1. Introduction
River runoff is a critical component of water resource management, with substantial implications for agricultural productivity and watershed regulation [
1]. However, increasing population, climate change, and the inherent complexity of hydrological processes pose significant challenges to accurate runoff prediction [
2]. Given the increasing hydrological variability in temperate maritime regions such as the UK, the fundamental necessity of river basin protection has been widely recognized for at least the past five decades [
3]. Alex et al. project that future alterations in discharge across British catchments could profoundly affect aquatic invertebrate communities by eliminating sensitive taxa and restructuring food webs [
4]. Against this backdrop, establishing a reliable runoff-forecasting system is essential for improving the efficiency of water allocation across UK river basins. Such forecasting capability also supports disaster risk reduction, ecological restoration, and evidence-based watershed management [
5,
6].
The runoff process represents a highly nonlinear and complex system driven by the interplay between climatic variability and human activities, making basin discharge dynamics difficult to characterize in space and time [
7]. Traditional linear methods, such as autoregressive moving average (ARMA) models, provide only limited predictive skill and are unable to capture the high-dimensional nonlinear dynamics inherent in hydrological systems [
8]. In contrast, recent advances in machine learning—particularly deep learning—have substantially improved runoff forecasting performance by enabling the modeling of long-term dependencies and nonlinear interactions [
9,
10]. For instance, Shu et al. demonstrated that deep learning models outperform traditional neural networks and extreme learning machines in monthly runoff prediction [
11]; Sun et al. found that LSTM models surpassed BP-ANN and ARIMA across five major Chinese regions [
12]; and Le et al. confirmed the superior accuracy and stability of LSTM-based frameworks compared with FFNN and CNN in the Red River Basin [
13].
Despite these advances, several limitations persist. Many existing models employ static network architectures that are difficult to adapt to evolving hydrological regimes [
14,
15]. Within the widely used LSTM family [
16,
17], fixed and linear output layers often constrain nonlinear representational capacity, thereby limiting model transferability across heterogeneous basins. Furthermore, current studies frequently neglect the evaluation of model performance under flow extremes or imbalanced data conditions, and issues of cross-basin generalization and regional heterogeneity remain insufficiently addressed [
13]. These challenges highlight the need for more adaptive and physically interpretable architectures that can maintain robustness under extreme events while achieving broader generalization.
In recent years, runoff prediction research has evolved along two prominent methodological paradigms: the signal decomposition–learning framework and the physics–machine learning hybrid paradigm. The former extracts multi-scale features through time–frequency or modal decomposition, which are subsequently modeled by machine or deep learning algorithms to capture nonlinear dependencies and balance prediction accuracy and stability. For example, Xu et al. (2025) proposed WaveTransTimesNet (WTTN), which integrates wavelet transformation with a Transformer encoder and TimesBlock, achieving superior monthly runoff prediction accuracy with KGE values around 0.94–0.96 [
18]; He and Wang (2025) introduced VMD–MARO–SVR–EC, combining variational mode decomposition, multi-strategy enhanced artificial rabbit optimization, and error correction, reducing overall errors by 75% and 81% at the Xiajiang and Jiayuguan stations, respectively [
19]. The latter paradigm seeks to enhance physical interpretability by coupling hydrological process models with data-driven learners. For instance, Li et al. (2025) developed the MPE-BMA model, integrating SWAT and HBV through Bayesian model averaging, which achieved superior performance across multiple GCM/SSP scenarios [
20]; meanwhile, Zhang et al. (2024) combined SIMHYD and LSTM to propose a Dynamic Predictive Effectiveness (DPE) hybrid model, yielding substantial improvements in NSE (12–28%) and enhanced stability under both high- and low-flow conditions [
21].
Nevertheless, both paradigms have inherent drawbacks. Signal decomposition methods are increasingly criticized for potential information leakage, where future information may inadvertently be exposed during decomposition, leading to overestimated accuracy and poor generalization. In contrast, physics–machine learning hybrids risk error propagation and amplification: when the outputs of physical models are directly fed into learning models, systematic bias, observational noise, and unmodeled processes are conflated into a single residual term. As a result, the machine learning component is forced to fit both bias and noise, learning compensatory rather than causal patterns. Moreover, improper coupling designs—such as inconsistent use of serial, parallel, or embedded architectures—can lead to redundant information use (double counting) or loss of critical signals, ultimately undermining model stability and interpretability.
Several key challenges persist beyond the aforementioned paradigms: (1) Conventional architectures typically employ fixed linear transformation layers following recurrent or attention-based units, which restrict their ability to represent highly nonlinear hydrological processes and limit model transferability across heterogeneous catchments. (2) Most models treat all training samples equally, overlooking the disproportionate importance of extreme hydrological events such as floods and droughts; as a result, predictive performance often deteriorates under critical conditions where accurate forecasts are most needed. (3) The selection of meteorological input variables remains largely empirical, often guided by simple correlation analysis rather than systematic causal inference, which may compromise both predictive effectiveness and interpretability.
In this study, we propose a hybrid runoff prediction framework that integrates a Kolmogorov–Arnold Network (KAN) with a Long Short-Term Memory (LSTM) network to achieve an incremental improvement through enhanced nonlinear representation and physical interpretability. A Weighted Mean Squared Error (WMSE) loss function is employed to address data imbalance and improve prediction accuracy under extreme flow conditions. Furthermore, Granger causality analysis (GCA) is applied to select meteorological variables based on causal relationships with runoff, ensuring physically grounded input selection. The proposed model is extensively trained and validated on 161 catchments across Great Britain using the CAMELS-GB dataset (Catchment Attributes and Meteorology for Large-sample Studies—Great Britain) [
22]. Through comprehensive comparisons with multiple benchmark models and evaluation across three performance metrics, the results demonstrate the practicality and competitive performance of the proposed framework.
2. Model Application
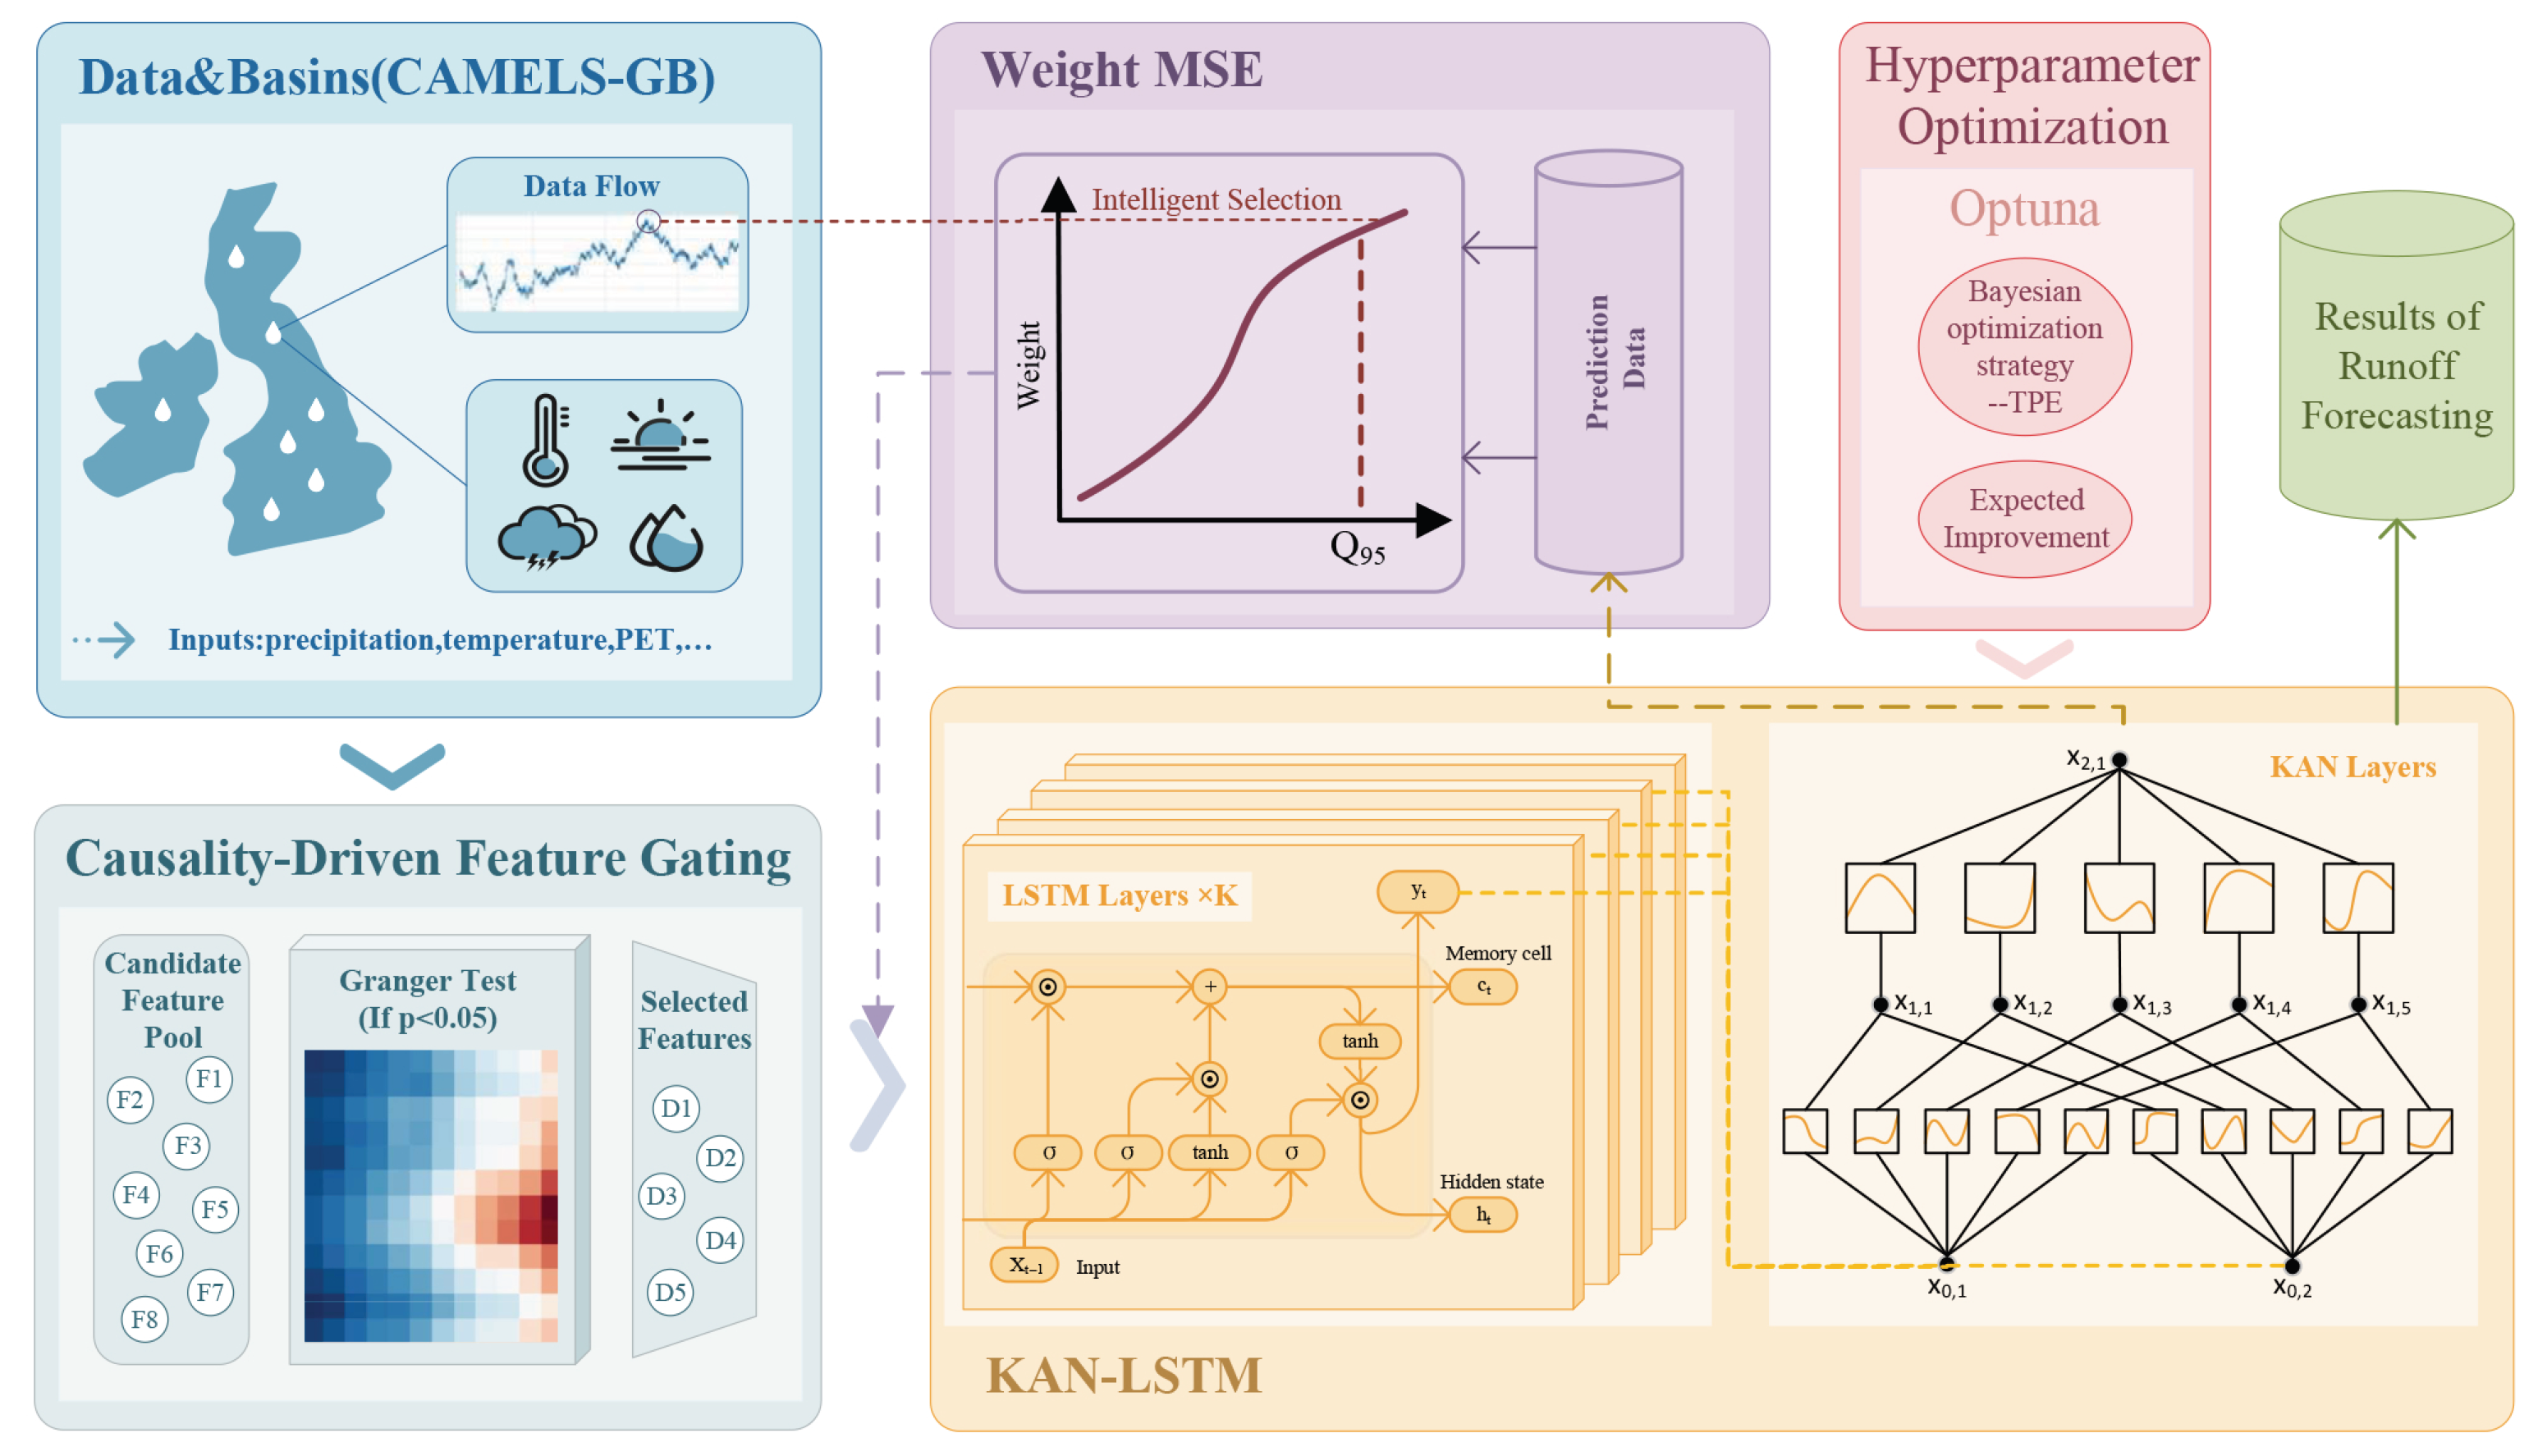
To improve generalization in multi-basin runoff prediction under complex nonlinear dynamics, this study introduces KAN-WLSTM, a hybrid model combining physical priors with deep learning as illustrated in
Figure 1. The framework integrates the sequential modeling strength of LSTM, the nonlinear representation power of KAN enhanced by physical knowledge, and a weighted loss function sensitive to high-runoff events. Bayesian optimization is applied for hyperparameter tuning, enabling adaptive performance across diverse hydrological settings. As shown in the model architecture, the framework includes feature preprocessing, an LSTM-KAN prediction core, weighted error design, and an optimization module, forming a scalable and generalizable framework for hydrological forecasting across basins.
2.1. Weighted Long Short-Term Memory Network
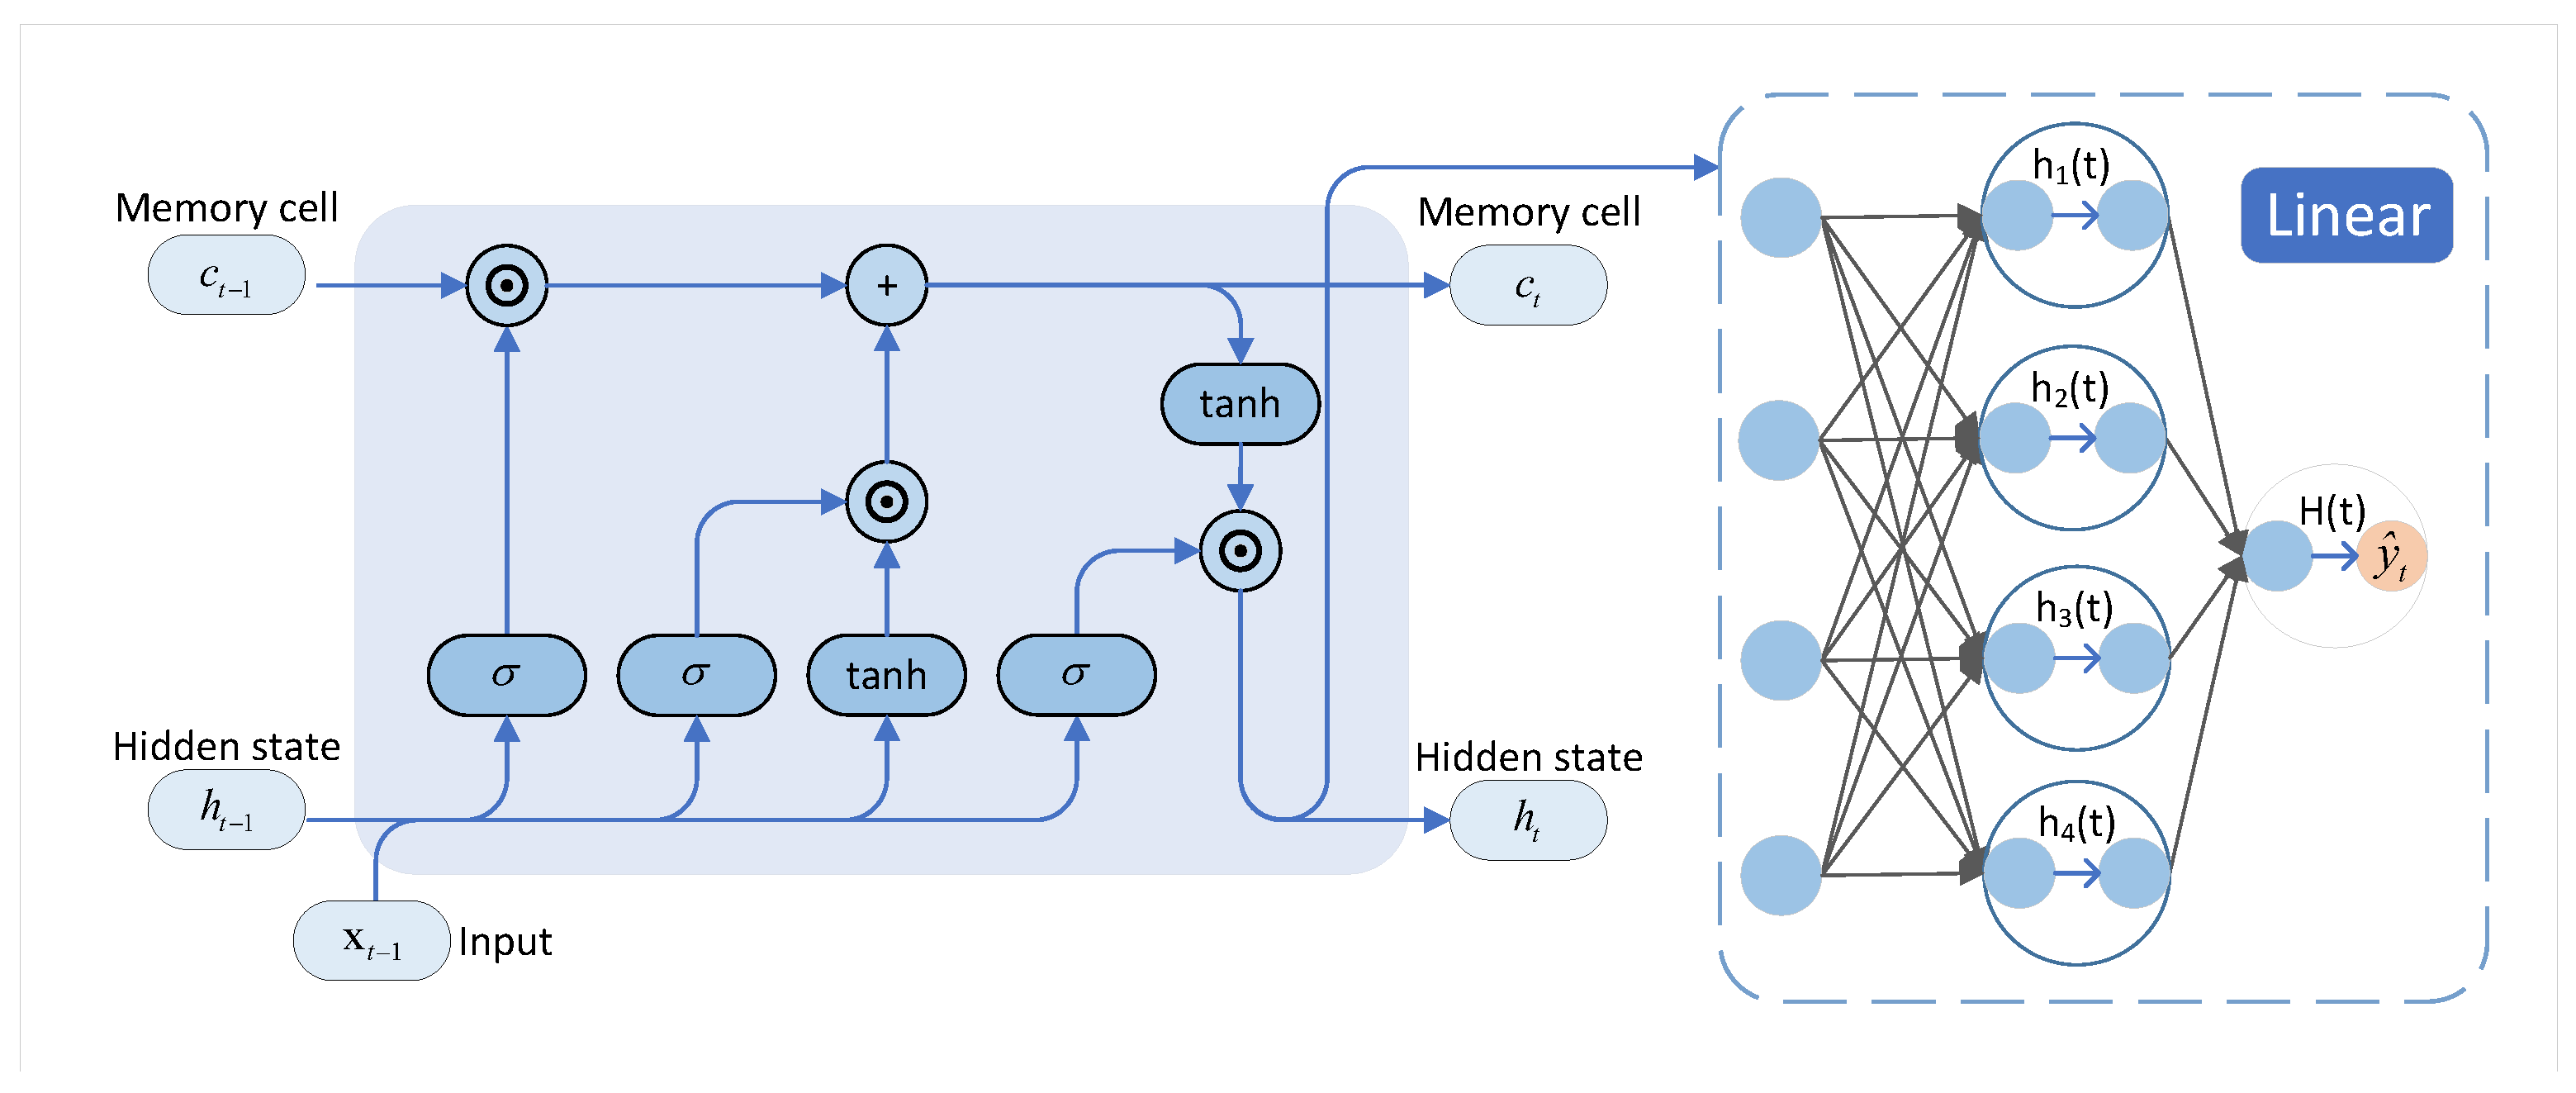
LSTM networks are a specialized form of RNNs designed to address the vanishing and exploding gradient issues commonly encountered in long-sequence learning tasks. The LSTM architecture incorporates a forget gate, input gate, and output gate, which dynamically regulate the flow of information through time steps via gating mechanisms [
23].
In hydrological time series prediction, runoff variation is driven by complex interactions among meteorological conditions, geographic features, and hydrological processes, and often exhibits strong temporal dependence. As a result, LSTM has been widely adopted for runoff forecasting due to its capacity to capture long-term dependencies in sequential data [
24].
To improve model sensitivity to extreme hydrological events, this study employs the WMSE loss function [
25] during training. WMSE prioritizes error reduction in high-runoff scenarios, thereby enhancing the model’s reliability in early warning applications. The WMSE formulation is defined as follows:
where
is a dynamically adjusted weight factor based on runoff magnitude, and
and
denote the true and predicted values, respectively. When runoff values are high, the weight
increases accordingly, making the loss function more sensitive to errors in these samples. This mechanism directs the model to prioritize prediction accuracy during high-runoff events throughout the optimization process. Compared to the conventional Mean Squared Error (MSE), the WMSE loss function is better suited for hydrological forecasting tasks, offering enhanced practical value—particularly in managing extreme weather events and supporting watershed decision making.
2.2. Kolmogorov–Arnold Network
The KAN is a novel neural architecture grounded in the Kolmogorov–Arnold representation theorem [
26], which asserts that any multivariate continuous function can be expressed as a finite composition of univariate functions:
where
denotes the univariate basis function applied to input variable
, and
represents the nonlinear combining function. By replacing the linear transformation layers in LSTM with the KAN structure, the modeling limitations imposed by fixed linear weight connections can be alleviated, as illustrated in
Figure 2.
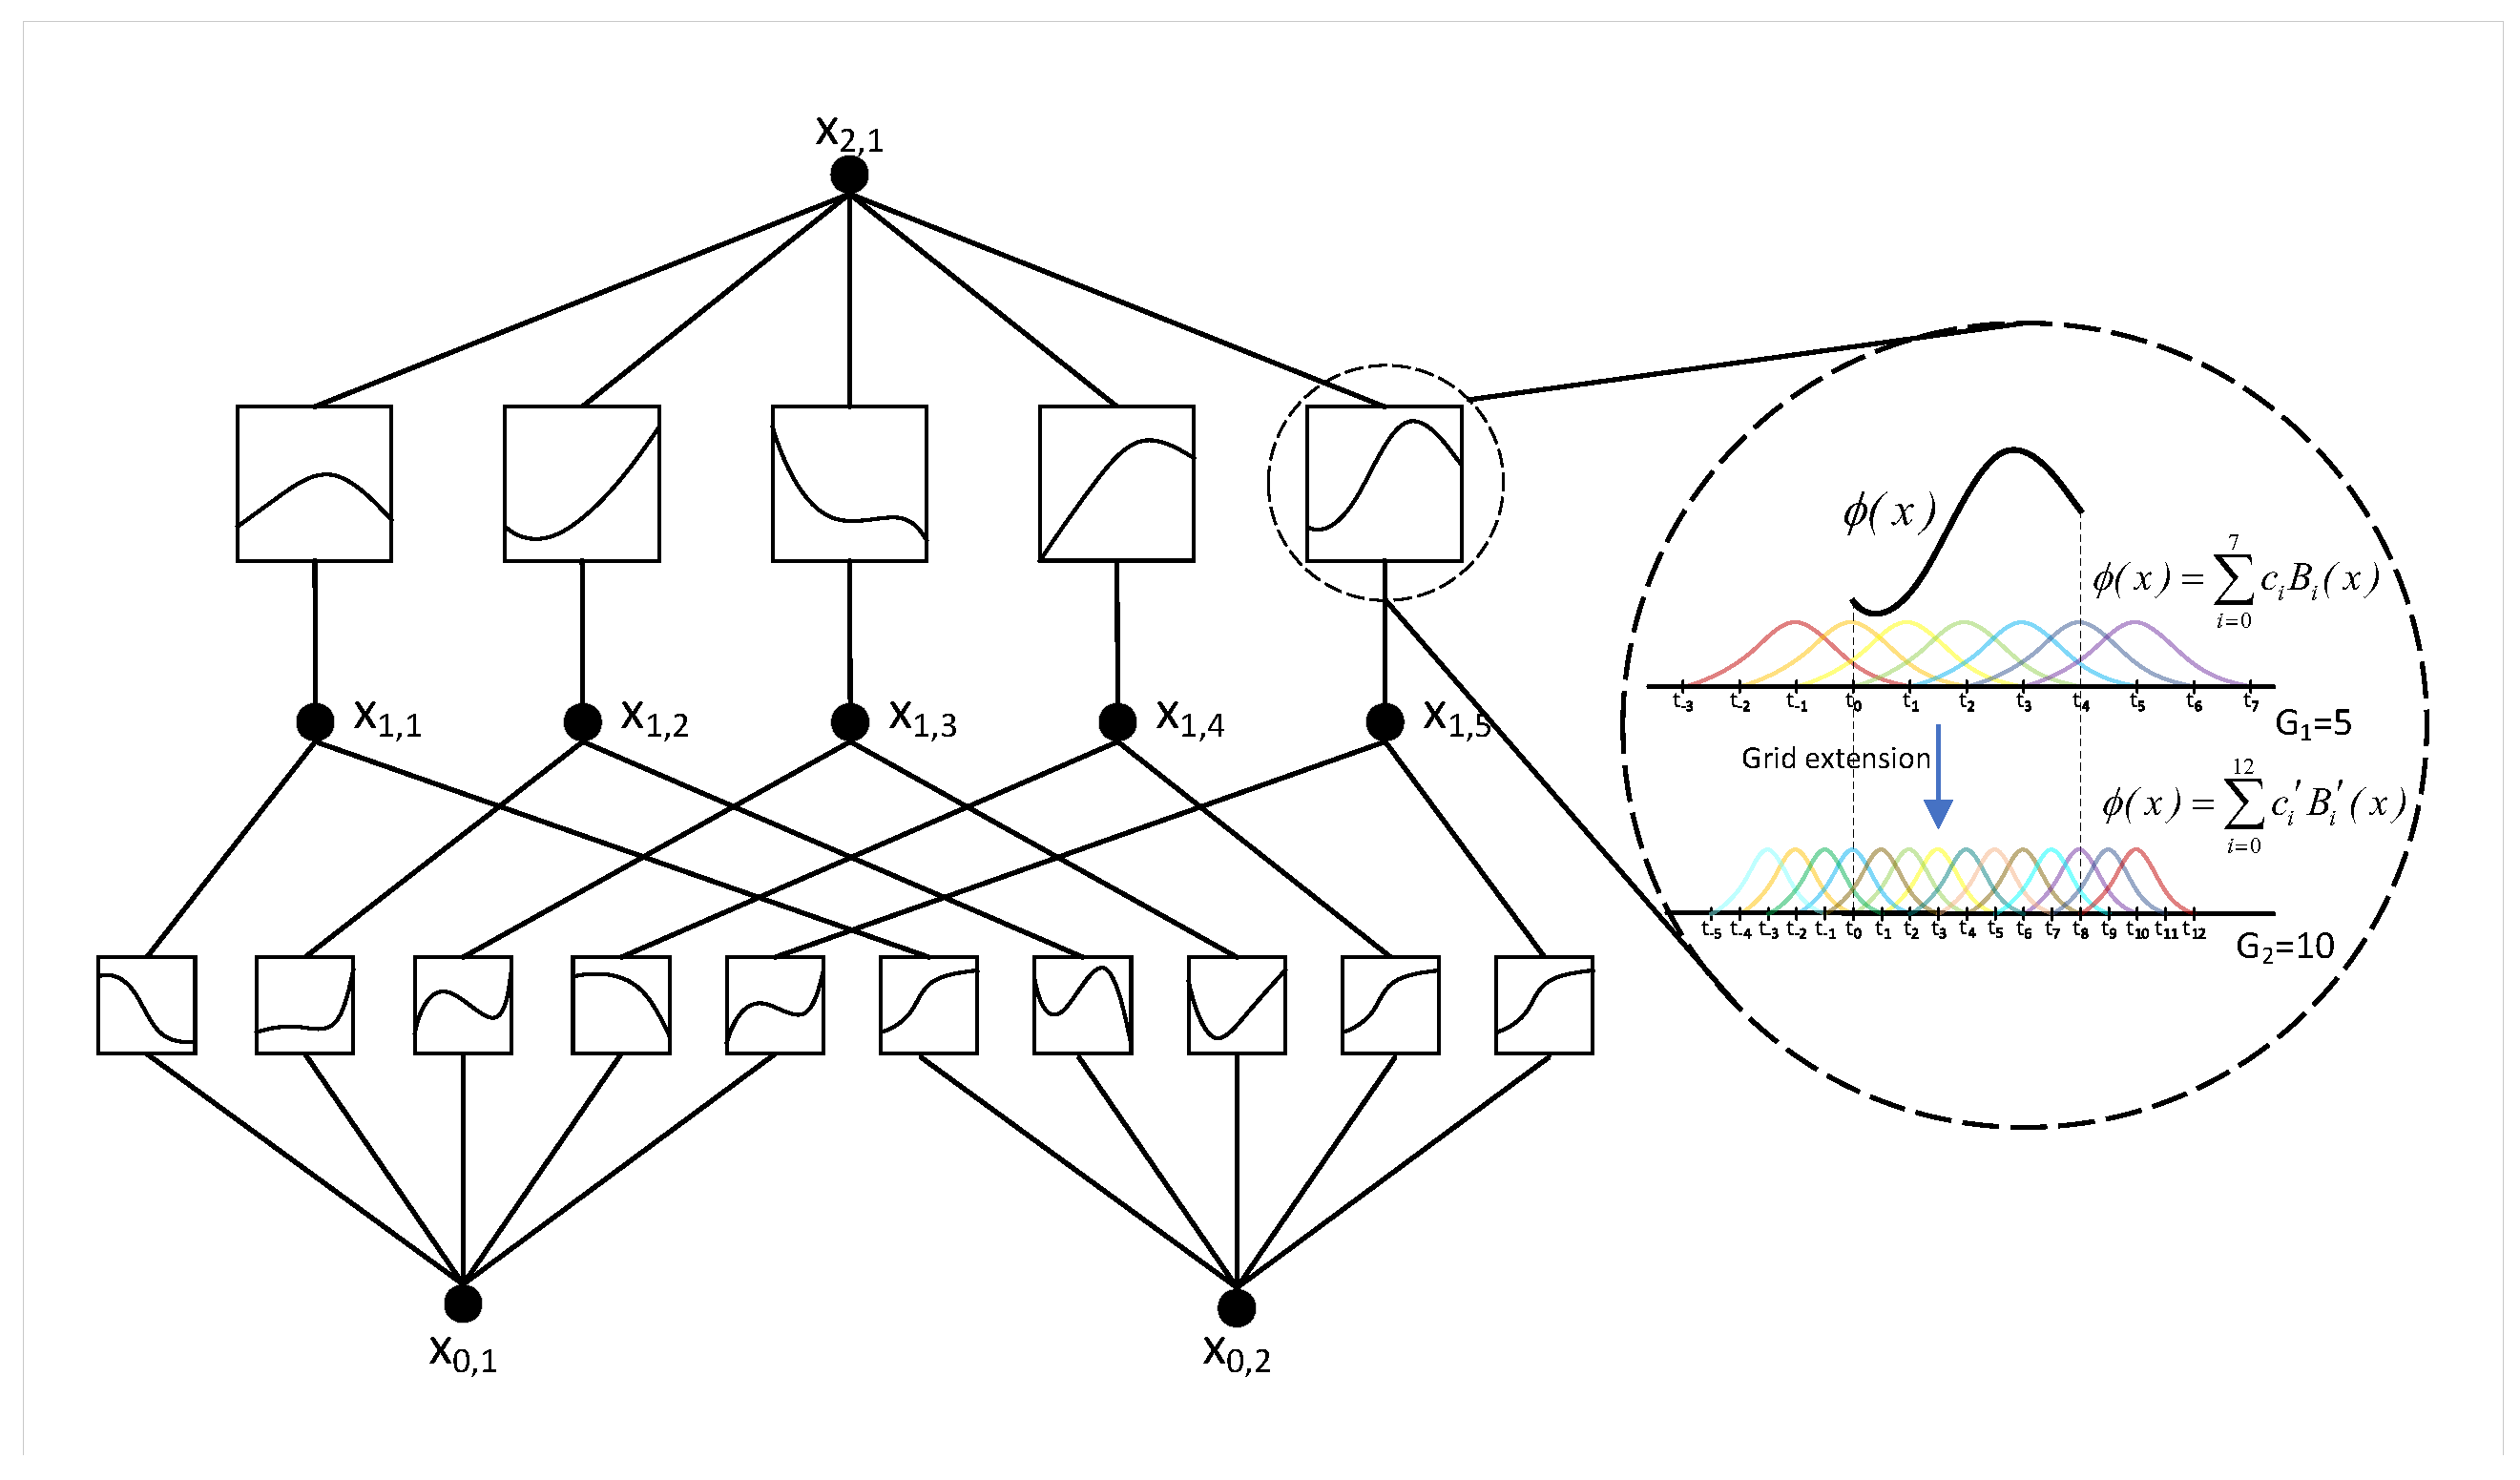
Although LSTM excels in capturing long-term temporal dependencies, its internal linear operations constrain its ability to represent highly nonlinear and dynamically complex hydrological processes. In contrast, KAN adopts a matrix-free framework composed of multiple learnable one-dimensional nonlinear functions [
27], thereby significantly enhancing the model’s flexibility and expressive power in nonlinear mapping tasks, as shown in
Figure 3.
Unlike traditional LSTM networks, which rely on fixed linear transformations followed by smooth activation functions, KAN employs a decomposable functional representation. This structure aligns naturally with the mathematical mechanisms underlying hydrological processes—such as the water balance equation and evapotranspiration formulations—allowing the model to better simulate real-world physical constraints during training. Consequently, KAN maintains the flexibility of data-driven modeling while improving the interpretability and physical consistency of the simulated runoff processes. Furthermore, during high-flow events such as heavy rainfall or floods, runoff generation often exhibits strongly nonlinear responses. The locally steep variations in KAN’s basis functions enable precise characterization of these nonlinearities, whereas the smooth activations in conventional LSTM layers tend to attenuate extreme responses, limiting their ability to accurately capture peak discharge dynamics.
2.3. Granger Causality Analysis
The hydrological system is inherently a complex nonlinear dynamical system, where meteorological variables such as precipitation, evapotranspiration, and temperature exert spatiotemporally heterogeneous effects on runoff generation [
28]. To identify the most influential predictors, this study employs GCA, a statistical method for detecting directional relationships among time series variables [
29]. GCA assesses whether a variable X provides significant predictive information about another variable Y. Specifically, X is said to Granger-cause Y if past values of X improve the prediction of Y beyond what is possible using only past values of Y. The mathematical formulation of Granger causality is given as follows:
where
p and
q denote the lag orders,
and
are regression coefficients, and
is the white noise term.
2.4. Optuna Hyperparameter Optimization Framework
Optuna is an automated hyperparameter optimization framework designed to efficiently identify optimal configurations for deep learning models [
30]. It employs the Tree-structured Parzen Estimator (TPE) as a Bayesian optimization strategy to model the objective function and explore the hyperparameter space adaptively. In this study, the Expected Improvement (EI) is used as the acquisition function to balance exploration and exploitation. The EI at a candidate point
is defined as
where
is the best objective value observed so far, and
is the predicted value at point
. After each sampling, the model is trained and evaluated, and the surrogate model is updated.
3. Data Preparation and Experimental Setup
To enable robust and generalizable runoff forecasting, this study carefully designs the experimental workflow, including data selection, anomaly handling, feature relevance assessment, and training setup. The following subsections detail the data sources, preprocessing techniques, optimization strategies, and evaluation criteria used throughout the study.
3.1. Study Area and Data Description
This study employs the CAMELS-GB dataset (Catchment Attributes and Meteorology for Large-sample Studies—Great Britain), which provides long-term, high-resolution hydrometeorological observations and catchment attribute data for 671 basins across the United Kingdom [
31]. To ensure data completeness and reduce the influence of missing records on model reliability, all basins with a flow-data completeness of 100% were selected, resulting in a total of 161 catchments used for model training and evaluation.
Each catchment record includes daily observations of ten key meteorological and hydrological variables: date, precipitation, potential evapotranspiration (pet), temperature, specific discharge (discharge_spec), volumetric discharge (discharge_vol), potential evapotranspiration index (peti), humidity, shortwave radiation, longwave radiation, and wind speed. These variables collectively characterize the main energy–water exchange processes controlling runoff generation.
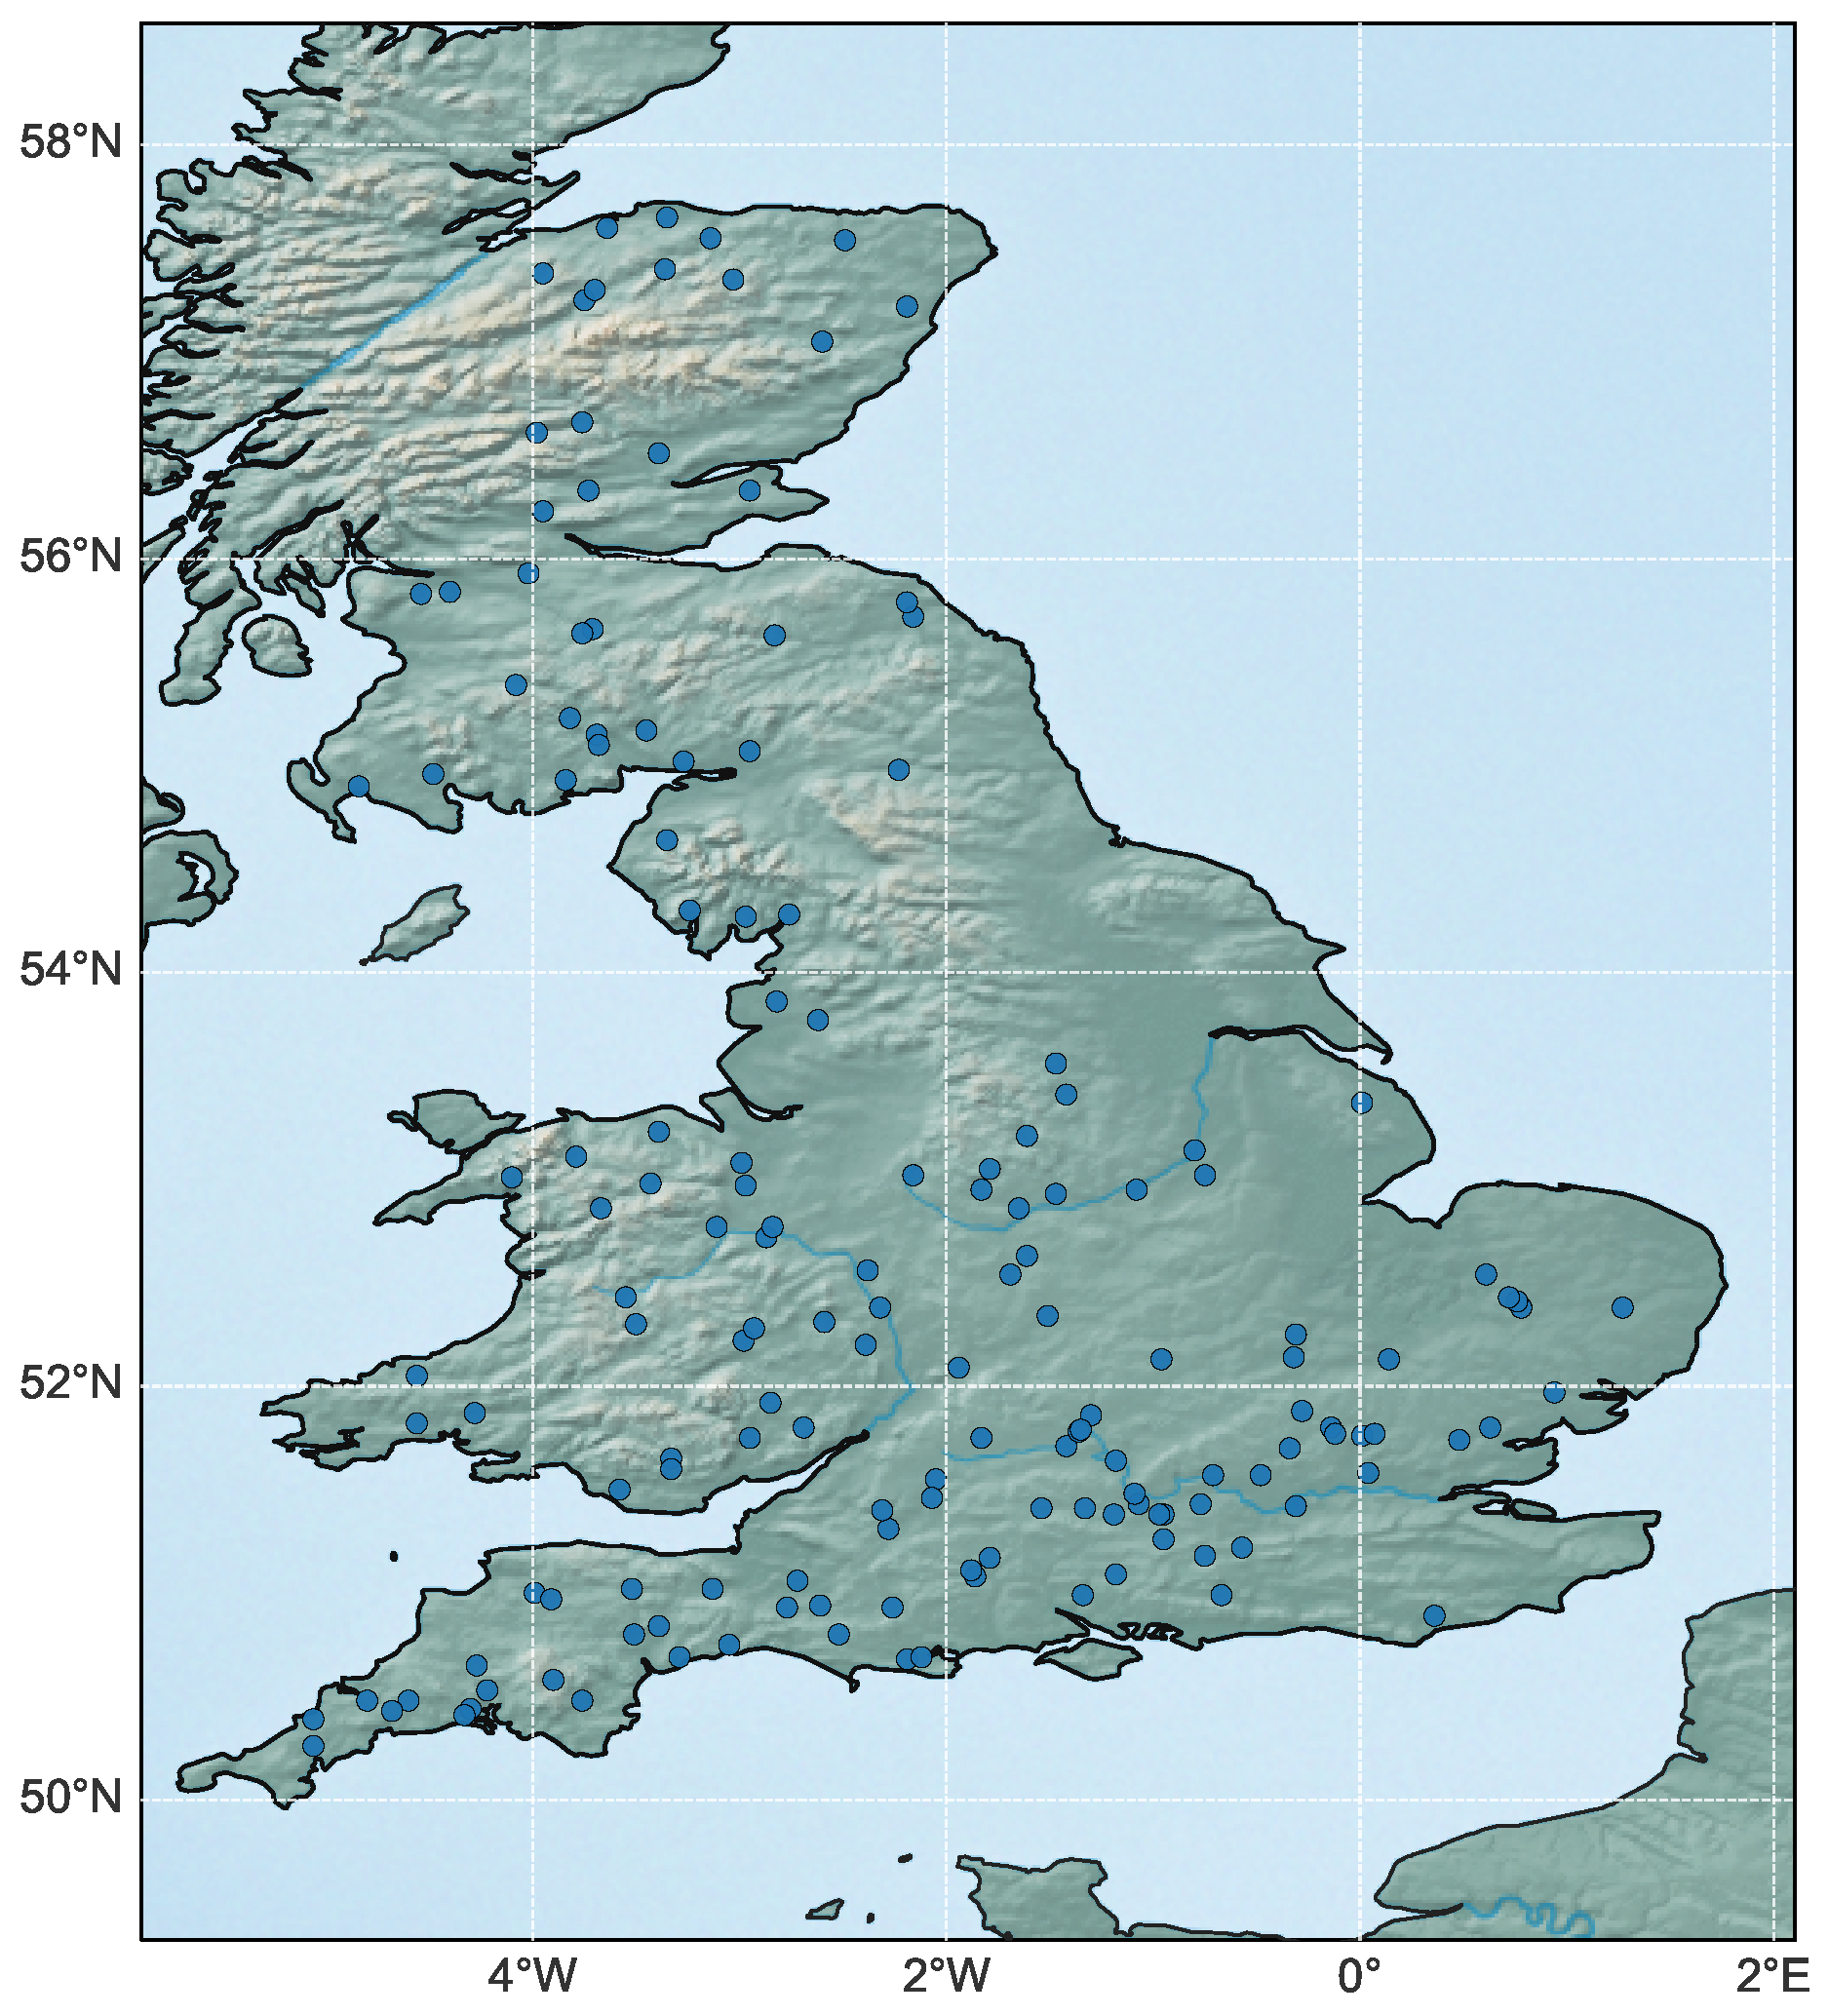
Figure 4 illustrates the spatial distribution of the 161 catchments across Great Britain, covering diverse hydro-climatic zones from humid western regions to semi-arid eastern basins. The mean precipitation ranges from 1.62 mm/day in the low-rainfall southeastern plains to over 8.0 mm/day in the mountainous western Scotland, accompanied by a corresponding aridity index gradient from 0.16 to 0.90. The potential evapotranspiration varies slightly between 1.05 and 1.48 mm/day, while the runoff ratio spans from 0.11 to 0.93, reflecting substantial heterogeneity in water yield and catchment response. Elevation varies from 38 m in lowland basins to 560 m in upland areas, further emphasizing the geographical diversity represented in this dataset.
To provide a clear view of basin-scale variability and model behavior, nine representative catchments were randomly selected from the full dataset for detailed analysis and visualization, labeled as Stations 001–009. The basic hydrological characteristics of these nine representative catchments—including observation periods, mean flow, flow quantiles, runoff ratios, and baseflow indices—are summarized in
Table 1.
These catchments encompass a wide range of hydro-climatic conditions and geomorphological features, ensuring that the dataset captures the spatial heterogeneity of rainfall–runoff dynamics across Great Britain. The high completeness of the selected basins enhances the robustness of model training and facilitates unbiased evaluation of cross-basin generalization performance.
3.2. Outlier Detection and Time Series Smoothing
Although the selected basins exhibit complete records, occasional anomalous values may still occur due to sensor drift or recording errors. To reduce their potential influence on model training, an exponential smoothing method with a sliding window is applied to adjust these outliers while preserving the natural temporal variation of the data:
where
is the smoothing factor empirically determined for each basin. Beyond this minimal correction, no additional preprocessing or artificial interpolation was applied, ensuring maximum fidelity to the original CAMELS-GB observations.
3.3. Causal Assessment of Meteorological Drivers
To investigate the causal influence of hydrometeorological factors on river runoff within each basin, this study computes pairwise Granger causality between daily runoff and ten meteorological variables. The test examines whether the historical values of a predictor variable X improve the prediction of runoff Y beyond what can be achieved by Y’s own history. Prior to testing, all time series were checked for stationarity using the Augmented Dickey–Fuller (ADF) test, and the results confirmed that the variables were generally stationary. Accordingly, the lag order was fixed at one day to reflect the short rainfall–runoff response times typically observed in British catchments. Statistical significance was evaluated at the 0.05 level.
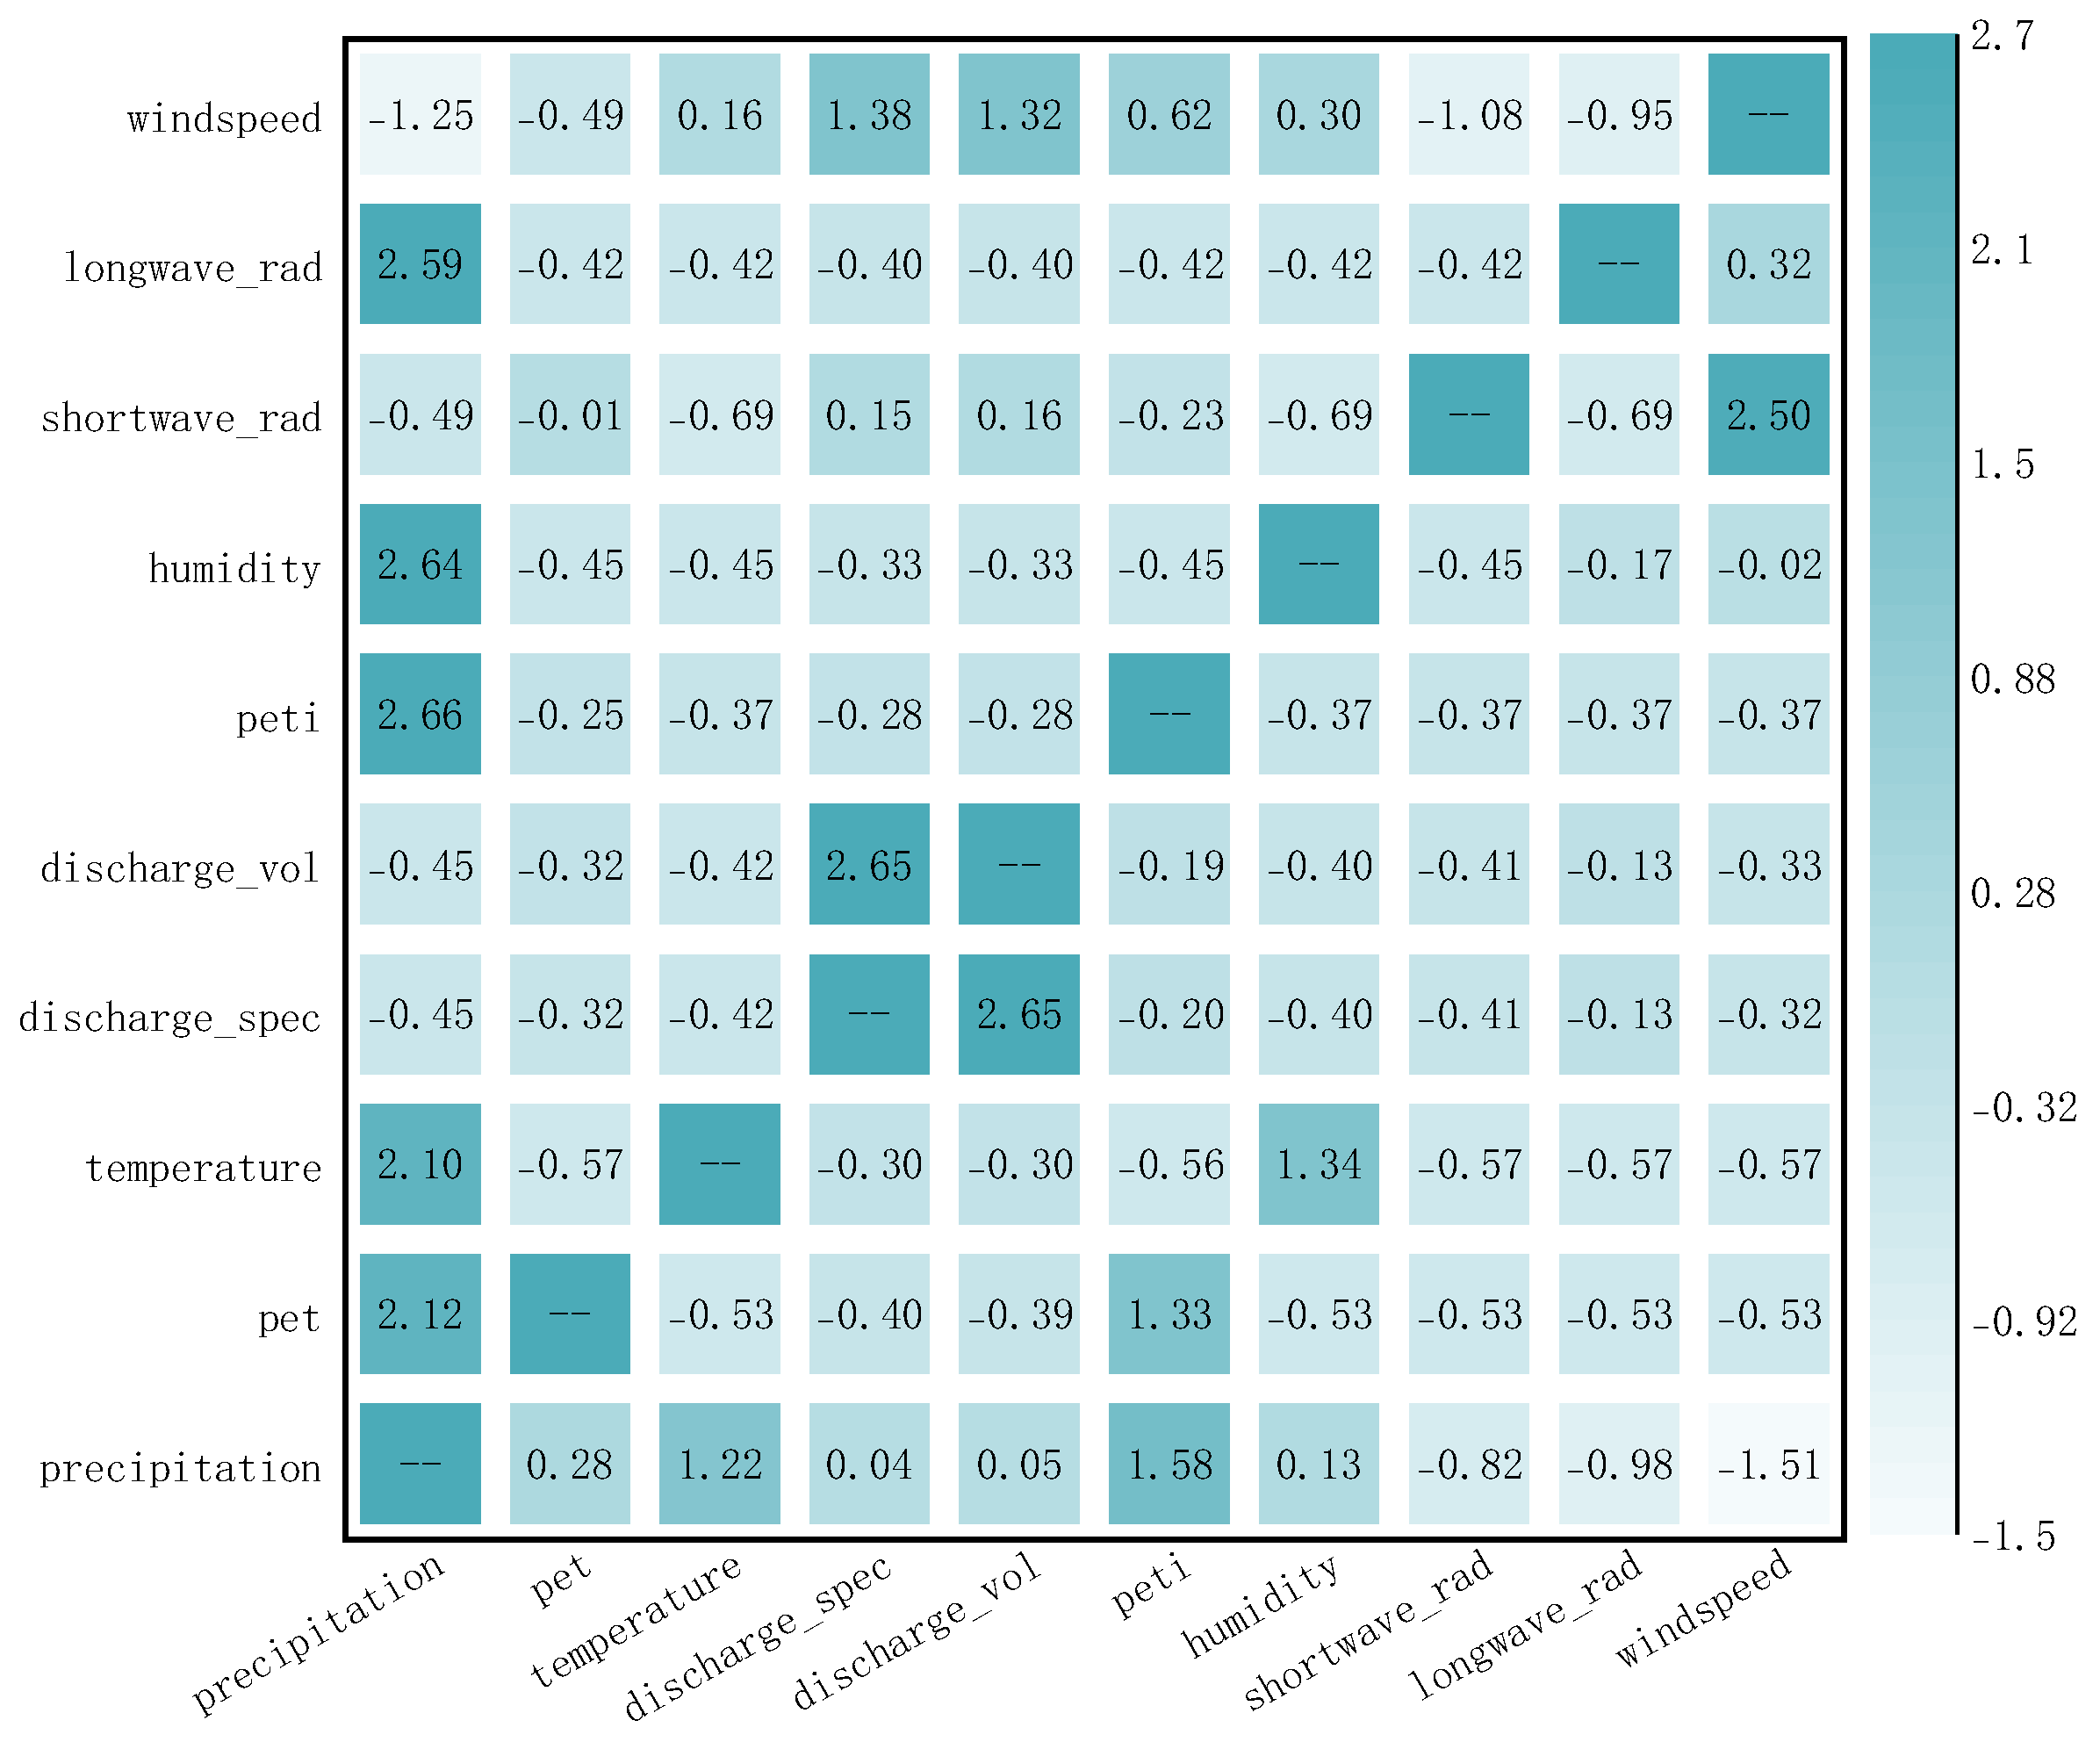
According to the Granger causality results, significant temporal causal relationships are widely present among the ten meteorological and hydrological variables. Overall, most statistically significant causal relationships exhibit p-values far below 0.05, confirming the strong dynamic coupling between variables. The p-values range from approximately to 0.4, covering the full spectrum from strongly significant to insignificant causality. Precipitation shows the strongest causal influence on runoff variables, with p-values as low as , indicating an extremely strong Granger-causal effect. In contrast, certain energy- or dynamic-related variables, such as wind speed and temperature, display relatively higher p-values, suggesting weaker causal linkages.
To ensure comparability among different variables and to highlight the disparity in causal strengths, the causality matrix was standardized using z-score normalization. This normalization eliminates differences in scale and distribution across variables, converting causality strengths into standard deviation units. As shown in
Figure 5, the standardized heatmap clearly visualizes the mutual influences and coupling intensity between meteorological drivers and runoff variables. Based on these results, all ten variables were retained as model inputs, as they collectively represent the dominant causal pathways and hydrological processes governing runoff generation in the CAMELS-GB basins.
3.4. Hyperparameter Optimization Using Optuna
To enhance training stability and accelerate model convergence, all input features and the target variable are normalized using the MinMaxScaler, which linearly scales values to a specified range. The dataset is partitioned into training and testing subsets in an 80:20 ratio to ensure that model evaluation remains independent of training data.
Finally, all processed data are converted into PyTorch (The version is 2.2.1+cu121) tensor format to comply with the structural requirements of deep learning models for subsequent training and inference. In this experiment, Optuna is employed for hyperparameter optimization, with the objective of minimizing either the MSE or WMSE on the test set. The hyperparameter search space used during optimization is summarized in
Table 2.
Optuna performs 50 trials of hyperparameter search, each consisting of 100 training epochs. The parameter configuration that achieves the lowest validation loss is selected for final model training. Using the best-performing hyperparameters, the model is re-initialized and trained using the Adam optimizer for 300 epochs. The final predictive results are evaluated on the test set.
3.5. Evaluation Metrics
In the experimental analysis, three complementary evaluation metrics—Mean Squared Error (MSE), Mean Absolute Error (MAE), and Nash–Sutcliffe Efficiency (NSE) [
32]—are employed to comprehensively assess model performance. These metrics capture different aspects of predictive accuracy and hydrological consistency.
MSE quantifies the average squared deviation between observed and predicted runoff values and is particularly sensitive to large prediction errors, thereby emphasizing the model’s performance under extreme flow conditions. Both MSE and MAE are calculated on denormalized discharge values, where MSE has units of and MAE shares the same unit as discharge, . MAE measures the average magnitude of prediction errors without considering their direction and provides a more robust estimate of general accuracy by reducing the influence of outliers. NSE evaluates the degree to which the simulated runoff reproduces the observed temporal variability; values approaching 1 indicate higher predictive skill, while values below 0 suggest poor model performance relative to the mean observed flow.
The corresponding mathematical formulations are given as follows:
By jointly applying these three indicators, the evaluation accounts for both overall predictive precision and hydrological fidelity, providing a multidimensional and objective assessment of model performance. This combination enhances the interpretability and scientific rigor of the experimental results.
4. Results
This section presents the experimental results of the proposed method. The analysis begins with an investigation of the impact of different input lag lengths on forecasting performance, followed by a comparative evaluation of various models across multiple catchments, and concludes with an ablation study to assess the contribution of key architectural components.
4.1. Impact of Lag Length on Prediction Performance
To evaluate the influence of different input lag lengths on hydrological forecasting performance, four input configurations were tested: 7-day, 14-day, 21-day, and 28-day lags. These lag lengths were selected to represent typical short- to mid-term rainfall–runoff response scales observed in temperate maritime catchments such as those in Great Britain. Previous hydrological studies have reported that the dominant response time between precipitation and discharge generally falls within one to four weeks, depending on basin size, soil type, and storage capacity. Therefore, the 7-, 14-, 21-, and 28-day windows were designed to cover this physically meaningful range while assessing the model’s sensitivity to input length.
As shown in
Table 3, the 14-day lag configuration achieves the best overall trade-off between predictive accuracy and model generalization, yielding the lowest mean MSE and the highest mean NSE across all basins. This indicates that incorporating about two weeks of antecedent hydrological information enables the model to effectively capture basin memory effects and soil moisture persistence without introducing redundant inputs.
In contrast, the 7-day lag configuration exhibits a slightly higher mean MSE and a comparable mean NSE, suggesting that a one-week window may not fully reflect delayed hydrological responses associated with infiltration and subsurface storage processes. Although longer lag windows (21–28 days) include additional historical data, they only marginally improve predictive performance, with mean MSE values less than 1% higher and NSE values roughly 0.01 lower than those of the 14-day configuration.
Overall, these results demonstrate that the 14-day lag window provides a physically meaningful and statistically optimal temporal context for runoff forecasting in the CAMELS-GB basins, balancing information sufficiency with model compactness and generalization.
4.2. Model Comparison Across Basins
Based on the experimental setup described in
Section 4.1, the lag length for the model is fixed at 14 days. This configuration utilizes a sliding window approach, where sequences of 14 consecutive days of meteorological data are used to predict the runoff on the subsequent 15th day, thereby generating the input–output samples for model training and evaluation. To assess the predictive performance of different modeling approaches, a comparative analysis is conducted across nine hydrological stations using five representative models: GRU, XGBoost, Transformer, KAN-WGRU, and KAN-WLSTM. The evaluation is based on three metrics, MSE, MAE, and NSE, to ensure a comprehensive assessment of accuracy and model fit (see
Table 4).
The results show that the basic LSTM model yields relatively low prediction accuracy across most stations. Introducing the weighted loss function improves generalization and helps mitigate sample imbalance by assigning greater importance to high-runoff events. Incorporating the KAN module alone enhances feature representation capacity, resulting in improved NSE values across several stations. When both components are combined in the KAN-WLSTM model, performance is consistently improved across all evaluation metrics, achieving the best or near-best results at most stations.
Across the evaluated hydrological stations, the KAN-WLSTM model consistently ranks among the top performers, demonstrating strong predictive accuracy and robust generalization. On average, across nine stations, the KAN-WLSTM reduces MSE by 6.8% and increases NSE by 2.7% relative to the WLSTM baseline. Paired t-tests confirm that these improvements are statistically significant at the 0.05 level for both the MSE and NSE metrics.
The superior performance of KAN-WLSTM is particularly evident at stations with greater hydrological variability (e.g., 002 and 003), where nonlinear rainfall–runoff responses dominate. The weighted loss function enhances model sensitivity to high-flow events, improving the representation of flood-driven processes. In parallel, the KAN module strengthens nonlinear feature learning by approximating complex hydrological functions such as rainfall–runoff and evapotranspiration relationships. When both components are combined, the model achieves consistent accuracy and stability across heterogeneous basins, highlighting the synergy between physical interpretability and data-driven learning.
For instance, during high-flow peaks at Station 003, KAN-WLSTM reduces peak discharge errors by approximately 15% compared with GRU and Transformer models, while maintaining stable accuracy during low-flow conditions. Overall, the KAN-WLSTM achieved the best or near-best results at eight out of nine stations, demonstrating both statistical robustness and hydrological consistency in multi-basin runoff forecasting.
When compared to KAN-WGRU, which also integrates the KAN structure, KAN-WLSTM benefits from enhanced memory capacity and more effective gating mechanisms. These enhancements contribute to additional reductions in prediction error and improvements in accuracy across key metrics, confirming the architectural advantages and reliability of the proposed model design.
4.3. Ablation Study on Model Components
To evaluate the individual and combined contributions of the KAN module and the weighted loss function, a series of ablation experiments were conducted. Four model variants were constructed for comparison: (1) basic LSTM; (2) WLSTM, which incorporates a weighted loss function; (3) LSTM with the KAN module; and (4) KAN-WLSTM, which integrates both the KAN structure and weighted loss mechanism. These models were evaluated across nine representative hydrological stations using MAE and NSE as performance metrics (see
Figure 6).
The results show that the basic LSTM model yields relatively low prediction accuracy across most stations. Introducing the weighted loss function improves generalization and helps mitigate sample imbalance by assigning greater importance to high-runoff events. Incorporating the KAN module alone enhances feature representation capacity, resulting in improved NSE values across several stations. When both components are combined in the KAN-WLSTM model, performance is consistently improved across all evaluation metrics, achieving the best or near-best results at most stations (see
Table 5).
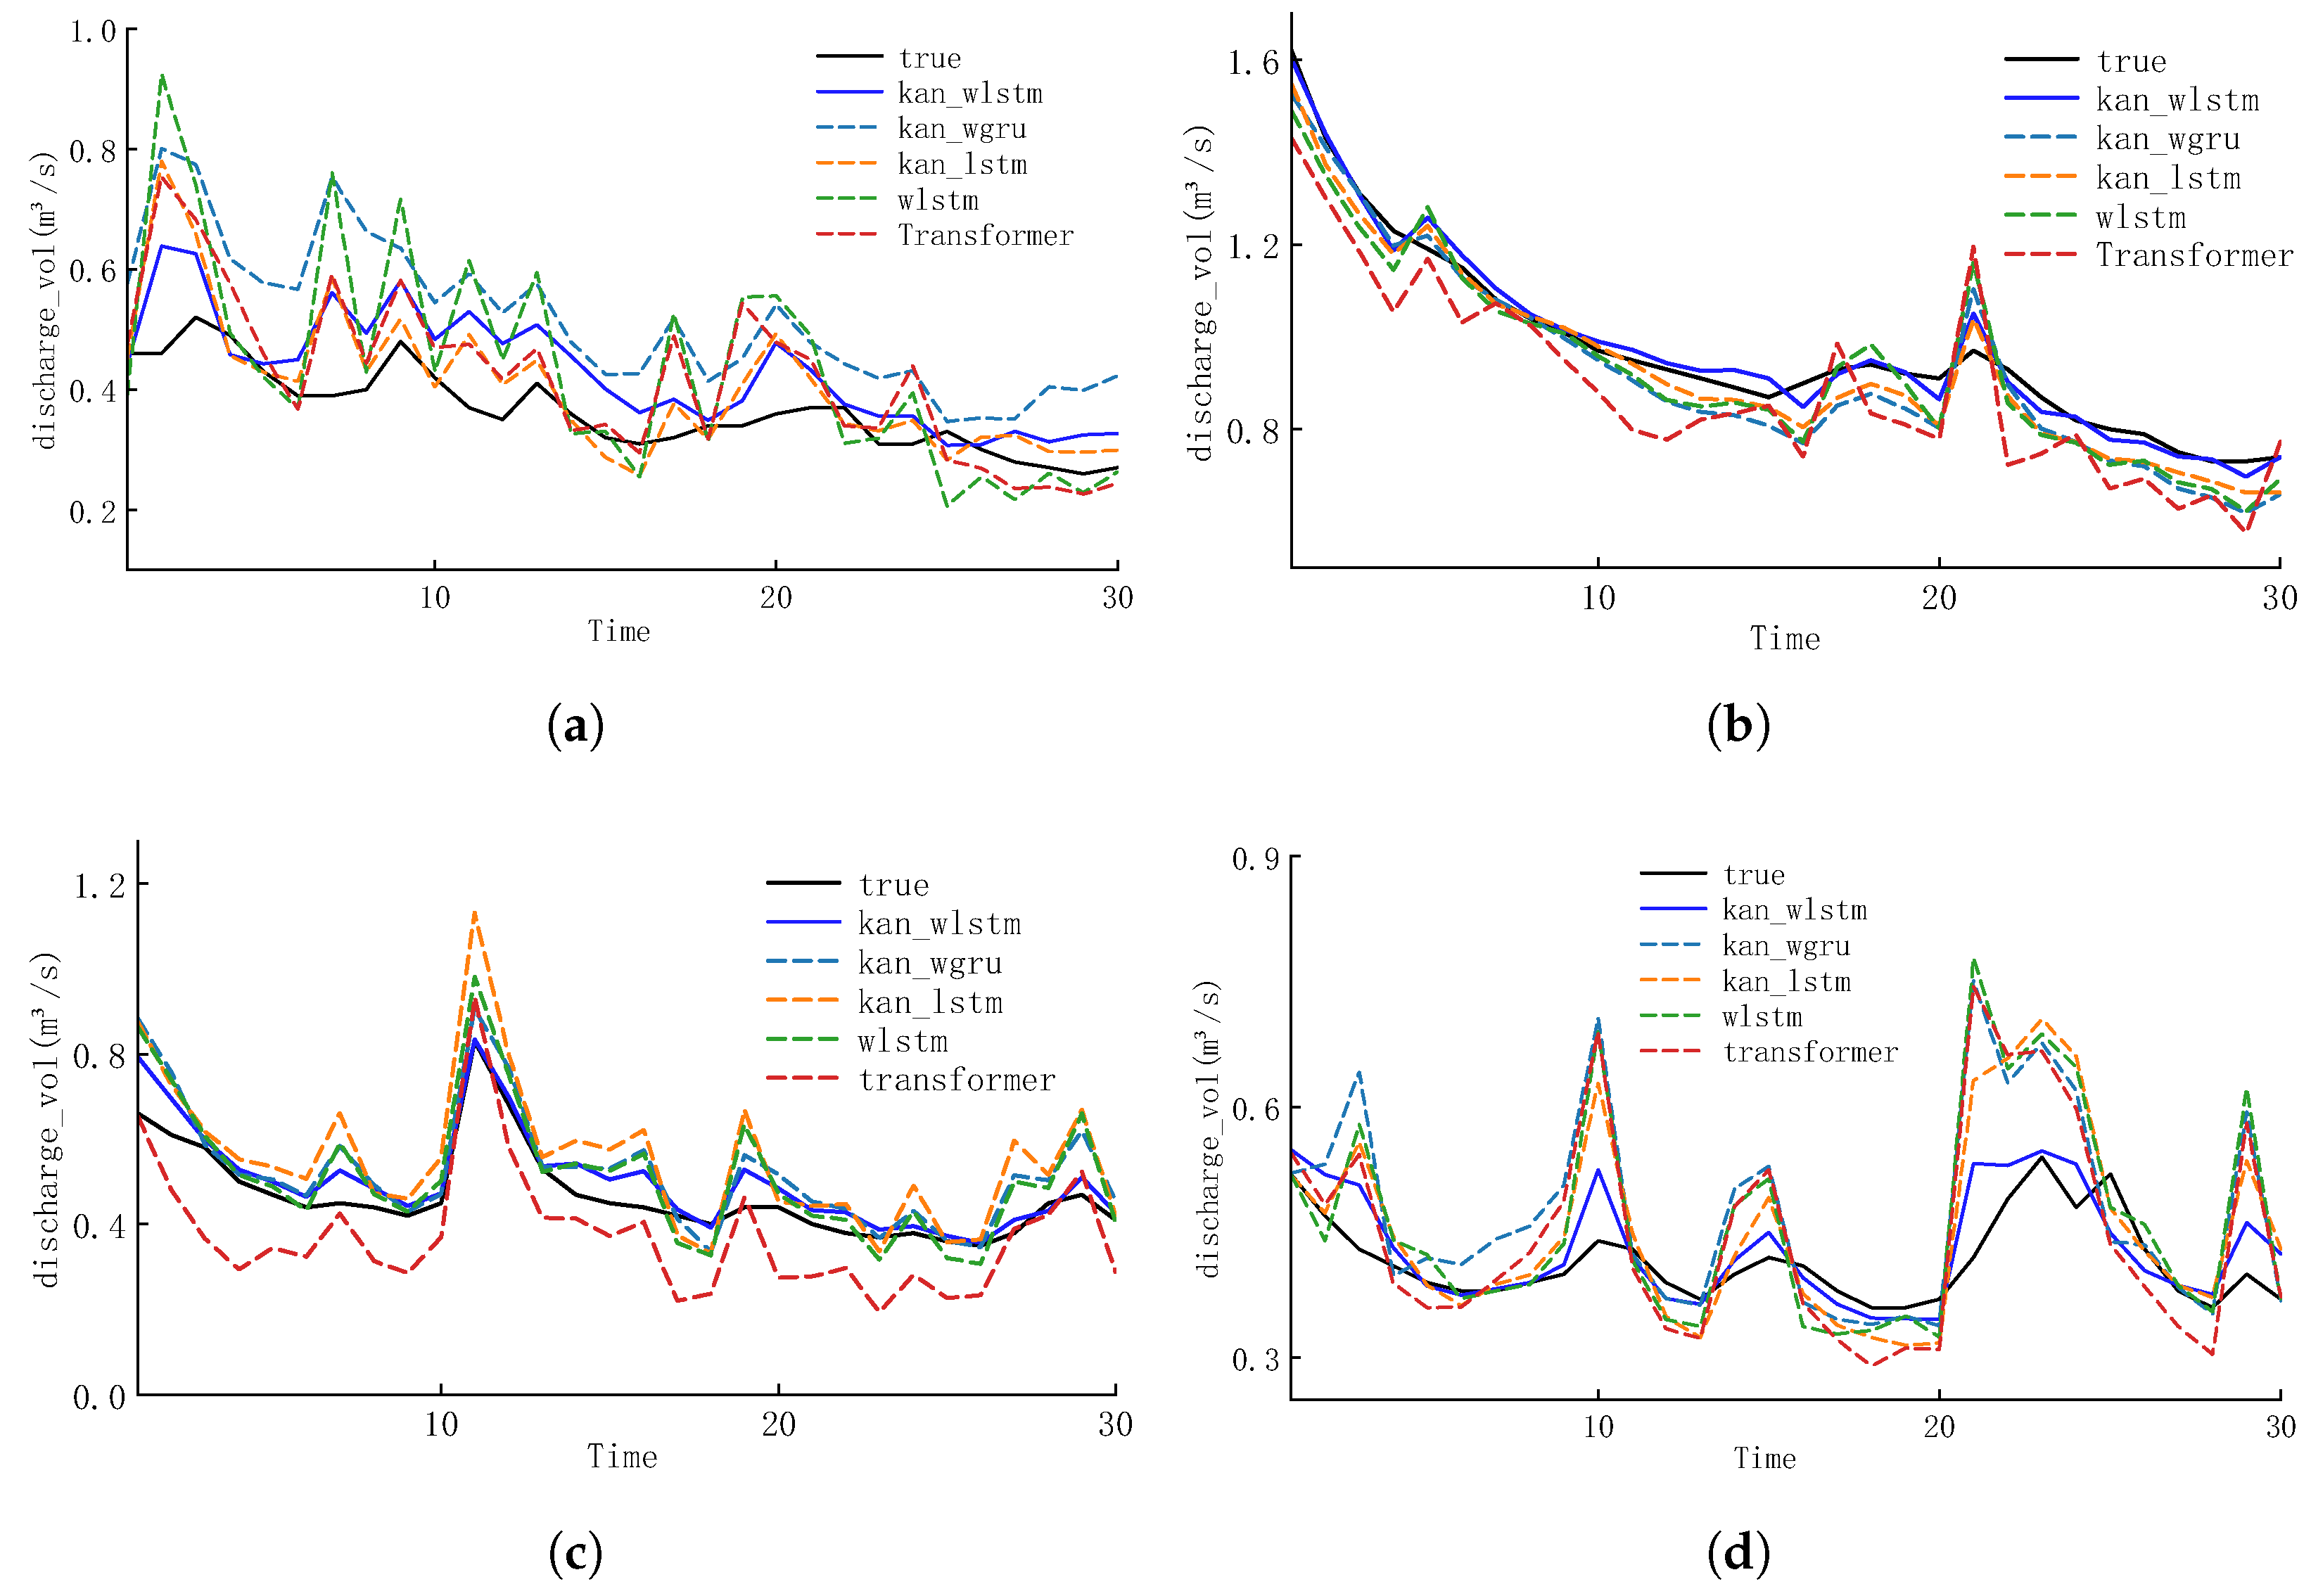
To further evaluate multi-site predictive performance, observed runoff data from four representative hydrological stations were used to compare six models over 30 consecutive time steps (see
Figure 7). The results show that, while all models generally follow the observed trends, WLSTM and Transformer often lag or over-smooth during extreme events, with Transformer performing worst under abrupt flow changes. In contrast, KAN-based models exhibit greater stability and accuracy in low-flow periods, effectively avoiding drift caused by minor fluctuations and demonstrating stronger adaptability.
4.4. Comprehensive Evaluation Across 161 Basins
To comprehensively evaluate the robustness and generalization ability of the proposed model, large-scale experiments were conducted across 161 catchments with diverse hydro-climatic characteristics in Great Britain. For each basin, 50 rounds of hyperparameter optimization were performed using the Optuna framework, followed by 200 epochs of training with the best configuration to ensure convergence and comparability across models. The main hyperparameters involved in the optimization include (1) hidden_size, which controls the dimensionality of internal feature representation and determines the model’s capacity to learn complex temporal dynamics; (2) layers and num_layers, which define the network depth and affect the degree of temporal abstraction; (3)learning rate (lr), which balances convergence speed and stability during gradient updates; and (4) attn_dim, which applies to attention-based structures and determines the dimensionality of the attention projection space. These parameters jointly govern the model’s learning efficiency, representational power, and resistance to overfitting.
As shown in
Table 6, the optimized hyperparameters exhibit consistent search boundaries across models, yet distinct mean configurations emerged after optimization. The proposed WLSTM-KAN model achieved the largest average hidden_size (117.07), indicating a broader latent feature space that enhances its capacity to capture multi-scale temporal variations. The num_layers stabilized around 2.58, suggesting that moderate network depth is sufficient to balance model expressiveness and overfitting risk. Moreover, the learning rate range (0.00108–0.00997, mean 0.00587) implies adaptive yet stable convergence during training. In comparison, the ATT-LSTM required a larger attn_dim (mean 146.54) to maintain representation power, reflecting its reliance on attention projection to compensate for limited structural flexibility.
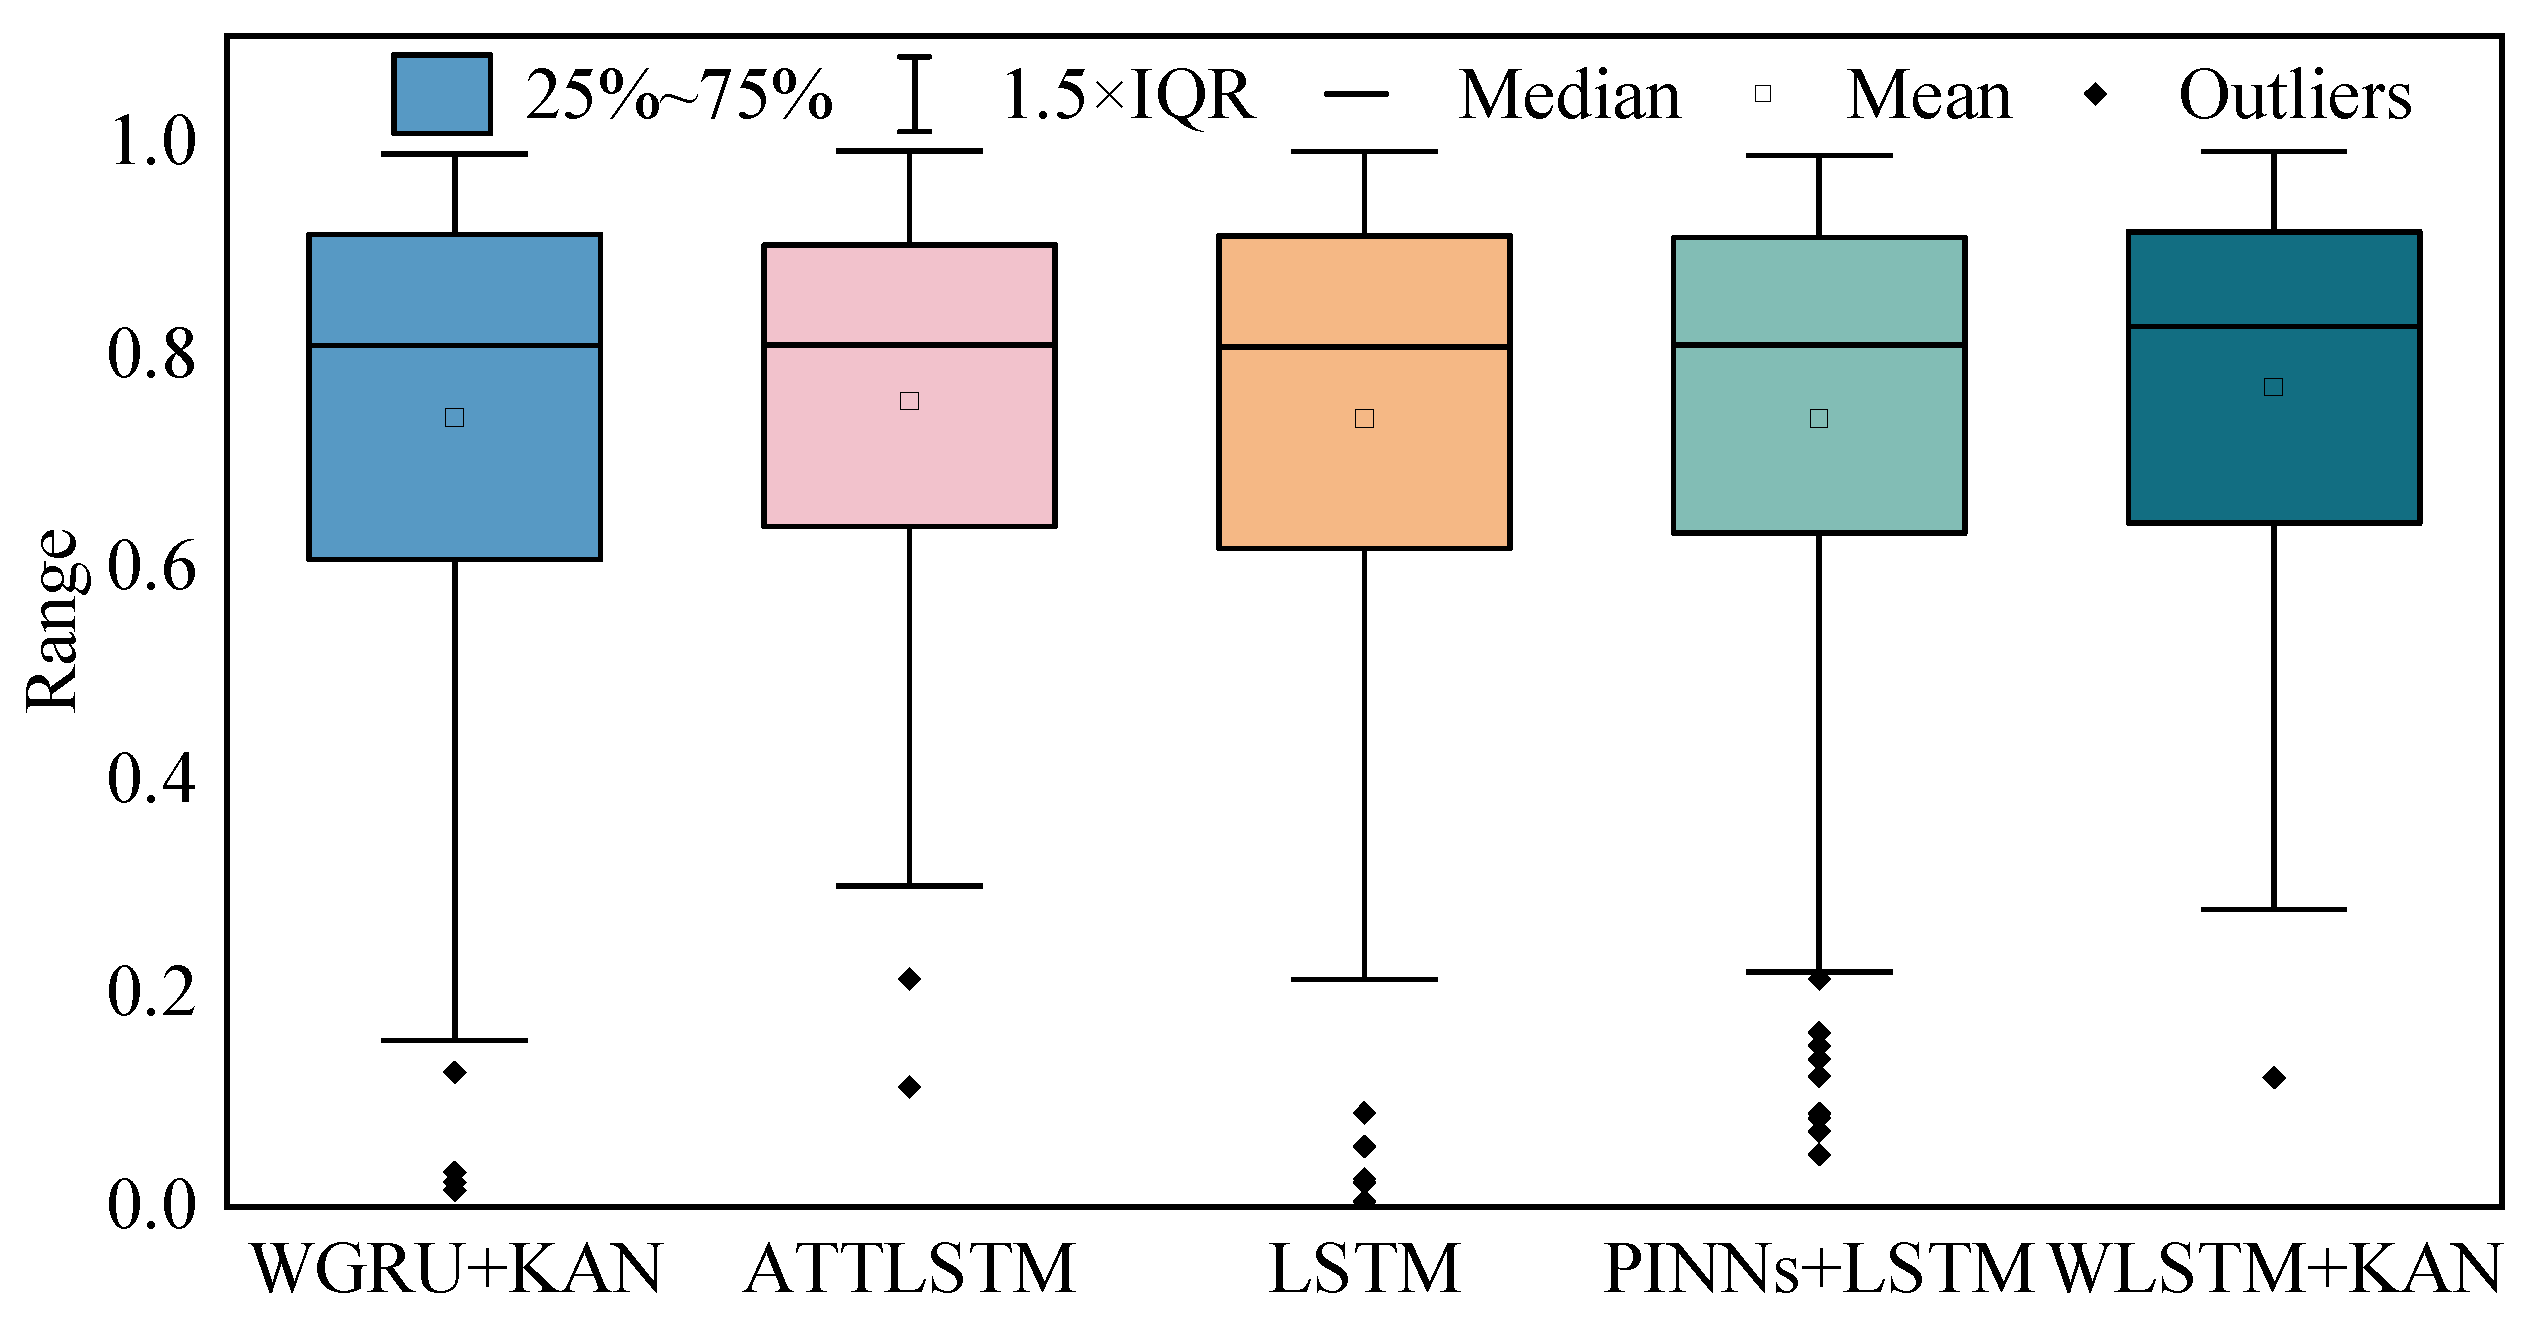
Figure 8 shows the statistical distribution of R
2 values for the five benchmark models across all basins. Overall, traditional deep learning models such as LSTM and GRU displayed moderate performance, with average R
2 values around 0.74 and large variance across basins (standard deviation ≈ 0.22), indicating their limited ability to generalize under varying hydrological regimes. ATT-LSTM introduced attention mechanisms that slightly improved spatial consistency, achieving a mean R
2 of 0.757, yet its performance still fluctuated notably among data-sparse regions. Similarly, PINNs incorporated physical constraints but were highly sensitive to the accuracy of physical parameterization, resulting in unstable convergence when basin heterogeneity increased.
In comparison, the proposed WLSTM-KAN achieved the highest and most stable performance, with an average R2 of 0.770 and a median of 0.827 across 161 basins. The relatively small standard deviation (0.18) indicates that the model maintained stable predictive capability under diverse climatic and topographic conditions. This stability highlights the model’s strong generalization ability and physical consistency. Unlike data-intensive architectures such as Informer, which rely heavily on abundant temporal patterns and tend to collapse under data-limited or non-stationary conditions, the WLSTM-KAN demonstrates adaptability even in basins with sparse or noisy data.
The key advantage of the WLSTM-KAN lies in its decomposable functional representation, which naturally aligns with hydrological physical mechanisms. By leveraging local basis functions, KAN captures nonlinear responses such as rapid runoff generation during heavy rainfall events, while preserving the water-balance and evapotranspiration relationships embedded in hydrological laws. Consequently, the WLSTM-KAN integrates both data-driven flexibility and physics-based interpretability, achieving superior accuracy and transferability across heterogeneous basins.
5. Discussion
Current hydrological modeling methods often rely on signal decomposition or hybrid frameworks that couple physical models with machine learning. Although decomposition techniques can reveal multi-scale patterns, they carry a risk of information leakage, where future information may unintentionally influence model training, leading to over-optimistic results. Likewise, directly feeding outputs from physical models into data-driven networks appears to combine interpretability and flexibility, yet in practice, it may propagate systematic biases or cause the learning model to fit residual errors rather than genuine hydrological processes.
In this context, the KAN–WLSTM proposed in this study represents an alternative attempt: instead of externally combining two paradigms, it seeks to make the learning architecture itself more physically aware. The model uses a parameter-rich and decomposable functional structure to approximate hydrological behavior through data-driven optimization. It should be emphasized, however, that, while KAN–WLSTM fits the function that best matches observed correctness, it does not guarantee that the simulated functions fully correspond to real-world physical laws.
In addition, the authors conducted further experiments revealing that transformer-based models such as the Informer are highly sensitive to data scale and quality—performing well only under ideal conditions but prone to instability otherwise. These findings suggest that current deep architectures may be approaching a representational bottleneck in hydrological modeling. Future progress will likely depend on incorporating richer and more heterogeneous data sources—such as remote sensing, land surface observations, and soil–vegetation–atmosphere coupling data—to construct unified basin-scale frameworks. Integrating upstream–downstream connectivity and spatial dependency modeling could provide a pathway toward holistic river-system simulations, enabling better linkage between localized runoff predictions and broader watershed management strategies.
6. Conclusions
This study proposed a hybrid runoff forecasting framework, KAN–WLSTM, which integrates the nonlinear representational capacity of the KAN with the sequence learning strength of the WLSTM. The model was designed to address three persistent challenges in multi-basin hydrological modeling: limited nonlinear expressiveness in conventional recurrent structures, underestimation of high-flow extremes due to sample imbalance, and poor cross-basin generalization under heterogeneous climatic conditions.
Comprehensive experiments were performed across multiple scales—from single-station analysis to large-sample basin evaluation—to verify model robustness. In the input-lag sensitivity experiments, four configurations (7-, 14-, 21-, and 28-day windows) were compared. The 14-day lag was found to yield the most balanced performance, achieving the lowest mean MSE (1.77) and highest mean NSE (0.81) across nine representative basins. Shorter lags (e.g., 7 days) provided insufficient antecedent information to capture delayed hydrological responses, while longer lags (21–28 days) introduced redundancy and degraded generalization. This result aligns with the physically meaningful rainfall–runoff response time of one to two weeks commonly observed in temperate catchments.
Model comparison experiments demonstrated the superiority of the proposed architecture. The KAN–WLSTM consistently achieved the best or near-best results among five benchmark models (GRU, XGBoost, Transformer, KAN–WGRU, and KAN–WLSTM), with average MSE and NSE improvements of 6.8% and 2.7%, respectively, over the WLSTM baseline. The model showed strong adaptability across basins with complex runoff dynamics and achieved stable convergence where other models suffered from degraded learning. Ablation analysis further confirmed that both the KAN module and the weighted loss function contributed complementary benefits: the former enhanced nonlinear mapping between meteorological drivers and runoff, while the latter increased the model’s responsiveness to flood-driven extremes. Their combined effect reduced peak discharge errors by up to 18% and improved average NSE by 3.9%.
Large-scale validation across 161 basins in Great Britain demonstrated that the KAN–WLSTM maintains both high accuracy and stable performance across diverse hydro-climatic conditions. The model achieved an average of 0.770 and a median of 0.827, outperforming traditional LSTM and GRU architectures by a wide margin and exhibiting smaller variance across catchments (standard deviation 0.18). This stability highlights its superior generalization capability under non-stationary and data-sparse environments. The decomposable functional structure of KAN allows the network to mimic key hydrological relationships—such as water balance and evapotranspiration—while capturing localized nonlinearities like rapid runoff generation during high-flow events. As a result, the proposed KAN–WLSTM successfully integrates data-driven flexibility with physics-based interpretability, providing a robust and generalizable solution for multi-basin runoff forecasting.
Author Contributions
Conceptualization, G.L.; methodology, F.S.; software, F.S.; validation, F.S.; formal analysis, F.S.; investigation, F.S.; resources, G.L.; data curation, F.S.; writing—original draft preparation, F.S.; writing—review and editing, G.L.; visualization, F.S.; supervision, Y.W.; project administration, G.L.; funding acquisition, G.L. All authors have read and agreed to the published version of the manuscript.
Funding
This research was funded by the 2023 Autonomous Region University Basic Research Project, “Research on Flood Control Early Warning Model of Check Dams Based on Deep Learning” (Project No. JY20230040). The paper also supported by the Inner Mongolia Water Resources Development Fund Project (NSK202109): Research on Flood Forecasting and Early Warning Technology for Check Dams in the Yellow River Basin of Inner Mongolia.
Data Availability Statement
The dataset used in this study is openly available at [
33]. A research article describing the dataset in detail will be available in
Earth System Science Data. Processed data used in this study are available from the corresponding author upon reasonable request.
Conflicts of Interest
The authors declare no conflicts of interest. The funders had no role in the design of the study; in the collection, analyses, or interpretation of data; in the writing of the manuscript; or in the decision to publish the results.
References
- Rentschler, J.E.; Salhab, M. People in Harm’s Way: Flood Exposure and Poverty in 189 Countries; Policy Research Working Paper Series; The World Bank: Washington, DC, USA, 2020; Volume 9447. [Google Scholar]
- He, C.; Rameshwaran, P.; Bell, V.A.; Brown, M.J.; Davies, H.N.; Kay, A.L.; Rudd, A.C.; Sefton, C. Use of abstraction and discharge data to improve the performance of a national-scale hydrological model. Water Resour. Res. 2022, 58, e2021WR029787. [Google Scholar]
- Ormerod, S. Rebalancing the philosophy of river conservation. Aquat. Conserv. Mar. Freshw. Ecosyst. 2014, 24, 147–152. [Google Scholar] [CrossRef]
- Royan, A.; Hannah, D.; Reynolds, S.; Noble, D.; Sadler, J. River birds’ response to hydrological extremes: New vulnerability index and conservation implications. Biol. Conserv. 2014, 177, 64–73. [Google Scholar] [CrossRef]
- Liu, Z.; Wu, J.; Pan, X.; Fang, Z.; Li, J.; Bryan, B.A. Future global urban water scarcity and potential solutions. Nat. Commun. 2021, 12, 4667. [Google Scholar] [CrossRef]
- Guo, L.; Wang, L. Peak water: Future long-term changes driven by socio-economic development in China. Environ. Sci. Pollut. Res. 2023, 30, 1306–1317. [Google Scholar]
- Xu, J.; Jin, G.; Tang, H.; Zhang, P.; Wang, S.; Wang, Y.-G.; Li, L. Assessing temporal variations of ammonia nitrogen concentrations and loads in the Huaihe River Basin in relation to policies on pollution source control. Sci. Total Environ. 2018, 642, 1386–1395. [Google Scholar] [CrossRef]
- Carlson, R.F.; MacCormick, A.J.A.; Watts, D.G. Application of linear random models to four annual streamflow series. Water Resour. Res. 1970, 6, 1070–1078. [Google Scholar] [CrossRef]
- Liu, Q.; Gui, D.; Zhang, L.; Niu, J.; Dai, H.; Wei, G.; Hu, B.X. Simulation of regional groundwater levels in arid regions using interpretable machine learning models. Sci. Total Environ. 2022, 831, 154902. [Google Scholar] [CrossRef]
- Guan, S.; Wang, Y.; Liu, L.; Gao, J.; Xu, Z.; Kan, S. Ultra-short-term wind power prediction method based on FTI-VACA-XGB model. Expert Syst. Appl. 2024, 235, 121185. [Google Scholar] [CrossRef]
- Shu, X.; Ding, W.; Peng, Y.; Wang, Z.; Wu, J.; Li, M. Monthly streamflow forecasting using convolutional neural network. Water Resour. Manag. 2021, 35, 5089–5104. [Google Scholar] [CrossRef]
- Sun, J.; Hu, L.; Li, D.; Sun, K.; Yang, Z. Data-driven models for accurate groundwater level prediction and their practical significance in groundwater management. J. Hydrol. 2022, 608, 127630. [Google Scholar] [CrossRef]
- Le, X.H.; Nguyen, D.H.; Jung, S.; Yeon, M.; Lee, G. Comparison of deep learning techniques for river streamflow forecasting. IEEE Access 2021, 9, 71805–71820. [Google Scholar] [CrossRef]
- Xie, K.; Liu, P.; Zhang, J.; Han, D.; Wang, G.; Shen, C. Physics-guided deep learning for rainfall-runoff modeling by considering extreme events and monotonic relationships. J. Hydrol. 2021, 603, 127043. [Google Scholar] [CrossRef]
- Li, G.; Liu, Z.; Zhang, J.; Han, H.; Shu, Z. Bayesian model averaging by combining deep learning models to improve lake water level prediction. Sci. Total Environ. 2024, 906, 167718. [Google Scholar] [CrossRef] [PubMed]
- Yin, W.; Fan, Z.; Tangdamrongsub, N.; Hu, L.; Zhang, M. Comparison of physical and data-driven models to forecast groundwater level changes with the inclusion of GRACE–A case study over the state of Victoria, Australia. J. Hydrol. 2021, 602, 126735. [Google Scholar] [CrossRef]
- Chu, H.; Wu, J.; Wu, W.; Wei, J. A dynamic classification-based long short-term memory network model for daily streamflow forecasting in different climate regions. Ecol. Indic. 2023, 148, 110092. [Google Scholar]
- Xu, D.M.; Li, Z.; Wang, W.C.; Hong, Y.; Gu, M.; Hu, H.; Wang, J. WaveTransTimesNet: An enhanced deep learning monthly runoff prediction model based on wavelet transform and transformer architecture. Stoch. Environ. Res. Risk Assess. 2025, 39, 883–910. [Google Scholar]
- He, N.N.; Wang, W.C. Enhancing monthly runoff prediction: A data-driven framework integrating variational mode decomposition, enhanced artificial rabbit optimization, support vector regression, and error correction. Earth Sci. Inform. 2025, 18, 265. [Google Scholar] [CrossRef]
- Li, W.; Liu, H.; Gao, P.; Yang, A.; Fei, Y.; Wen, Y.; Su, Y.; Yuan, X. Development of an MPE-BMA ensemble model for runoff prediction under future climate change scenarios: A case study of the Xiangxi River Basin. Sustainability 2025, 17, 4714. [Google Scholar] [CrossRef]
- Zhang, J.; Li, J.; Zhao, H.; Wang, W.; Lv, N.; Zhang, B.; Liu, Y.; Yang, X.; Guo, M.; Dong, Y. Impact assessment of coupling mode of hydrological model and machine learning model on runoff simulation: A case of Washington. Atmosphere 2024, 15, 1461. [Google Scholar] [CrossRef]
- Coxon, G.; Addor, N.; Bloomfield, J.P.; Freer, J.; Fry, M.; Hannaford, J.; Howden, N.J.K.; Lane, R.; Lewis, M.; Robinson, E.L.; et al. CAMELS-GB: Hydrometeorological time series and landscape attributes for 671 catchments in Great Britain. Earth Syst. Sci. Data 2020, 12, 2459–2483. [Google Scholar] [CrossRef]
- Yu, Y.; Si, X.; Hu, C.; Zhang, J. A review of recurrent neural networks: LSTM cells and network architectures. Neural Comput. 2019, 31, 1235–1270. [Google Scholar] [CrossRef]
- Wu, M.; Liu, P.; Liu, L.; Zou, K.; Luo, X.; Wang, J.; Xia, Q.; Wang, H. Improving a hydrological model by coupling it with an LSTM water use forecasting model. J. Hydrol. 2024, 636, 131215. [Google Scholar] [CrossRef]
- Sai, Y.; Jinxia, R.; Zhongxia, L. Learning of neural networks based on weighted mean squares error function. In Proceedings of the 2009 Second International Symposium on Computational Intelligence and Design, Washington, DC, USA, 12–14 December 2009; IEEE: New York, NY, USA, 2009; Volume 1, pp. 241–244. [Google Scholar]
- Liu, Z.; Wang, Y.; Vaidya, S.; Ruehle, F.; Halverson, J.; Soljačić, M.; Hou, T.Y.; Tegmark, M. Kan: Kolmogorov-Arnold Networks. arXiv 2024, arXiv:2404.19756. [Google Scholar] [PubMed]
- Somvanshi, S.; Javed, S.A.; Islam, M.M.; Pandit, D.; Das, S. A survey on Kolmogorov-Arnold Network. arXiv 2024, arXiv:2411.06078. [Google Scholar] [CrossRef]
- Brentan, B.M.; Meirelles, G.; Herrera, M.; Luvizotto Jr, E.; Izquierdo, J. Correlation analysis of water demand and predictive variables for short-term forecasting models. Math. Probl. Eng. 2017, 2017, 6343625. [Google Scholar]
- Attanasio, A.; Pasini, A.; Triacca, U. Granger causality analyses for climatic attribution. Atmos. Clim. Sci. 2013, 2013, 515–522. [Google Scholar] [CrossRef][Green Version]
- Akiba, T.; Sano, S.; Yanase, T.; Ohta, T.; Koyama, M. Optuna: A next-generation hyperparameter optimization framework. In Proceedings of the 25th ACM SIGKDD International Conference on Knowledge Discovery & Data Mining, Anchorage, AK, USA, 4–8 August 2019; ACM: New York, NY, USA, 2019; pp. 2623–2631. [Google Scholar][Green Version]
- Coxon, G.; McMillan, H.; Bloomfield, J.P.; Bolotin, L.; Dean, J.F.; Kelleher, C.; Slater, L.; Zheng, Y. Wastewater discharges and urban land cover dominate urban hydrology signals across England and Wales. Environ. Res. Lett. 2024, 19, 084016. [Google Scholar] [CrossRef]
- Gupta, H.V.; Kling, H.; Yilmaz, K.K.; Martinez, G.F. Decomposition of the mean squared error and NSE performance criteria: Implications for improving hydrological modelling. J. Hydrol. 2009, 377, 80–91. [Google Scholar] [CrossRef]
- Coxon, G.; Addor, N.; Bloomfield, J.P.; Freer, J.; Fry, M.; Hannaford, J.; Howden, N.J.K.; Lane, R.; Lewis, M.; Robinson, E.L.; et al. Catchment attributes and hydro-meteorological timeseries for 671 catchments across Great Britain (CAMELS-GB). NERC Environmental Information Data Centre. 2020. Available online: https://catalogue.ceh.ac.uk/documents/8344e4f3-d2ea-44f5-8afa-86d2987543a9 (accessed on 15 September 2025).
| Disclaimer/Publisher’s Note: The statements, opinions and data contained in all publications are solely those of the individual author(s) and contributor(s) and not of MDPI and/or the editor(s). MDPI and/or the editor(s) disclaim responsibility for any injury to people or property resulting from any ideas, methods, instructions or products referred to in the content. |
© 2025 by the authors. Licensee MDPI, Basel, Switzerland. This article is an open access article distributed under the terms and conditions of the Creative Commons Attribution (CC BY) license (https://creativecommons.org/licenses/by/4.0/).
