Abstract
Within the context of global climate change, the hydrological and sediment load dynamics in the Huai River Basin are expected to continue evolving due to intensified human activities and environmental changes. Effective river management requires a clear understanding of the magnitude, causes, and characteristics of these changes, coupled with insight into the dynamic response processes of the river channel. This study applied a suite of statistical methods, including the Mann–Kendall test, Sen’s slope estimator, Pettitt’s test, double mass curve, and morphological analysis, to examine trends in streamflow and sediment load at two hydrological stations in the mid-Huai River from 1982 to 2016, and to assess channel evolution between Wujiadu and Xiaoliuxiang. The results indicate that: (1) both hydrological stations exhibited no significant decrease in annual streamflow, but a significant reduction in sediment load, with a change point detected in 1991 at Wujiadu Station; (2) compared to 1982–1990, the mean streamflow and sediment load decreased by 23% and 50% during 1991–2016, with a significant shift in the streamflow-sediment relationship; (3) while temperature and evapotranspiration increased significantly, precipitation remained relatively stable, indicating that climate change had a minor effect on hydrological elements, and sediment load reduction was primarily driven by large-scale ecological restoration and engineering activities; and (4) differential channel adjustments were observed in response to reduced sediment supply and human activities, modulated by local boundary conditions. Erosion occurred in the WJD section, resulting in a transformation from a U-shape to a V-shape cross-section, whereas the XLX section remained stable with a local adverse gradient. This study reveals the complex mechanisms of hydro-sedimentary and channel evolution under human dominance, offering scientific support for the sustainable management of the Huai River basin and similar regulated rivers.
1. Introduction
As climate change and human activities intensify, rivers worldwide are undergoing unprecedented alterations in streamflow and sediment regimes [1,2]. These changes trigger complex channel morphological adjustments that threaten flood control, ecological sustainability, and water resource management at the basin scale [3,4]. A representative example is the Middle-Lower Yangtze River, where the operation of the Three Gorges Dam has significantly reduced sediment load, inducing extensive channel erosion and subsequent bank instability that poses substantial risks to riverside communities and infrastructure [5]. However, morphological responses to environmental changes exhibit considerable heterogeneity across river systems, governed by distinct climatic conditions, geomorphic characteristics, and human interventions [6,7]. For instance, in the Source Region of the Yangtze River, climate-driven increases in streamflow and sediment load have intensified accretion processes [8]. In contrast, the Lower Yellow River has experienced a substantial shift from sediment deposition to rapid channel erosion since 2002, following the implementation of the Water-Sediment Regulation Scheme through the coordinated operation of large reservoirs [9]. Therefore, understanding the behavior and morphodynamic evolution of specific river systems has become an urgent need, as it offers essential scientific insights for guiding sustainable river basin management and governance.
The Huai River Basin, one of China’s major grain-producing areas and most densely populated regions, supports large-scale agricultural production and economic activities, highlighting its strategic importance [10]. However, located in the transitional zone between northern and southern climatic regimes, characterized by a north–south gradient from a warm-temperate semi-humid monsoon to a northern subtropical humid climate, the area exhibits highly uneven spatiotemporal precipitation distribution and complex variability, leading to frequent floods and droughts at an average rate of one major flood event every five years [11,12]. Since 1949, the basin has experienced more than ten major flood events and over eight severe droughts [13]. In response to these challenges, extensive water control projects have been constructed, including more than 5700 dams and 5000 sluices, transforming the Huai River into one of the most heavily engineered river systems in the world [14]. As a result, the natural streamflow-sediment processes have been significantly altered, triggering basin-wide hydrological variability and geomorphic adjustments. Previous studies have mainly investigated the trends and drivers of streamflow-sediment changes, indicating that both climate change and human activities have substantially modified hydrological and sediment processes in the basin [15,16,17]. Nevertheless, the vast spatial extent of the Huai River results in pronounced heterogeneity in topographic conditions and streamflow-sediment processes among its upper, middle, and lower reaches, making generalized analyses insufficient to reveal critical reach-specific response mechanisms.
Compared to the upper and lower reaches of the Huai River, the middle reach deserves greater attention due to its distinctive hydrological and socio-economic significance. First, the middle reach serves as the economic core of the basin, supporting intensive agriculture, a dense population, and concentrated industrial activities. According to the Huai River Basin and Shandong Peninsula Water Resources Bulletin (2022), the total water resources in this reach amounted to 258.3 × 10⁸ m3, significantly exceeding those in the upper (65.6 × 10⁸ m3) and the lower reaches (33.2 × 10⁸ m3). Moreover, water consumption in the middle reach was considerably higher, with agricultural use accounting for 120.7 × 10⁸ m3, industrial use for 9.5 × 10⁸ m3, and domestic use for 13.2 × 10⁸ m3. Second, the upper reach exhibits steep slopes (0.5‰) and high flow velocities that deliver substantial sediment midstream, while the middle reach experiences a markedly reduced gradient (0.03‰). This geomorphic transition, compounded by the backwater effect from the Hongze Lake and the adverse slope downstream of the Fushan, severely constrains flood conveyance, resulting in frequent and severe flooding. For example, the middle reach was the most severely affected during the catastrophic basin-wide flood in 1991, requiring the evacuation of 504,000 people and resulting in direct economic losses of CNY 27.5 billion.
However, existing studies often investigate streamflow-sediment dynamics and channel evolution in isolation [18,19,20,21], rather than as interconnected processes. This fragmented approach limits a systematic understanding of the intrinsic mechanisms between streamflow-sediment variations and channel bed response under changing environmental conditions. As a result, the practical application of such findings remains constrained in supporting effective basin management, particularly in water resource utilization and flood prevention. There is an urgent need for integrated studies that holistically investigate these interactions. This fragmented approach hinders a systematic understanding of the mechanisms linking streamflow-sediment variations and channel adjustments under changing environmental conditions. Consequently, the practical application of previous findings remains limited in guiding integrated basin management, particularly in water resource allocation and flood risk mitigation. Therefore, there is an urgent need for comprehensive studies that holistically examine the coupled interactions within the middle reach of the Huai River.
To address the research gap and enhance the systematic understanding of streamflow-sediment variations and channel evolution in the mid-Huai River, this study sets out to achieve the following objectives: (1) to quantify temporal trends in streamflow and sediment load through the Mann–Kendall and Pettitt tests, based on daily hydrological records (1982–2016) from two hydrological stations; (2) to examine changes in streamflow-sediment relationships across different periods through double mass curves and analysis correlation methods; (3) to investigate the influence of key environmental drivers on the streamflow-sediment regime; (4) to characterize channel evolution and erosion–deposition patterns based on long-term topographic survey data; and (5) to analyze the driving factors of sediment changes and associated mechanisms of channel adjustment. The findings are expected to provide a scientific foundation for river management and ecological protection in the mid-Huai River while also serving as a reference for the regulation of rivers influenced by climate change and intensive human activities.
2. Materials and Methods
2.1. Study Area
The Huai River Basin (Figure 1), with a drainage area of 274,657 km2, is the sixth-largest river basin in China. It is located between the Yangtze and Yellow River Basins and has a climate characterized by dry winters and wet summers, with a mean annual temperature of 14.5 °C and an average annual precipitation of 883 mm [22]. Despite substantial water resources in the basin—with an average runoff depth of 230 mm—the high population density has reduced per capita water availability to less than one-fifth the national average [23]. Due to its location in a transitional climatic zone, the Huai River Basin is particularly susceptible to flooding. The increasing frequency and severity of these disasters are attributed to the combined impacts of climate change and human activities, with the middle reaches being the most severely affected [21].
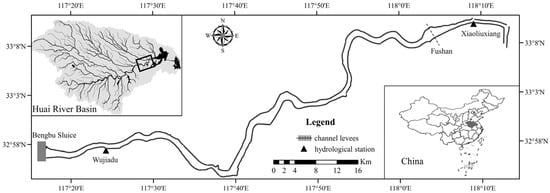
Figure 1.
Location of the study reach and hydrological stations.
The study area, Wujiadu–Xiaoliuxiang (WJD–XLX) reach, is located in the downstream section of the mid-Huai River. This meandering segment is approximately 100 km, situated just 10 km downstream of a major hydraulic structure (the Bengbu Sluice) and about 70 km upstream of the inflow area to Hongze Lake. Based on these critical locational attributes, the WJD-XLX reach was selected for this study as a quintessential site for investigating hydro-sedimentary dynamics and channel evolution under changing environments due to the following reasons. First, the reach is situated in a transitional zone between the northern and southern climatic regimes in China, resulting in an intricate and variable hydro-meteorological setting. This inherent intricacy is further amplified by significant human interventions (e.g., flow regulation from the upstream Bengbu Sluice and frequent dredging projects within the reach), which collectively create a highly complex and dynamic environment. Second, due to the combined influence of the backwater effect of the Hongze Lake and an inverse gradient downstream of the Fushan, flood conveyance in the WJD-XLX reach is severely impeded, making it the most severe flood area in the mid-Huai River. Consequently, the combined natural (hydro-meteorological and geographical) and human forcings drive the most dynamic channel evolution in the WJD-XLX reach—manifested as significant bed erosion-deposition and rapid longitudinal profile adjustments—making it both a long-standing management priority and a critical zone for studying flood hazards and geomorphic processes.
2.2. Data
2.2.1. Hydrological and Sediment Data
Daily streamflow and sediment load data (1982–2016) for the mid-Huai River were obtained from the Huai River Water Resources Commission, recorded at the WJD and XLX hydrological stations. The WJD hydrological station serves as the main control section of the mid-Huai River, and its records represent the incoming water and sediment conditions of this region. The XLX Station is the final control station before the Huai River enters Hongze Lake. The contributing area between WJD and XLX is relatively small, with no major tributaries joining in this reach. Thus, the sediment difference between the inflow (WJD) and outflow (XLX) largely reflects the channel erosion and deposition within the segment [24]. Additionally, data were missing at XLX from 1989 to 1992, which were estimated using multi-year mean streamflow and ratios of sediment transport. All data used in this study have been rigorously validated by the Huai River Water Resources Commission.
2.2.2. Channel Topography and Cross-Sectional Data
The topographic and channel morphology data were obtained from the Hydrological Bureau of the Huai River Water Resources Commission. The dataset includes thalweg elevation profiles for the years 1983, 1992, 2001, and 2012. Cross-sectional survey data at the WJD hydrological station are available for 1983, 1989, 1995, 2001, 2007, and 2015, while cross-sectional data at the XLX station cover the years 1983, 1989, 1995, 2001, 2007 and 2008. In addition, pre- and post-flood seasonal cross-sectional measurements at WJD are available for the period from 2009 to 2014. All datasets underwent rigorous quality control and validation by the issuing authority and are suitable for analyzing channel evolution and sedimentation processes.
2.2.3. Remote Sensing Data
Precipitation (PRE) data for 1982 to 2016 were derived from the Climate Hazards Group Infrared Precipitation with Station data (CHIRPS) [25], which provides a spatial resolution of 0.05° and a daily temporal resolution. The dataset is calibrated with station data and is suitable for long-term trend analysis. Temperature (TEMP) data, including annual maximum, mean, and minimum values from 1982 to 2016, were obtained from the ERA5-Land monthly aggregated dataset [26], which has a spatial resolution of 0.1° and has been widely applied in trend studies. Evapotranspiration (ET) data, representing the annual average from 2000 to 2016, were derived from the MOD16A2GF.061 dataset [27] at 500 m spatial resolution. After gap-filling and 8-day composite processing, the data quality is robust for long-term sequence analysis. The normalized difference vegetation index (NDVI) from 1986 to 2016 [28] was calculated as annual averages based on Landsat 4, Landsat 5, Landsat 7, Landsat 8, and Landsat 9 satellites, with a spatial resolution of 30 m.
2.3. Methods
2.3.1. Trend Analysis
The Mann–Kendall test is a non-parametric method for detecting trends in long-term time series which is recommended by the World Meteorological Organization [29]. Since it does not require the data to follow a specific distribution, the MK test has been widely applied in the analysis of hydrological and meteorological variables such as streamflow, precipitation, and sediment [11,30]. The Mann–Kendall statistic S is computed by comparing each data point with every subsequent point in the time series. For each pair, if a later value is greater than an earlier one, a positive sign is assigned (indicating an upward trend); otherwise, a negative sign is assigned. The statistic S is then obtained by summing the signs of all pairwise differences. For a time series of n observations (x1, x2, …, xn), S can be expressed as follows [31,32]:
where:
If n ≥ 8, then the statistic S is approximately normally distributed with a mean of zero and can be calculated as follows:
Finally, the statistic Z-score to assess significance was calculated as follows:
The length of the time series is denoted by n, where xi and xj represent the data values at times i and j (i < j), respectively. The parameter m indicates the quantity of tied groups, and tk refers to the number of ties for the k-th group. The null hypothesis (H0) of no trend is rejected when |Z| ≥ Z1−α/2, with α representing the chosen significance level. To quantify the trend rate, Sen’s non-parametric method was applied [33], in which the trend magnitude is characterized by the absolute value of the slope:
where 1 < i < j < n, and β is the median of all possible pairwise slopes calculated from the dataset.
2.3.2. Change-Point Analysis
The non-parametric Pettitt test [34] was applied to detect significant change points in streamflow and sediment load time series. This method does not require the data to follow a specific distribution and relies on minimal assumptions, making it particularly suitable for identifying abrupt shifts in sequence means when the timing of the change is unknown [35,36]. The test is based on a Mann–Whitney-type statistic (Ut,n). Given a time series X = x1, x2, …, xn, the series is divided into two segments: (x1, x2, …, xt) and (xt+1, xt+2, …, xn). The test statistic Ut,n is calculated as follows:
The most probable change point is identified as follows:
where the sign function sgn(xt − xj) is defined consistently with the Mann–Kendall test. The most probable change point location corresponds to the time t at which the absolute value of the test statistic |Ut,n|. The statistical significance of this change is assessed using the associated probability:
2.3.3. Double Mass Curve Analysis
A double mass curve (DMC) is constructed by plotting cumulative values of two interrelated variables over a common time period [37]. Although this approach cannot quantify the individual contributions of different anthropogenic factors, it provides a straightforward and visual method for detecting shifts in the relationship between the variables—such as between streamflow and sediment load—and has been widely applied in hydrological studies [38,39,40]. In this study, DMCs were developed to examine sediment-related relationships: cumulative streamflow versus cumulative sediment load, and cumulative precipitation versus cumulative sediment load. The precipitation-streamflow relationship was excluded, as it lies outside the scope of this study. A linear segment in the curve indicates a consistent proportional relationship between the variables, implying that the variable on the x-axis remains the dominant controlling factor. Conversely, deviations from linearity indicate changes in the original relationship, typically caused by external influences such as human activities.
3. Results
3.1. Temporal Variations in Streamflow and Sediment Load
Figure 2 illustrates the annual variability in streamflow and sediment load at the two mid-Huai River stations from 1982 to 2016, with corresponding statistics and trend analysis results summarized in Table 1. Overall, streamflow exhibited non-significant decreasing trends at both stations (p > 0.1), with rates of −3.21 × 10⁸ m3/year at WJD and −3.15 × 10⁸ m3/year at XLX. Moreover, the flow regimes displayed remarkable similarity between the two stations, characterized by comparable mean annual streamflow (WJD: 265.55 × 10⁸ m3; XLX: 268.49 × 10⁸ m3) and closely matched coefficients of variation (WJD: 0.58; XLX: 0.56). This convergence in both trend magnitude and flow variability indicates a relatively consistent hydrological response across the basin.
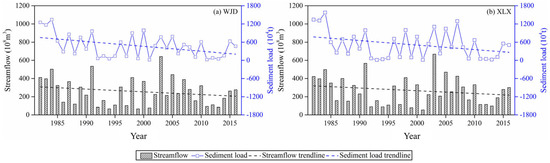
Figure 2.
Annual variation in streamflow and sediment load at different hydrological stations in the mid-Huai River during 1982–2016. (a): The WJD hydrological station; (b) The XLX hydrological station.

Table 1.
Statistics and the trend analysis result of the annual streamflow and sediment load at the WJD and XLX hydrological stations in the mid-Huai River during 1982-2016.
In contrast to streamflow, sediment load showed more pronounced and statistically significant declining trends (p < 0.1) at both stations, with rates of −15.61 × 10⁴ t/year at WJD and −11.22 × 10⁴ t/year at XLX. The mean annual sediment load was higher at XLX (517.79 × 10⁴ t) than at WJD (476.97 × 10⁴ t), and showed greater interannual variability (XLX: Cv = 0.87; WJD: Cv = 0.80).
Change-point analysis detected a statistically significant change point only in the sediment load time series at WJD, occurring in 1991. To enable a comparative assessment, the study period was divided into two phases: P1 (1982–1990) and P2 (1991–2016). Compared to P1, both streamflow and sediment load at WJD and XLX decreased substantially in P2, with the reduction in sediment load being nearly twice that of streamflow. This disproportionate decline suggests a partial decoupling between streamflow and sediment transport. Such differential responses are likely attributable to a combination of reduced upstream sediment supply, human activities (e.g., sand mining), and natural channel adjustments within the intervening river reach.
Seasonally, the flood season dominated the hydrological regime, accounting for approximately 64% of the annual streamflow and 80% of the sediment load at both stations (Figure 3; Table 2). In contrast, the non-flood season contributed a relatively small proportion and exhibited weaker interannual variability. This pronounced seasonal concentration was also reflected in the trend and change-point patterns. At WJD, both streamflow and sediment load exhibited declining trends during the flood season, with rates of −2.49 × 10⁸ m3/year and −13.51 × 10⁴ t/year, respectively. The change-point year (1991) and reduction magnitudes were consistent with those observed at the annual scale. Similarly, the flood season played a decisive role in the sediment decline at XLX, which decreased at a rate of 10.00 × 10⁴ t/year, corresponding to a 43.01% reduction in the post-change period. Meanwhile, streamflow declined moderately (CQ = −20.49%) and no significant change point was detected.
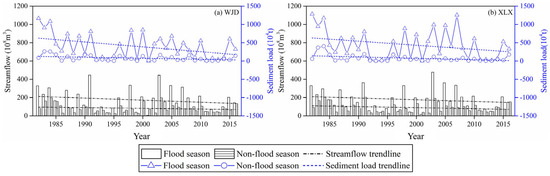
Figure 3.
Variation in streamflow and sediment load at different hydrological stations across different seasons from 1982 to 2016. (a): The WJD hydrological station; (b) The XLX hydrological station.
Table 2.
Statistics and the trend analysis result of the streamflow and sediment load at the WJD and XLX hydrological stations in the flood season during 1982–2016.
3.2. Changes in the Streamflow-Sediment Relationship
To quantify shifts in sediment yield dynamics, DMC analysis and linear regression were applied at both stations on annual and flood-season scales (Figure 4 and Figure 5). The results indicated highly linear and stable streamflow-sediment relationships during P1 across both stations and temporal scales, suggesting minimal human intervention and relatively constant sediment supply conditions. However, a pronounced divergence in DMC slopes emerged during P2. Both stations exhibited decreasing slopes, with WJD showing more substantial declines (annual: 33.19%; flood season: 32.65%) compared to XLX (annual: 18.47%; flood season: 16.07%). This differential decline in sediment yield per unit streamflow was accompanied by contrasting patterns in the goodness-of-fit (R2) of the regression models (Figure 5), which together suggest divergent underlying drivers.
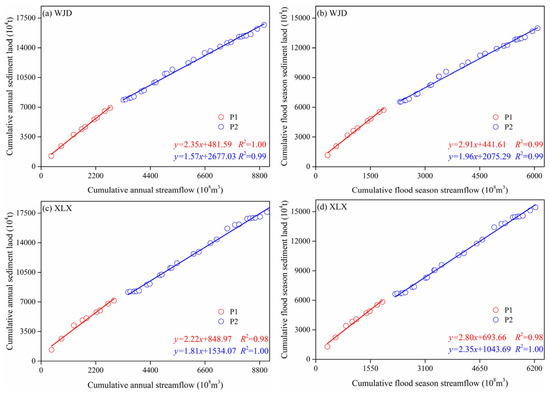
Figure 4.
Double mass curves of annual and flood season streamflow-sediment load relationships at different hydrological stations. (a) Annual at the WJD hydrological station; (b) Flood season at the WJD hydrological station; (c) Annual at the XLX hydrological station; (d) Flood season at the XLX hydrological station. The solid lines represent the linear regression trends for the periods before and after the change-point year of 1991.
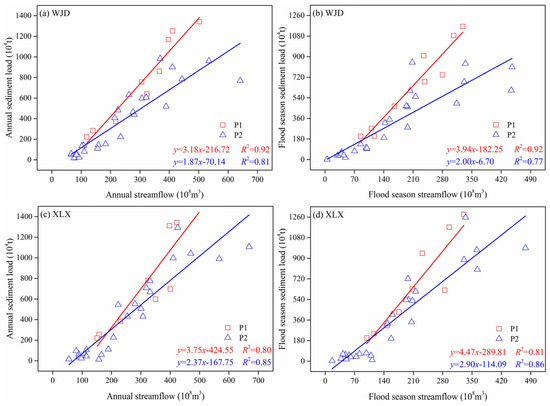
Figure 5.
Changes in the streamflow-sediment load relationship for annual and flood seasons at different hydrological stations. (a) Annual at the WJD hydrological station; (b) Flood season at the WJD hydrological station; (c) Annual at the XLX hydrological station; (d) Flood season at the XLX hydrological station. The solid lines represent the linear regression trends for the periods before and after the change point year of 1991.
Although strong streamflow-sediment correlations persisted at both stations (R2 = 0.77–0.92), the evolution of these correlations differed markedly. At WJD, the reduction in the DMC slope likely reflects sediment retention behind upstream dams or the effectiveness of soil conservation measures. This interpretation is supported by a discernible decline in R2 values (annual: from 0.92 to 0.81; flood season: from 0.92 to 0.77), signifying that non-streamflow factors (e.g., anthropogenic interventions) became increasingly pivotal in regulating sediment yield post-1991. However, a more moderate slope decrease was accompanied by stable or slightly improved R2 values at XLX (annual: from 0.80 to 0.85; flood season: from 0.81 to 0.86). This suggests that streamflow remained the dominant predictor of sediment transport. The sustained coherence implies that despite reduced sediment production efficiency per unit flow, a stable sediment supply (e.g., from channel erosion) maintains a continuous transport mechanism.
3.3. The Influence of Environmental Factors on the Streamflow-Sediment Regime
Figure 6 and Table 3 present the spatiotemporal variations in key environmental factors at different hydrological stations in the mid-Huai River during 1982–2016. For PRE, a non-significant increasing trend (p > 0.1) was observed at both stations from P1 to P2, with increasing rates of 0.43 mm/year at WJD and 1.27 mm/year at XLX. Compared to WJD (mean: 859.03 mm; Cv: 0.13), XLX demonstrated a higher mean annual PRE and greater interannual variability (mean: 901.32 mm; Cv: 0.14). In contrast to the stable PRE pattern, the study reach underwent significant climatic changes, characterized by a highly significant increase in TEMP (0.03 °C/year, p < 0.01) that raised the mean TEMP by 0.6 °C from P1 to P2. This warming was accompanied by a significant rise in ET, which increased more steeply at XLX (6.09 mm/year) than at WJD (4.56 mm/year). Additionally, NDVI showed highly significant increasing trends at both stations (p < 0.05), rising uniformly from 0.16 in P1 to 0.19 in P2, with annual increasing rates of 0.002 at WJD and 0.003 at XLX.
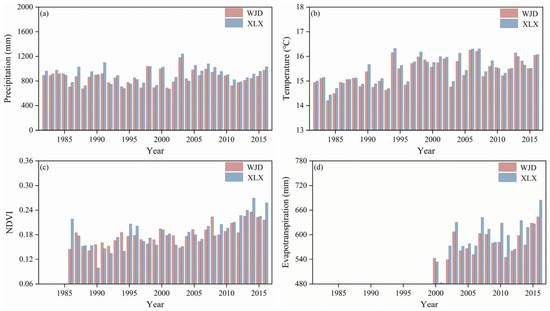
Figure 6.
Temporal variations in PRE, TEMP, NDVI and ET at WJD and XLX hydrological stations during 1982–2016. (a) PRE; (b) TEMP; (c) NDVI; (d) ET.
Table 3.
Statistics and the trend analysis result of the PRE, TEMP, NDVI and ET at different hydrological stations in the mid-Huai River during 1982–2016.
Given that PRE serves as the primary driver of both streamflow generation and sediment transport, the DMC and correlation analyses were applied to examine temporal changes in PRE-streamflow and PRE-sediment relationships (Figure 7 and Figure 8). For Pre-streamflow relationship, the DMC slopes decreased from P1 to P2 at both stations (WJD: from 0.34 to 0.29; XLX: from 0.35 to 0.28), indicating a reduction in streamflow yield due to factors beyond PRE. This decline in water yield efficiency was further supported by correlation analysis, which showed a decrease in R2 from P1 to P2, along with markedly lower annual streamflow under comparable PRE conditions. Compared to the PRE–streamflow relationship, the PRE–sediment relationship exhibited more pronounced changes. The DMC slopes declined substantially at both stations (WJD: from 0.80 to 0.45; XLX: from 0.76 to 0.51), reflecting a marked drop in sediment yield per unit precipitation. Although the R2 values increased from P1 to P2, annual sediment load decreased significantly under similar PRE conditions, highlighting the dominant role of non-climatic factors in sediment reduction.
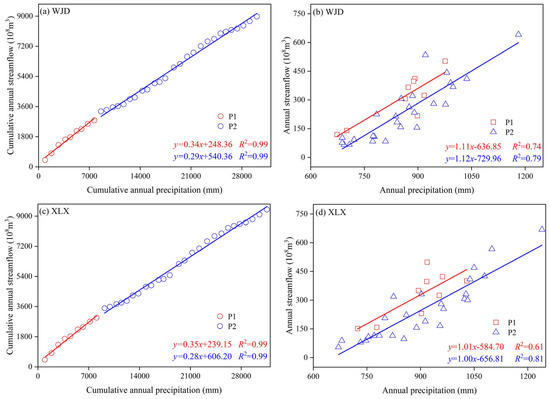
Figure 7.
Double mass curves and correlation analyses between precipitation and streamflow for the WJD and XLX hydrological stations during 1982–2016. (a) Double mass curves for WJD hydrological stations; (b) Correlation analyses for WJD hydrological stations; (c) Double mass curves for XLX hydrological stations; (d) Correlation analyses for XLX hydrological stations.
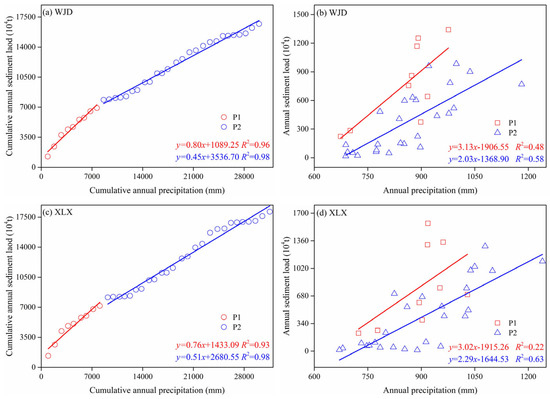
Figure 8.
Double mass curves and correlation analyses between precipitation and sediment load for the WJD and XLX hydrological stations during 1982–2016. (a) Double mass curves for WJD hydrological stations; (b) Correlation analyses for WJD hydrological stations; (c) Double mass curves for XLX hydrological stations; (d) Correlation analyses for XLX hydrological stations.
To investigate the response of sediment transport to atypical PRE, the cumulative departure of PRE and sediment load from 1982 to 2016 was analyzed (Figure 9). Overall, the cumulative departure of PRE exhibited a consistent pattern at both stations, characterized by an initial decrease followed by a sustained increase, indicating a shift toward wetter conditions in the latter part of the study period. In contrast, the cumulative departure of sediment load displayed a far more complex and multi-phasic pattern, cycling through periods of increase and decrease. Notably, a persistent decline in sediment load was observed in recent years against the backdrop of increasing PRE. This complex pattern can be further investigated by examining the contribution of specific extreme events. Statistical analysis of the four basin-wide flood years (1991, 1998, 2003, and 2007) demonstrated that a small number of extreme events accounted for a vastly disproportionate share of the total sediment load. Over the entire study period, these years accounted for only 14% of the total precipitation at both stations while contributing 19% and 24% of the total sediment load at WJD and XLX, respectively. Furthermore, this disparity was amplified in P2, with sediment contributions surging to 32% at WJD and 40% at XLX, significantly exceeding the corresponding PRE contributions of 18% and 19%.
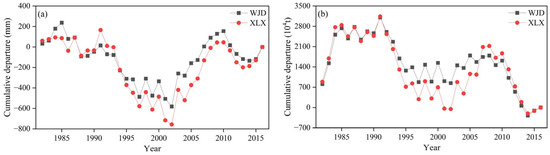
Figure 9.
Cumulative departure of annual PRE and sediment load at WJD and XLX hydrological stations during 1982–2016. (a) PRE; (b) Sediment load.
3.4. Channel Morphological Response to Environmental Changes
Figure 10 shows the temporal evolution of the longitudinal profile of the WJD-XLX reach in the Huai River from 1982 to 2016. Overall, the channel bed elevation exhibited a highly irregular, serrated pattern with significant interannual fluctuations, indicating continuing dynamic adjustments. In 1983, bed elevations ranged from −12.55 m to 8.65 m, with a mean of 3.15 m. By 1992 and 2001, the channel bed had experienced notable erosion, with mean scour depths of 0.65 m and 0.61 m, respectively. The mean bed elevation decreased to 2.49 m in 1992 and 1.89 m in 2001. Between 2001 and 2013, the most pronounced changes occurred, with the mean elevation sharply declining to 0.11 m, accompanied by a maximum scour depth of −15.95 m. These results, together with the large interannual fluctuations, indicate substantial channel instability during this period. Such dramatic changes are consistent with previous studies [41,42], which attributed the adjustments to both a sharp reduction in upstream sediment supply and intensive sand mining. Notably, the estimated sand extraction volume in the WJD–XLX section was about 5.3 times greater than the natural sediment transport [41,43,44], indicating that human activities, especially sand mining, played a dominant role in channel evolution, exceeding the influence of natural fluvial processes.
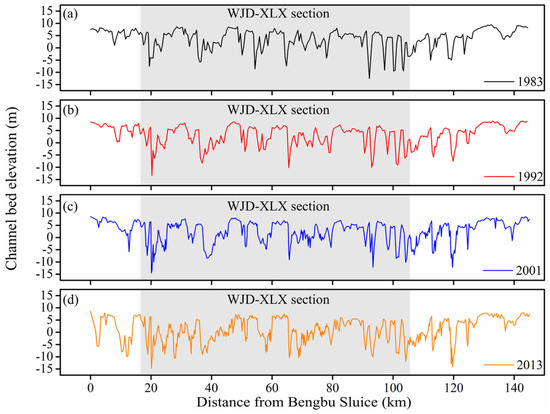
Figure 10.
Temporal evolution of the longitudinal profile at the WJD-XLX reach. (a) 1983; (b) 1992; (c) 2001; (d) 2013. (The grew shadow represents the channel bed changes of the study reach).
Figure 11 illustrates the annual and flood-season variations in channel sedimentation at the WJD–XLX reach. On the annual scale, channel sedimentation showed significant fluctuations. The mean erosion rate was 29.12 × 10⁴ t/year in P1 and increased to 32.51 × 10⁴ t/year in P2, indicating that erosion was the dominant process and intensified over the study period. At the flood-season scale, variations were more pronounced. The mean erosion rate was 12.32 × 10⁴ t/year in P1 and rose markedly to 38.69 × 10⁴ t/year in P2, suggesting a stronger influence of flood-season hydrological and sediment conditions on channel evolution. Furthermore, changes in cumulative sediment deposition supported these patterns; both annual and flood-season cumulative curves showed a declining trend, confirming long-term channel erosion. In summary, the WJD–XLX reach was predominantly characterized by erosion at both time scales, with the flood season exerting a more pronounced effect.
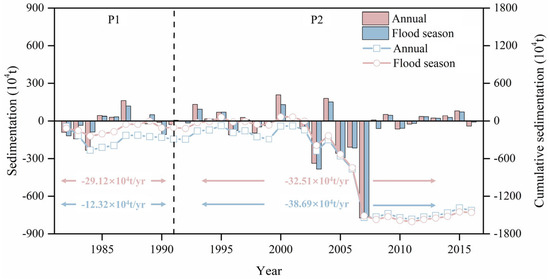
Figure 11.
Annual and flood-season variations in channel sedimentation at the WJD-XLX reach of the Huai River during 1982–2016. (Negative values indicate erosion; mean erosion rates for the annual and flood-season scales are shown in red and blue, respectively).
Temporal evolution of cross-sectional morphology at WJD and XLX from 1983 to 2015 (Figure 12) reveals fundamentally different evolutionary patterns at two stations, reflecting their distinct controlling mechanisms. For WJD, the cross-section in 1983 exhibited an asymmetric U-shape profile, with a steep left bank and gentle right slope featuring a floodplain. The thalweg elevation was 5.82 m, located 520 m from the left bank. After the implementation of a left-bank levee setback project in 1985, the cross-section remained relatively stable until 1995, during which the thalweg elevation gradually decreased to 4.50 m without significant lateral migration. Subsequently, the cross-section experienced substantial adjustments, with the thalweg elevation dropping to −2.02 m in 2001 and −1.69 m in 2007, accompanied by more pronounced right bank erosion. A further pronounced erosion was observed in 2015, with the thalweg elevation dropping markedly to –11.22 m and shifting approximately 100 m toward the left bank, resulting in a clear morphological transformation from an asymmetric U-shape to a more symmetric V-shaped profile. In contrast, the XLX reach is situated on an adverse slope, which significantly reduces flow energy, thereby reducing erosive capacity and limiting substantial morphological adjustment. As a result, the cross-section at XLX maintained a consistent U-shaped profile, with thalweg elevations ranging between 4.57 m and 5.44 m. Morphological adjustments at XLX mainly involved right-bank alterations, with relative stability dominating from 1983 to 1995, followed by localized narrowing (<15 m) and minor deposition on the right bank around 2001. Subsequently, right bank lateral erosion led to channel widening of approximately 25 m during 2007–2008.
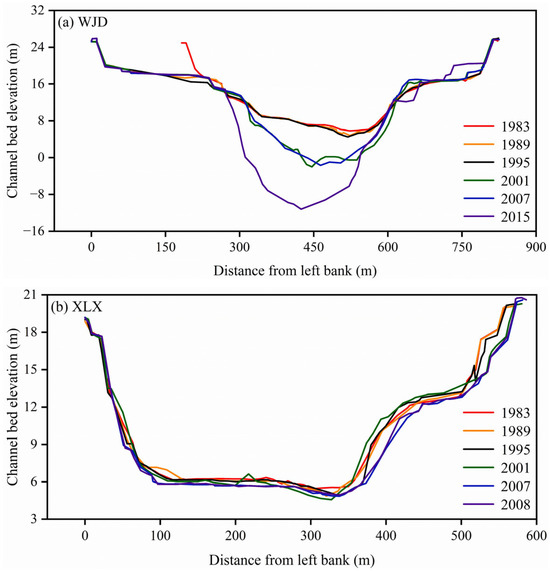
Figure 12.
Temporal evolution of cross-sectional profiles at WJD and XLX over the study period. (a): The WJD hydrological station; (b) The XLX hydrological station. (The different colors of the lines represent the channel bed changes over different years).
Figure 13 shows a comparison of cross-sectional profiles at WJD before and after flood seasons from 2009 to 2014. During 2009–2022 (Figure 13a–c), the pre- and post-flood profiles showed strong agreement with only minor local variations, suggesting that flood events had limited geomorphic impact during these years. In contrast, distinct differences emerged in 2012 and 2013 (Figure 13d,e). Specifically, the 2012 flood season resulted in clearly observable erosion in the mid-channel region, where post-flood elevation was lower than pre-flood levels. By 2013, erosion had not only intensified in the central area but also extended toward the right bank. These changes reflect stronger fluvial forces during the flood seasons, enhancing erosion both within the thalweg and along the banks. In addition, a particularly notable shift occurred in 2014, when the pre-flood elevation was significantly lower than the post-flood elevation. This initial incision, primarily driven by intensive sand mining between 2013 and 2014, led to a deepened and widened cross-section. The resulting increase in flow area coincided with exceptionally low discharge in 2014, reducing sediment transport capacity and promoting net deposition during the flood season.
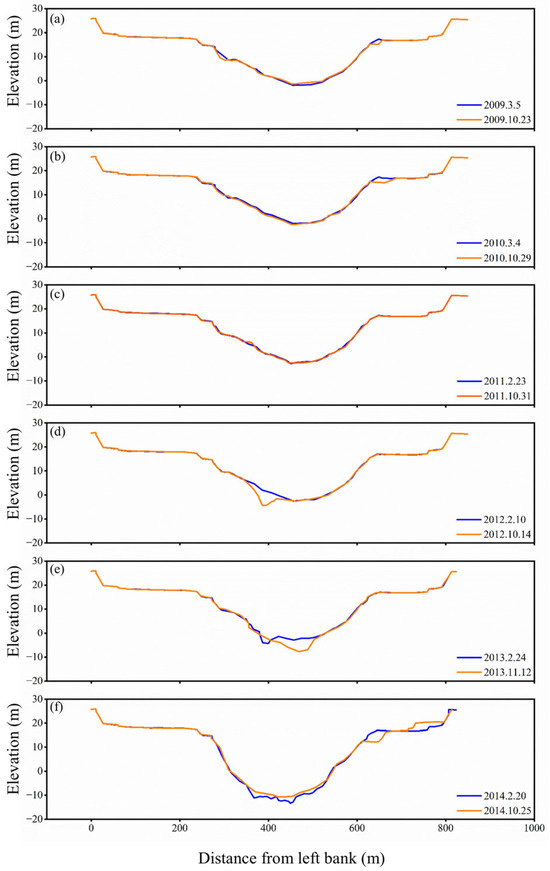
Figure 13.
Comparison of cross-sectional profiles at the WIJD during the pre-flood and post-flood seasons from 2009 to 2014. (a) 2009; (b) 2010; (c) 2011; (d) 2012; (e) 2013; (f) 2014.
4. Discussion
4.1. Causes of Sediment Load Reduction in the Mid-Huai River
For the mid-Huai River examined here, climate factors were not the primary cause of sediment load reduction during the study period. Although both TEMP and ET showed significant increasing trends (p < 0.05; Table 3), PRE—the main driver of erosion and sediment yield—showed no statistically significant changes (p > 0.1; Table 3). This suggests that climate variability alone cannot explain the sharp decline in sediment load (Figure 2). Furthermore, the PRE–sediment load relationship revealed a decreased slope in the DMC during the P2 period, accompanied by markedly reduced sediment load under comparable PRE conditions, which collectively indicate that non-climatic factors played a major role in the significant sediment load reduction observed (Figure 8). This conclusion is consistent with previous studies, which identified human activities as the primary factor responsible for sediment load reduction in the Huai River [16,45].
Unlike the Yangtze River [46,47] and the Mississippi River [48,49], where sediment reduction is predominantly driven by dam construction, the decline in sediment load in the mid-Huai River is not caused by reservoir operations. Although most major reservoirs were completed before 1975 [15], and continue to retain sediment, their contribution to the marked sediment load decline between 1982 and 2016 was minimal. Instead, the sharp reduction is mainly associated with intensive watershed management and in-channel engineering interventions. First, large-scale ecological restoration efforts implemented since the 1990s—including the “Grain for Green” project and enforcement of the Soil and Water Conservation Law—have significantly improved vegetation coverage. Remote sensing data reveal a highly significant increasing trend in NDVI (p < 0.01; Table 3) in the mid-Huai River. Enhanced vegetation cover has effectively increased soil erosion resistance, reducing sediment production at the source. These findings are consistent with other regions of China, where vegetation recovery has significantly suppressed sediment yield [50,51,52]. Second, channel regulation and sand mining activities have directly altered bed morphology and sediment transport capacity. Following the major flood in the Huai River in 1991, systematic channel dredging, embankment reinforcement, and river regime control projects were carried out. Combined with in-channel sand mining activities removed large quantities of bed sediment, reducing the sediment transport capacity of the channel. Such engineering-induced sediment reduction is consistent with observations from other rivers [53,54]. Moreover, as a major agricultural zone, changes in land use practices, such as terracing, conservation tillage, and irrigation management, may have further contributed to the decline in sediment load [45]. A synthesis of the driving factors is provided in Table 4, which evaluates the relative influence on the sediment load reduction in the study site.
Table 4.
Driving factors for sediment load reduction in the WJD-XLX reach.
Overall, the marked decline in sediment load in the mid-Huai River cannot be primarily attributed to climatic variability or dam construction. Instead, it reflects the cumulative impacts of large-scale ecological restoration across the watershed and intensive channel engineering at the local scale.
4.2. Channel Adjustments in Response to Sediment Load Reduction
Numerous studies have established that when sediment input falls substantially below the transport capacity of the prevailing flow conditions, the channel compensates by eroding its bed and banks to source sediment, initiating a cycle of degradation [55,56,57]. The significant erosion and cross-sectional transformation observed in the mid-Huai River represent a direct geomorphic response to altered streamflow-sediment relationships, particularly a sharp decrease in sediment load and human activities (Figure 10, Figure 11 and Figure 12). The findings of this study indicate that the state of sediment starvation is primarily attributable to direct and large-scale human activities rather than solely to remote factors such as upstream dam retention.
The China River Sediment Bulletin (2006–2007) provide direct evidence supporting this conclusion, over 19.5 × 10⁶ m3 of sediment were removed from the WJD–XLX reach to improve flood conveyance capacity between 2005 and 2008—a volume that far exceeded the natural sediment load during the same period. Additionally, extensive illegal sand mining activities likely operated in collaborative operation with official engineering projects, further exacerbating sediment deficit and destabilizing the channel. Consequently, human-induced sediment extraction has become the dominant force influencing channel morphology, surpassing natural watershed processes [43,44].
Furthermore, the divergent adjustment patterns between the WJD and XLX cross-sections underscore the important role of local boundary conditions in mediating system response. The WJD evolved into a symmetrical V-shape with pronounced thalweg erosion, typical of channels affected by clear-water erosion and intensive human activity. In contrast, the adverse slope at XLX effectively dissipated flow energy and suppressed vertical erosion, thereby maintaining relatively stable cross-sectional morphology. This phenomenon has also been observed in other river systems [58,59]. These findings indicate that, despite pervasive sediment reduction and substantial human interference across the system, local channel conditions can lead to distinctly different morphodynamical outcomes.
In addition, although the WJD-XLX reach has undergone significant channel erosion, this morphological adjustment has paradoxically not led to an increase in sediment delivery to the downstream reach. This phenomenon is clearly evidenced by the consistently declining sediment load trends at the XLX station (Figure 2b). The main reason is that a substantial portion of the sediment sourced from local deposition and channel erosion within the reach has been systematically removed from the fluvial system through extensive, large-scale sand mining activities. Consequently, the extracted sediment does not contribute to the downstream sediment flux and is restrained from subsequent bed-forming processes (Figure 10).
In summary, channel adjustments in the mid-Huai River are a direct response to human-induced reduction in sediment supply. This morphological evolution is influenced not only by system-wide sediment depletion but also by segment-specific channel conditions, and the combined effect of these factors results in spatial heterogeneity in cross-sectional changes.
4.3. Implications and Limitations
The findings from this study have important implications for managing and restoring rivers that are heavily altered by human activities, especially in regions experiencing rapid land-use changes and intensive in-channel modifications. In the mid-Huai River, sediment decline and channel adjustments are driven primarily by human actions, not climatic or upstream dam influences. Addressing these changes effectively requires management strategies that operate at the basin scale. To minimize unintended morphological impacts, ecological restoration measures (e.g., afforestation, soil conservation) and in-channel engineering (e.g., dredging, mining, regulation) should be planned in a coordinated and basin-wise manner.
Local differences in how the channel responds highlight the need for management strategies that reflect site-specific conditions. For example, areas with steeper slopes or more resistant banks tend to be more stable and may need different approaches than sections prone to erosion. To guide effective planning, it is essential to track both natural and human-driven changes in sediment transport, particularly in rivers affected by widespread sand mining and dredging.
While this study provides clear evidence on the factors shaping sediment decline and channel changes, a few limitations should be acknowledged. First, the full extent of historical illegal sand mining is hard to determine due to missing records, which may lead to underestimating its role. Second, although reservoir sedimentation influences were deemed limited, a lack of detailed data on sediment trapping behind key dams limits a more complete understanding of upstream influences. In addition, this study relied on remote sensing and published hydrological data, which may not capture high-resolution, process-based mechanisms such as bank erosion dynamics or sediment sorting during transport. Future studies could benefit from combining field-based observations with hydrodynamic and morpho dynamic models to better capture the interactions between flow, sediment transport, and channel form.
5. Conclusions
- (1)
- Over the study period (1982–2016), the WJD–XLX reach experienced a significant decoupling of its streamflow-sediment regime, with a dramatically sharper decline in sediment load than in streamflow, fundamentally altering their natural synergy.
- (2)
- The sediment reduction in the study reach was predominantly driven by human activities, notably ecological restoration, channel engineering, and sand mining, while the contribution from climatic factors was comparatively minor.
- (3)
- As sediment supply declined, the WJD–XLX reach experienced overall channel erosion, but the adjustment patterns diverged due to local conditions. At WJD, clear-water erosion combined with sand mining transformed the cross-section into a V-shape, whereas at XLX, the reverse slope reduced flow energy, helping to preserve a more stable U-shaped profile.
This study shows that to manage heavily human-impacted rivers such as the Huai River, a systematic approach must be adopted, integrating basin-scale ecological measures with channel engineering interventions while accounting for differences in geomorphic stability along specific reaches.
Author Contributions
Conceptualization, K.C. and J.N.; methodology, K.C.; validation, K.C., P.W. and J.N.; resources, H.Z. and H.L.; data curation, K.C.; writing—original draft preparation, K.C.; writing—review and editing, K.C. and P.W.; funding acquisition, J.N. All authors have read and agreed to the published version of the manuscript.
Funding
This research was funded by the Anhui Provincial Natural Science Foundation Joint Fund for Water Science (2208085US04), the Anhui & Huai River Institute of Hydraulic Research Science and Technology Project (KY202302).
Data Availability Statement
The original contributions presented in this study are included in this article. Further inquiries can be directed to the corresponding author.
Conflicts of Interest
The authors declare no conflicts of interest.
References
- Ma, C.; Qiu, D.; Mu, X.; Gao, P. Morphological Evolution Characteristics of River Cross-Sections in the Lower Weihe River and Their Response to Streamflow and Sediment Changes. Water 2022, 14, 3419. [Google Scholar] [CrossRef]
- Liu, W.; Wang, S.; Sang, Y.-F.; Ran, L.; Ma, Y. Effects of large upstream reservoir operations on cross-sectional changes in the channel of the lower Yellow River reach. Geomorphology 2021, 387, 107768. [Google Scholar] [CrossRef]
- Li, L.; Lu, X.; Chen, Z. River channel change during the last 50 years in the middle Yangtze River, the Jianli reach. Geomorphology 2007, 85, 185–196. [Google Scholar] [CrossRef]
- Khaleghi, S.; Surian, N. Channel Adjustments in Iranian Rivers: A Review. Water 2019, 11, 672. [Google Scholar] [CrossRef]
- Dai, Z.; Liu, J.T. Impacts of large dams on downstream fluvial sedimentation: An example of the Three Gorges Dam (TGD) on the Changjiang (Yangtze River). J. Hydrol. 2013, 480, 10–18. [Google Scholar] [CrossRef]
- de Musso, N.M.; Capolongo, D.; Caldara, M.; Surian, N.; Pennetta, L. Channel Changes and Controlling Factors over the Past 150 Years in the Basento River (Southern Italy). Water 2020, 12, 307. [Google Scholar] [CrossRef]
- Kiss, T.; Fiala, K.; Sipos, G. Alterations of channel parameters in response to river regulation works since 1840 on the Lower Tisza River (Hungary). Geomorphology 2008, 98, 96–110. [Google Scholar] [CrossRef]
- He, Y.C.; Li, Z.W.; Xia, J.Q.; Deng, S.S.; Zhou, Y.J. Channel Morphological Characteristics and Morphodynamic Processes of Large Braided Rivers in Response to Climate-Driven Water and Sediment Flux Change in the Qinghai-Tibet Plateau. Water Resour. Res. 2024, 60, e2023WR036126. [Google Scholar] [CrossRef]
- Bi, N.; Sun, Z.; Wang, H.; Wu, X.; Fan, Y.; Xu, C.; Yang, Z. Response of channel scouring and deposition to the regulation of large reservoirs: A case study of the lower reaches of the Yellow River (Huanghe). J. Hydrol. 2019, 568, 972–984. [Google Scholar] [CrossRef]
- Xia, H.; Zhao, J.; Qin, Y.; Yang, J.; Cui, Y.; Song, H.; Ma, L.; Jin, N.; Meng, Q. Changes in Water Surface Area during 1989–2017 in the Huai River Basin using Landsat Data and Google Earth Engine. Remote Sens. 2019, 11, 1824. [Google Scholar] [CrossRef]
- He, Y.; Ye, J.; Yang, X. Analysis of the spatio-temporal patterns of dry and wet conditions in the Huai River Basin using the standardized precipitation index. Atmos. Res. 2015, 166, 120–128. [Google Scholar] [CrossRef]
- Sun, P.; Wen, Q.; Zhang, Q.; Singh, V.P.; Sun, Y.; Li, J. Nonstationarity-based evaluation of flood frequency and flood risk in the Huai River basin, China. J. Hydrol. 2018, 567, 393–404. [Google Scholar] [CrossRef]
- Gao, C.; Zhang, Z.; Zhai, J.; Qing, L.; Mengting, Y. Research on meteorological thresholds of drought and flood disaster: A case study in the Huai River Basin, China. Stoch. Environ. Res. Risk Assess. 2014, 29, 157–167. [Google Scholar] [CrossRef]
- Wang, L.; Han, X.; Zhang, Y.; Zhang, Q.; Wan, X.; Liang, T.; Song, H.; Bolan, N.; Shaheen, S.M.; White, J.R.; et al. Impacts of land uses on spatio-temporal variations of seasonal water quality in a regulated river basin, Huai River, China. Sci. Total. Environ. 2023, 857, 159584. [Google Scholar] [CrossRef]
- Shi, H.L.; Hu, C.H.; Wang, Y.G.; Tian, Q.Q. Variation trend and cause of runoff and sediment load variations in Huaihe River. J. Hydraul. Eng. 2012, 43, 571–579. (In Chinese) [Google Scholar] [CrossRef]
- Yin, S.; Gao, G.; Huang, A.; Li, D.; Ran, L.; Nawaz, M.; Xu, Y.J.; Fu, B. Streamflow and sediment load changes from China’s large rivers: Quantitative contributions of climate and human activity factors. Sci. Total Environ. 2023, 876, 162758. (In Chinese) [Google Scholar] [CrossRef]
- Yang, C.; Lin, Z.; Yu, Z.; Hao, Z.; Liu, S. Analysis and Simulation of Human Activity Impact on Streamflow in the Huaihe River Basin with a Large-Scale Hydrologic Model. J. Hydrometeorol. 2010, 11, 810–821. [Google Scholar] [CrossRef]
- Yu, B.-y.; Wu, P.; Sui, J.-y.; Yang, X.-j.; Ni, J. Fluvial geomorphology of the Middle Reach of the Huai River. Int. J. Sediment Res. 2014, 29, 24–33. [Google Scholar] [CrossRef]
- Ni, J.; Yu, B.; Wu, P. A Numerical Study of the Flow and Sediment Interaction in the Middle Reach of the Huai River. Water 2021, 13, 2041. [Google Scholar] [CrossRef]
- Yu, B.Y.; Wu, P.; Sui, J.; Ni, J.; Whitcombe, T. Variation of Runoff and Sediment Transport in the Huai River—A Case Study. J. Environ. Inform. 2020, 35, 138–147. [Google Scholar] [CrossRef]
- Gao, C.; Ruan, T. The influence of climate change and human activities on runoff in the middle reaches of the Huaihe River Basin, China. J. Geogr. Sci. 2017, 28, 79–92. [Google Scholar] [CrossRef]
- Zhou, Y.; Zhang, Y.; Liang, T.; Wang, L. Shifting of phytoplankton assemblages in a regulated Chinese river basin after streamflow and water quality changes. Sci. Total. Environ. 2019, 654, 948–959. [Google Scholar] [CrossRef]
- Zhang, Y.; Xia, J.; Shao, Q.; Zhai, X. Water quantity and quality simulation by improved SWAT in highly regulated Huai River Basin of China. Stoch. Environ. Res. Risk Assess. 2011, 27, 11–27. [Google Scholar] [CrossRef]
- Yu, B.Y.; Yu, Y.S.; Ni, J. Analysis on erosion and deposition in Wujiadu–Xiaoliuxiang reach of the main stem Huaihe River. J. Sediment Res. 2009, 4, 12–16. (In Chinese) [Google Scholar] [CrossRef]
- Funk, C.; Peterson, P.; Landsfeld, M.; Pedreros, D.; Verdin, J.; Shukla, S.; Husak, G.; Rowland, J.; Harrison, L.; Hoell, A.; et al. The climate hazards infrared precipitation with stations—A new environmental record for monitoring extremes. Sci. Data 2015, 2, 150066. [Google Scholar] [CrossRef]
- Hersbach, H.; Bell, B.; Berrisford, P.; Hirahara, S.; Horányi, A.; Muñoz-Sabater, J.; Nicolas, J.; Peubey, C.; Radu, R.; Schepers, D.; et al. The ERA5 global reanalysis. Q. J. R. Meteorol. Soc. 2020, 146, 1999–2049. [Google Scholar] [CrossRef]
- Running, S.; Mu, Q.; Zhao, M.; Moreno, A. MODIS/Terra Net Evapotranspiration Gap-Filled 8-Day L4 Global 500m SIN Grid V061; NASA: Washington, DC, USA, 2021. [CrossRef]
- Townshend, J.R.G.; Justice, C.O. Analysis of the dynamics of African vegetation using the normalized difference vegetation index. Int. J. Remote Sens. 2007, 7, 1435–1445. [Google Scholar] [CrossRef]
- Ma, F.; Ye, A.; Gong, W.; Mao, Y.; Miao, C.; Di, Z. An estimate of human and natural contributions to flood changes of the Huai River. Glob. Planet. Change 2014, 119, 39–50. [Google Scholar] [CrossRef]
- Wei, Y.; Jiao, J.; Zhao, G.; Zhao, H.; He, Z.; Mu, X. Spatial–temporal variation and periodic change in streamflow and suspended sediment discharge along the mainstream of the Yellow River during 1950–2013. Catena 2016, 140, 105–115. [Google Scholar] [CrossRef]
- Mann, H.B. Nonparametric tests against trend. Econometrica 1945, 13, 245–259. [Google Scholar] [CrossRef]
- Kendall, M.G. Rank Correlation Measures, 4th ed.; Charles Griffin: London, UK, 1975. [Google Scholar]
- Sen, P.K. Estimates of the Regression Coefficient Based on Kendall’s Tau. J. Am. Stat. Assoc. 1968, 63, 1379–1389. [Google Scholar] [CrossRef]
- Pettitt, A.N. A Non-Parametric Approach to the Change-Point Problem. Appl. Stat. 1979, 28, 126–135. [Google Scholar] [CrossRef]
- Gao, G.; Ma, Y.; Fu, B. Multi-temporal scale changes of streamflow and sediment load in a loess hilly watershed of China. Hydrol. Process. 2015, 30, 365–382. [Google Scholar] [CrossRef]
- Zhang, S.; Lu, X.X. Hydrological responses to precipitation variation and diverse human activities in a mountainous tributary of the lower Xijiang, China. Catena 2009, 77, 130–142. [Google Scholar] [CrossRef]
- Sun, J.; Wang, G.; Sun, S.; Chen, S.; Sun, X.; Wang, Y.; Sun, H.; Song, C.; Lin, S.; Hu, Z. Asynchronous changes and driving mechanisms of water-sediment transport in the Jinsha River Basin: Response to climate change and human activities. Catena 2025, 259, 109325. [Google Scholar] [CrossRef]
- Hu, J.; Zhou, X.; Yi, Y.; Li, C.; Wang, X.; Liu, Q.; Mao, J. Hydrological changes in the Upper Yellow River under the impact of upstream cascade reservoirs over the past 70 years. J. Hydrol. 2025, 57, 102105. [Google Scholar] [CrossRef]
- Wu, Y.; Fang, H.; Huang, L.; Ouyang, W. Changing runoff due to temperature and precipitation variations in the dammed Jinsha River. J. Hydrol. 2020, 582, 124500. [Google Scholar] [CrossRef]
- Zhou, Y.; Li, D.; Lu, J.; Yao, S.; Yan, X.; Jin, Z.; Liu, L.; Lu, X.X. Distinguishing the multiple controls on the decreased sediment flux in the Jialing River basin of the Yangtze River, Southwestern China. Catena 2020, 193, 104593. [Google Scholar] [CrossRef]
- Yang, X.J.; Yu, B.Y. Analysis on recent channel evolution of middle reach of Huaihe River. Water Resour. Hydropower Eng. 2011, 42, 49–53. (In Chinese) [Google Scholar] [CrossRef]
- Yu, B.Y.; Lv, L.M.; Yang, X.J.; Ni, J. Research progress of flood outlet and river regulation in the middle reach of the Huaihe River. J. Sediment Res. 2021, 46, 74–80. (In Chinese) [Google Scholar] [CrossRef]
- Yang, X.J.; Hei, P.F. Effect of Artificial Sand Excavation on Fluvial Process of Huaihe River Bengbu to Fushan Reach. J. Basic Sci. Eng. 2011, 19, 78–84. (In Chinese) [Google Scholar]
- Ben, P.; Lu, M.N.; Lu, H.T.; Peng, L. Impact of sand mining on river regime stability and flood control safety in Bengbu section of Huaihe River. Yangtze River 2023, 54, 16–20, 27. (In Chinese) [Google Scholar] [CrossRef]
- Wei, C.; Dong, X.; Ma, Y.; Zhang, K.; Xie, Z.; Xia, Z.; Su, B. Attributing climate variability, land use change, and other human activities to the variations of the runoff-sediment processes in the Upper Huaihe River Basin, China. J. Hydrol. 2024, 56, 101955. [Google Scholar] [CrossRef]
- Yang, S.L.; Zhao, Q.Y.; Belkin, I.M. Temporal variation in the sediment load of the Yangtze river and the influences of human activities. J. Hydrol. 2002, 263, 56–71. [Google Scholar] [CrossRef]
- Yang, H.F.; Yang, S.L.; Xu, K.H.; Milliman, J.D.; Wang, H.; Yang, Z.; Chen, Z.; Zhang, C.Y. Human impacts on sediment in the Yangtze River: A review and new perspectives. Glob. Planet. Change 2018, 162, 8–17. [Google Scholar] [CrossRef]
- Li, T.; Wang, S.; Liu, Y.; Fu, B.; Zhao, W. A retrospective analysis on changes in sediment flux in the Mississippi River system: Trends, driving forces, and implications. J. Soils Sediments 2019, 20, 1719–1729. [Google Scholar] [CrossRef]
- Meade, R.H.; Moody, J.A. Causes for the decline of suspended-sediment discharge in the Mississippi River system, 1940–2007. Hydrol. Process. 2009, 24, 35–49. [Google Scholar] [CrossRef]
- Deng, L.; Shangguan, Z.-p.; Li, R. Effects of the grain-for-green program on soil erosion in China. Int. J. Sediment Res. 2012, 27, 120–127. [Google Scholar] [CrossRef]
- Zeng, Y.; Meng, X.; Wang, B.; Li, M.; Chen, D.; Ran, L.; Fang, N.; Ni, L.; Shi, Z. Effects of soil and water conservation measures on sediment delivery processes in a hilly and gully watershed. J. Hydrol. 2023, 616, 128804. [Google Scholar] [CrossRef]
- Gao, P.; Deng, J.; Chai, X.; Mu, X.; Zhao, G.; Shao, H.; Sun, W. Dynamic sediment discharge in the Hekou-Longmen region of Yellow River and soil and water conservation implications. Sci. Total Environ. 2017, 578, 56–66. [Google Scholar] [CrossRef]
- Rinaldi, M.; Wyżga, B.; Surian, N. Sediment mining in alluvial channels: Physical effects and management perspectives. River Res. Appl. 2005, 21, 805–828. [Google Scholar] [CrossRef]
- Bhattacharya, R.; Dolui, G.; Das Chatterjee, N. Effect of instream sand mining on hydraulic variables of bedload transport and channel planform: An alluvial stream in South Bengal basin, India. Environ. Earth Sci. 2019, 78, 303. [Google Scholar] [CrossRef]
- Battisacco, E.; Franca, M.J.; Schleiss, A.J. Sediment replenishment: Influence of the geometrical configuration on the morphological evolution of channel-bed. Water Resour. Res. 2016, 52, 8879–8894. [Google Scholar] [CrossRef]
- Brandt, S.A. Classification of geomorphological effects downstream of dams. Catena 2000, 40, 375–401. [Google Scholar] [CrossRef]
- Piégay, H.; Darby, S.E.; Mosselman, E.; Surian, N. A review of techniques available for delimiting the erodible river corridor: A sustainable approach to managing bank erosion. River Res. Appl. 2005, 21, 773–789. [Google Scholar] [CrossRef]
- Zolezzi, G.; Luchi, R.; Tubino, M. Modeling morphodynamic processes in meandering rivers with spatial width variations. Rev. Geophys. 2012, 50, 4005. [Google Scholar] [CrossRef]
- Cheng, N.N.; He, H.M.; Yang, S.Y.; Lu, Y.J.; Jing, Z.W. Impacts of topography on sediment discharge in Loess Plateau, China. Quat. Int. 2017, 440, 119–129. [Google Scholar] [CrossRef]


Disclaimer/Publisher’s Note: The statements, opinions and data contained in all publications are solely those of the individual author(s) and contributor(s) and not of MDPI and/or the editor(s). MDPI and/or the editor(s) disclaim responsibility for any injury to people or property resulting from any ideas, methods, instructions or products referred to in the content. |
© 2025 by the authors. Licensee MDPI, Basel, Switzerland. This article is an open access article distributed under the terms and conditions of the Creative Commons Attribution (CC BY) license (https://creativecommons.org/licenses/by/4.0/).