Article

Hydropower–FPV Hybridization for Sustainable Energy Generation in Romania

by
Octavia-Iuliana Bratu
,
Eliza-Isabela Tică
*,
Angela Neagoe
and
Bogdan Popa
Department of Hydraulics, Hydraulic Machinery and Environmental Engineering, Faculty of Energy Engineering, National University of Science and Technology Politehnica Bucharest, 313 Splaiul Independentei, Sector 6, 060042 Bucharest, Romania
*
Author to whom correspondence should be addressed.
Water 2025, 17(21), 3144; https://doi.org/10.3390/w17213144 (registering DOI)
Submission received: 10 October 2025 / Revised: 30 October 2025 / Accepted: 31 October 2025 / Published: 1 November 2025
(This article belongs to the Special Issue Sustainable Water Resources Management in a Changing Environment)

Abstract

This paper investigates the integration of hydropower and solar energy within the Lower Olt River cascade as a pathway toward sustainable energy generation in Romania. The study focuses on the conceptual design of future hybrid power plants consisting of existing hydropower facilities where floating photovoltaic panels are proposed to be installed on the reservoir’s surfaces. An estimation of electricity production from both sources was performed, followed by the formulation of a trading strategy for the July–September 2025 period. The paper also explores the interaction between tactical and strategic management in hydropower operation and planning, describing how forecasting and decision-making processes are structured within the institutional framework. Finally, results for the selected hydropower plants demonstrate the positive influence of floating photovoltaic deployment on company performance, the national energy mix, and the overall sustainability of energy generation in Romania.

1. Introduction

The transition toward sustainable energy systems is a central challenge of our time, driven by the imperative to reduce greenhouse gas emissions, mitigate climate change, and secure energy supply in a world of growing energy demand. Traditional reliance on fossil fuels is no longer viable, and renewable energy sources (e.g., solar, wind, hydro) are assuming a crucial role in new power system architectures. However, the inherent variability of solar and wind generation raises challenges with grid integration, stability, and use.
The Sustainable Development Goals (SDGs), especially SDG 7 (“Affordable and Clean Energy”), are closely tied to energy production as they aim to expand access to electricity, increase the proportion of renewable energy sources worldwide, and enhance energy efficiency. Shifting toward sustainable energy supports the achievement of other SDGs as well—it advances climate action (SDG 13) by cutting greenhouse gas emissions, encourages sustainable consumption and production (SDG 12) by reducing reliance on fossil fuels, and fosters economic growth (SDG 8) through job creation and innovation in clean energy technologies [1,2].
Hydropower, on the other hand, has long been employed as a flexible and reliable renewable energy source. However, in some cases, hydropower development and operation can generate climate- and global change–induced challenges—such as ecosystem disruption, and in a cascading manner, may also contribute to social unrest and broader societal problems. But in many regions—including Romania—hydropower alone struggles to fully address daytime peaks or periods of limited water availability. Hence, hybridization between different renewable technologies emerges as a promising pathway to exploit complementarity, increase system flexibility, and improve the overall efficiency of energy systems with significant generation from renewables.
In recent years, the concept of combining hydropower with floating photovoltaic (FPV) installations has gained attention. The hybrid FPV–hydropower paradigm aims to leverage the co-location of solar arrays on reservoir surfaces, using existing infrastructure, reducing land competition, and enhancing overall energy output.
As shown by Quaranta [3], the integration of FPV systems with existing hydropower reservoirs can significantly enhance renewable generation while reducing infrastructure costs, improving grid stability, and supporting the transition toward low-carbon energy systems.
Similar analyses demonstrate that installing FPV systems on existing hydropower reservoirs can significantly increase renewable electricity generation, reduce evaporation losses, and contribute to carbon-neutrality objectives [4].
Several studies confirm the global potential of such hybrid systems. According to Lee et al. [5], a geospatial analysis estimated the technical potential of hybrid FPV–hydropower systems at 3.0–7.6 TW (≈4251–10,616 TWh yr−1), while in [6] a global evaluation of hydro–PV–wind hybridization revealed that system fluctuations can be reduced by up to 99%, confirming the crucial role of hybridization in renewable integration, flexibility, security of supply and grid stability.
Case studies reinforce this potential. In [7], Piancó et al. explored hybridization in Brazil, and in [8], analysis of the Furnas hydropower plant (−20.6697, −46.3182) showed that FPV integration can boost total energy output by 50% using only 1.4–3.8% of the reservoir area. Similar benefits were found in Sub-Saharan Africa [9] and Switzerland [10], where FPV integration improved annual production by 20% and increased downstream environmental flows by 50%. Moreover, the world’s largest hydropower–FPV hybrid at Longyangxia, China, demonstrated that complementary operation enhances solar integration and revenue with minimal impact on reservoir management [11].
Beyond electricity generation, FPV integration provides water-related and ecological benefits. According to Perez et al. [12], covering only 1.2% of U.S. reservoirs with FPV installations could generate as much electricity as existing hydropower, while reducing evaporation losses and enhancing renewable energy dispatchability. Other studies report that FPV can reduce water evaporation by up to 70% and increase efficiency by ~11% compared to ground-mounted systems [13], with additional gains in carbon emission reduction and water conservation [14,15,16,17].
From a methodological perspective, research has focused on techno-economic optimization, modeling of solar generation and curtailment, and hybrid dispatch strategies. NREL [18] quantified benefits such as reduced PV curtailment, better transmission use, and improved water management. Studies in Sardinia [19,20], and Taiwan [21] show how AI-based or storage-integrated hybrid systems enhance reliability, reduce mechanical wear, and improve the water–food–energy nexus by up to 15%.
Recent works also emphasize the structural and environmental challenges of FPV deployment. Offshore and marine installations face unique issues, including hydrodynamic stresses, corrosion, and mooring design optimization [22,23,24]. Engineering studies demonstrate that mooring stiffness and floater dimensions can reduce frame stress by 30%, improving long-term durability. Meanwhile, modular floating structures, such as Singapore’s 100 kWp pilot at Tengeh Reservoir, have validated the technical feasibility of HDPE-based designs under real conditions [25].
Economic and policy frameworks are equally crucial for FPV expansion. Şahin et al. [26] provided a comprehensive review highlighting the role of harmonized international regulations, financial incentives, and integration with Sustainable Development Goals (SDGs). Countries such as India, China, Brazil, and Singapore have incorporated FPV into national renewable strategies, while Europe focuses on environmental standards and water management compatibility. Complementary to these aspects, life cycle and regional optimization studies [27] reveal that FPV carbon payback times can be reduced by 35%, underlining the urgency of near-term deployment.
At the same time, new directions are emerging. Studies on FPV–pumped-storage integration [28,29] propose coordinated operation to maximize generation and minimize imbalances, saving millions of cubic meters of water annually. Other hybrid solutions include PV-driven hydropower [30], battery–flywheel hybridization for mechanical stress reduction [20], and FPV use in rural electrification [31].
Finally, global reviews synthesize the progress and research gaps in this fast-growing field. Studies such as [32,33], and [34] emphasize design innovation, cooling enhancement, AI-based monitoring, and hybrid energy storage, while noting remaining challenges in environmental impact, standardization, and policy harmonization. Together, these insights confirm that FPV–hydropower hybridization represents one of the most promising pathways toward efficient, flexible, and sustainable renewable energy systems.
However, gaps remain: many studies are geographically concentrated (Asia, Brazil), relatively few focus on Eastern Europe or Romania specifically, and fewer still address local climatic, hydrological, and grid constraints. Recent studies have highlighted Romania’s high solar potential and demonstrated the feasibility of FPV deployment on inland reservoirs, both in coastal and urban contexts [35,36].
The main objective of this study is to perform an energy forecasting exercise for a hybrid power plant combining two renewable sources and was achieved by conceptually transforming conventional hydropower facilities into hybrid systems by adding FPV plants. This decision was supported by both technical and economic analyses, while maintaining the operational integrity of the existing hydropower installation.
The case study for the assessment of the potential benefits of implementing FPV plants are seven reservoirs along the Lower Olt River in terms of energy generation and financial performance. The purpose is twofold: first, to demonstrate hybrid FPV-hydropower systems adapted to Romanian conditions (hydrology, solar resources, existing dams); and second, to quantify the potential gains—in terms of additional generation, curtailment reduction, flexibility, and economic viability—compared to hydropower alone or solar alone.
The significance lies in filling a regional gap: to our knowledge, no comprehensive study has yet modeled such hybrid systems in the Romanian context, considering both national grid, water constraints, and investment feasibility.

2. Materials and Methods

2.1. Background

On 19 March 2023, a Joint Venture Agreement (JVA) was signed between Abu Dhabi Future Energy Company PJSC—Masdar (“Masdar”) and Hidroelectrica S.A., defining the framework for a future Joint Venture Company (JVC).
The JVC’s scope of activity is the development, financing, construction, and operation of renewable energy projects in Romania, with a focus on equity investments in companies operating exclusively in the following technological categories [37]:
  • Floating photovoltaic (FPV);
  • Offshore wind (fixed and floating).
The JVA represents a contractual alliance through which the parties pool capital, human resources, technology, and operational expertise to initiate joint projects while maintaining separate legal identities. Such an arrangement reduces market exposure risks, facilitates resource access, strengthens market positioning, and increases eligibility for state subsidies and participation in competitive tenders.
As a case study, seven hydropower developments along the Olt River, as illustrated in Figure 1, were selected for the installation of floating photovoltaic systems: Zăvideni, Drăgășani, Arcești, Ipotești, Frunzaru, Rusănești, and Izbiceni. According to Hidroelectrica [37], the combined installed capacity of the planned FPV systems is estimated at around 1500 MW, representing the most ambitious hybrid hydropower–solar initiative currently proposed in Romania.
The goal of this paper is to assess the energy generation in existing HPPs of the Lower Olt River sector for 3 months, July, August and September 2025, and the energy generation in the future FPV systems installed on reservoirs surfaces for the same months of the year. Thus, the methodology can be used to forecast energy generation in hybrid hydropower-FPV plants. Then, to build a scenario for the valorization of the energy and the evaluation of financial gains.
For the estimation of future FPV energy generation, forecasting was also applied to the existing hydropower plants, as this approach enhances the scientific value of the study. Also, the data for the inflows on Olt River in the upstream section, Zăvideni, is downloaded from a free source for the period 1981–2010 (the only available data), it was compulsory to forecast inflows for the case-study period, July–September 2025. Open-access data sources were selected to promote transparency and cost-efficient research.
This case highlights both the strategic partnerships shaping Romania’s renewable energy sector and the role of hydropower reservoirs as platforms for innovative hybrid solutions. The integration of FPV on hydropower reservoirs offers multiple benefits: optimizing the use of existing infrastructure, reducing evaporation losses, and providing complementary generation profiles to hydropower, thus enhancing flexibility and energy security at the national level.

2.2. Hydropower Energy Generation Assessment

Forecasting hydropower energy production represents a fundamental component of both tactical and strategic management within a hydropower facility. The high variability of inflows, driven by precipitation, snowmelt, and seasonal hydrological dynamics, requires robust models capable of capturing short-term fluctuations and long-term trends. Reliable forecasts are essential not only for ensuring system security and balancing supply-demand but also for supporting trading strategies and integration into electricity markets.
At the tactical level, short-term forecasts (daily to weekly) are used to optimize turbine scheduling, manage reservoir storage levels, and ensure compliance with grid dispatch requirements. These forecasts are usually derived from:
  • Hydrological models (rainfall–runoff models such as HEC-HMS or HBV);
  • Statistical approaches (time-series analysis, ARIMA-type models);
  • Machine learning methods (LSTM, random forest, hybrid AI models).
At the strategic level, medium- to long-term forecasts (monthly to annual) offer predictive insights into water and energy resource availability, enabling decisions on maintenance scheduling, investment planning, and the integration of complementary renewable sources such as floating photovoltaic (PV) systems. These forecasts typically rely on:
  • Climate scenario projections (precipitation and temperature trends);
  • Reservoir operation models for cascade systems;
  • Multi-objective optimization frameworks that balance hydropower, irrigation, navigation, and ecological flows.
For the development of the forecasting framework, openly accessible datasets were employed to ensure reproducibility and transparency. River discharge data were obtained from the SMHI HYPEweb portal, https://hypeweb.smhi.se/explore-water/historical-data/europe-time-series/ (accessed on 21 March 2025) [38], developed by the Swedish Meteorological and Hydrological Institute (SMHI). The portal (website) provides simulated daily discharge time series generated by the HYPE (Hydrological Predictions for the Environment) model. The datasets represent modeled river flow, not direct hydrometric observations. The model describes hydrological processes conceptually through multiple storage compartments (soil, groundwater, reservoirs and rivers) and has been calibrated and validated using observed data across Europe and globally. HYPEweb allows users to visualize and extract hydrological information interactively. When a river point is selected, the corresponding upstream catchment is automatically delineated, and the associated time series of simulated flow can be downloaded. The sub-basin boundaries follow the predefined catchment structure of the E-HYPE model, which was originally derived from digital elevation data and physiographic characteristics by SMHI. This functionality ensures transparency and accessibility for large-scale hydrological analyses.
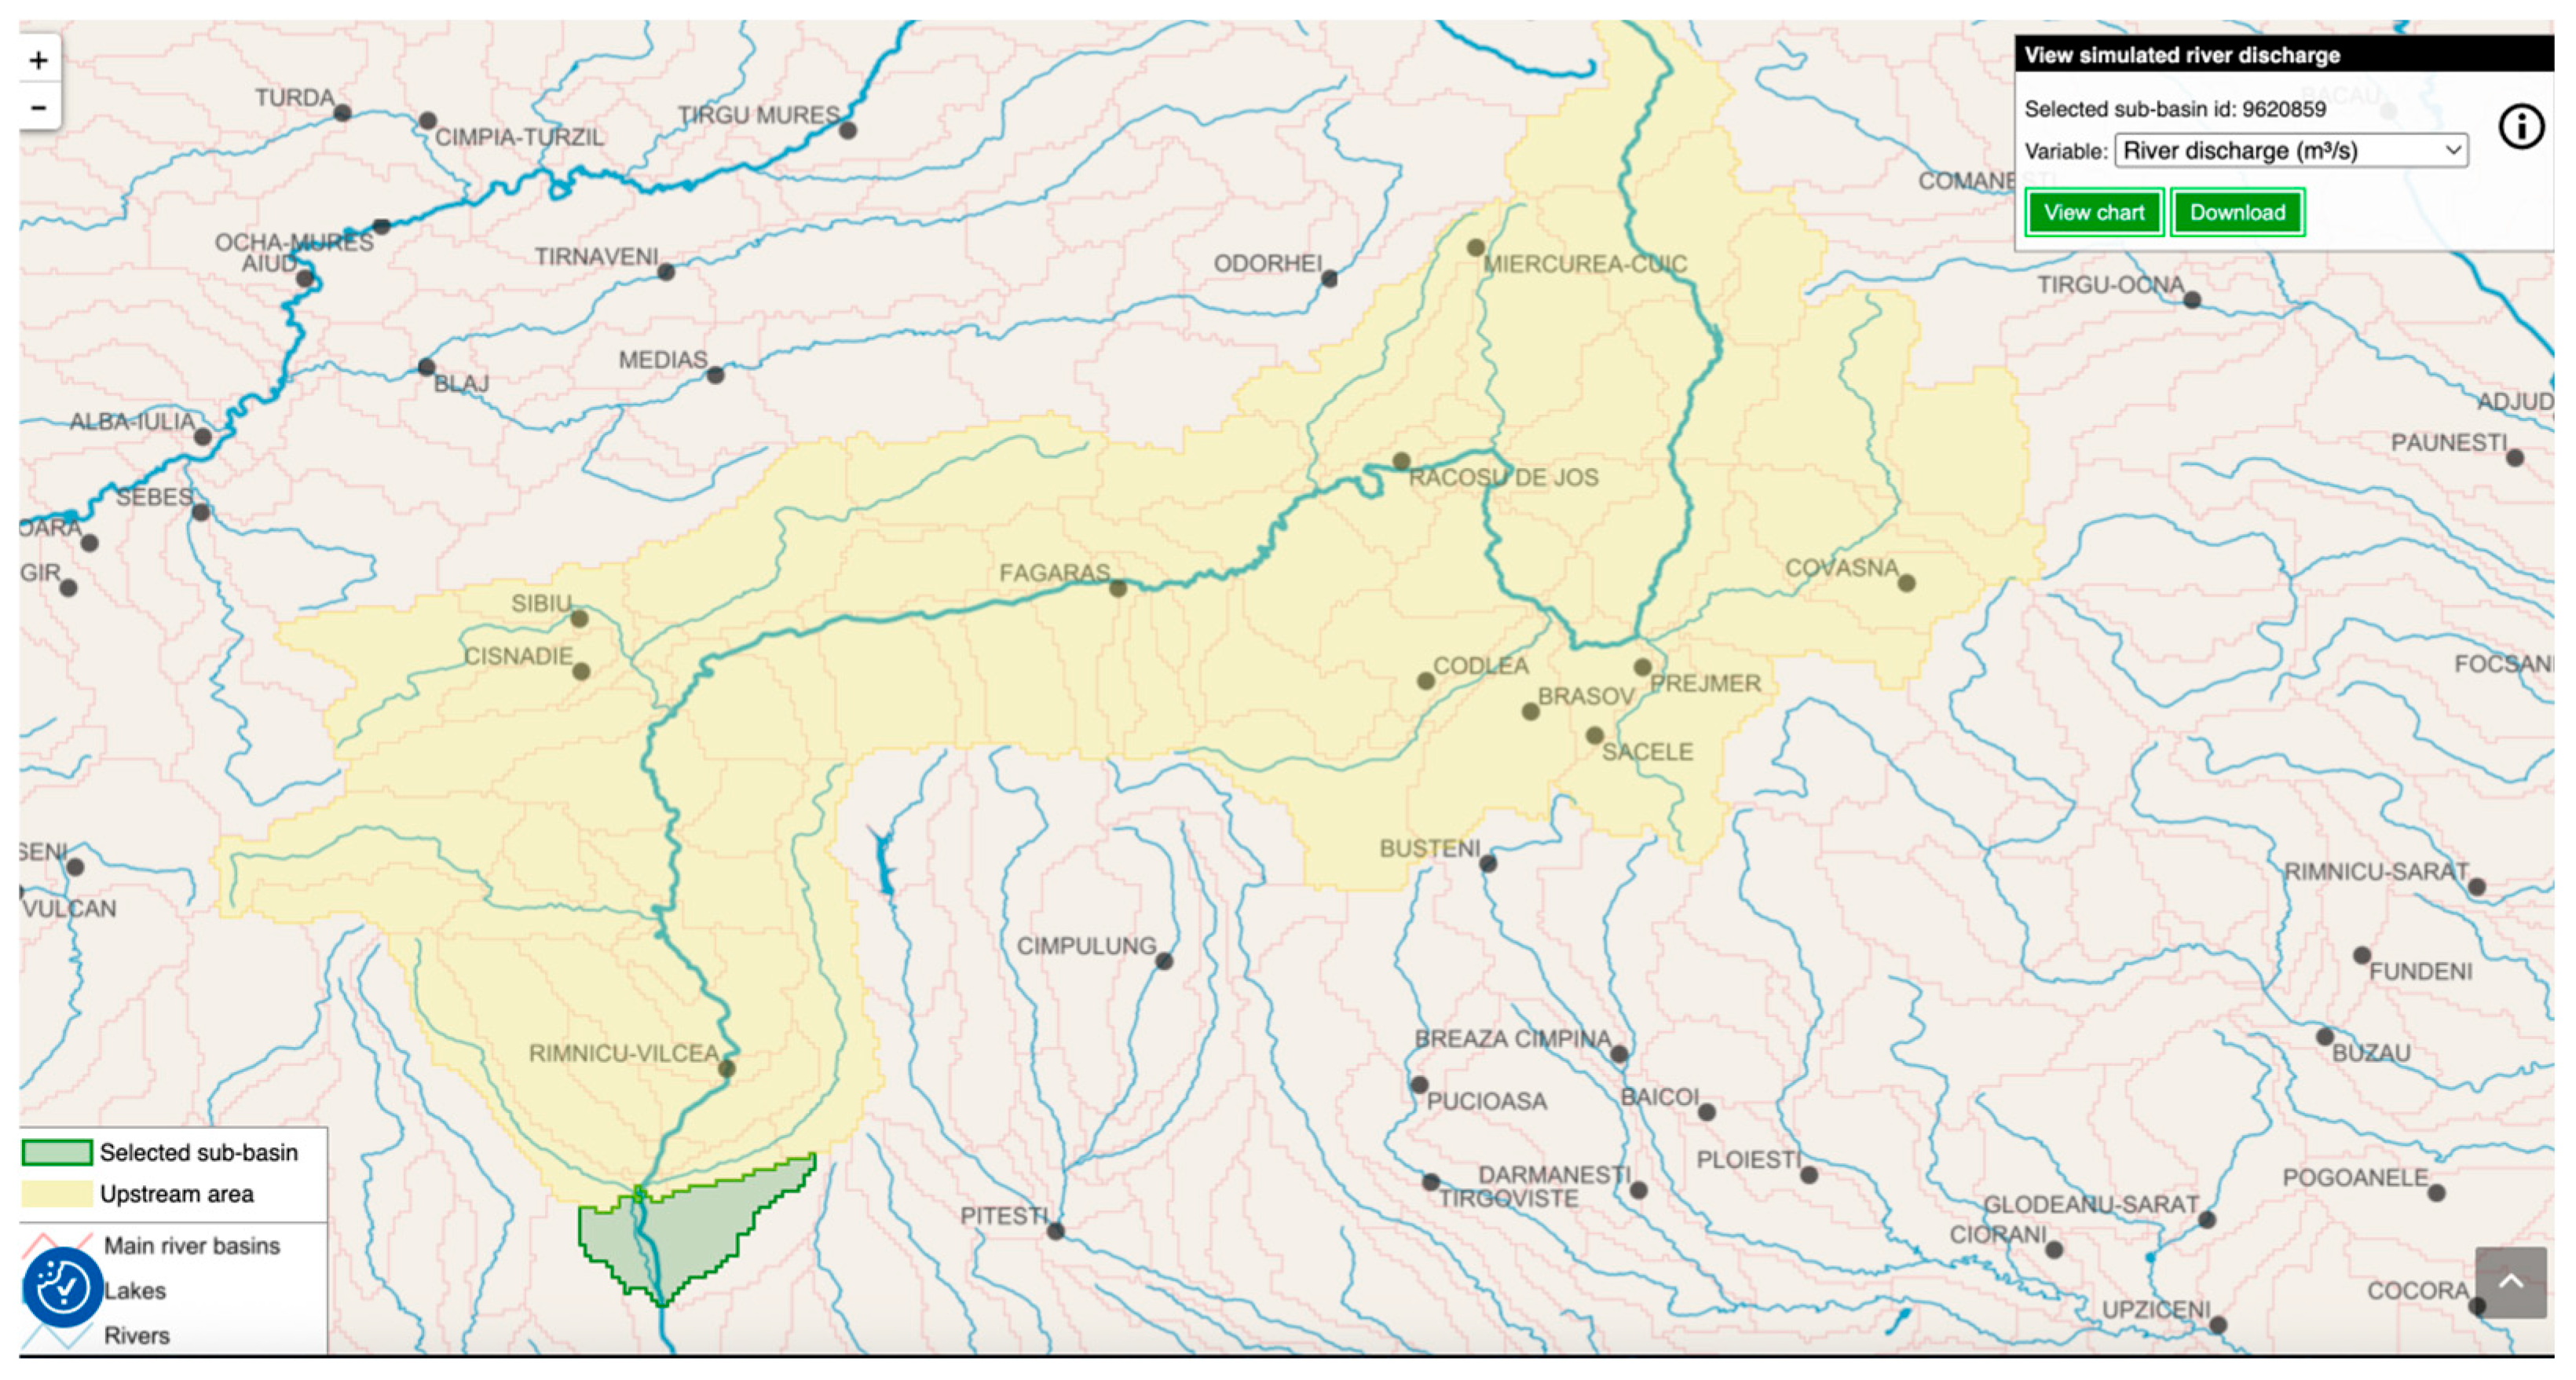
Meteorological variables (precipitation and temperature) were obtained from the Open-Meteo platform, https://open-meteo.com/en/docs/historical-weather-api (accessed on 3 October 2025) [39]. These datasets were selected due to their full public availability for the Olt River Basin in Romania. In parallel, discharge data were extracted from the HYPEweb model, and the selected sub-basin used for this extraction is shown in Figure 2.
The analysis focused on the Zăvideni reservoir, which represents the first storage reservoir in the middle and lower Olt River cascade. Using the downloaded data, the inflow to the Zăvideni reservoir was estimated based on the hydrological time series extracted for the study area. The delineation of the sub-basin presented in Figure 2 follows the predefined catchment structure of the E-HYPE model implemented within the HYPEweb portal. The process starts by selecting the Zăvideni Dam as the outlet point on the interactive map, upon which the platform automatically delineates the corresponding upstream contributing catchment. This structure, originally derived from high-resolution Digital Elevation Models (DEM) and physiographic datasets developed by SMHI, ensures consistency across the model’s fixed hydrological network.
For the forecasting experiment, the historical discharge and meteorological records covering the period 1981–2010 were used to train and validate the predictive model. This time span represents the maximum continuous period available from the HYPEweb database, providing a consistent and statistically representative baseline of hydrological variability for the Olt River Basin. The trained model was subsequently applied to generate inflow forecasts for the July–September 2025 period, which served as input for the hydropower production simulation at a 15 min temporal resolution.
The net head and total storage volume at Normal Reservoir Level (NRL) for each hydropower plant in the Olt River cascade were obtained from references [40,41,42,43], while the total storage capacities at NRL were published in [44]. Based on these data, the initial storage volume was set to 80% of the total capacity at NRL, and the Minimum Operational Level (MOL) was fixed at 25% of the total capacity.
The corresponding parameters for each hydropower facility, with H denoting the head and VNRL the total storage volume at the NRL, are as follows:
  • Zăvideni: H = 10 m, VNRL = 50 mil.m3;
  • Drăgăşani: H = 10 m, VNRL = 76 mil.m3;
  • Arcești: H = 10 m, VNRL = 54 mil.m3;
  • Frunzaru: H = 13.5 m, VNRL = 96 mil.m3;
  • Ipoteşti: H = 12.8 m, VNRL = 110 mil.m3;
  • Rusăneşti: H = 13.5 m, VNRL = 74 mil.m3;
  • Izbiceni: H = 13.5 m, VNRL = 74 mil.m3.
These values were used as boundary conditions in the simulation model to initialize reservoir storage and define operational limits for the forecasting experiment.
The inflow to Zăvideni was considered as the reference input to the cascade system. For the downstream reservoirs, the inflow was computed as the sum of the turbined discharge from the immediately upstream plant and a proportional adjustment factor accounting for local losses and lateral inflows. Consequently, each hydropower facility was characterized by three operational discharge components: turbined flow, withdrawn flow from storage, and spilled flow (if applicable).
Given that the forecast period corresponds to the summer season, additional operational constraints were introduced to maintain a minimum storage level in each reservoir, ensuring both ecological continuity and operational safety. Moreover, minimum turbine discharge thresholds were imposed to reflect safe operating limits under reduced inflows.
The inflow to the reservoir was modeled using a Multi-Layer Perceptron (MLP) neural network, which predicts daily inflow values based on precipitation, air temperature, and previous inflow observations (lagged flows). Recent studies have shown that machine learning models, including the Multi-Layer Perceptron (MLP) [45] and Bayesian Neural Network (BNN) [46], can significantly improve reservoir inflow forecasting accuracy compared to traditional hydrological approaches.
For the hydrological forecasting itself, a Nonlinear Autoregressive Network with Exogenous Inputs (NARX–MLP) model was implemented, enhanced by a Cuckoo Search optimization algorithm used for parameter calibration. The NARX architecture has been shown to efficiently capture nonlinear temporal dependencies in hydrological time series [47] and in other time-dependent environmental variables (e.g., solar radiation) [48], while metaheuristic algorithms such as Cuckoo Search (CS) provide superior convergence and global search capabilities for neural network parameter optimization compared to gradient-based training methods [49,50,51].
The model was trained using data from 1981 to 2009, while the year 2010 was reserved for independent validation to assess predictive performance.
A one-day-ahead forecasting strategy was adopted, with the model predicting next-day inflow from antecedent conditions; longer horizons, when needed, are obtained by recursively iterating the one-step model. Predictors included temperature, precipitation, an antecedent precipitation index (API), short-term rolling sums and means, and 1–12 flow lags. Data were median-imputed, standardized, and modeled using a ReLU/Adam MLPRegressor with early stopping (max 700 iterations).
To identify the optimal network configuration, the CS algorithm was employed for hyperparameter optimization, exploring parameters such as the number of hidden neurons, learning rate, regularization term, number of lag inputs, and the antecedent precipitation index (API) decay factor. The model was applied in a one-day-ahead forecasting mode and run recursively to predict inflows for July–September 2025, using exogenous temperature and precipitation inputs from Open-Meteo [39].
The objective function minimized during optimization was defined as:
J(θ) = 1 − NSE(Qobs, Qsim(θ)),
where NSE is the Nash–Sutcliffe Efficiency between observed and simulated inflows, and θ represents the vector of model hyperparameters optimized by the CS algorithm.
In this study, θ includes parameters controlling both the structure and learning process of the MLP model, namely:
θ = {Nlags, APIdecay, Hhidden, αL2, ηlearning},
where
  • Nlags: represents the number of lagged inflow values used as input features;
  • APIdecay: decay factor of the antecedent precipitation index;
  • Hhidden: number of neurons in the hidden layer;
  • αL2: L2 regularization coefficient;
  • ηlearning: initial learning rate of the neural network.
Thus, each candidate solution (or “nest”) in the CS algorithm corresponds to a specific parameter vector θ, whose performance is evaluated based on the objective function (Equation (1)).
This algorithm was chosen due to its effectiveness in handling mixed discrete–continuous and non-convex optimization problems, such as the tuning of MLP hyperparameters. The CS metaheuristic algorithm provides efficient global exploration through Lévy flights, allowing the search to escape local minima while requiring only a small number of control parameters [52].
In addition, CS can easily accommodate integer and continuous variables within bounded domains and performs robustly on noisy, nonlinear objective functions, where gradient-based or grid-search methods are inefficient.
In the present study, the CS algorithm was employed to optimize the parameters of the NARX–MLP predictive model, improving convergence stability and reducing the risk of local minima during the hydrological forecasting process [53].
The optimization of hyperparameters was carried out using the Cuckoo Search algorithm, configured with a population size of 22, 60 iterations, a discovery rate of 0.25, and a step size parameter (α) of 0.1, employing Lévy flights with an exponent of 1.5. To ensure reproducibility, a fixed random seed was used (NumPy = 42, MLPRegressor random_state = 42), and early stopping was activated during training.
The hybrid NARX–Cuckoo Search model was designed to improve generalization performance and convergence speed, particularly under nonlinear and nonstationary inflow conditions. This approach enables robust short-term discharge prediction and provides a solid basis for the tactical management of the Olt River cascade.
The performance of the forecasting model was assessed using several standard statistical indicators widely adopted in hydrological modeling:
  • Nash–Sutcliffe Efficiency (NSE)—to quantify the predictive accuracy relative to observed inflows:
N S E = 1 i = 1 n Q s i m , i Q o b s , i 2 i = 1 n Q o b s , i Q ¯ o b s 2 ;
  • Root Mean Square Error (RMSE)—to evaluate the magnitude of residuals between observed and simulated values:
R M S E = i = 1 n Q s i m , i Q ¯ o b s 2 n ;
  • Mean Absolute Percentage Error (MAPE)—to measure relative errors in percentage terms for interpretability:
M A P E = 100 n i = 1 n Q o b s , i Q s i m , i Q o b s , i .
In Equations (3)–(5), Q o b s , i , represents the observed discharge at time step i; Q s i m , i represents the simulated discharge at time step i; Q ¯ o b s is the average of observed values; Q ¯ s i m is the average of simulated values and n represents the total number of observations.
For operational forecasting, an NSE greater than 0.65–0.70 is generally considered satisfactory, ensuring that the model captures the main dynamics of inflow variability and reproduces observed generation trends with sufficient precision [54].
The evaluation procedure was applied over both the calibration and validation periods, with a particular focus on maintaining model robustness during high- and low-flow regimes. This validation step is essential for ensuring the reliability of the hybrid NARX–Cuckoo Search model when applied to real-time hydropower operation scenarios.
Figure 3 illustrates the comparison between observed and simulated inflows for the validation year 2010 at a one-day-ahead prediction horizon. The model accurately reproduces the temporal dynamics and peak discharges, showing a close agreement between Q s i m and Q o b s .
The performance metrics confirm the model’s robustness, with an NSE of 0.935, RMSE = 41.17 m3/s, and MAPE = 9.04%. The CS optimization achieved convergence after 27 iterations (out of 60), identifying an optimal configuration with:
Nlag = 5, APIdecay = 0.97 and 64 hidden neurons.
These results indicate an excellent predictive capability for short-term inflow forecasting [55,56]. According to commonly adopted performance thresholds [56,57], MAPE values below 10% indicate high reliability and robust forecasting capability.

2.3. FPV Energy Generation Assessment
The FPV installation consists of photovoltaic panels mounted on modular buoyant structures positioned on the surface of a water body. The arrangement is designed to maximize solar exposure while ensuring mechanical stability and accessibility for maintenance.
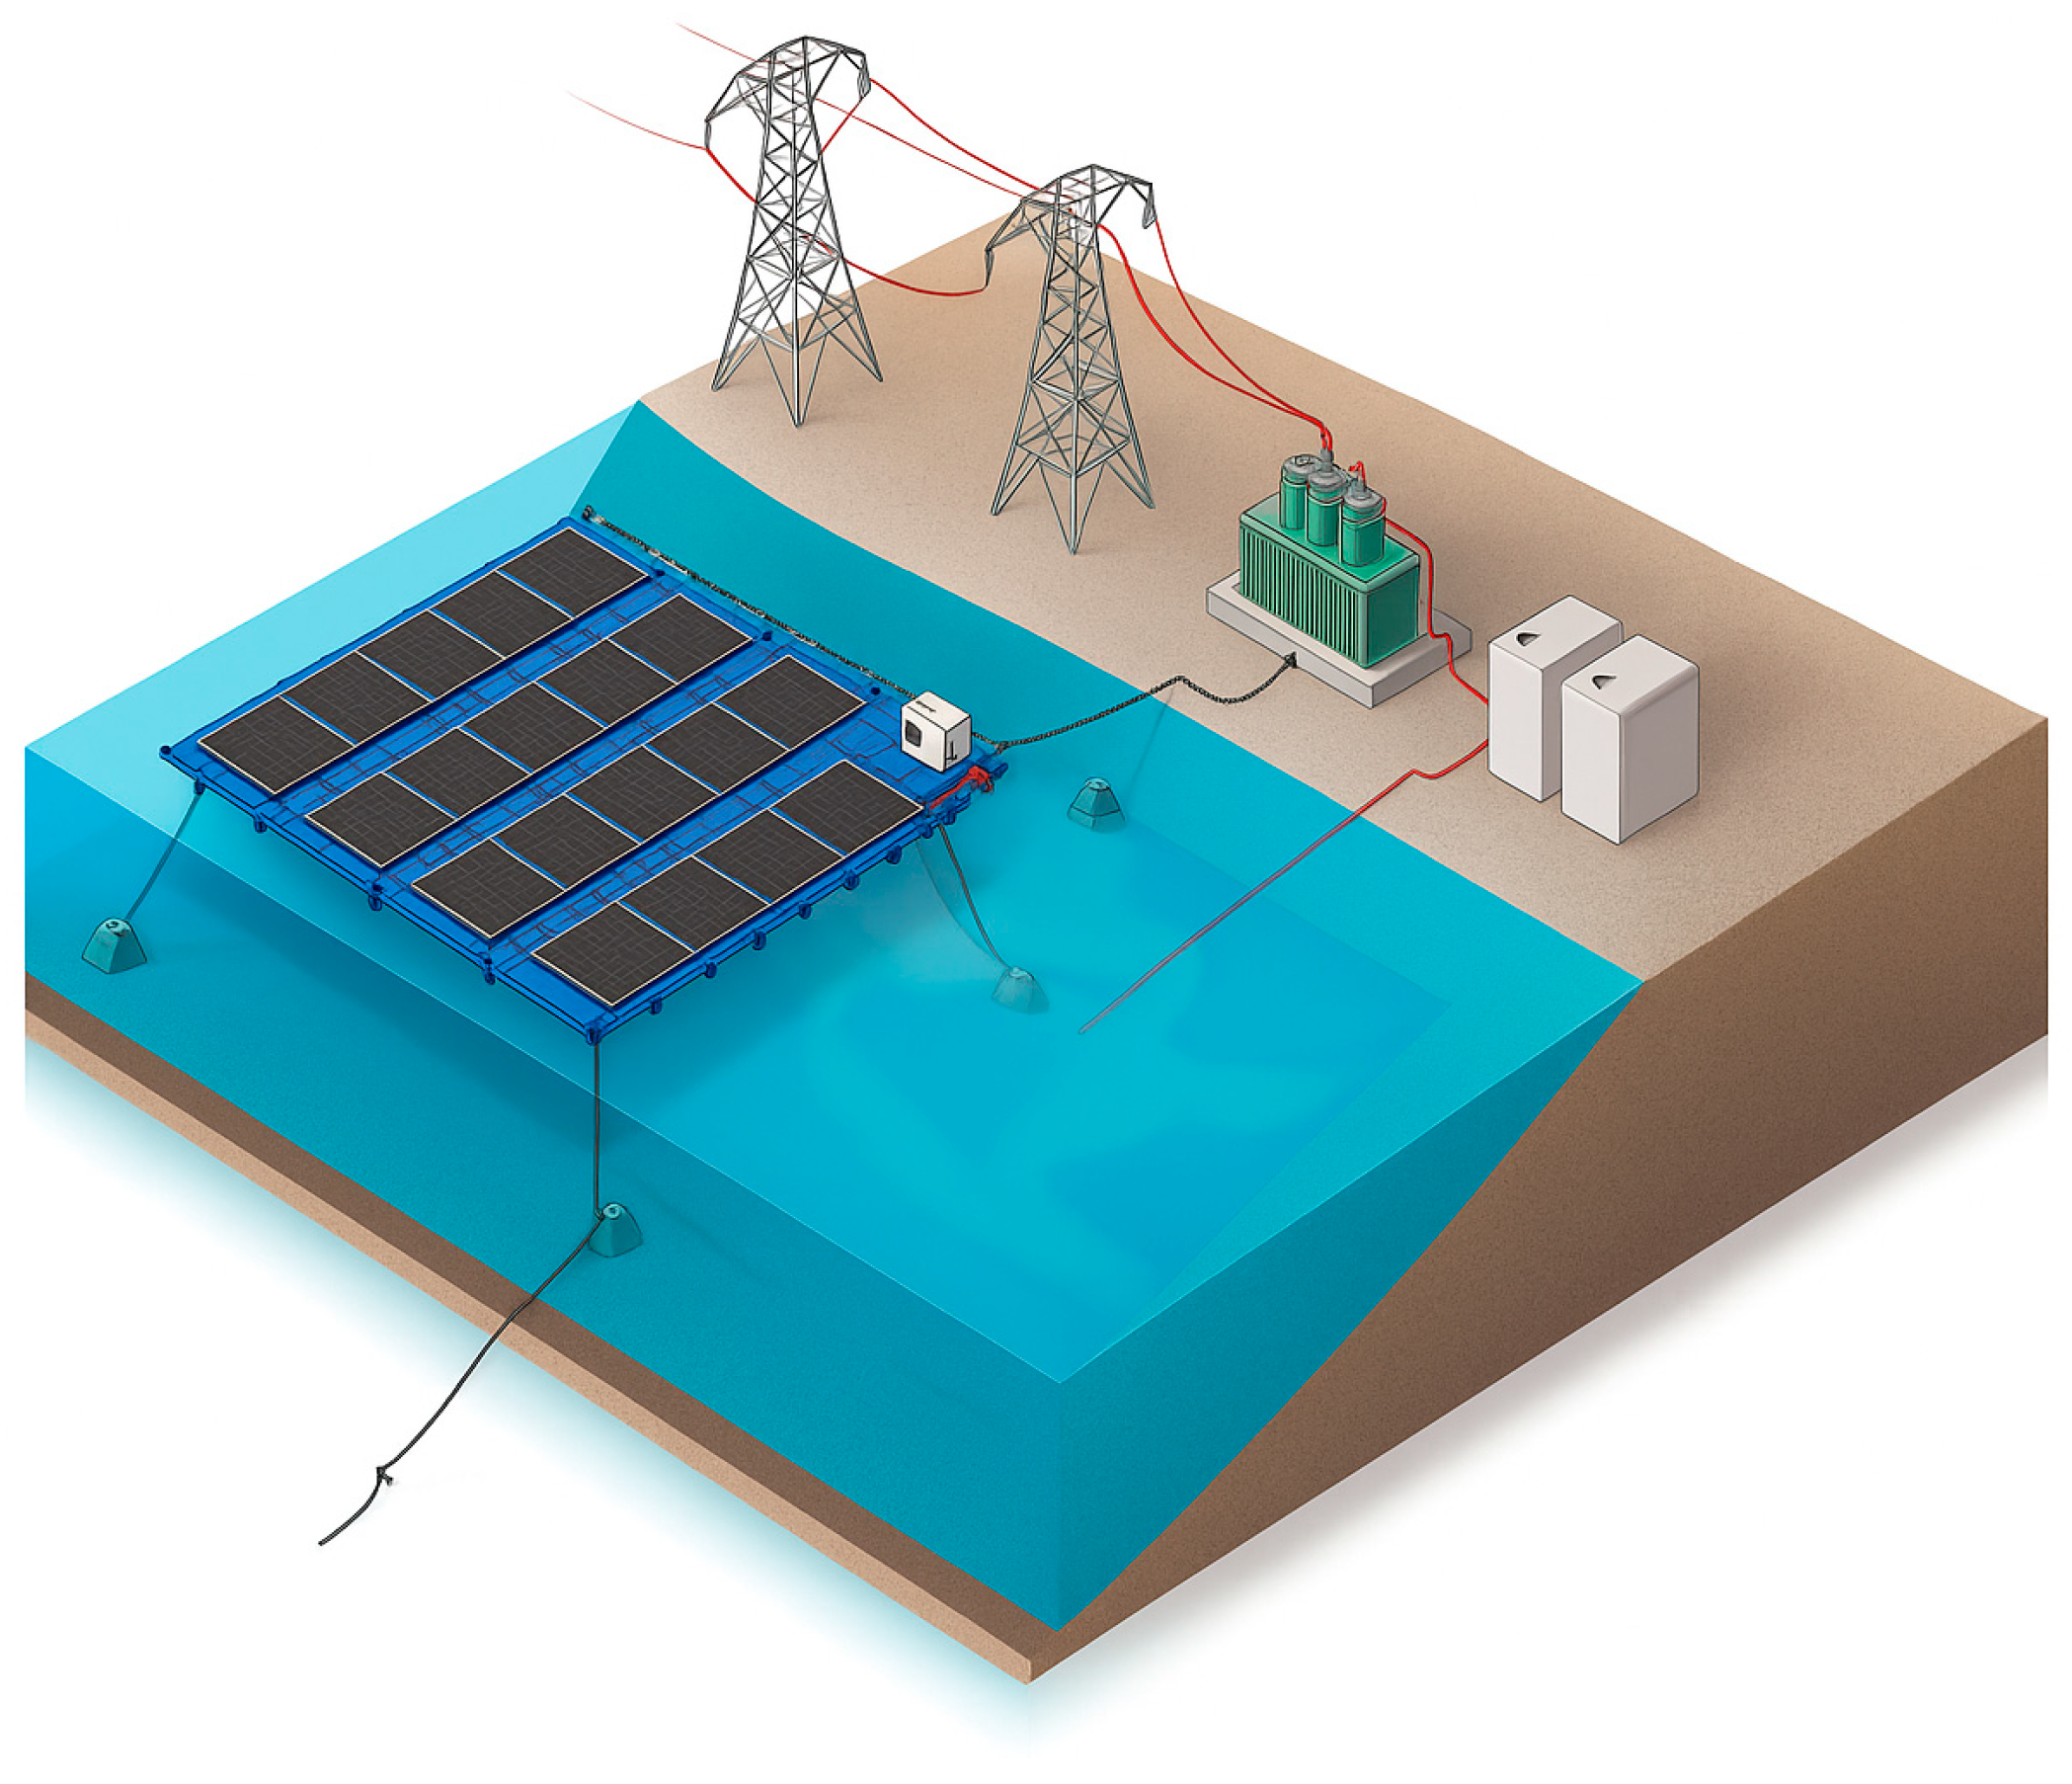
The modules are connected through floating walkways and anchored to the reservoir bed or shoreline using flexible mooring lines that allow for water-level fluctuations and wind loads. Electrical connections are routed through waterproof conduits toward inverters and the onshore grid connection point. A conceptual representation of the FPV system layout, including the floating modules, anchoring configuration, and electrical connections, is shown in Figure 4.
This configuration reduces water evaporation, improves the thermal performance of the panels through natural cooling, and allows efficient use of the water surface area without competing with terrestrial land uses.
The performance of this installation was analyzed using the NREL System Advisor Model (SAM) software [58], which enables detailed simulation of FPV systems based on solar resource data, component characteristics, and local environmental parameters.
Figure 4. Representation of the floating photovoltaic (FPV) system layout showing the modular floating structures, PV panel arrays, and the anchoring and electrical connection system [59].
Water 17 03144 g004
The SAM software, https://sam.nrel.gov/download.htm (accessed on 26 May 2025), is an open-source simulation tool developed by the U.S. National Renewable Energy Laboratory (NREL), https://www.nrel.gov/ (accessed o 26 May 2025), for the techno-economic assessment of renewable energy systems. SAM is a comprehensive performance and financial modeling tool that supports decision-making in renewable energy projects by estimating system performance and cost of energy for both behind-the-meter and utility-scale applications [58].
The platform includes dedicated modules for photovoltaic (PV) systems, both grid-connected and stand-alone, as well as for wind, hydropower, biomass, and hybrid configurations, including battery energy storage systems.
In this study, SAM was employed to model the performance of an FPV system. The initial step involved selecting the meteorological dataset from the software’s built-in library, based on the site coordinates. For the Zăvideni location, data were retrieved from the National Solar Radiation Database (NSRDB).
The system configuration was defined according to equipment datasheets and market specifications. The selected components include the LONGi Green Energy Technology Co., Ltd. (Xi’an, China) LR5-66HBD-480M photovoltaic modules and the Sungrow Power Supply Co., Ltd. (Hefei, China) SG250HX-US [800 V] inverters.
The SAM input parameters specify the number of inverters, the series and parallel connections of PV modules (distributed across several inverters, not representing physical wiring), and mounting-related losses.
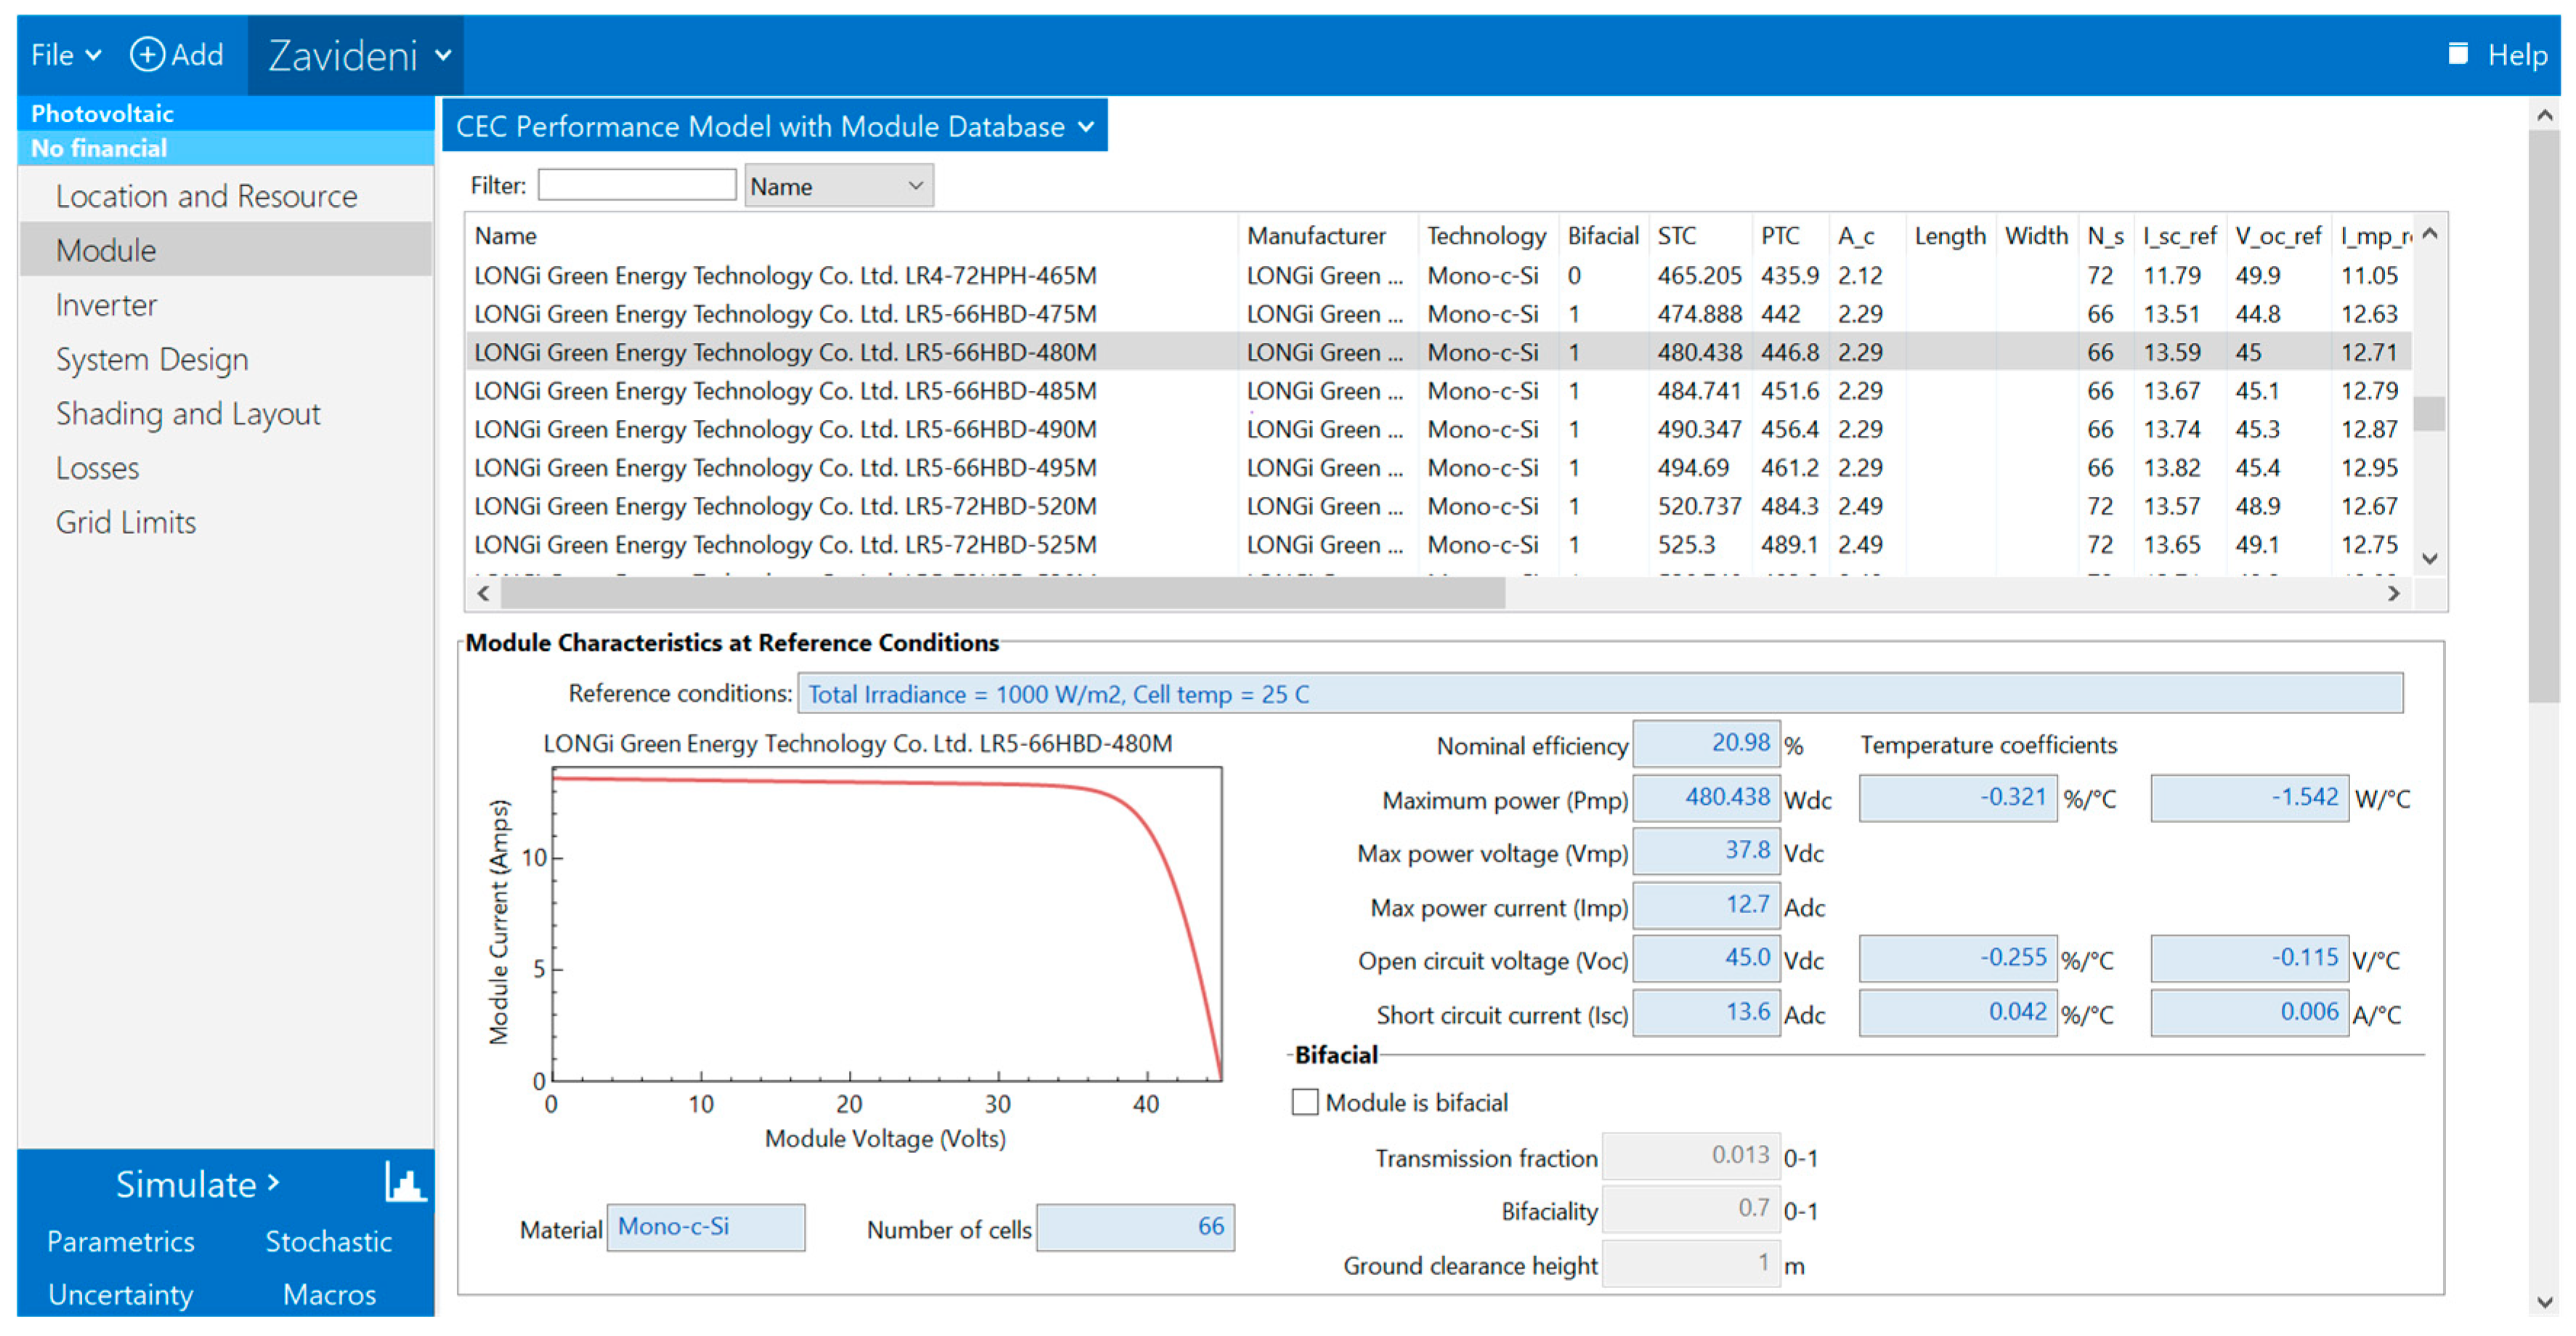
Regarding the selection of the photovoltaic module (Figure 5), this option provides a high-power output per unit—namely 480 W, with a total of 66 cells. In selecting the modules, it was ensured that the surface covered by the panels would not exceed 20% of the reservoir area, while the 480 W power rating allows the target installed capacity to be achieved with a smaller number of panels.
Figure 5. Selection of the photovoltaic module in the SAM software interface [58].
Water 17 03144 g005
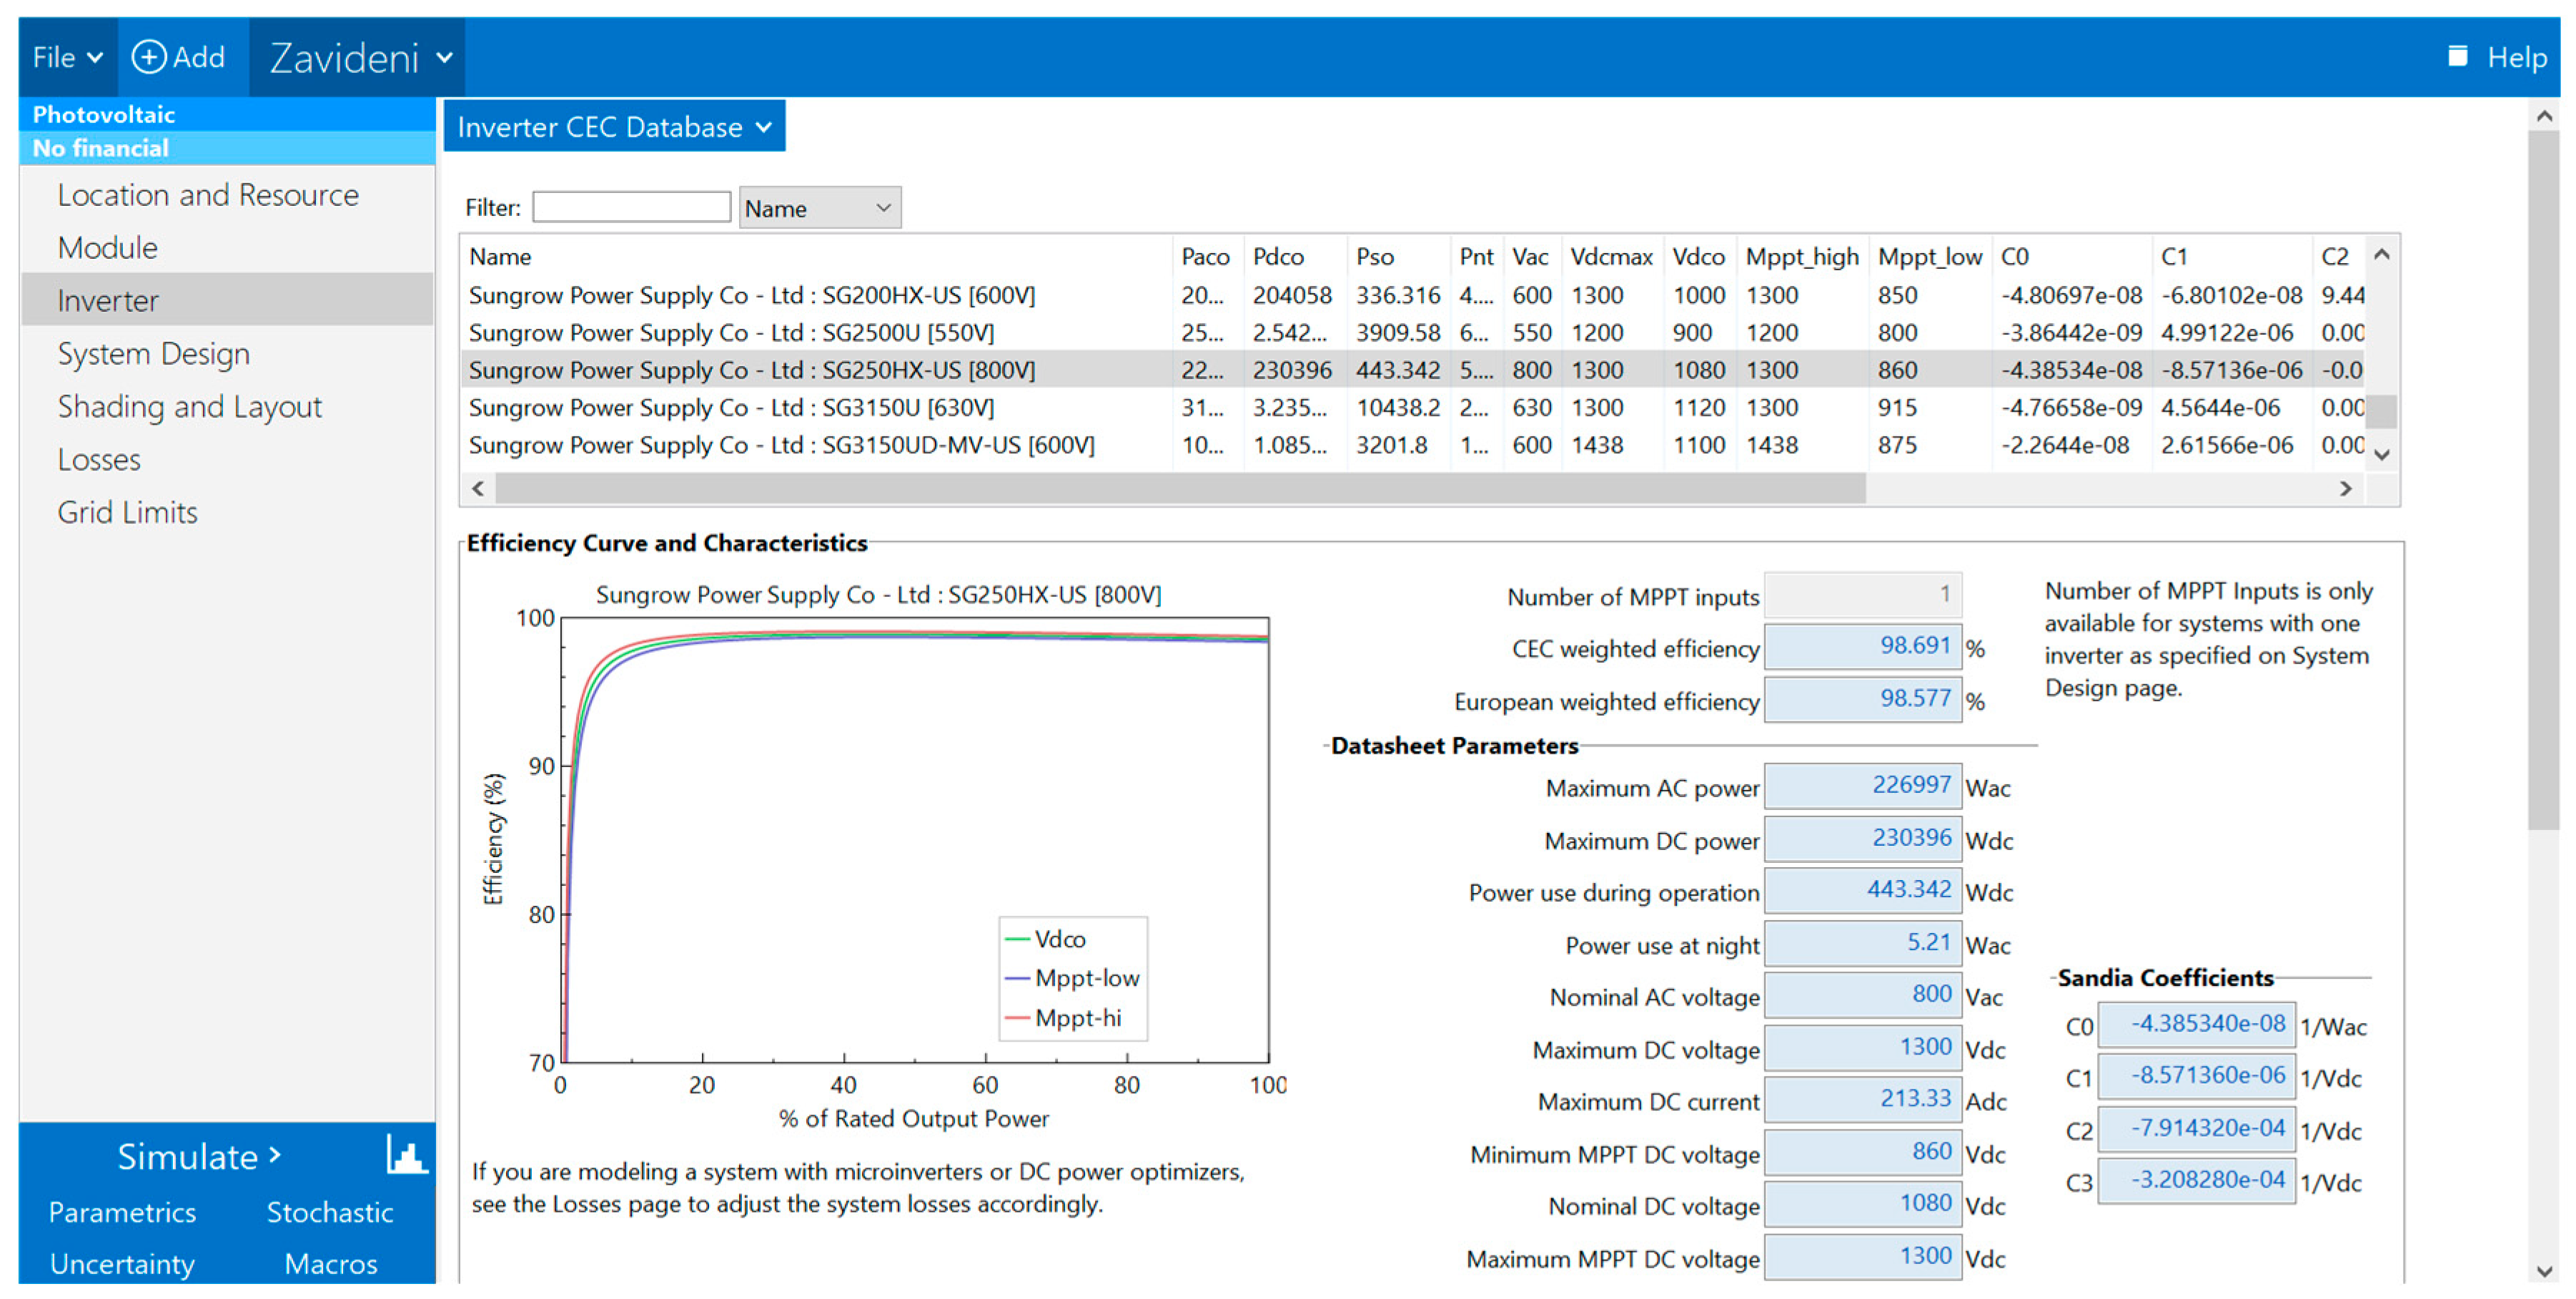
This, in turn, reduces the overall cost of the floating structure and cabling system. Although larger panels (e.g., 600 W) may appear as an alternative, they can introduce stability issues for floating platforms. LONGi is recognized as a global leader in photovoltaic technology, and the wide availability of this model facilitates rapid procurement and implementation. The inverter was selected because it supports high voltage levels up to 1500 V, which allows the connection of up to 30 LONGi Green Energy Technology Co., Ltd. (Xi’an, China) LR5-66HBD-480M modules (Figure 6), while maintaining compliance with the following safety condition:
Voc,t < VDCmax, invertor,
where Voc,t = 45 V represents the open-circuit voltage of the module, measured when it is not connected to any load, while VDCmax, invertor = 1500 V, is the maximum input voltage limit of the inverter.
This verification applies to cold days with low or no solar radiation. This type of inverter tracks the maximum power point (MPPT) even when the panels heat up or are partially shaded. In addition, it offers high conversion efficiency.
Figure 6. Selection of the inverter type in the SAM software interface [58].
Water 17 03144 g006
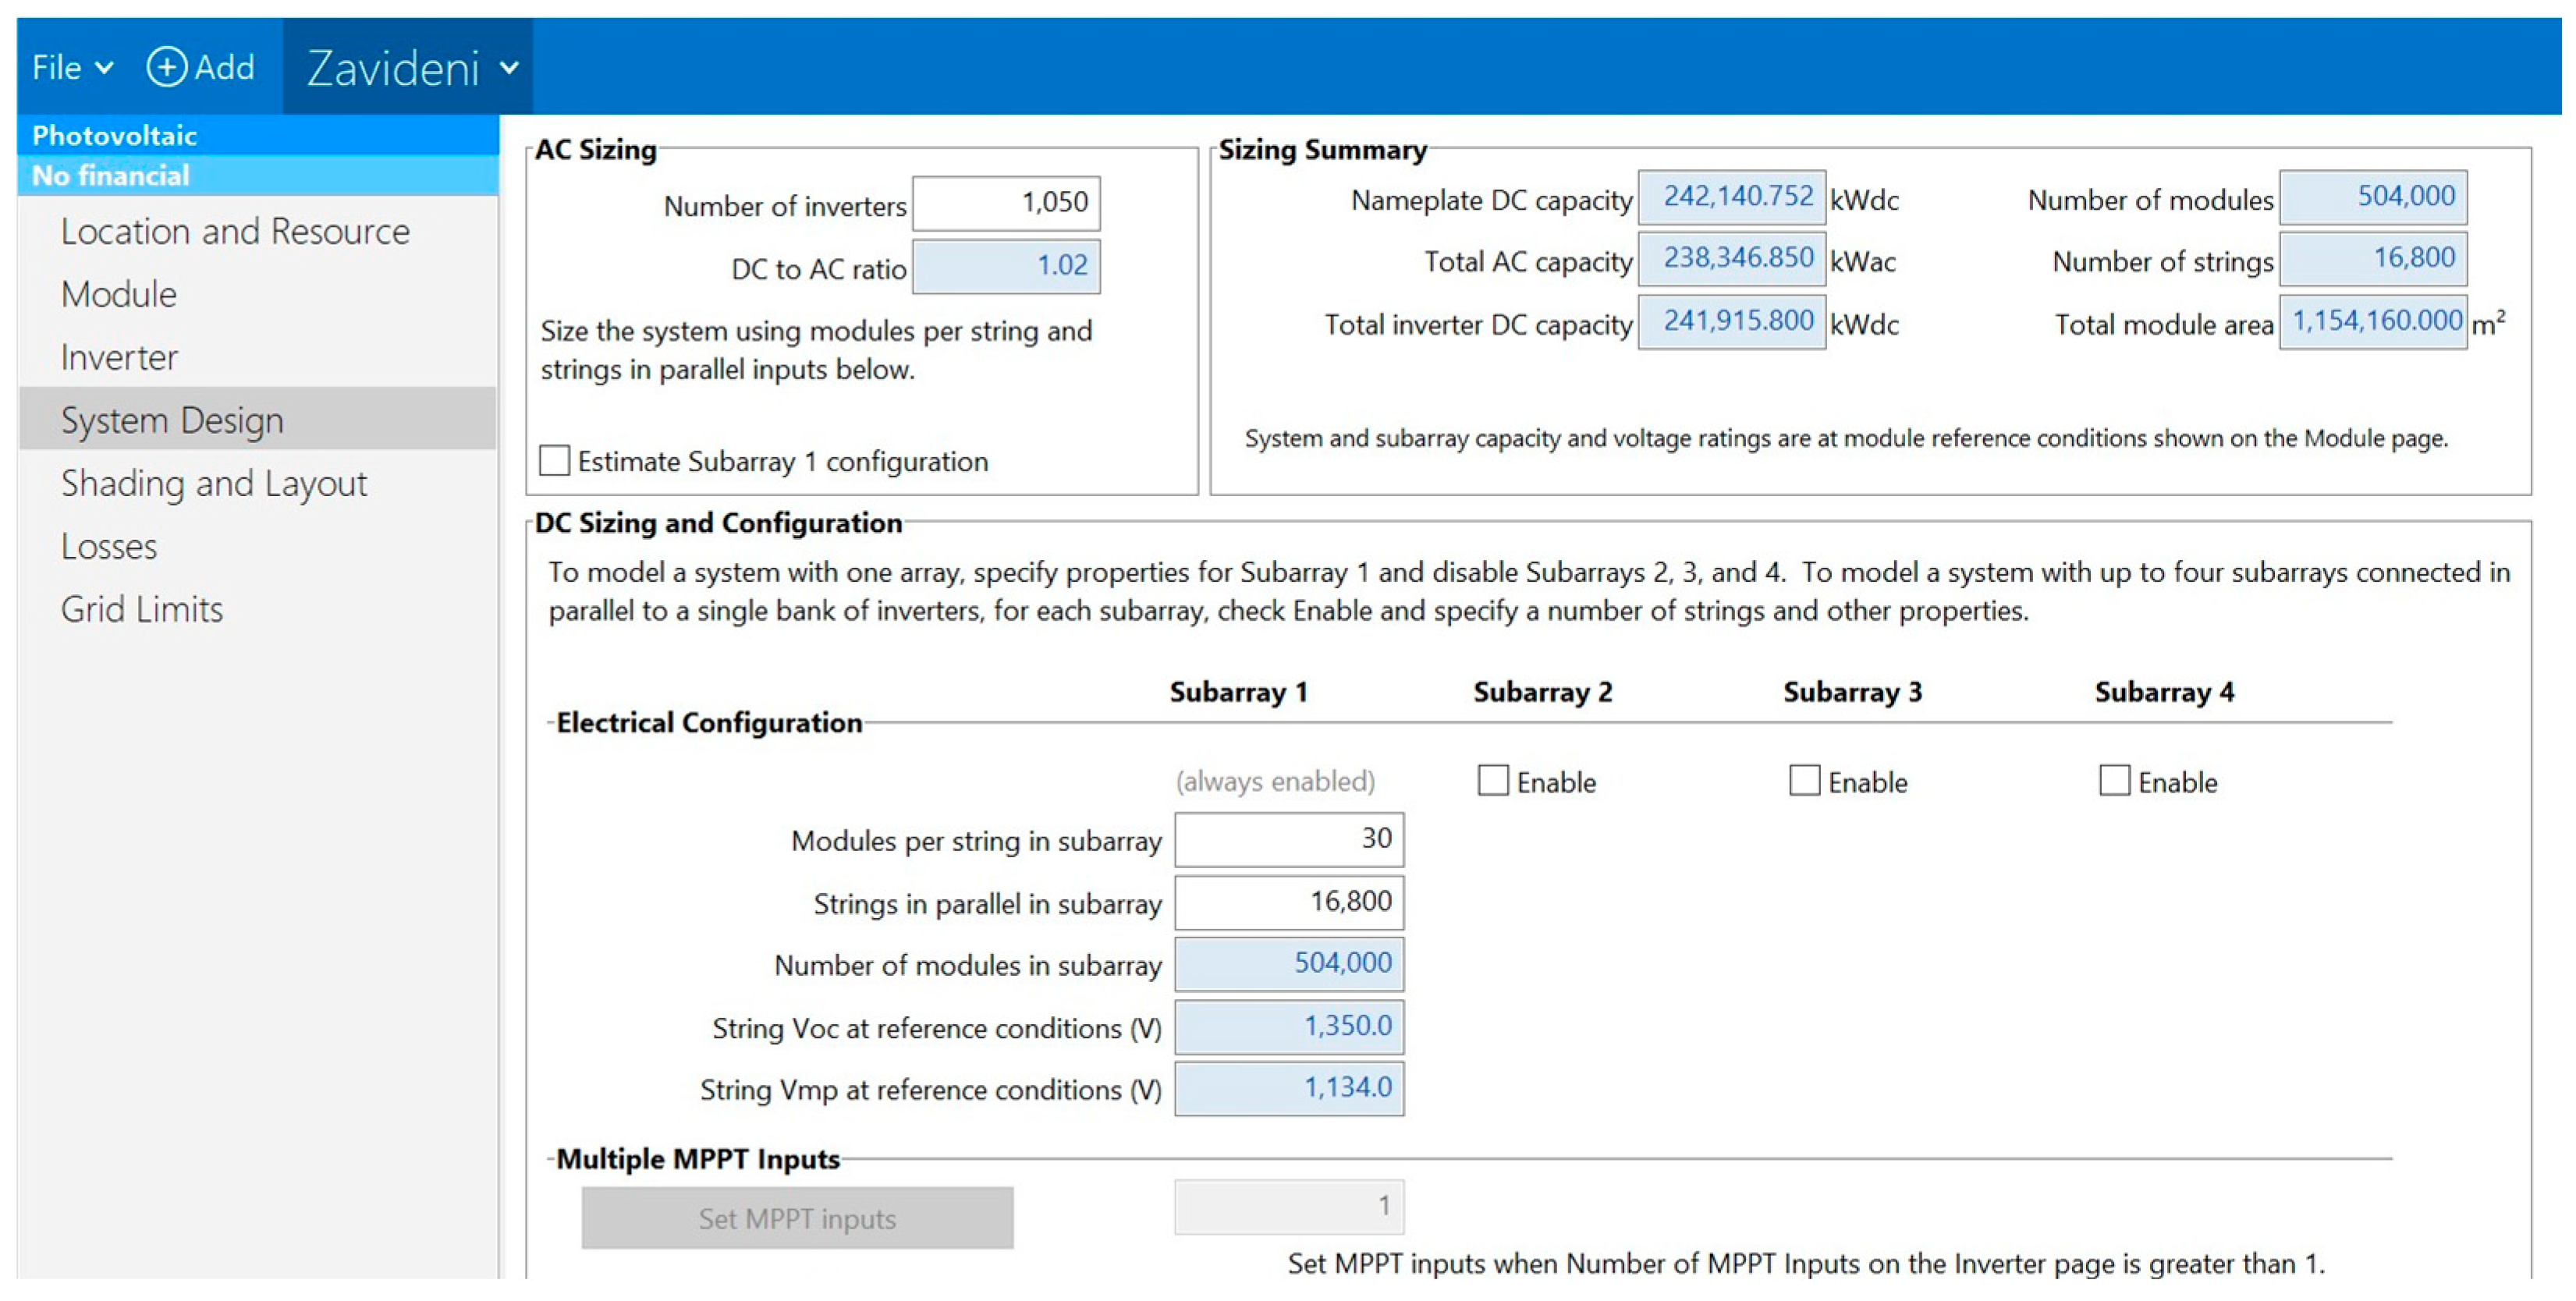
After selecting these components, the configuration parameters are defined, specifying the number of photovoltaic modules connected in series within a string and the number of strings connected in parallel to a single inverter (Figure 7).
Figure 7. Selection of the number of inverters, series-connected panels, and parallel-connected strings in the SAM software interface [58].
Water 17 03144 g007
According to the performed calculations, the following panel configuration was determined for the Zăvideni reservoir:
16,800 strings/1050 inverters = 16 strings per inverter.
Other relevant parameters considered in the calculation include:
  • Tilt angle, set to 10°, according to the technical specifications of floating photovoltaic panels [60];
  • Annual losses: a value of 3% was adopted to account for performance reductions caused by environmental factors and equipment degradation;
  • Azimuth angle set to 180°.
The azimuth represents the horizontal rotation of the panel relative to the north–south axis. Since Romania is in the Northern Hemisphere, photovoltaic panels are oriented toward geographic south to maximize solar radiation capture.
The same methodology was applied to the other six hydropower reservoirs within the cascade, and the corresponding results are summarized in the Results and Discussion section.

3. Results and Discussions

3.1. Electricity Generation from Hydropower Plants

The inflow to the Zăvideni hydropower plant was considered as that obtained from the forecasting method, as inflow in the reservoir, described in the previous section. In the first scenario, the hydropower plants were treated as run-of-river systems, where inflow directly influences electricity generation. For the downstream facilities, the inflow was computed as the turbined discharge from the immediately upstream plant, adjusted by a proportional correction factor to account for local losses and minor lateral inflows. The trained model was subsequently applied to generate inflow forecasts for the July–September 2025 period.
Accordingly, for each hydropower facility, the total discharge was divided into three operational categories:
  • Turbined discharge—the flow used in the HPP for energy generation;
  • Withdrawn discharge—the volume extracted from reservoir storage to supplement generation;
  • Spilled discharge—the flow released through spillways during high inflow conditions (if applicable).
Since the forecasting period corresponds to summer months (July–September 2025), additional operational constraints were imposed to maintain a minimum storage level in each reservoir, ensuring both ecological flow continuity and operational safety. Moreover, a minimum turbine discharge threshold was enforced to guarantee safe and efficient operation during low-flow conditions.
The computation of the produced energy, E, was performed using the following set of equations:
P e l = 9.81 · η ·   Q t u r · H g r   kW   ,  
E = P e l · t   kWh   ,
where P e l represents the power produced in the HPP; η is the overall HPP efficiency; Q t u r is the flow used for energy generation (turbined flow); H g r is the gross head.
The discharge was classified according to the operational mode during the analyzed period (July–September 2025), distinguishing between turbined, withdrawn, and spilled flows, Table 1.
As shown in Table 2, the total monthly released energy reached 44.91 GWh in July, decreased to 41.57 GWh in August, and increased to 74.15 GWh in September, reflecting the seasonal variation in inflows (defined as scenario 1).
The results show no considerable variation in the estimated energy production across the analyzed months, reflecting a hydrologically dry period.
The hydropower plant’s key design parameters, including the installed flow, Qi, installed capacity, Pi, and average annual design energy generation, Ean, are presented in Table 3. These parameters were also used to estimate the potential energy production under planned or imposed operating conditions, defined as a fraction of Ean, and adjusted according to the month’s position within the cold or warm season, which reflects periods of higher or lower system load (defined as scenario 2). Moreover, these values served as reference inputs for assessing the plant’s performance under different hydrological and operational scenarios, allowing a comparison between the two energy outputs.

3.2. Electricity Generation from FPV Plants

In the context where the only known parameter is the installed capacity of the PV plants to be deployed within this project, the design criterion was to cover 20–25% of each reservoir’s surface area. The outcomes of the simulation are summarized in Table 4 below.
The surface area values were roughly estimated using Google Earth [61]. Based on the results presented in Table 4, the Zăvideni hydropower reservoir demonstrates the largest surface coverage by photovoltaic panels within the cascade system.
Within the developed application, the energy corresponding to a 15 min time step (Δt = 15 min) was computed according to the following equations:
E t   kWh   =   P AC kW · 0 . 25 ,
P AC   kW = P DC   kW · η i n v · η l o s s e s ,
P DC   kW = P i   kW · G P O A 1000 · 1 + β · T c - 25   ° C ,
where
  • E t = energy generation with a timestep of 15 min;
  • P A C = FPV power in AC (alternative current);
  • P D C = FPV power in DC (direct current);
  • η i n v = inverter efficiency;
  • η l o s s e s = electrical circuit efficiency;
  • P i = FPV installed capacity;
  • G P O A = solar radiation [W/m2];
  • β = thermal coefficient;
  • T c = photovoltaic cell temperature.
The Global Solar Atlas [60], developed by the World Bank and ESMAP, provides free access to global solar resource data with a spatial resolution of up to 1 km. The platform enables the estimation of photovoltaic energy potential based on parameters such as GHI, DNI, and PV output, supporting the design and validation of solar generation models.
In this study, the GSA interface was used to perform a simplified simulation for the Zăvideni reservoir, validating the results obtained from the SAM.
The differences between the 2025 annual production estimates derived from the System Advisor Model (SAM) and the Global Solar Atlas (GSA) are reported in Table 5.
The discrepancies likely stem from GSA’s limited equipment-specific inputs and from differences in the historical meteorological datasets used by the two platforms; in SAM, the latest weather records found were from 2022. Overall, SAM tends to produce a more optimistic estimate while GSA is more conservative, yet the order of magnitude remains consistent. Operational teams monitor assets, issue daily short-term forecasts, and ensure contracted energy deliveries, reporting to the market and the system operator regarding the Production Responsibility Entity (PRE) status. Meanwhile, strategic and tactical teams coordinate throughout the project lifecycle, maintaining transparent communication on plans, resources, and outcomes.

3.3. Hydropower-FPV Hybrid Plant Energy Production Trading Strategy

In this stage, it is assumed that the FPV plants have been commissioned, with June 2025 representing the testing period, and the operational phase starting in July 2025.
During the testing phase, the FPV units were included in a temporary (PRE) responsible for balancing operations, while the settlement was performed according to the following formula:
P settlement   =   Min P DAM ; 400   RON .
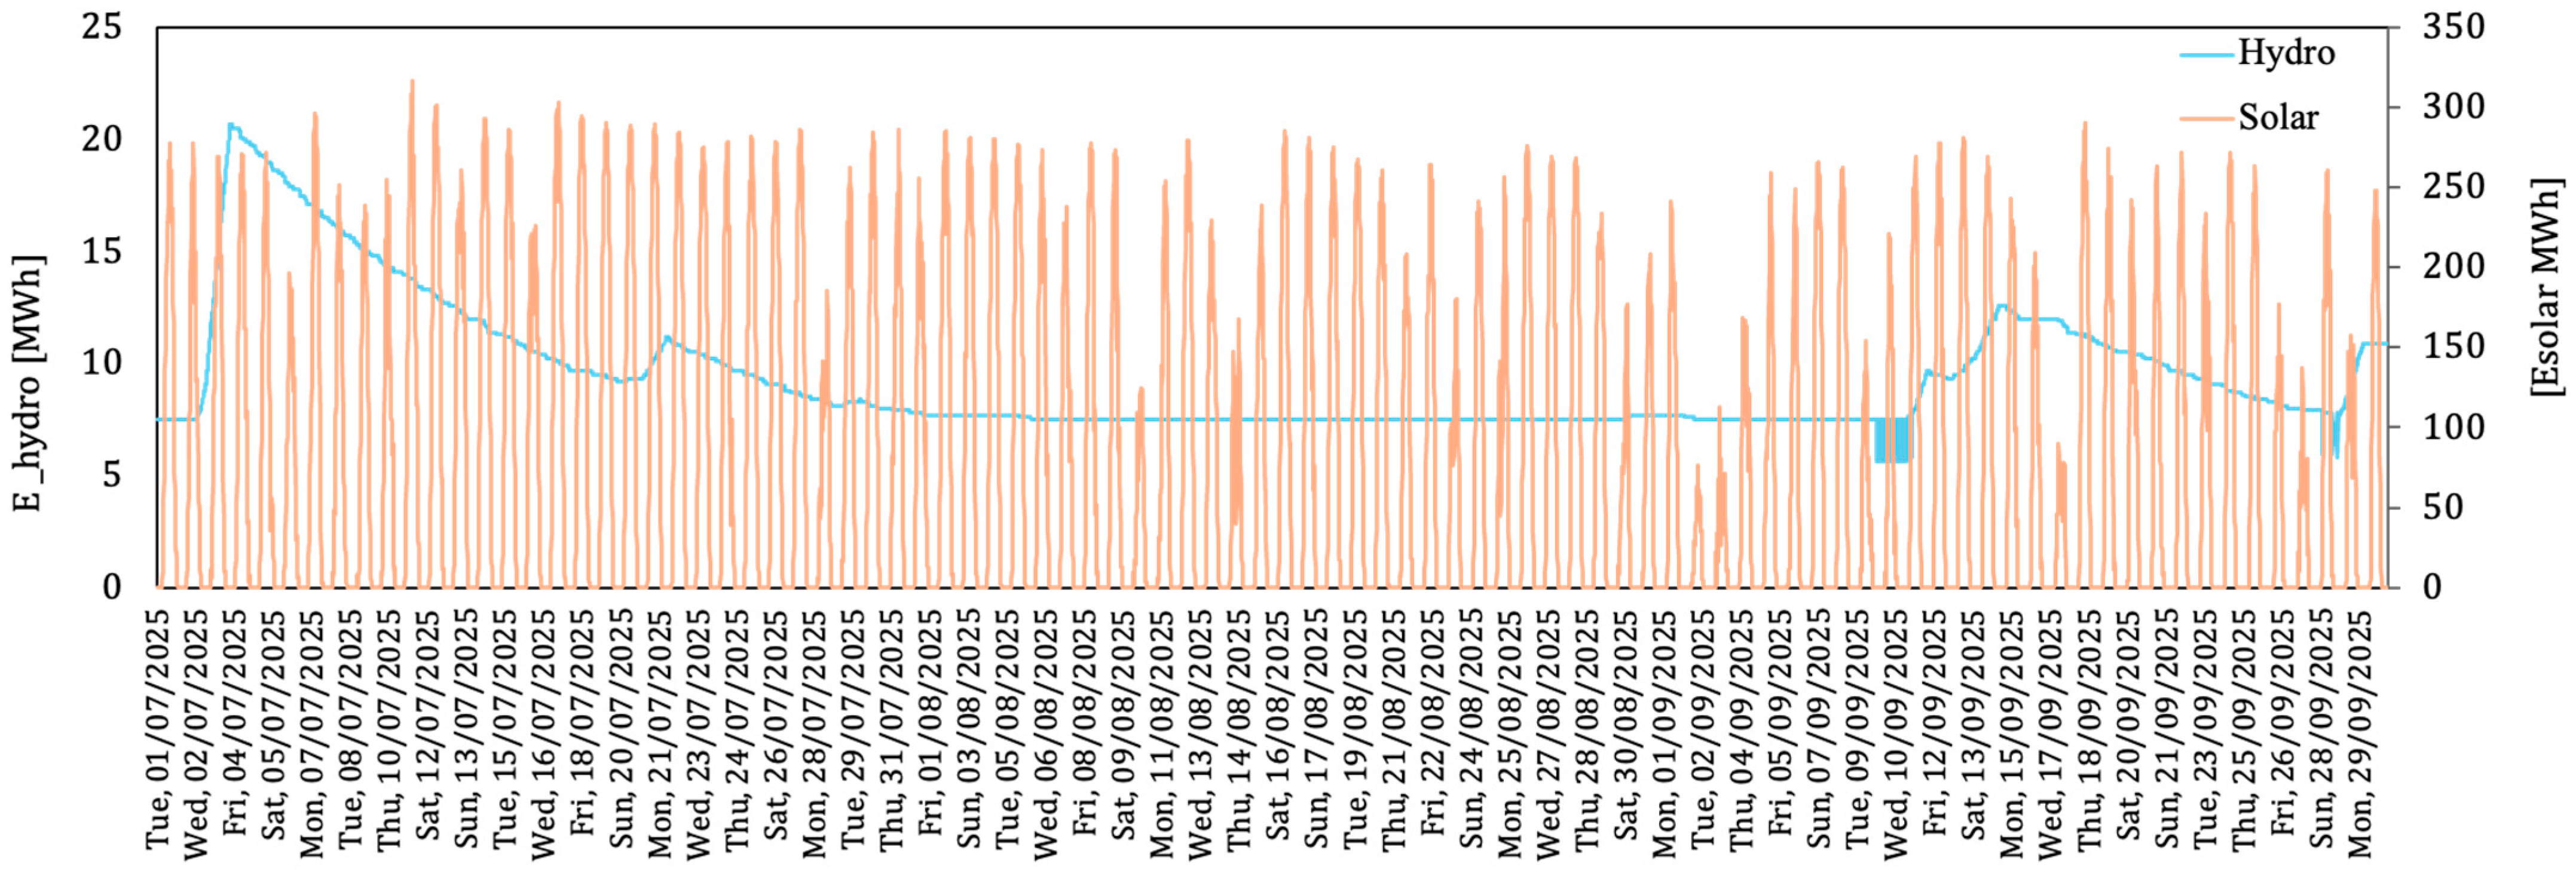
Using the energy forecast and the actual prices from the Day-Ahead Market (DAM), the organized electricity market segment where trading takes place one day before delivery, the remuneration during the testing period was estimated at 68,475,828 RON. This value is indicative only, as the final settlement depends on the realized energy. For July–September 2025, the total forecast energy is distributed by month and generation type, hydropower and FPV, as shown in Table 6 and detailed in Figure 8.
As shown in Figure 8, during the third quarter, water resources are limited. Conversely, the solar generation profile exhibits its highest production value within the same period. Thus, although seasonal, solar generation compensates for the reduction in hydropower output, helping to meet the increasing energy demand that typically rises sharply in the summer months due to the use of air conditioning systems.
It is worth noting that in recent years, summer months have been characterized by low hydrological conditions, and this assumption was also applied for the summer of 2025.
In 2023, electricity trading in Romania was carried out in accordance with Government Emergency Ordinance (GEO) No. 27/2022, introducing the Centralized Electricity Acquisition Mechanism (MACEE) through GEO No. 153/2022. The implementation of this mechanism affected market liquidity and required participants to rapidly adjust their short-term trading strategies [62].
In the short term, the electricity available beyond the quantity contracted through MACEE was traded on the DAM to optimize operational schedules and efficiently manage deviations from forecasts.
Starting from 1 January 2025, the obligation for market participants to adhere to the MACEE mechanism was removed, leading to an increased prevalence of bilateral contracts in the market. This type of contract is concluded directly between two parties without the involvement of market operators, and the price and conditions remain confidential.
Such contracts also specify which party bears the cost of imbalances between forecasted and actual generation. In the present case study, when the forecasting process is managed by the Production Responsibility Entity (PRE) that purchases the energy and assumes imbalance costs, the seller’s market risk and collateral exposure are significantly reduced. For the buyer, energy acquisition occurs at a fixed price, mitigating exposure to spot market volatility. If the forecasting system offers high accuracy or the PRE has a diversified portfolio that smooths imbalances, the cost of concluding a bilateral contract remains low.
For energy trading in the third quarter (July–September 2025), Physical Bilateral Contracts (PBC) will be signed for the energy generated by the hydropower plants, and virtual bilateral contracts for the energy produced by the floating PV systems.
To determine the pricing of physical bilateral contracts, a forecast of the forward price curve (Figure 9) is employed. This curve represents a projection of future electricity prices, profiled according to the purchased production categories (base load, peak, and off-peak). The profiled curve is then compared with the unprofiled forward curve, to which several components are added: the estimated average imbalance value, the cost of capital locked in guarantees, a risk margin for extreme price fluctuations, and fixed costs such as forecasting software licenses and mandatory reporting to ANRE and Transelectrica.
The obtained price has a value of 651.14 RON/MWh. Compared to the average forward price of 654 RON/MWh, it is slightly lower, which indicates that the energy profile to be sold also includes cheaper hours. This effect is referred to as a “discount” relative to the forward price, amounting to 2.86 RON/MWh. However, in this case, it was established that the seller would bear the imbalances and perform the forecasting, which also includes an additional operational cost. Consequently, the final settlement price of the contract was set at 670 RON/MWh.
The contract price is derived from a forward curve, supplemented by operational expenditures, including imbalance costs and expenses associated with production forecasting accuracy, resulting in a final settlement price of approximately 770 RON/MWh, slightly higher than the initially estimated 670 RON/MWh, due to the inclusion of additional operational and imbalance-related costs.
Therefore, the projected revenues from the sale of electricity generated by the hydropower source, according to the forecasted scenarios, are presented in Table 7. In practice, however, the actual values may differ due to imbalances between the forecast and the actual production.
Scenario 2, which considers an imposed (fixed) amount of generated energy during the same three-month period, returned a higher total revenue compared to Scenario 1 presented in Table 7, where a settlement price of 770 RON/MWh was applied. If a contract is already established for the fixed monthly energy, meaning that the selling price does not fluctuate daily but remains constant at an average value, for example, 770 RON/MWh, the total estimated revenue would increase to 130,453,400 RON. Furthermore, based on the forward price curve, the total revenue for Scenario 2 reached 110,656,349 RON, reflecting the impact of market price dynamics and indicating a significant improvement relative to the previous trading results.
To estimate the total transaction value for the period July–September 2025, the forecasted energy and the forward price curve presented in Figure 9 will be used in the calculation.
The price flow operates as follows:
  • If ΔP = PDAM − Pstrike > 0, the producer pays the difference ΔP × V (volume) to the buyer;
  • If ΔP = PDAM − Pstrike < 0, the buyer pays the difference to the seller.
Regarding the procurement of the production forecast from the solar source through a virtual bilateral contract/Virtual Power Purchase Agreement (VPPA) with a price indexed to the DAM, there is no physical delivery of the contracted quantity. The settlement value for a closed month between the parties is determined based on the contracted volume and the difference between the DAM price and the agreed contractual price (strike).
It is assumed that, following the analysis carried out by both parties involved in the contract signing, based on the forward price observed in the DAM, a contractual price of 500 RON/MWh was established, with energy procurement following the “as produced” model.
Although this type of contract represents a purely financial transaction, both parties are required to fulfill their physical obligations in accordance with market regulations and to possess the energy associated with the agreement.
Within the framework of a VPPA contract the generation unit will register an income. This means that regardless of the prices recorded in the spot market, the reference will always remain the strike price. Consequently, the risk associated with negative DAM prices is eliminated, and the substitution of a financial guarantee is no longer necessary.
In the analyzed trading scenarios—namely, physical bilateral contracts associated with hydroelectric generation, and virtual bilateral contracts associated with photovoltaic generation—preliminary estimates were obtained, as shown in Table 8. It should be noted that these values do not include the remuneration corresponding to the production achieved during the testing period in June 2025.
If the outcome of the analysis is unfavorable for the generating unit selling the energy, it should be emphasized that the „forward” price estimate does not account for the negative values observed in previous years during the third quarter. Therefore, from a strategic management perspective, the decision to conclude such a type of contract represents a secure alternative for trading the entire amount of generated energy under a firm agreement. This approach minimizes market exposure and removes the need for rapid action if the full quantity cannot be settled on the DAM, for example.

4. Conclusions

This study conducted an energy forecasting analysis for a hybrid power plant integrating two renewable sources—conventional hydropower and FPV systems. The results showed that the hybridization decision is justified by both technical and economic assessments.
One of the major advantages of FPV deployment is the reduction in water evaporation, which contributes to maintaining higher reservoir volumes. At the same time, the cooling effect of the aquatic environment enhances PV module efficiency compared to traditional ground-mounted systems. An additional advantage lies in the efficient use of existing water surfaces, eliminating the need for new land acquisition.
Although strategic and tactical management operate independently, they constantly interact to ensure the achievement of both national and European energy targets, as well as company-level objectives related to trading the entire energy output under favorable market conditions. The proposed strategic plan for integrating floating photovoltaic systems with hydropower operations in the Lower Olt River cascade aligns with global trends in hybrid renewable energy development. The present plan places stronger emphasis on short-term trading optimization and regional energy mix diversification within the Romanian context.
The volatility of renewable energy sources directly affects market prices and introduces uncertainty, as long-term forecasts often diverge significantly from actual production. Therefore, forecasts are continuously refined as the delivery horizon approaches in order to minimize imbalances, which otherwise propagate into undesired price effects.
The seasonal complementarity between hydropower and solar generation proved particularly valuable, as it mitigates the risk of underproduction while increasing flexibility in trading negotiations. The hybridization of hydropower facilities with FPV thus represents a viable pathway to reduce Romania’s dependence on energy imports, providing a more stable and resilient contribution to national energy security by covering peak load hours and enhancing system flexibility.
Thus, the present study highlighted the potential of hybridizing hydropower plants with FPV systems as a viable solution to enhance renewable energy generation and market flexibility. The results confirmed that such integration supports both operational efficiency and environmental sustainability.
Beyond the technical feasibility, the hybrid approach offers economic and strategic advantages by stabilizing revenues and reducing market risks. It also contributes to achieving broader energy policy objectives, particularly those related to decarbonization and energy security.
Future work will focus on developing optimization frameworks for hybrid operation under variable hydrological and climatic conditions, as well as assessing large-scale implementation scenarios.

Author Contributions

Conceptualization, O.-I.B. and E.-I.T.; Methodology, E.-I.T., O.-I.B. and B.P.; Writing—original draft, O.-I.B. and E.-I.T.; Resources, O.-I.B., A.N. and B.P.; Supervision, A.N. and B.P.; Writing—review and editing, E.-I.T., A.N. and B.P. All authors have read and agreed to the published version of the manuscript.

Funding

This work was supported by a grant from the National Program for Research of the National Association of Technical Universities—GNAC ARUT 2023 (Contract no. 181).

Data Availability Statement

The original contributions presented in this study are included in the article. Further inquiries can be directed at the corresponding author.

Acknowledgments

The authors gratefully acknowledge the support provided by ARUT through the GNAC 2023 research program. During the preparation of this manuscript/study, the author(s) used ChatGPT (OpenAI, GPT-5, 2025 version) for the purposes of clarifying implementation errors related to the NARX–MLP algorithm optimized with the Cuckoo Search method. The authors have reviewed and edited the output and take full responsibility for the content of this publication.

Conflicts of Interest

The authors declare no conflicts of interest.

References

  1. United Nations. Transforming Our World: The 2030 Agenda for Sustainable Development. In Proceedings of the United Nations General Assembly, New York, NY, USA, 25 September 2015; A/RES/70/1. Available online: https://sdgs.un.org/2030agenda (accessed on 27 October 2025).
  2. International Energy Agency (IEA) & United Nations Statistics Division. Tracking SDG 7: The Energy Progress Report 2023; World Bank: Paris, France, 2023; Available online: https://trackingsdg7.esmap.org (accessed on 27 October 2025).
  3. Quaranta, E.; Rosa-Clot, M. Chapter five—Hydroelectric coupling with floating photovoltaics. In Progress in Floating Photovoltaic Systems; Elsevier: Amsterdam, The Netherlands, 2025; pp. 99–119, JRC139522. [Google Scholar] [CrossRef]
  4. Kakoulaki, G.; Gonzalez Sanchez, R.; Gracia Amillo, A.; Szabo, S.; De Felice, M.; Farinosi, F.; De Felice, L.; Bisselink, B.; Seliger, R.; Kougias, I.; et al. Benefits of pairing floating solar photovoltaics with hydropower reservoirs in Europe. Renew. Sustain. Energy Rev. 2023, 171, 112989. [Google Scholar] [CrossRef]
  5. Lee, N.; Grunwald, U.; Rosenlieb, E.; Mirletz, H.; Aznar, A.; Spencer, R.; Cox, S. Hybrid floating solar photovoltaics-hydropower systems: Benefits and global assessment of technical potential. Renew. Energy 2020, 162, 1415–1427. [Google Scholar] [CrossRef]
  6. Wang, Z.; Wen, X.; Tan, Q.; Fang, G.; Lei, X.; Wang, H.; Yan, J. Potential assessment of large-scale hydro-photovoltaic-wind hybrid systems on a global scale. Renew. Sustain. Energy Rev. 2021, 146, 111154. [Google Scholar] [CrossRef]
  7. Piancó, F.; Moraes, L.; dos Prazeres, I.; Lima, A.G.G.; Bessa, J.G.; Micheli, L.; Fernández, E.; Almonacid, F. Hydroelectric operation for hybridization with a floating photovoltaic plant: A case study. Renew. Energy 2022, 201, 85–95. [Google Scholar] [CrossRef]
  8. Lima, A.G.G.; de Mello Junior, H.D.; Quirino, T.M.; Mendoza, L.A.F.; Nunes, G.M.S.; Muller, G.M. Hydro-floating photovoltaic systems as virtual batteries: A case study of Brazil’s Furnas hydropower plant. Renew. Energy 2025, 252, 124036. [Google Scholar] [CrossRef]
  9. Olkkonen, V.; Haaskjold, K.; Klyve, Ø.S.; Skartlien, R. Techno-economic feasibility of hybrid hydro-FPV systems in Sub-Saharan Africa under different market conditions. Renew. Energy 2023, 215, 118981. [Google Scholar] [CrossRef]
  10. Micocci, D.; Bragalli, C.; Toth, E.; Wechsler, T.; Zappa, M. Hybridization of an alpine pumped-storage hydropower plant with floating solar photovoltaics: A study from the water resource perspective. Renew. Energy 2025, 253, 123530. [Google Scholar] [CrossRef]
  11. Fang, W.; Huang, Q.; Huang, S.; Yang, J.; Meng, E.; Li, Y. Optimal sizing of utility-scale photovoltaic power generation complementarily operating with hydropower: A case study of the world’s largest hydro-photovoltaic plant. Energy Convers. Manag. 2017, 136, 161–172. [Google Scholar] [CrossRef]
  12. Perez, M.; Perez, R.; Ferguson, C.R.; Schlemmer, J. Deploying effectively dispatchable PV on reservoirs: Comparing floating PV to other renewable technologies. Sol. Energy. 2018, 174, 837–847. [Google Scholar] [CrossRef]
  13. Sahu, A.; Yadav, N.; Sudhakar, K. Floating photovoltaic power plant: A review. Renew. Sustain. Energy Rev. 2016, 66, 815–824. [Google Scholar] [CrossRef]
  14. Rahaman, M.A.; dos Santos, F.R.; Centenaro, S.H.; Fekih, A.; Wiecheteck, G.; Chambers, T.L. Sustainability assessment of floating photovoltaic (FPV) system: A multidimensional comprehensive analysis across the water-energy nexus. J. Clean. Prod. 2025, 506, 145468. [Google Scholar] [CrossRef]
  15. Akhtar, Z.; Lalwani, M.; Rao, K.V.S. Estimation of energy potential and evaporation in 20 lakes with FPV in Rajasthan, India. Renew. Energy 2025, 256, 124297. [Google Scholar] [CrossRef]
  16. Bajc, T.; Kostadinović, D. Potential of usage of the floating photovoltaic systems on natural and artificial lakes in the Republic of Serbia. J. Clean. Prod. 2023, 422, 138598. [Google Scholar] [CrossRef]
  17. Moraes, C.A.; Valadão, G.F.; Renato, N.S.; Botelho, D.F.; de Oliveira, A.C.L.; Aleman, C.C.; Cunha, F.F. Floating photovoltaic plants as an electricity supply option in the Tocantins–Araguaia basin. Renew. Energy 2022, 193, 264–277. [Google Scholar] [CrossRef]
  18. Gadzanku, S.; Lee, N.; Dyreson, A. Enabling Floating Solar Photovoltaic (FPV) Deployment. 2022. Available online: https://digitalcommons.mtu.edu/michigantech-p/16825/ (accessed on 30 September 2025).
  19. Petrollese, M.; Seche, P.; Cocco, D. Analysis and optimization of solar-pumped hydro storage systems integrated in water supply networks. Energy 2019, 189, 116176. [Google Scholar] [CrossRef]
  20. Casarin, S.; Cavazzini, G.; Pérez-Díaz, J.I. Battery and flywheel hybridization of a reversible pumped-storage hydro power plant for wear and tear reduction. J. Energy Storage 2023, 71, 108059. [Google Scholar] [CrossRef]
  21. Zhou, Y.; Chang, F.-J.; Chang, L.-C.; Lee, W.-D.; Huang, A.; Xu, C.-Y.; Guo, S. An advanced complementary scheme of floating photovoltaic and hydropower generation flourishing water–food–energy nexus synergies. Appl. Energy 2020, 275, 115389. [Google Scholar] [CrossRef]
  22. Song, J.; Kim, J.; Chung, W.C.; Jung, D.; Kang, Y.J.; Kim, S. Wave-induced structural response analysis of the supporting frames for multiconnected offshore floating photovoltaic units installed in the inner harbor. Ocean Eng. 2023, 271, 113812. [Google Scholar] [CrossRef]
  23. Ionescu, C.; Pătrașcu, R.; Sandu, M.R. Integrated operation analysis of a geothermal–solar hybrid system for sustainable thermal energy supply: A case study in the Politehnica Bucharest Campus. UPB Sci. Bull. 2024, 86, 405–416, WOS:001380943300030. [Google Scholar]
  24. Huang, L.; Elzaabalawy, H.; Sarhaan, M.; Sherif, A.; Ding, H.; Ou, B.; Yang, D.; Cerik, B.C. Developing reliable floating solar systems on seas: A review. Ocean Eng. 2025, 322, 120525. [Google Scholar] [CrossRef]
  25. Dai, J.; Zhang, C.; Lim, H.V.; Ang, K.K.; Qian, X.; Wong, J.L.H.; Tan, S.T.; Wang, C.L. Design and construction of floating modular photovoltaic system for water reservoirs. Energy 2020, 191, 116549. [Google Scholar] [CrossRef]
  26. Şahin, A.D.; Kara, T.; Mut, A.O.; Korkmaz, M.S.; Kaymak, M.K.; Güloğlu, B. A comprehensive review of economic and policy considerations for floating photovoltaic systems: Insight on national policies and sustainable development goals. Renew. Sustain. Energy Rev. 2025, 223, 116024. [Google Scholar] [CrossRef]
  27. Hao, R.; Sun, X.; Zhao, Y.; Shang, J.; Zhu, X.; Li, H.; Liu, F. Integrating allocation methods and regional optimization in life cycle assessment of floating photovoltaics for cleaner energy transitions in China. J. Clean. Prod. 2025, 521, 146059. [Google Scholar] [CrossRef]
  28. Mishra, S.; Harish, V.S.K.V.; Saini, G. Developing design topologies and strategies for the integration of floating solar, hydro, and pumped hydro storage system. Sustain. Cities Soc. 2023, 95, 104609. [Google Scholar] [CrossRef]
  29. Liu, L.; Sun, Q.; Li, H.; Yin, H.; Ren, X.; Wennersten, R. Evaluating the benefits of integrating floating photovoltaic and pumped storage power system. Energy Convers. Manag. 2019, 194, 173–185. [Google Scholar] [CrossRef]
  30. Pali, B.S.; Vadhera, S. A novel approach for hydropower generation using photovoltaic electricity as driving energy. Appl. Energy 2021, 302, 117513. [Google Scholar] [CrossRef]
  31. Wang, G.; Wang, X.; Chen, T. Mapping the potential: A GIS-based approach to assessing floating solar resources for rural electrification in Cambodia. Energy Sustain. Dev. 2025, 87, 101724. [Google Scholar] [CrossRef]
  32. Kumar, M.; Niyaz, H.M.; Gupta, R. Challenges and opportunities towards the development of floating photovoltaic systems. Sol. Energy Mater. Sol. Cells. 2021, 233, 111408. [Google Scholar] [CrossRef]
  33. Ramanan, C.J.; Lim, K.H.; Kurnia, J.C.; Roy, S.; Bora, B.J.; Medhi, B.J. Towards sustainable power generation: Recent advancements in floating photovoltaic technologies. Renew. Sustain. Energy Rev. 2024, 194, 114322. [Google Scholar] [CrossRef]
  34. Garrod, A.; Hussain, S.N.; Ghosh, A.; Nahata, S.; Wynne, C.; Paver, S. An assessment of floating photovoltaic systems and energy storage methods: A comprehensive review. Results Eng. 2024, 194, 114322. [Google Scholar] [CrossRef]
  35. Manolache, A.I.; Andrei, G.; Rusu, L. An evaluation of the efficiency of the floating solar panels in the western Black Sea and the Razim–Sinoe lagunar system. J. Mar. Sci. Eng. 2023, 11, 203. [Google Scholar] [CrossRef]
  36. Popa, B.; Vuță, L.I.; Dumitran, G.E.; Picioroagă, I.; Călin-Arhip, M.; Porumb, R.-F. FPV for sustainable electricity generation in a large European city. Sustainability 2022, 14, 349. [Google Scholar] [CrossRef]
  37. Hidroelectrica (Bucharest, Romania). Annual Report 2023 of the Electricity Production Company in Hydropower Plants. 2024. Available online: https://www.hydro.com.au/about-us/our-governance/annual-report (accessed on 28 May 2025).
  38. SMHI Hypeweb. Available online: https://hypeweb.smhi.se/explore-water/historical-data/europe-time-series/ (accessed on 10 March 2025).
  39. Open-Meteo. Available online: https://open-meteo.com/en/docs/historical-weather-api (accessed on 10 March 2025).
  40. Power plant profile: Rusanesti, Romania. Available online: https://www.power-technology.com/data-insights/power-plant-profile-rusanesti-romania/ (accessed on 20 May 2025).
  41. Power plant profile: Izbiceni, Romania. Available online: https://www.power-technology.com/data-insights/power-plant-profile-izbiceni-romania/ (accessed on 20 May 2025).
  42. Power plant profile: Frunzaru, Romania. Available online: https://www.power-technology.com/data-insights/power-plant-profile-frunzaru-romania/ (accessed on 20 May 2025).
  43. Power plant profile: Ipotesti, Romania. Available online: https://www.power-technology.com/data-insights/power-plant-profile-ipotesti-romania/ (accessed on 20 May 2025).
  44. România Geografică. Available online: https://romaniadategeografice.net/hidrografie/lacuri/lacuri-z/ (accessed on 20 May 2025).
  45. Saab, S.M.; Othman, F.; Tan, C.G.; Allawi, M.F.; Sherif, M.; El-Shafie, A. Utilizing deep learning machine for inflow forecasting in two different environment regions: A case study of a tropical and semi-arid region. Environ. Sci. Pollut. Res. 2022, 12, 272. [Google Scholar] [CrossRef]
  46. Farahani, E.V.; Massah Bavani, A.R.; Roozbahani, A. Enhancing reservoir inflow forecasting precision through Bayesian Neural Network modeling and atmospheric teleconnection pattern analysis. Stoch. Environ. Res. Risk Assess. 2024, 39, 205–229. [Google Scholar] [CrossRef]
  47. Shoaib, M.; Shamseldin, A.Y.; Melville, B.W. Comparative study of different wavelet based neural network models for rainfall–runoff modeling. J. Hydrol. 2014, 515, 47–58. [Google Scholar] [CrossRef]
  48. Elmousaid, R.; Adnani, Y.; El Hamdaouy, A.; Elgouri, R. Daily Solar Radiation Prediction Using NARX and MLP-NNs Networks: A Case Study of Kenitra City Morocco; IEEE Xplore: New York, NY, USA, 2022. [Google Scholar] [CrossRef]
  49. Mohammed, S.J.; Zubaidi, S.L.; Al-Ansari, N.; Ridha, H.M.; Dulaimi, A.; Al-Khafaji, R. Application of Metaheuristic Algorithms and ANN Model for Univariate Water Level Forecasting. Adv. Civ. Eng. 2023, 9947603. [Google Scholar] [CrossRef]
  50. Chen, J.-F.; Hsieh, H.-N.; Do, Q.H. Forecasting Hoabinh Reservoir’s Incoming Flow: An Application of Neural Networks with the Cuckoo Search Algorithm. Information 2014, 5, 570–586. [Google Scholar] [CrossRef]
  51. Che Wan Zanial, W.N.; Abdul Malek, M.B.; Md Reba, M.N.; Zaini, N.; Ahmed, A.N.; Sherif, M.; Elshafie, A. River flow prediction based on improved machine learning method: Cuckoo Search–Artificial Neural Network. Appl. Water Sci. 2022, 13, 28. [Google Scholar] [CrossRef]
  52. Tong, Y.; Yu, B. Research on hyper-parameter optimization of activity recognition algorithm based on improved Cuckoo Search. Entropy 2022, 24, 845. [Google Scholar] [CrossRef]
  53. Nguyen, A.D.; Nguyen, P.L.; Vu, V.H.; Pham, Q.V.; Nguyen, V.H.; Nguyen, M.H.; Nguyen, T.H.; Nguyen, K. Accurate discharge and water level forecasting using ensemble learning with genetic algorithm and singular spectrum analysis-based denoising. Sci. Rep. 2022, 12, 19870. [Google Scholar] [CrossRef]
  54. Sheikh, M.R.; Coulibaly, P. Review of recent developments in hydrologic forecast merging techniques. Water 2024, 16, 301. [Google Scholar] [CrossRef]
  55. Chen, W.; Nguyen, K.A.; Lin, B.-S. Rethinking evaluation metrics in hydrological deep learning: Insights from torrent flow velocity prediction. Sustainability 2025, 17, 8658. [Google Scholar] [CrossRef]
  56. Lin, Y.; Wang, D.; Jiang, T.; Kang, A. Assessing objective functions in streamflow prediction model training based on the naïve method. Water 2024, 16, 777. [Google Scholar] [CrossRef]
  57. Moriasi, D.N.; Gitau, M.W.; Pai, N.; Dagupati, P. Hydrologic and water quality models: Performance measures and evaluation criteria. Trans. ASABE 2015, 58, 1763–1785. [Google Scholar] [CrossRef]
  58. SAM—System Advisor Model. Available online: https://sam.nrel.gov/download.html (accessed on 15 June 2025).
  59. Venturini, P.; Gagliardi, G.G.; Agati, G.; Cedola, L.; Migliarese Caputi, M.V.; Borello, D. Integration of Floating Photovoltaic Panels with an Italian Hydroelectric Power Plant. Energies 2024, 17, 851. [Google Scholar] [CrossRef]
  60. Global Solar Atlas. Available online: https://globalsolaratlas.info/map?c=43.824372,24.662247,11&s=43.824549,24.66171&m=site (accessed on 25 June 2025).
  61. Google Earth. Available online: https://earth.google.com/web/ (accessed on 25 June 2025).
  62. Curtea de Conturi a României. Available online: https://www.curteadeconturi.ro/ce-facem/raport-public-anual (accessed on 2 September 2025).
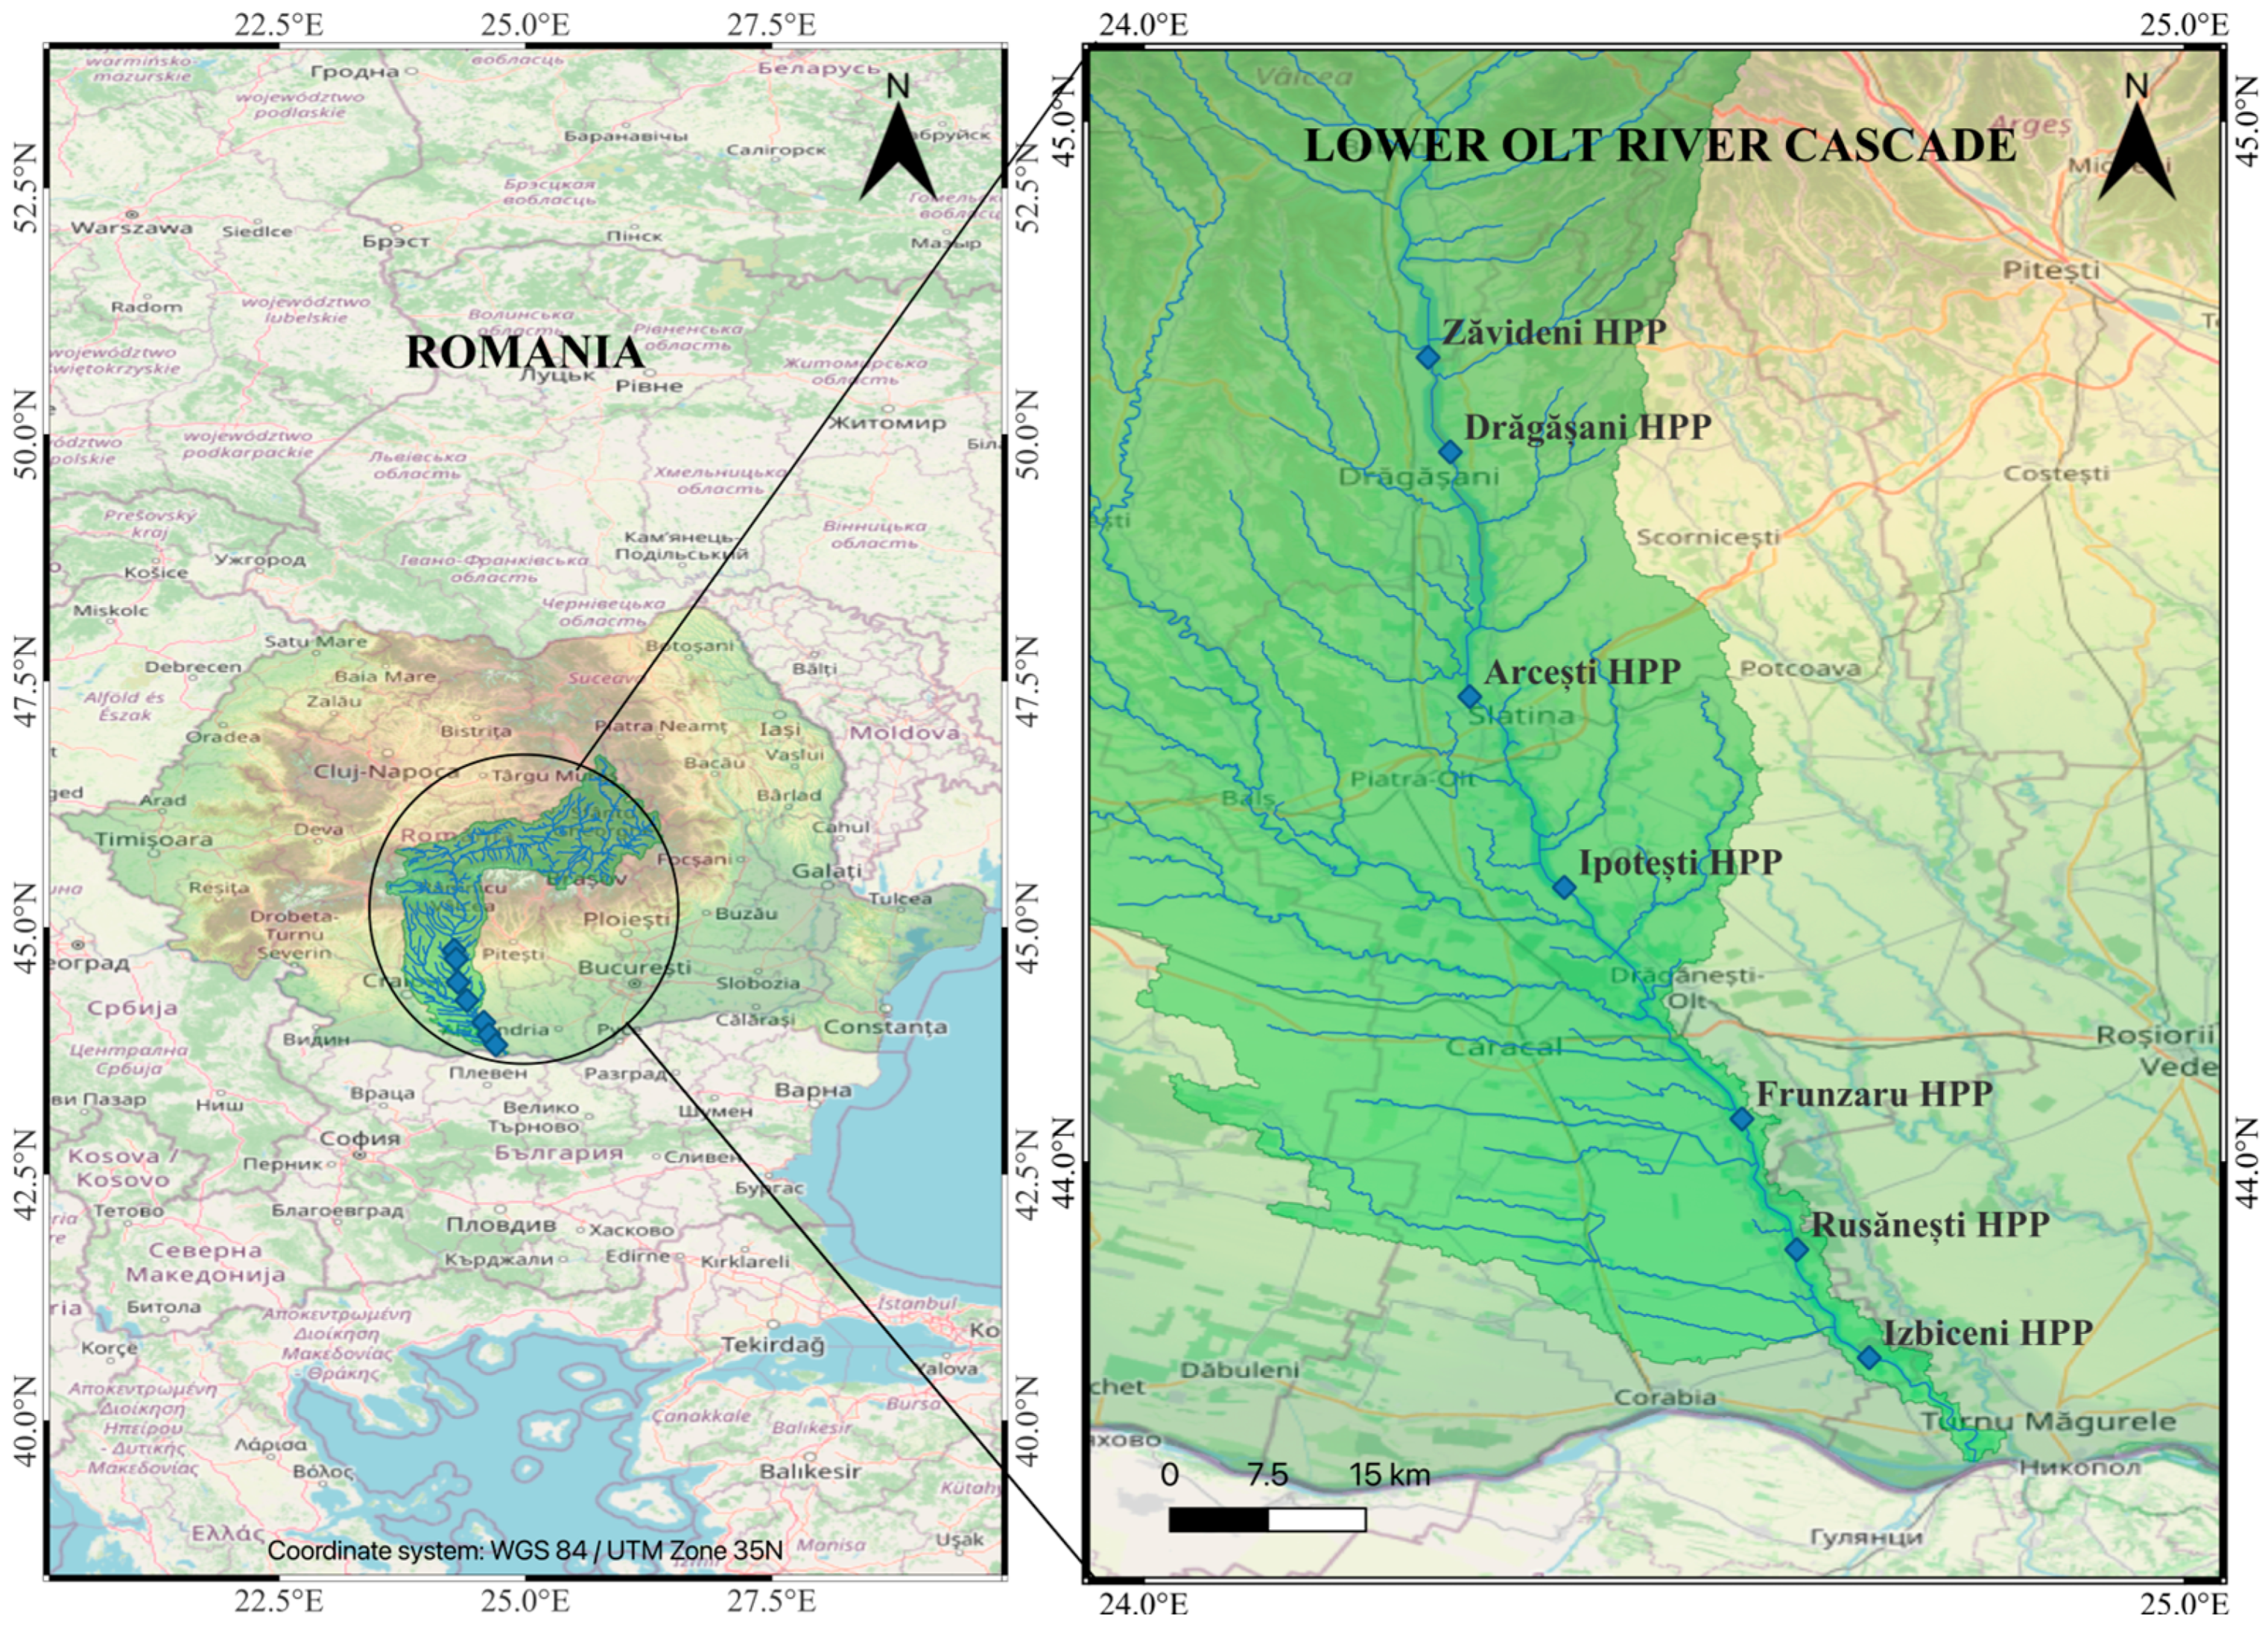
Figure 1. Lower Olt River selected for FPV installation: Zăvideni, Drăgășani, Arcești, Ipotești, Frunzaru, Rusănești, and Izbiceni reservoirs with related HPPs (source QGIS 3.42).
Water 17 03144 g001
Figure 2. Selected sub-basin of the Olt River used as input for the simulated discharge series obtained from the SMHI HYPEweb model (reference inflow to the Zăvideni reservoir) [38].
Water 17 03144 g002
Figure 3. Comparison between observed and simulated inflows for 2010 (1 day-ahead).
Water 17 03144 g003
Figure 8. Comparison of the two Renewable Energy Generation Profiles: hydropower and FPV.
Water 17 03144 g008
Figure 9. Electricity Price Forecast for the Settlement of Bilateral Contracts.
Water 17 03144 g009
Table 1. Average discharge values (m3/s) for each HPP, for the period July—September 2025.
ReservoirAverage Turbined Discharge (m3/s)Average Discharge Withdrawn from Reservoir (m3/s)Average Spilled Discharge (m3/s)
Zăvideni70.8400
Drăgășani63.7600
Arcești61.093.710
Ipotești55.080.10
Frunzaru49.580.010
Rusănești44.630.010
Izbiceni36.140.440
Table 2. Total monthly energy generation, [GWh].
MonthJulyAugustSeptember
Energy44.9141.5774.15
Table 3. Parameters of the analyzed HPPs.
ReservoirQi (m3/s)Pi (MW)Ean (GWh)Imposed Energy Production (GWh)
JulyAugustSeptember
Zăvideni330381208.48.49
Drăgășani330451409.89.810.5
Arcești330381228.548.549.15
Ipotești50053986.866.867.35
Frunzaru500531047.287.287.8
Rusănești500531037.217.217.73
Izbiceni500531037.077.077.58
TOTAL---55.1655.1659.1
Table 4. Data related to FPV.
ReservoirReservoir Area
(ha)
FPV Panels Area
(ha)
FPV Coverage
(%)
FPV Power
(MW)
Zăvideni84011513.69242
Drăgășani90010211.33225
Arcești80010713.38225
Ipotești1400976.93204
Frunzaru970899.18187
Rusănești1100746.73162
Izbiceni88011913.52255
TOTAL6890703Mean = 10.681500
Table 5. Comparison of Annual Energy Production Estimates: SAM vs. GSA (2025).
ReservoirFPV Capacity
(MWp)
Annual Production
SAM (GWh)
Annual Production
GSA (GWh)
SAM/GSA
(%)
Zăvideni242310.7272.312.31
Drăgășani225290.8254.112.45
Arcești225298.0256.014.96
Ipotești204256.9233.814.34
Frunzaru187253.3206.618.33
Rușănești162217.0185.514.35
Izbiceni255348.4258.815.75
TOTAL15001975.51667.1-
Table 6. Energy generation in HPPs and FPV plants, in [GWh].
Power PlantJulyAugustSeptember
HPP—scenario 144.9141.5774.15
HPP—scenario 255.1655.1659.10
FPV265.00223.70172.40
TOTAL—scenario 1309.91265.27246.55
TOTAL—scenario 2320.16278.86231.50
Table 7. Projected revenues from the sale of electricity generated by the hydropower source, based on a settlement price of 770 RON/MWh.
Revenue Collected (mil. RON)JulyAugustSeptemberTotal
HPP—scenario 134.5832.0157.10123.69
HPP—scenario 242.4742.4745.51130.45
Table 8. Revenue generated from the sale of hybrid power plant energy generation, in [RON].
Type of ContractJulyAugustSeptemberTotal 3 Months
PBC hydro1,265,9701,149,4791,942,5574,358,006
VPPA FPV9,345,5965,725,9235,725,92320,797,442
TOTAL10,611,5666,875,4027,668,48025,155,448
Disclaimer/Publisher’s Note: The statements, opinions and data contained in all publications are solely those of the individual author(s) and contributor(s) and not of MDPI and/or the editor(s). MDPI and/or the editor(s) disclaim responsibility for any injury to people or property resulting from any ideas, methods, instructions or products referred to in the content.