Abstract
For the design of stormwater pumping stations, there is often uncertainty regarding the selection of an appropriate rainfall event to determine the required pumping capacity and temporary storage volume for managing extreme events of a given magnitude. To account for the risk of system failure, the return period is considered, as recommended based on the size of the catchment’s drainage area or other considerations, depending on the local regulations of a country. This study focused on analysing the direct runoff volume from the catchment, the storage volume required for the operation of the pumping system, and the order of magnitude of the design flow rate. The results indicate that a rainfall event with a duration of at least twice the time of concentration should be used. The design flow rate should range between 50% and 70% of the peak discharge, and designing for flow rates near the peak is not advisable, as it can lead to intermittent pump operation and result in an oversized installed capacity. The methodology developed in this research was applied to the Coastal Protection Project located in the city of Cartagena, Colombia, which includes a 2045.6-m-long box culvert with a cross-sectional area of 2 × 2 m, and three pumping stations, each equipped with three pumps rated at 0.75 m3/s, for a total installed capacity of 6.75 m3/s.
1. Introduction
In the design of stormwater pumping stations, it is essential to account for the storage effect provided by the perimeter of conveyance conduits and wet wells. This consideration enables the optimisation of both capital and operational expenditure. By incorporating the transient storage capacity of these elements, peak inflow rates can be attenuated, thereby reducing the required installed capacity of pumps, pipelines, and associated hydraulic appurtenances such as valves. This reduction in peak design discharge often allows for fewer pump units to be installed, which in turn leads to lower energy consumption, reduced maintenance requirements, and extended equipment lifespan.
For system sizing, it is necessary to establish the interrelationship between the following parameters [1,2]:
- The inflow hydrograph (total runoff volume) corresponding to a selected return period.
- The adequate storage volume available within conduits and wet wells.
- The stage–discharge relationship of the pumping system.
Once these relationships are defined, a flood routing analysis is undertaken, treating both conduits and wet wells as integral storage reservoirs within the hydraulic network. This approach provides a more accurate representation of the system’s transient behaviour during storm events. Figure 1 illustrates the hydrograph routing methodology applied to such systems.
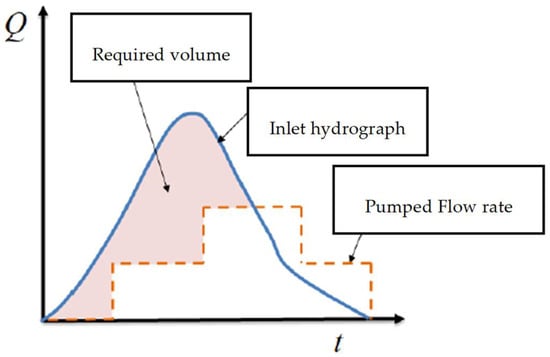
Figure 1.
Inflow and outflow hydrographs illustrating a typical flood-routing sequence within a stormwater pumping station system.
Currently, numerous technical manuals are available for sizing the various components of pumping stations. These documents address the civil, mechanical, and electrical aspects as well as the specification of appropriate instrumentation for data acquisition and transmission [1,3].
Historically, research efforts were directed towards achieving optimal designs for stormwater pumping stations serving small catchments, lowland areas, and systems ranging from small to medium capacity [4,5,6]. More recent studies have focused on jointly determining the appropriate pumped flow rates and controlling pollutant loads [7]. Furthermore, current research emphasises reducing both the energy consumption and maintenance costs by applying genetic algorithms and machine learning techniques to optimise pumping station operation [8,9].
Yazdi, Choi, and Kim (2016) [10] demonstrated that optimal operational strategies can reduce the peak water levels by as much as 40% in case studies, while maintaining the same number of pump start–stop cycles. Li et al. (2024) [11] combined a hydrodynamic model with evolutionary algorithms to optimise stormwater pumping station operations, while Wang et al. (2019) [12] applied the particle swarm optimisation algorithm, in conjunction with the SWMM software package (version 5.2.4), to determine the optimal pump start-up depth.
Computational fluid dynamics (CFD) has also been applied to the study of pumping stations, enabling the analysis of local hydraulic effects such as those produced by 90° lateral inlets, variable geometric configurations, and lateral flow diversions [13,14,15]. However, it should be noted that CFD modelling of pumping stations is computationally intensive, often requiring significant processing time.
Tse (2024) [16] provided a checklist of design considerations for pumping stations in the industrial sector, drawing attention to the impacts of climate change and energy use. Recently, several authors have examined the uncertainty associated with the selection of design rainfall events [17,18,19]. In this context, quantifying the temporal and spatial resolution of rainfall in urban environments is of paramount importance to reduce the risk of flooding [20,21]. In addition, several investigations have demonstrated that non-stationary conditions can be observed in regions worldwide due to climate or anthropogenic change, resulting in higher or lower magnitudes of rainfall–runoff events associated with different return periods [22].
Traditionally, the design of stormwater pumping stations follows established hydrological guidelines that recommend a minimum pump operating time and typically rely on the rational method to determine the design discharge. This approach is based on the peak flow, which results in an intermittent pumping regime. Consequently, pumping stations are often oversized—leading to large, costly infrastructures that remain idle for most of the time—or, alternatively, undersized when the system’s storage capacity is insufficient to accommodate long-duration rainfall events.
The novelty of the proposed methodology lies in linking the pumping capacity directly to the characteristics of the design rainfall rather than relying solely on the peak discharge estimated by the rational method. By considering the temporal distribution of rainfall and the associated runoff volume, this approach avoids the limitations of a peak-based design, which provides only an instantaneous flow rate without reflecting the actual hydrological response of the catchment. As a result, the methodology enables a more realistic estimation of pumping requirements, reduces the risk of overdimensioning, and ensures that the storage and pumping capacity are better matched to the variability of rainfall events. This represents a departure from conventional guidelines, offering a more efficient and adaptive design framework for stormwater pumping stations
The present study addresses one of the principal sources of uncertainty in the design of stormwater pumping stations: the selection of the temporal and spatial characteristics of rainfall events. This aspect is critical for determining both the required pumping capacity and the storage volume necessary to prevent flooding in urban drainage systems. In such analyses, the choice of return period is essential and is typically defined by national or regional regulatory frameworks. The research focused on identifying the critical rainfall distribution for pumping station design, which is fundamental for calculating the design flow. To this end, a methodology was proposed in this research and applied to the case study of the Coastal Protection Project.
2. Materials and Methods
This section presents the methodology employed in this research to select the critical rainfall distribution required for sizing stormwater pumping stations, which in turn was used to determine the design flow. It is important to emphasise that a low design flow in pumping stations leads to a higher storage volume, whereas a high design flow results in short pumping cycles, causing intermittent operation. Figure 2 presents the steps of the proposed methodology. Sanitary loads are not considered in the proposed methodology.
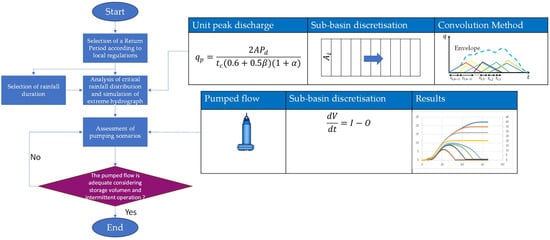
Figure 2.
Proposed methodology in this research.
2.1. Definition of a Return Period
The return period must be defined by local regulations and the nature of the project, based on a cost–benefit or risk analysis. This depends on the probability of occurrence and is expressed as:
where is the return period and is the probability of the occurrence of an extreme event.
For this analysis, the return period for the design storm was determined, and the scenario outlined below was considered.
2.2. Analysis of Critical Rainfall Distribution and Simulation of Extreme Hydrographs
The computation of extreme hydrographs was performed employing the methodology proposed by Arrieta-Pastrana et al. (2025) [23], which is based on the principles of proportionality and superposition. The hydrological method makes use of a dimensionless triangular unit hydrograph, derived by ensuring consistency between the runoff volume and the effective precipitation across the basin. The formulation of the unit peak discharge was demonstrated by the authors in Reference [23] and can be computed as follows:
where denotes to the unit peak discharge, is the catchment area, is the effective rainfall depth, is the time of concentration of a sub-basin, and and are coefficients with values of 1.67 and 0.10, respectively.
The convolution method was then applied, considering all sub-basins with their corresponding travel times. For the following analysis, a catchment with an area was discretised into 10 sub-catchments, each representing 10% of the total area and uniformly distributed. The choice of a 10% sub-catchment discretisation is intended to reflect the geomorphological characteristics of the basin while also accounting for the spatial variability of rainfall. By dividing the catchment into relatively small units, it becomes possible to superimpose the individual responses and thereby examine the combined effects of area and time on the hydrograph. This approach enables a more detailed assessment of how localised rainfall events propagate through the system, allowing the resulting hydrographs to capture variability in both spatial distribution and temporal response [23]. Consequently, the discretisation enhances the representation of hydrograph shapes by highlighting differences that might otherwise be obscured in a more aggregated model.
The unit of discretization is defined, which corresponds to the time interval used in the design hyetograph. The time of concentration () was assumed to be equal to . The time to peak and the base time were defined as described by Reference [23]. The duration of the rainfall was . A uniform rainfall intensity was assumed for the entire duration of the event with a direct precipitation () in each time interval.
Four rainfall duration scenarios were considered: , , , and . The time of concentration was varied from up to to capture not only the moment associated with the maximum peak discharge (at ), but also longer durations that may contribute a greater runoff volume to the pumping station [24].
The resulting hydrographs for each scenario are shown in Figure 3, generated using the methodology described in Section 2.2. The peak flow rate for the -duration storm was 0.7 (expressed in unitary terms: per unit area, unit rainfall depth, and per unit of time tr). For the storms with durations of , , and , the peak flow rate reached a value of 1. However, the corresponding direct runoff volumes differed 20, 30, and 40, respectively. This variation highlights the need to determine both the required storage volume and the pumping system capacity.
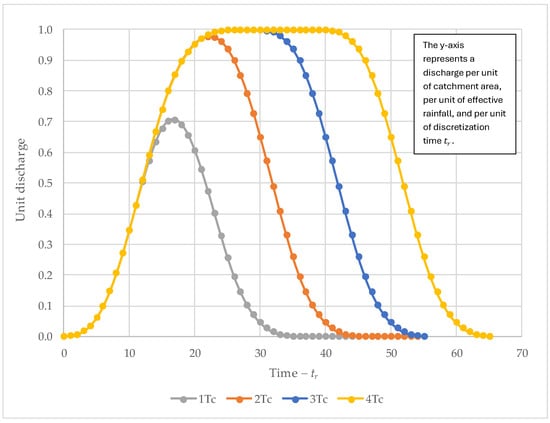
Figure 3.
Comparison of direct runoff hydrographs corresponding to varying design rainfall durations.
2.3. Assessment of Pumping Scenarios with Uniform Rainfall
Conduits and wet walls act as a reservoir, so the general storage equation is given by ref. [25]:
where denotes the change in storage, is the time increment, represents the inflow hydrograph, and represents the outflow hydrograph (which depends on the capacity of a pumping station).
The first simulation scenario involves designing the pumping system based on a flow rate equal to 100% of the peak discharge, as defined by the envelope of the hydrographs for rainfall durations of , , , and . Figure 4a presents the results for a pumping system operating with a capacity of one unit. The accumulated volumes of direct runoff and the corresponding storage volumes are shown for each of the selected rainfall durations (, , , and ). The simulation results revealed intermittent storage behaviour across all rainfall durations, indicating that the pumps undergo very short on/off cycles. Due to this operational inefficiency, this design alternative is not recommended.
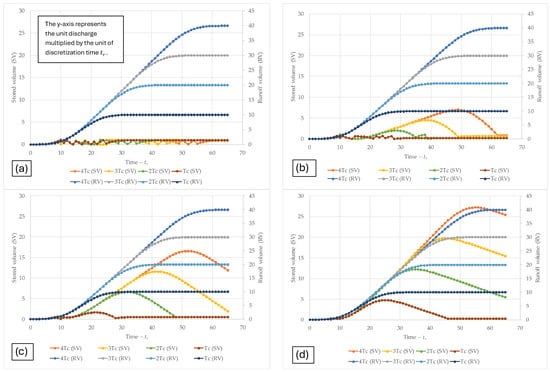
Figure 4.
Cumulative runoff and storage volume curves for a pumping system designed to operate at: (a) 100% of the peak flow rate; (b) 75% of the peak flow rate; (c) 50% of the peak flow rate; and (d) 25% of the peak flow rate.
Figure 4b–d presents the results of different pumping scenarios based on uniform rainfall durations of , , , and . Figure 4b shows the cumulative runoff volumes and corresponding storage requirements for each scenario when the pumping capacity was set at 75% of the peak flow rate. The results indicate stable pump operation for storms of duration , , and . However, for shorter rainfall events (), the storage behaviour became intermittent, revealing an oversized pumping system.
Similar trends were observed in Figure 4c, where the pumping capacity was reduced to 50% of the peak flow. In this case, stable storage behaviour was observed across all rainfall durations (, , , and ), with an increase in the maximum storage volume and pumping duration. This led to more consistent and efficient operation of the pumping system. Figure 4d presents the results for a pumping capacity of 25% of the peak flow rate. The system demonstrated stable storage and pump operation, although it required significantly larger storage volumes and longer pumping times.
Table 1 summarises the required storage volumes for each pumping scenario. When the pumping system was designed at 100% of the peak flow, the required storage was minimal, representing only 2.5% of the direct runoff volume for the rainfall duration. For 75% pumping capacity, storage requirements increased to 17.5%; for 50%, to 41.5%; and for 25%, to 68%. Ultimately, the design choice depends on the trade-off between available storage capacity, the cost of the pumping infrastructure, and the energy availability for system operation.

Table 1.
Maximum required storage volumes corresponding to each pumping scenario.
3. Results and Discussion
The proposed methodology in this research was applied to two situations, which are described in the following subsections.
3.1. Pumping Scenarios Considering Extreme Rainfall Events
For this analysis, the intensity–duration–frequency (IDF) curves of the Rafael Núñez Airport synoptic station (code: 14015080) located in Cartagena de Indias (Colombia) were employed. This station is operated by the Institute of Hydrology, Meteorology, and Environmental Studies of Colombia (IDEAM). These curves are discussed in References [25,26], as follows:
where = rainfall intensity (mm/h), = return period (years), and t = rainfall duration (min).
Figure 5 illustrates the temporal distribution of rainfall for the Rafael Núñez Airport station in Cartagena. The blue line represents the rainfall depth (in mm) for a 100-year return period. The orange line shows the average rainfall per interval, assuming a total of 40 units of precipitation distributed evenly over 40 time intervals ( units).
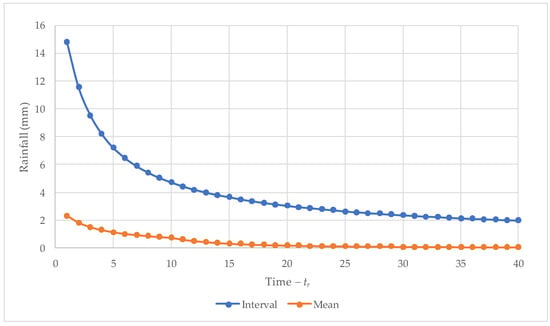
Figure 5.
Temporal distribution of rainfall intensity for a 100-year return period.
Figure 6 presents the estimated hydrographs for rainfall durations of , , , and . The results show that the peak discharge for was 1.455, while for , , and , the peak value increased slightly to 1.53. Due to the non-uniform distribution of rainfall intensity over time, the total storage volumes required varied across the different rainfall durations: 39.91 for , 34.91 for , 28.80 for , and 20.38 for .
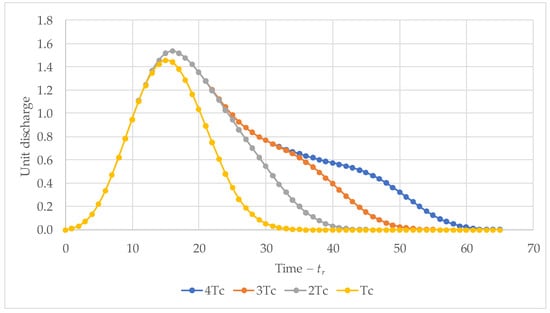
Figure 6.
Design rainfall hyetograph for a 100-year return period corresponding to durations of , , , and .
In the first simulation scenario, the pumping flow rate was set to 100% (1.53 units) of the peak discharge from the envelope of the hydrographs for the various rainfall durations. The results, shown in Figure 7a, revealed intermittent storage behaviour for all rainfall scenarios. This outcome indicates frequent on/off pump cycling, reflecting the inefficiency of the pumping system under this condition. As such, this design alternative was not considered viable, as it results in operational issues and requires a significantly oversized installed capacity. Figure 7b shows the results of the second simulation scenario using a pumping flow rate of 95% (1.455 units), equivalent to the peak discharge associated with the duration. Although this value was very close to the overall envelope peak flow, the system still exhibited intermittent storage and pumping behaviour. Consequently, this alternative was also deemed operationally unfeasible. Figure 7c presents the simulation results for a pumping flow rate of 75% (1.1475 units) of the peak discharge. The results showed intermittent pumping and storage behaviour, particularly at the beginning and end of the rainfall events. This effect was more pronounced for the duration, where the pump operation was notably less stable. Figure 7d shows the results for a reduced pumping flow rate of 50% (0.765 units). In this case, both storage and pumping were stable, with increased storage volumes and longer pumping durations observed across all rainfall scenarios. Figure 7e corresponds to a pumping flow rate of 25% (0.385 units). The system again exhibited stable storage and pump operation. However, the required storage volume and pumping duration were significantly greater than in the previous scenarios.
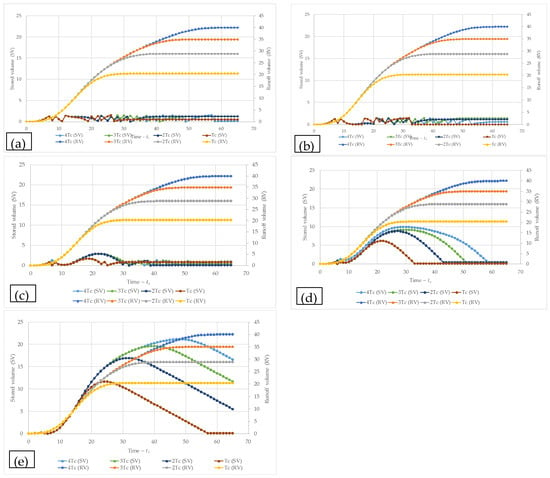
Figure 7.
Cumulative runoff and storage volume curves for a pumping system operating at: (a) 100% of the peak flow rate (1.53 units); (b) 95% of the peak flow rate (1.455 units); (c) 75% of the peak flow rate (1.1475 units); (d) 50% of the peak flow rate (0.765 units); and (e) 25% of the peak flow rate (0.385 units).
Table 2 summarises the relationship between the maximum storage volume and the direct runoff volume for a rainfall duration. The 100% and 95% pumping flow rate alternatives are not recommended due to the high level of intermittency in pump operation. The 75% alternative exhibited some intermittency at the beginning and end of the pumping period, with stable behaviour during the central portion. In this case, the required storage volume was approximately 7% of the total runoff volume. The 50% pumping scenario demonstrated good operational stability and required a storage volume equal to 25% of the total runoff. Finally, the 25% alternative offered very stable pump operation, but demanded a significantly larger storage volume—around 53% of the runoff volume.

Table 2.
Summary of the storage and pumping capacity performance.
3.2. Application to a Case Study: Coastal Protection Project in Cartagena de Indias, Colombia
The stormwater storage and pumping system designed for the Coastal Protection Project, currently under construction in Cartagena de Indias, Colombia, was used here as a case study for evaluation and comparison. This project, developed by the Universidad de Cartagena (Colombia) [27], aims to prevent coastal erosion and mitigate urban flooding in the Bocagrande neighbourhood. It will provide adequate drainage for a total area of 30.80 hectares including the local beach areas, thereby reducing the flood risk in the sector. Figure 8 shows the location of the area to be drained, with the total catchment area highlighted in purple. To apply the hydrological model proposed by Arrieta-Pastrana et al. (2025) [23], the catchment was discretised as outlined in Table 3. According to Arrieta-Pastrana et al. (2022), no evidence of climate change effects was found in the precipitation data series [28].
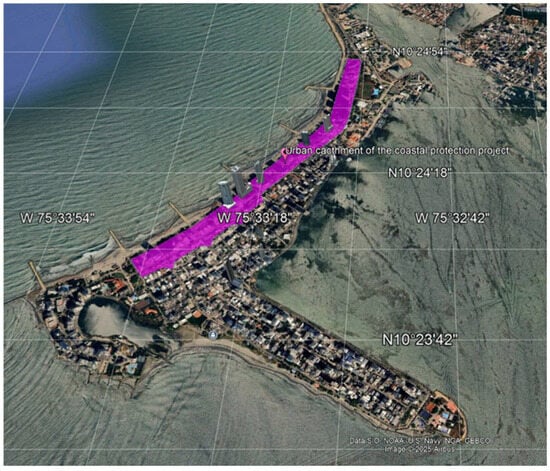
Figure 8.
Catchment area for the Coastal Protection Project in Cartagena de Indias, Colombia.

Table 3.
Discretisation of the sub-basin for the hydrological model.
The system consists of a longitudinal box culvert measuring 2045.63 m in length (Figure 9) and three pumping stations (Figure 10). Figure 10 has been adapted from the construction drawings of the Coastal Protection Project designed by the Universidad de Cartagena [27]. The box culvert has an internal cross-section of 2 m × 2 m and provides a total surface storage area of 4582 m2 including the storage of the pumping stations. Each pumping station is equipped with three pumps, each with an individual capacity of 0.75 m3/s, giving a combined installed capacity of 6.75 m3/s across the nine pumps in total. The pumps have been designed to stop at a water level of 0.0 m and start at 1.0 m during the operational stage. The control method is level-based and does not directly depend on storm characteristics. When the water level reaches the defined threshold, the system switches on and subsequently stops once the lower level is reached. Even in the absence of storms, infiltration or base flows may still trigger intermittent pump operation. During dry periods, the pumping system must also be exercised manually by opening the return valves connected to the sea. Once the system has been filled, the pumps are run in short cycles to evacuate the storage volume. This operation is repeated periodically to avoid pump deterioration caused by sulphation, obstruction, sediment accumulation, or crystallisation when the equipment remains in standby.
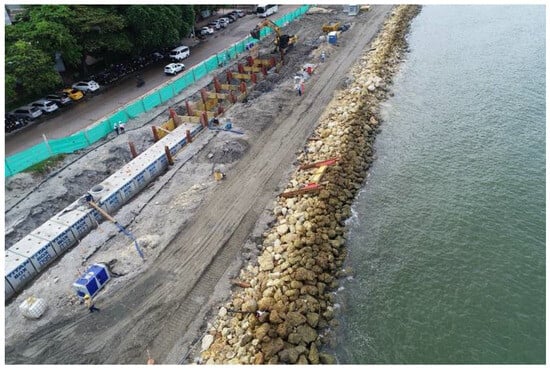
Figure 9.
Photograph of the initial section of the box culvert installed along the shoreline of Bocagrande Beach in Cartagena de Indias.
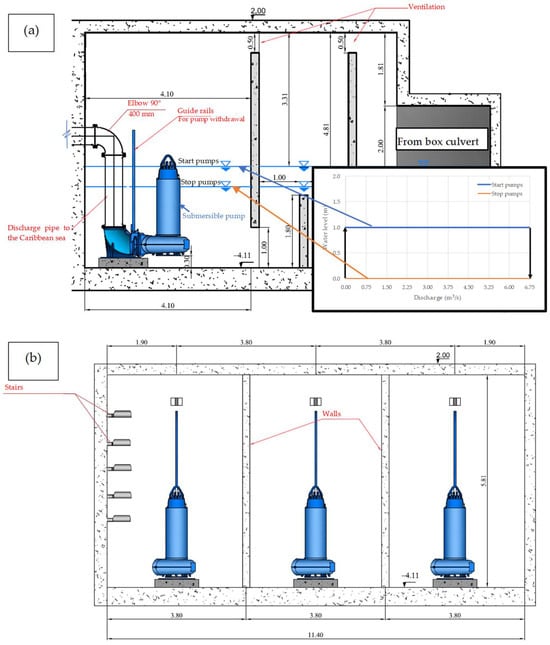
Figure 10.
Representative cross-sectional elevations of the pumping station for the case study: (a) elevation view 1 and (b) elevation view 2.
The effective storage volume of the system is 9164 m3. The project adopts a time of concentration of 30 min, which includes the times associated with catchment areas and the interior of the box culvert. A 50-year return period was used, with a runoff coefficient of 0.9. This return period was selected in accordance with Colombian regulations [29], as the catchment area falls within the range of 10 to 1000 ha. Figure 11 illustrates the stage–storage curve for the project, considering the storage capacity of the box culvert, the three pumping stations, and the total volume, defined as the sum of the storage within the box culvert and the pumping stations.
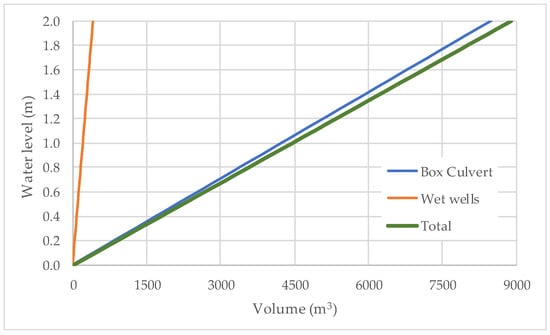
Figure 11.
Stage–storage curve for the case study.
The design storm was based on a one-hour rainfall equivalent to . A time to peak of 48 min and a peak discharge of 13.17 m3/s were estimated. The pumping system’s design discharge corresponded to 51.3% of the peak discharge from the one-hour hydrograph ().
The estimated storage volume was 7128.53 m3. The hydrograph estimation was performed using the alternating block method, with the inflow hydrograph as the basis. Table 3 presents the configuration of inflow areas. The discretisation time, , was three (3) minutes.
Figure 12 presents the resulting hydrographs for the Coastal Protection Project in Cartagena de Indias, Colombia. The enveloping peak discharges for , , and were 9.77 m3/s, while for , the value was slightly lower at 9.50 m3/s. However, using the alternating block method, the peak discharge reached 11.41 m3/s, which was 17% higher than the enveloping value. The alternating block method is less representative of real conditions, as it is generated by centring the maximum values within the hydrograph, which leads to higher peak discharges.
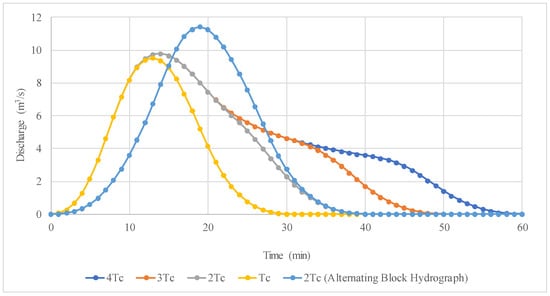
Figure 12.
Rainfall hydrograph for a 50-year return period and durations of , , , and .
The results shown in Figure 13 indicate a maximum storage volume of 5243 m3 for rainfall durations of , , and ; 3728 m3 for ; and 7046 m3 when applying the alternating block hydrograph method.
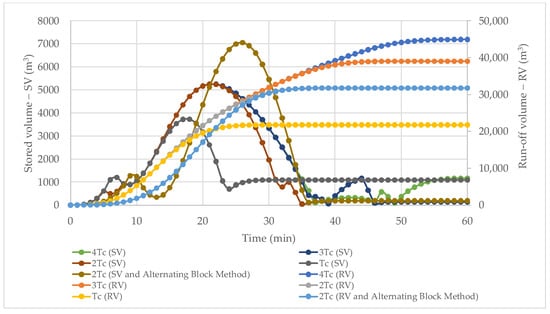
Figure 13.
Runoff volume and storage volume curves for the Bocagrande pumping discharge of 6.75 m3/s, corresponding to 69% of the peak discharge.
Table 4 summarises the storage volume required for each design storm duration scenario. The ratio between the design discharge and the peak discharge of the enveloping hydrograph ranged from 69% to 71%, while for the alternating block method, the ratio was 59%.

Table 4.
Summary of the pumping capacity and storage for each scenario.
The pumping system only operates for a limited number of hours each year. According to rainfall statistics from IDEAM, between April 1971 and September 2025, the Rafael Núñez Airport synoptic station recorded an average of 99 rainy days per year, with individual events generally lasting less than one hour. Figure 14 presents the exceedance probability curve of daily rainfall, where the 10-year return period (148 mm) corresponds to an exceedance probability of 0.054%. Consequently, energy consumption is minimal and operational costs are negligible. The system therefore serves primarily as a standby measure to mitigate emergency situations, with its operation being sporadic rather than continuous.
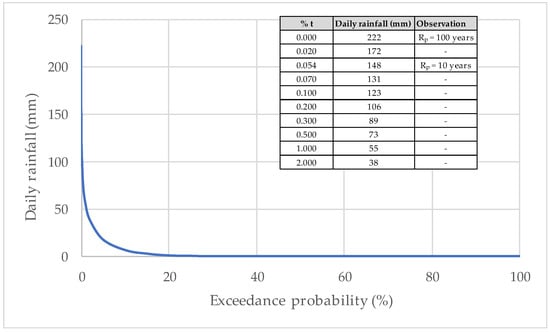
Figure 14.
Exceedance probability curve of daily rainfall events at the Rafael Núñez Airport synoptic station.
3.3. Discussion About the Methodology
3.3.1. Time Step Variation
In this section, the analysis of the time step during simulation was conducted considering the previous methodology developed by the authors [23]. Two simulations were carried out considering a rainfall event with a duration of and a total precipitation of 20 units. In Alternative 1, each was divided into 10 intervals, with a rainfall depth of one unit per interval (). In Alternative 2, each was divided into 5 intervals of , with a rainfall depth of two units per interval.
The results are presented in Figure 15, where the improved continuity of the solution can be observed for the interval. The calculation time step () determines the accuracy of the solution: the smaller the time step, the more convergent the solution becomes.
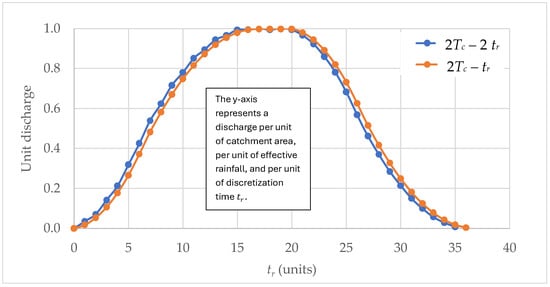
Figure 15.
Analysis of time step () during the simulations.
3.3.2. Analysis of Pumped Capacity
Figure 16 examines the performance of all pumps over a rainfall duration of . When operating at full capacity, the pumps exhibited multiple cycles (intermittent events). In contrast, a pumping capacity between 50% and 75% of the total flow was identified as the most suitable operational range. The assessment was based on a theoretical analysis under uniform rainfall conditions, highlighting the overall operability of the system. Conversely, operating at 25% of the total pumping capacity resulted in a longer simulation duration and a greater stored volume.
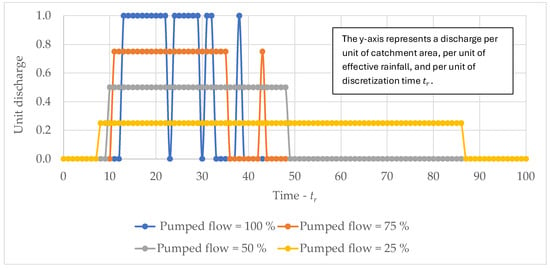
Figure 16.
Cycles of the pumping system.
3.3.3. Guidelines Applicable to Practitioners
As part of its applicability for engineers and designers, Table 5 summarises the steps to be followed when applying the guidelines developed in this research for the design of stormwater pumping stations.

Table 5.
Practical design guidelines applicable to practitioners.
Table 6 presents the results of this research considering different pumping capacity scenarios as a function of the peak flow.

Table 6.
Pros and cons for the pumping capacity scenario.
4. Conclusions
This study establishes essential hydrological criteria for the design of stormwater pumping stations. The analysis demonstrates that the selection of a design storm for sizing both the pumping capacity and temporary storage volume should consider a duration of at least twice the time of concentration (), as this ensures the capture of substantial volumes of direct runoff, which are critical for accurate system sizing.
The results indicate that the design discharge should range between 50% and 70% of the peak discharge from either the enveloping hydrograph or the hydrograph. Designing for discharges close to the peak flow (100% or 95%) is discouraged, as it results in intermittent pump operation and an oversized installed capacity, leading to reduced operational efficiency.
The selected pumping capacity has a direct impact on storage performance and operational stability. Lower percentages of the peak discharge require greater storage volumes. In comparison, higher percentages reduce storage needs but may introduce operational intermittency for shorter storm events or under non-uniform rainfall distribution.
Author Contributions
Conceptualization, A.A.-P.; Methodology, A.A.-P. and O.E.C.-H.; Formal analysis, A.A.-P.; Writing—original draft preparation, O.E.C.-H. and A.A.-P.; Writing—review and editing, V.S.F.-M.; Supervision, A.A.-P. and V.S.F.-M. All authors have read and agreed to the published version of the manuscript.
Funding
This research received no external funding.
Data Availability Statement
The original contributions presented in this study are included in the article. Further inquiries can be directed to the corresponding author.
Acknowledgments
The authors thank the Universidad de Cartagena for providing the information for this research.
Conflicts of Interest
The authors declare no conflicts of interest.
References
- Smith, P. Highway Stormwater Pump Station Design. Hydraulic Engineering Circular No. 24. Publication No. FHWA-NHI-01-007; Federal Highway Administration: Washington, DC, USA, 2001.
- Baumgardner, R.H. Hydraulic Design of Stormwater Pumping Stations: The Effect of Storage. Transp. Res. Rec. 1984, 948, 64–70. [Google Scholar]
- Placer County Environmental Engineering. Pump Station Design Manual; Placer County Environmental Engineering: Placer County, CA, USA, 2016.
- Froehlich, D.C. Sizing Small Stormwater Pump Stations. JAWRA J. Am. Water Resour. Assoc. 1994, 30, 1055–1062. [Google Scholar] [CrossRef]
- Kuo, J.; Yen, B.C.; Hwang, G. Optimal Design for Storm Sewer System with Pumping Stations. J. Water Resour. Plan. Manag. 1991, 117, 11–27. [Google Scholar] [CrossRef]
- Graber, S.D. Generalized Method for Storm-Water Pumping Station Design. J. Hydrol. Eng. 2010, 15, 901–908. [Google Scholar] [CrossRef]
- Ganora, D.; Isacco, S.; Claps, P. Framework for Enhanced Stormwater Management by Optimization of Sewer Pumping Stations. J. Environ. Eng. 2017, 143, 04017025. [Google Scholar] [CrossRef]
- Wang, M.; Zheng, S.; Sweetapple, C. A Framework for Comparing Multi-Objective Optimization Approaches for a Stormwater Drainage Pumping System to Reduce Energy Consumption and Maintenance Costs. Water 2022, 14, 1248. [Google Scholar] [CrossRef]
- Joo, J.G.; Jeong, I.S.; Kang, S.H. Deep Reinforcement Learning for Multi-Objective Real-Time Pump Operation in Rainwater Pumping Stations. Water 2024, 16, 3398. [Google Scholar] [CrossRef]
- Yazdi, J.; Choi, H.S.; Kim, J.H. A Methodology for Optimal Operation of Pumping Stations in Urban Drainage Systems. J. Hydro-Environ. Res. 2016, 11, 101–112. [Google Scholar] [CrossRef]
- Li, X.; Xue, S.; Hou, J.; Guo, Y.; Liu, Y.; Ma, H.; Zhang, T.; Wang, S. Hydrodynamic Model-Driven Evolutionary Algorithm-Based Operation Optimization of an Experimental Drainage Pumping Station. J. Water Clim. Change 2024, 15, 5540–5556. [Google Scholar] [CrossRef]
- Wang, H.; Lei, X.; Khu, S.T.; Song, L. Optimization of Pump Start-up Depth in Drainage Pumping Station Based on SWMM and PSO. Water 2019, 11, 1002. [Google Scholar] [CrossRef]
- Ji, R.; Xi, B.; Lian, Y.; Song, Z. A Study on the Inlet Characteristics of a 90° Lateral-Inlet Pumping Station with a Truncated River. Water 2025, 17, 1806. [Google Scholar] [CrossRef]
- Wang, C.; Zhang, Y.; Zhang, S.; Wang, X. Real-Time Prediction Method of Three-Dimensional Flow Field for Pumping Station Units Operation under Geometrically Variable Conditions Based on Reduced-Order Model and Machine Learning. Eng. Anal. Bound. Elem. 2025, 175, 106205. [Google Scholar] [CrossRef]
- Cheng, B.; Yu, Y. CFD Simulation and Optimization for Lateral Diversion and Intake Pumping Stations. Procedia Eng. 2012, 28, 122–127. [Google Scholar] [CrossRef][Green Version]
- Tse, H. Challenges for Pumping Station Design in Water Industries: An Overview of Impacts from Climate Change and Energy Crisis. Water Res. 2024, 253, 121250. [Google Scholar] [CrossRef]
- Shin, M.-J.; Kim, C.-S. Analysis of the Effect of Uncertainty in Rainfall-Runoff Models on Simulation Results Using a Simple Uncertainty-Screening Method. Water 2019, 11, 1361. [Google Scholar] [CrossRef]
- Panchanathan, A.; Ahrari, A.; Ghag, K.S.; Mustafa, S.; Haghighi, A.T.; Kløve, B.; Oussalah, M. An Overview of Approaches for Reducing Uncertainties in Hydrological Forecasting: Progress and Challenges. Earth Sci. Rev. 2024, 258, 104956. [Google Scholar] [CrossRef]
- Sharafati, A.; Doroudi, S.; Shahid, S.; Moridi, A. A Novel Stochastic Approach for Optimization of Diversion System Dimension by Considering Hydrological and Hydraulic Uncertainties. Water Resour. Manag. 2021, 35, 3649–3677. [Google Scholar] [CrossRef]
- Berne, A.; Delrieu, G.; Creutin, J.-D.; Obled, C. Temporal and Spatial Resolution of Rainfall Measurements Required for Urban Hydrology. J. Hydrol. 2004, 299, 166–179. [Google Scholar] [CrossRef]
- Blanc, J.; Hall, J.W.; Roche, N.; Dawson, R.J.; Cesses, Y.; Burton, A.; Kilsby, C.G. Enhanced Efficiency of Pluvial Flood Risk Estimation in Urban Areas Using Spatial–Temporal Rainfall Simulations. J. Flood Risk Manag. 2012, 5, 143–152. [Google Scholar] [CrossRef]
- Obeysekera, J.; Salas, J.D. Frequency of Recurrent Extremes under Nonstationarity. J. Hydrol. Eng. 2016, 21, 04016005. [Google Scholar] [CrossRef]
- Arrieta-Pastrana, A.; Coronado-Hernández, O.E.; Ramos, H.M. Simulation of Extreme Hydrographs in Heterogeneous Catchments with Limited Data. Water 2025, 17, 1713. [Google Scholar] [CrossRef]
- Texas Departament of Transportation. Hydraulic Design Manual; Texas Departament of Transportation: Austin, TX, USA, 2009.
- Coronado-Hernández, O.E.; Arrieta-Pastrana, A.; Pérez-Sánchez, M. Explicit Scheme Approach for Calculating Rainwater Harvesting: Proposed Model and Practical Application. Urban. Water J. 2025, 22, 751–760. [Google Scholar] [CrossRef]
- Almanza, L.; Martínez, O.; Velázquez, R. Prediseño Del Alcantarillado Pluvial Del Sector San Vicente de Paul. Bachelor’s Thesis, Universidad de Cartagena, Cartagena, Colombia, 1995. [Google Scholar]
- Universidad de Cartagena. Informe Propuesta de Drenajes Pluviales. Actualizar Los Diseños y Línea Base Ambiental Para Las Obras de Protección Costera En El Tramo Comprendido Entre El Túnel de Crespo y El Espolón Iribarren, y Ampliación de La Avenida 1era de Bocagrande, En Cartagena de Indias D.T y C. Contrato Interadministrativo No. Val 02-2017; Universidad de Cartagena: Cartagena, Colombia, 2017. [Google Scholar]
- Arrieta-Pastrana, A.; Saba, M.; Alcázar, A. Analysis of Climate Variability in a Time Series of Precipitation and Temperature Data: A Case Study in Cartagena de Indias, Colombia. Water 2022, 14, 1378. [Google Scholar] [CrossRef]
- Ministry of Housing, C. and D. (MinVivienda) Resolution No. 0799/2021. Available online: https://www.minvivienda.gov.co/normativa/resolucion-0799-2021 (accessed on 10 October 2025).
Disclaimer/Publisher’s Note: The statements, opinions and data contained in all publications are solely those of the individual author(s) and contributor(s) and not of MDPI and/or the editor(s). MDPI and/or the editor(s) disclaim responsibility for any injury to people or property resulting from any ideas, methods, instructions or products referred to in the content. |
© 2025 by the authors. Licensee MDPI, Basel, Switzerland. This article is an open access article distributed under the terms and conditions of the Creative Commons Attribution (CC BY) license (https://creativecommons.org/licenses/by/4.0/).