Abstract
Karst mining regions frequently encounter ecological and geological challenges during extraction, especially the increased water inflow into mine pits, water contamination, and karst collapse due to dewatering activities. These challenges not only threaten the safety of mineral resource extraction but also escalate operational expenses. To address these concerns, this study offers a detailed examination of the geohydrological conditions in a karst mining area. It integrates multiple data sources, such as the dynamics of groundwater, mine dewatering activities, and precipitation patterns, to identify the primary sources of water ingress into the mines. The result reveals that the primary water inflow of the mine pits is directly recharged by atmospheric precipitation through runoff zones. Additionally, the key factors leading to karst collapses are the decrease in groundwater levels due to dewatering and the stability of surrounding rock. Consequently, this paper presents a set of innovative methods for water hazard prevention and control. Utilizing the GMS (Groundwater Modeling System), the groundwater numerical model is built to estimate water consumption in mining operations, and also to validate the efficacy of these methods. The model reveals that application of these techniques can reduce groundwater inflow of the mine by 34.3%. The set of methods not only substantially lowers the risk of water inrush incidents but also avoids the contamination of groundwater. Consequently, it ensures the safety of mine production, especially in the wet season.
1. Introduction
Water hazards in mining activities within karst regions have long been a significant research topic in the field of geological engineering [1,2,3]. During dewatering operations, challenges such as increased water inflow into mine workings, deterioration of water quality, and occurrences of karst collapse present substantial environmental threats and safety risks [4,5]. These issues not only impact the safe and efficient extraction of mineral resources but also substantially escalate economic expenses during mining processes [6,7]. Therefore, the implementation of effective mitigation measures and the prediction of their outcomes are important for hazard prevention during mining operations and treatments of mine wastewater [8,9].
In non-karst regions, mine water hazards typically behave as water inrush through porous aquifers, fissured zones, or minor faults [10,11]. In karst environments, the distinctive landforms like caverns and underground rivers frequently lead to intense and sudden water inrush. The interactions between groundwater and rocks are highly complex; the groundwater flow patterns influence both geological environments and ecosystems significantly [12,13]. The mines in the southwestern karst area studied in this paper face a greater risk of water inrush disasters and environmental pollution than non-karst areas.
In addressing the threat of extraordinarily large water inrush disasters, interventions are typically categorized into two primary strategies. The first strategy is source control and prevention [14,15,16,17]. Xu Chengyuan et al. established a mathematical model and carried out experimental verification for the leakage prevention and plugging technology of natural fractured reservoirs, which has theoretical guiding significance for the source control of mine water disasters [18]. The second strategy is engineering interception and plugging. Chengyuan Xu et al. first revealed the key influence mechanism of the friction coefficient on the plugging effect of fractured reservoirs, and proposed a material screening standard based on friction characteristics, which can guide the formulation design of plugging slurry and the setting of pump pressure parameters in field construction, and is very helpful for engineering interception and plugging of water inrush hazards [19]. However, the long-term water resistance of many materials is insufficient, which often has a great impact on the plugging effect. To deal with environmental pollution, physical, chemical, and biological methods are usually used for treatment [20,21,22]. Su Peidong offered a novel Fe-Zr bimetallic functionalized biochar made by ginkgo leaves, which effectively reduces SO42− concentrations in mine wastewater [23]. However, the consumption of these methods is often large, which directly increases the operating cost of the mining area.
Numerical simulation is a popular tool for predicting mine water inflow [24,25,26]. Through laboratory experiments, field tests, and PFC numerical simulation, Li, X et al. systematically studied the coal extraction parameters and top coal caving technology, providing technical support for on-site production [27]. Karki, R. employed the MODFLOW-NWT numerical simulation tool to conduct an assessment of the effects on groundwater levels and the interaction between streams and aquifers resulting from elevated rates of groundwater extraction in the Lower Apalachicola–Chattahoochee–Flint (ACF) River basin [28]. L. Surinaidu used MODFLOW 2005 numerical simulation software to estimate the groundwater flow in each development stage of an open-pit mine [29].
Effective monitoring after water hazard interventions is critical for evaluating long-term stability and pollution control. Geophysical methods enable non-invasive, real-time assessment of subsurface stability and water pathways in karst terrains. Electrical Resistivity Tomography (ERT) detects cavity development, water-bearing structures, and potential collapse risks by mapping resistivity anomalies [30]. The Complex Resistivity method (CR) is mainly used to study frequency domain parameter anomaly of the underground target body caused by near-field EM coupling effects and induced polarization effect. Using the Complex Resistivity method, Deng Juzhi et al. has mapped the two-dimensional pseudo-section of apparent resistivity and video divergence and the two-dimensional inversion section [31]. In addition to that, water quality downstream of the mine area should be monitored to assess the risk of pollution bought by mine water. Passive samplers capture time-weighted average contaminant concentrations, addressing episodic pollution in variable-flow karst systems. The pollution monitoring of karst mines should mainly adopt the passive sampling strategy to overcome the limitations of traditional sampling methods in karst landforms [32].
Different from the traditional mine water treatment method, this study comprehensively considers the conditions of the entire hydrogeological unit. Starting from the overall situation, a series of comprehensive schemes are proposed by combining the traditional methods (water diversion, surface anti-seepage, prevention of karst collapse) with the innovative methods (drainage tunnels). The drainage tunnels can not only reduce the recharge of the northwest runoff zone to the mine water from the source, but also avoid the risk of insufficient long-term water resistance of the material in the project interception. We evaluate these water control strategies through numerical simulation, and provide a framework of solution for the prevention and control of water disasters in similar mining areas.
2. Backgrounds and Methods
2.1. Overview of the Mining Region
Beishan mine is a large lead–zinc mine. The burial depth of the deposit is 60~500 m. The No. 1 ore body mined is layered and lenticular. It is 1050 m long from north to south, 100~600 m wide from east to west, and 1.4~46.3 m thick, with an average thickness of 20.5 m. The output elevation is mainly +110~+350 m, and a small part is below +110 m. In this article, the elevation is expressed by altitude (meters above the sea level). A total of 75% of the reserves of the mine are located below the erosion basis. The mine was built and put into operation in 1993. It has been mined for 30 years, and there is still a 10-year service period. The +120 m horizontal middle section currently mined is the lowest middle section of the mining design.
2.1.1. Meteorological and Hydrological Background
The mining region is in a subtropical monsoon climate zone, characterized by significant rainfall (1750 mm of average annual precipitation and 156 mm of maximum daily rainfall). The topography of the region includes peak clusters, karst depressions, and karst valleys. These are separated by ridges with substantial elevation changes. During the wet season, flash floods occur with discharge rates reaching up to 22 ± 5% m3/s. Conversely, during the dry season, the flow of the mountain river reduces significantly to mere trickles, sometimes as low as 0.2 ± 5% m3/s. The geographical location map of the mining area is shown in Figure 1.
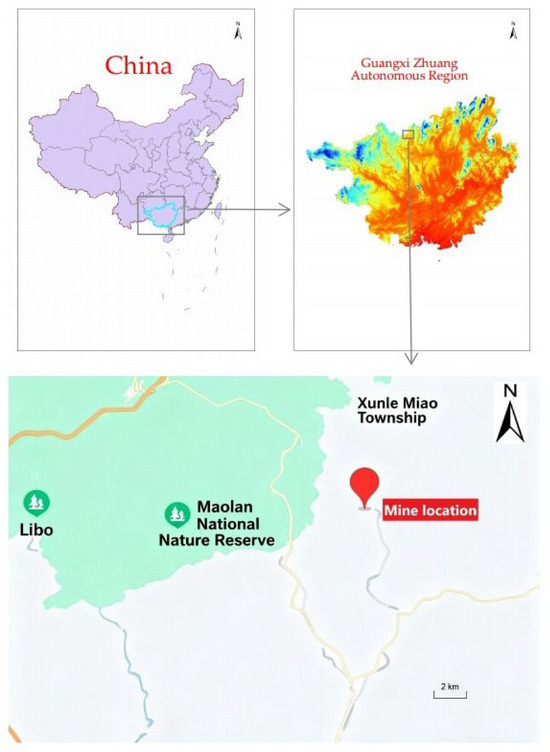
Figure 1.
Geographical location of Baishan Mine.
2.1.2. Characteristics of Hydrogeology
The mining region is characterized by intricate geological formations. The exposed strata include the Middle Devonian Donggangling Formation, Upper Devonian Guilin Formation, Upper Devonian Rongxian Formation, and Lower Carboniferous Yaoyunling Formation. According to the hydrogeological survey, the mining area is an independent hydrogeological unit, which is bounded by watershed and impermeable faults (Figure 2 and Figure 3). The terrain of the mining area is characterized by karst peaks surrounded by mountains on three sides, with a catchment area of about 13.3 km2. In the northern part of Fault F6, extensive outcrops expose limestone, bioclastic limestone (D2d2−2(2)), early reef limestone (D2d12−2), and late reef limestone (D2d21) covering ~10.0 km2. The remaining 3.3 km2 area primarily consists of marlstone and mudstone formations (D2d22 and D2d12−1).
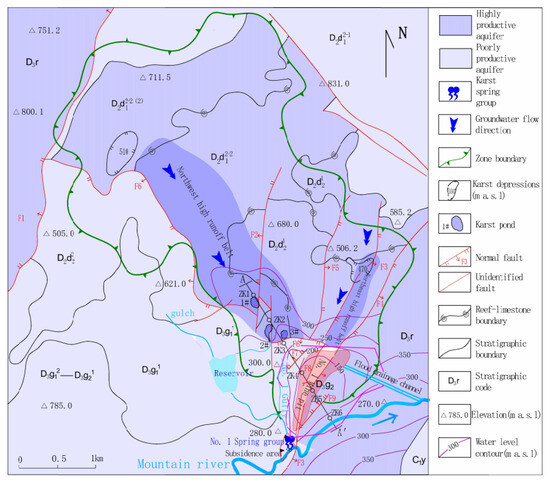
Figure 2.
Hydrogeological map of Baishan Mine.
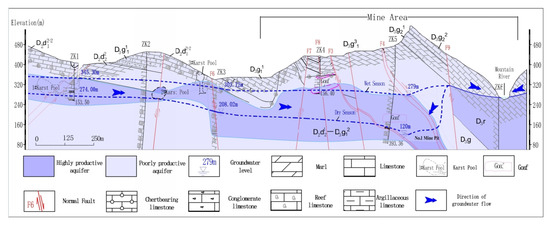
Figure 3.
Hydrogeological cross-section along line A–A′.
The aquifer, characterized by high productivity, consists of limestone, bioclastic limestone, dolomite, dolomitic limestone, and reef limestone (inclusive of stromatoporoid bioherms). This primarily correlates with the Devonian Rongxian Formation (D3r), Upper Dadongling Formation Bed D2d21, Lower Dadongling Formation Bed D2d12−2, and Lower Dadongling Formation Subbed D2d12−2(2). The aquifer, which is only weakly productive, is primarily composed of thin-bedded limestone, banded limestone, marlstone, and argillaceous limestone. It spans five stratigraphic units: Upper Guilin Formation Bed D3g21, Lower Guilin Formation Beds D3g11–D3g13, and Upper Dadongling Formation Bed D2d22.
Fault F4 is located in the central part of the mining area, extending over 4.5 km in length. It is a regional, multiphase active principal tensional fault exhibiting relative impermeability. However, mining activities have compromised this sealing capacity within the mine section. Fault F6 trends northwestward and east-westward, dipping south at angles ranging from 52° to 88° with a vertical displacement exceeding 500 m. Its well-cemented conglomeratic zone is flanked by fractured damage zones characterized by abundant cavities and fissures, making it a water-conductive structure. During tunnel excavation, consistent inflow rates of 816 ± 5% m3/d were observed from this fault.
2.1.3. Intensive Runoff Belt
The northeastern groundwater runoff zone originates from karstic depressions at an elevation of +470 m and terminates at Pit No. 1. This subsurface runoff pathway, with a length of 1.4 km and widths varying between 100–300 m, drains a catchment area of approximately 1.4 km2 within the early reef limestone formation (D2d12−2). Summit elevations range from +550 m to +650 m above sea level, while the depression floor sits at +470 m. Surface sheet runoff formed by steep hydraulic gradients, supplemented by shallow karst infiltration. After converging at the +470 m depression, water seeps into the ground and follows the eastern boundary of the hydrogeological unit southward to Pit No. 1.
The northwestern groundwater runoff zone originates from a karstic depression at elevation +510 m in the northwestern part of the unit and terminates at the southern karst collapse area. Its northern boundary coincides with the F6 fault’s exposed karst zone, while the southern section is buried beneath marlstone and mudstone formations. This runoff belt, with a length of 4.4 km and a width of 250–1000 m, drains a catchment area of 11.9 km2. Groundwater flows from northwest toward southeast, crossing the F6 fault and contributing to mine water inrush. Three blue holes (Pond #1, #2, and #3) are developed along the runoff zone; under natural conditions, groundwater mainly discharges through the spillway of Pond #2 into reservoirs and then flows into mountain streams through Spring Group I during high-water seasons.
2.2. Water Hazards and Related Environmental Geological Issues
2.2.1. Water Hazards
Mining in the study area has significantly changed the groundwater flow and caused a series of hydrogeological problems. For example, after excavation, the water table in Pit No. 1 dropped from +280 m during high-flow seasons to +120 m and formed a large cone of depression. The formation of the cone of depression has changed the direction of natural subsurface flow and may affect the stability of the surrounding strata.
In addition, the original spillway of Pond #2 at elevation +320 m in the high-water seasons rose 17 m (to +337 m) during the construction of the tailings pond, which greatly reduced its discharge capacity and increased the water inflow into Pit No. 1. The maximum water levels of borehole ZK1, ZK2 (near the blue holes), and ZK3 in the three consecutive peak flow periods were +349.5 ± 0.05 m, +336.1 ± 0.05 m, and +313.2 ± 0.05 m, respectively. At the same time, the water level in Pit No. 1 rose to + 280 m, with the water level increasing 160 m compared with the original mining benchmark. As a result, the mine influx increased about 7.6 × 10⁴ m3/d from 1.2 × 10⁴ m3/d under the normal baseflow condition, and up to 2.16 × 10⁵ m3/d during flood events, which led to the cessation of mine production. It not only harms mining operations economically, but also becomes a persistent risk to the adjacent environment.
2.2.2. Water Pollution
During the wet seasons, groundwater enters into the mine’s 280 m elevation gallery via subsurface runoff. Due to limited settling capacity in the mining system, the untreated water overflows directly into gully brooks. As the SO42−–Fe2+-rich groundwater traverses the 280 m level passageway, it converts to SO42−–Fe3+-rich groundwater due to oxidation, with a distinctive reddish-yellow color and pH from 7.5 to 3.1, creating highly acidic conditions [33]. The severe acidification of water and sediment directly indicates the existence of acid mine drainage (AMD) and potential hazard to the riverine ecosystem. The water quality of the monitoring wells near the mining area reaches the Class III groundwater standard in the national standard of the People’s Republic of China [34].
2.2.3. Karst Collapse
In the mining area, intensive dewatering significantly lowered the groundwater levels, resulting in the drying up of several karst springs. Consequently, several karst collapses (with diameters of 2–3 m and visible depths of 1–2 m) have developed near the riverbed in the southern mining zone. The exposed karst voids establishing direct connection between surface water and groundwater, potentially serving as critical conduits for mine water inrush—posing immediate threats to mining operations [35]. Furthermore, fluctuations in groundwater regime destabilize underground cavities, particularly within the complex hydrogeological characteristics of karst terrain. Mine dewatering reduces the confining pressure of groundwater on rock masses, and increases the mechanical load stress, resulting in the voids being connected and expanded continuously, and finally forming collapse [36].
2.3. Sources of Mine Water Inrush
To comprehensively characterize groundwater dynamics and identify primary water sources for mine inundation during mining activities, three additional long-term observation points (ZK1, ZK2, and ZK3) were set up along the northeastern and northwestern runoff zones. The observation results are detailed in Figure 4 and Figure 5.
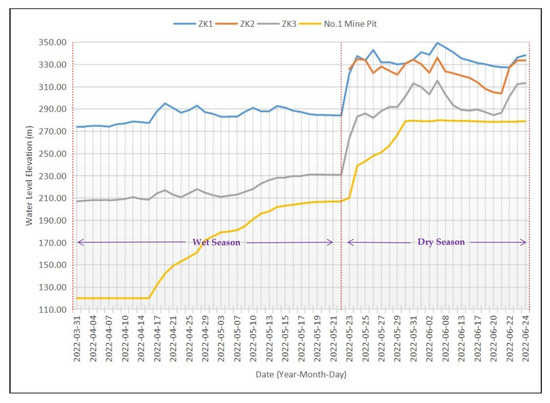
Figure 4.
Water level fluctuation in the NW runoff zone and water level restoration of No. 1 mine pit in 2022.
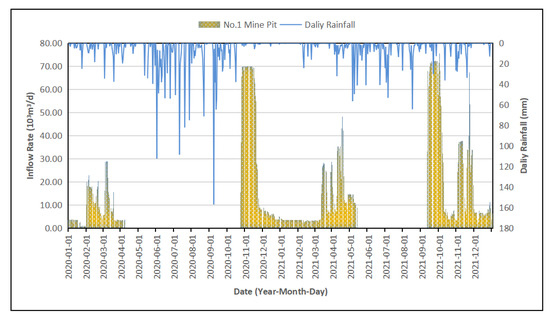
Figure 5.
Daily rainfall and inflow rate of No. 1 mine pit from 2020 to 2021.
Figure 4 is the observation data of mine water level from March to June in 2022, which shows that during the normal season under active mining, the lowest water levels at observation points ZK1 and ZK3 were +274 ± 0.05 m and +208 ± 0.05 m, respectively, while the pit water level stood at 120.0 m. However, during the wet season, the highest water levels reached +349.5 ± 0.05 m (ZK1), +336.1 ± 0.05 m (ZK2), and +313.2 ± 0.05 m (ZK3), while Pit No. 1 had a water level of +280 m and groundwater overflow was discharged via storm drain channels. These observations indicate that the depression cone formed by intensive dewatering during production has expanded beyond ZK1, resulting in a much steeper hydraulic gradient from upstream ZK1 to the mine pit than that during the wet season. On May 18, as the wet season began, mining operations were suspended due to a dramatic surge of groundwater from northwestern runoff zone, and the pit water levels rose rapidly six hours later, indicating strong hydrogeological connectivity between the mine workings and the northwestern flow paths.
The data in Figure 5 are taken from 2020 to 2021. As illustrated, the resumption of mining operations from September to October required continuous dewatering at an intensity of approximately 7 × 10⁴ ± 5% m3/d for nearly a month to attain the target level of +120 m mid-level drift. When the normal production is restored, the mine water inflow is generally kept at a low level of 1.2 × 10⁴ ± 5% m3/d. However, as the daily precipitation exceeded 20 mm, there was a significant surge in mine water volume with minimal delay following the rainfall. This suggests a high sensitivity of pit inflow to rainfall events [37].
Figure 4 and Figure 5 demonstrate that water inrush occurs in Pit No. 1 when the water level exceeds the elevation benchmark of +280 m, and the mine water volume is directly related to groundwater levels. According to the hydrogeological ground survey results of the project, atmospheric precipitation will be recharged in the mine through two runoff zones in the northwest and northeast. In the scenario of extreme rainfall, the peak discharge rates range from 7.6 × 10⁴ ± 5% m3/d (normal conditions) to 2.16 × 10⁵ ± 5% m3/d (worst-case). As shown in Table 1, the recharge from precipitation into the northeastern and northwestern runoff zones during the wet season, as calculated using the five-year average precipitation, totals approximately 9.05 × 10⁴ ± 5% m3/d. This recharge will directly overflow when the pit level is higher than +280 m, which indicates that precipitation is the main source of mine water supply along subsurface flow paths.

Table 1.
Calculation of Groundwater Recharge by Rainfall.
2.4. Integrated Water Hazard Management Plan
Groundwater system plays a key role in controlling the feasibility and cost of mining operations in the karst terrain, which features complex hydrogeological conditions. Human-induced engineering activities during ore extraction significantly disrupt natural groundwater flow. Consequently, comprehensive hydrogeological investigation is necessary throughout the life cycle of a mine to accurately characterize the post-disturbance groundwater environment. The water management strategies, including drainage control, sealing technologies, and resource conservation measures, not only help preserve subsurface water resources but also minimizes environmental impacts [38].
In order to ensure sustainable extraction of groundwater, reduce the rate of mine inflow, and allow for the segregated management of contaminated and pristine water streams, an integrated set of hydrological interventions is suggested. These include controlled diversion, strategic drainage systems, and the use of sealing technologies. Figure 6 provides a representation of the spatial configuration of this comprehensive management scheme. Up to now, the management plan is in the design stage, and has to be evaluated by numerical simulation. The actual effectiveness will be vertified after the management plan begins to be implemented.
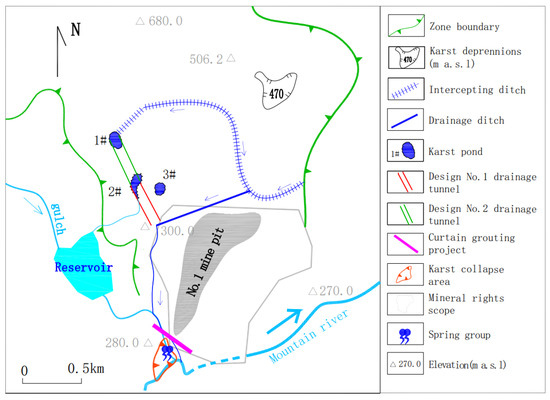
Figure 6.
Schematic diagram of water management strategies.
2.4.1. Water Diversion
Hydrogeological investigation reveals that the karst depression at elevation + 470 m acts as a regional catchment area, which collects overland flow and generates temporary ponded water during wet seasons. The infiltration estimated by recharge area calculations recharges through the NE-trending runoff belt into Mine No. 1, and contributes approximately 10% of total mine water inflow. To reduce this component, an engineering solution has been proposed, which consists of a pump station inside the depression to actively dewater the rainfall accumulation during the wet seasons, and a discharge pipeline cross the mountain spine with a hydraulic head differential of about 100 m (total length: 300 m), terminating in extraneous stream valleys northeast of the mining unit. Concurrently, high-elevation surface conduits adjacent to the depression will be geotechnically sealed, thereby reducing direct meteoric recharge to aquifer systems.
2.4.2. Drainage Tunnel
The northwest-oriented high-flow groundwater belt has been identified as the primary source of mine water inrush. To reduce groundwater recharge into mining excavations, it is recommended to construct a Drainage Tunnel No. 1 from Karst Pond #2 to surface drainage ditches, for diverting subsurface water from this location to the ground surface. This designed tunnel has a total length of approximately 370 m, with its invert elevation at +300 m.
It is essential to monitor the piezometric responses at borehole ZK1 after the completion of Tunnel No. 1. If a concurrent drawdown is not observed, Tunnel No. 2 from Pond #1 to Pond #2, which spans approximately 390 m, with its invert elevation consistently maintained at +300 m, becomes necessary. However, if the concurrent drawdown is observed, Tunnel No. 2 will not be considered.
2.4.3. Surface Anti-Seepage
The existing land reclamation drainage system within the region is utilized to redirect surface water into karst pond clusters and surface stream channels, thereby reducing the proportion of atmospheric precipitation infiltrating groundwater. Moreover, the previous drainage infrastructure in Gully No. 1 has been upgraded and extended into an open earthen channel measuring approximately 1.2 km in length. It intercepts groundwater discharged from Tunnel No. 1 and redirects it to mountainous river.
2.4.4. Prevention of Karst Collapse
The continuous dewatering during mining has formed an increasingly expanding cone of depression in the groundwater table, which extends laterally to the bank of mountain stream nearby. As a result, Spring No. 1 dried up and river water flowed back into the subsurface empty zone, and then widespread surface collapse occurred. To address this issue, a cement–bentonite slurry wall cutoff curtain was built at the junction of the mountain river and tributary channels. The length of the curtain is about 250 m along the river direction, and its location is shown in Figure 5. The function of the cutoff curtain is to cut off the preferential flow channel and prevent the river recharge from further karst development due to the effect of the seepage barrier.
2.5. Evaluation of Governance Effects Based on Numerical Models
2.5.1. Hydrogeological Conceptual Model
Based on the hydrogeological map (Figure 2) of the study area, a conceptual model was established. The hydrogeological unit is delineated by topographic divides and a southern impermeable fault zone. The mine is located in the southern part of the unit with an elevation of +120 m. The unit contains only one aquifer layer.
Before the treatments, the natural groundwater flows along two directions of NE→SW and NW→SW, and is primarily recharged by precipitation. The recharge rates in the two topography-controlled recharge zones were higher than those in other areas; one is the karst depression with an elevation of +510 m in the NW part, and the other is the runoff convergence area with an elevation of +470 m in the NE part. The discharge consists of three outlets, namely Spring Group I in the SW collapse zone, the overflow outlet at Pond No. 2 (elevation +337 m), and the mine tunnels (elevation +120 m).
After treatment, the regional water tables decreased, and the recharge volumes of the two depressions were greatly reduced. Two drainage tunnels were constructed, namely Tunnel No. 1 between Pond No. 1 and Pond No. 2 (elevation +300 m) and Tunnel No. 2 from Pond No. 2 to Gully No. 1. Curtain grouting was also performed at Spring Group I to block river backflow, so Spring Group I became an impermeable boundary. The overflow outlet at Pond No. 2 lost its discharge function, and the recharge contributions of the two depressions were thus reduced.
2.5.2. Mathematical Modeling of Groundwater Flow
According to the hydrogeological attributes of the research area, we conceptualize the groundwater system as a three-dimensional, heterogeneous flow model. The mathematical representation governing this model is expressed as follows:
In Equation (1), H is the groundwater head in meters; K denotes the hydraulic conductivity coefficient in meters per day (m/d); Ss is the specific storage coefficient per meter (m−1); ω is the source/sink term (d−1), with positive values indicating inflow and negative values denoting outflow; Γ1 is the head boundary; Γ2 is the flow boundary; Ω is the seepage simulation domain; H0 indicates the initial water level in meters; H1 signifies known head values in meters; q represents the unit width flow rate across boundaries in square meters per day (m2/d); spatial coordinates include x, y, z in meters; n defines the outward normal direction to boundaries; and time is measured in days (d).
2.5.3. Numerical Model of Groundwater Flow
- (1)
- Domain’s Meshing and Boundary Conditions
This simulation utilized the MODFLOW module within the GMS v10 software for numerical modeling. The model domain was discretized into a grid system with 300 rows × 200 columns, yielding a total of 25,605 computational cells. The southeastern boundary was set as an impermeable fault zone, while all other boundaries were delineated based on topographic divides. Therefore, all model boundaries were treated as no-flow (zero flux) conditions.
- (2)
- Hydrogeological Parameters
- I.
- Recharge
The study area primarily receives atmospheric recharge. Due to widespread karst features, including depressions, sinkholes and collapse structures distributed across northern and western regions, intensive surface runoff convergence under heavy rainfall events significantly amplifies regional infiltration rates. The two large-scale depressions (Figure 7a) are representative of all topographic anomalies that lead to dramatic increases in recharge in the western and northern parts, where it is necessary to assign larger infiltration. After the treatment measures, the effective engineering control has decreased the regional infiltration, and the recharge of depressions gradually returned to normal.
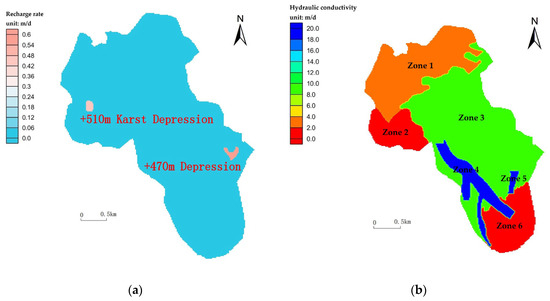
Figure 7.
Hydrogeological zonation map: (a) recharge; (b) hydraulic conductivity.
- II.
- Discharge
Before treatment measures, groundwater discharged via three pathways: (1) the spring group I in the southwestern collapse zone under fixed-head boundary conditions; (2) the overflow outlet of Pool No. 2 karst depression at an elevation of +337 m also configured as a fixed-head boundary; and (3) the +120 m mine gallery simulated using a DRAIN package in MODFLOW. After treatment measures, the water levels decreased and curtain grouting was implemented at the spring group I to cut off the river backflow and to eliminate the hydraulic connections between the + 337 m overflow outlet and the spring group I with the outside system. The construction of drainage tunnel from Pool No. 2 to Gully No. 1 and Tunnel No. 2 connecting Karst Basins No. 1 and No. 2 remain the groundwater levels at approximately +300 m within their influence ranges.
- III.
- Hydrogeological Parameters
The study area exhibits complex spatial variability in hydraulic conductivity due to karst. For the purposes of numerical modeling, we categorized the domain into six distinct zones. These data are obtained through regional comprehensive analysis of stratigraphic lithology and hydrogeological survey (Figure 7b).
3. Results
3.1. Model Calibration
Based on the water levels at observation wells and regional recharge rates, model parameters were calibrated with the results summarized in Table 2.
Table 2.
Calibrated Parameters.
The Nash–Sutcliffe Efficiency coefficient (NSE) was employed to determine the goodness-of-fit between simulated and observed values [39]. The mathematical expression of NSE is Equation (2).
where Qs represents the corresponding simulated value; Q0 denotes the observed value; and n is the number of output stems. It evaluates the correspondence between model outputs and measurements.
To comprehensively validate the applicability of the model across the entire study area, the monitoring data at ZK1, ZK2, and ZK3, as well as pit water levels and the pit inflow rate are set to be output stems. The NSE of this model reached 0.99, indicating excellent model performance. The specific values of these data are presented in Table 3.
Table 3.
Comparison Table of Observed vs. Simulated Water Levels.
3.2. Model Prediction
The model employed DRAIN package to simulate the mine water inrush effects. Post-remediation conditions were represented by the following: (1) removing the fixed-head boundary at +337 m, suggesting water levels had dropped and the overflow outlet no longer acted as a drain; (2) removing the southern fixed-head boundaries to simulate curtain grouting isolation; (3) reducing recharge rates in depressions to replicate diversion and surface drainage measures; and (4) adding a new fixed-head condition at + 300 m to simulate constructed drainage tunnels.
The model simulation results showed that the maximum discharge of the spring before treatment in the high-flow period was 78,738 m3/d, and after treatment was 51,128 m3/d, with a reduction of 34.3%. The water level simulated by the pre-treatment model was basically consistent with the observed data, and the water level simulated by the post-treatment model gradually stabilized at about +300 m around ZK1 and ZK2 blue holes (Figure 8). The simulation results show that the engineering control measures effectively reduced the mine inflow in the study area.
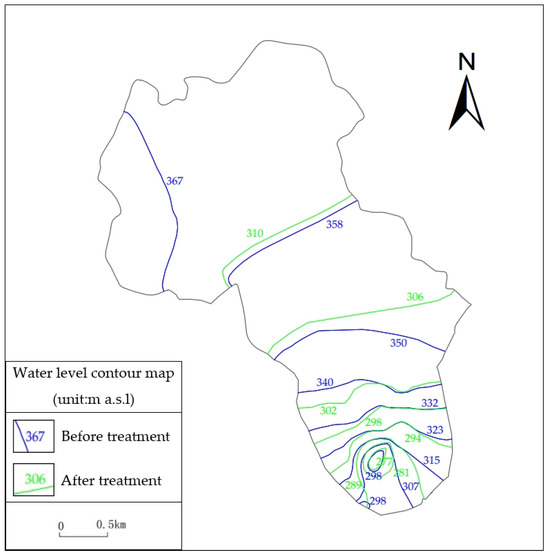
Figure 8.
Water level contour map before and after treatment in the study area.
4. Discussions
It is also necessary to optimize the monitoring framework for mine environmental governance after the implementation of the water hazard intervention measures. For the assessment of the effects of water diversion and surface anti-seepage, high-precision flow meters installed at pumping station outlets and open channels enable real-time drainage volume recording. Combining these measurements with meteorological data (rainfall intensity/duration) allows calculation of actual interception efficiency. For drainage tunnels, automated water level loggers (sampling frequency ≥1/h) deployed in existing observation wells continuously monitor groundwater dynamics. Comparative analysis of pre/post-operation water level drawdown and flow field stability directly demonstrates tunnel drainage efficiency.
Furthermore, the geophysical method can be used for karst structure safety assessment. Periodic electrode array deployments along the treatment perimeter detect resistivity variations in karst development zones. When resistivity fluctuations exceed 15%, ground-penetrating radar re-evaluation is triggered to assess structural instability risks. Because the area where the groundwater level changes greatly is concentrated near the mine, the geophysical exploration work is mainly concentrated near the mine. Water injection experiments can be used to evaluate the grouting effect.
It is also necessary to monitor the water quality. Before the implementation of governance measures, the water quality of monitoring wells near the mine met Class III groundwater standard [34], can be discharged directly. After treatment, the amount of contaminated groundwater is greatly reduced, and the impact on the environment and biodiversity will become smaller. For the water quality monitoring of mine water, especially for the characteristics of sulfate-rich (SO42−), iron ions (Fe2+/Fe3+), strong acidity (pH value fluctuates greatly), and potential heavy metal pollution, a high-precision online pH meter and conductivity meter can be used for real-time continuous monitoring to capture the dynamic change trend (such as sudden decline suggesting that the oxidation reaction is intensified).
While MODFLOW was employed in this study to predict mine water inflow and met the requirements for mine water hazard management, the approach exhibits limitations due to the intense karst development within the hydrogeological unit of the mining area. This geological setting results in pronounced heterogeneity and anisotropy. Future research should focus on achieving more precise characterization of the karst media structure in the mining area and incorporate models such as discrete fracture networks (DFNs) to enable more accurate predictions of groundwater levels and inflow rates.
5. Conclusions
This study presents a comprehensive analysis of the hydrogeological conditions and water hazard sources within a mining area, proposing an innovative set of treatments for the prevention and control of water hazards. Specialized hydrogeological investigation is essential for uncharted mining territories to assess dramatic surges in mine water inrush.
The strategy of water control in karst mining is “divergence rather than sealing”. The comprehensive prevention and control measures mainly include the following: the construction of diversion tunnels, surface drainage measures, grouting curtains, and controlled discharge channels, aiming to reduce the inflow amount and achieve the separation of clean and polluted water. The effectiveness of this set of treatments was evaluated via numerical simulation. The employed methods not only significantly mitigate the risk of water inrush within the mine but also prevent groundwater pollution and ensure the safety of mine production, particularly during the rainy season. Compared to conventional approaches, the proposed method effectively reduces groundwater inflow into the mine pit from both northwestern and southeastern runoff zones at its source. This significantly decreases contaminated groundwater volume, ensuring construction safety while substantially lowering wastewater treatment complexity.
The MODFLOW numerical model effectively evaluates mine water damage control measures. Its DRAIN package simulates mine drainage operations. By calibrating the model with implemented controls, predictive simulations quantified water inrush volumes both before and after remediation. These numerical results quantitatively demonstrate the substantial effectiveness of the engineering in reducing water hazards. This approach provides a quantitative tool for preventing and controlling water damage in similar mining areas.
Post-intervention mine environmental monitoring requires an optimized framework: High-precision flow meters at pumping stations and open channels track drainage volume, combining with rainfall data to calculate interception efficiency. Automated water level loggers in wells continuously monitor tunnel drainage impacts. Resistivity detected via electrode arrays trigger ground-penetrating radar re-evaluations for karst safety, alongside water injection tests to verify grouting. Water quality must be tracked for real-time sulfate-, iron-, acidity- (pH fluctuations), and heavy metal-related trends, leveraging reduced contamination post-treatment to mitigate environmental impacts. In the future, we will also use other models to study the project according to the needs of the project.
Author Contributions
Conceptualization, M.X. and Y.X.; methodology, M.X. and W.M.; software, M.X.; validation, M.X. and Z.W.; formal analysis, M.X. and Y.X.; investigation, Z.W.; resources, J.L. and L.Q.; data curation, Z.H.; writing—original draft preparation, M.X.; writing—review and editing, M.X. and Y.X.; visualization, M.X.; supervision, W.M.; project administration, W.M.; funding acquisition, Y.X. All authors have read and agreed to the published version of the manuscript.
Funding
This research was funded by Guangxi Science and Technology Program, grant number Guike AD25069074.
Data Availability Statement
The original contributions presented in this study are included in the article. Further inquiries can be directed to the corresponding author.
Acknowledgments
We are grateful to Guilin Agricultural Water and Soil Resources and Environment Observation and Research Station of Guangxi, Guilin University of Technology, Guilin, 541006, China; Collaborative Innovation Center for Water Pollution Control and Water Safety in Karst Area, Guilin University of Technology, Guilin, 541006, China; Guilin Lijiang River Ecology and Environment Observation and Research Station of Guangxi, Guilin University of Technology, Guilin, 541006, China.
Conflicts of Interest
The authors declare no conflicts of interest.
References
- Shi, X.; Xu, G.; Qian, Z.; Zhang, W. Study on the Hydrogeological Characteristics of Roof Limestone Aquifers After Mining Damage in Karst Mining Areas. Water 2025, 17, 2264. [Google Scholar] [CrossRef]
- Xia, R.; Wang, H.; Hu, T.; Yuan, S.; Huang, B.; Wang, J.; Ren, Z. A Risk Assessment of Water Inrush in Deep Mining in Metal Mines Based on the Coupling Methods of the Analytic Hierarchy Process and Entropy Weight Method: A Case Study of the Huize Lead–Zinc Mine in Northeastern Yunnan, China. Water 2025, 17, 643. [Google Scholar] [CrossRef]
- Zhou, J.; Jiang, Z.; Qin, X.; Zhang, L. Heavy Metal Distribution and Health Risk Assessment in Groundwater and Surface Water of Karst Lead–Zinc Mine. Water 2024, 16, 2179. [Google Scholar] [CrossRef]
- Zhang, Z.; Li, H.; Zhang, F.; Qian, J.; Han, S.; Dai, F. Groundwater Hydrogeochemical Processes and Potential Threats to Human Health in Fengfeng Coal Mining Area, China. Water 2023, 15, 4024. [Google Scholar] [CrossRef]
- Liu, J.; Zhao, Y.; Tan, T.; Zhang, L.; Zhu, S.; Xu, F. Evolution and modeling of mine water inflow and hazard characteristics in southern coalfields of China: A case of Meitanba mine. Int. J. Min. Sci. Technol. 2022, 32, 513–524. [Google Scholar] [CrossRef]
- Yuan, S.; Sui, W.; Han, G.; Duan, W. An Optimized Combination of Mine Water Control, Treatment, Utilization, and Reinjection for Environmentally Sustainable Mining: A Case Study. Mine Water Environ. 2022, 41, 828–839. [Google Scholar] [CrossRef]
- Liu, H.; Cao, Y. Technologies of Preventing Coal Mine Water Hazards for Sustainable Development in North China. Geotech. Geol. Eng. 2011, 29, 1–5. [Google Scholar]
- Li, P. Mine Water Problems and Solutions in China. Mine Water Environ. 2018, 37, 217–221. [Google Scholar] [CrossRef]
- Qu, X.; Shi, L.; Qu, X.; Bilal, A.; Qiu, M.; Gao, W. Multi-model fusion for assessing risk of inrush of limestone karst water through the mine floor. Energy Rep. 2021, 7, 1473–1487. [Google Scholar] [CrossRef]
- Shen, Q.; Liang, X.; Liao, F.; Mao, H.; Xiao, B.; Duan, L.; Shi, Z.; Wang, G.; Yu, R. Geochemical fingerprint and spatial pattern of mine water quality in the Shaanxi-Inner Mongolia Coal Mine Base, Northwest China. Sci. Total Environ. 2023, 854, 158812. [Google Scholar]
- Liu, B.; Liu, G.; Sha, J.; Sun, J.; Zhao, X.; Ren, S.; Liu, R.; Li, S. Numerical simulation of the interaction between mine water drainage and recharge: A case study of Wutongzhuang coal mine in Heibei Province, China. Ecol. Indic. 2024, 158, 111568. [Google Scholar] [CrossRef]
- Dong, S.; Wang, H.; Guo, X.; Zhou, Z. Characteristics of Water Hazards in China’s Coal Mines: A Review. Mine Water Environ. 2021, 40, 325–333. [Google Scholar] [CrossRef]
- Zhou, S.; Liu, T.; Duan, L. Ecological Impact Prediction of Groundwater Change in Phreatic Aquifer under Multi-Mining Conditions. ISPRS Int. J. Geo-Inf. 2022, 11, 359. [Google Scholar] [CrossRef]
- Liu, Z.; Dong, S.; Zheng, S.; Shi, Z. Research on advanced grouting curtain technology for water interception and control at the source of aquifer in coal seam roof. Sci. Rep. 2025, 15, 20354. [Google Scholar] [CrossRef] [PubMed]
- Kong, B.; Han, L.; Zheng, J. Study on Formation Mechanism of Advance Grouting Curtain in Ore-Rock Contact Zone in Water-Rich Roadway. Appl. Sci. 2024, 14, 6257. [Google Scholar] [CrossRef]
- Xu, C.; Han, L. Engineering scale Modeling of Advance-Curtain Grouting in Roadways Under Dynamic Water Conditions: The Formation and Stability of Curtain Method. Iran. J. Sci. Technol. Trans. Civ. Eng. 2023, 47, 3071–3081. [Google Scholar] [CrossRef]
- Yuan, S.; Sun, B.; Han, G.; Duan, W.; Wang, Z. Application and Prospect of Curtain Grouting Technology in Mine Water Safety Management in China: A Review. Water 2022, 14, 4093. [Google Scholar] [CrossRef]
- Xu, C.; Kang, Y.; You, L.; You, Z. Lost-Circulation Control for Formation-Damage Prevention in Naturally Fractured Reservoir: Mathematical Model and Experimental Study. SPE J. 2017, 22, 1654–1670. [Google Scholar] [CrossRef]
- Xu, C.; Yan, X.; Kang, Y.; You, L.; You, Z.; Zhang, H.; Zhang, J. Friction Coefficient: A Significant Parameter for Lost Circulation Control and Material Selection in Naturally Fractured Reservoir. Energy 2019, 174, 1012–1025. [Google Scholar] [CrossRef]
- Su, P.; Tang, J.; Wu, M.; Guo, X.; Zhang, C.; Guo, Q.; Liu, Z.; Li, J.; Zhang, J. Enhanced Sulfate Adsorption in Mine Water via Fe-Zr Bimetal Modified Ginkgo Leaf-Derived Biochar: Mechanistic Insights and DFT Calculations. Sep. Purif. Technol. 2025, 376, 133941. [Google Scholar] [CrossRef]
- Dubuc, J.; Coudert, L.; Lefebvre, O.; Neculita, C.M. Electro-Fenton treatment of contaminated mine water to decrease thiosalts toxicity to Daphnia magna. Sci. Total Environ. 2022, 835, 155323. [Google Scholar] [CrossRef]
- Zhang, H.; Li, W.; Du, M.; Jiang, P.; Li, J. Research Status and Prospects of Groundwater Pollution Control Technologies in Closed Mines. Coal Eng. 2022, 54, 170–176. [Google Scholar]
- Yuan, J.; Bai, S.; Bi, Y.; Li, J.; Ding, Z.; Wen, S. Research Progress on Treatment and Comprehensive Utilization of Mine Acid Wastewater at Home and Abroad. Nonferrous Met. Eng. 2022, 12, 131–139. [Google Scholar]
- Cao, Z.; Zhang, S.; Du, F.; Ma, D.; Li, Z.; Huang, C.; Wang, W. Water Inrush Mechanism and Variable Mass Seepage of Karst Collapse Columns Based on a Nonlinear Coupling Mechanical Model. Mine Water Environ. 2025, 44, 259–274. [Google Scholar] [CrossRef]
- Mayaud, C.; Wagner, T.; Benischke, R.; Birk, S. Single Event Time Series Analysis in a Binary Karst Catchment Evaluated Using a Groundwater Model (Lurbach System, Austria). J. Hydrol. 2014, 511, 628–639. [Google Scholar] [CrossRef]
- Teng, T.; Chen, Y.; Wang, S.; Jia, W.; Wang, Y.; Liu, K.; Li, Z. Water Injection Softening Modeling of Hard Roof and Application in Buertai Coal Mine. Environ. Earth Sci. 2025, 84, 54. [Google Scholar] [CrossRef]
- Li, X.; Ren, Z.; Chen, Z.; Ren, H. Study on Coal Drawing Parameters of Deeply Buried Hard Coal Seams Based on PFC. Sci. Rep. 2025, 15, 21934. [Google Scholar] [CrossRef] [PubMed]
- Karki, R.; Srivastava, P.; Kalin, L.; Mitra, S.; Singh, S. Assessment of Impact in Groundwater Levels and Stream-Aquifer Interaction Due to Increased Groundwater Withdrawal in the Lower Apalachicola-Chattahoochee-Flint (ACF) River Basin Using MODFLOW. J. Hydrol. Reg. Stud. 2021, 34, 100802. [Google Scholar] [CrossRef]
- Surinaidu, L.; Rao, V.V.S.G.; Rao, N.S.; Srinu, S. Hydrogeological and Groundwater Modeling Studies to Estimate the Groundwater Inflows into the Coal Mines at Different Mine Development Stages Using MODFLOW. Water Resour. Ind. 2014, 7, 49–65. [Google Scholar] [CrossRef]
- Hussain, Y.; Uagoda, R.; Borges, W.; Nunes, J.; Hamza, O.; Condori, C.; Aslam, K.; Dou, J.; Cárdenas-Soto, M. The Potential Use of Geophysical Methods to Identify Cavities, Sinkholes and Pathways for Water Infiltration. Water 2020, 12, 2289. [Google Scholar] [CrossRef]
- Deng, J.; Zheng, Y.; Chen, H.; Pei, J. Application of Complex Resistivity method (CR) in Lengshuikeng ore concentration area. Prog. Geophys. 2017, 17, 2264. [Google Scholar]
- Field, M.S. Groundwater sampling in karst terranes: Passive sampling in comparison to event-driven sampling strategy. Hydrogeol J. 2021, 29, 53–65. [Google Scholar] [CrossRef]
- Wang, Y.; Xia, J.; Yang, H.; Zhou, Y.; Song, K.; Tan, S.; Chen, Y. Sulfate-regulated hydration mechanism and kinetics of backfill materials based on coal gangue and high-salinity concentrated mine water. Process Saf. Environ. Prot. 2025, 201, 107559. [Google Scholar] [CrossRef]
- GB/T 14848—2017; Groundwater Quality Standard. China National Standards Press: Beijing, China, 2017.
- Zhu, G.; Jiang, B.; Li, M.; Song, Y.; Cheng, G. Logging identification of karstified Jurassic conglomerate aquifer in the Zhuxianzhuang coal mine: Implications for water abundance heterogeneity and mining risk mitigation. Front. Earth Sci. 2025, 13, 1580956. [Google Scholar] [CrossRef]
- Wang, J.; Yang, Y.; Yang, X.; Lu, Y.; Liu, Y.; Hu, D.; Hu, Y. The prediction of karst-collapse susceptibility levels based on the ISSA-ELM integrated model. Front. Earth Sci. 2025, 13, 1581090. [Google Scholar] [CrossRef]
- Guan, L.; Liu, C.; Wang, W.; Yin, J.; Wang, H. Study on Ecological Allocation of Mine Water in Mining Area Based on Long-term Rainfall Forecast. Water Resour. Manag. 2022, 36, 5545–5563. [Google Scholar] [CrossRef]
- Palash, W.; Guimarães, A.; AmirRahmami, M.; Sam, S.; Steen, J.; Kunz, N.C. Hydro-climatological changes and mine water management challenges in Canada under climate change. Environ. Res. Lett. 2025, 20, 094037. [Google Scholar] [CrossRef]
- McCuen, R.H.; Knight, Z.; Cutter, A.G. Evaluation of the Nash–Sutcliffe Efficiency Index. J. Hydrol. Eng. 2006, 11, 597–602. [Google Scholar] [CrossRef]


Disclaimer/Publisher’s Note: The statements, opinions and data contained in all publications are solely those of the individual author(s) and contributor(s) and not of MDPI and/or the editor(s). MDPI and/or the editor(s) disclaim responsibility for any injury to people or property resulting from any ideas, methods, instructions or products referred to in the content. |
© 2025 by the authors. Licensee MDPI, Basel, Switzerland. This article is an open access article distributed under the terms and conditions of the Creative Commons Attribution (CC BY) license (https://creativecommons.org/licenses/by/4.0/).