Article

From Simulation to Implementation: Validating Flood Resilience Strategies in High-Density Coastal Cities—A Case Study of Macau

1
School of Architectural Engineering, Jinling Institute of Technology, Nanjing 211199, China
2
School of Civil Engineering and Architecture, Southwest University of Science and Technology, Mianyang 621010, China
3
School of Architecture, Tianjin University, Tianjin 300072, China
4
Tianjin Huahui Engineering Architectural Design Co., Ltd., Tianjin 300384, China
*
Authors to whom correspondence should be addressed.
Water 2025, 17(21), 3110; https://doi.org/10.3390/w17213110
Submission received: 10 September 2025 / Revised: 24 October 2025 / Accepted: 26 October 2025 / Published: 30 October 2025
(This article belongs to the Section Urban Water Management)

Abstract

Urban coastal areas are increasingly vulnerable to compound flooding due to the convergence of extreme rainfall, storm surges, and infrastructure aging, especially in high-density settings. This study proposes and empirically validates a multi-scale strategy for enhancing urban flood resilience in the Macau Peninsula, a densely built coastal city with complex flood exposure patterns. Building on a previously developed network-based resilience assessment framework, the study integrates hydrodynamic simulation and complex network analysis to evaluate the effectiveness of targeted interventions, including segmented storm surge defense barriers, drainage infrastructure upgrades, and spatially optimized low-impact development (LID) measures. The Macau Peninsula was partitioned into multiple shoreline defense zones, each guided by context-specific design principles and functional zoning. Based on our previously developed flood simulation framework covering extreme rainfall, storm surge, and compound events in high-density coastal zones, this study validates resilience strategies that achieve significant reductions in inundation extent, water depth, and recession time. Additionally, the network-based resilience index showed marked improvement in system connectivity and recovery efficiency, particularly under compound hazard conditions. The findings highlight the value of integrating spatial planning, ecological infrastructure, and systemic modeling to inform adaptive flood resilience strategies in compact coastal cities. The framework developed offers transferable insights for other urban regions confronting escalating hydrometeorological risks under climate change.

1. Introduction

High-density coastal urban areas face escalating flood risks due to the compounded impacts of climate change, land-use intensification, and aging infrastructure systems. In particular, cities like Macau, characterized by extreme urban density, limited land resources, and extensive coastal exposure, are increasingly vulnerable to both pluvial flooding from extreme rainstorms and coastal flooding from storm surges. Recent severe flood events, such as those induced by the Typhoons Hato and Mangkhut [1], have highlighted the deficiencies in the existing flood defense systems and underscored the urgent need for enhanced flood resilience measures in such urban contexts. However, the practical implementation of such strategies remains limited in high-density coastal contexts.
Over the past decade, scholars have developed various frameworks to enhance urban flood resilience, often grounded in integrated risk governance, distributed stormwater management, and adaptive spatial planning [2,3]. For instance, embedding decentralized stormwater into urban spatial design to reduce pluvial flooding is emphasized in recent cross-city reviews and BGI framework studies [4,5]. Similarly, risk-governance frameworks that integrate hazard, exposure/land-use vulnerability, and resilience for decision support have been updated and systematized [6,7]. Other works highlight a system-based resilience transition, beyond hard infrastructure to include early warning systems, community preparedness, and adaptive land-use planning [8,9,10]. Notably, nature-based solutions such as sustainable urban drainage systems, green roofs, and vegetated swales have gained prominence as effective tools for reducing runoff while enhancing ecological and social co-benefits [11,12,13]. Despite this progress, few studies translate these resilience concepts into spatially actionable strategies, especially for dense urban districts constrained by land scarcity and infrastructure rigidity [14,15].
In terms of modeling, substantial efforts have been devoted to flood risk identification through hydrodynamic simulation, remote sensing, and geospatial analytics [16,17]. Approaches include the application of source–pathway–receptor models to coastal urban settings [18], the use of high-resolution flood simulations with 3D visualization to support stakeholder decision making [19], GIS-based coastal hazard zoning for urban areas [20], and the development of quantitative flood resilience evaluation frameworks that integrate pressure–state–response perspectives with advanced analytical methods such as rough set theory [21]. Recent work, including a comprehensive flood risk assessment of the Macau Peninsula based on simulations under multiple disaster scenarios [22,23], has provided detailed insights into the spatial distribution of flood hazards in high-density coastal environments.
While numerous studies identify high-risk areas or propose generalized adaptation strategies, few incorporate quantitative validation of specific spatial interventions through integrated modeling [24]. Moreover, a disconnect persists between conceptual resilience frameworks and operational urban design guidelines [25]. Additionally, existing models rarely evaluate the systemic performance of flood mitigation strategies across resistance, absorption, and recovery phases using complex systems thinking [26]. This lack of spatial granularity and empirical validation hinders the applicability of resilience strategies in planning practice.
Our study aims to bridge that gap by developing and testing spatially explicit flood resilience strategies for the Macau Peninsula. Building upon our previously validated flood hazard simulation framework [22], which quantified inundation risk across pluvial, coastal, and compound flood scenarios, and our network-based flood resilience assessment model [27], which translated urban system performance into measurable indicators of resistance, absorption, and recovery, this study integrates both methodological foundations into a unified strategy-validation platform.
Specifically, the model is extended by embedding a suite of urban design interventions, including storm surge barriers, low-impact development (LID) measures [28,29], and amphibious infrastructure, into the scenario-based framework to test their systemic effects on resilience. Although several flood risk studies have been conducted for Macau, most remain at the stage of hazard identification or propose generalized adaptation recommendations without spatially explicit implementation or quantitative validation [30,31]. Moreover, few studies provide empirical evidence on how such spatial strategies perform under compound flooding conditions or assess their system level impacts across different resilience dimensions [32,33]. Our study addresses these gaps by embedding targeted spatial interventions into an established simulation framework and validating their performance through multi-scenario testing. The effectiveness of these strategies is evaluated under diverse flood conditions, including independent rainstorm events, storm surges, and compound disaster scenarios. The results demonstrate their capacity to reduce inundation extent, water depth, and recession time while enhancing overall network functionality. By doing so, this research advances the practical implementation of integrated flood resilience measures and provides a replicable model for other high-density coastal cities facing similar challenges.
The primary objectives of our study are as follows: (1) to propose a spatially grounded multi-strategy flood resilience framework designed for high-density coastal urban areas; (2) to integrate these interventions into a validated hydrodynamic simulation model for effectiveness testing; (3) to generate empirical evidence of risk reduction through scenario-based modeling; (4) to assess the systemic impact of spatial strategies using a resilience evaluation model grounded in complex network theory.

2. Methodology

2.1. Integrated Research Framework

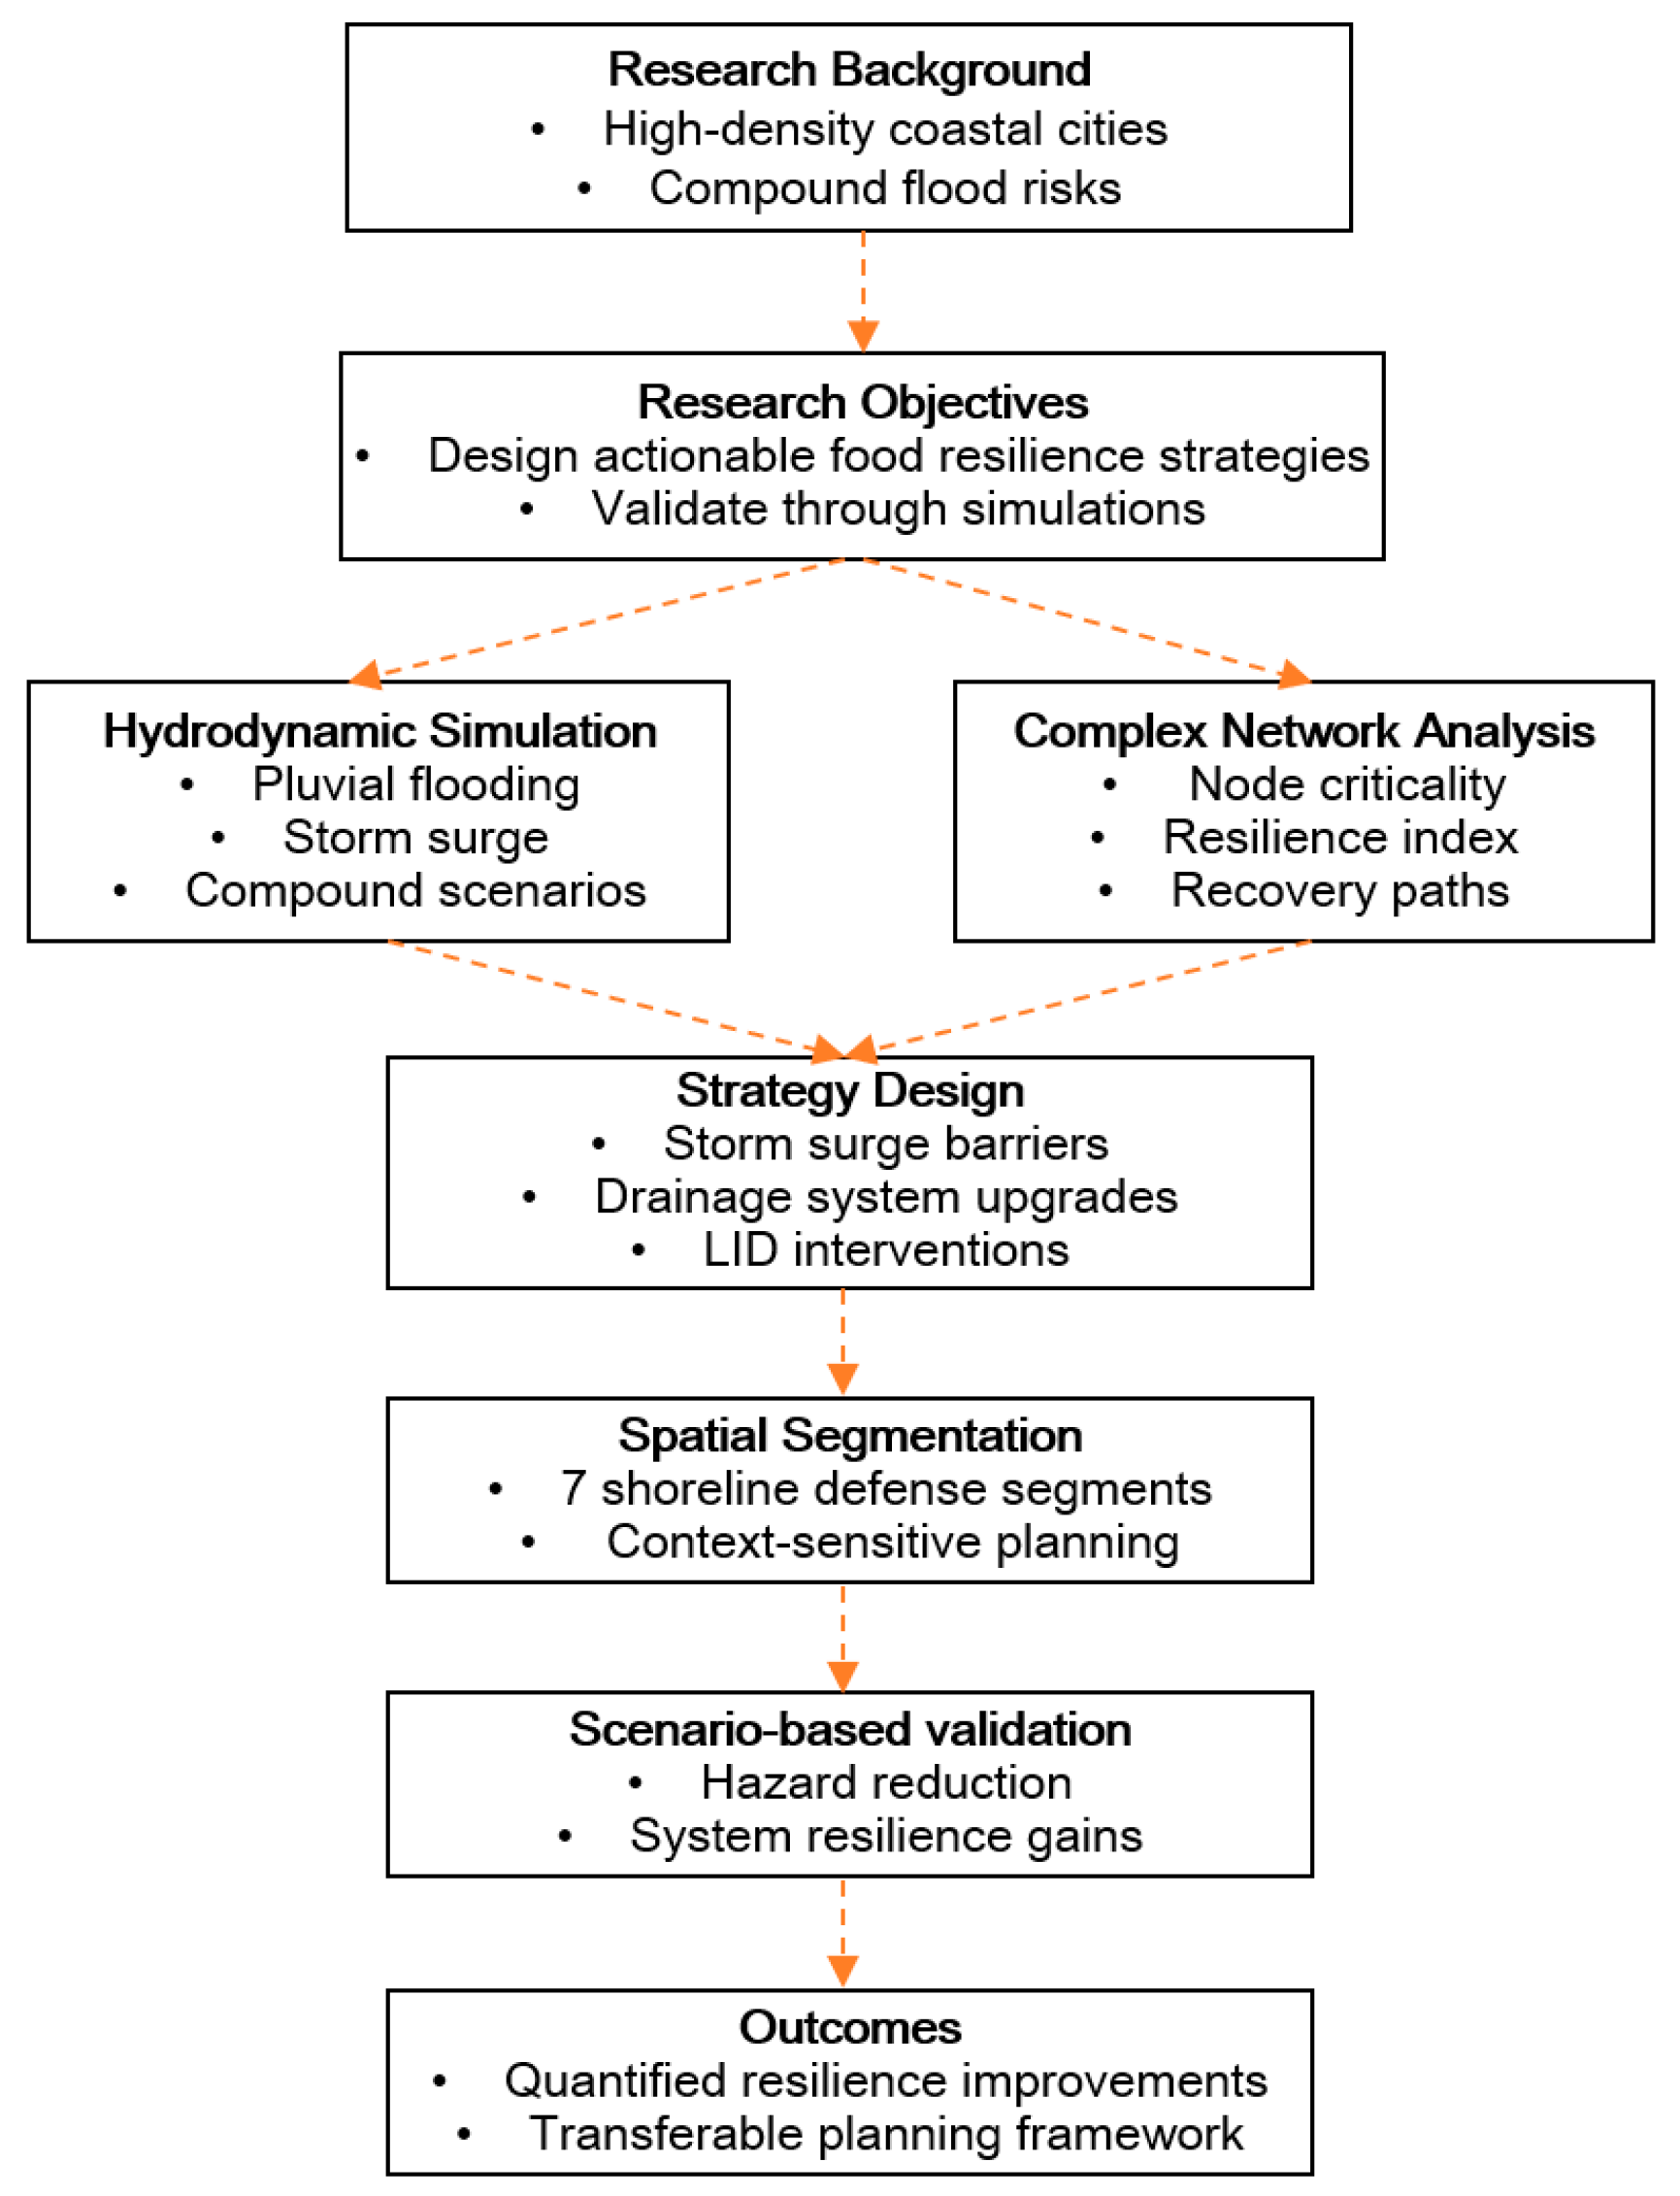
Our study adopted a multi-stage methodological approach that integrates disaster scenario simulation, resilience strategy deployment, and systemic impact evaluation. The overall framework included three components (Figure 1): (1) constructing baseline and strategy-adjusted flood scenarios using a validated hydrodynamic model; (2) deploying spatially grounded resilience strategies based on flood mechanism diagnosis and vulnerability mapping; (3) evaluating strategy effectiveness through both risk indicators [22] and a network-based resilience measurement model [27].

2.2. Data Sources and Scenario Construction

The simulation was based on high resolution datasets including digital elevation models (DEM) [34], land-use classification, building footprints [35], drainage network data [35], and historical flood event records [36]. Three representative flood scenarios were constructed: (1) rainstorms; (2) storm surge; (3) compound event (synchronous extreme rainstorm and high tide) [22].To represent extreme compound flooding conditions, the rainfall hyetograph and storm surge time series were synchronized so that their peaks coincide, simulating a “peak-to-peak” scenario that maximizes potential flood impact. These scenarios reflect the primary hazard types that Macau faces and were defined based on historical extreme events, hydrological return periods, and future climate risk projections. Flood simulations were conducted using InfoWorks ICM version 11.0, incorporating dynamic interactions between surface runoff, underground drainage, and boundary water levels [34,37]. Key configuration parameters included a 5 m resolution 2D mesh and a 60 s time step to balance the computational efficiency and accuracy. The model setup included 6035 nodes, 107 outfalls, and 5744 sub-catchments after hydrological generalization. These simulation parameters were comprehensively calibrated and validated using observed flood data in our previous study [22].

2.3. Strategy Modeling and Parameter Adjustment

The hydrodynamic simulation model used in our study was based on a previously developed and validated framework [22], which captured the spatiotemporal dynamics of pluvial, fluvial, and compound flood events across the Macau Peninsula. This model incorporated high resolution elevation data, drainage networks, land-use types, and historical disaster records and was calibrated using 35 disaster scenarios to ensure robustness across multiple hazard types (Table 1). Model calibration was conducted based on historical flood event data and observed water levels provided by the Macau Direcção dos Serviços de Cartografia e Cadastro (DSCC) [36], ensuring consistency between the simulated and real-world flood extents and depths. These 35 scenarios were used not only to enhance the model’s reliability across different hazard combinations and return periods but also to enable comprehensive simulation coverage. This allowed the selection of representative cases for scenario-based strategy validation in subsequent phases.
Building upon this baseline model, our study introduced three categories of resilience-enhancing spatial strategies [38,39,40]: resistance-oriented, absorption-oriented, and recovery-oriented interventions into the simulation environment (Table 2). These strategies were optimized spatially according to local functional needs and risk hotspots identified in prior simulations.
In the strategy verification phase, one extreme flood scenario was selected from each of the three hazard types for simulation. Specifically, a 50-year return period rainstorm event was chosen for the pluvial flooding scenario, a black alert level storm surge for the tidal flooding scenario, and a compound event combining a black alert level storm surge with a 50-year rainstorm for the compound scenario. These scenarios represent the most severe but plausible disaster conditions for high-density coastal cities such as Macau.
To implement the proposed resilience optimization strategies, the following adjustments were made to the baseline hydrodynamic model: (1) infrastructure upgrade: The existing combined sewer system in the high-density urban areas was restructured into a separated sewer system, based on strategy recommendations. The original pipe diameters were retained for comparability; (2) coastal defense enhancement: Storm surge defense barriers were added at critical coastal segments. The minimum design height of 3 m for these barriers was determined based on historical records provided by the Macau DSCC, which documented 14 extreme storm surge events between 1974 and 2020 [41], with the maximum recorded inundation water level reaching 2.38 m. To ensure adequate protection under future compound flooding scenarios, a conservative buffer was applied, setting the effective surge protection height at 3 m; (3) LID: To simulate green infrastructure interventions at scale, two broadly applicable LID measures were adopted. The rooftops of 50% of buildings were converted into green roofs with 50 cm of soil substrate, and all existing green spaces were modeled as sunken green spaces (depressed vegetated areas for runoff retention). These adjustments represent an idealized implementation scenario to test the upper bound effects of the proposed resilience strategies. These modifications ensure that the resilience-enhancing effects of infrastructural, spatial, and ecological interventions can be evaluated comprehensively under extreme flood conditions.

2.4. Resilience Measurement Framework (Complex Network-Based)

The resilience measurement framework established in our prior study was built upon complex network theory, providing a quantifiable and interpretable method to evaluate the flood resilience of high-density urban systems under various hazard scenarios. The method conceptualized the urban physical infrastructure—comprising road networks, functional systems (example, healthcare and emergency response), and spatial units—as an interdependent network of nodes and edges, subject to disruption by flood events. This framework integrated three key dimensions of urban resilience—resistance, absorption, and recovery—into a temporal and topological model: (1) Network Disruption Simulation: urban flooding scenarios (example, 50-year rainstorm and storm surge) were simulated to determine node/edge failures based on inundation depth thresholds and service disruption criteria; (2) Functional System Evaluation: essential urban functions (such as medical care, transportation, and emergency services) were embedded into the network, enabling system level analysis of functional connectivity before, during, and after flood events; (3) Time-based Performance Indexing: a resilience index was computed by tracking how quickly and effectively the system regained critical connectivity over time, based on formulas incorporating the efficiency of restored routes and service accessibilities (Formulas (1)–(5) in the prior study [22,27,42,43,44] (Table 3)). In this study, a node is considered “failed” when the inundation depth at its location exceeds 0.3 m, the critical threshold for safe vehicular passage. This threshold is widely accepted in urban flood studies to represent functional disruption [27,45,46,47].
This methodological foundation served as the baseline for validating our strategy. By comparing resilience indicators before and after the implementation of spatially deployed optimization measures, the effectiveness of the proposed interventions under multiple disaster scenarios was assessed.

3. Study Area and Strategy Design

3.1. Study Area

The Macau Peninsula, a densely developed coastal urban area in southern China, serves as the study area for this research. It spans approximately 9.2 km2 and is characterized by high population and building density [48], limited land resources, and a complex urban fabric composed of both historical districts and modern reclamation zones [49,50]. Coastal waterfronts bound the region on three sides and exhibit substantial elevation variation, with many low-lying areas below 3 m above sea level [51,52].
The infrastructure network in Macau includes a mix of aging combined sewer systems and modern drainage improvements, extensive underground commercial and transit spaces, and numerous critical urban functions concentrated in small zones [51]. These characteristics make the city particularly vulnerable to compound flood events, with high exposure and cascading disruption risks across urban systems [38].

3.2. Design Logic of Strategies

Building upon the spatial risk analysis and scenario-based hydrodynamic simulations, our study strategically deployed resilience-enhancing interventions across the Macau Peninsula. The deployment framework was based on empirical findings from previous studies and resilience measurements, which consistently highlight the disproportionate impact of storm surge events on the urban safety of high-density coastal districts.
The simulation results and network-based resilience assessments reveal that storm surges are a dominant external driver of flood induced disruptions in Macau [53] These events trigger widespread failure of critical nodes and connections within the urban system, significantly degrading the resilience performance of the city [48]. Given that storm surge hazards are capable of compromising both the structural integrity and systemic connectivity, reducing their impact is crucial to improving overall urban flood resilience.
Accordingly, the construction of storm surge defense barriers emerges as an essential strategy to enhance both the resistance capacity and absorption capacity of the urban system. This strategy, alongside ecological absorption measures and system recovery enhancements, forms a comprehensive intervention package calibrated for Macau’s spatial constraints and compound risk profile. The spatial deployment follows three key principles: (1) alignment with localized flood risk typologies, (2) adaptability to existing land-use and infrastructure conditions, and (3) feasibility of intervention implementation in a high-density urban environment.

3.3. Spatial Deployment of Strategies

3.3.1. Drainage Network Upgrade

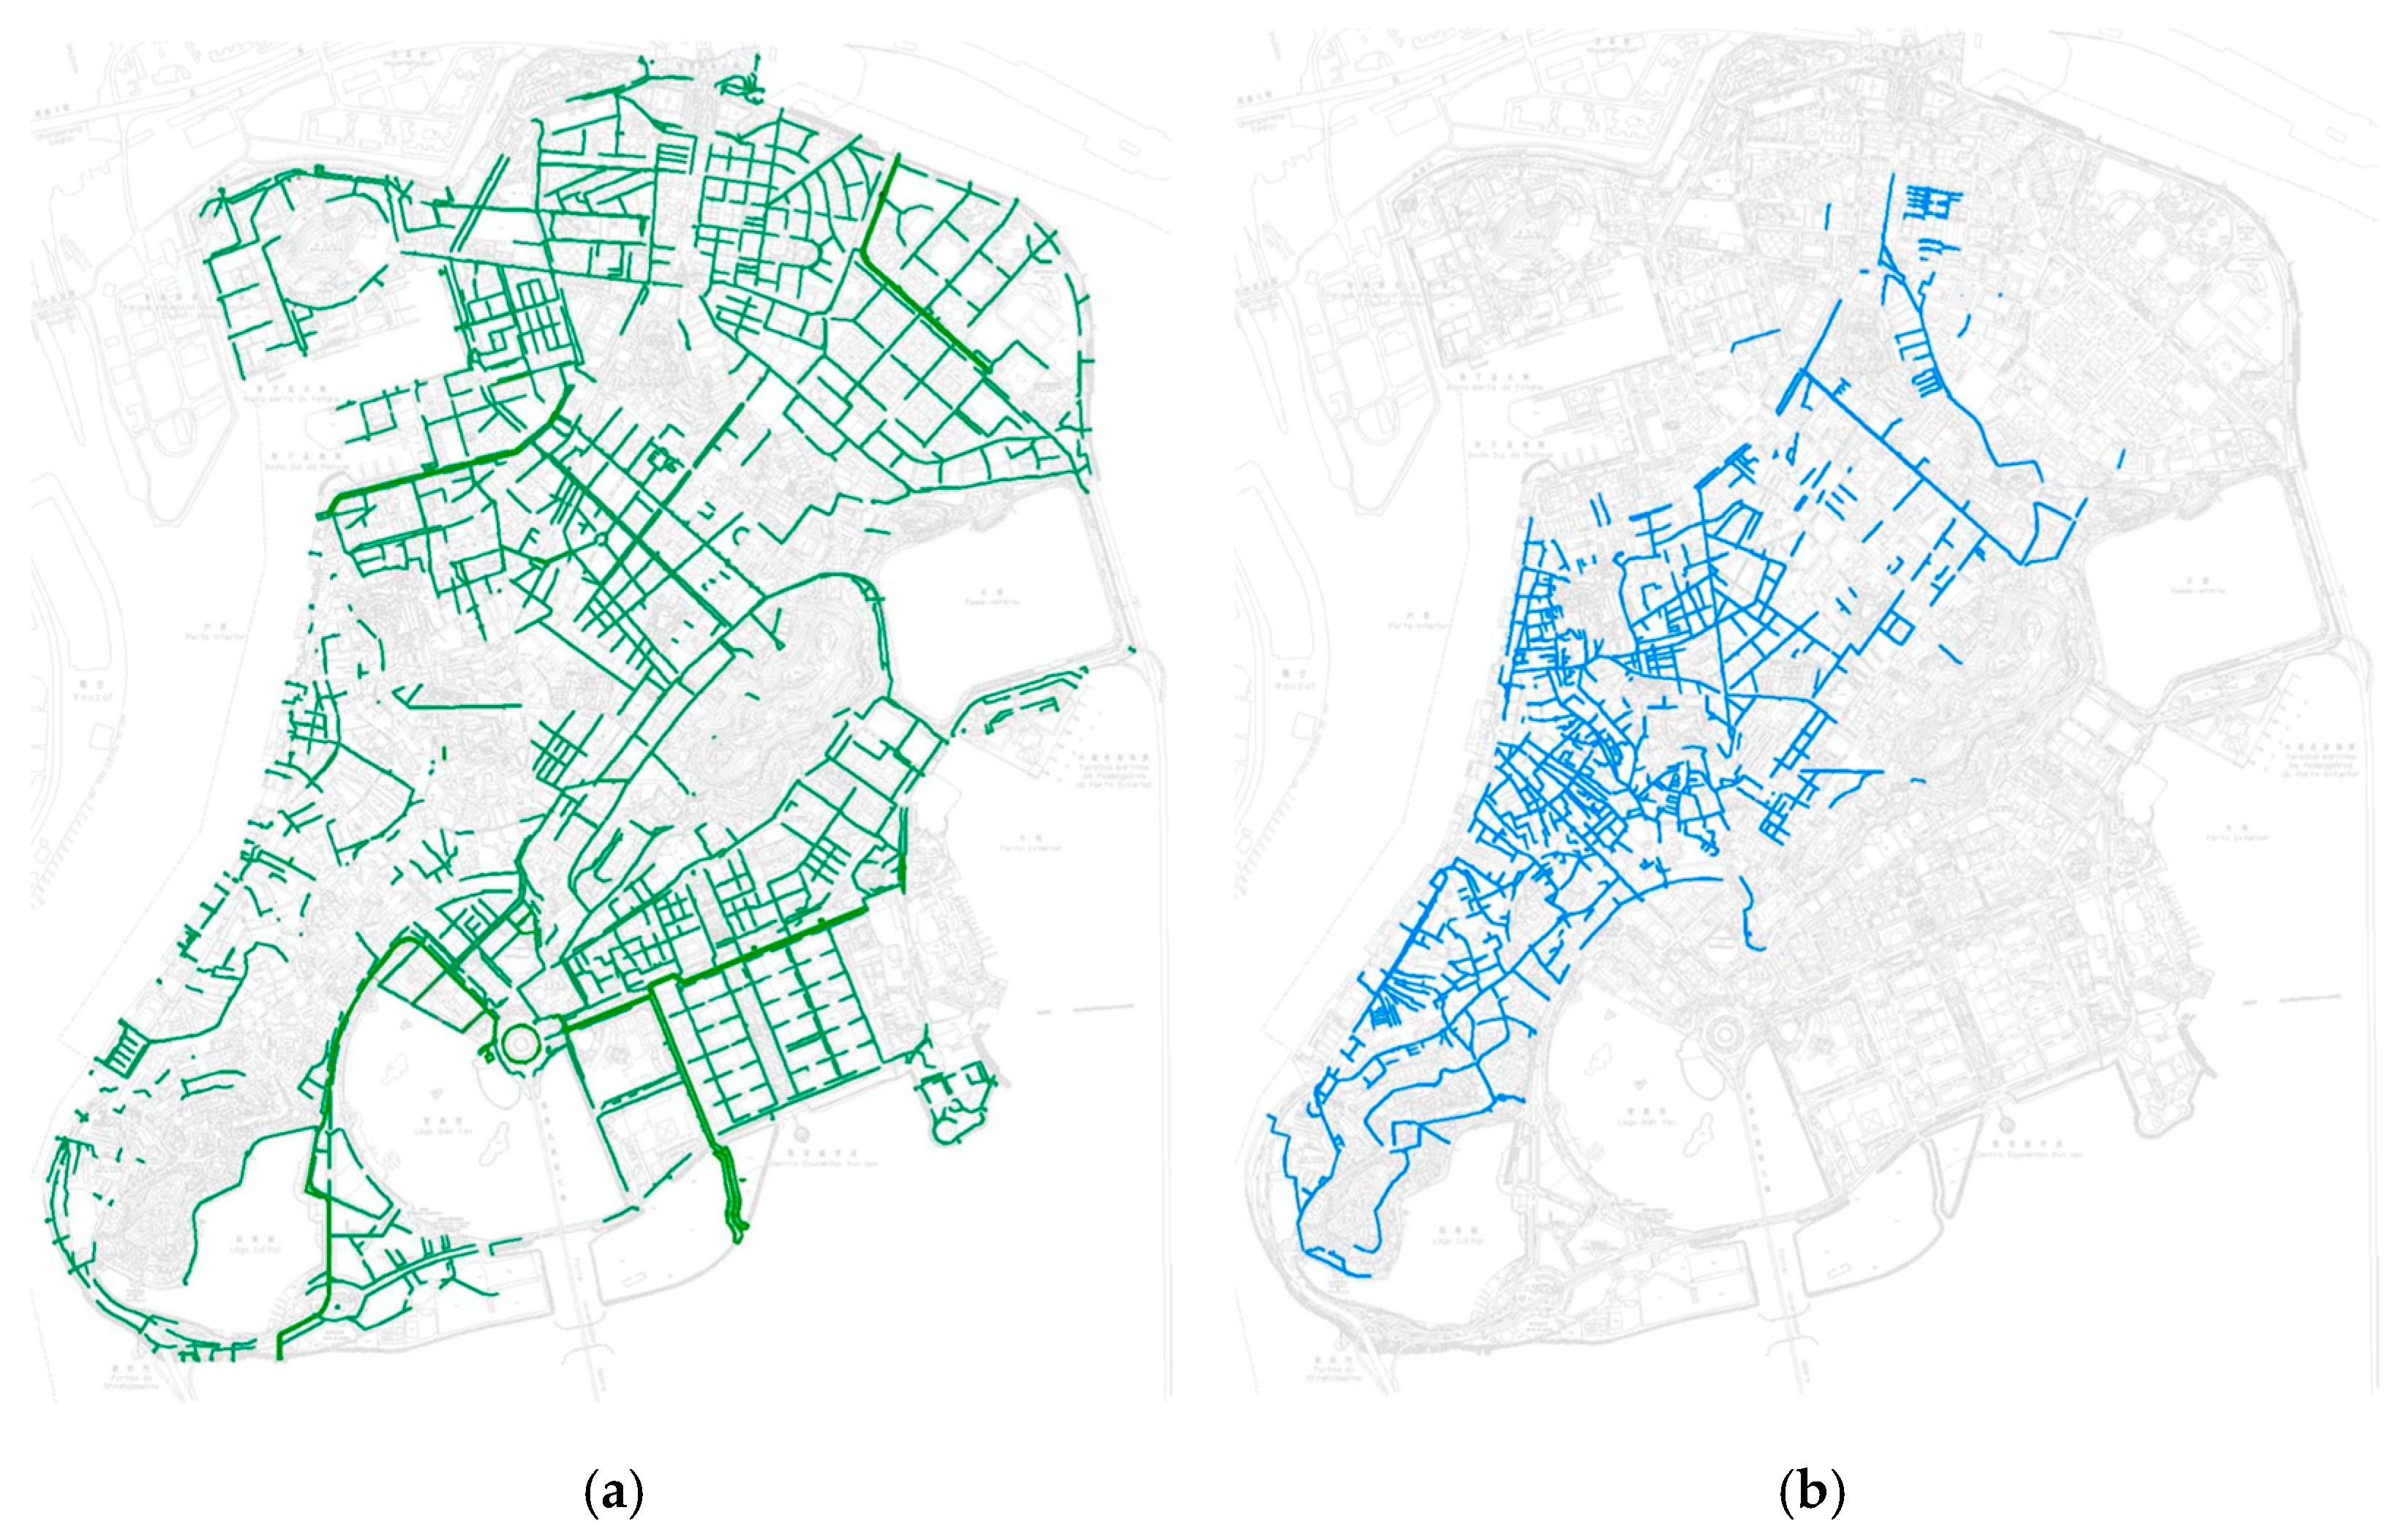
Macau’s drainage system consists of two types of sewers: combined and separate. Newly reclaimed areas are equipped with separate systems, in which rainwater is discharged directly into the sea through stormwater outlets. In contrast, the drainage systems in the older urban areas of the Macau Peninsula, constructed many decades ago under conditions of limited infrastructure and compact urban scale, adopted combined sewer systems. In these areas, stormwater and sewage are conveyed together to the Macau Peninsula Wastewater Treatment Plant and the Cross border Industrial Zone Wastewater Treatment Station.
The Inner Harbor area, which is relatively low-lying, is almost entirely served by combined systems. As shown in Figure 2, combined sewer systems account for 31% of the entire network [54]. Issues such as insufficient design flow and serious aging of infrastructure have further aggravated the drainage challenges in these regions. When facing extreme weather events such as heavy rainstorms or storm surges, these outdated drainage systems are prone to various risks, including sewer backflow, seawater intrusion, overflow of combined pipelines, and inadequate drainage capacity.
Therefore, upgrading the drainage network is an essential part of the overall optimization strategy. The ultimate goal is to convert all existing combined sewer systems into separate sewer systems, thereby fundamentally improving the capacity of the city to cope with urban flood risks.

3.3.2. Storm Surge Barriers

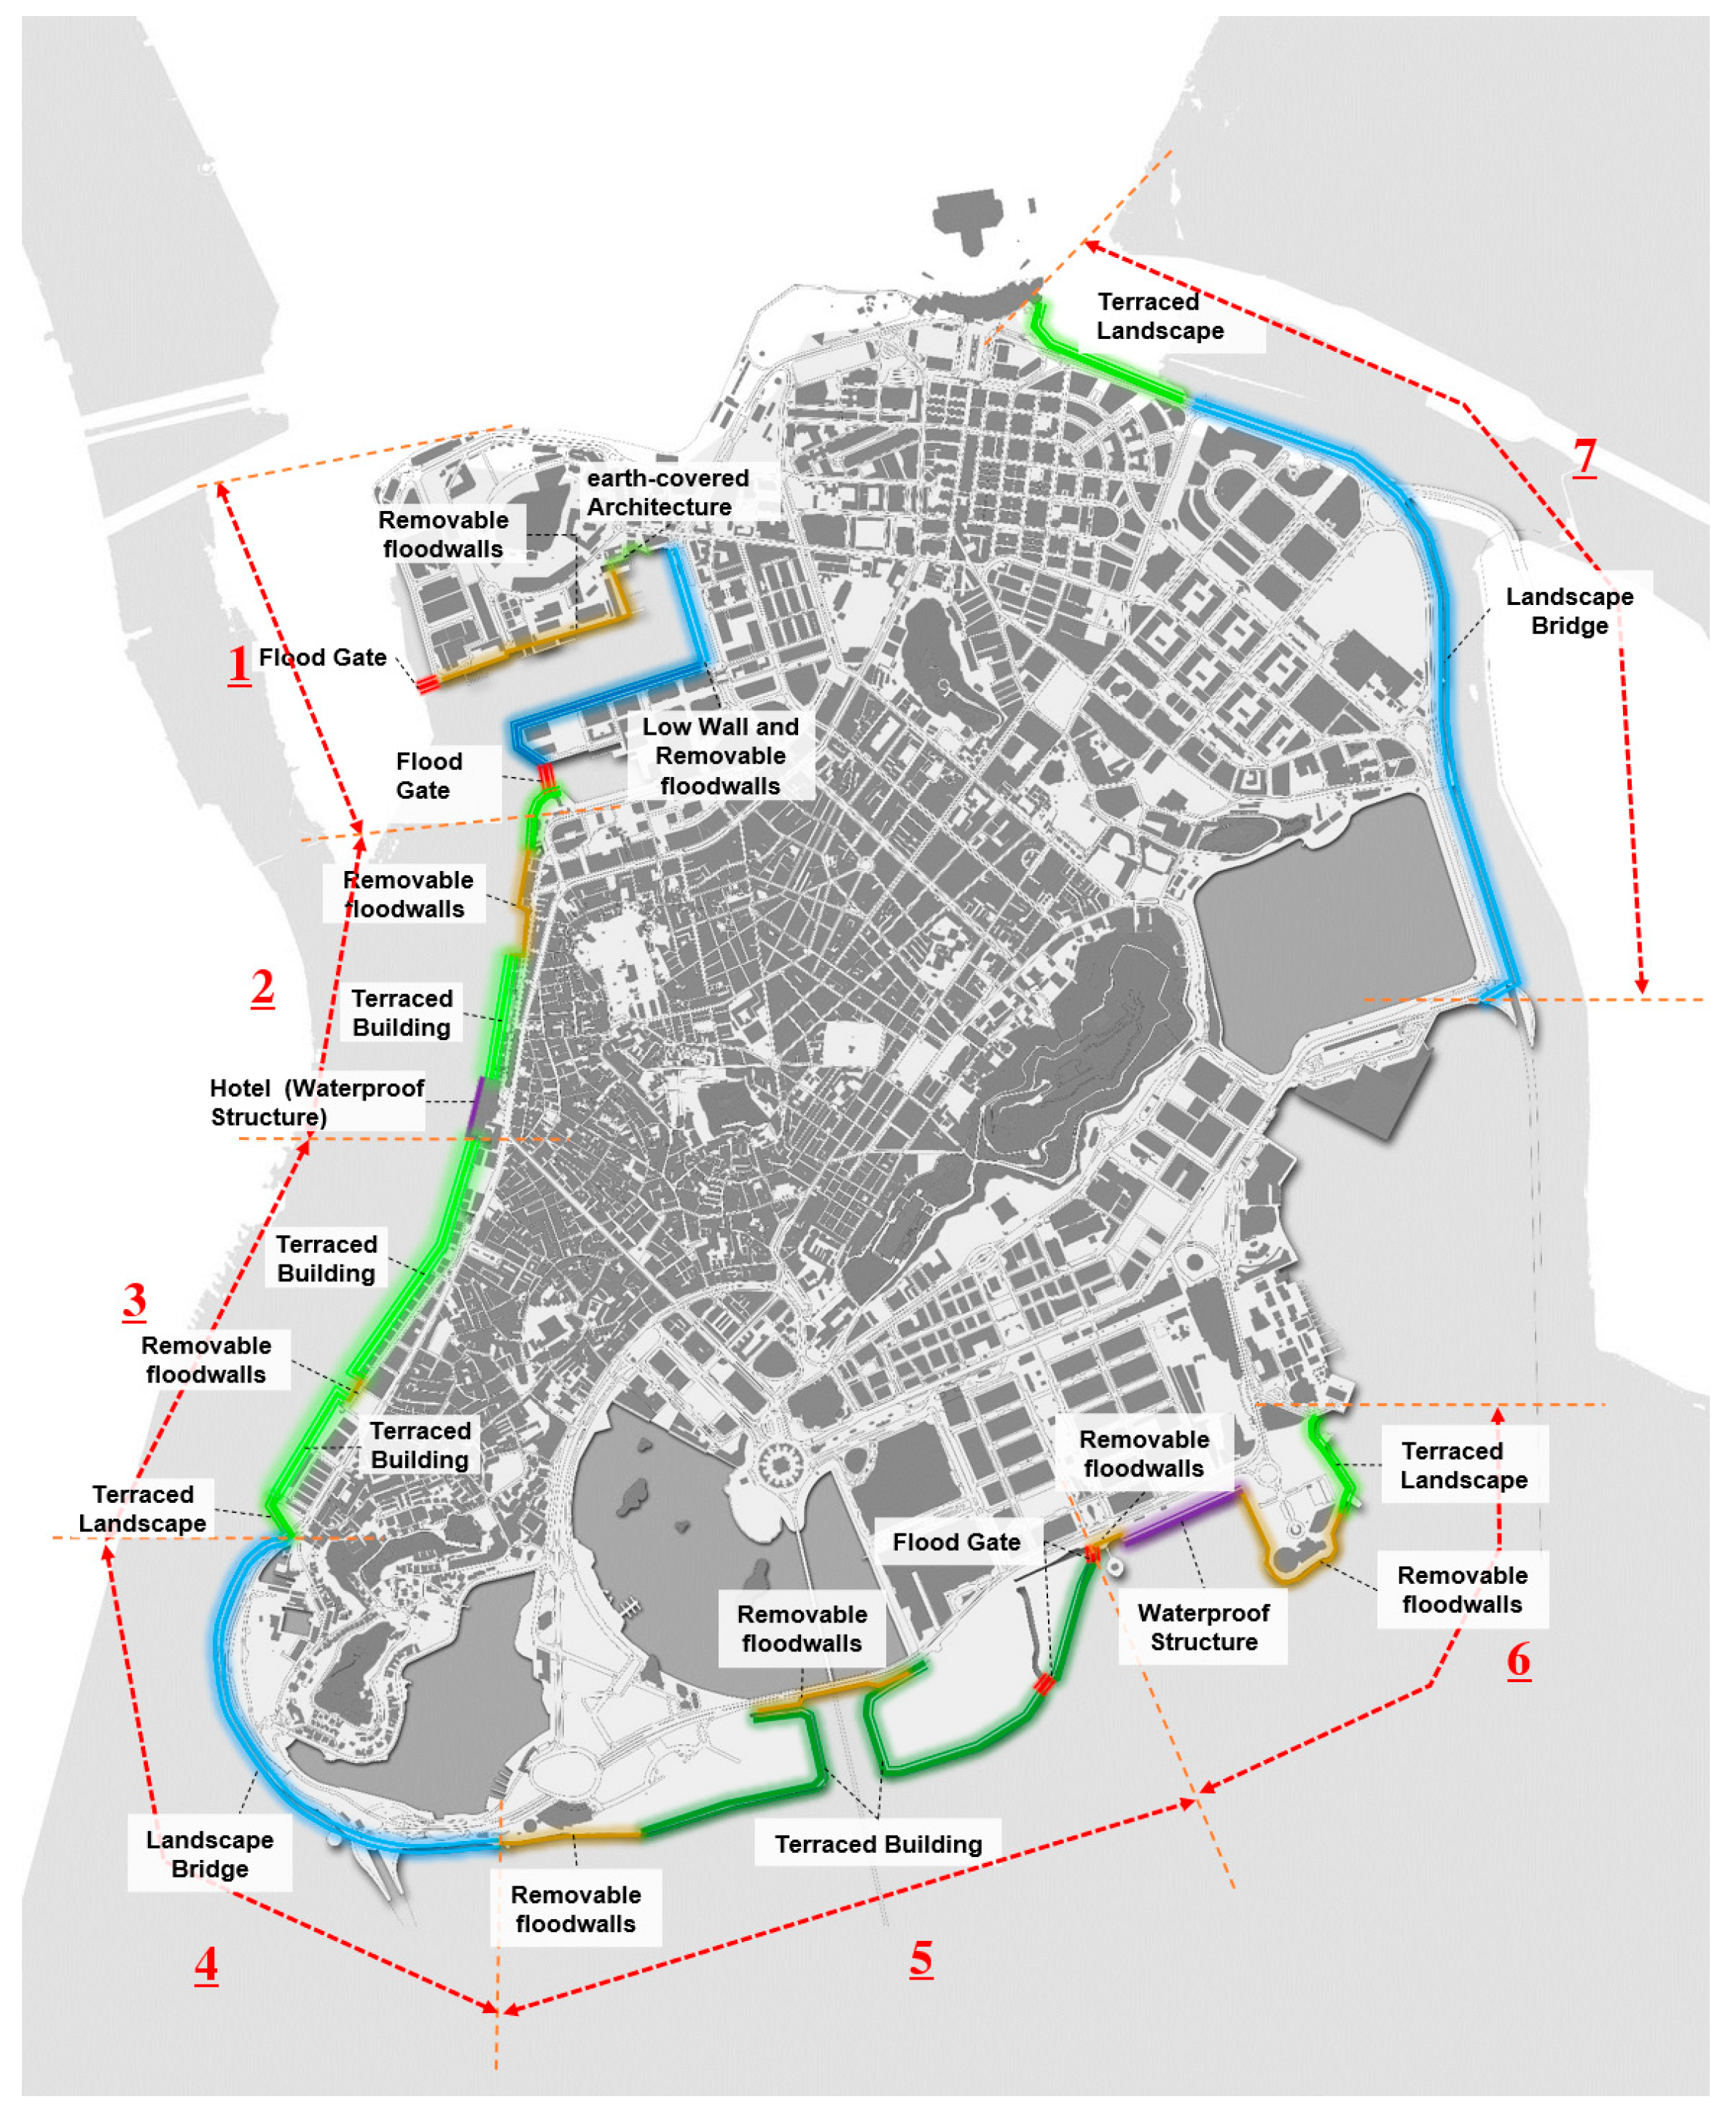
In designing the storm surge barriers, our study refers to the functional spatial distribution within the existing storm surge defense zone, as well as the distribution of proposed defense strategies (Table 4). Areas with similar current functions and convergent defense strategies were grouped and divided accordingly. Subsequently, seven defense sections were defined: Ilha Verde Industrial Zone to North Inner Harbor section, North Inner Harbor to Sofitel Ponte 16 Hotel section, Yuet Tung Pier to Nautical School section, Sai Van Lakefront section, Avenida Dr. Sun Yat-Sen (West Section), Avenida Dr. Sun Yat-Sen (East Section), and Avenida da Amizade to Ponte da Amizade section (Figure 3).
To enhance urban flood resilience, the defense system construction should be organically integrated with urban planning and development. In designing storm surge barriers for Macau’s high-density urban areas, ensuring coordination with the overall urban landscape is essential, so that during disasters, the barriers can effectively provide protection and safeguard the city, while in non-disaster periods, they can serve as part of the urban space, fulfilling ecological, landscape, or public functions and blending into daily life.
Our study developed section-specific defense strategies for seven distinct coastal defense sections in Macau, based on their specific conditions (Figure 3). Each strategy considered key factors such as land-use types, existing infrastructure conditions, and historical flood vulnerability, ensuring that the barriers achieve both functional performance and urban integration.

3.3.3. LID Measures

LID techniques were applied to increase stormwater infiltration and reduce surface runoff. Key interventions include the installation of green roofs on suitable buildings and the creation of sunken green spaces in public areas to temporarily store rainwater during peak storm events. Specifically, the rooftops of approximately 50% of existing buildings were modeled as green roofs with a 50 cm soil substrate, and all existing green spaces were converted into sunken green spaces. This setup was designed to test the potential effectiveness of flood resilience strategies under ideal implementation scenarios. This configuration represents an idealized research scenario designed to test the theoretical potential of flood resilience strategies rather than a depiction of current implementation conditions. Each strategy was formulated in accordance with the specific conditions of the seven shoreline defense segments identified in prior studies, considering factors such as land-use type, existing infrastructure, and historical flood vulnerability (Table 5).

4. Results

The effectiveness of the proposed strategies was assessed through scenario-based simulations, combining hydrodynamic modeling with network level resilience indicators. While the results demonstrate the modeled potential of the interventions to enhance system performance under various flood scenarios, they do not constitute empirical validation in real-world settings. Further studies involving pilot implementation and onsite monitoring are needed to confirm the actual effectiveness of these strategies in practice.

4.1. Validation of Disaster Response Strategies Based on Scenario Simulations

4.1.1. Scenario of a 1-in-50-Year Rainstorm Occurring Independently

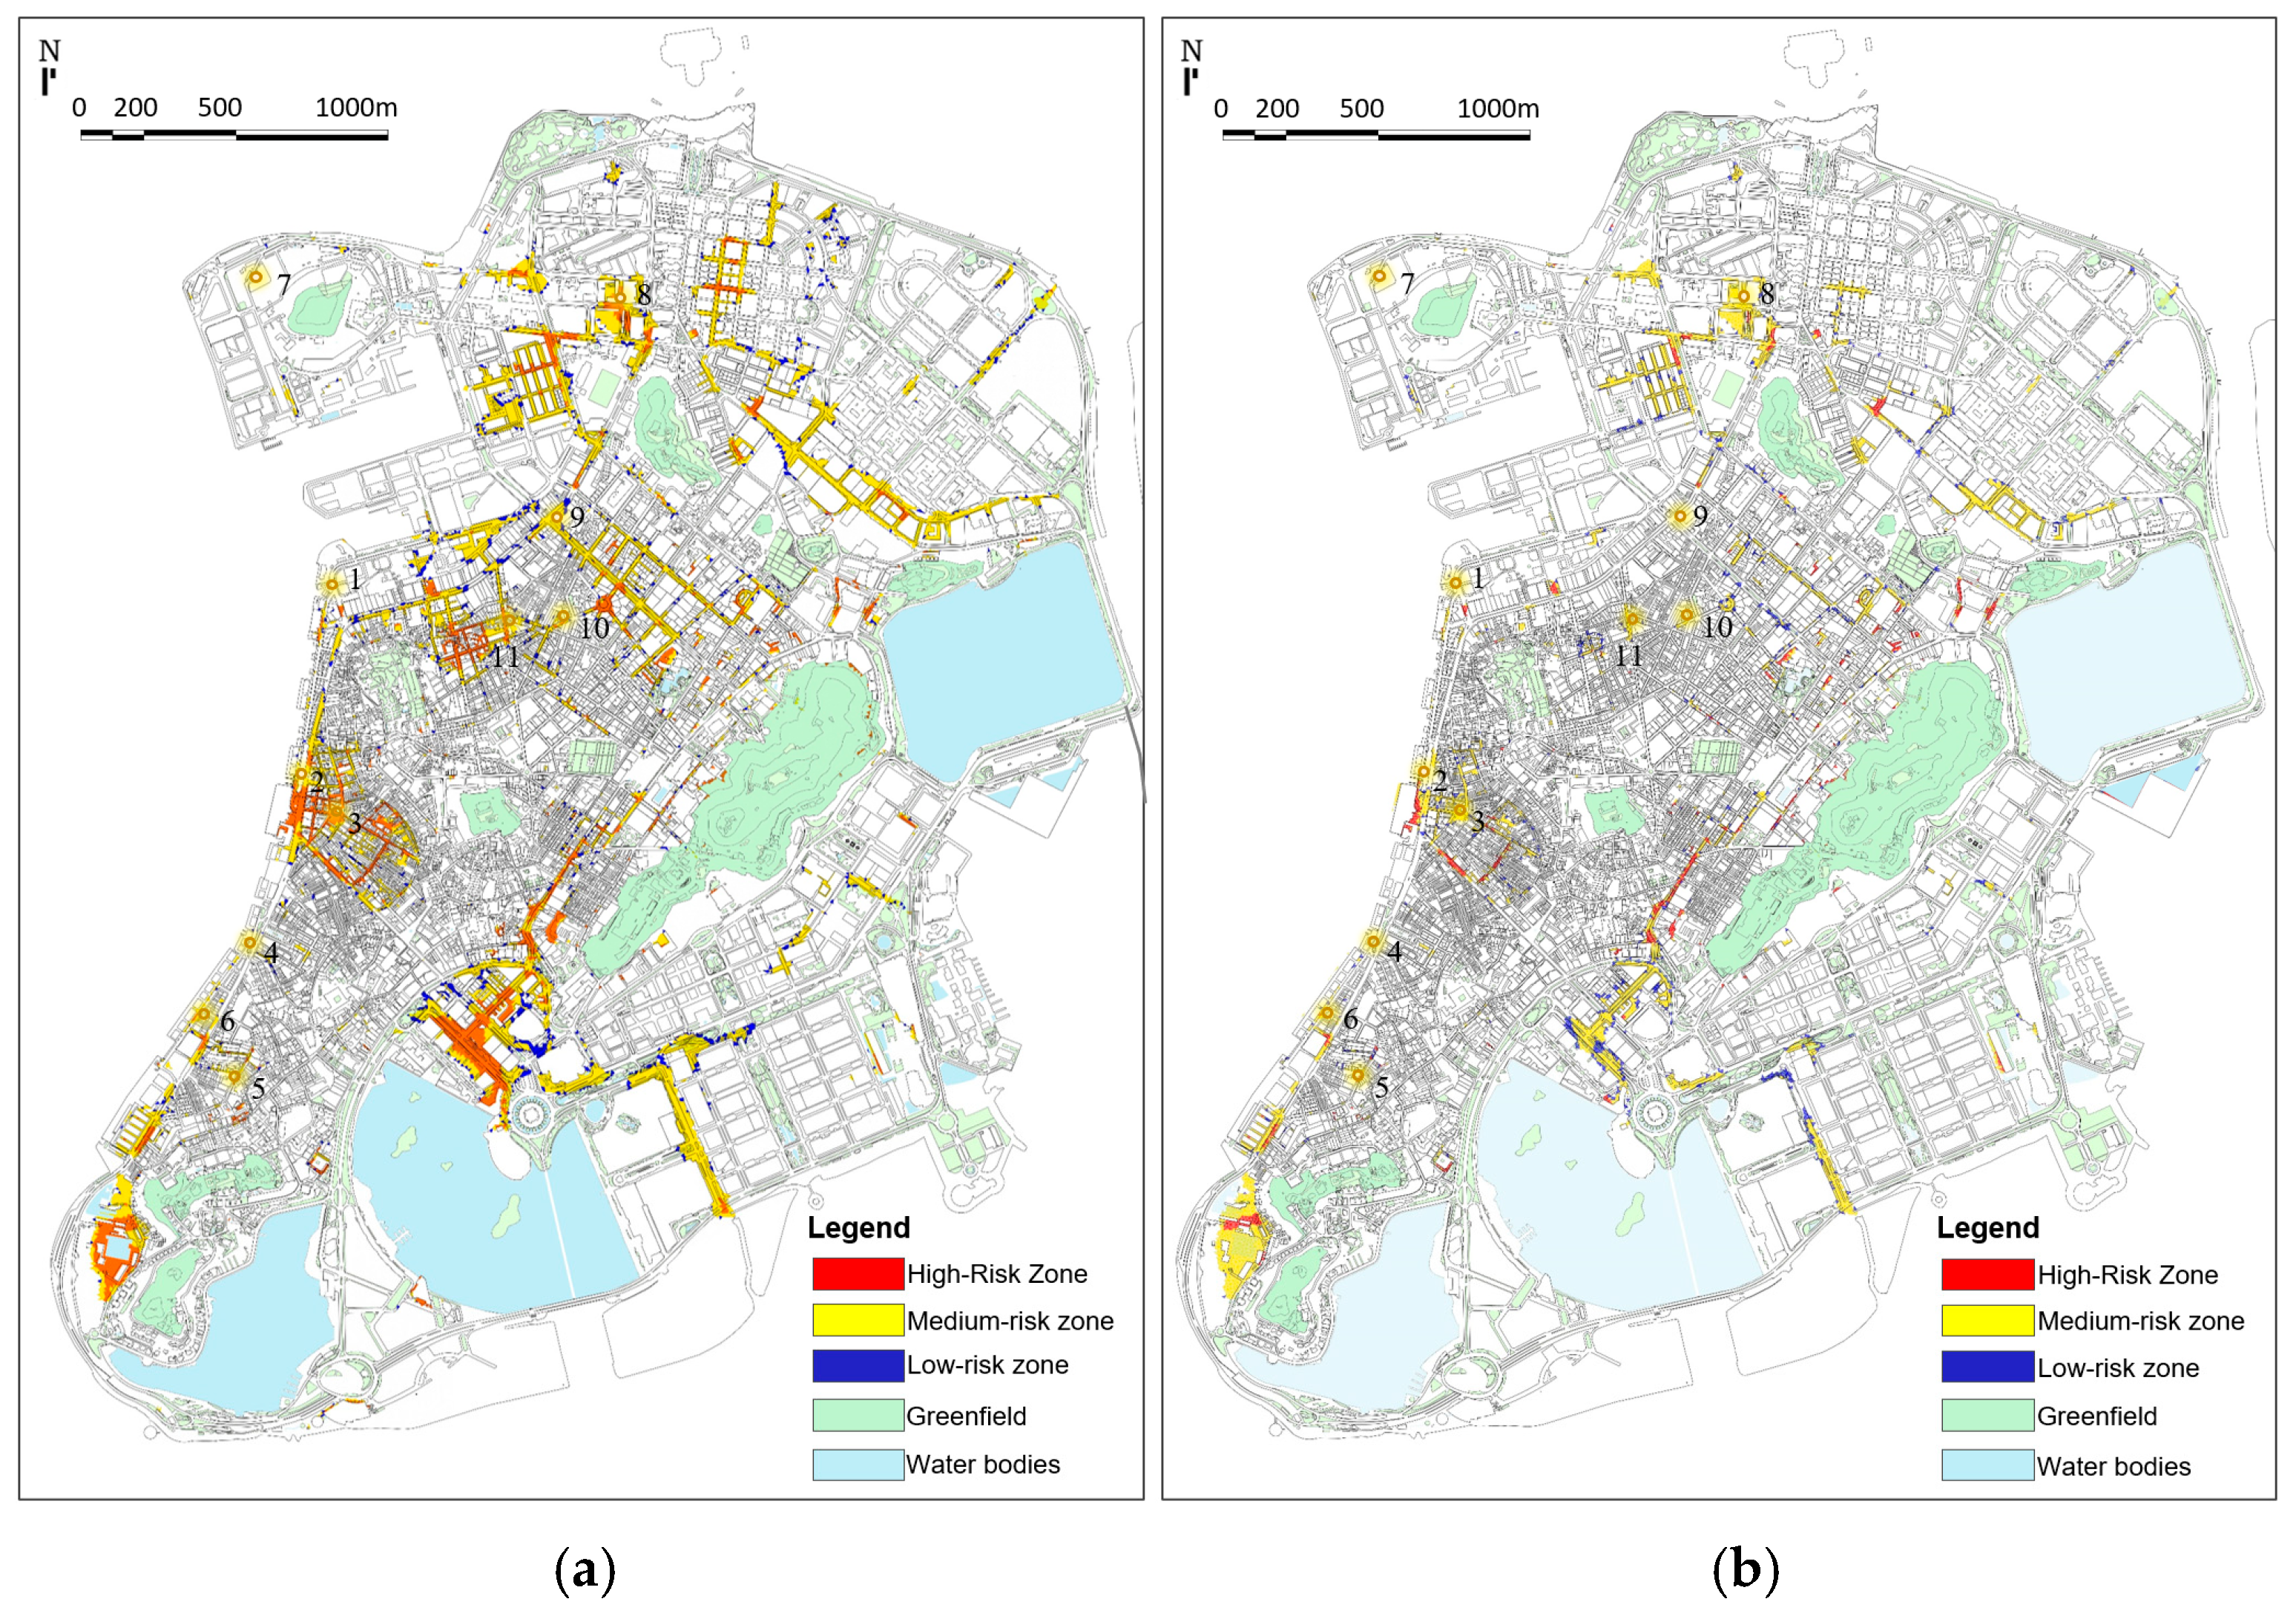
After the implementation of flood resilience optimization strategies, the simulation of a 4 h-long 1-in-50-year rainstorm was conducted. Based on the simulation results and the previously established risk classification criteria, an updated pluvial flood risk map was produced (Figure 4). Comparison between the pre- and post-optimization flood risk maps reveals the following: First, the overall extent of flood prone areas in the high-density urban zone was significantly reduced after the strategies were applied. Second, medium- and high-risk areas within the affected zones were greatly diminished, and most areas with residual risk were now categorized as low risk. These results indicate a substantial improvement in urban flood resilience.
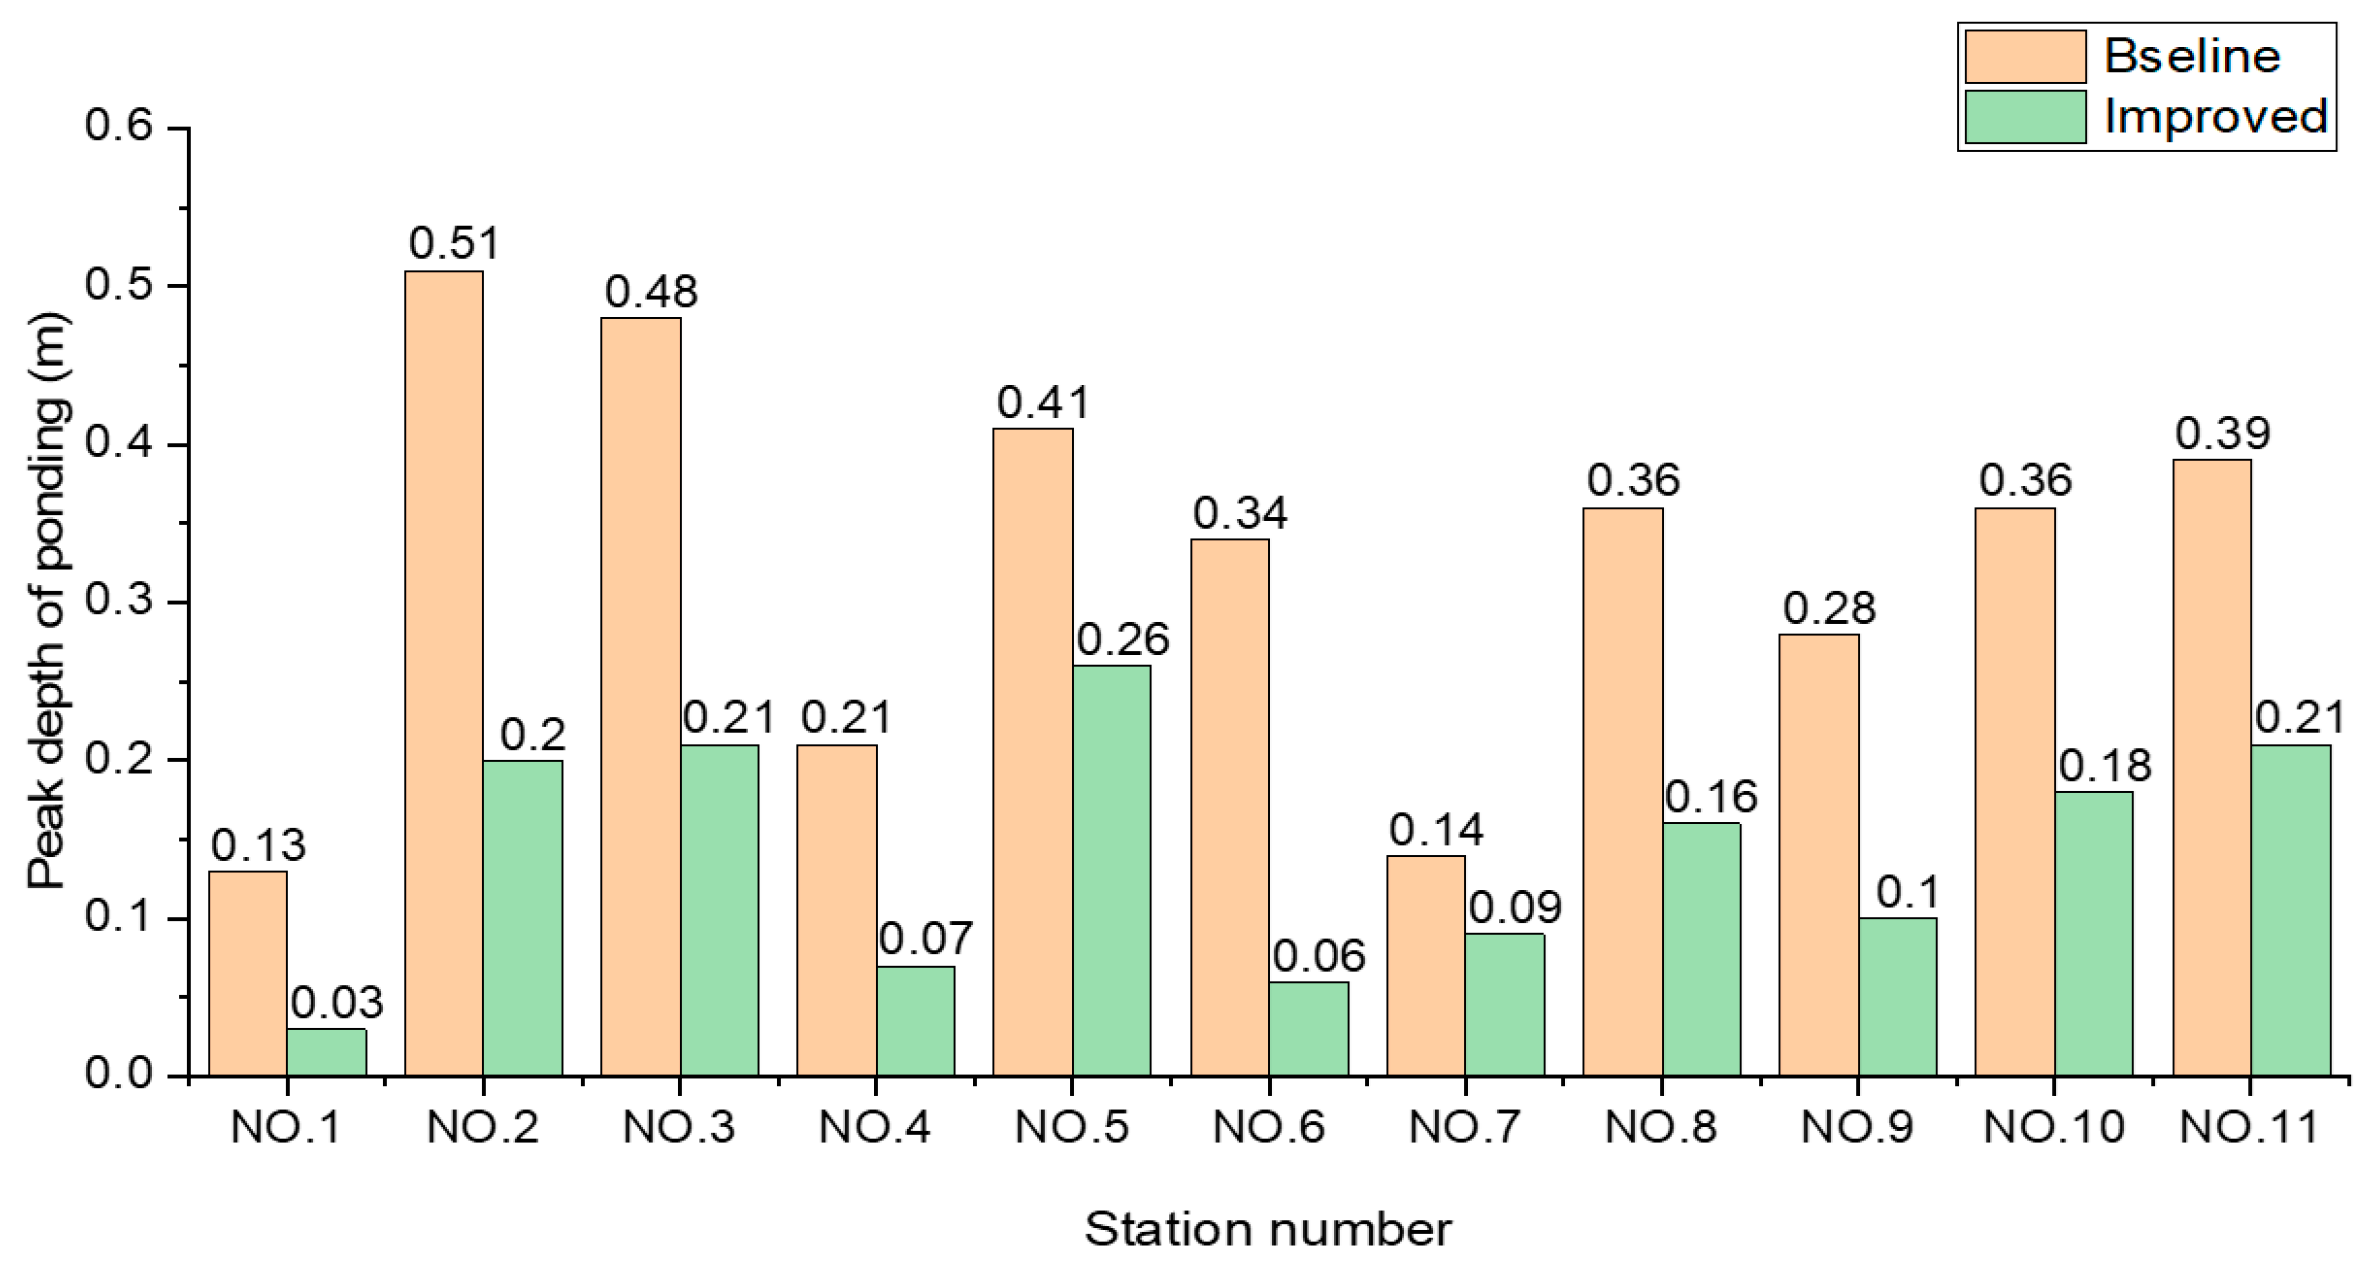
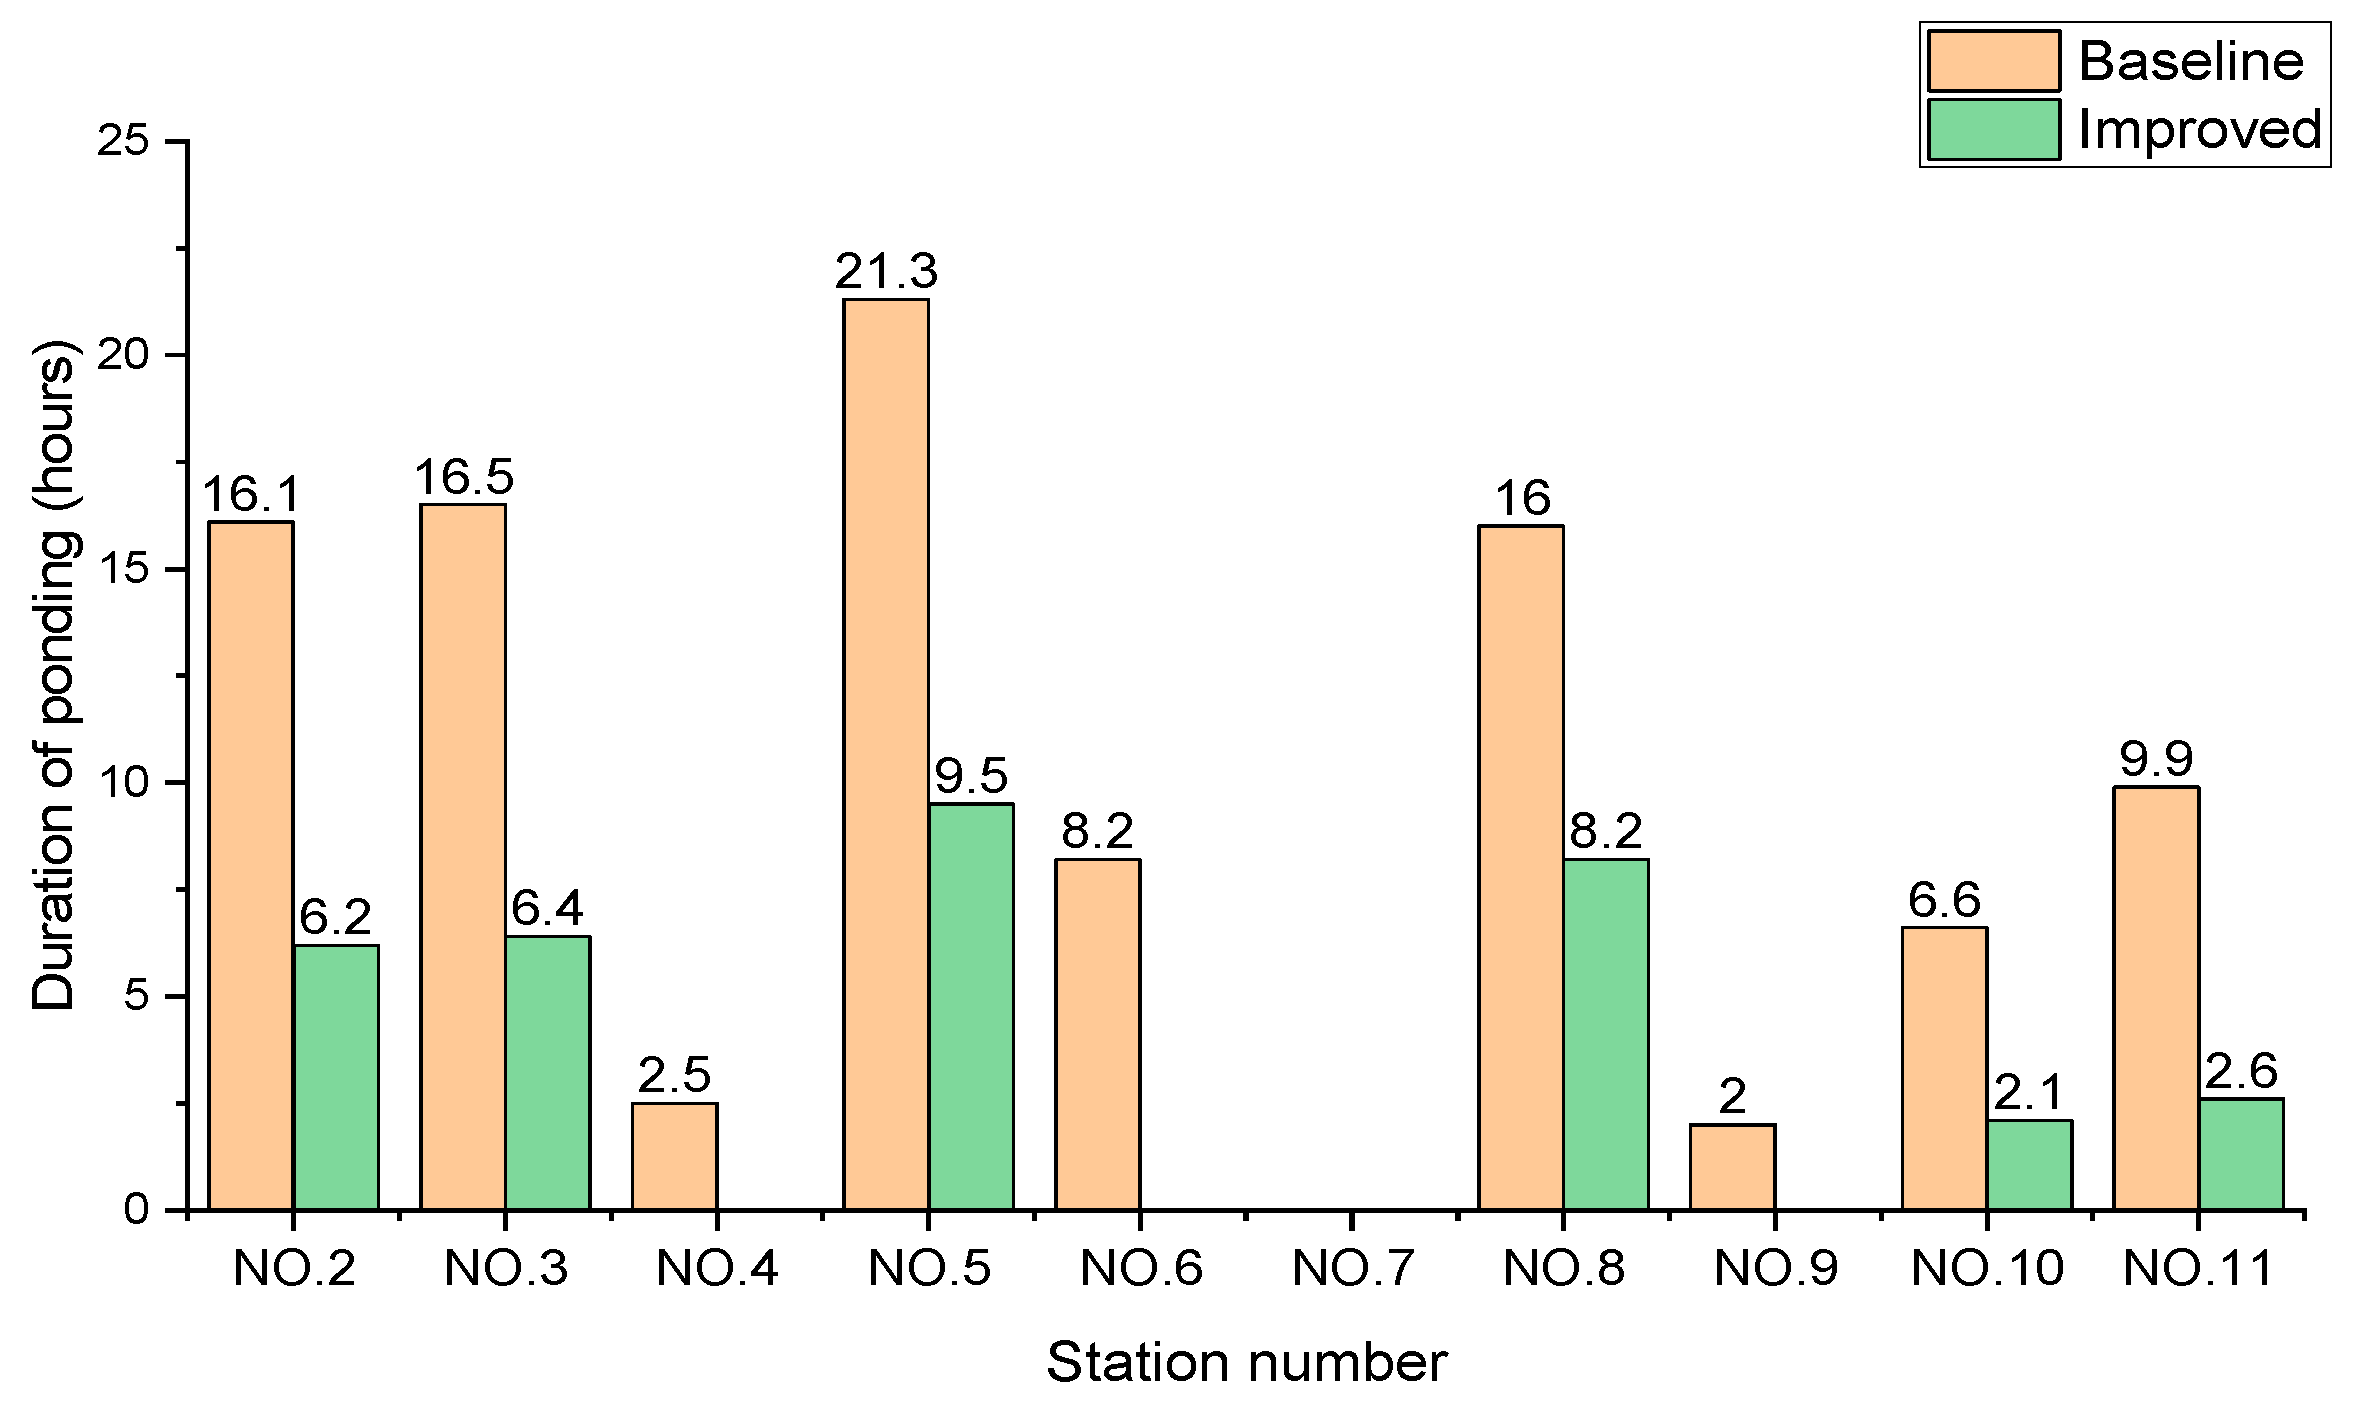
Furthermore, comparison of the maximum water depths and the longest waterlogging durations at monitoring stations before and after optimization (Table 6) shows a marked improvement. The number of stations with water depths exceeding 0.15 m decreased from 9 to 6, and the water depths at all stations dropped significantly (Figure 5). The duration of waterlogging at each station was also reduced, with the longest duration shortened from 21.3 to 9.5 h. (Figure 6).
These improvements can be attributed to the deployment of low-impact development (LID) measures, which increased local infiltration and delayed surface runoff concentration. Green roofs and sunken open spaces served as temporary stormwater storage. By slowing runoff accumulation in low-lying zones, they effectively alleviated the burden on the drainage system. These processes not only reduced the peak inundation depth but also accelerated the recession, demonstrating how distributed absorption strategies can enhance resilience in dense urban districts.

4.1.2. Scenario of a Black Warning Level Storm Surge Occurring Independently

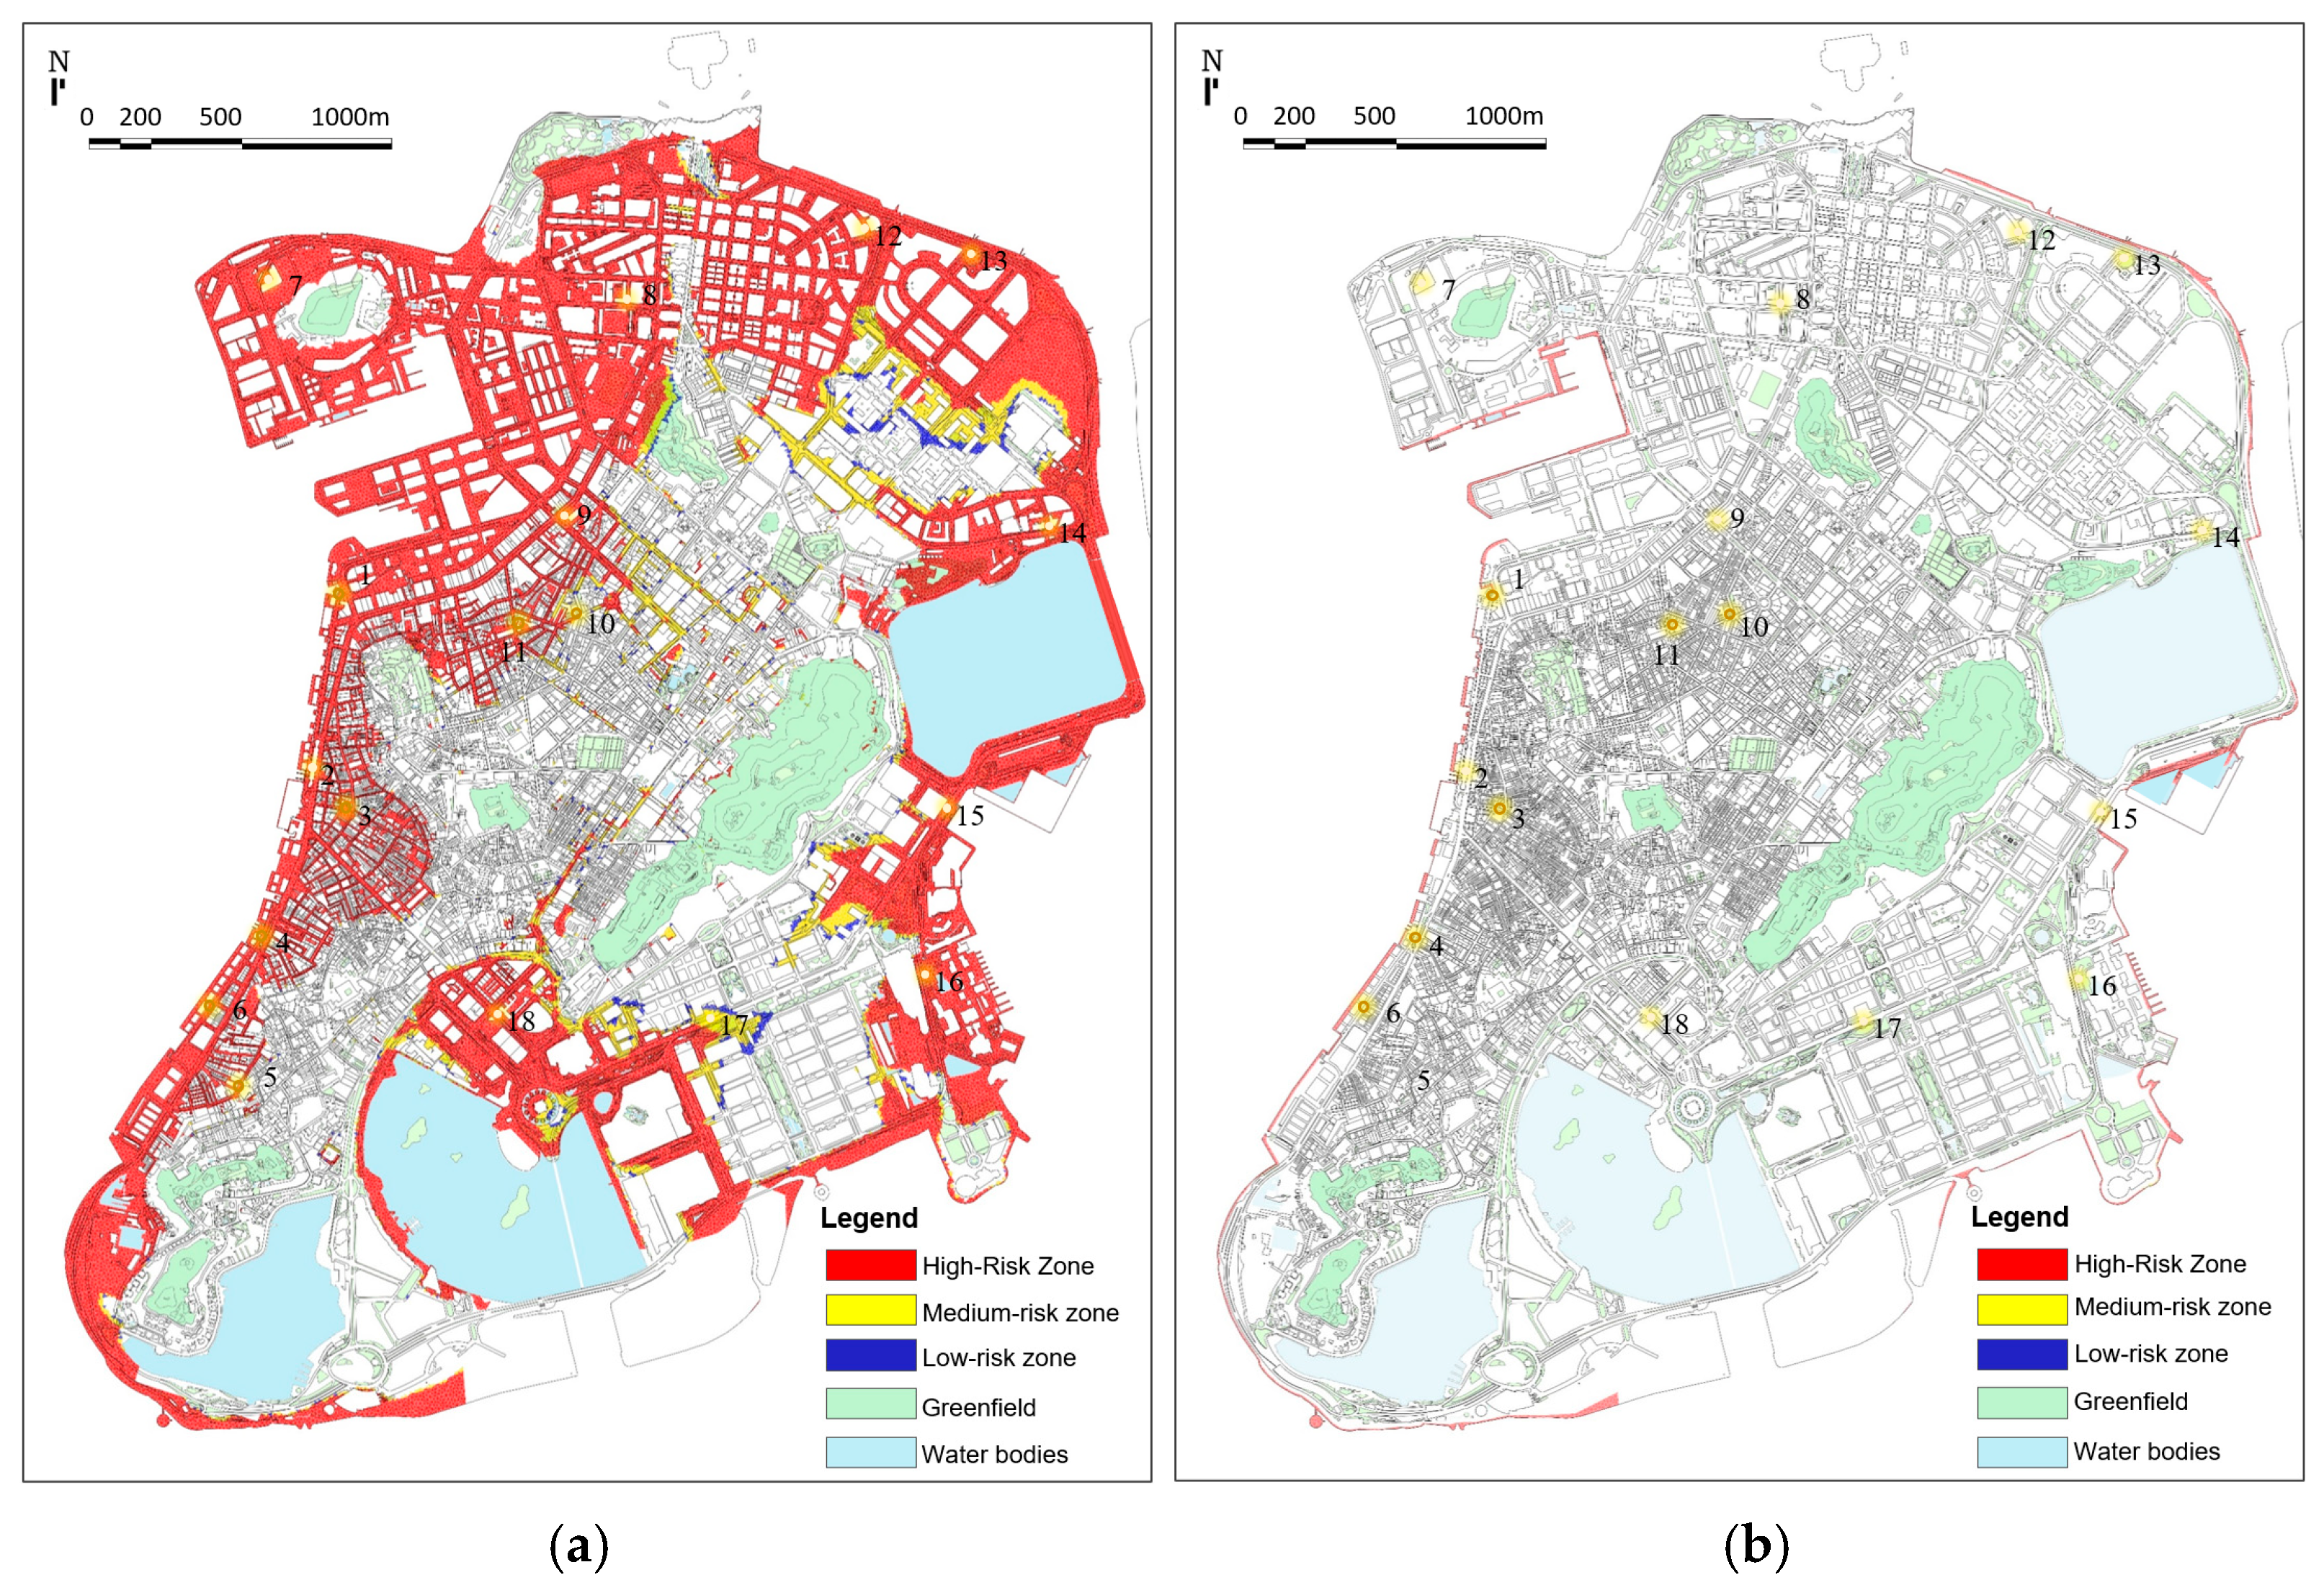
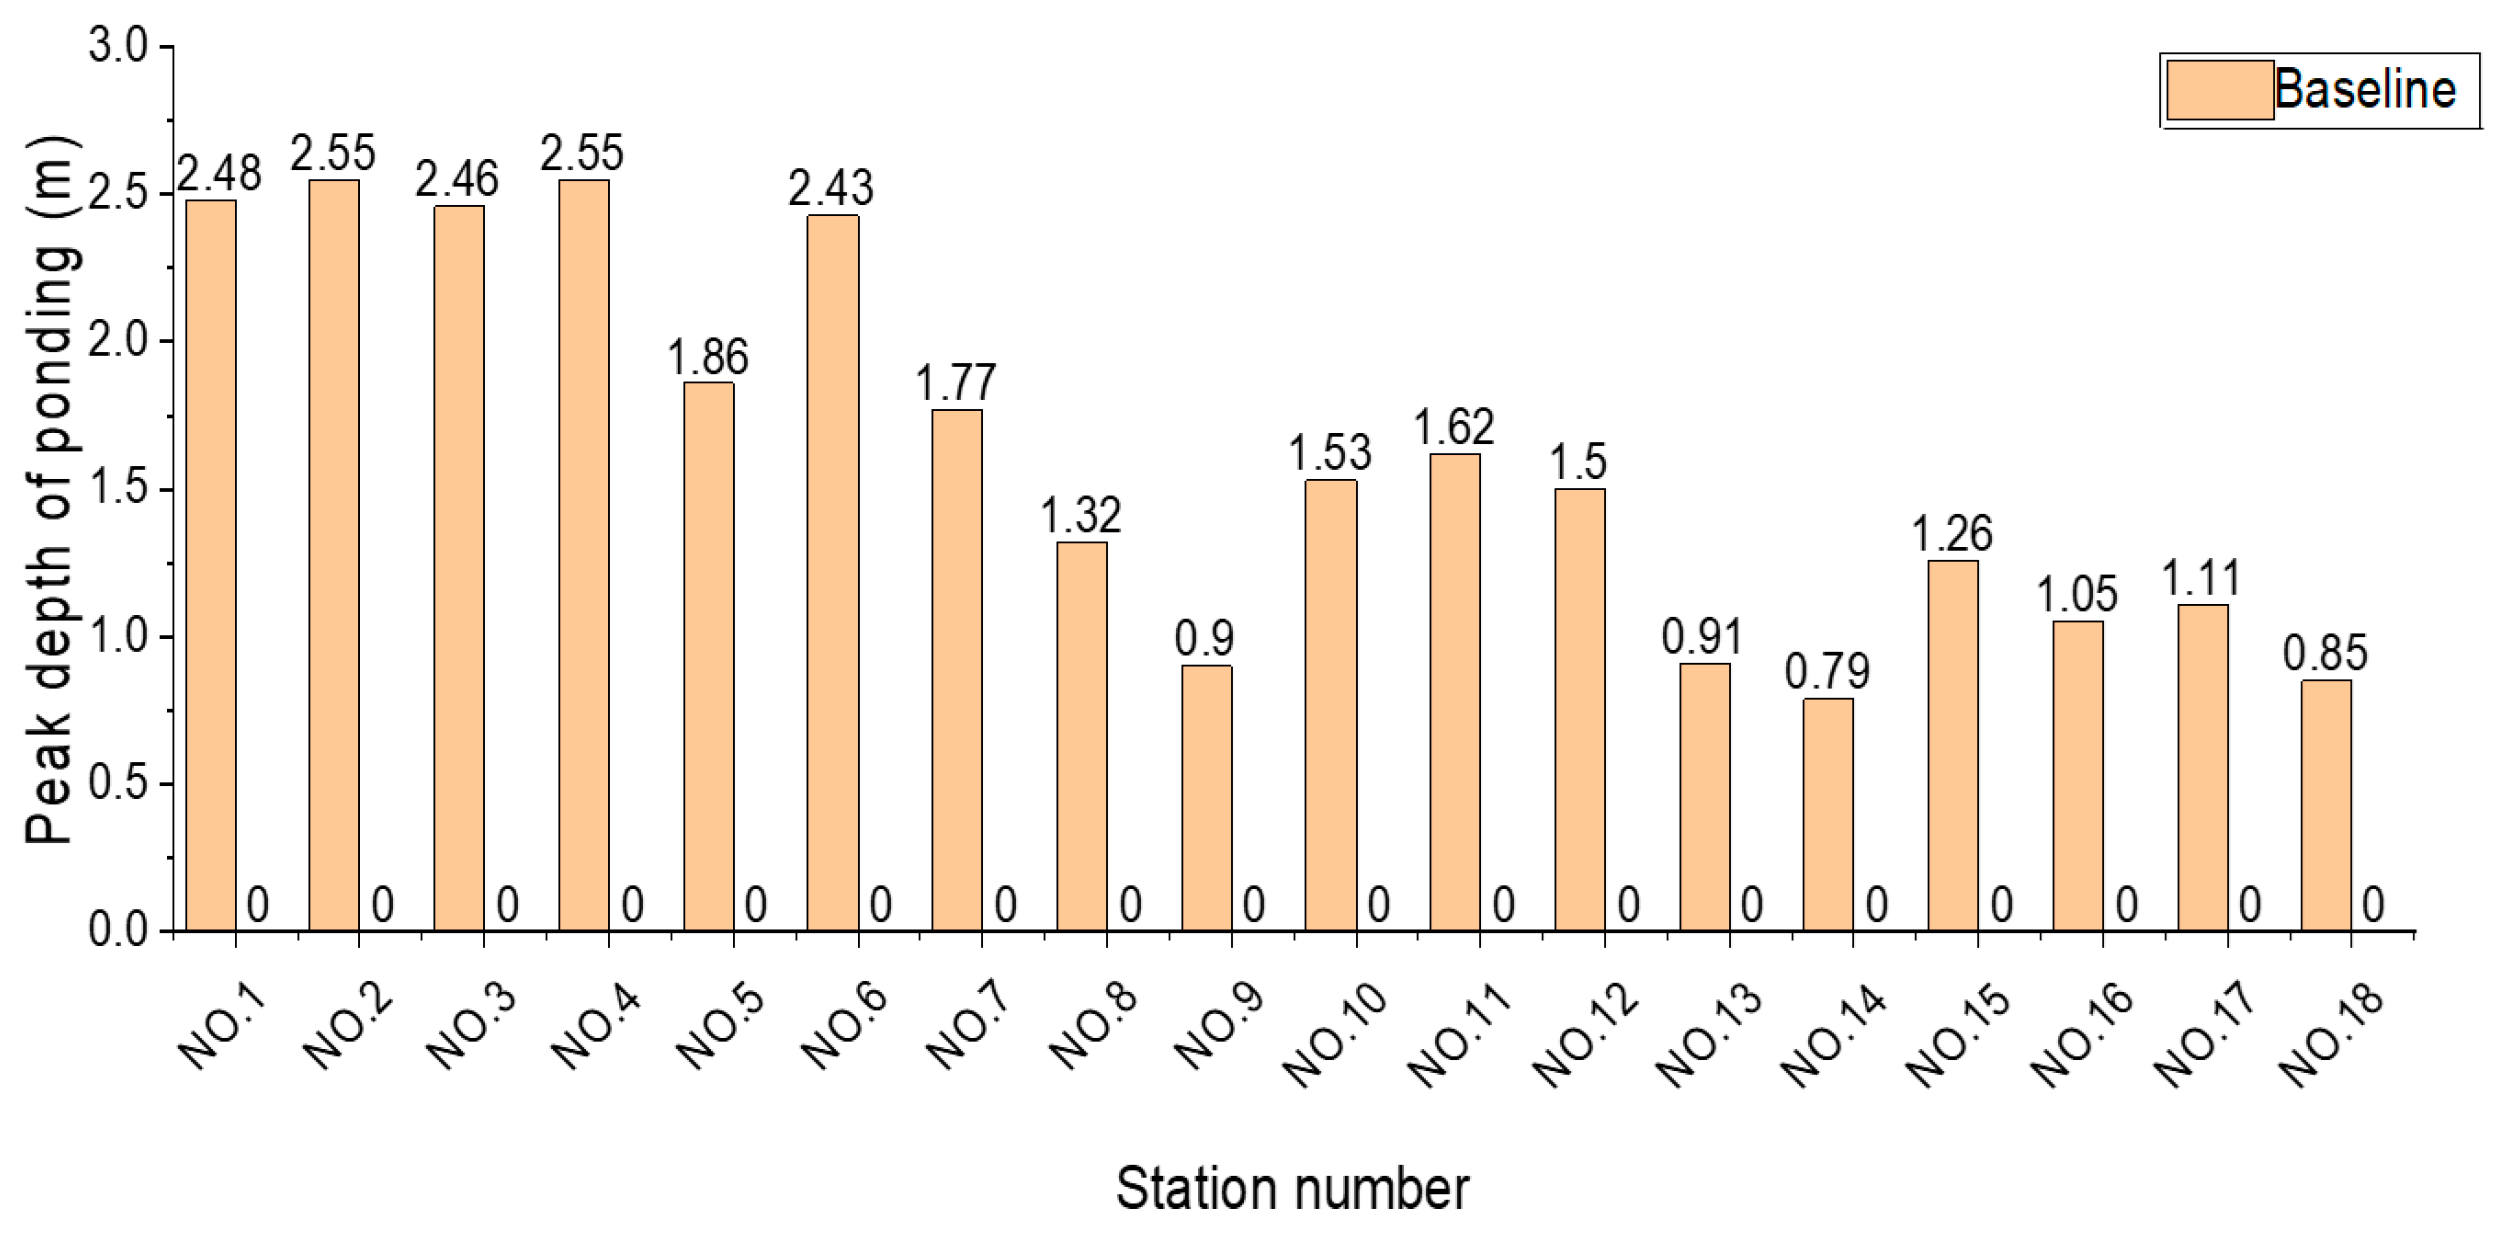
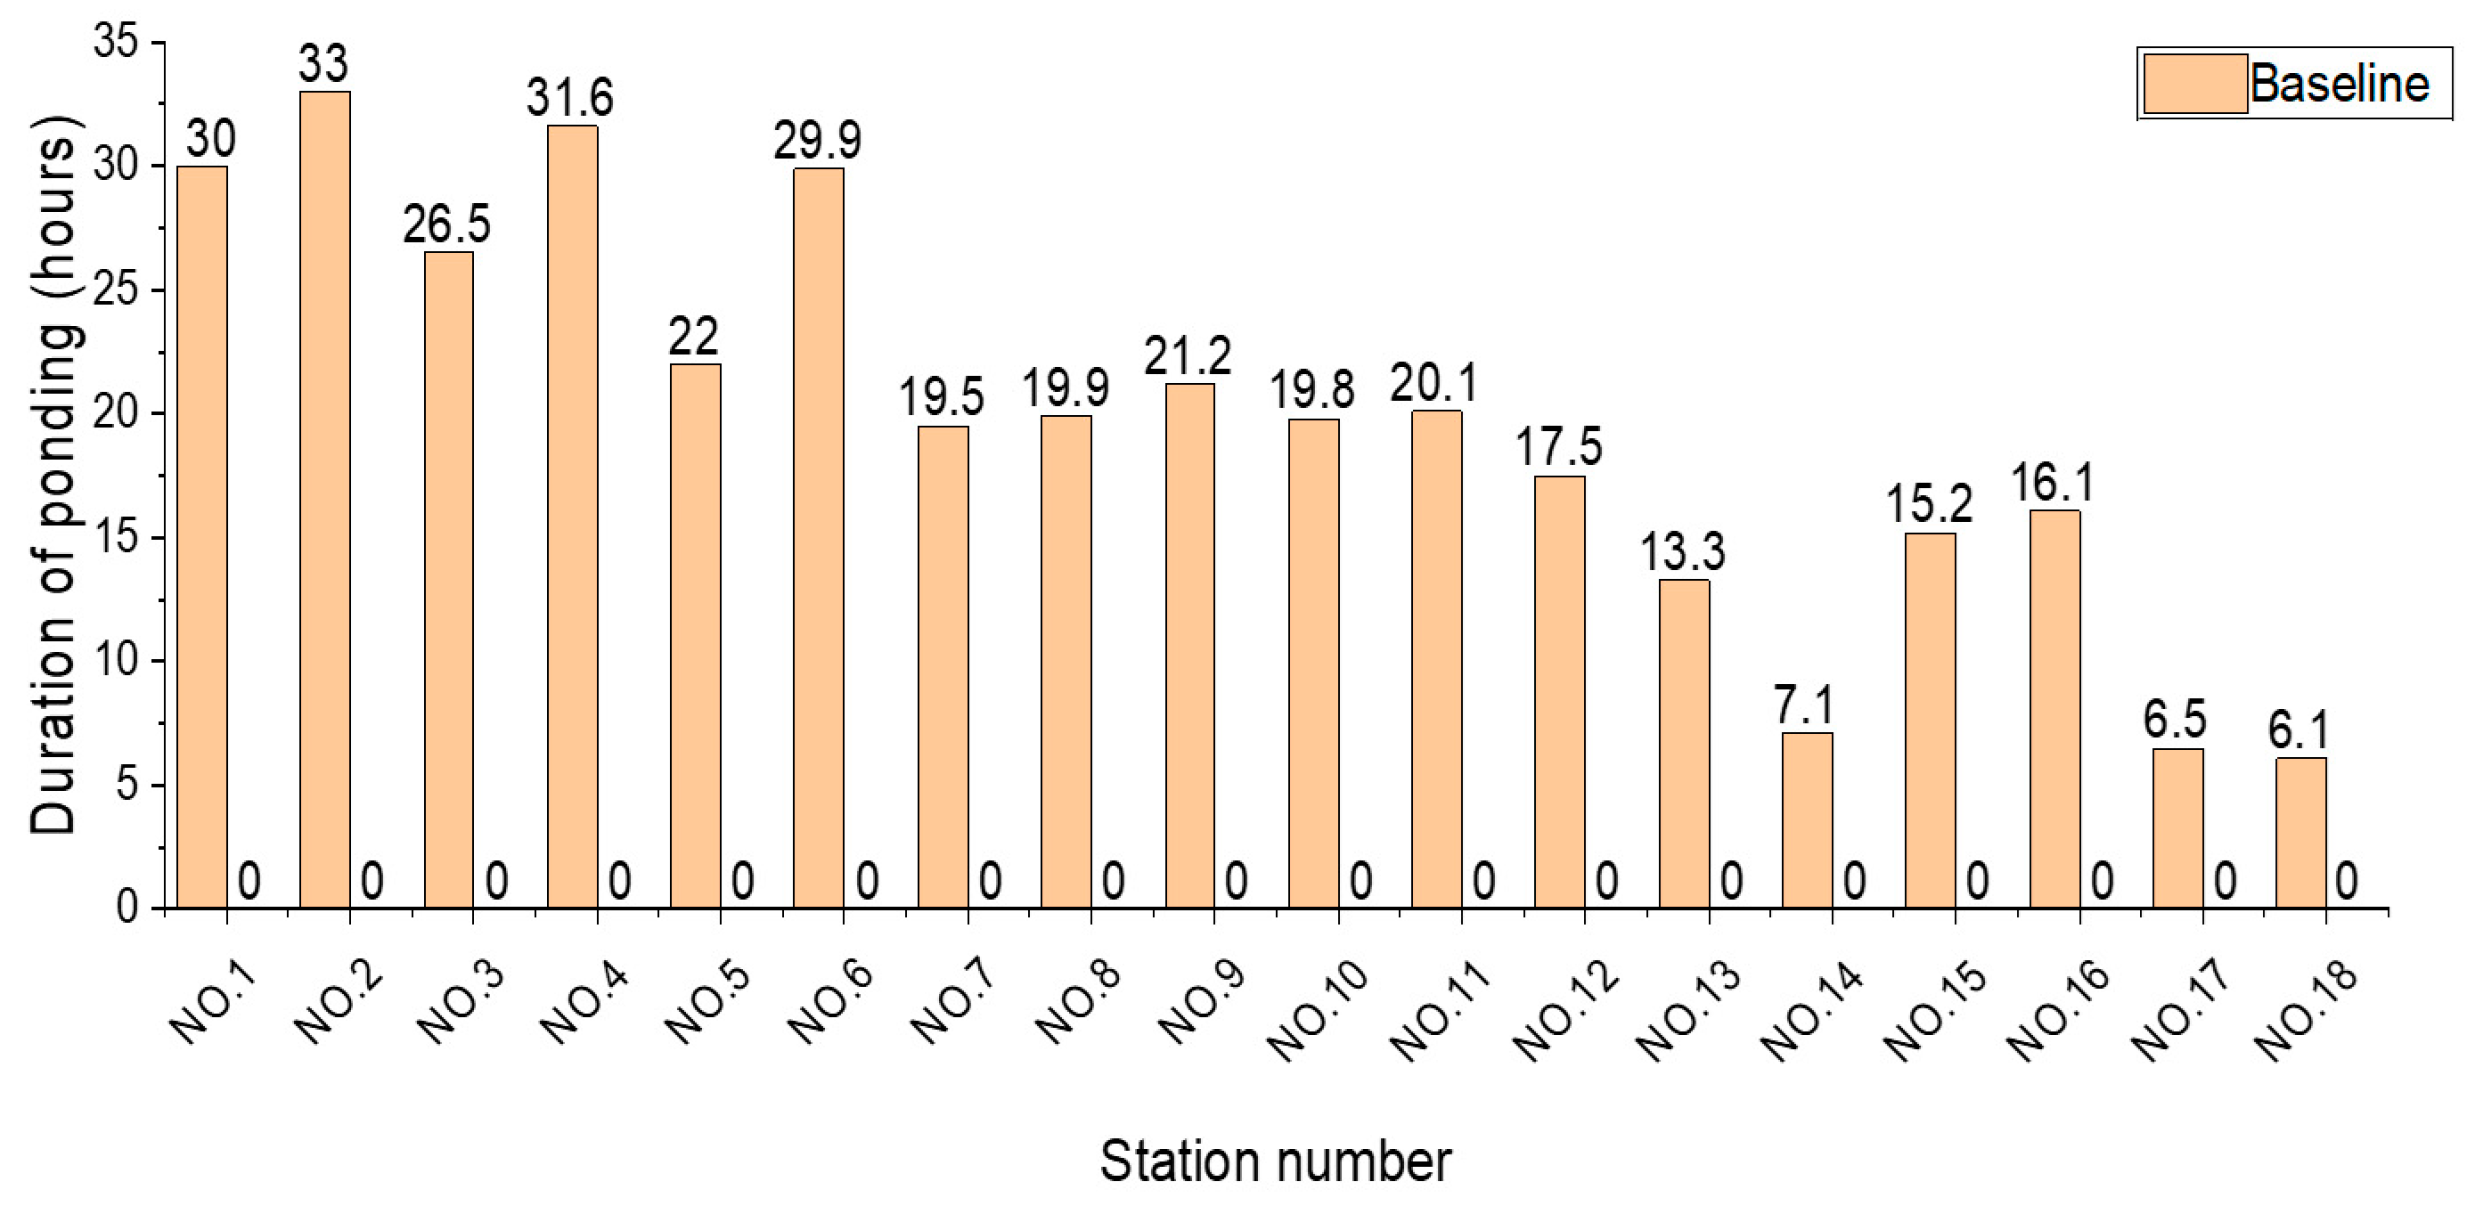
After implementing the flood resilience optimization strategies, the scenario involving a black warning level storm surge was simulated. Based on the simulation results and the previously established risk classification criteria, a revised pluvial flood risk map was generated (Figure 7). A comparison of the flood risk maps before and after the addition of optimization strategies reveals the following: With the deployment of storm surge defense barriers, the previously widespread inundation zones caused by storm surges were substantially reduced and effectively confined to designated amphibious buffer zones. Simulation results show that areas once highly vulnerable—particularly in the central urban core—remained completely dry under the same black warning level conditions (Table 7), demonstrating a significant shrinkage in overall inundation extent.
The ring-shaped flood barrier system established a semi-enclosed protective perimeter that intercepted and deflected incoming tidal flows before they could penetrate inland. By decoupling the surge impact from the internal urban drainage system, the barriers alleviated backpressure, preserved outflow capacity, and enabled faster water recession. These interventions fundamentally reshaped the floodwater pathways, reducing both the spatial spread and peak depth of inundation while accelerating the drainage (Figure 8 and Figure 9), thereby strengthening the city’s resistance and recovery capacities. (Note: In the earlier stage of flood risk simulation, to ensure the accuracy of the results under storm surge scenarios, seven additional monitoring points [Stations 12–18] were added).

4.1.3. Scenario of Black Warning Level Storm Surge Coinciding with Heavy Rainstorm

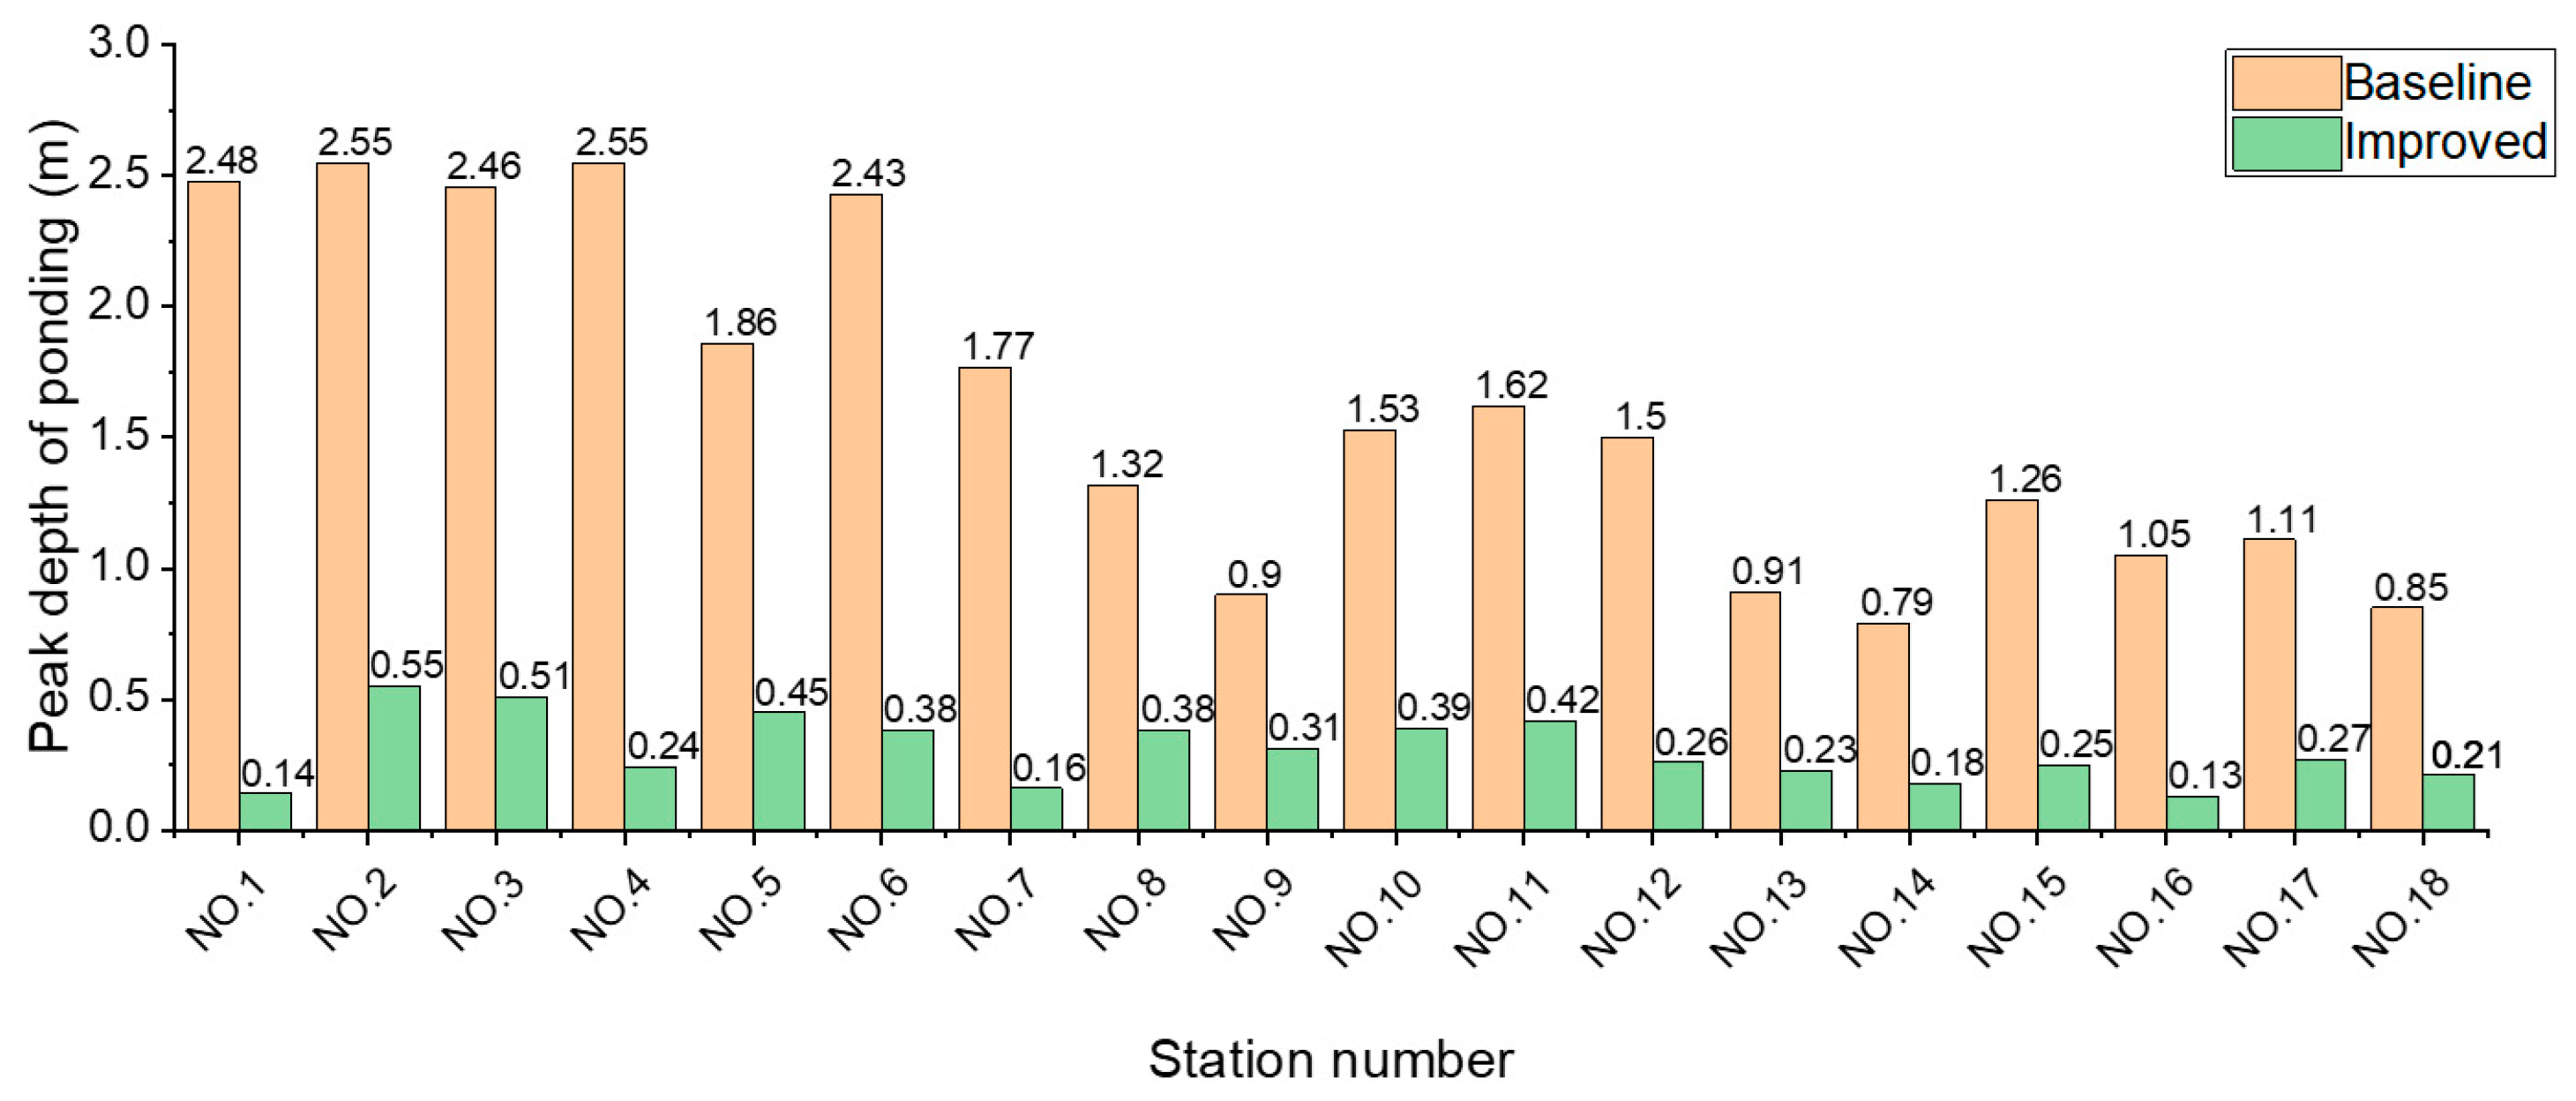
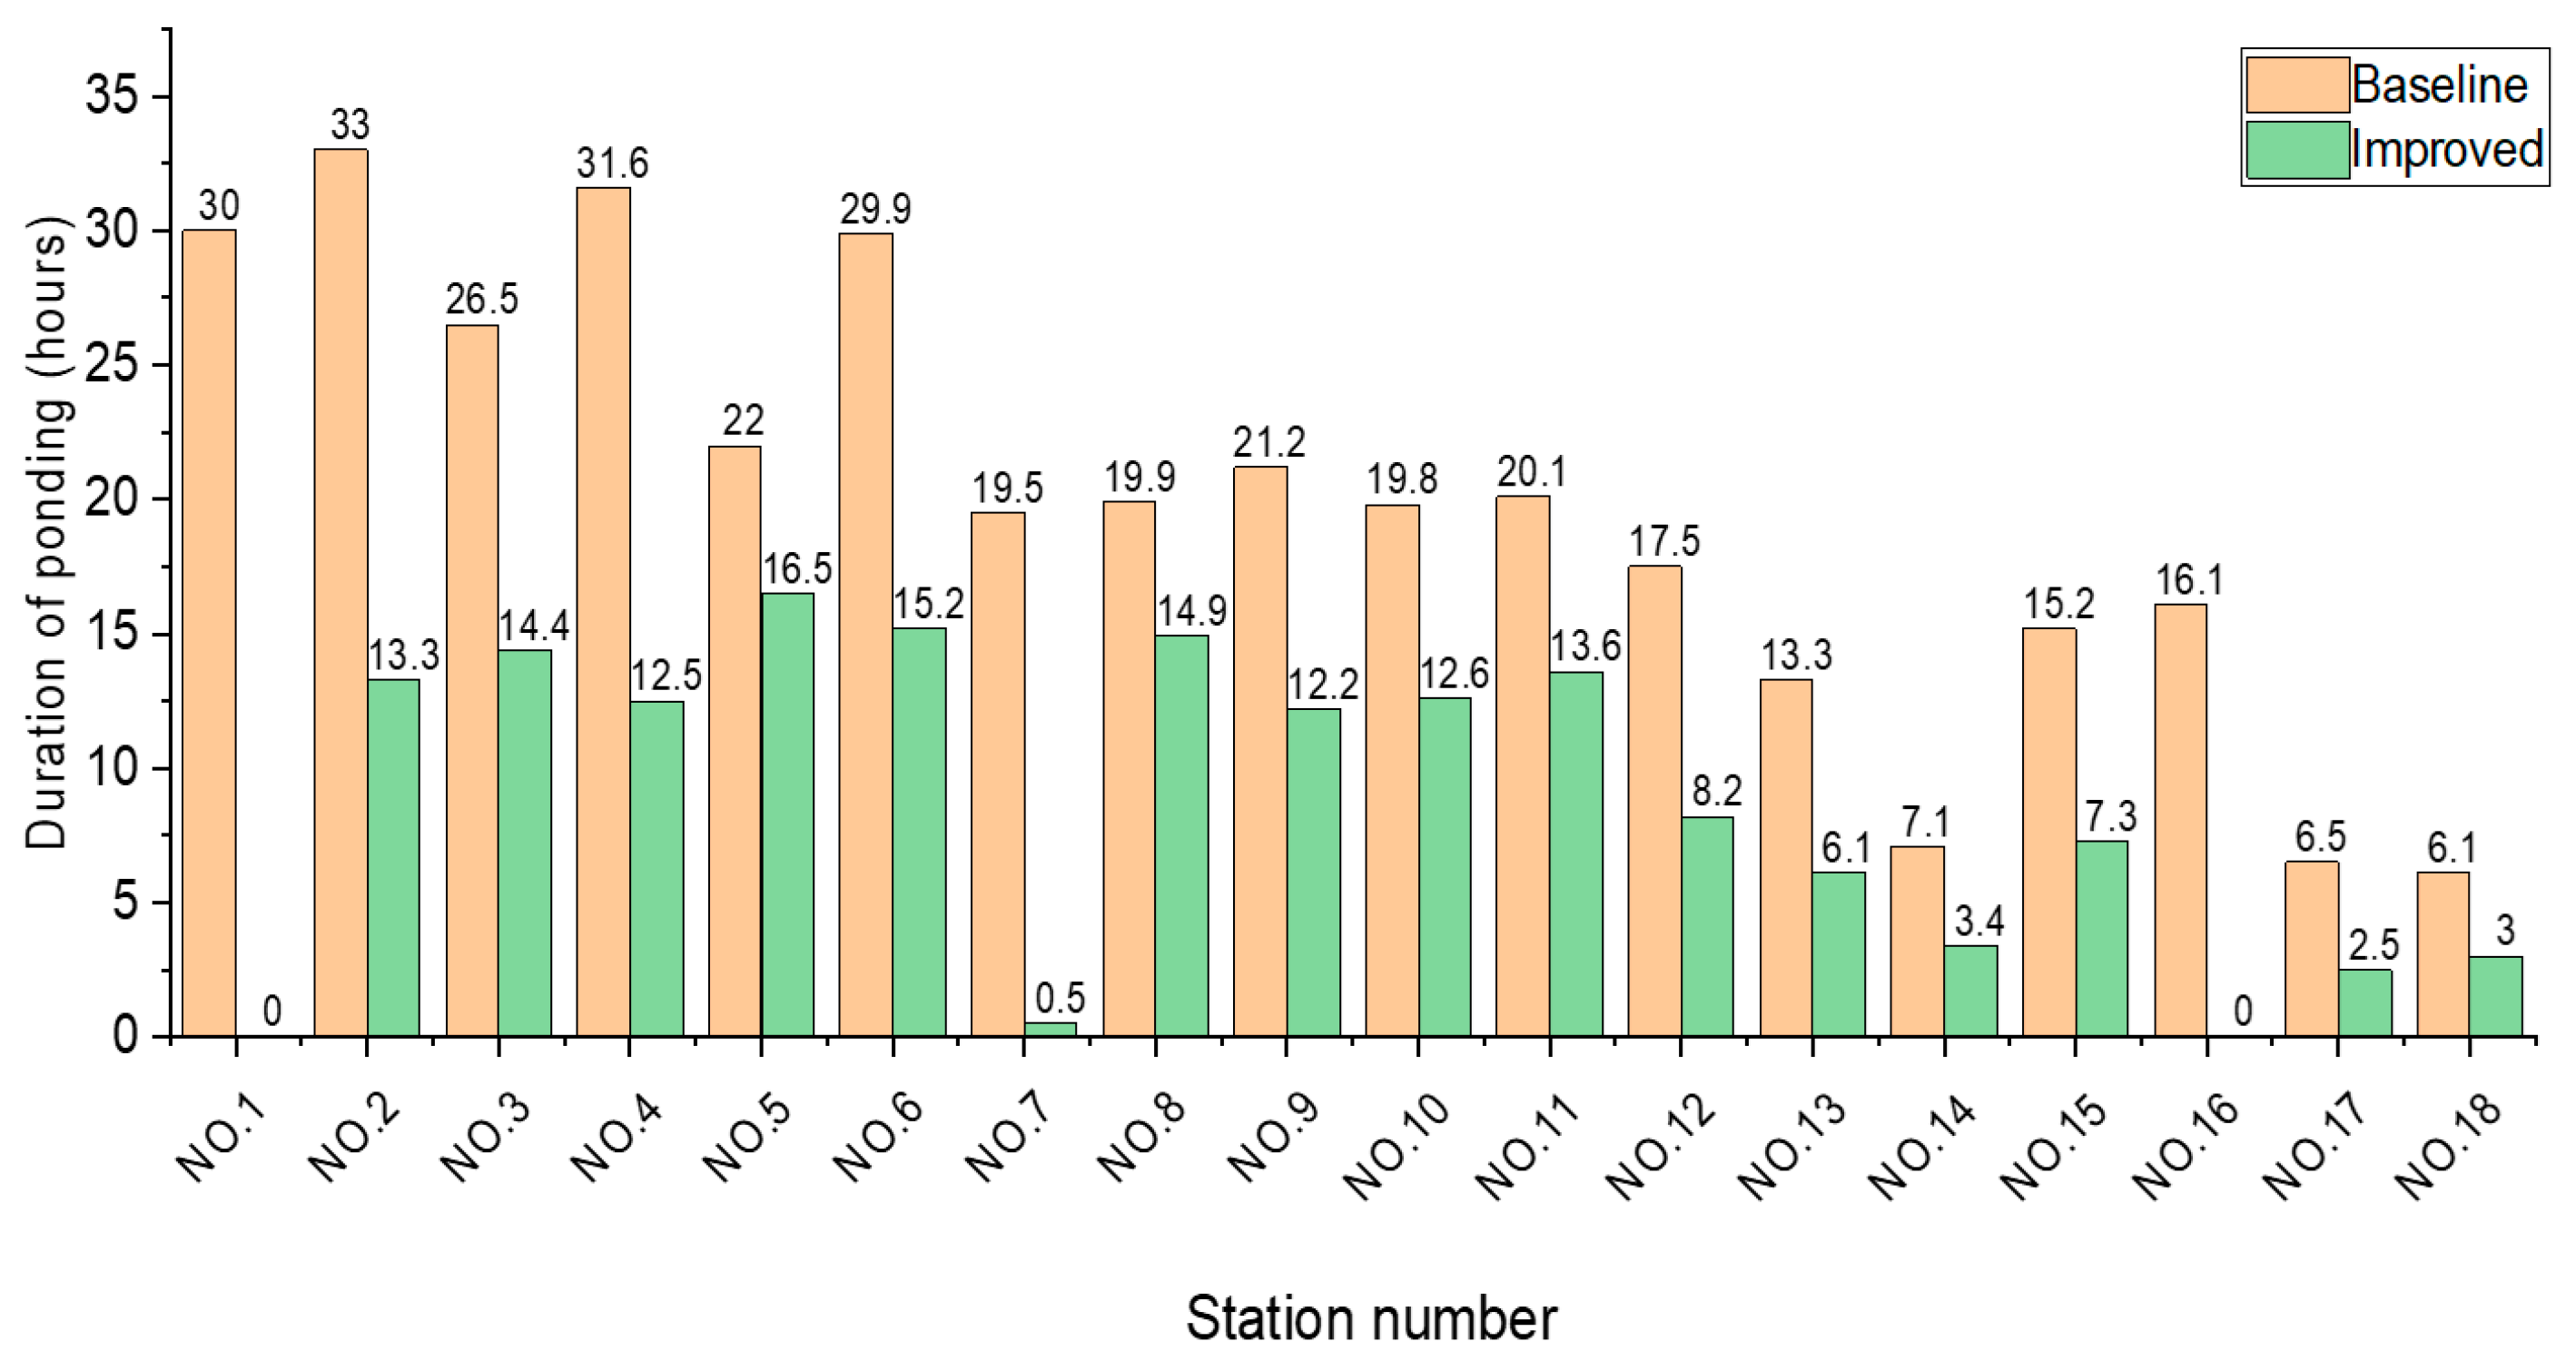
Following the implementation of flood resilience strategies, a compound disaster scenario, where a black warning level storm surge coincides with a 1-in-50-year rainstorm was simulated. Based on the risk classification framework introduced earlier, an updated flood risk map was generated (Figure 10). Compared to pre-optimization conditions, the inundation risk under this extreme scenario was markedly reduced, with most high-risk zones reclassified into low- or moderate-risk categories. The peak inundation depth dropped substantially (from 2.55 m to 0.55 m), while the longest water retention time across all monitored locations was shortened from 33.0 h to 13.3 h (Figure 11 and Figure 12, Table 8), reflecting a significant mitigation of flood severity.
The compound resilience improvements stemmed from the synergetic effects of multiple interventions. The storm surge barriers intercepted tidal forces, preventing their intrusion into inland drainage sensitive areas. Concurrently, rain-induced surface runoff was mitigated by LID installations. This dual decoupling of tidal and pluvial inputs allowed the urban drainage network to preserve its conveyance and discharge functions even under compounding loads. This ensured not only physical resilience (reduced exposure and damage) but also functional resilience (service continuity), advancing both the resistance and recovery dimensions of the city’s flood adaptation system.

4.2. Validation of Strategies Based on Flood Resilience Measurement

Building on the scenario-based simulation results, this section quantitatively assesses the effectiveness of the proposed strategies from a network resilience perspective. By comparing the resilience indices before and after the implementation of the strategies, we validate the extent to which system-wide flood resilience has improved.

4.2.1. 50-Year Return Period Rainstorm Scenario

Under the 50-year return period rainstorm scenario, the number of connection failures and node disruptions in the urban network significantly decreased after the implementation of the flood resilience optimization strategies, with interruptions occurring only in a few local street blocks. The full recovery time of the network system was reduced by more than 50%, from 21.3 to 9.5 h. The comparison of network connectivity efficiency shows that the number of failed nodes decreased from 539 (pre-optimization) to 447 (post-optimization), with noticeable improvements in the connectivity of critical systems, especially the healthcare system. By substituting the relevant results into the resilience index calculation formulas (Table 3: Equations (1)–(5)), the flood resilience index of the high-density urban area under this scenario increased to 0.0847, representing an 89.7% improvement compared to the pre-optimization level (Table 9).
Beyond these numerical improvements, the underlying mechanisms contributing to resilience enhancement can be explicitly traced to the spatially distributed configuration of the strategies. Specifically, the deployment of amphibious infrastructures such as liftable flood bridges and elevated connection nodes mitigated the fragmentation of network paths by maintaining vertical connectivity during inundation. In parallel, the targeted reinforcement of low-lying medical and emergency response nodes ensured that core services remained operable, sustaining the system’s functional integrity. The integration of these structural and spatial interventions allowed critical urban subsystems to maintain operation under stress, thereby reducing the cascading failure risk that typically arises in densely networked environments.
These results provide strong quantitative evidence that the proposed strategies effectively enhance urban flood resilience and validate their practical effectiveness in reducing vulnerability and improving system recovery capacity.

4.2.2. Black Storm Surge Warning Scenario (Independent Event)

Under the disaster scenario of a black storm surge warning level occurring independently and following the implementation of flood resilience optimization strategies in the high-density urban area of Macau Peninsula, no connection failures or node disruptions were observed in the network compared to the pre-optimization state. The comparison of network connectivity efficiency reveals that the number of failed nodes was reduced to zero, and the connectivity of all critical systems was fully restored to the baseline level (that is, the level before the disaster occurred). Moreover, as the road system was no longer affected by storm surge-induced flooding, the system experienced no recovery delay. Therefore, no further flood resilience index calculation is required for this scenario.
The effectiveness of this outcome can be attributed to the deployment of vertical barrier-based interventions such as removable floodwalls and tide gates positioned along key coastal frontiers. These structures effectively intercepted surge inflows and protected the underlying road networks and infrastructure nodes from marine inundation. Moreover, the incorporation of amphibious infrastructures at critical coastal intersections preserved transport accessibility during temporary water rise. Unlike rainfall events, storm surges are characterized by directional pressure and tidal intrusion; the implemented strategies successfully broke this propagation chain, ensuring that network wide failure did not initiate.
In essence, the optimized configuration transformed the coastal boundary from a vulnerable exposure line into a controlled buffer zone, preventing surge encroachment from triggering cascading failures within inland systems. This demonstrates how strategically placed structural measures, when aligned with spatial vulnerability patterns, can achieve full network preservation even under extreme surge conditions.

4.2.3. Compound Scenario: Black Storm Surge Warning Combined with a 50-Year Return Period Rainstorm

Under the compound disaster scenario in which a black storm surge warning coincides with a 50-year return period rainstorm, the implementation of flood resilience optimization strategies reduced network disruptions and node failures. While some road segments still experienced temporary disconnections, the overall network connectivity remained stable, with a minor impact on the system accessibility. Notably, the total system recovery time was drastically reduced from 33 to 16.5 h. The network connectivity efficiency comparison indicates that the number of failed nodes decreased from 4523 to 484, and all critical systems exhibited substantial improvements in connectivity. By applying the simulation results to the previously established calculation formulas, the flood resilience index under this compound scenario was calculated to be 0.0474 (Table 10). These measurement results demonstrate the effectiveness of the proposed strategies in enhancing flood resilience under extreme compound hazard scenarios, while also quantitatively confirming their contribution to improved disaster response and urban safety.
The resilience enhancement resulted from the coordinated operation of distributed and structural interventions. The resilience improvement stemmed from coordinated pluvial and coastal defenses. This dual mechanism prevented surge–rainfall feedback loops, preserved discharge efficiency, and ensured uninterrupted operation of core systems.

4.3. Integrated Resilience Performance and Strategic Insights

Our results, detailed in the previous sections, collectively demonstrate the substantial improvements achieved through the proposed flood resilience optimization strategies under various disaster scenarios. By integrating scenario-based hydrodynamic simulations with network-based resilience assessments, a multi-dimensional understanding of urban system performance under rainstorm and storm surge hazards is established.
First, the implementation of targeted physical interventions, such as removable floodwalls, flood-resistant terraced buildings, upgraded drainage systems, and coastal defense infrastructure, significantly reduced both the spatial extent and intensity of flooding in all simulated scenarios. In the black level storm surge and a 1-in-50-year rainstorm event, the inundation area shrank considerably, and the maximum water depths decreased from 2.55 to 0.55 m, while recovery times at critical monitoring stations were halved. These outcomes indicate not only an enhancement in the resistance capacity (or, limiting the initial impact) but also in the absorptive capacity (that is, faster recovery).
Second, the resilience index values derived from the complex network model further confirm the effectiveness of these interventions. The compound hazard scenario (storm surge + rainstorm) demonstrated the most notable improvement, where the resilience index increased from baseline to 0.0474, representing a substantial recovery in network functionality despite dual stressors. This reinforces the argument that resilience-enhancing strategies should account for compound disasters, which represent realistic and increasingly common threats in coastal high-density urban environments.
Third, the mechanisms of resilience improvement can be linked to several system level changes: (1) the reduction in node failures in key systems, such as transportation and healthcare, increased the overall network integrity; (2) the reconfiguration of coastal zones through amphibious architecture and modular defense elements introduced redundancy and flexibility into vulnerable edge systems; (3) the upgrade of drainage infrastructure, particularly the conversion from combined to separate systems in low-lying zones, mitigated internal waterlogging and reduced the load on emergency pumping and treatment systems.
Furthermore, the design logic behind the strategies, such as modularity, reversibility, and multi-functionality, enhances their scalability and adaptability in other urban contexts. The reliance on passive and semi-passive solutions (such as deployable flood resistant landscape bridges and earth-covered levee structures) offers an energy efficient and spatially optimized approach suitable for space constrained high-density areas like Macau.
In conclusion, the combined simulation and measurement results affirm that the proposed strategies not only improve quantitative resilience metrics but also align with broader goals of urban sustainability, climate adaptation, and disaster preparedness. These insights underscore the importance of integrating spatial design, infrastructure planning, and systems modeling in the development of resilient coastal cities.

5. Discussion and Outlook

5.1. Integrated Discussion and Implications

Our study demonstrated that a multi-dimensional resilience strategy, combining storm surge defense barriers, drainage system upgrades, and LID measures, can substantially reduce pluvial and compound flood risks in high-density coastal urban areas. The results of scenario-based simulations confirmed significant improvements in the inundation extent, water depth, and recession time across the Macau Peninsula. Moreover, the network-based resilience index showed marked enhancement in the connectivity and functionality of critical urban systems. These findings highlight the importance of adopting a spatially explicit and multi-scale approach when designing flood resilience strategies.

5.2. Comparison with Existing Studies

The results align with previous evidence that hybrid flood mitigation strategies combining structural and non-structural measures can achieve greater system level benefits than single interventions (for instance, integrated defense concepts in Shanghai and New Orleans) [55,56]. However, few studies have examined these strategies within the unique constraints of high-density coastal cities, where land scarcity, mixed land-use patterns, and aging infrastructure create distinct challenges. Compared to studies focusing primarily on LID in suburban contexts [57,58], the present study demonstrates that LID interventions must be carefully prioritized in limited spaces, such as converting rooftops to green roofs or installing sunken green spaces in public plazas.
The segmented design of storm surge barriers proposed here also extends beyond conventional linear seawalls, allowing for a localized adaptation to varied waterfront morphologies and urban functions. Comparable concepts have emerged in high-density coastal cities such as Hong Kong and Singapore [59,60], which have shifted traditional seawall-only approaches toward more integrated flood resilience systems combining coastal barriers, surge gates, and ecological measures. However, few prior studies have quantitatively evaluated their systemic benefits using a resilience-based framework.

5.3. Practical Implications

The findings underscore the necessity of tailoring strategies to functional zones and risk hotspots, rather than applying uniform citywide measures. For Macau, this means prioritizing storm surge defense barriers along low-lying waterfronts, retrofitting drainage systems in combined sewer areas, and leveraging rooftops and residual spaces for LID. Beyond Macau, the framework offers transferable lessons for other high-density coastal cities such as Hong Kong, Shanghai, and Ho Chi Minh City.
Another key implication is that resilience planning should not only focus on short term hazard reduction but also deliver co-benefits for urban livability and climate adaptation. For example, green roofs and rain gardens can mitigate urban heat and improve biodiversity, while deployable landscape bridges can function as public spaces during non-flood periods. Embedding such multifunctionality into urban design can help build broader public and political support for resilience investments.

5.4. Limitations and Future Research Directions

Our study has several limitations that warrant further research. First, the scenario-based modeling assumes idealized implementation levels of strategies (example: 50% rooftop retrofitting, complete conversion of existing green spaces), which may overestimate the potential benefits. Future studies could employ cost–benefit analyses or multi-objective optimization to identify realistic implementation levels under budgetary and land-use constraints. Moreover, while this study demonstrates the modeled effectiveness of flood resilience strategies through scenario-based simulations, it does not yet constitute empirical validation in real-world contexts. Future work should include pilot implementations and field-based monitoring to further verify the actual effectiveness of these strategies in practice.
Second, while the network-based resilience index captures systemic performance, it does not explicitly incorporate social vulnerability or economic disruption metrics. Integrating socio-economic factors and dynamic population exposure would enable a more holistic understanding of urban flood resilience.
Third, the proposed strategies were evaluated under historical and design-based disaster scenarios. With climate change expected to exacerbate extreme rainfall and storm surge events, future work should explore dynamic adaptation pathways, including upgradable flexible measures with evolving risks. Coupling real-time data (such as the rainfall radar) with the simulation framework could also support adaptive operations and emergency response.

6. Conclusions

Our study proposed and empirically validated a set of resilience-enhancing strategies for mitigating pluvial flood risks in high-density urban areas, using the Macau Peninsula as a case study. Building upon prior research that established a quantifiable and interpretable flood resilience assessment framework based on complex network theory, our study shifted the focus to the design and scenario-based validation of actionable planning and engineering interventions. The proposed strategies addressed three major components: (1) the construction of storm surge defense barriers adapted to differentiated urban waterfront zones; (2) the systematic upgrade of drainage infrastructure, particularly in aging combined sewer areas; and (3) the integration of LID measures to reduce runoff and alleviate pressure on conventional drainage systems. A key innovation lies in the spatially explicit partitioning of flood defense strategies, in which the Macau Peninsula was divided into multiple defensive segments based on functional zoning and exposure levels. Each zone was guided by localized urban design principles, enabling context-sensitive and implementable solutions. Simulation results under multiple compound disaster scenarios confirmed that the optimized strategies significantly reduced the inundation extents, peak water depths, and recession times. Crucially, the network-based resilience index showed consistent improvements across all the tested scenarios, with enhanced system connectivity, reduced node failures, and shortened recovery times. These findings demonstrate the effectiveness of a targeted multi-scale intervention framework for enhancing urban flood resilience. The research also underscores the value of integrating spatial planning, ecological infrastructure, and engineering-based controls with network-based resilience modeling. The proposed framework is not only applicable to Macau but also offers a transferable model for other high-density coastal cities seeking adaptive strategies to address escalating hydrometeorological risks under climate change.
Author Contributions

R.Z., conceptualization, methodology, software, formal data analysis, data curation, writing—initial draft preparation, and project administration; Y.L., validation, and interpretation of results; C.L., reviewing and editing of the manuscript; T.C., supervision and project administration. All authors have read and agreed to the published version of the manuscript.

Funding

This work was supported by the General Project of Philosophy and Social Science Research in Colleges and Universities of Jiangsu Province [grant numbers 2025SJYB0419]; the Research Program for High-level Talents of Jinling Institute of Technology [grant numbers jit-b-202345]; the Natural Science Foundation of Sichuan Province [grant numbers 2024NSFSC0922]; and the International Cooperation and Exchanges NSFC [grant numbers 52061160366]; Anhui Provincial Key Laboratory of Digitalized Conservation and Innovative Revitalization of Ancient Huizhou Villages [grant numbers PA2024GDSK0081].

Data Availability Statement

All supporting data are cited within Section 2: Methodology.

Conflicts of Interest

Author Chengfei Li was employed by the company Tianjin Huahui Engineering Architectural Design Co., Ltd. The remaining authors declare that the research was conducted in the absence of any commercial or financial relationships that could be construed as a potential conflict of interest.

References

  1. Zhuge, W.; Liu, X.; Li, H.; Liang, B. High-resolution simulation of coastal flooding under extreme storm tides and sea level rise: A case study of Macau. Phys. Fluids 2024, 36, 126637. [Google Scholar] [CrossRef]
  2. Kiedrzyńska, E.; Kiedrzyński, M.; Zalewski, M. Sustainable floodplain management for flood prevention and water quality improvement. Nat. Hazards 2015, 76, 955–977. [Google Scholar] [CrossRef]
  3. Serra-Llobet, A.; Conrad, E.; Schaefer, K. Governing for integrated water and flood risk management: Comparing top-down and bottom-up approaches in Spain and California. Water 2016, 8, 445. [Google Scholar] [CrossRef]
  4. Ambily, P.; Chithra, N.R.; Firoz, M. A framework for urban pluvial flood-resilient spatial planning through blue–green infrastructure. Int. J. Disaster Risk Reduct. 2024, 103, 104342. [Google Scholar]
  5. Fereshtehpour, M.; Najafi, M.R. Urban stormwater resilience: Global insights and strategies for climate adaptation. Urban Clim. 2025, 59, 102290. [Google Scholar] [CrossRef]
  6. Tabasi, N.; Fereshtehpour, M.; Roghani, B. A review of flood risk assessment frameworks and the development of hierarchical structures for risk components (Integrated Risk Linkages, IRL Framework). Discov. Water 2025, 5, 10. [Google Scholar] [CrossRef]
  7. Liao, Z.; He, X.; Tian, W.; Zhang, Z.; Wang, H.; Xie, W. An integrated assessment of urban flooding risk and resilience based on spatial grids. Urban Water J. 2025, 22, 174–185. [Google Scholar] [CrossRef]
  8. Salgado, M.J.H.; Alfonso, L.; Upegui, J.J.V. Towards integrating community and institutional flood early warning systems: A framework applied to an Andean tropical case. Int. J. Disaster Risk Reduct. 2025, 116, 105126. [Google Scholar]
  9. Cattoën, C.; Carr, R.H.; Bennett, J.; Dougherty, E.; Fortin, V.; Imhoff, R.; Lee, G.; Luo, Y.; Mapedza, E.; Polcher, J.; et al. Integrating Prediction of Precipitation and Hydrology for Early Actions: The InPRHA Project within the World Weather Research Programme. Bull. Am. Meteorol. Soc. 2025, 106, E1303–E1318. [Google Scholar] [CrossRef]
  10. Valente, S.; Pinho, P. Adaptive Planning Approaches for Coastal Climate Adaptation: Process and Key-elements. Environ. Manag. 2025, 75, 1013–1038. [Google Scholar] [CrossRef]
  11. Qbal, S.; Haider, R.; Pasha, G.A.; Zhao, L.; Abbas, F.M.; Anjum, N.; Murtaza, N.; Abbas, Z. Numerical Investigation of Flow Around Partially and Fully Vegetated Submerged Spur Dike. Water 2025, 17, 435. [Google Scholar] [CrossRef]
  12. Zölch, T.; Henze, L.; Keilholz, P.; Pauleit, S. Regulating urban surface runoff through nature-based solutions—An assessment at the micro-scale. Environ. Res. 2017, 157, 135–144. [Google Scholar] [CrossRef] [PubMed]
  13. Zhou, K.; Kong, F.; Yin, H.; Destouni, G.; Meadows, M.E.; Andersson, E.; Chen, L.; Chen, B.; Li, Z.; Su, J. Urban flood risk management needs nature-based solutions: A coupled social-ecological system perspective. npj Urban Sustain. 2024, 4, 25. [Google Scholar] [CrossRef]
  14. Azadgar, A.; Gańcza, A.; Asl, S.R.; Salata, S.; Nyka, L. Optimizing nature-based solutions for urban flood risk mitigation: A multi-objective genetic algorithm approach in gdańsk, Poland. Sci. Total Environ. 2025, 963, 178303. [Google Scholar] [CrossRef]
  15. Liu, Y.; Zhang, X.; Liu, J.; Wang, Y.; Jia, H.; Tao, S. A flood resilience assessment method of green-grey-blue coupled urban drainage system considering backwater effects. Ecol. Indic. 2025, 170, 113032. [Google Scholar] [CrossRef]
  16. Owrangi, A.M.; Lannigan, R.; Simonovic, S.P. Mapping climate change-caused health risk for integrated city resilience modeling. Nat. Hazards 2015, 77, 67–88. [Google Scholar] [CrossRef]
  17. Thongs, G. Integrating risk perceptions into flood risk management: Trinidad case study. Nat. Hazards 2019, 98, 593–619. [Google Scholar] [CrossRef]
  18. Grilli, A.; Spaulding, M.L.; Oakley, B.A.; Damon, C.; Edwards, M. Mapping the coastal risk for the next century, including sea level rise and changes in the coastline: Application to Charlestown RI, USA. Nat. Hazards 2017, 88, 389–414. [Google Scholar] [CrossRef]
  19. Chen, A.S.; Khoury, M.; Vamvakeridou-Lyroudia, L.; Fu, G.; Butler, D.; Djordjević, S. 3D visualization tool for improving the resilience to urban and coastal flooding in Torbay, UK. Procedia Eng. 2018, 212, 809–815. [Google Scholar] [CrossRef]
  20. Chien, L.K.; Huang, W.E.P.; Hsu, C.H.; Chang, Y.J.; Huang, C.M. Coastal disaster risk assessment and designation of protection zoning in Taiwan using GIS. WIT Trans. Built Environ. 2017, 170, 173–184. [Google Scholar] [CrossRef]
  21. Ruan, J.; Chen, Y.; Yang, Z. Assessment of temporal and spatial progress of urban resilience in Guangzhou under rainstorm scenarios. Int. J. Disaster Risk Reduct. 2021, 66, 102578. [Google Scholar] [CrossRef]
  22. Zhang, R.; Li, Y.; Chen, T.; Zhou, L. Flood risk identification in high-density urban areas of Macau based on disaster scenario simulation. Int. J. Disaster Risk Reduct. 2024, 107, 104485. [Google Scholar] [CrossRef]
  23. Li, Y.; Wang, L.; Li, F.; Peng, S.G.; Ding, C. Quantitative estimation of urban flood damage from storm surges for a coastal city. Nat. Hazards 2025, 121, 16915–16934. [Google Scholar] [CrossRef]
  24. Azadgar, A.; Nyka, L.; Salata, S. Advancing Urban Flood Resilience: A Systematic Review of Urban Flood Risk Mitigation Model, Research Trends, and Future Directions. Land 2024, 13, 2138. [Google Scholar] [CrossRef]
  25. Angheloiu, C.; Tennant, M. Mind the Gap: Defining Urban Resilience Knowledge-Implementation Gaps. J. City Clim. Policy Econ. 2024, 2, 316–358. [Google Scholar] [CrossRef]
  26. Gao, J.; Barzel, B.; Barabási, A.L. Universal resilience patterns in complex networks. Nature 2016, 530, 307–312. [Google Scholar] [CrossRef] [PubMed]
  27. Zhang, R.; Li, Y.; Li, C.; Chen, T. A complex network approach to quantifying flood resilience in high-density coastal urban areas: A case study of Macau. Int. J. Disaster Risk Reduct. 2025, 119, 105335. [Google Scholar] [CrossRef]
  28. O’Donnell, E.; Thorne, C.; Ahilan, S.; Arthur, S.; Birkinshaw, S.; Butler, D.; Dawson, D.; Everett, G.; Fenner, R.; Glenis, V.; et al. The blue-green path to urban flood resilience. Blue-Green Syst. 2019, 2, 28–45. [Google Scholar] [CrossRef]
  29. Dai, W.; Tan, Y. Study on Multi-Scenario Rain-Flood Disturbance Simulation and Resilient Blue-Green Space Optimization in the Pearl River Delta. Buildings 2024, 14, 3797. [Google Scholar] [CrossRef]
  30. Yang, J.; Chen, M. Potential impacts of flood risk with rising sea level in Macau: Dynamic simulation from historical typhoon mangkhut (2018). Ocean Eng. 2022, 246, 110605. [Google Scholar] [CrossRef]
  31. Zou, S.; Chu, C.; Dai, W.; Shen, N.; Ren, J.; Ding, W. Predicting Typhoon Flood in Macau Using Dynamic Gaussian Bayesian Network and Surface Confluence Analysis. Mathematics 2024, 12, 340. [Google Scholar] [CrossRef]
  32. Sun, R.; Shi, S.; Reheman, Y.; Li, S. Measurement of urban flood resilience using a quantitative model based on the correlation of vulnerability and resilience. Int. J. Disaster Risk Reduct. 2022, 82, 103344. [Google Scholar] [CrossRef]
  33. Peiris, M.T.O.V. Assessment of urban resilience to floods: A spatial planning framework for cities. Sustainability 2024, 16, 9117. [Google Scholar] [CrossRef]
  34. National Earth System Science Data Center. Available online: https://www.geodata.cn/data/index.html?word=%E6%BE%B3%E9%97%A8 (accessed on 7 October 2025).
  35. Estudo Do “Melhoramento Das Redes De Drenagem Da Pen’INsula De Macau”. Available online: https://www.dsscu.gov.mo/uploads/media/estudo/melhoramento_das_redes_de_drenagem_da_peninsula-macau.pdf (accessed on 7 October 2025).
  36. Rainstorm Historica Records. Available online: https://www.smg.gov.mo/en/subpage/355/report/rainstorm-history (accessed on 7 October 2025).
  37. Hualinfu Hydraulic and Environmental Technology Consulting (Shanghai) Co., Ltd. Introduction to Urban Integrated Watershed Drainage Modeling Software; Research Report; Hualinfu Hydraulic and Environmental Technology Consulting (Shanghai) Co., Ltd.: Shanghai, China, 2018. [Google Scholar]
  38. Godschalk, D.R. Urban hazard mitigation: Creating resilient cities. Nat. Hazards Rev. 2003, 4, 136–143. [Google Scholar] [CrossRef]
  39. Lhomme, S.; Serre, D.; Diab, Y.; Laganier, R. Analyzing resilience of urban networks: A preliminary step towards more flood resilient cities. Nat. Hazards Earth Syst. Sci. 2013, 13, 221–230. [Google Scholar] [CrossRef]
  40. Jha, A.K.; Miner, T.W.; Stanton-Geddes, Z. Building Urban Resilience: Principles, Tools, and Practice; World Bank Publications: Washington, DC, USA, 2013. [Google Scholar]
  41. Maximum Tide Height and Flood Height of Macau Under the Effects of Storm Surges. Available online: https://www.smg.gov.mo/en/subpage/355/page/38 (accessed on 7 October 2025).
  42. Latora, V.; Marchiori, M. Efficient behavior of small-world networks. Phys. Rev. Lett. 2001, 87, 198701. [Google Scholar] [CrossRef]
  43. Yan, W.; Lu, J.; Li, Z.; Shen, Y. Implications of measuring resilience of urban street networks: Comparative study of five global cities. Urban Plan. Int. 2021, 36, 1–12. [Google Scholar]
  44. Lai, C.; Luo, Y.; Li, X.; Yu, H.; Zeng, Z.; Li, S.; Gao, W.; Wang, Z. Assessment on vulnerability of road networks considering the dynamic impact of urban waterlogging and the mitigation effect of LID measures. J. Hydrol. 2024, 643, 132005. [Google Scholar] [CrossRef]
  45. Zhang, M.; Xu, M.; Wang, Z.; Lai, C. Assessment of the vulnerability of road networks to urban waterlogging based on a coupled hydrodynamic model. J. Hydrol. 2021, 603, 127105. [Google Scholar] [CrossRef]
  46. Ma, F.; Ao, Y.; Wang, X.; He, H.; Liu, Q.; Yang, D.; Gou, H. Assessing and enhancing urban road network resilience under rainstorm waterlogging disasters. Transp. Res. Transp. Environ. 2023, 123, 103928. [Google Scholar] [CrossRef]
  47. Vragović, I.; Louis, E.; Díaz-Guilera, A. Efficiency of informational transfer in regular and complex networks. Phys. Rev. E 2005, 71, 036122. [Google Scholar] [CrossRef]
  48. Li, Y.; Peng, S.; Xu, J.; Xu, T.; Gao, J. Hydrodynamic model-based flood risk of coastal urban road network induced by storm surge during typhoon. Sustain. Cities Soc. 2025, 121, 106250. [Google Scholar] [CrossRef]
  49. Yuan, Z. Analysis on the evolution of urban spatial form and its influencing factors in Macau. Urban Plan. 2011, 35, 26–32. (In Chinese) [Google Scholar]
  50. Li, K.; Zhou, L. The influence of urban flooding on residents’ daily travel: A case study of Macau with proposed ameliorative strategies. Water 2019, 11, 1825. [Google Scholar] [CrossRef]
  51. Macau Meteorological and Geophysical Bureau. Historical Flooding Heights Caused by Storm Surges [EB/OL]. 2025. Available online: https://www.smg.gov.mo/zh/subpage/355/page/38 (accessed on 18 July 2025).
  52. Hong Kong Observatory. Maximum Sea Levels and Storm Surges Recorded at Hong Kong Tide Stations During Tropical Cyclones [EB/OL]. 2024. Available online: https://www.hko.gov.hk/tc/wservice/tsheet/pms/stormsurgedb.htm?t=RANK&v=SEA_LEVEL (accessed on 18 July 2025).
  53. Chen, A.; Giese, M.; Chen, D. Flood impact on Mainland Southeast Asia between 1985 and 2018—The role of tropical cyclones. J. Flood Risk Manag. 2020, 13, e12598. [Google Scholar] [CrossRef]
  54. Land, Public Works and Transport Bureau of Macau SAR. Study on Improving the Drainage System of the Macau Peninsula; Government Report; Land, Public Works and Transport Bureau of Macau SAR: Macau, China, 2017.
  55. Du, S.; Verhave, G.; van den Brink, M. Hard or soft flood adaptation? Advantages of a hybrid strategy combining a storm-surge barrier, wet-proofing, and coastal wetland development outperforms both hard and soft strategies. Environ. Res. 2020, 188, 109828. [Google Scholar]
  56. Xian, S.; van der Veen, A. Comparative analysis of flood protection standards and hybrid resilience strategies between two coastal megacities, including New Orleans. Sci. Total Environ. 2018, 628–629, 1459–1471. [Google Scholar]
  57. Neupane, B.; Vu, T.M.; Mishra, A.K. Evaluation of land-use, climate change, and low-impact development practices on urban flooding. Hydrol. Sci. J. 2021, 66, 1440–1457. [Google Scholar] [CrossRef]
  58. Abduljaleel, Y.; Demissie, Y. Evaluation and Optimization of Low Impact Development Designs for Sustainable Stormwater Management in a Changing Climate. Water 2021, 13, 2889. [Google Scholar] [CrossRef]
  59. Chan, F.K.S.; Chuah, J.; Ziegler, A.D.; Dąbrowski, M. Towards resilient flood risk management for Asian coastal cities: Lessons learned from Hong Kong and Singapore. J. Clean. Prod. 2018, 187, 576–589. [Google Scholar] [CrossRef]
  60. Urban Redevelopment Authority (URA). A Flood Resilient City & Coast; Draft Master Plan Theme Page; Urban Redevelopment Authority (URA): Singapore, 2025.
Figure 1. Research framework diagram.
Water 17 03110 g001
Figure 2. Current drainage system distribution in high-density urban areas of Macau: (a) separate sewer system distribution; (b) combined sewer system distribution.
Water 17 03110 g002
Figure 3. Zoning plan of storm surge defense measures in Macau Peninsula.
Water 17 03110 g003
Figure 4. Comparison of flood risk before and after optimization under the scenario of a 1-in-50-year rainstorm event: (a) pre-optimization; (b) post-optimization.
Water 17 03110 g004
Figure 5. Comparison of ponding depth at stations before and after optimization under the 1-in-50-year rainstorm scenario.
Water 17 03110 g005
Figure 6. Comparison of inundation duration at stations before and after optimization under the 1-in-50-year rainstorm-only scenario.
Water 17 03110 g006
Figure 7. Comparison of flood risk before and after optimization under the black warning level storm surge-only scenario: (a) pre-optimization; (b) post-optimization.
Water 17 03110 g007
Figure 8. Comparison of ponding depth at stations before and after optimization under the black warning level storm surge-only scenario.
Water 17 03110 g008
Figure 9. Comparison of inundation duration at stations before and after optimization under the black warning level storm surge-only scenario.
Water 17 03110 g009
Figure 10. Comparison of ponding depth at stations before and after optimization under the black warning level storm surge-only scenario: (a) pre-optimization; (b) post-optimization.
Water 17 03110 g010
Figure 11. Comparison of ponding depth (m) at stations before and after optimization under the compound scenario of black warning level storm surge and rainstorm.
Water 17 03110 g011
Figure 12. Comparison of inundation duration at stations before and after optimization under the compound scenario of black warning level storm surge and rainstorm.
Water 17 03110 g012
Table 1. Simulated disaster scenarios.
Rainstorms Occur IndependentlyIndependent Storm Surge OccurrenceStorm Surges of Different Warning Levels During Rainstorms
Storm Surge LevelRainstorm Intensity
1-in-2-year rainstormBlue warning level storm surgeBlue1-in-2-year, 1-in-5-year, 1-in-10-year, 1-in-20-year rainstorm, 1-in-50-year
1-in-5-year rainstormYellow warning level storm surgeYellow
1-in-10-year rainstormOrange warning level storm surgeOrange
1-in-20-year rainstormRed warning level storm surgeRed
1-in-50-year rainstormBlack warning level storm surgeBlack
Table 2. Resilience-oriented urban flood mitigation strategies and measures.
Resilience DimensionStrategy TypeSpecific Measures/Examples
Resistance-OrientedStructural protection Construction of storm surge defense barriers (example, terraced building, terraced landscape, removable floodwalls)
Risk sensitive spatial designZoning and waterfront reorganization
Building reinforcementQuay and structure retrofitting
Buffer space Waterfront buffer zones
Absorption-OrientedLID and green infrastructure Permeable pavements, rain gardens, green roofs, vegetated swales, bio-retention basins, infiltration-based open space design
Retention facilitiesDetention ponds, rainwater tanks
Recovery-OrientedSewer system upgradingSewer separation, capacity expansion
Flexible defensesRemovable, modular floodwalls
Table 3. Computation of flood resilience indices and connectivity efficiencies in urban networks.
Formula No.Formula NameMathematical Expression (Symbolic)Function/Description
(1)Urban system resilience indexR = E d / E p r e t 2 t 1 Overall system resilience during recovery.
(2)Connectivity efficiency of a network containing N nodesE = i , j N , i j E i j N ( N 1 ) = 1 N ( N 1 ) i , j N , i j 1 d i j Overall network connectivity.
(3)Global connectivity efficiency under non-attack conditions E p r e = E s p r e + E r p r e + E h p r e + E b p r e + E u p r e Aggregated system connectivity.
(4)Global connectivity efficiency after pluvial flood induced disruptions E d = E s d + E r d + E h d + E b d + E u d
(5)Key system efficiency E x = 1 N x · N 0 i N x , j N 0 1 d i j Ex represents the connectivity efficiency of system x, where x ∈ {Evacuation, Medical, Education, Rescue, Retail}.
Table 4. Explanation of storm surge defense barrier section planning.
No.Defense Section NameCurrent ConditionReason for Division
1Ilha Verde Industrial Zone to North Inner Harbor SectionMainly industrial and office buildings in good condition.Homogeneous land use and coherent stormwater management needs.
2North Inner Harbor to Sofitel Ponte 16 Hotel SectionSmall piers, poor quality structures, and scattered mixed use.Poor infrastructure and high vulnerability warrant focused intervention.
3Yuet Tung Pier to Marine and Water Bureau Nautical School SectionAging piers and streets, lacking flood protection capacity.Key area for upgrading coastal defense on western shore.
4Sai Van Lakefront SectionSparse buildings, primarily road dominated.Simplified conditions allow clear resilience strategy.
5Avenida Dr. Sun Yat-Sen (West Section)Newly reclaimed land, no existing buildings.Flexible site for new urban development and flood adaptation.
6Avenida Dr. Sun Yat-Sen (East Section)Higher elevation, good quality buildings.Low-risk zone but integral to network continuity.
7Avenida da Amizade to Ponte da Amizade SectionSound urban fabric, low disaster risk.Stable area requiring minimal intervention.
Table 5. Low-impact development strategies by urban spatial type for pluvial flood mitigation.
Spatial TypeApplied LID Measures
Multi-story Residential Mixed-use BlocksConversion of conventional roofs into green roofs to delay and reduce surface runoff.
Highrise Residential and Mixed-use BlocksGreen roofs and small rain gardens are implemented to manage stormwater runoff.
Industrial ZonesGreen roofs and small rain gardens are implemented to manage stormwater runoff.
Public Green SpacesTransformed into sunken green areas, rain gardens, and permeable pavements to enhance rainwater infiltration and retention.
Table 6. Statistical comparison of relevant indicators before and after optimization under the 1-in-50-year rainstorm scenario.
No.LocationPeak Depth of Ponding (m)Duration of Ponding (Hours)
BaselineImprovedBaselineImproved
1Estação do Porto Interior (Norte) Station0.130.03————
2Estação do Porto Interior Station0.510.2016.16.2
3Templo Hong Kung Station0.480.2116.56.4
4Fazcnda Station0.210.072.5——
5Rua da Praia do Manduco Station0.410.2621.39.5
6Estação do Porto Interior (Sul) Station0.340.068.2——
7Ilha Verde Station0.140.09————
8F’atima Station0.360.1616.08.2
9Mercado Vermelho Station0.280.12——
10Rua da Restauração Station0.360.186.62.1
11Cinema Alegria Station0.390.219.92.6
Note: The ponding duration counted is for ponding of more than 0.15 m.
Table 7. Statistical comparison of relevant indicators before and after optimization under the black warning level storm surge-only scenario.
No.LocationPeak Depth of Ponding (m)Duration of Ponding (h)
BaselineImprovedBaselineImproved
1Estação do Porto Interior (Norte) Station2.480300
2Estação do Porto Interior Station2.550330
3Templo Hong Kung Station2.46026.50
4Fazcnda Station2.55031.60
5Rua da Praia do Manduco Station1.860220
6Estação do Porto Interior (Sul) Station2.43029.90
7Ilha Verde Station1.77019.50
8F’atima Station1.32019.90
9Mercado Vermelho Station0.9021.20
10Rua da Restauração Station1.53019.80
11Cinema Alegria Station1.62020.10
12Edf. Jardim Hoi Keng1.5017.50
13Crowne Plaza0.91013.30
14Escola Chong Tak De Macau0.7907.10
15Casino Oceanus No Pelota Basca1.26015.20
16Fisherman’s Wharf1.05016.10
17Hotel Novo Oriental Landmark1.1106.50
18Escola Portuguesa De Macau0.8506.10
Note: The ponding duration counted is for ponding of more than 0.15 m.
Table 8. Statistical comparison of relevant indicators before and after optimization under the compound scenario of black warning level storm surge and 1-in-50-year rainstorm.
No.LocationPeak Depth of Ponding (m)Duration of Ponding (h)
BaselineImprovedBaselineImproved
1Estação do Porto Interior (Norte) Station2.480.1430——
2Estação do Porto Interior Station2.550.553313.3
3Templo Hong Kung Station2.460.5126.514.4
4Fazcnda Station2.550.2431.612.5
5Rua da Praia do Manduco Station1.860.452216.5
6Estação do Porto Interior (Sul) Station2.430.3829.915.2
7Ilha Verde Station1.770.1619.50.5
8F’atima Station1.320.3819.914.9
9Mercado Vermelho Station0.90.3121.212.2
10Rua da Restauração Station1.530.3919.812.6
11Cinema Alegria Station1.620.4220.113.6
12Edf. Jardim Hoi Keng1.50.2617.58.2
13Crowne Plaza0.910.2313.36.1
14Escola Chong Tak De Macau0.790.187.13.4
15Casino Oceanus No Pelota Basca1.260.2515.27.3
16Fisherman’s Wharf1.050.1316.1——
17Hotel Novo Oriental Landmark1.110.276.52.5
18Escola Portuguesa De Macau0.850.216.13
Note: The ponding duration counted is for ponding of more than 0.15 m.
Table 9. Statistical results of resilience index calculations under the 1-in-50-year rainstorm scenario.
Calculation Results StatisticsComparison of Key System Efficiency
BaselineImproved
Connectivity Efficiency of Each Key SystemEfficiency of Evacuation SystemEs0.8326Es0.8419
Efficiency of Education SystemEu0.7045Eu0.7527
Efficiency of Medical SystemEh0.7556Eh0.9804
Efficiency of Rescue SystemEr0.6965Er0.7476
Efficiency of Retail SystemEb1.124Eb1.1914
System Recovery Time (hours)T1-T221.3T1-T29.5
Resilience ValueR0.0446R0.0847
System Node Status StatisticsComparison of System Node Status
BaselineImproved
System NameEffective NodesFailed NodesEffective NodesFailed Nodes
Number of Building Nodes in Each Key SystemEvacuation System290290
Education System800800
Medical System150150
Rescue System220220
Retail System270270
Other Building Nodes Statistics87065398798447
Table 10. Statistical results of resilience index calculations under the compound scenario of black warning level storm surge and 1-in-50-year rainstorm.
Calculation Results StatisticsComparison of Key System Efficiency
BaselineBaseline
Connectivity Efficiency of Each Key SystemEfficiency of Evacuation SystemEs0.3989Es0.8165
Efficiency of Education SystemEu0.4018Eu0.6959
Efficiency of Medical SystemEh0.4390Eh0.9322
Efficiency of Rescue SystemEr0.4381Er0.7371
Efficiency of Retail SystemEb0.5495Eb1.1836
System Recovery Time (hours) 33T1-T216.5
Resilience Value 0.0121R0.0474
System Node Status StatisticsComparison of System Node Status
BaselineBaseline
Number of Building Nodes in Each Key SystemSystem NameEffective NodesFailed NodesEffective NodesFailed Nodes
Evacuation System227290
Education System6416800
Medical System69150
Rescue System157220
Retail System1413270
Other Building Nodes Statistics 45238761484
Disclaimer/Publisher’s Note: The statements, opinions and data contained in all publications are solely those of the individual author(s) and contributor(s) and not of MDPI and/or the editor(s). MDPI and/or the editor(s) disclaim responsibility for any injury to people or property resulting from any ideas, methods, instructions or products referred to in the content.