Article

The Decadal Increase in Terrestrial Water Storage in a Region Experiencing Rapid Transitions from Dry to Wet Periods

Department of Earth, Geographic, and Climate Sciences, University of Massachusetts Amherst, Amherst, MA 01003, USA
*
Author to whom correspondence should be addressed.
Water 2025, 17(21), 3093; https://doi.org/10.3390/w17213093
Submission received: 11 September 2025 / Revised: 21 October 2025 / Accepted: 24 October 2025 / Published: 29 October 2025

Abstract

Understanding the impact of climate change and altered hydrologic cycles on regional water storage trends is crucial for predicting changes in recharge and streamflow and informing decisions regarding drought resilience and flood mitigation. While many regions have become drier under global climate change, the northeast United States has experienced an increased precipitation intensity, driving groundwater rise. This study integrates terrestrial water storage data from NASA’s Gravity Recovery and Climate Experiment (GRACE) satellites and soil moisture data from Soil Moisture Active Passive (SMAP), as well as long-term instrumental groundwater records from USGS groundwater monitoring wells, to understand the nature of storage trends. The results show that while aquifer-wide groundwater storage anomalies have stabilized in recent years, shallow groundwater and certain surface water bodies have accumulated about 0.6 cm of water annually, adding over 10 cm to the landscape, since 2005. These findings indicate that excess water from heavy rainfall is mainly stored in the shallow subsurface as perched aquifers and temporary wetlands rather than deep (5–30 m) aquifers. Understanding this change in storage is crucial for improving water resource management and adapting more effectively to a changing climate in the region.

1. Introduction

As climate change alters the timing, intensity, and amount of precipitation, understanding its impact on the water cycle becomes critical to predicting changes in subsurface water storage, flux, and recharge rates in the coming years. Subsurface water sustains crops, makes up over 2/3 of all streamflow, and maintains the baseflow in wetlands, lakes, and ponds [1]. Many parts of the world under anthropogenic climate change are experiencing intensification of the hydrological cycle [2,3,4,5]. This is leading to increases in periods of both flood and drought. Much of the world is drying and experiencing depletion of groundwater storage, which has been the focus of numerous studies and scientific investigations in recent years [6]. Some regions, due to atmospheric patterns and geographical proximity to the oceans, are experiencing increases in precipitation and above-average wet periods. One such region is the northeast coast of the United States, where a confluence of weather patterns brings moisture from the western US, Canada and the Arctic, the Gulf of Mexico, and the North Atlantic. Furthermore, warming of the North Atlantic has caused a shift in atmospheric circulation patterns [7,8,9]. However, regional responses to these global shifts vary greatly, and understanding changes in how and where water is stored on the landscape remains a challenge. While the groundwater observation network has relatively dense coverage, it primarily consists of deeper wells and wells of opportunity (i.e., not hydrologically optimally placed). There is a need to reconcile controls on storage changes and potential biases in the observation network towards deep observations, as these observations overlook the critical shallow, transient stored water component.
The Gravity Recovery and Climate Experiment (GRACE) [10] is a satellite mission to map Earth’s gravity field. Terrestrial water storage (TWS) is a data product derived from GRACE through temporal variations in Earth’s gravity field [11]. Globally, the estimates of changes in terrestrial water storage (ΔTWS) derived from GRACE exhibit nonlinearity [12]. Jasechko et al. (2024) observed declining groundwater levels in many regions globally, and these trends tended to accelerate into the 21st century [13]. However, many regions experienced either a deceleration in groundwater decline, a reversal, or a continued increase in groundwater levels. The trends in GRACE-based anomalies are also highly variable across the contiguous United States; even within the northeast US, there is significant variability in the direction and significance of groundwater storage trends [14].
Herein, we evaluate the usefulness of large-scale satellite-based water anomalies for understandinf hydrologic change in southern New England. Specifically, we compare the existing observational groundwater-level network and satellite terrestrial water storage anomalies by pursuing the following objectives:
  • Documenting how these data have changed over time;
  • Comparing their respective increases and decreases;
  • Characterizing the impacts of recent pluvials and droughts.
We find that the groundwater observational network is biased towards deeper water storage, and shallow and transiently perched water table anomalies dominate a region-wide storage increase of over 0.6 cm/yr in the region. These increases in water storage are episodic and represent holdover of water from extremely wet years that is not compensated for by equal losses during average or anomalously dry seasons. Our findings point to a wetter landscape, which will significantly impact how the landscape functions, with important implications for the design and sustainability of surface and subsurface infrastructure.

2. Study Area

2.1. Regional Geology

The topography of the region ranges from 13 to 1064 masl with distinct values for incised rivers, including the largest river (Connecticut) in New England. The uplands are heavily forested with mixed deciduous and conifer species. The soil in this region is thin owing to recent glaciation. The Paxton soil series is the dominant soil type in the region, found in the glacial uplands of Connecticut, Massachusetts, New Hampshire, New York, Rhode Island, and Vermont. It is characterized by loamy, well drained soils which are formed in lodgment till [15]. The thickest sediments are in the river valleys from post-glacial deposition and modern alluvial processes. The uplands have thin sediment cover (~ few meters), primarily underlain by low-permeability metamorphic and crystalline fractured bedrock. This fractured bedrock aquifer is the main water supply for private homeowners in the region (50–100 m deep wells yield ~4 L/min). No regional aquifers exist in this region, and studies have documented that modern meteoric water does not circulate below a 100 m depth [16]. In the uplands, a thin layer of ablation glacial till overlies the bedrock. This till is poorly sorted but is sand-dominated, with clay contents of less than 2%, and forms an important upland water storage reservoir. These glacial till aquifers are quite permeable and function as the main storage and release mechanism of the uplands. These aquifers also provide significant baseflow to headwater streams. In the lowlands of the region, fluvial and lacustrine glacial and post-glacial sediments may reach thicknesses of up to 50 m in the Connecticut River valley (the largest valley in this region). Within these sediments are prolific aquifers (valley fill aquifers) which are the main groundwater storage reservoirs across the region that also host local public water supplies. These characteristics create a limited groundwater storage capacity across the region. In the uplands, most of the water storage is in the upper few meters of the land’s surface and in the deepest valleys is around at 50 m.

2.2. Regional Climate and Hydrology

Southern New England (Northern Connecticut, Western Massachusetts, and Southern Vermont and New Hampshire—Figure 1) is characterized by a humid temperate climate. Average yearly temperatures range from −5.7 °C to 20.7 °C (mean annual January and July temperatures, respectively) with a distinct growing season from April to Sept [17]. The average annual precipitation is ~1200 mm with strong interannual variability of +/− 200 mm/yr. Precipitation is equally distributed over the months of the year with no distinct seasonality. Seasonality in evapotranspiration drives seasonal variability in streamflow and groundwater table elevations. The maximum potential evapotranspiration rates (PETs) occur in July (average PET: ~100 mm), while the minimum PET is observed from December to January (~7.6 mm) [18]. Snow during the winter months is common but is becoming less frequent, as the average air temperature in January has increased at a rate of 0.350 °C/decade (1980–2024) in the northeast climate region [17]. Over that same period, the average annual temperature increased at a rate of 0.034 °C/year, and from 2000 to 2024, temperature increased at a rate of 0.037 °C/year [17]. Snow storage on the surface is seasonal and elevation-dependent. Snow water equivalent is not a dominant component of the water budget of the region, as it may only reach up to ~10 percent of the total water budget in any given year [17].
Significant changes in precipitation intensity and timing in the northeast US have altered the annual water budget, leading to shifts in drought and flood frequency. In Massachusetts, annual precipitation has increased by over 30% since the 1960s, with totals exceeding 1800 mm (compared to the long-term average of ~1200 mm) observed multiple times in the past decade [17]. From 1996 to 2014, extreme precipitation increased by 53% (relative to 1901–1995), with a significant change to a wetter climate in around 2002 [19]. Since this shift, wet years have been punctuated by abrupt dry intervals, a trend projected to increase into 2100 [20]. Projections also indicate that precipitation will increase by 9.7% and extreme precipitation by 51.6% in the northeast by 2100 [21], with the largest changes expected in winter, likely reflecting a decline in frozen precipitation. In Harvard Forest, located in central Massachusetts, Jurado and Matthes (2024) observed increases of 4.5 mm/year in extreme precipitation (p = 0.010) and a 6.86 mm/year increase in total precipitation (p = 0.0004) from 1964 to 2023, accompanied by declining soil moisture and relatively stable evapotranspiration [22].
The average depth to water observed in a distributed water level network is ~5 m [23]. However, climate change has produced wetter conditions in New England, interrupted by both short- and long-term droughts, and has reduced winter snowfall. This has resulted in higher terrestrial water storage, which is defined as the total of groundwater, surface water, soil moisture, snow, and biological water. Regional increases in water levels were observed over this same period [24]. In addition, flood extents may expand by 20% by the mid-century, with extreme flow and water depths expected to increase concurrently [25]. Locally, these trends are contributing to nuisance flooding, wet basements, expanded surface water features, wetland growth, and the emergence of inland ghost forests. Massachusetts land is primary wooded, with 56.7% of land cover being classified as forest. Impervious/developed land has the next highest percentage with 16.8%. This is followed by wetlands, forested wetlands, and emergent wetlands at 11.2%. Open water makes up 6.2% of land cover, and cultivated land and pastures make up 6.2% [26].
Projections for Massachusetts indicate substantial seasonal variability. Winter 100-year floods are expected to significantly increase into the mid-21st century, while fall 10-year 7-day low flows are expected to significantly decline [27]. Streamflow records indicate that winter/spring baseflows have increased [28,29] and the spring/fall baseflow index (BFI) has decreased [29].
Surface water features in southern New England also play a significant role in regional hydrology. The Connecticut River is the primary drainage system in the region, flowing south from New Hampshire, through Massachusetts and Connecticut, and into Long Island Sound. The river depth ranges significantly throughout the year, and it is fed by many tributaries, including the Deerfield, Westfield, and Chicopee rivers. Surface water features comprise various ponds, lakes, and wetlands, the largest of which is the Quabbin reservoir, which supplies much of the state with drinking water. These surface water features can be permanent or seasonal/ephemeral. Understanding these surface and subsurface systems provides the foundation for further analysis into the water storage of region.
Figure 1. The extent of the GRACE analysis bounding box, representing the area between 42 and 43° N and −71.5 and −73.5° W (red line). Massachusetts Hydrologic Unit Codes (HUC) 8 watershed delineations (black line). Locations of USGS monitoring wells used in the study (red circle) overlaid onto a statewide transmissivity map from the Hydrogeologic Atlas of Massachusetts [26].
Water 17 03093 g001

3. Materials and Methods

3.1. Definition of Subsurface Storage Reservoirs

Because this region has thin soil and sediment over low-permeability bedrock, we characterized the groundwater storage using a shallow versus deep framework. Shallow surface and groundwater storage is defined as the upper 3 m of the surface (inclusive of both soil moisture and transient perched aquifers), while deeper groundwater storage occurs from 3 to 50 m, primarily in the high-transmissivity sediments of river valleys. Results from Boutt et al. (2010) and Boutt (2017) show that the region’s low-permeability bedrock stores less than 1% of the total groundwater, compared to the overlying glacial sediments, which have significantly higher dynamic storage [16,24].

3.2. GRACE Terrestrial Water Storage Data Retrieval

To quantify terrestrial water storage (TWS) changes, publicly available, monthly, three-dimensional gridded data from NASA’s Gravity Recovery and Climate Experiment (GRACE) and GRACE Follow-On missions from April 2002 to January 2025 was used [30], specifically, Release Level 6.03 Version 4 of the 0.5-degree-resolution Level 3 TWS anomaly product. This dataset is based on JPL’s Mascon solution, which estimates mass anomalies over predefined areas of Earth’s surface and incorporates Coastal Resolution Improvement (CRI) to reduce signal leakage between the land and ocean [31]. TWS anomalies represent deviations from a baseline period (January 2004 to December 2009) and reflect the combined changes in groundwater, surface water, soil moisture, snow, and biological water, expressed as liquid water equivalent in centimeters.
The Mascon dataset, downloaded from JPL as netCDF, was processed using Python 3.12.6 with the netCDF4, xarray, pandas, and matplotlib libraries [32,33,34,35]. The dataset was spatially subset to the study area (42–43° N, 71.5–73.5° W; see Figure 1) for subsequent analysis. The overall anomaly for a given month was an average of the anomaly at each 0.5-degree grid cell within the bounding box, from which a time series of the TWS anomalies for the region was calculated. Each grid cell is approximately 2500 km2. To correct the signal attenuation introduced by the regularization and spatial smoothing in JPL’s Mascon solution [31], gridded scaling factors provided in the NetCDF file were applied to restoring the amplitude of the terrestrial water storage signal.

3.3. USGS Monitoring Well Data Retrieval

Deep groundwater-level (average well depth of ~8 m) data was obtained from observation wells in the United States Geological Survey (USGS) Groundwater Monitoring Network [23]. After filtering to include only wells within the GRACE data retrieval bounding box for a direct comparison with the GRACE terrestrial water storage data, 36 wells were identified (Table S1) from various geologic and depositional environments (represented by red circles in Figure 1). Wells screened in fractured bedrock often comprise a distinct, confined aquifer system [24] and were excluded from analysis. Prior work has shown that these systems have extremely low storage. All sites used had nearly complete data over their period of record. However, to account for missing data, only months where >60% of wells had available data were used in the analysis. The data in the USGS Groundwater Monitoring Network contains both daily instrumental depth to water (DTW) measurements and approximately monthly field DTW measurements. Daily values were widely implemented in the last decade, while some field values went as far back as the 1950s. The average deep groundwater level anomaly within the bounding box was calculated using Python. This workflow compiles DTW data using the National Water Information System (NWIS) data retrieval library. Through combining daily data from the get_dv() function and monthly field measurements from the getrecord() function [23], we obtained access to a more complete time series for each well. To combine these datasets, the daily instrumental values were constrained to a monthly value. We chose the 23rd day of each month to pull a single monthly value from the daily data. This date was similar to the dates of record of many of the monthly field measurements and kept the temporal resolution even throughout the time series and consistent with the monthly GRACE data. Following the procedure used for the GRACE terrestrial water storage anomaly, the deep groundwater anomalies for each well were calculated by subtracting the baseline mean (Jan 2004–Dec 2009) from the value for a given month. These anomalies were spatially unweighted averages across all the wells in the dataset to calculate the overall deep groundwater anomaly within the bounding box. A constant specific yield value of 0.15 [24] was used to convert the groundwater anomaly into the liquid water equivalent for it to be directly comparable to the terrestrial water storage anomaly.

3.4. Quabbin Reservoir Data Retrieval

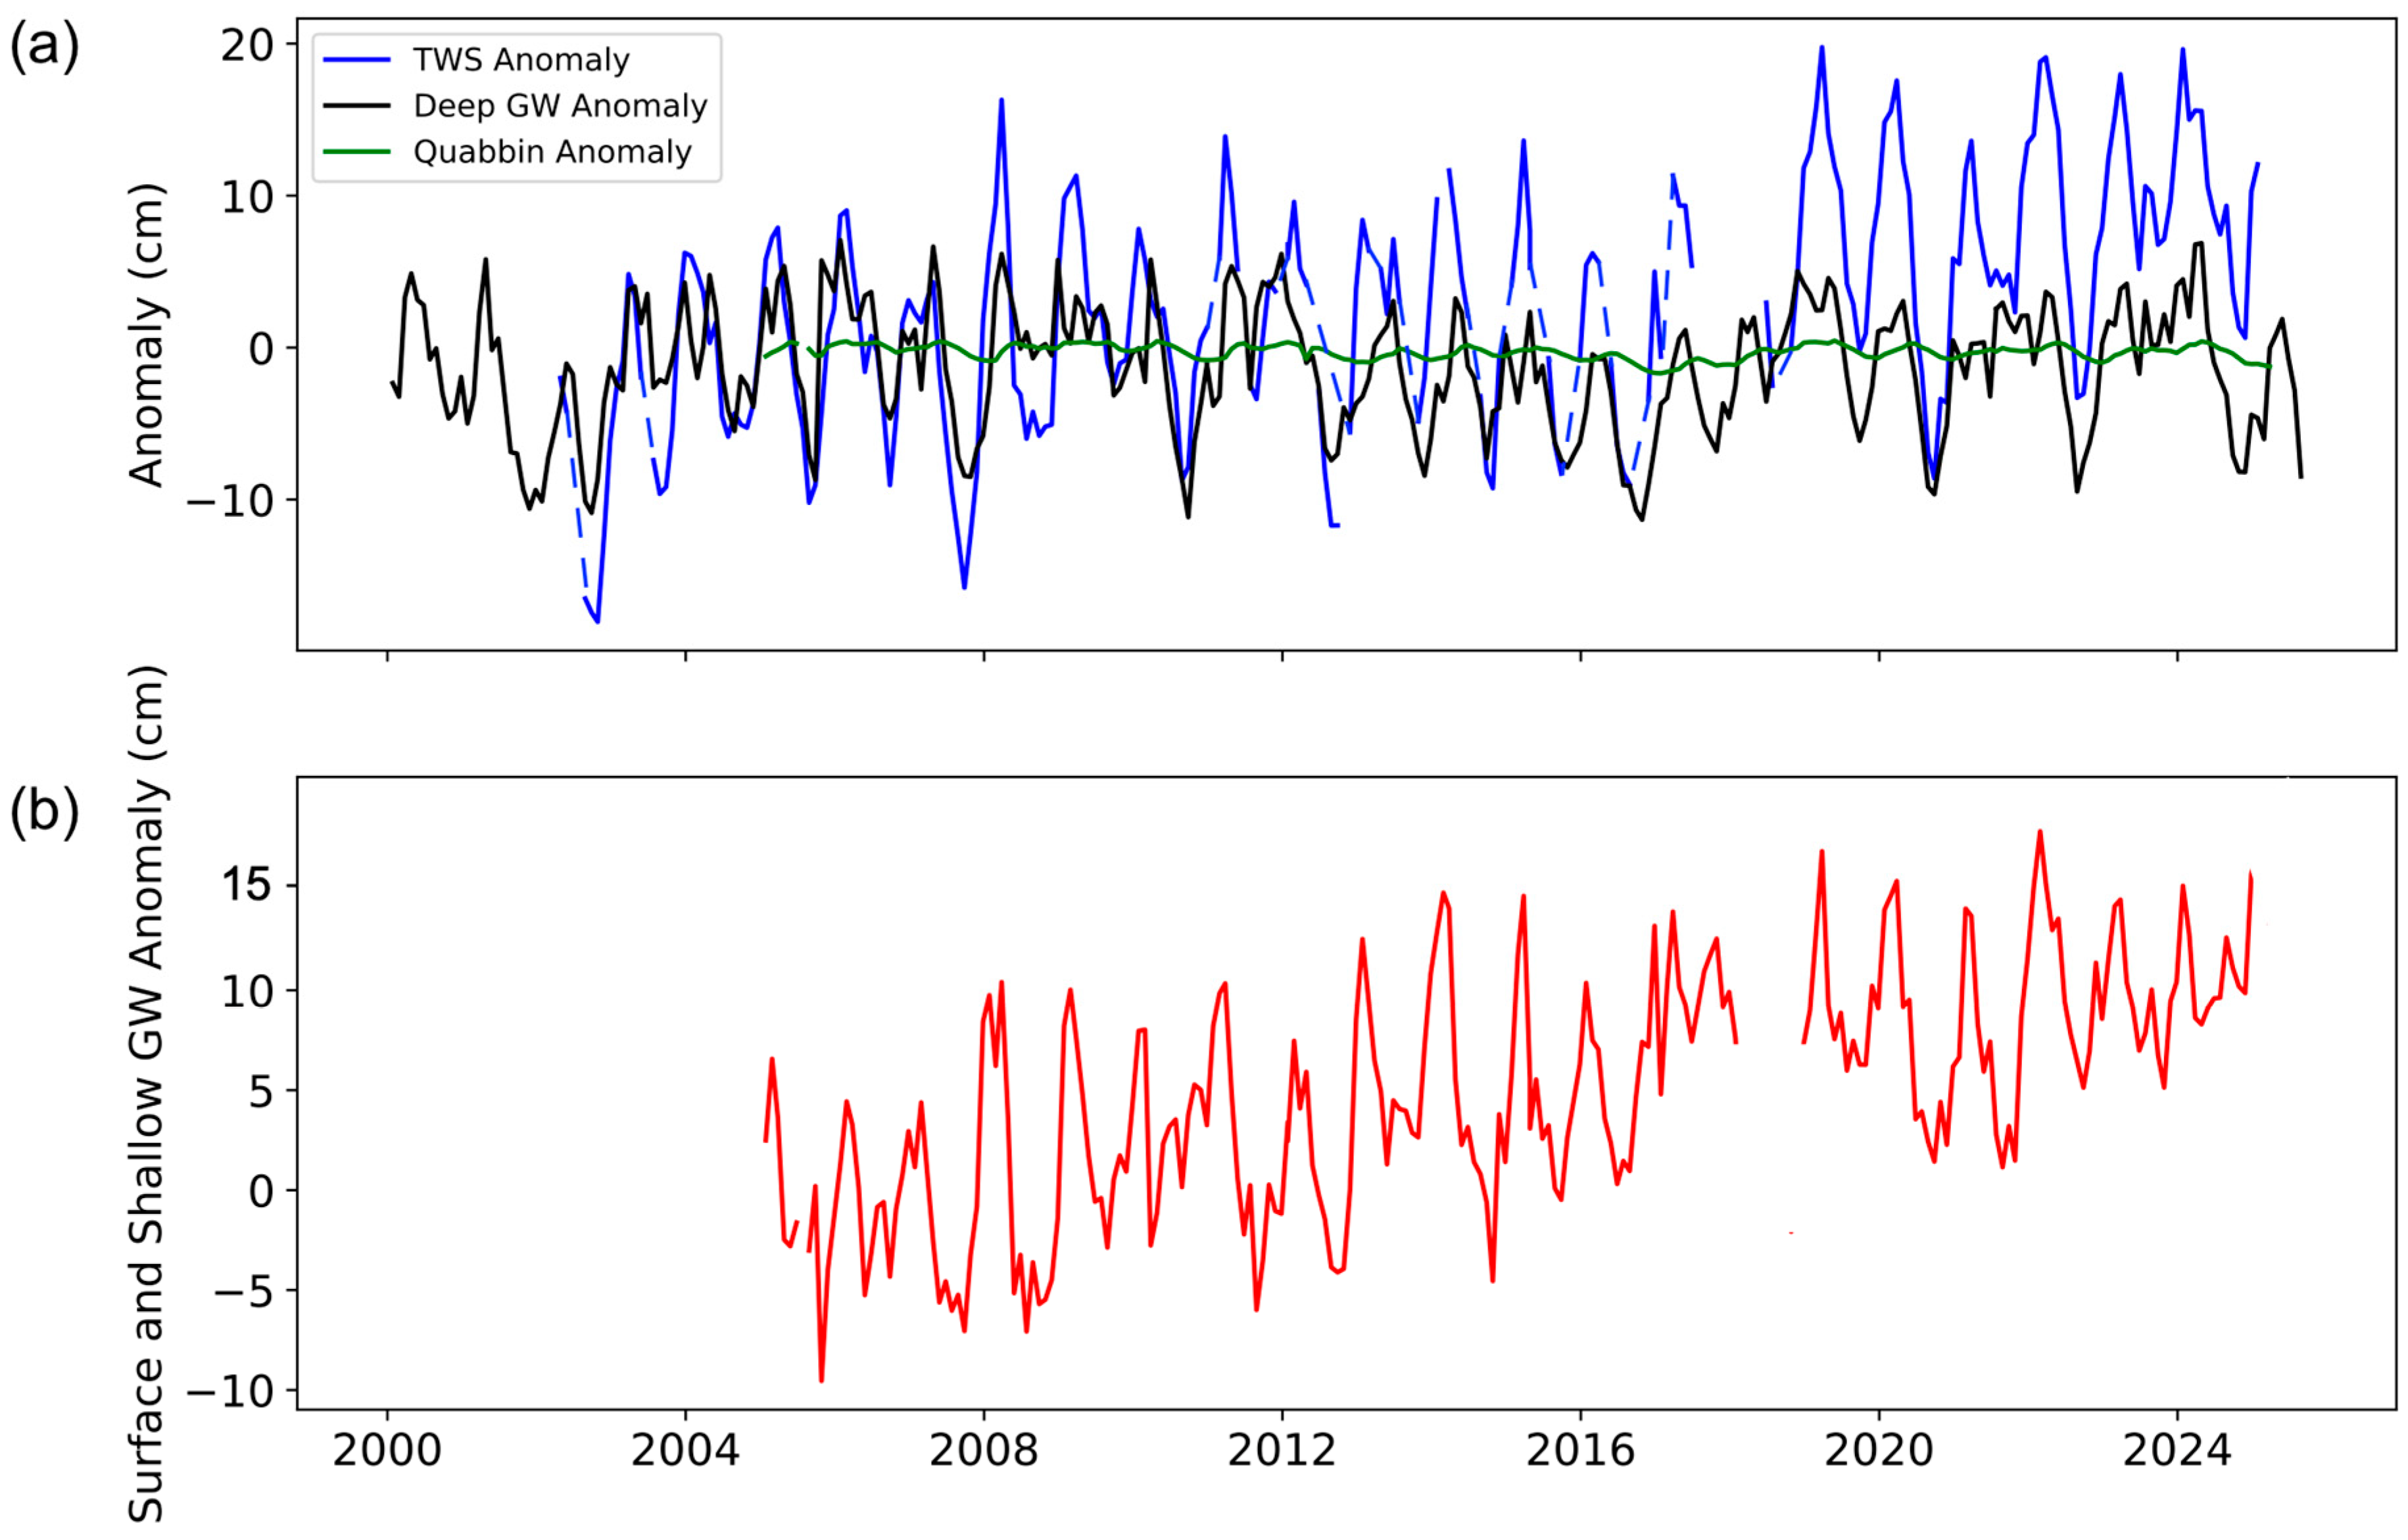
Data from the Quabbin reservoir, the largest surface water body within the bounding box, was also considered in this study. Reservoir volume data came from the Massachusetts Water Resources Authority’s historical records [36]. This information was only available from 2005 onward, so the baseline value for the Quabbin data was set as the average volume from Jan 2005 to Dec 2009, and the anomaly was calculated relative to this value. The anomaly was divided by the total area of the bounding box to calculate the liquid water equivalent over the region. This was plotted alongside the deep groundwater and terrestrial water storage anomalies as a reference to compare the relative magnitudes across the region.

3.5. SMAP Soil Moisture Data Retrieval

Soil moisture data was obtained from NASA’s Soil Moisture Active Passive (SMAP) Level 3 gridded dataset (SPL3SMPE, Version 005) [30]. These values represent the volumetric water content within the top 5 cm of the soil. Data was retrieved using Google Earth Engine from April 2015 to January 2025, and monthly soil moisture values were computed by calculating the mean of the daily values for a given month within a grid cell. These mean grid cell values were averaged for each month to calculate an overall time series within the bounding box.

4. Results

4.1. Terrestrial Water Storage (GRACE)

GRACE satellites capture the terrestrial water storage anomaly at the seasonal, annual, and inter-annual levels. With a monthly temporal resolution, the seasonal variation in water storage is evident in Figure 2. In general, the terrestrial water storage anomaly peaks in the winter/spring and reaches a minimum in late summer/fall (tracking precipitation–evapotranspiration trends). However, not all years follow this trend, as excessive rain during the growing season can result in an elevated water storage anomaly throughout the year, as observed in 2021 and 2023. The TWS heatmap also indicates changes in the timing of storage changes, with an increase in early season storage. Seasonal variation in water storage typically ranges from 15 to 20 cm, although it can be as low as 10 cm in years with high storage anomalies year round. The largest annual variation occurred from 2007 to 2008, with the difference between the maximum and minimum storage being 33 cm. Interannually, over the period of analysis, these data show three distinct trend periods (Figure 2b). Water storage declined during the period from 2011 to 2016 following a multi-year drought culminating in 2016. In contrast, the water storage in the years preceding and following the drought increased. A seasonal Mann–Kendall test [37] indicates a statistically significant increasing trend (p < 0.001). The overall water storage anomaly increased 13.2 cm over the entire time series, following a trend of 0.048 cm/month (0.037–0.058 at the 95% confidence interval), calculated using Sen’s slope estimator [38]. The time series can be broken down further into three sections: 2002 to the beginning of the 2008 pluvial, the end of the 2008 pluvial to the start of the transition between GRACE and GRACE-FO, and the end of the GRACE-to-GRACE-FO transition to 2025. These have trends of 0.048 (−0.054 to 0.14 at the 95% confidence interval), −0.0059 (−0.042 to 0.029 at the 95% confidence interval), and 0.024 (−0.057 to 0.094 at the 95% confidence interval) cm/month, respectively.

4.2. Groundwater (USGS Monitoring Wells)

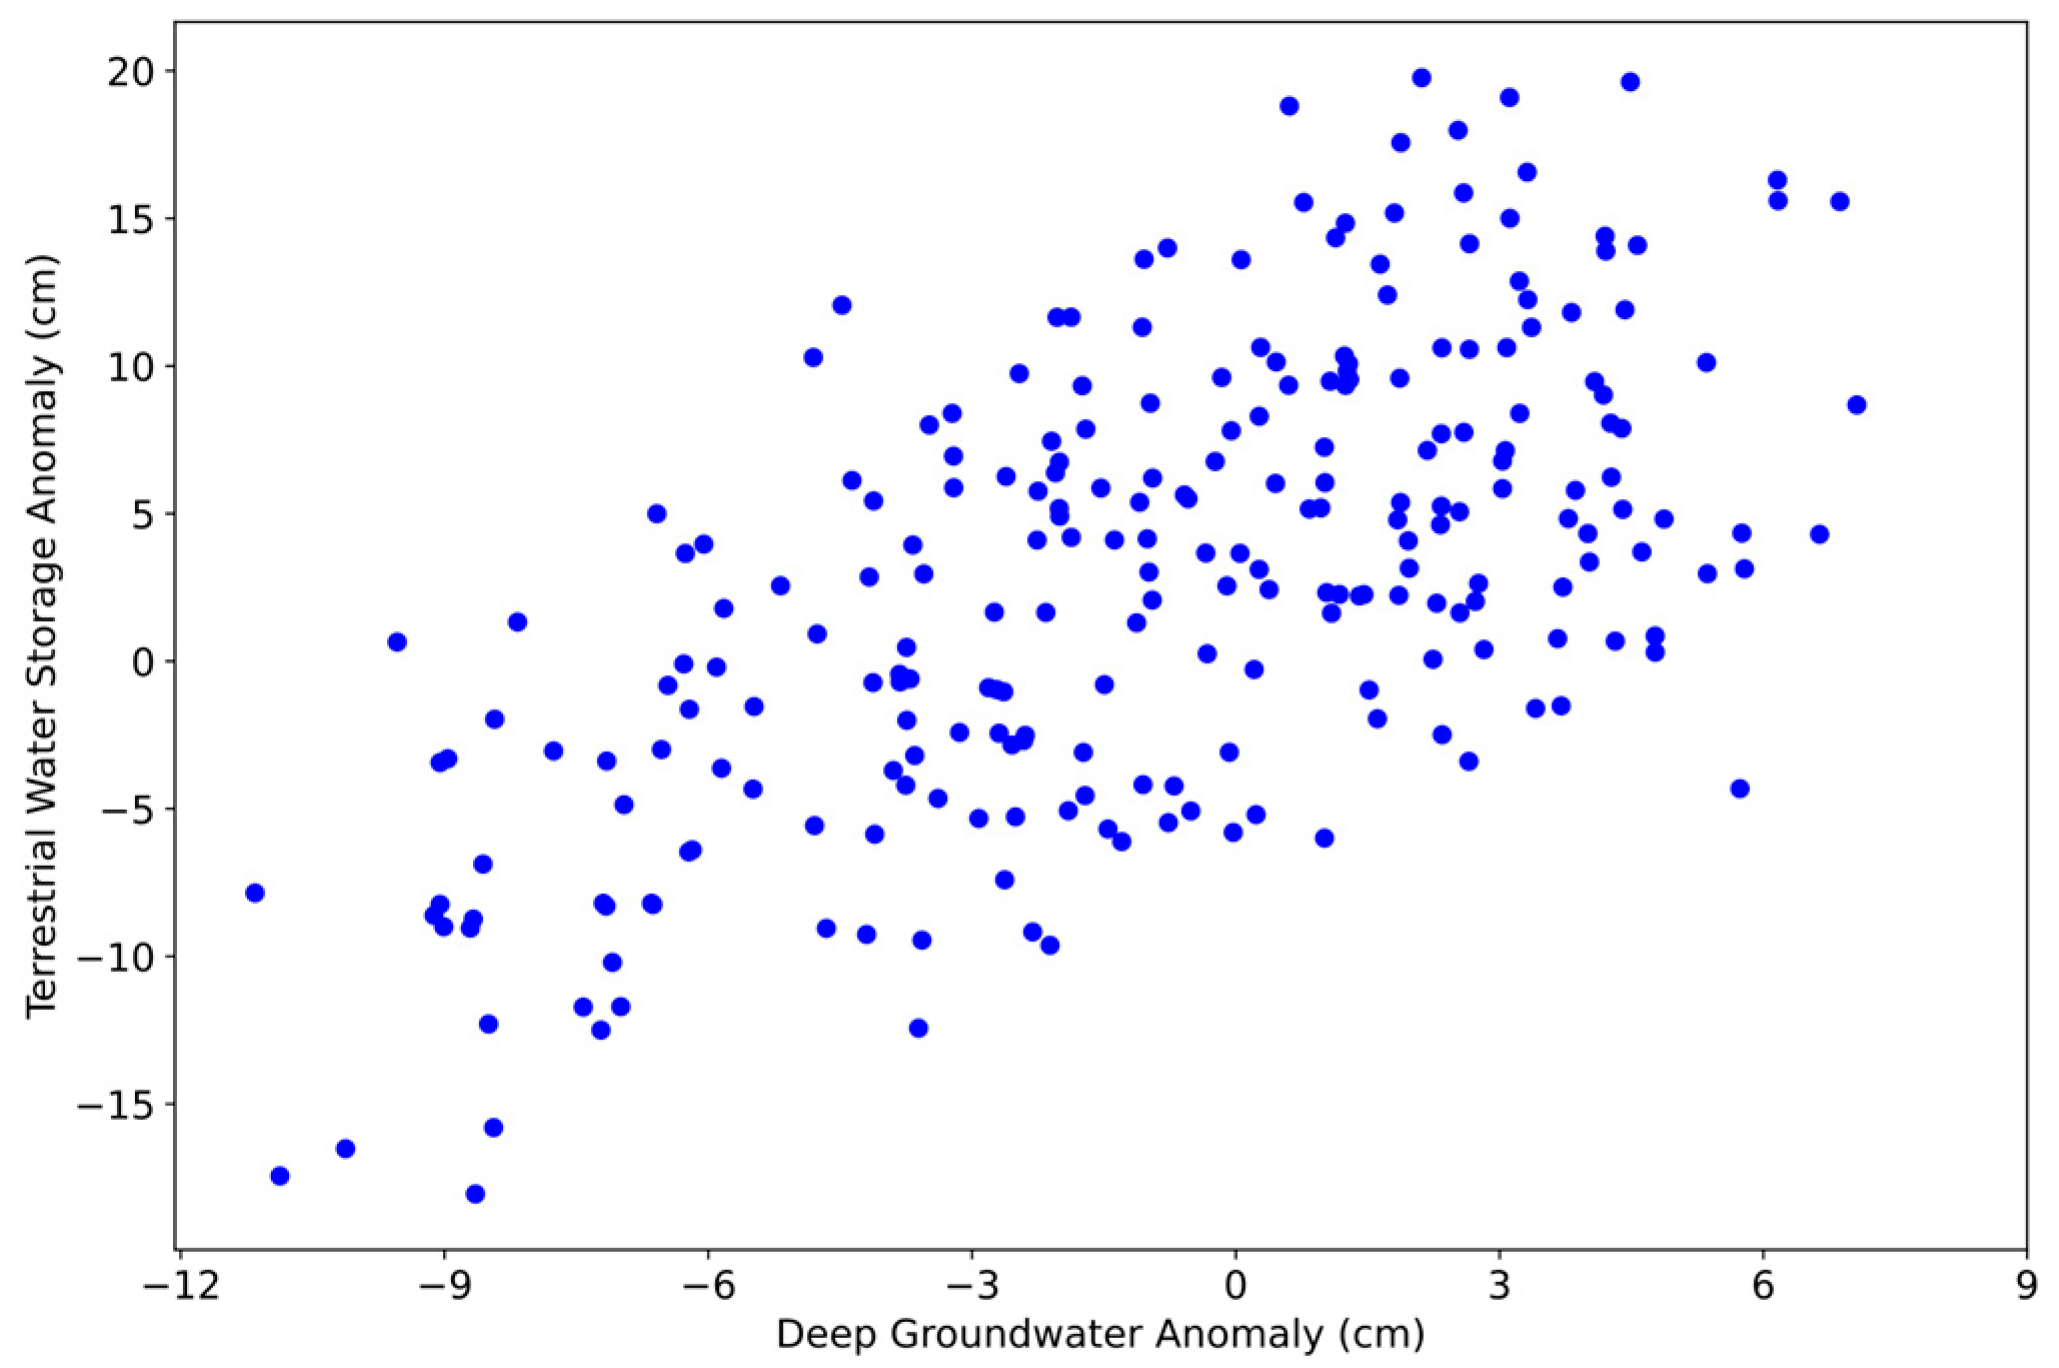
Deep groundwater storage anomalies (Figure 3) likewise exhibit strong seasonal variability. The instrumental groundwater anomaly closely resembled that of the terrestrial water storage (TWS), with the TWS anomaly often peaking in the same month or the month prior to the groundwater anomaly (Figure 4). The relative magnitudes of the seasonal swings also closely match each other. While the period from 2002 to 2009 (Figure 5) saw strong coupling of the two lines, decoupling occurred along the time series as TWS increased at a faster rate than deep groundwater. By the 2020s TWS was significantly higher than the deep groundwater anomaly. Both the TWS and instrumental deep groundwater lines in Figure 2 and Figure 3 decreased in the years preceding the 2016 drought; however, the deep groundwater anomaly declined by ~6 cm during this time and regained 6 cm in the years following the drought, resulting in no net change. TWS did not decrease as dramatically from 2010 to 2016, resulting in over 5 cm of accumulation in the period from 2010 to 2025. Throughout the entire time series, a seasonal Mann–Kendall test indicates no significant change in level (p = 0.701) [37]. Similarly to TWS, recent years have been marked by a ‘whiplash’ state of alternating droughts and pluvial events, which have resulted in large swings in storage from year to year. Deep groundwater anomaly swings are generally around 10–15 cm of liquid water equivalent over the course of a year, although large swings such as those in 2024 and 2010 reached up to 18 cm. These swings often occurred from high to low levels when an elevated water table was followed by a drought, causing the anomaly to plummet. In contrast, years in which the water table stayed elevated, such as in 2009, 2021, and 2023, observed seasonal swings as small as 6 cm. At zero lag, there is a moderately strong correlation (r2= 0.665) between deep groundwater and terrestrial water storage, as represented in Figure 6.

4.3. Surface and Shallow Groundwater Residual

The residual after subtracting the monthly deep groundwater anomaly and Quabbin reservoir data from the TWS anomaly includes soil moisture, shallow groundwater, and surface water bodies (excluding the Quabbin). This has a similar overall trend to that for the GRACE anomaly, with a statistically significant increase (p < 0.001) according to a seasonal Mann–Kendall test [37]. The trend from year to year based on Sen’s slope estimator [38], as represented in Figure 5, indicates that water accumulated at a rate of 0.052 cm per month with a 95% confidence interval of 0.045–0.061 cm/month, resulting in a total increase of 12.48 cm from 2005 to 2025. The trend was not consistent across the time series but instead came in pulses as holdovers from wet years rather than as a linear increase. Figure 5 depicts the seasonal swings in the residual anomaly from 5 to 15 cm. However, given zero lag, slight differences between the peaks of the groundwater and TWS anomalies may result in an inflated residual anomaly swing, especially considering how quickly anomalies can change during droughts and at the end of the growing season.

4.4. Soil Moisture (SMAP)

The soil moisture values obtained from SMAP represent the volumetric percentage of water within the top 5 cm of soil. These values ranged from 0.17 to 0.49 percent, with all but 7 months falling between 0.3 and 0.45 percent (Figure S1). Restricting the calculations to the top 5 cm of soil corresponds to yearly swings of ~0.75 cm of liquid water equivalent. However, the Paxton soil series reaches depths of 50–100 cm, meaning seasonal fluctuations can be upwards of 7.5 cm. While seasonal variation in the residual anomaly (Figure 5) may be explained by fluctuations in soil moisture, the long-term SMAP-derived soil moisture trend is relatively flat, indicating that the increase visible in the residual anomaly is unlikely to be attributed to long-term changes in soil moisture.

5. Discussion

While previous research has demonstrated that deep groundwater levels in New England have risen since the 1960s drought [24,39], we show that recent decades have seen a flattening of this trend. Despite this, TWS data from the GRACE satellites indicate that the total water storage over this area has continued to rise. The increase in storage between 2002 and 2025 corresponds to approximately 20% of annual precipitation being added/removed from storage. Similarly to the trends in the observational groundwater level network, the increases in storage come in seasonal pulses (Figure 2). Decadal trends suggest that increases in stored water on the landscape are holdovers from extremely wet years.
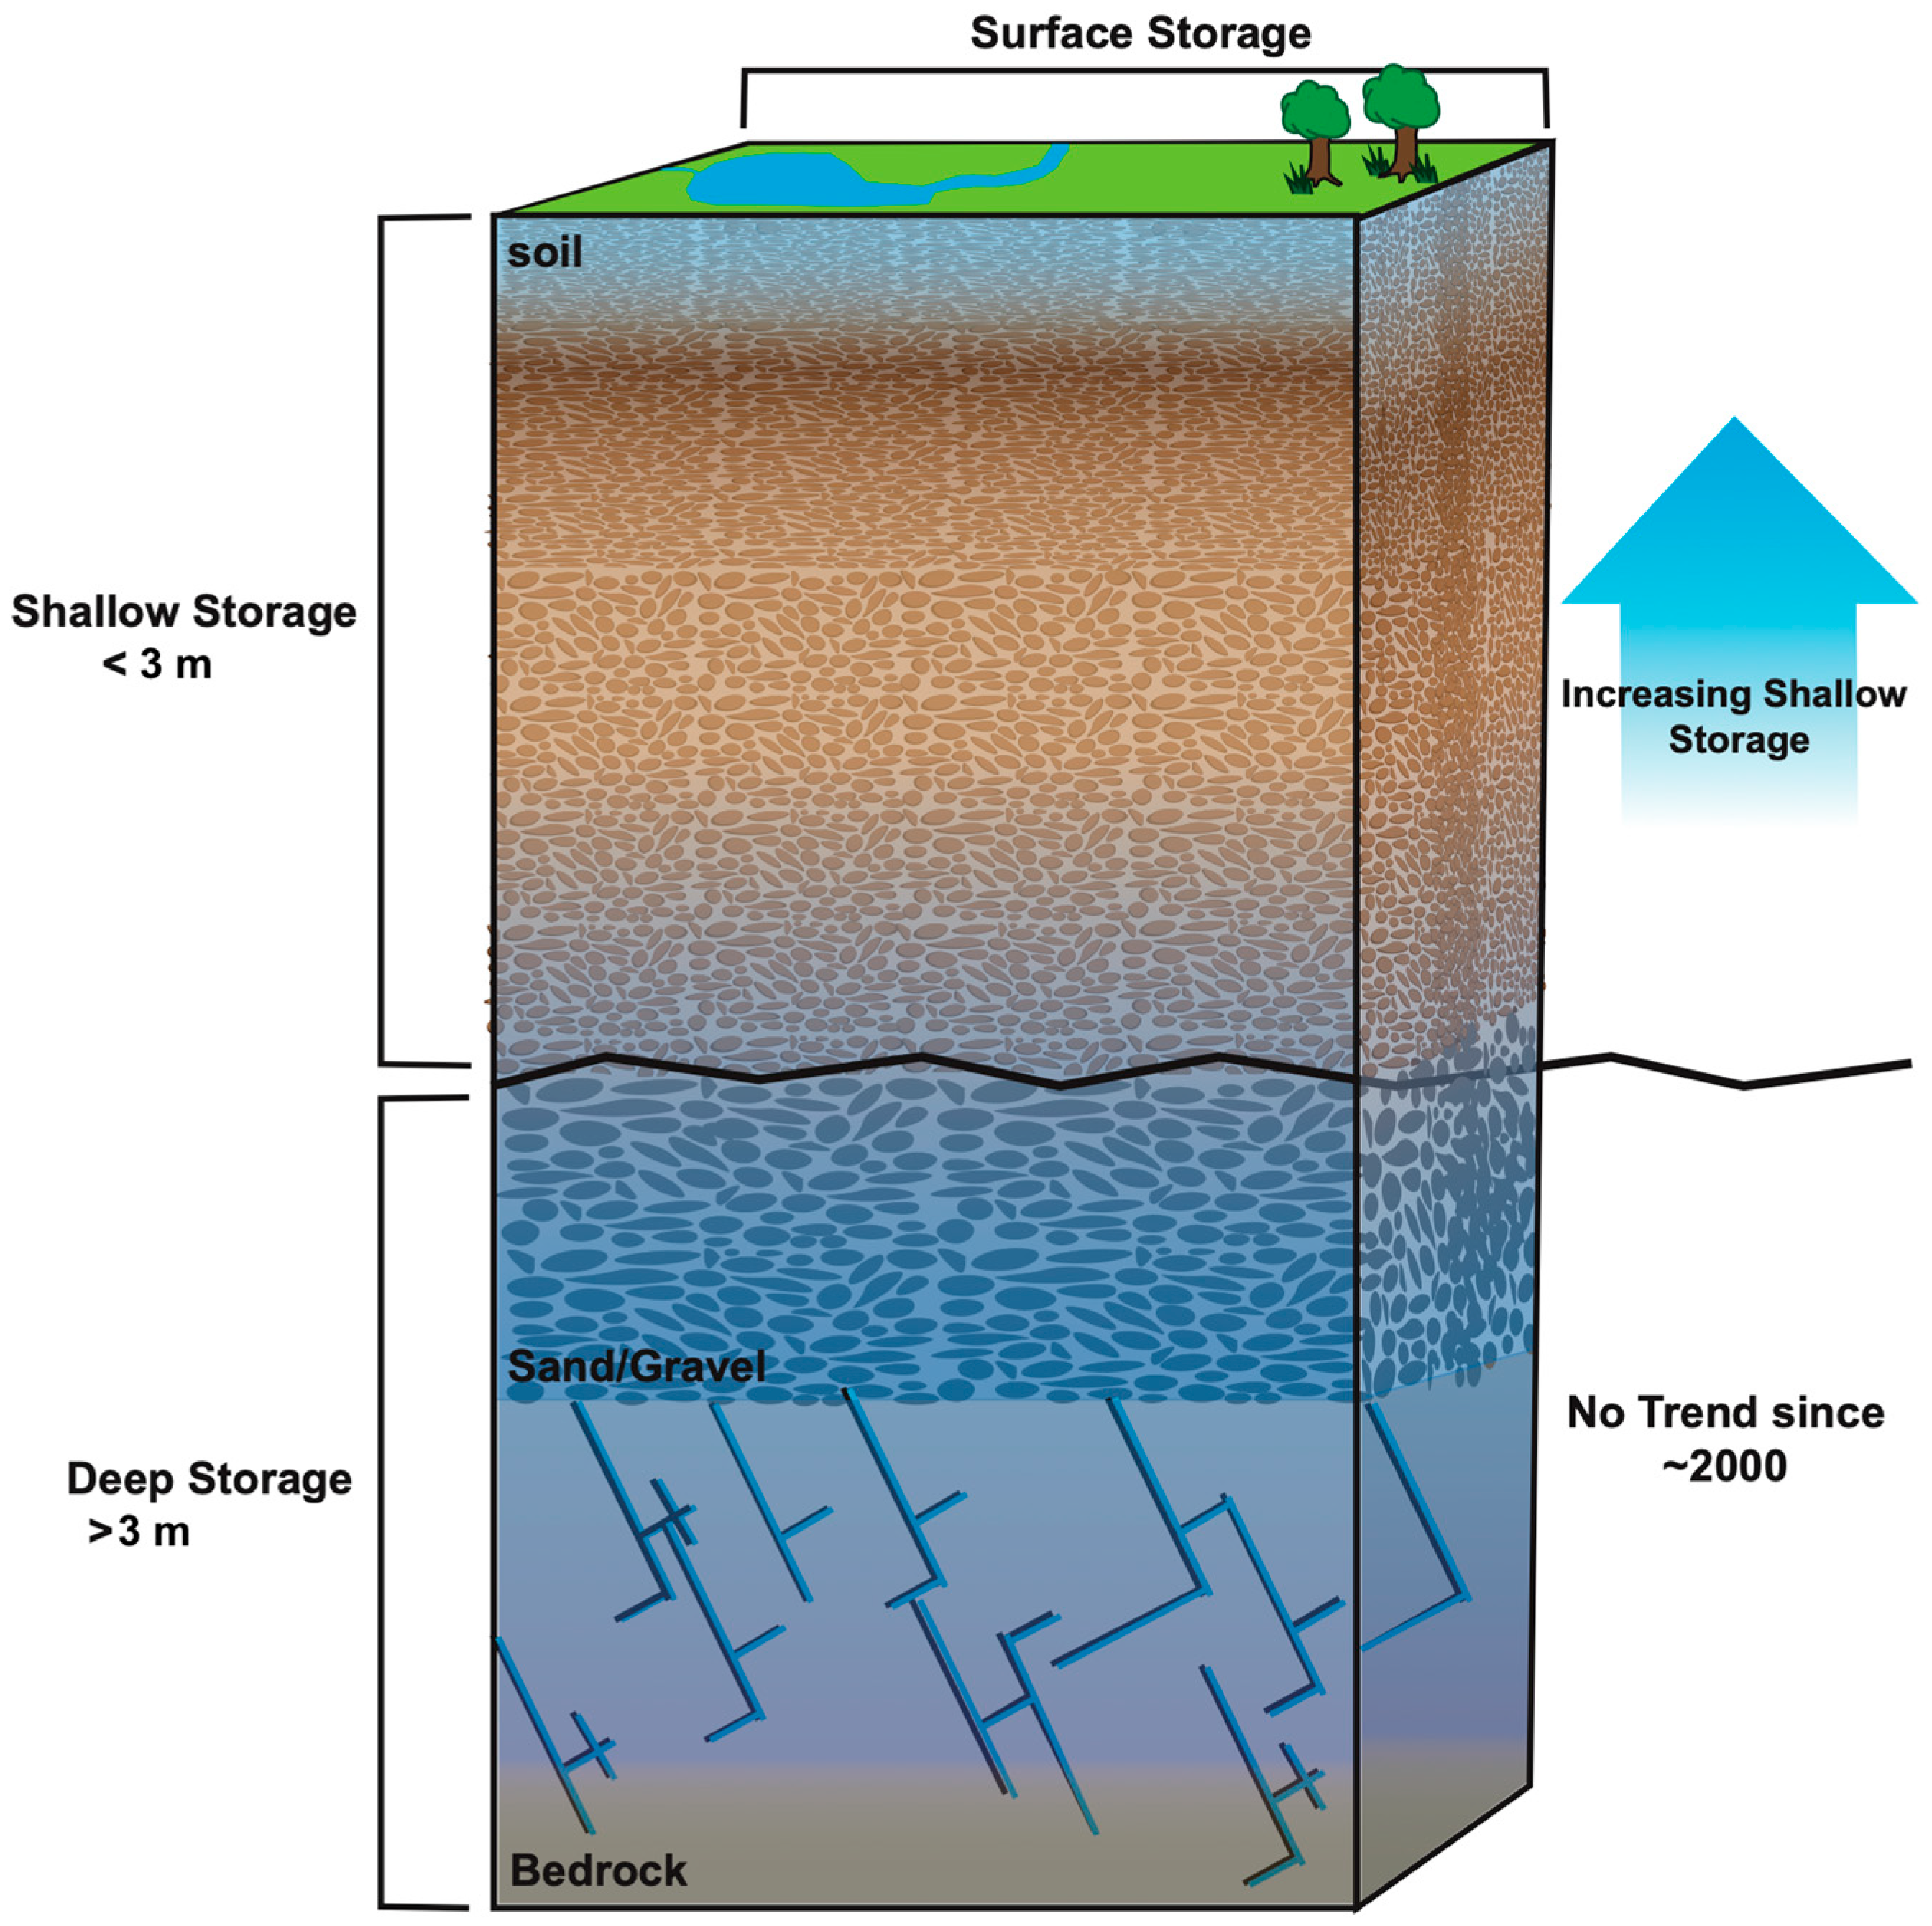
Since groundwater data from the observational monitoring network does not reflect the same rise, water must be stored elsewhere on the landscape or in the subsurface. With an average well depth of 8.08 m, the anomaly from the USGS groundwater monitoring network captures a deep groundwater anomaly but may not accurately represent changes in shallow subsurface storage. Deeper systems may have reached a threshold according to which they can no longer rise, constraining their level and explaining the lack of an increasing trend. Figure 7 represents a summary of our hypothesis as to why we see differences between the trends in the observed TWS and deep groundwater anomalies.
Discrepancies between GRACE and observed well measurements may be the result of several factors. For example, additional infiltration from excess precipitation may create seasonal perched aquifers not sampled by the regional monitoring network. Increases in terrestrial water storage may be explained by increases in water storage on the surface and as temporary wetlands. To understand where observed increases in storage may be stored, it is important to consider the regional water budget. As mentioned previously, annual precipitation often exceeds 1800 mm compared to the 1200 mm baseline average since the 1960s. Jurado and Matthes (2024) have demonstrated that evapotranspiration has been stable, if not declining slightly, meaning that a smaller percentage of precipitation is returning to the atmosphere [22]. Streamflow records have indicated rising streamflow and baseflow in the winter months but a decline in summer/fall [28,29], suggesting changes in timing but not necessarily in magnitude. GRACE data, however, shows a part of this excess water has been retained in storage since 2002. This increase is likely stored in the shallow subsurface as perched aquifers and temporary wetlands, reflecting a change in storage processes in the shallow subsurface. Although small compared to the entire water budget, this change in storage has substantial effects on the region’s hydrology.
The Connecticut River likewise plays a role in the regional water budget. The gage height at the USGS stream gage in Montague, MA, typically fluctuates between 2 and 5 m. The river runs approximately 150 km through the bounding box. Assuming a width of 400 m, the total volume of the river within this region typically ranges from 120,000,000 to 300,000,000 cubic meters. Over the entire bounding box, these fluctuations result in a 1.04 cm contribution to the overall terrestrial water storage anomaly. Landsat imagery analyzed using Google Earth Engine estimates the surface water extent within the bounding box to be 585,000,000 square meters, approximately 20% of which is the Quabbin reservoir. This surface water extent makes up 3.4% of the total bounding box area. This would indicate that a 10 cm increase in terrestrial water storage would require over 290 cm of corresponding increase in surface water levels. This value is likely overstated, however, since the 30 × 30 m spatial resolution of Landsat imagery cannot fully capture smaller ponds, wetlands, and narrow water features such as many streams and rivers, which results in a lower surface water extent estimate.
While using GRACE-derived terrestrial water storage data provides important insights into storage changes, the use of this data at a smaller scale (<200,000 km2) such as in southern New England may introduce potential signal leakage from surrounding areas outside the desired region of interest [31]. This leakage could either amplify or dampen the true anomaly. However, the close coupling between GRACE and instrumental monitoring well data and matching seasonal trends suggest that the GRACE TWS anomaly is consistent with actual hydrologic trends. While signal leakage remains a source of uncertainty at such a small scale, this analysis supports the interpretation that the increases in TWS observed in the anomaly reflect actual storage changes within the region.
In humid temperate regions such as southern New England, surface and groundwater serve several vital functions by nourishing headwater streams, providing drinking water for communities, and supporting local ecosystems. This work documents significant changes to the region’s overall water budget. Shallow and near-surface water storage is increasing at rates faster than that for other components of the water budget, indicating a dramatic shift in hydrology. Quantifying these changes in terrestrial water budget components (e.g., evapotranspiration, soil moisture, streamflow) is essential for understanding future conditions. Rising water tables and seasonal soil moisture variations influence farmers’ crop rotation planning, water managers’ strategies for surface reservoir storage, and emergency managers’ forecasts for nuisance and extreme floods. This work provides vital data for various stakeholders to make informed decisions regarding infrastructure, planning, and resilience projects.

6. Conclusions

This study combines GRACE-derived terrestrial water storage anomalies with soil moisture and groundwater measurements to evaluate long-term hydrologic changes in southern New England. We observe that while deep groundwater storage has stabilized in recent decades after increasing for 30 years, total terrestrial water storage has continued to increase at a rate of 0.048 cm/month on average. However, these increases come in pulses following heavy rainfall years, resulting in ~13 cm of water having been added over the last two decades. The divergence of GRACE TWS from deeper groundwater indicates that surplus water is being stored near the surface in aquifers that are underrepresented in the observation network. In addition, the timing of storage has shifted, with an increase in early season storage. Unlike many areas of the world, this region is experiencing increases in precipitation and terrestrial water storage, leading to adverse impacts on the environment. In this analysis, we show how integrating long-term remote sensing data with instrumental and field measurements can identify specific hydrologic changes and processes. We link regional water storage increases to seasons with extreme rainfall and explain why apparent wetting trends from GRACE may not be reflected in groundwater records in southern New England.
Publicly available data have been analyzed to understand the water storage trends in southern New England with detailed precision, both on the landscape and beneath the surface. As climate change leads to more frequent droughts and floods [1], accurately monitoring changes in water storage and pinpointing where these changes happen become increasingly crucial. These observations can guide decisions on water scarcity and flood prevention, helping improve management of the growing impacts of climate change.

Supplementary Materials

The following supporting information can be downloaded at https://www.mdpi.com/article/10.3390/w17213093/s1. Table S1: USGS monitoring well locations and characteristics. Figure S1: SMAP 5 cm depth soil moisture within bounding box.

Author Contributions

Conceptualization: D.F.B. and J.C.H.; methodology: D.F.B., G.O., J.C.H. and N.B.; software: G.O. and N.B.; validation: D.F.B. and J.C.H.; formal analysis: D.F.B., G.O., J.C.H. and N.B.; investigation: G.O., J.C.H. and N.B.; resources: D.F.B., J.C.H. and N.B.; data curation: G.O. and N.B.; writing—original draft preparation: D.F.B., G.O. and J.C.H.; writing—review and editing: D.F.B., G.O., J.C.H. and N.B.; visualization: G.O., J.C.H. and N.B.; supervision: D.F.B. and J.C.H.; project administration: D.F.B.; funding acquisition: D.F.B. All authors have read and agreed to the published version of the manuscript.

Funding

This work was financially supported by the U.S. Geological Survey Water Cycle Center (Grant No. G24AC00126-00).

Data Availability Statement

The data presented in this study are available in various publicly accessible repositories. The GRACE-derived TWS data and SMAP soil moisture data is available from NASA’s Earthdata Search at https://search.earthdata.nasa.gov (accessed on 22 August 2025). The groundwater data was compiled from USGS National Information Water System at https://waterdata.usgs.gov/nwis (accessed on 6 September 2025). The specific wells used can be found in the Supplementary Materials section. Discharge measurements, including the Connecticut River stream gage data, was likewise obtained from USGS National Information Water System. Precipitation data is from NOAA National Center for Environmental Information’s Climate at a Glance page at https://www.ncei.noaa.gov/access/monitoring/climate-at-a-glance/national (accessed on 28 July 2025). Surface water data is from the Global Surface Water Explorer at http://global-surface-water.appspot.com (accessed on 20 August 2025). The Quabbin reservoir data is from the Massachusetts Water Resources Authority at https://www.mwra.com/your-water-system/reservoirs-watersheds/water-supply-demand (accessed on 22 August 2025).

Acknowledgments

We thank Danielle Hare for reviewing an early version of the manuscript, and discussions with Matthew Winnick, Brendan Moran, and Tanveer Ali Dar improved the overall presentation.

Conflicts of Interest

The authors declare no conflicts of interest. The funders had no role in the design of this study; in the collection, analyses, or interpretation of the data; in the writing of the manuscript; or in the decision to publish the results.

Abbreviations

The following abbreviations are used in this manuscript:
USGSUnited States Geological Survey
NASANational Aeronautics and Space Administration
GRACEGravity Recovery and Climate Experiment
CRICoastal Resolution Improvement
DTWDepth to Water
NWISNational Water Information System
SMAPSoil Moisture Active Passive

References

  1. Oki, T.; Kanae, S. Global hydrological cycles and world water resources. Science 2006, 313, 1068–1072. [Google Scholar] [CrossRef]
  2. Wu, P.; Christidis, N.; Stott, P. Anthropogenic impact on Earth’s hydrological cycle. Nat. Clim. Change 2013, 3, 807–810. [Google Scholar] [CrossRef]
  3. Yin, J.; Gentine, P.; Zhou, S.; Sullivan, S.C.; Wang, R.; Zhang, Y.; Guo, S. Large increase in global storm runoff extremes driven by climate and anthropogenic changes. Nat. Commun. 2018, 9, 4389. [Google Scholar] [CrossRef]
  4. Allan, R.P.; Barlow, M.; Byrne, M.P.; Cherchi, A.; Douville, H.; Fowler, H.J.; Gan, T.Y.; Pendergrass, A.G.; Rosenfeld, D.; Swann, A.L.S.; et al. Advances in understanding large-scale responses of the water cycle to climate change. Ann. N. Y. Acad. Sci. 2020, 1472, 49–75. [Google Scholar] [CrossRef]
  5. Fowler, H.J.; Lenderink, G.; Prein, A.F.; Westra, S.; Allan, R.P.; Ban, N.; Barbero, R.; Berg, P.; Blenkinsop, S.; Do, H.X.; et al. Anthropogenic intensification of short-duration rainfall extremes. Nat. Rev. Earth Environ. 2021, 2, 107–122. [Google Scholar] [CrossRef]
  6. Chandanpurkar, H.A.; Famiglietti, J.S.; Gopalan, K.; Wiese, D.N.; Wada, Y.; Kakinuma, K.; Reager, J.T.; Zhang, F. Unprecedented continental drying, shrinking freshwater availability, and increasing land contributions to sea level rise. Sci. Adv. 2025, 11, eadx0298. [Google Scholar] [CrossRef] [PubMed]
  7. Liu, Q.; Bader, J.; Jungclaus, J.H.; Matei, D. More extreme summertime North Atlantic Oscillation under climate change. Comm. Earth Environ. 2025, 6, 474. [Google Scholar] [CrossRef]
  8. Lau, N.; Ploshay, J.J. Model Projections of the Changes in Atmospheric Circulation and Surface Climate over North America, the North Atlantic, and Europe in the Twenty-First Century. J. Clim. 2013, 26, 9603–9620. [Google Scholar] [CrossRef]
  9. Polyakov, I.V.; Alexeev, V.A.; Bhatt, U.S.; Polyakova, E.I.; Zhang, X. North Atlantic warming: Patterns of long-term trend and multidecadal variability. Clim. Dyn. 2010, 34, 439–457. [Google Scholar] [CrossRef]
  10. Tapley, B.D.; Bettadpur, S.; Watkins, M.; Reigber, C. The gravity recovery and climate experiment: Mission overview and early results. Geophys. Res. Lett. 2004, 31, L09607. [Google Scholar] [CrossRef]
  11. Wahr, J.; Swenson, S.; Velicogna, I. Accuracy of GRACE mass estimates. Geophys. Res. Lett. 2006, 33, L06401. [Google Scholar] [CrossRef]
  12. Shamsudduha, M.; Taylor, R.G. Groundwater storage dynamics in the world’s large aquifer systems from GRACE: Uncertainty and role of extreme precipitation. Earth Syst. Dyn. 2020, 11, 755–774. [Google Scholar] [CrossRef]
  13. Jasechko, S.; Seybold, H.; Perrone, D.; Fan, Y.; Shamsudduha, M.; Taylor, R.G.; Fallatah, O.; Kirchner, J.W. Rapid groundwater decline and some cases of recovery in aquifers globally. Nature 2024, 625, 715–721. [Google Scholar] [CrossRef]
  14. Thomas, B.F.; Famiglietti, J.S. Identifying Climate-Induced Groundwater Depletion in GRACE Observations. Sci. Rep. 2019, 9, 4124. [Google Scholar] [CrossRef]
  15. USDA. Soil Survey Staff, Natural Resources Conservation Service, United States Department of Agriculture. Web Soil Survey. Available online: https://websoilsurvey.nrcs.usda.gov (accessed on 26 August 2025).
  16. Boutt, D.F.; Diggins, P.; Mabee, S. A field study (Massachusetts, USA) of the factors controlling the depth of groundwater flow systems in crystalline fractured-rock terrain. Hydrogeol. J. 2010, 18, 1839–1854. [Google Scholar] [CrossRef]
  17. NOAA National Centers for Environmental Information. Climate Data Records for the Northeastern Climate Region. Available online: https://www.ncei.noaa.gov (accessed on 22 August 2025).
  18. Northeast Regional Climate Center. Evapotranspiration Trends in the Northeastern United States. Available online: https://www.nrcc.cornell.edu (accessed on 18 August 2025).
  19. Huang, H.; Winter, J.M.; Osterberg, E.C.; Horton, R.M.; Beckage, B. Total and extreme precipitation changes over the Northeastern United States. J. Hydrometeorol. 2017, 18, 1783–1798. [Google Scholar] [CrossRef]
  20. Xue, Z.; Ullrich, P.A. Changing Trends in Drought Patterns over the Northeastern United States Using Multiple Large Ensemble Datasets. J. Clim. 2022, 35, 7413–7433. [Google Scholar] [CrossRef]
  21. Picard, C.J.; Winter, J.M.; Cockburn, C.; Hanrahan, J.; Teale, N.G.; Clemins, P.J.; Beckage, B. Twenty-first century increases in total and extreme precipitation across the Northeastern USA. Clim. Change 2023, 176, 72. [Google Scholar] [CrossRef]
  22. Jurado, S.; Matthes, J. Increasing large precipitation events and low available water holding capacity create the conditions for dry land-atmosphere feedbacks in the Northeastern United States. Water Resour. Res. 2025, 61, e2024WR038600. [Google Scholar] [CrossRef]
  23. U.S. Geological Survey. National Water Information System (NWIS). Available online: https://waterdata.usgs.gov/nwis (accessed on 6 September 2025).
  24. Boutt, D.F. Assessing hydrogeologic controls on dynamic groundwater storage using long-term instrumental records of water table levels. Hydrol. Process. 2017, 31, 1479–1497. [Google Scholar] [CrossRef]
  25. Pal, S.; Wang, J.; Feinstein, J.; Yan, E.; Kotamarthi, V.R. Projected changes in extreme streamflow and inland flooding in the mid-21st century over Northeastern United States using ensemble WRF-Hydro simulations. J. Hydrol. Reg. Stud. 2023, 47, 101371. [Google Scholar] [CrossRef]
  26. Mass.gov. MassGIS Data. Available online: https://www.mass.gov/info-details/massgis-data-layers (accessed on 10 October 2025).
  27. Siddique, R.; Karmalkar, R.; Sun, F.; Palmer, R. Hydrological extremes across the Commonwealth of Massachusetts in a changing climate. J. Hydrol. Reg. Stud. 2020, 32, 100733. [Google Scholar] [CrossRef]
  28. Ayers, J.R.; Villarini, G.; Schilling, K.; Jones, C.; Brookfield, A.; Zipper, S.C.; Farmer, W.H. The Role of Climate in Monthly Baseflow Changes across the Continental United States. J. Hydrol. Eng. 2022, 27, 04022006. [Google Scholar] [CrossRef]
  29. Ficklin, D.L.; Robeson, S.M.; Knouft, J.H. Impacts of recent climate change on trends in baseflow and stormflow in United States watersheds. Geophys. Res. Lett. 2016, 43, 5079–5088. [Google Scholar] [CrossRef]
  30. National Aeronautics and Space Administration (NASA). Earthdata Search. Available online: https://search.earthdata.nasa.gov/search (accessed on 22 August 2025).
  31. Humphrey, V.; Rodell, M.; Eicker, A. Using Satellite-Based Terrestrial Water Storage Data: A Review. Surv. Geophys. 2023, 44, 1489–1517. [Google Scholar] [CrossRef]
  32. Unidata. NetCDF4 API Documentation. Available online: https://unidata.github.io/netcdf4-python/ (accessed on 5 September 2025).
  33. Hoyer, S.; Hamman, J.J. xarray: N-D labeled arrays and datasets in Python. J. Open Res. Softw. 2017, 5, 10. [Google Scholar] [CrossRef]
  34. Pandas Development Team. Pandas-dev/Pandas: Pandas, version 1.0.3; Zenodo: Genève, Switzerland, 2020. [Google Scholar]
  35. Hunter, J.D. Matplotlib: A 2D graphics environment. Comput. Sci. Eng. 2007, 9, 90–95. [Google Scholar] [CrossRef]
  36. Massachusetts Water Resources Authority. Water Supply & Demand. Available online: https://www.mwra.com/your-water-system/reservoirs-watersheds/water-supply-demand (accessed on 22 August 2025).
  37. Hirsch, R.M.; Slack, J.R. A Nonparametric Trend Test for Seasonal Data With Serial Dependence. Water Resour. Res. 1984, 20, 727–732. [Google Scholar] [CrossRef]
  38. Sen, P.K. Estimates of the Regression Coefficient Based on Kendall’s Tau. J. Amer. Stat. Assoc. 1968, 63, 1379–1389. [Google Scholar] [CrossRef]
  39. Weider, K.; Boutt, D.F. Heterogeneous water table response to climate revealed by 60 years of groundwater data. Geophys. Res. Lett. 2010, 37, L24405. [Google Scholar] [CrossRef]
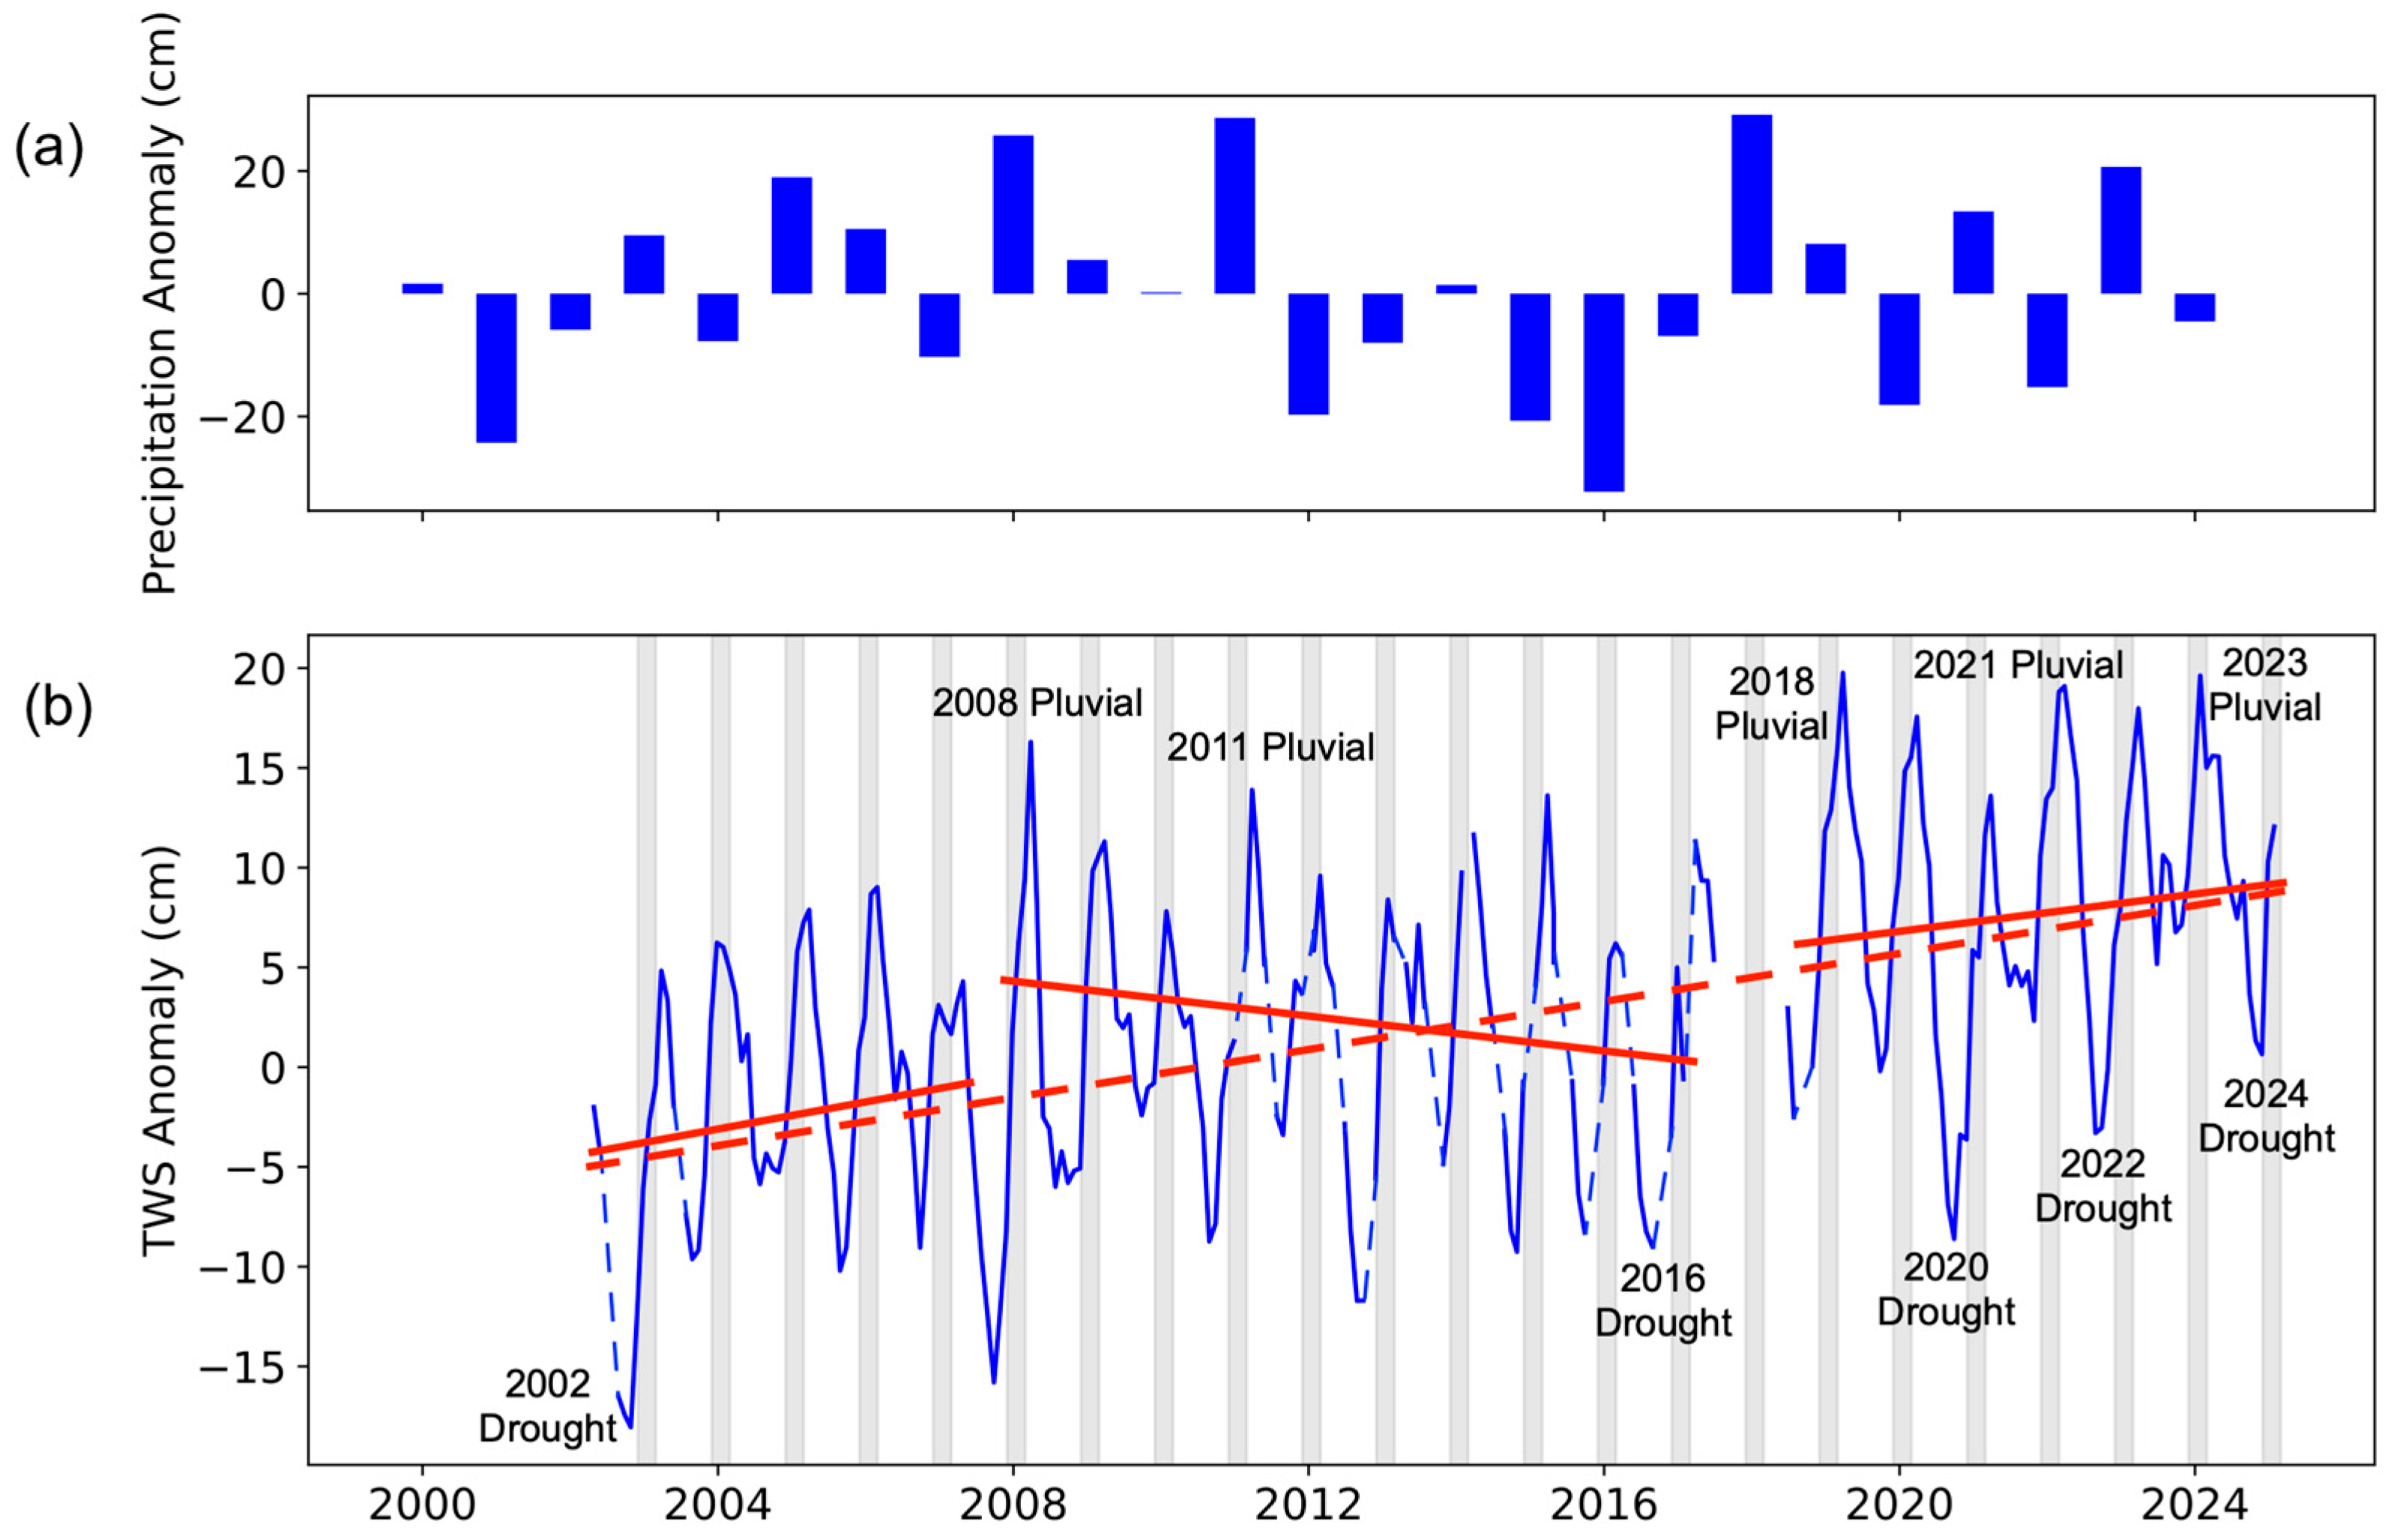
Figure 2. Time series of (a) annual Massachusetts precipitation anomaly (cm) and (b) GRACE-derived terrestrial water storage anomalies within the bounding box in blue. Sporadic months with missing data are interpolated and represented with a dashed blue line. Solid red lines represent the trend for individual sections, and the dashed red line represents the overall trend. Months Dec–Feb are shaded gray, and the data gap in 2017/18 is caused by the transition from GRACE to GRACE-FO.
Water 17 03093 g002
Figure 3. Time series from 2000 to 2025 of the mean deep groundwater anomaly for non-bedrock USGS monitoring wells within the GRACE bounding box relative to the 2004–2010 baseline. Values are retrieved once monthly from the 23rd of each month.
Water 17 03093 g003
Figure 4. Heatmaps of (a) the GRACE terrestrial water storage anomaly from the baseline (Jan 2004–Dec 2009) and (b) the deep groundwater anomaly from USGS monitoring wells with months on the x-axis and hydrological years on the y-axis. The storage anomaly is color-coded with elevated values in blue and lower levels in red; months with no data are colored white.
Water 17 03093 g004
Figure 5. (a) A plot with the deep groundwater anomaly (black), the terrestrial water storage anomaly (blue), and the Quabbin reservoir anomaly (green); the dashed line represents interpolated data. (b) Time series of surface water bodies excluding the Quabbin, shallow groundwater, and soil moisture anomalies calculated by subtracting the deep groundwater and Quabbin reservoir anomalies from the terrestrial water storage anomaly with zero lag. The data gap represents the transition from GRACE to GRACE-FO, and the dashed line represents interpolated months with no data.
Water 17 03093 g005
Figure 6. Cross plot with the deep groundwater anomaly from USGS monitoring wells converted into the liquid water equivalent on the x-axis and the GRACE terrestrial water storage anomaly on the y-axis (r2 = 0.665).
Water 17 03093 g006
Figure 7. A conceptual model of a typical Massachusetts stratigraphic section, illustrating deep storage (>3 m) reaching capacity, resulting in increasing storage in the shallow subsurface (<3 m). Blue-shaded sections indicate fully saturated zones.
Water 17 03093 g007
Disclaimer/Publisher’s Note: The statements, opinions and data contained in all publications are solely those of the individual author(s) and contributor(s) and not of MDPI and/or the editor(s). MDPI and/or the editor(s) disclaim responsibility for any injury to people or property resulting from any ideas, methods, instructions or products referred to in the content.