Abstract
Understanding long-term rainfall variability is essential for addressing Saudi Arabia’s growing challenges of water scarcity, climate resilience, and sustainable resource management in its arid to hyper-arid environment. This study analyzes the spatiotemporal variations and long-term rainfall trends across the 13 administrative regions of the Kingdom of Saudi Arabia (KSA) using four decades of observed data (1982–2021) from the National Center for Meteorology (NCM). The non-parametric Mann–Kendall (M–K) test and Sen’s slope estimator were applied to detect and quantify rainfall trends. Results reveal that 10 of the 13 regions show statistically significant negative trends, excluding the Eastern, Mecca, and Tabuk regions, with declines ranging from −4 to −16 mm/yr. The most pronounced decreases occurred in Hail, Al-Qassim, Riyadh, Medina, and Asir, while Mecca and Tabuk exhibited weak positive signals during the last decade, likely linked to Red Sea Trough dynamics. Seasonal analysis indicates the largest declines during winter and spring, crucial periods for groundwater recharge and agriculture, whereas summer rainfall remains localized in the southwestern highlands with a slight decreasing trend. Overall, rainfall variability in Saudi Arabia reflects both long-term drying and short-term oscillations. The findings provide a robust rainfall baseline to support water security, climate adaptation, and sustainable management strategies in one of the world’s driest regions.
1. Introduction
Climate change drives substantial fluctuations in rainfall patterns, global temperatures, and sea levels, alongside increased frequency and intensity of extreme weather events [1]. It represents a long-term alteration in the climate system, typically observed over decades or longer, and is largely attributed to anthropogenic activities [2,3]. As one of the most pressing global threats, climate change affects food security, biodiversity, water availability, and socioeconomic stability worldwide [4].
Variations in rainfall and temperature are key indicators of regional climate change [5]. Reliable climate data is therefore essential for understanding and addressing these challenges. According to Panja, Garai [3] climate data records consist of long, consistent, and continuous measurements that enable the analysis of climate variability and change. These records capture multiple atmospheric parameters, including temperature, precipitation, wind speed, humidity, and pressure, offering valuable insight into the dynamics of the Earth’s climate system. Spatiotemporal variations in these parameters influence ecological and environmental processes, underscoring the importance of continuous assessment of climatic conditions [5,6].
As outlined by El-Rawy et al. [7] Climate change exacerbates existing pressures on food production and water resources, particularly in arid and semi-arid regions. Effective management of agricultural water resources requires adaptive strategies that enhance climate resilience. A critical first step in this process is quantifying the rate and direction of change in key climatic variables such as rainfall and temperature. Identifying and measuring these trends provide the foundation for meaningful interpretation and practical adaptation planning [3].
A plethora of studies have investigated climate-related data trend analysis. Many have studied rainfall [8,9,10,11], temperature [12,13,14,15]. Others have focused on both rainfall and temperature [16,17,18,19,20]. Meskelu et al. [21] analyzed rainfall patterns in the Awash River Basin, Ethiopia. Their findings indicated a declining trend across all stations during the Bega season (December, January, February) as identified by the Mann-Kendall test (M-K). In contrast, the Tsedey season (September, October, November) and Kiremt season (June, July, August) exhibited an upward trend at most stations. However, no definitive trend was observed for the Belg season (March, April, May) or the annual rainfall at most of the stations.
Rahman et al. [22] analyzed the spatiotemporal variations in temperature and rainfall across South Korea from 1974 to 2023. Their results indicated a consistent warming trend throughout the country, implying an increased frequency and intensity of heat waves with potential impacts on agriculture, water resources, and public health. Rainfall trends, however, were more complex, exhibiting distinct regional and seasonal variations. Notably, summer and autumn precipitation increased in regions such as the Han River Basin and Jeju Island, likely due to intensified monsoonal activity associated with elevated sea surface temperatures. Conversely, winter and spring rainfall exhibited minimal changes, underscoring the influence of regional topography and oceanic dynamics on the spatial heterogeneity of climate trends in South Korea.
In Saudi Arabia, Furl et al. [23] examined annual and seasonal rainfall patterns in the southwestern region using data from 29 rain gauges spanning over six decades. Their analysis revealed slight but regionally consistent declines in rainfall, particularly during winter, when all four subregions exhibited negative trends. Two regions also showed significant long-term decreases in annual rainfall (α < 0.05) after autocorrelation adjustment.
Similarly, another investigation covering eight meteorological stations across the Najd and Hejaz regions applied the Mann–Kendall and Sen’s slope tests to assess precipitation and temperature trends [24]. The study found few significant precipitation changes, limited mainly to Tabuk, Riyadh, Qassim, Medina, and Hail during February, March, July, and November, while Mecca, Al-Baha, and Jizan exhibited no discernible rainfall trends. Across all sub-basins, precipitation between August and October remained stable. In contrast, temperature trends displayed more consistency, with notable warming during mid-summer and three out of four seasons showing significant increases. Overall, the findings highlighted the absence of uniformity in precipitation trends and the relatively moderate variation in annual temperature across the analyzed regions.
While previous studies have provided general insights into Saudi Arabia’s rainfall regime, the literature remains limited in characterizing the spatiotemporal variability of precipitation across its major watersheds. These watersheds, which often extend beyond administrative boundaries, are of high hydrological significance due to their roles in groundwater recharge, rainwater harvesting, and agricultural sustainability. This study seeks to bridge this gap by delivering a comprehensive, up-to-date assessment of rainfall variability and trends across the Kingdom—representing the core of the Arabian Peninsula and one of the most arid regions on Earth. Specifically, the objectives are to: (i) examine the spatial and temporal patterns of rainfall across Saudi Arabia, and (ii) quantify the magnitude and direction of long-term trends. The outcomes are expected to advance understanding of precipitation dynamics, identify climate-related risks, and provide critical data to support water resource management and resilience planning in arid and hyper-arid environments.
2. Methodology
2.1. Study Area Description
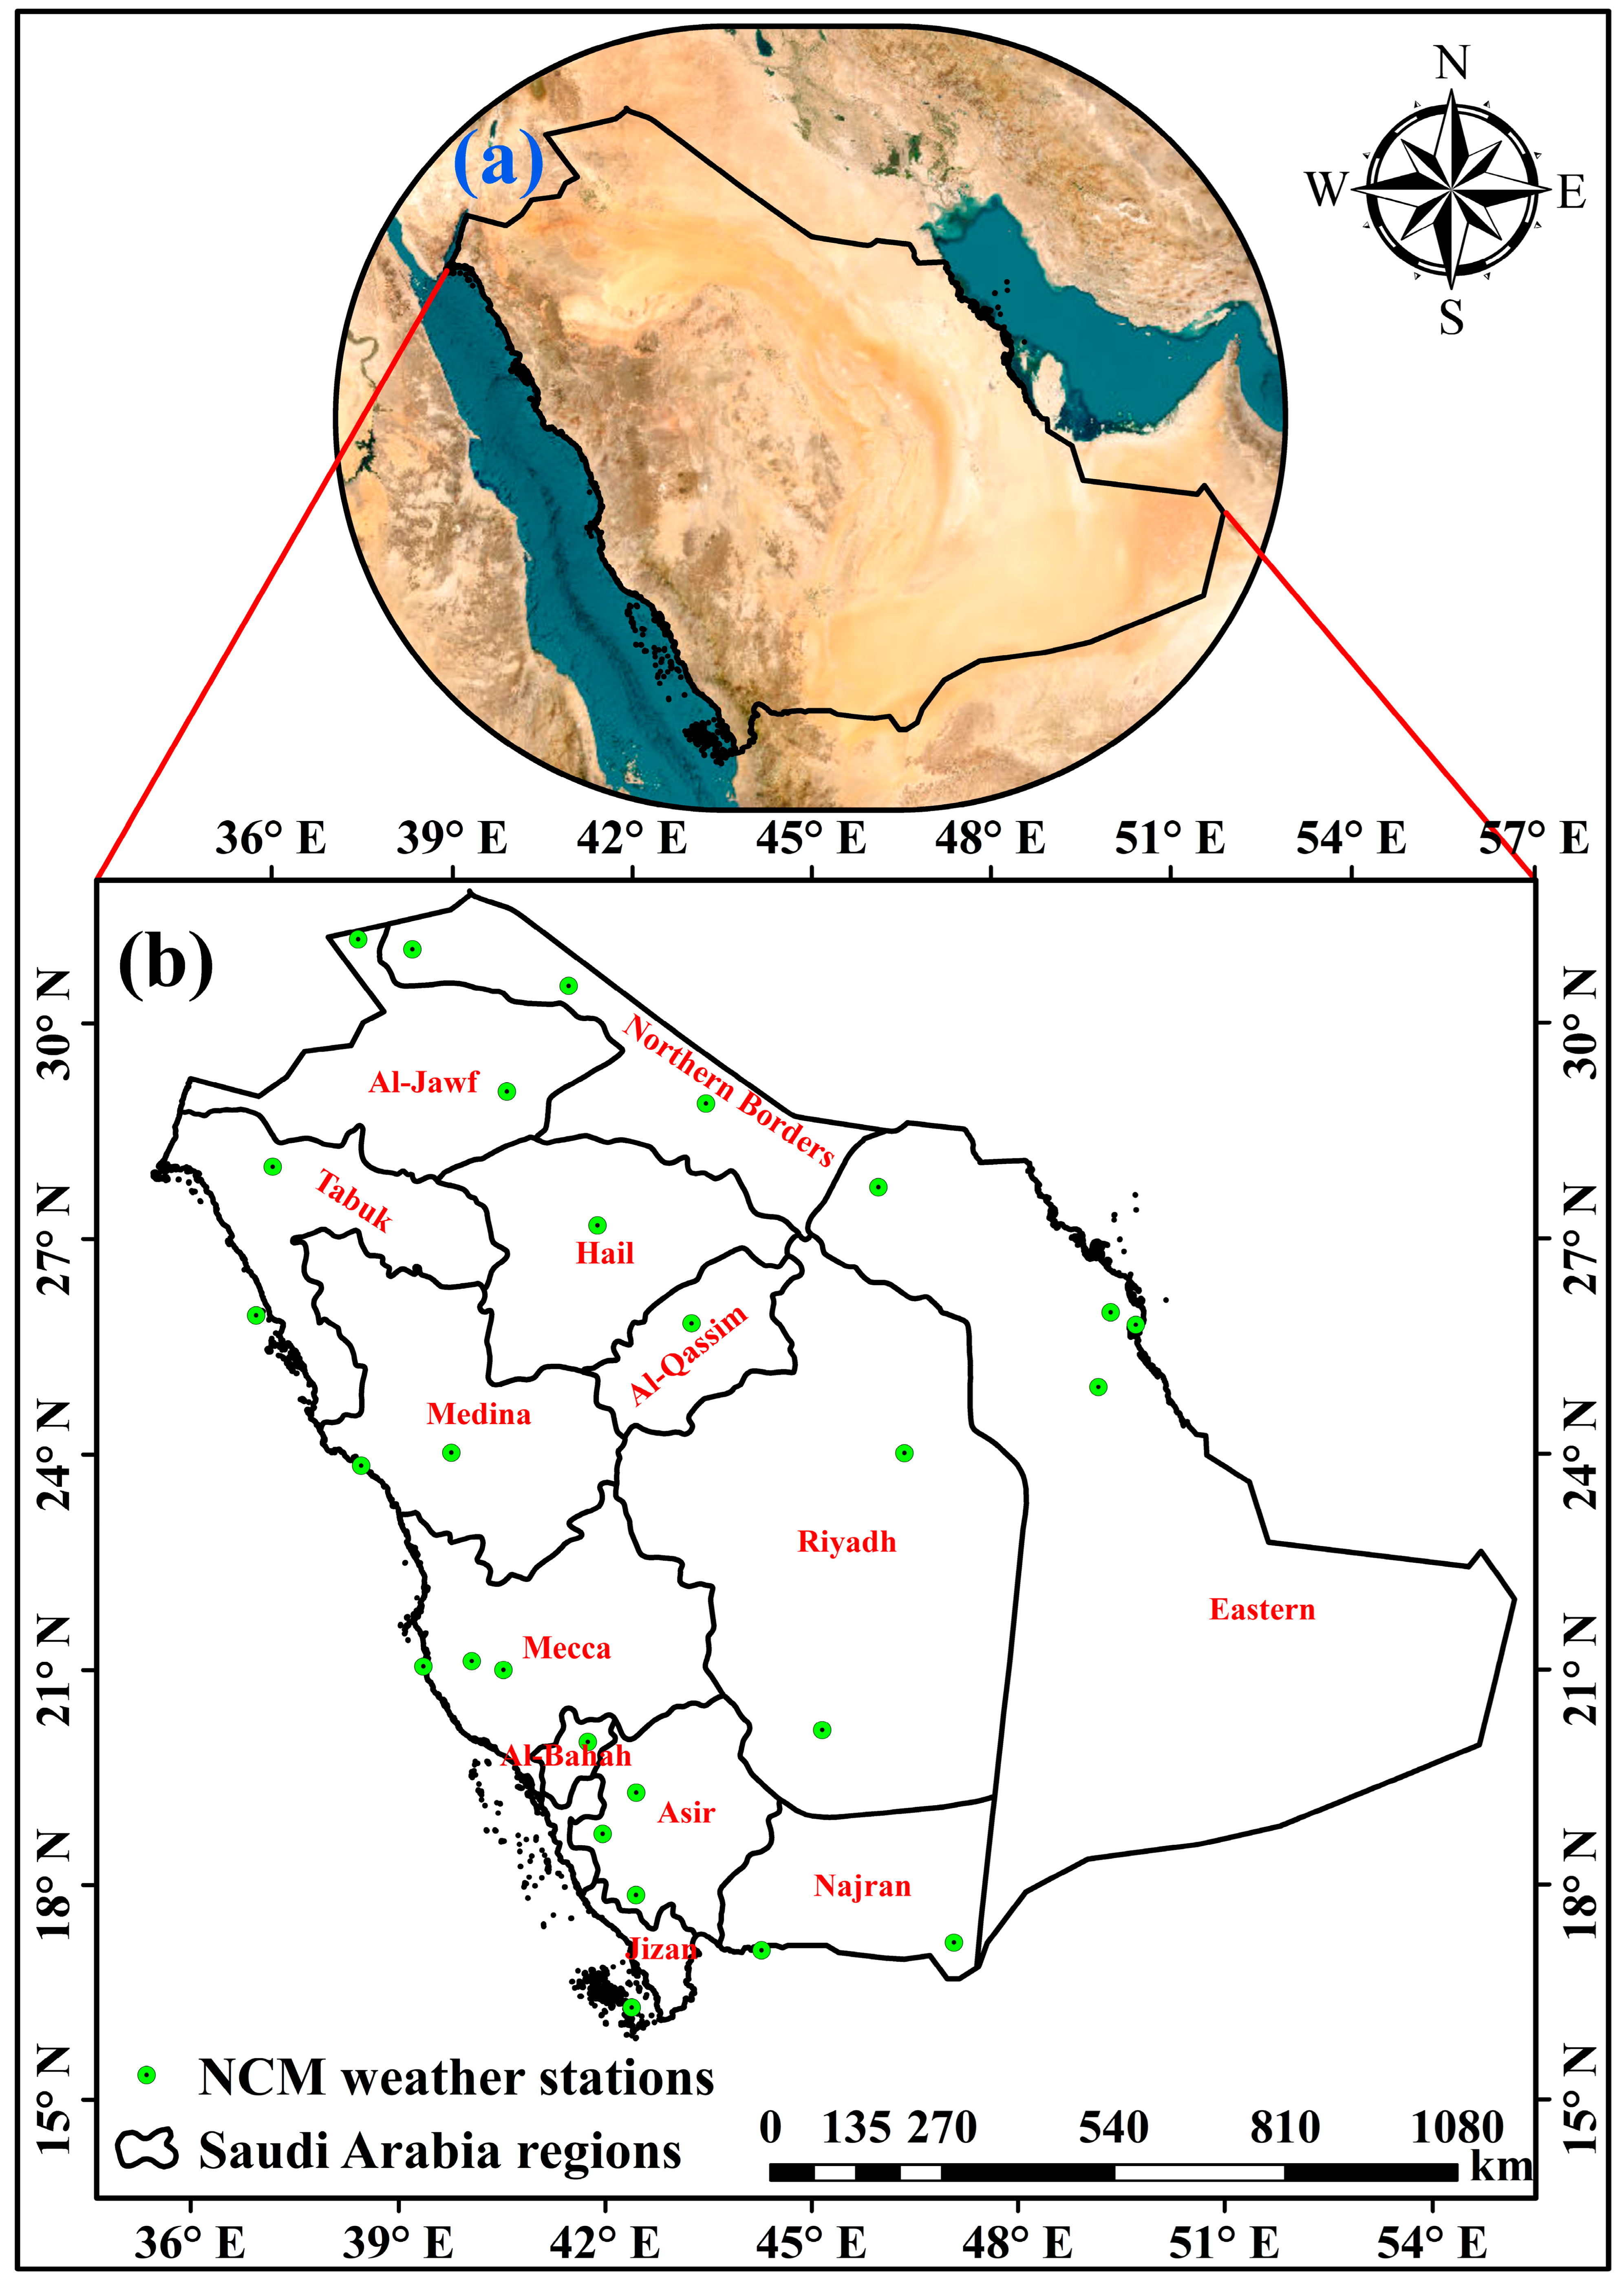
Comprising about 80% of the whole Arabian Peninsula, Saudi Arabia is the largest nation there at 2.25 million square kilometers [6], Figure 1. Geographically, it is bordered to the north by Jordan, Iraq, and Kuwait; to the west, the Red Sea; to the southeast, the United Arab Emirates and Oman; and to the east the Arabian Gulf [25]. From hilly terrain along the western escarpment and coastal plains along the Red Sea to huge deserts like the Rub’ al Khali (Empty Quarter), the geography of the nation encompasses great diversity [26]. Topographic and spatial elements greatly affect the geographic distribution of precipitation [27]. The Köppens-Geiger classification [28] mostly designates Saudi Arabia as desert and hyper-arid [29]. Mostly, the impact of two primary prevailing weather systems: the Indian Ocean monsoon system in summer and the Mediterranean frontal system in winter, the nation endures quite low and unpredictable precipitation [6]. Whereas the northern and western portions often get winter precipitation from westerly disturbances, the southern area obtains summer rainfall from the Southwest monsoon [30]. About place and time, Saudi Arabia’s rainfall is relatively unpredictable and restricted [31]. While the southern highlands, especially the Asir and Jizan areas, may get over 300 mm yearly [12], the average annual precipitation in most of the nation only surpasses 100 mm. Although the region experiences intense heat, with summer highs frequently reaching 45 °C, winter temperatures can drop to nearly freezing. Long-term trend analysis becomes quite important for hydro-climatic dynamics and water resource management as the complicated interplay of regional topography and atmospheric circulation patterns intensifies the variability. Rainfall patterns throughout the Arabian Peninsula have changed recently; several studies point to a trend of higher rainfall variability and intensity in some areas, most likely under the impact of climate change [32]. Saudi Arabia’s ground-based and satellite rainfall data show inconsistent trends, especially in the Southwest highlands; some areas show declining trends while others show increasing anomalies [33]. These anomalies draw attention to the need for careful temporal and spatial analysis of long-term data to spot statistically significant trends and assess their consequences. Given the huge demand for rainfall for urban expansion, agriculture, and groundwater recharge in this nation of water deficit, one must understand the long-term variations in precipitation. Moreover, when Saudi Arabia starts major national development initiatives like Vision 2030, thorough climatological data is very essential for enabling sustainable water resource management and strengthening climate resilience [34].
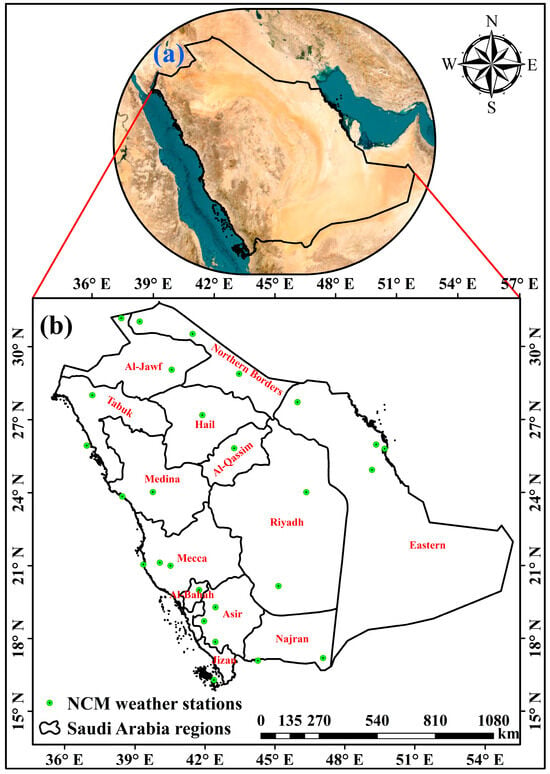
Figure 1.
Study area map; (a) Global map (adapted from Google Earth Pro (2025)), (b) Location map of Saudi Arabia.
2.2. Data Collection
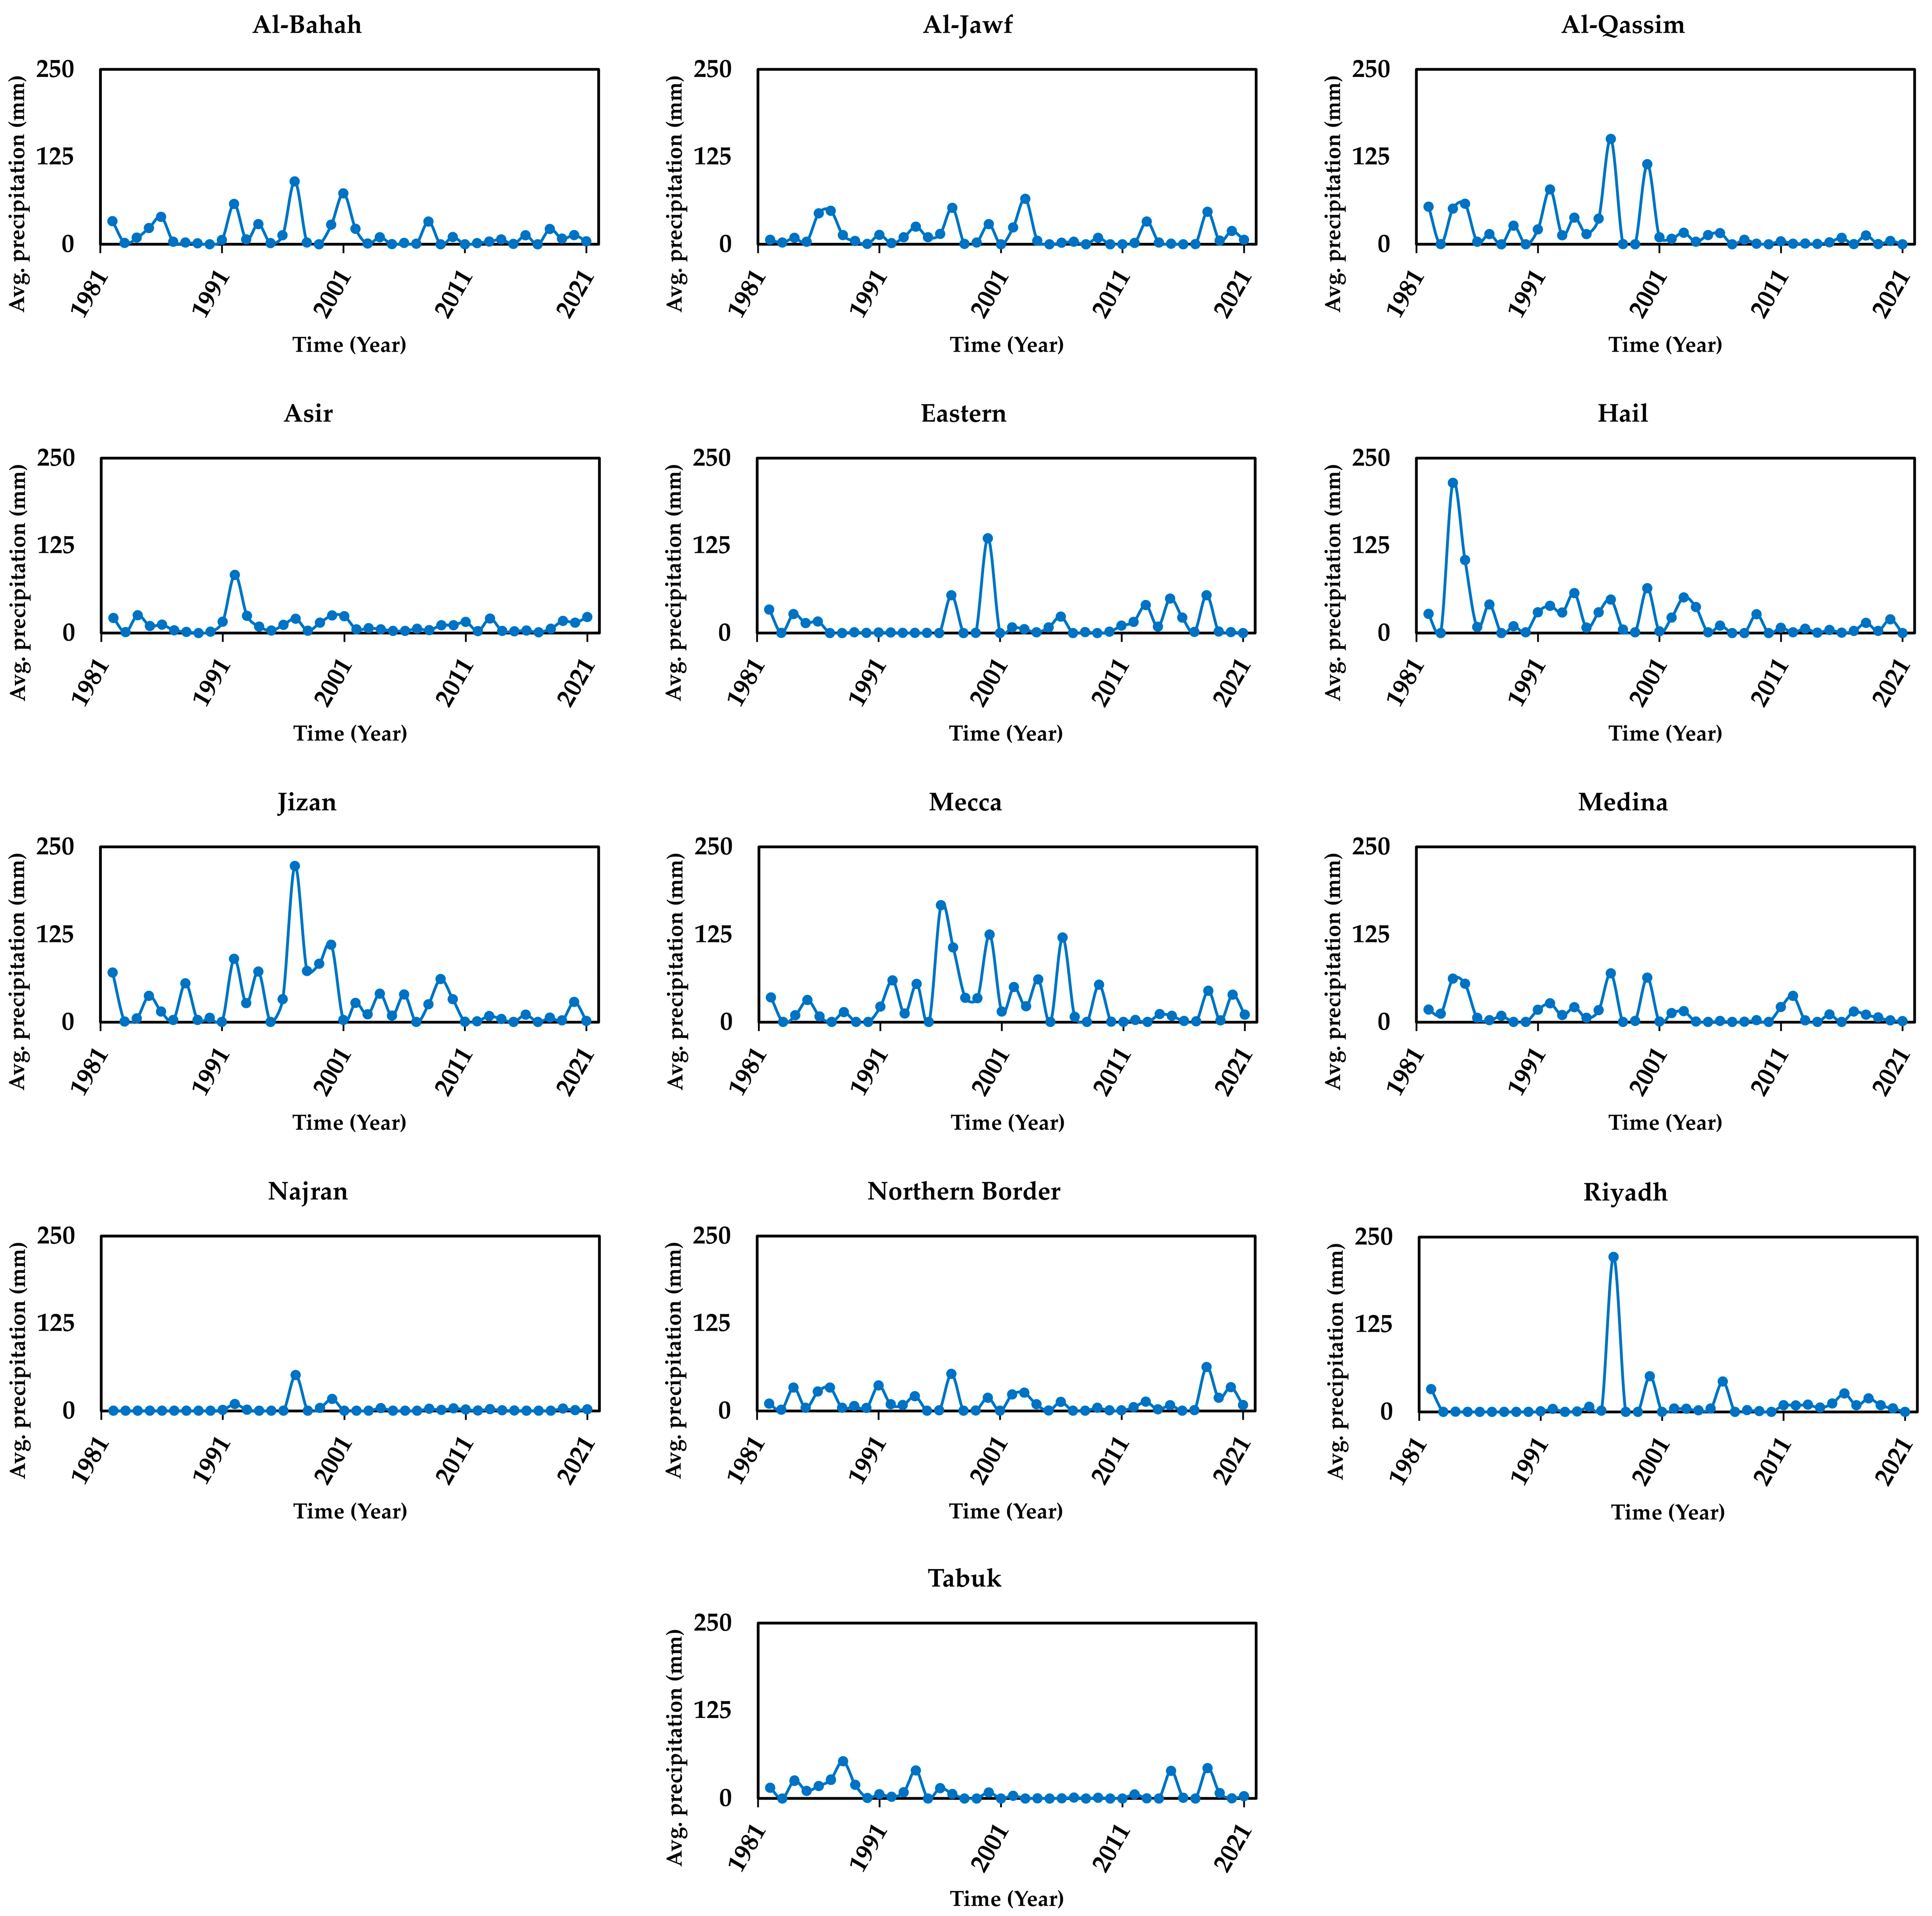
For a thorough trend analysis, an extended series of rainfall observations is essential. Moreover, in regions characterized by complex orography, a dense network of meteorological stations is required to accurately capture spatial variations in precipitation [35]. The foundation of the present investigation into rainfall trends across Saudi Arabia’s major watersheds is the observed rainfall dataset obtained from the National Center for Meteorology (NCM), Kingdom of Saudi Arabia—the official national authority responsible for weather observation and climate monitoring. The dataset includes 40 years of daily precipitation records (1982–2021) from 27 meteorological stations distributed across the 13 administrative regions of the Kingdom (Figure 1), providing a robust and reliable basis for long-term climate assessment. These data represent direct ground-based observations, rather than reanalysis or gridded interpolations, thereby offering a more accurate reflection of local climatic variability.
As illustrated in Figure 1, each region contains one or more NCM stations. To ensure uniform regional representation, the average of all stations within each region was computed to produce a single composite rainfall series, resulting in 13 representative regional stations. Annual rainfall totals from these aggregated series were then analyzed to detect long-term trends using the Mann–Kendall test and Sen’s slope estimator. Decadal and seasonal averages were subsequently derived to examine temporal variability. The four decadal periods were defined as D1 (1982–1991), D2 (1992–2001), D3 (2002–2011), and D4 (2012–2021). Seasonal averages were calculated as follows: winter (December–February), spring (March–May), summer (June–August), and fall (September–November). Accordingly, the dataset resolution corresponds to the station level, spatially aggregated at the regional scale, ensuring a representative and coherent depiction of rainfall variability across Saudi Arabia’s major watersheds over the four-decade period. This comprehensive dataset enabled the derivation of meaningful and applicable conclusions regarding the spatiotemporal variations and long-term rainfall trends across the major watersheds of Saudi Arabia [25]. Importantly, this research is grounded in real-world observational data rather than model-based reanalyzes, thereby enhancing the credibility and relevance of its findings.
Although the present study delineated the major watershed boundaries of Saudi Arabia to provide a hydrologically meaningful spatial reference, the statistical trend analyses were performed at the administrative-region level. This choice was made to ensure full national coverage, as the delineated watersheds collectively encompass approximately 70% of the kingdom’s total area. Furthermore, rainfall data provided by the Saudi NCM are organized according to administrative regions, allowing consistent aggregation and statistical treatment across all sites. Thus, the use of administrative regions facilitates comprehensive representation of rainfall variability across the entire country while maintaining a hydrological context through watershed mapping for spatial interpretation and visualization.
2.3. Rainfall Trend Detection
Trends in meteorological variables are commonly assessed using the non-parametric Mann–Kendall (M-K) test, which is less influenced by anomalies, applicable to all data distributions (i.e., it does not require normality), highly reliable, and particularly effective for identifying trends in time-series datasets. A positive M-K test statistic denotes an upward trend, whereas a negative value signifies a downward trend [36]. To achieve a thorough understanding of climate change trends, the M-K test combined with Sen’s slope estimator can be employed. These statistical tools are instrumental not only in identifying the existence, significance, and direction of trends but also in accurately quantifying the rate of change associated with them. Therefore, these methods prove to be exceptionally valuable in conducting an initial assessment and gaining insights into the baseline conditions of any region being studied from a socio-climatic perspective. The M-K test assumes that the time series comprises independent and randomly distributed observations, a condition confirmed via the Autocorrelation Function (ACF). Equation (1) represents the statistical expression for the M-K test (S). where zero hypothesis denotes the trend’s non-existence, is refused. The MK analysis will be implemented in this research at a significant level of 0.05, for α.
observations of the annual time series are denoted by i and j (with j > i), n signifies the analysis interval, and the sgn function of the variation between xj and xi will be calculated as below:
The following equation will be used if the dataset average is zero, to obtain the difference of S:
where m expresses the tied groups number—a set of sample data obtaining same value—and ti refers to the number of ties of extent i. For the sample size n > 10, the following formula will be used to compute the standard normal test statistic Zmk:
p-value of Zmk will be assessed utilizing the standard normal distribution function. Zmk follows the normal distribution with a variance of one and a mean of zero.
Given that the dataset exhibits autocorrelation, the scale of trends in meteorological variables was evaluated using the Theil–Sen estimator, which remains unaffected by anomalies and often proves substantially more precise than basic linear regression for skewed or heteroscedastic datasets [37]. The World Meteorological Organization endorses this method for trend analysis in hydrometeorological data [38]. The equation for Sen’s Slope involving multiple N data sample pairs is formulated as follows:
For a time-series with n observations of xj, there will be N = n(n − 1)/2 slope calculations. These N values of Qi are arranged in ascending order, and the median of Qi (Qmed) represents Sen’s Slope. A two-tailed analysis determines the value of Qmed within a 95% confidence range, computed as follows:
During the current work, the M-K test and Sens slope test were implemented using the “R 4.5.1 software”. In addition, ArcGIS 10.7 was used for mapping the general and decadal rainfall averages across the KSA regions.
2.4. Watershed Delineation Process
The United States Geological Survey portal provided digital elevation model (DEM) data that was used to delineate the watersheds in Saudi Arabia. The study used the most recent version of the 1-Arc SRTM DEM, which is accurate to within 30 m [39], to confirm that the watershed was delineated correctly. The ArcGIS platform’s hydrology tool was used to automatically delineate the watersheds. The process included several important steps, such as filling the DEM, figuring out the flow direction, collecting flow, setting conditional parameters, figuring out the stream order, and changing the stream order data from raster to vector format [40].
The traditional approach for extracting watershed networks requires manual identification of stream order, a process that is both arduous and time-consuming [41]. On the other hand, the study used a recent method that takes advantage of how well automated watershed delineation works when DEM processing is done in ArcGIS. There were many challenges with collecting data for watershed delineation in Saudi Arabia. One major problem was getting and managing a large number of DEM files. To solve this problem, the researchers gathered the DEM files and painstakingly put them together to make a single dataset that could be used to define the KSA’s watersheds. To confirm that the watershed delineation was accurate, this assignment had to be done very carefully, paying close attention to data integrity, resolution, and consistency. Despite these challenges, the utilized technique enabled a comprehensive and detailed examination of the principal watersheds in the KSA. A Google Earth Pro overlay was used to set the watershed’s limits to make sure that the results were consistent and correct. The study’s watershed delineation methodology was used in several recent studies [39,40,41].
3. Results and Discussion
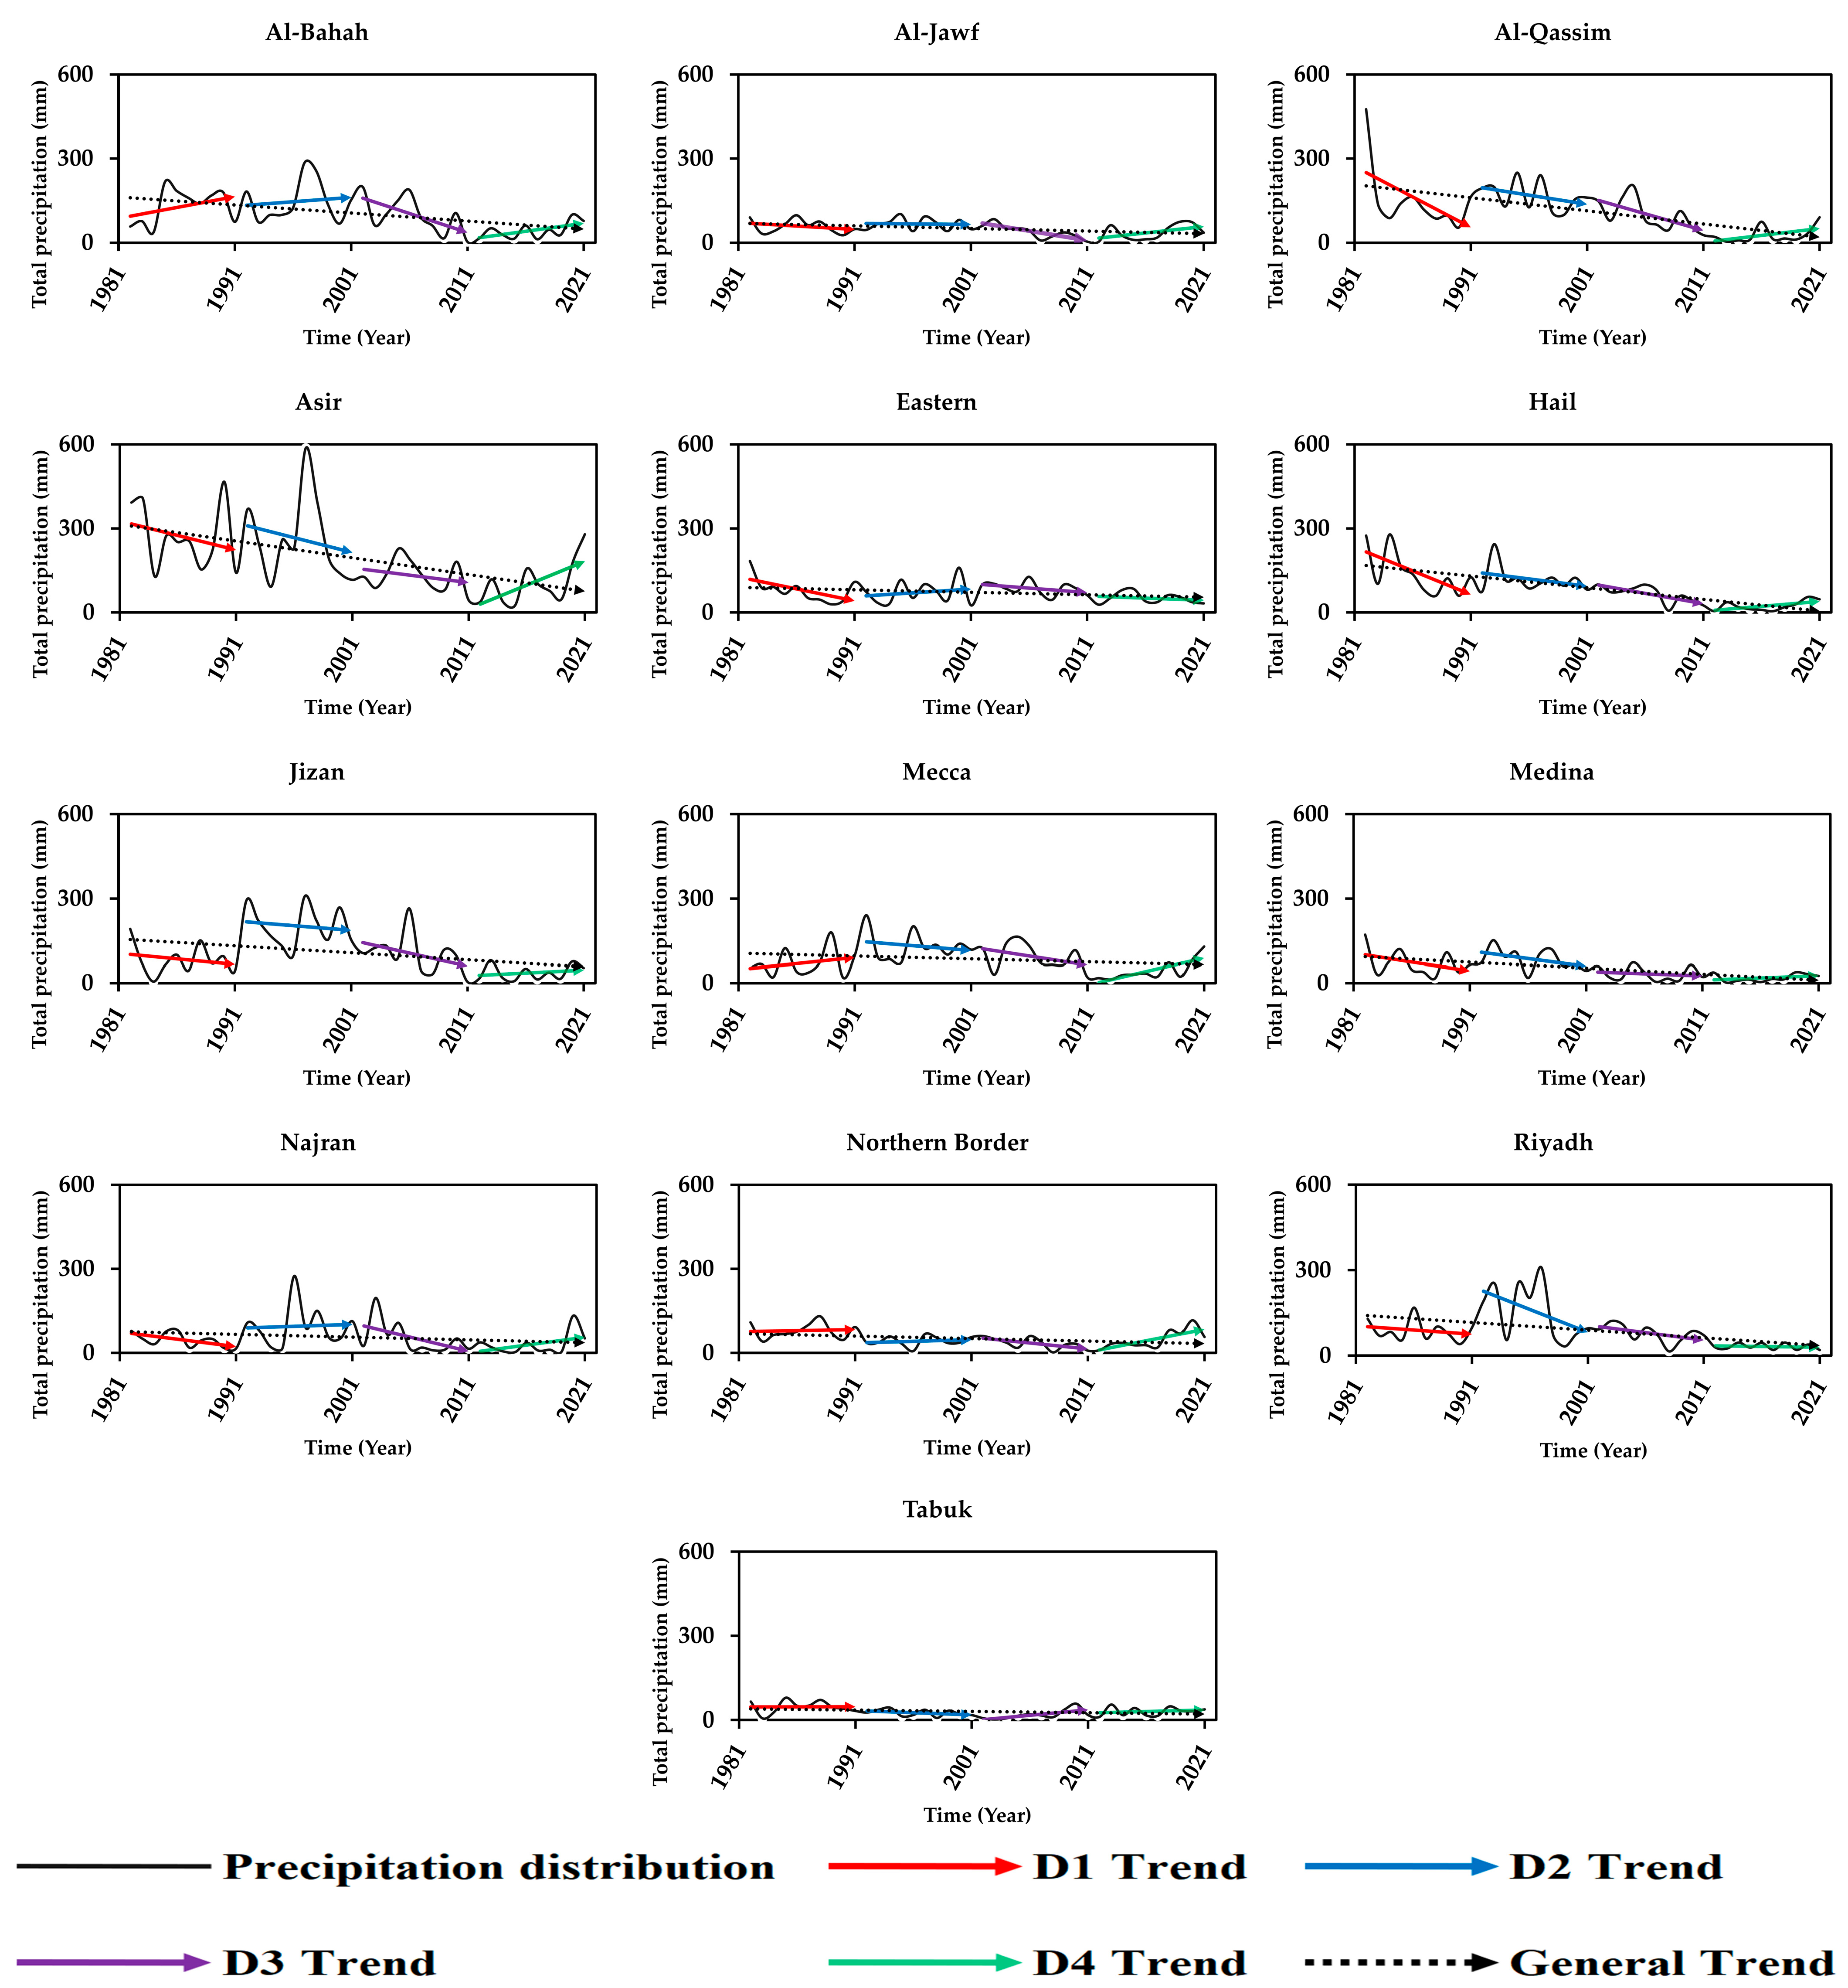
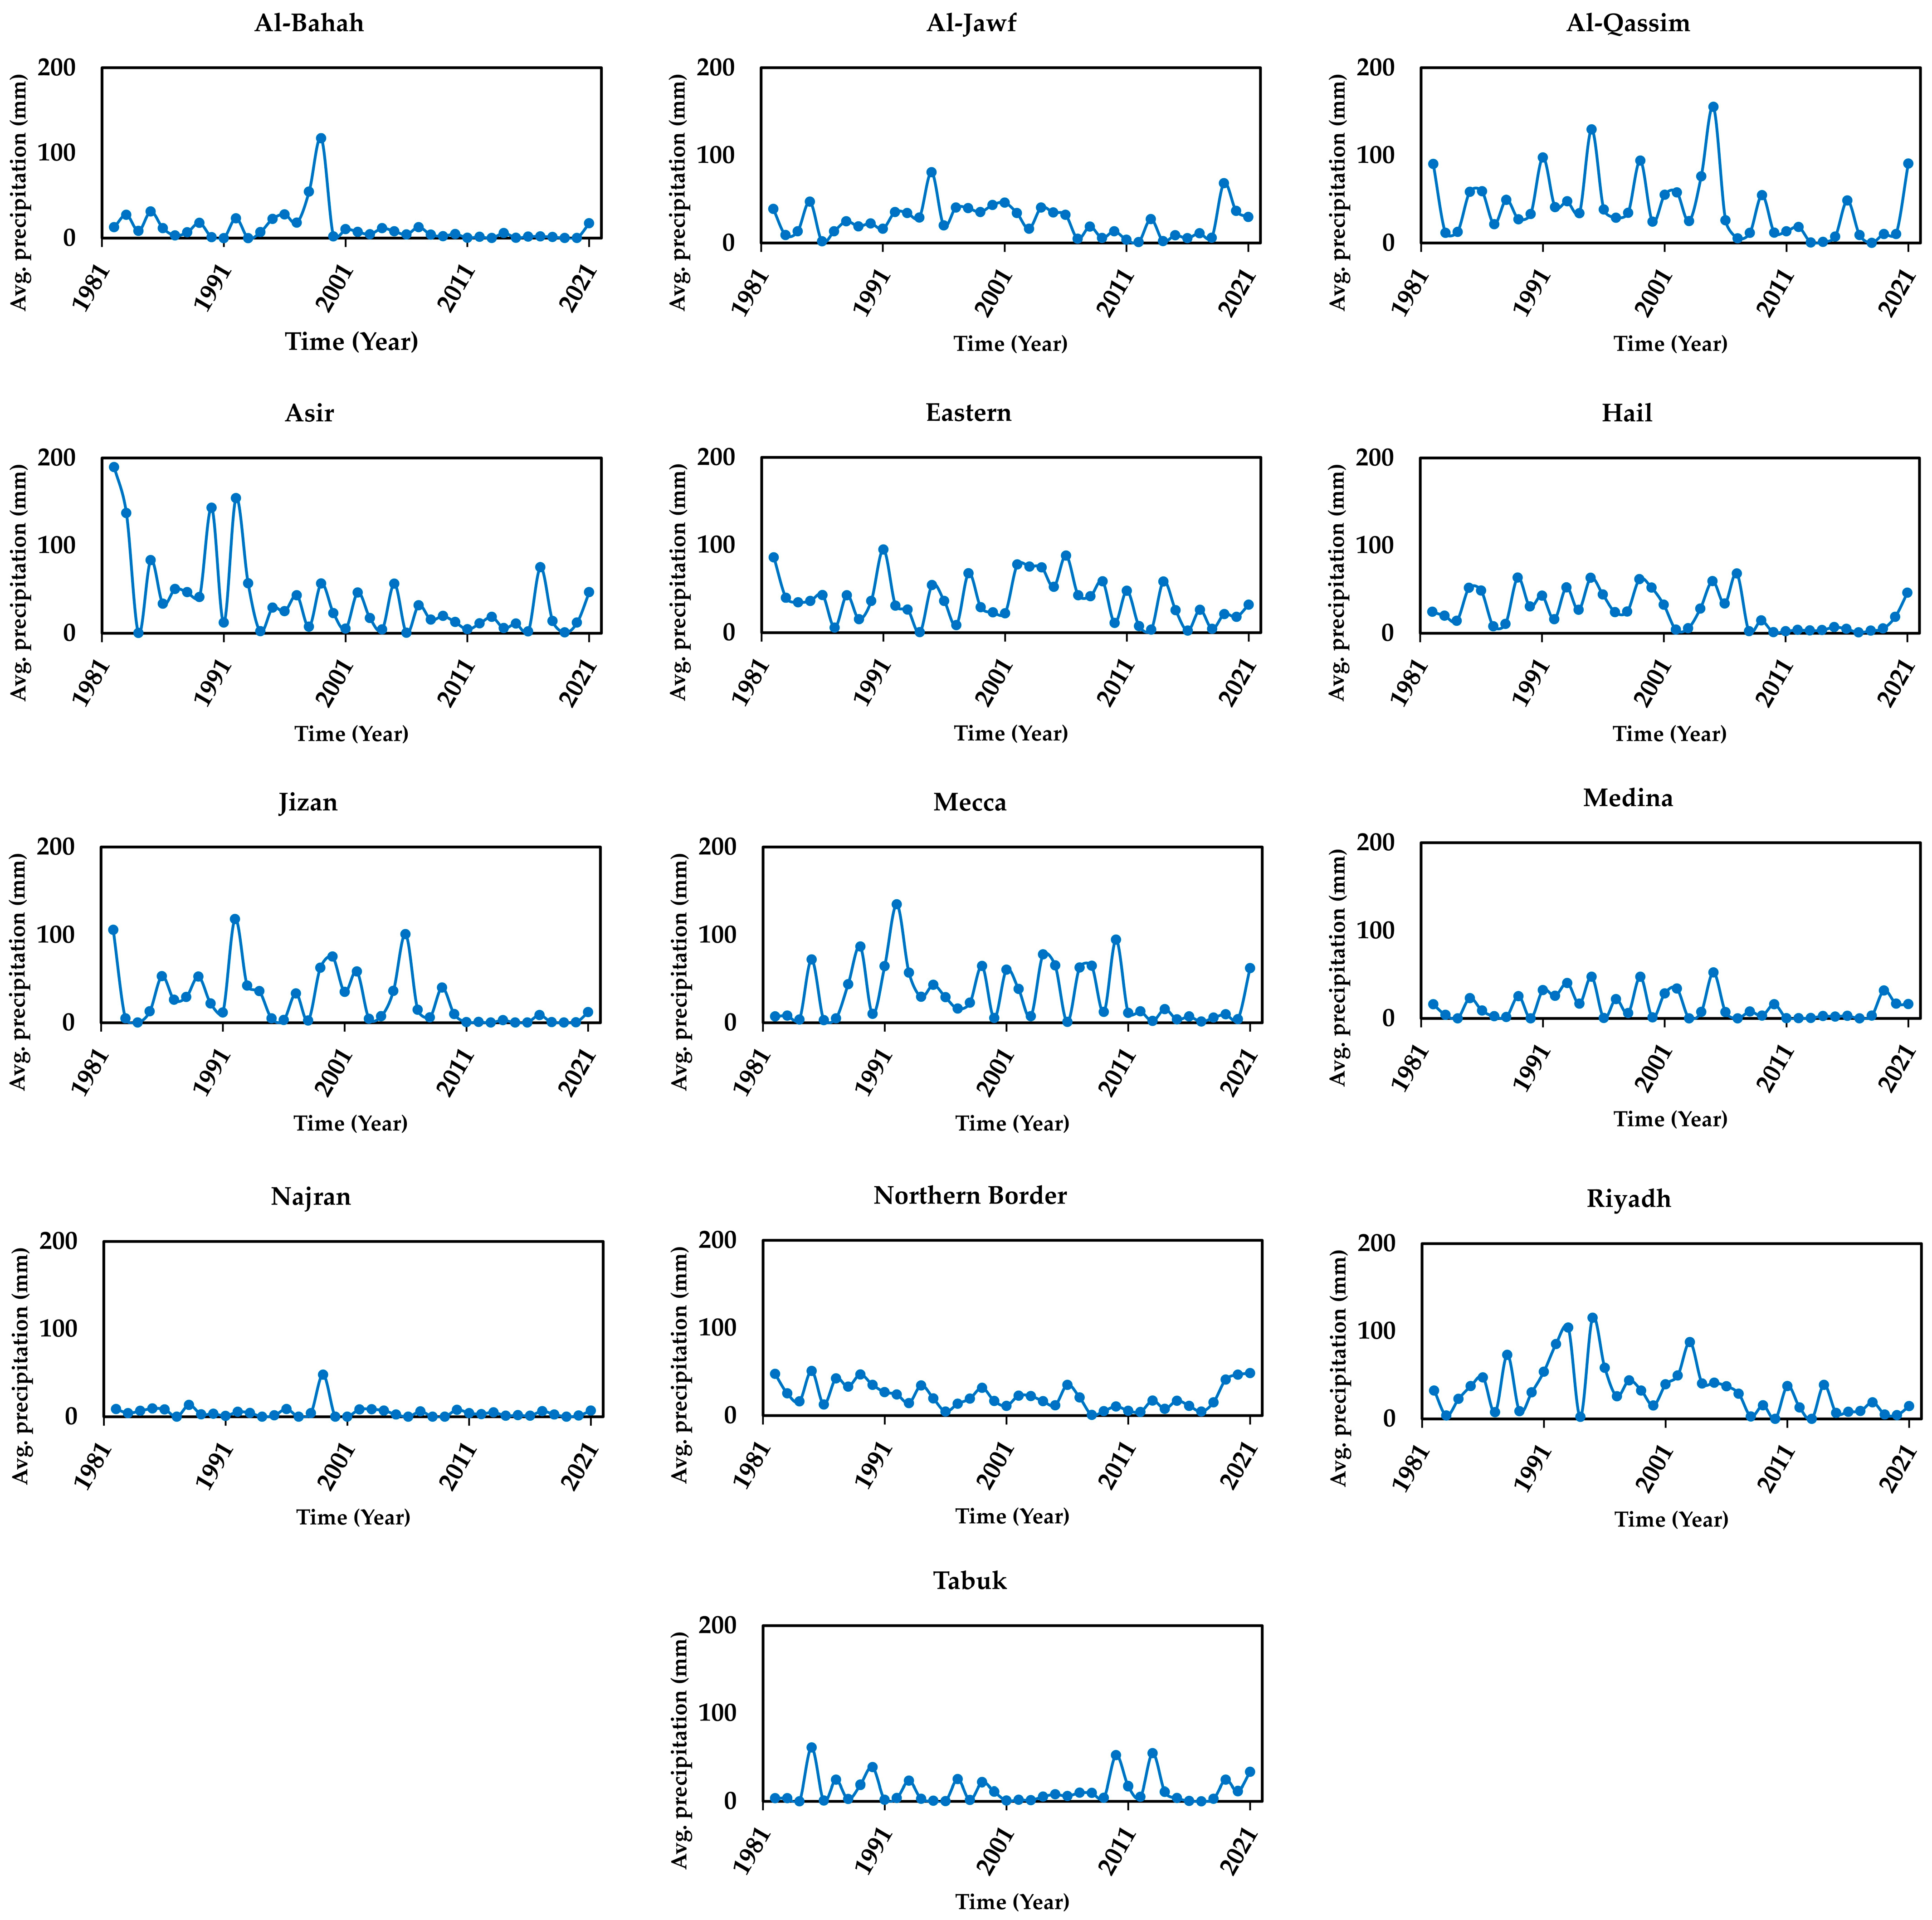
The analysis of rainfall time series from thirteen administrative regions across Saudi Arabia, using the non-parametric Mann–Kendall test (Table 1), provides strong evidence of both long-term declines and notable decadal variability (Figure 2). These findings highlight the dual nature of rainfall dynamics in the KSA: an overall trajectory of decreasing precipitation consistent with regional drying signals but punctuated by localized and temporally limited episodes of recovery. Such a pattern complicates both the detection and attribution of trends and has significant implications for water management in an arid to hyper-arid climates.

Table 1.
Mann-Kendall results for rainfall across KSA regions (1982–2021).
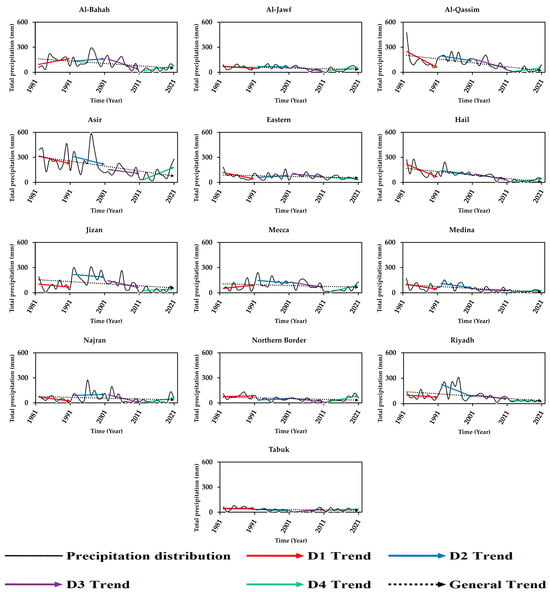
Figure 2.
General and decadal rainfall trends over the KSA regions. Where: General: (1982–2021), D1: (1982–1991), D2: (1992–2001), D3: (2002–2011), D4: (2012–2021).
3.1. General and Decadal Rainfall Trend Analysis
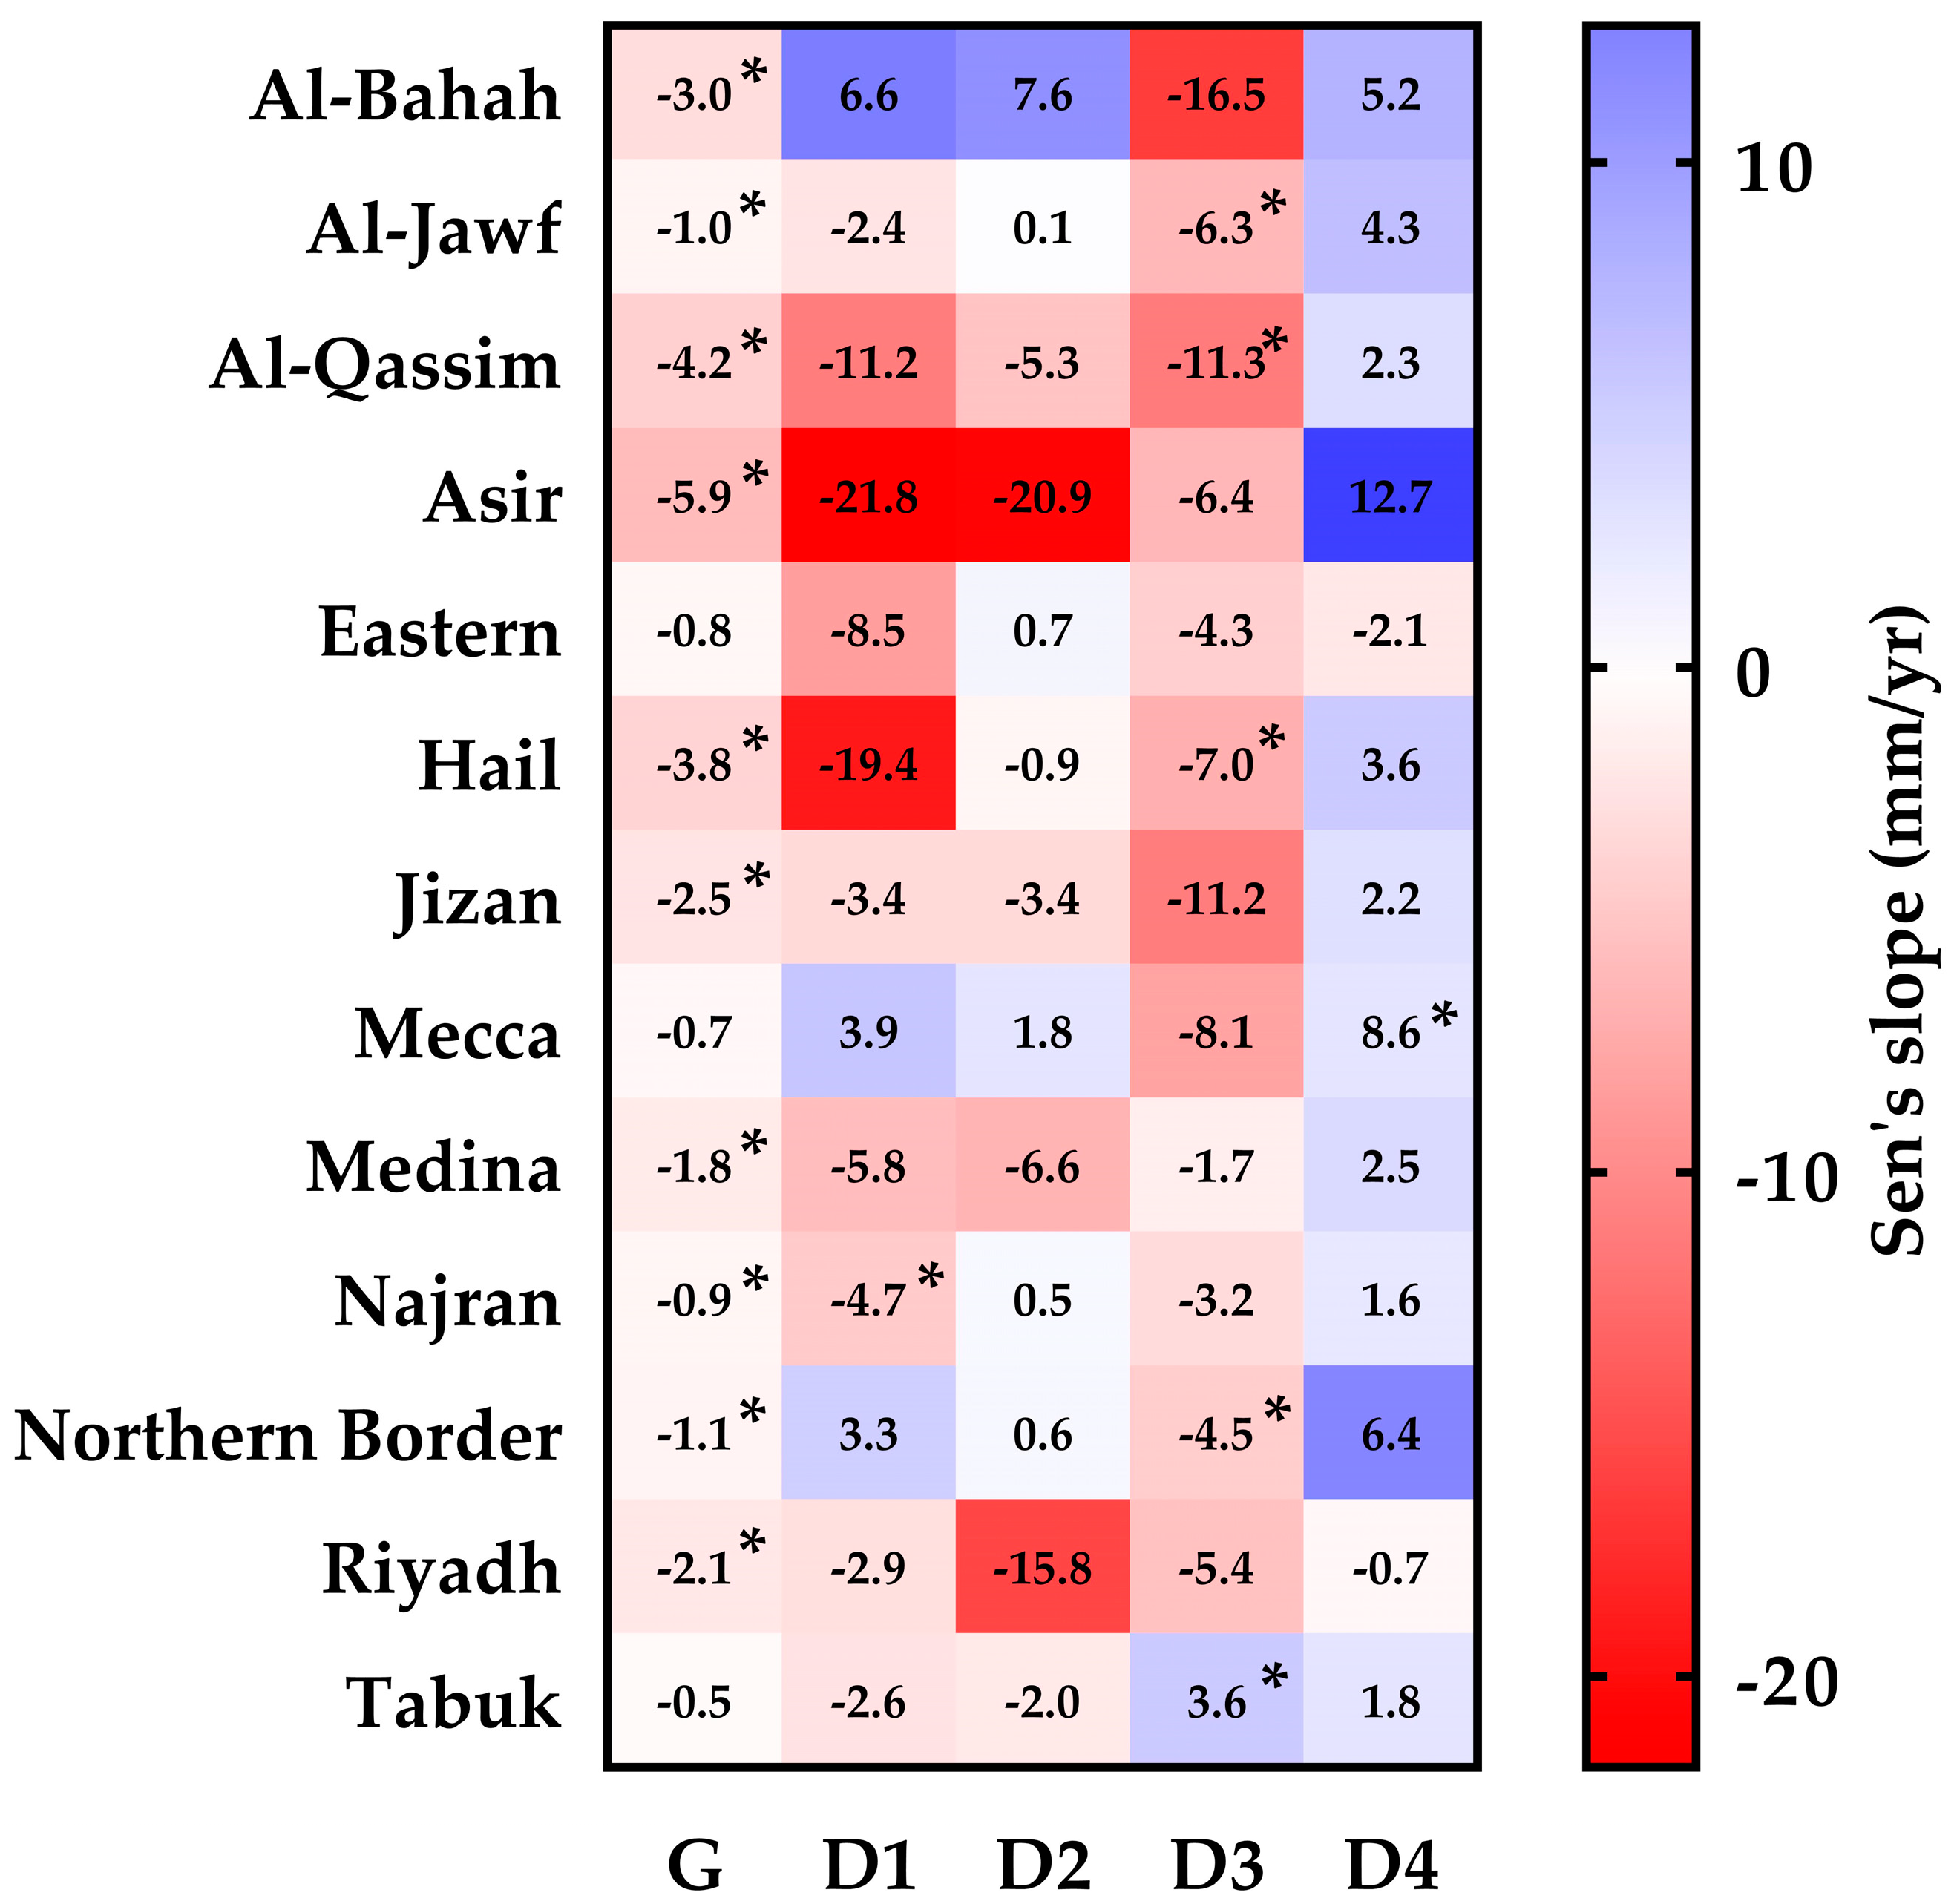
Starting with rainfall trends in Al-Bahah region, which demonstrated strong long-term decline across 1982–2021 (Z = −3.1, p < 0.01) with 3.0 mm/yr. This suggests a consistent drying trajectory in the southwest highlands, an area historically benefiting from orographic rainfall. Decadal analyses, however, reveal variability: the first two decades (D1, D2) indicate slight positive slopes (~+6–7 mm/yr), while D3 exhibits a pronounced negative slope (Z = −1.8, p < 0.07) with −16.5 mm/yr, which may have caused the downward direction of the general rainfall trendline. Although, the decline was followed by a weak rebound in D4 (+5.2 mm/yr). Asir region, another mountainous region, with a slope of −5.9 mm/yr, shows long-term drying (Z = −4.1, p < 0.01). However, all decadal slopes except D4 are negative, though not statistically significant. D4 shows a modest, non-significant positive slope (+12.7 mm/yr), suggesting a recent rebound. The steepest decadal declines (D1, D2) were substantial (~–20 mm/yr) but not statistically significant, likely due to variability. This confirms the high sensitivity of orographic rainfall in the southwest to broader circulation shifts [42]. Jizan region exhibited significant drying over the full record (Z = −2.5, p = 0.01; slope −2.5 mm/yr). All decades but D4 show negative slopes (up to −11.2 mm/yr in D3). The recent decade (D4) shows a weak rebound (+2.2 mm/yr), all decadal trends were non-significant. Given Jizan’s subtropical setting, linked to Red Sea convective systems, this pattern implies weakening of wet season input with only partial recovery in recent years.
Al-Qassim region exhibits one of the steepest long-term rainfall declines, with a rate of −4.2 mm/yr (Z = −4.2, p < 0.01) (Table 1; Figure 2). Decadal analysis shows negative slopes in D1 and D2, though not statistically significant (~–5 to −11 mm/yr). The decline becomes significant in D3 (Z = −2.0, p = 0.05; slope −11.3 mm/yr), followed by a weak rebound in D4 (+2.3 mm/yr). As a major agricultural region, the drying observed during D3 has important implications for crop water demand and irrigation planning. Hail region records one of the strongest signals of long-term drying (Z = −5.4, p < 0.01; slope −3.8 mm/yr). The most pronounced decline occurs during D3 (Z = −2.0, p = 0.05; slope −7.0 mm/yr), while earlier decades show large but non-significant reductions (up to −19.4 mm/yr in D1). A weak recovery appears in D4 (+3.6 mm/yr). This pattern reflects the susceptibility of north-central plateau rainfall to multi-decadal drought variability (Figure 2). In Medina, the long-term trend indicates a significant decline of −1.8 mm/yr (Z = −3.8, p < 0.01). Decadal trends are negative but not significant in D1–D3, with a modest rebound during D4 (+2.5 mm/yr). The persistence of drying across moderate elevations suggests climatic behavior like that of the central plateau.
Riyadh region also shows a marked long-term decline (Z = −3.7, p < 0.01; slope −2.1 mm/yr). All decades exhibit negative tendencies, although none reach statistical significance. The strongest decline occurs in D2 (−15.8 mm/yr), weakening in subsequent decades. This steady downward trajectory highlights the persistent drying of the central plateau without the short-term recovery observed in western or northern areas. In contrast, Eastern region shows no significant long-term trend (Z = −1.8, p = 0.08). Average slopes remain low (~–0.8 mm/yr). Decadal variations include moderate but non-significant declines in D1 (−8.5 mm/yr) and D3 (−4.3 mm/yr), offset by flat or slightly positive slopes in D2 (+0.7 mm/yr) and D4 (−2.1 mm/yr). The absence of a clear drying signal may reflect coastal moderation and distinct rainfall-generating systems compared to the interior plateau (Table 1). Mecca region does not exhibit a significant long-term decline (Z = −1.2, p = 0.24); however, D4 reveals a statistically significant increase (Z = 2.5, p = 0.01; slope +8.6 mm/yr). Earlier decades show flat or slightly negative slopes. This recent upward trend may be associated with enhanced Red Sea Trough activity and convective rainfall events, which could elevate flood risk [43].
Al-Jawf region has recorded significant drying overall (Z = −2.3, p = 0.02) as 1.0 mm/yr, with the most pronounced decline in D3 (Z = −2.7, p = 0.01; slope −6.3 mm/yr). While earlier decades (D1, D2) were stable, recent years (2012–2021) show a non-significant moderate positive slope (+4.3 mm/yr). The strong drying in D3 aligns with the multi-year droughts affecting northern Saudi Arabia, while the more recent slight recovery may reflect anomalous convective activity. Najran region also showed long-term significant decline (Z = −2.3, p = 0.02; slope −0.9 mm/yr). Interestingly, D1 alone shows a significant negative slope (Z = −2.0, p = 0.05; slope −4.7 mm/yr), while later decades are flat or positive. This suggests an early period of strong drying, followed by stabilization, unlike most other regions. Northern Border region has shown long-term significant decline (Z = −2.7, p = 0.01) with 1.1 mm/yr. Although 3 of 4 decades have shown positive but not significant trend. The critical period is D3 (Z = −2.0, p = 0.05; slope −4.5 mm/yr) that may have shaped the downward trend in the region. This indicates mid-period drought dominance, consistent with northern Saudi Arabia’s heightened sensitivity to circulation shifts. Tabuk region differs from many regions: long-term decline is not significant (Z = −1.6, p = 0.11). Most decades are negative or flat, except D3, which shows a significant positive slope (Z = 2.3, p = 0.02; +3.6 mm/yr). This highlights Tabuk region as an exception, possibly benefiting from localized convective enhancements or Red Sea Trough influences [44].
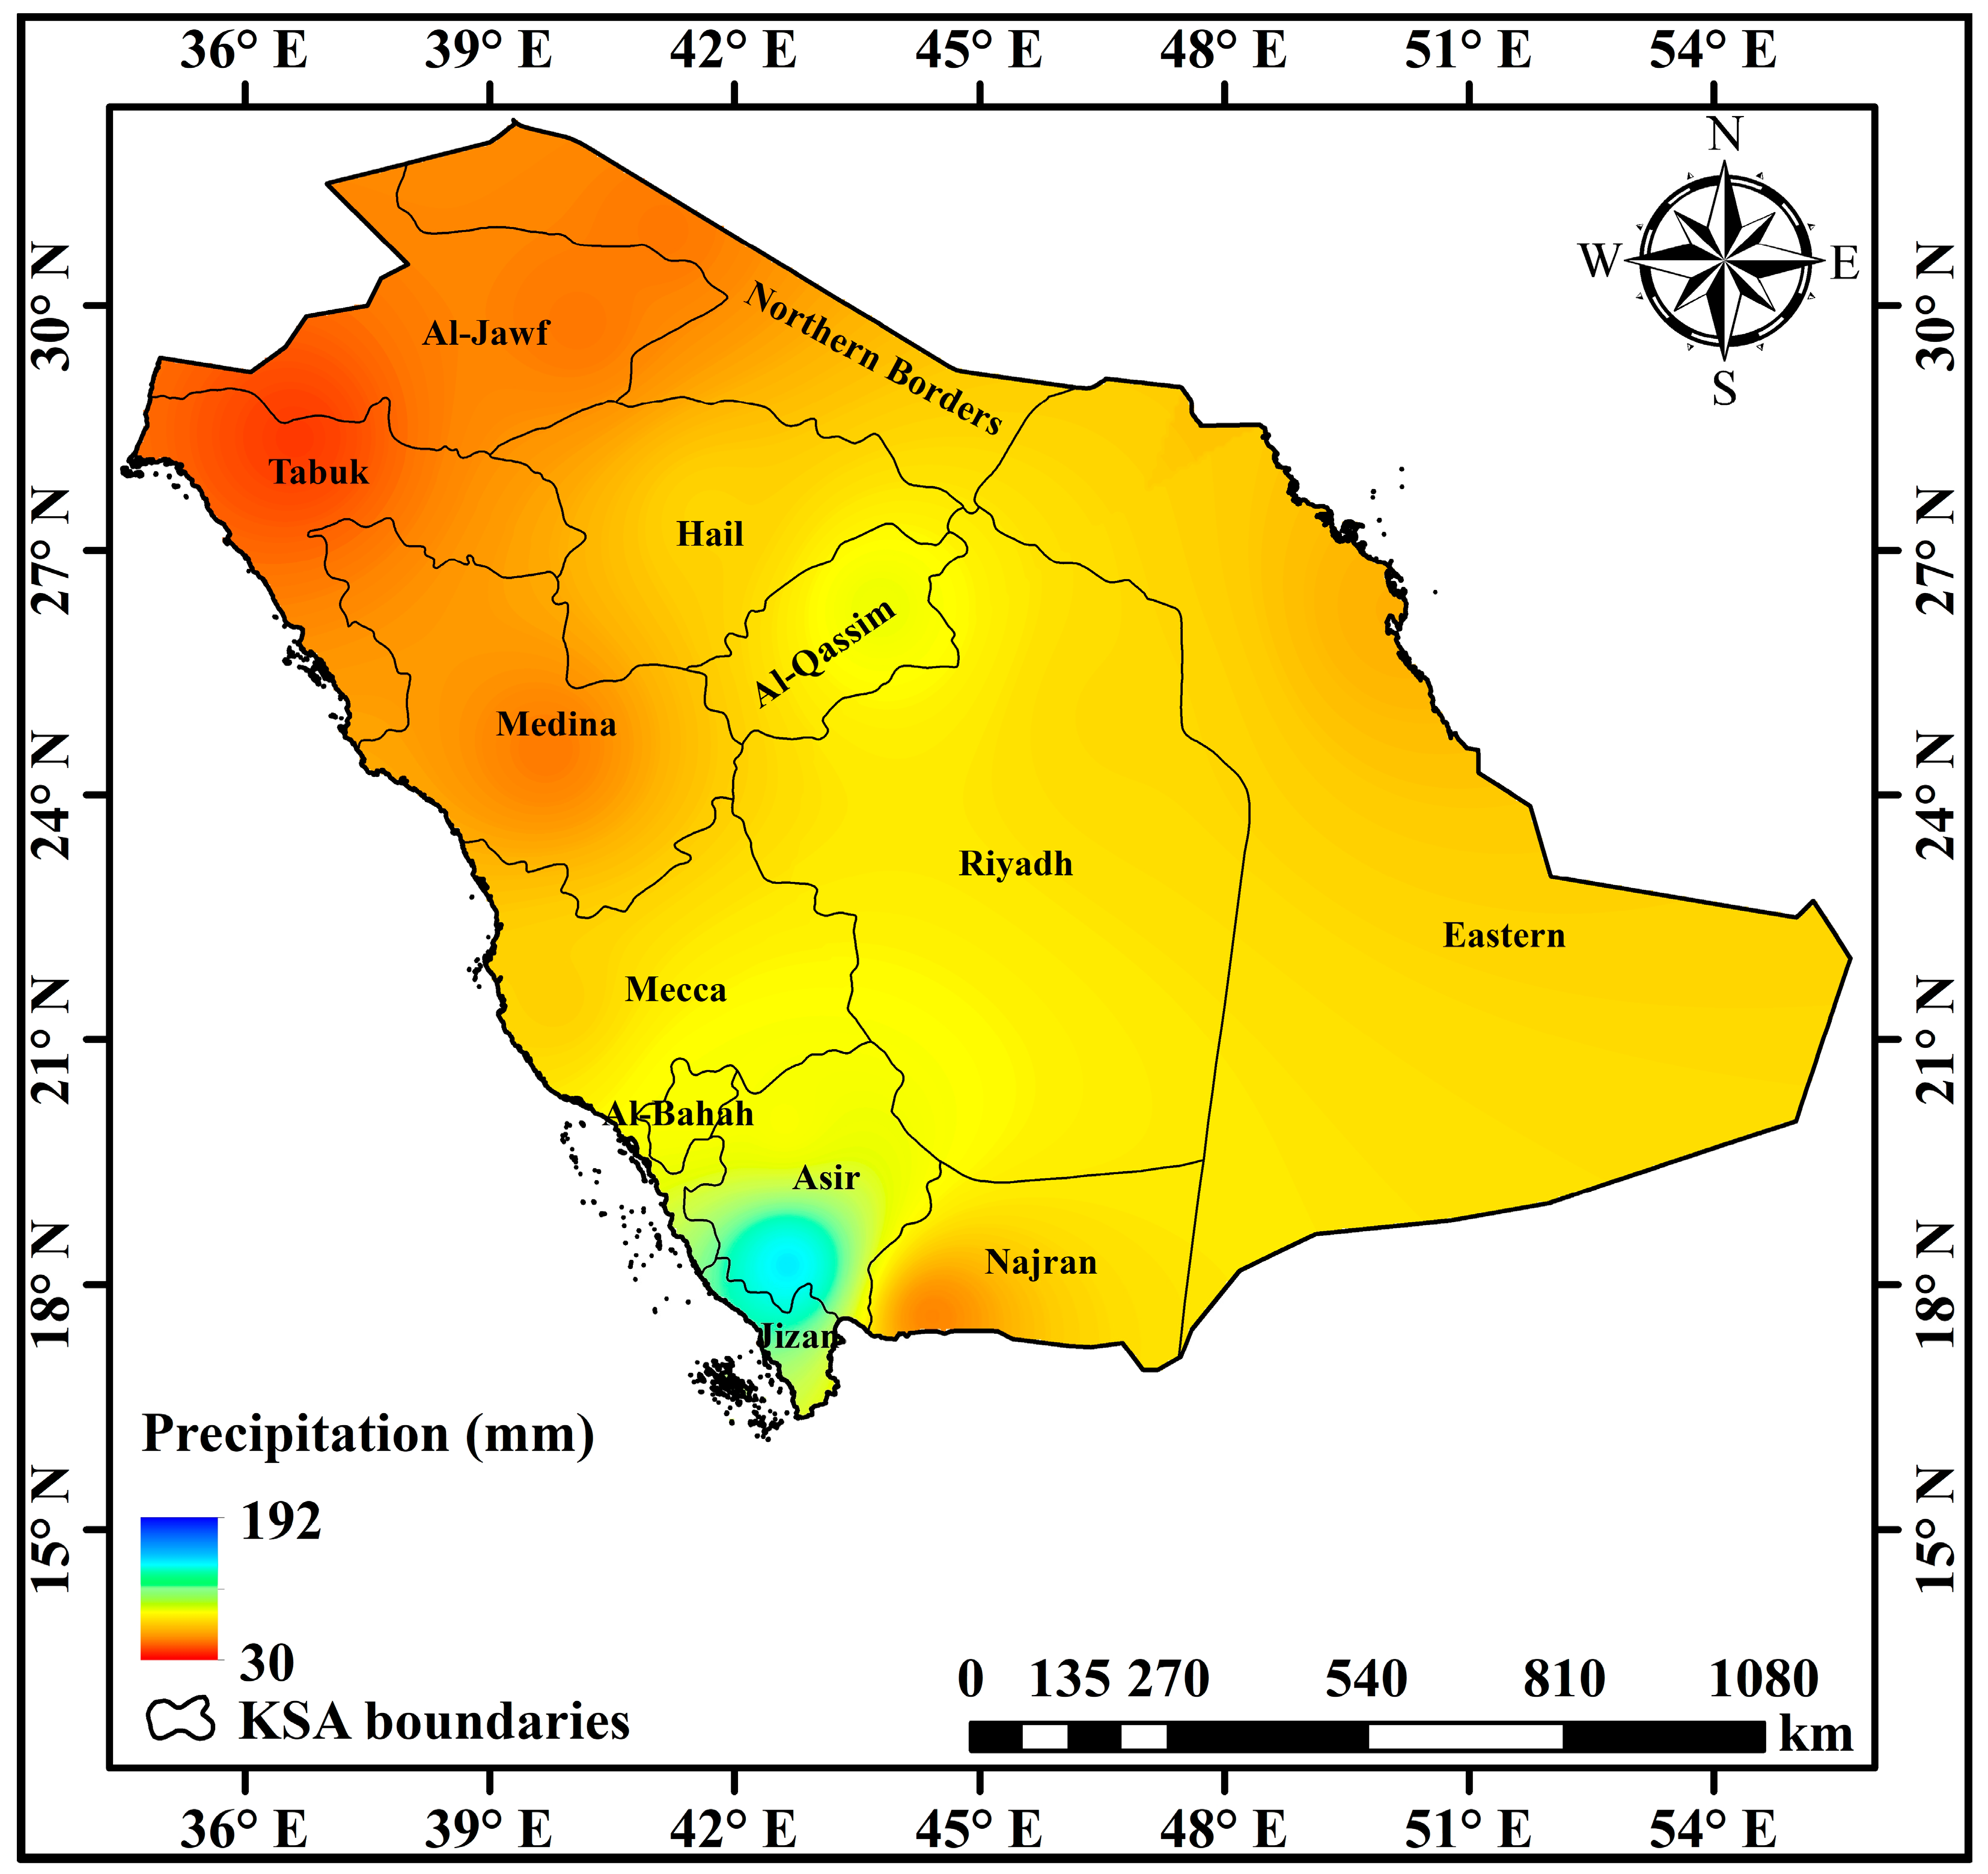
Spatiotemporally, over the 40-year period (Figure 3), ten out of thirteen regions exhibited statistically significant negative trends, excluding the Eastern, Mecca, and Tabuk regions, confirming that declining rainfall is widespread. The magnitude of reduction was particularly severe in the northern and central regions: Hail region recorded the steepest decline, followed by Al-Qassim, Medina, and Riyadh regions. In the southwestern highlands, both Asir and Al-Bahah regions also showed marked downward trajectories. These findings suggest that the long-term decline is not restricted to arid interior basins but also affects regions traditionally reliant on orographic rainfall and summer monsoon incursions. In contrast, regions such as the Eastern Province, Mecca, and Tabuk showed non-significant long-term trends, indicating greater rainfall variability but no statistically robust decline. This mixed outcome underlines that while the national-scale picture points toward drying, localized resilience or variability remains a feature of Saudi rainfall systems.
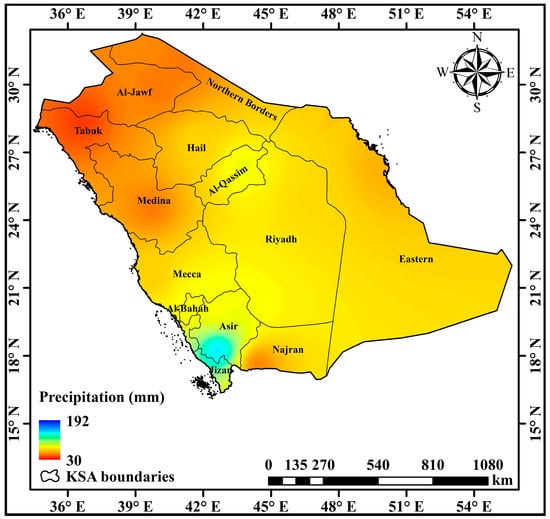
Figure 3.
Spatiotemporal variations of rainfall patterns over the KSA (1982–2021).
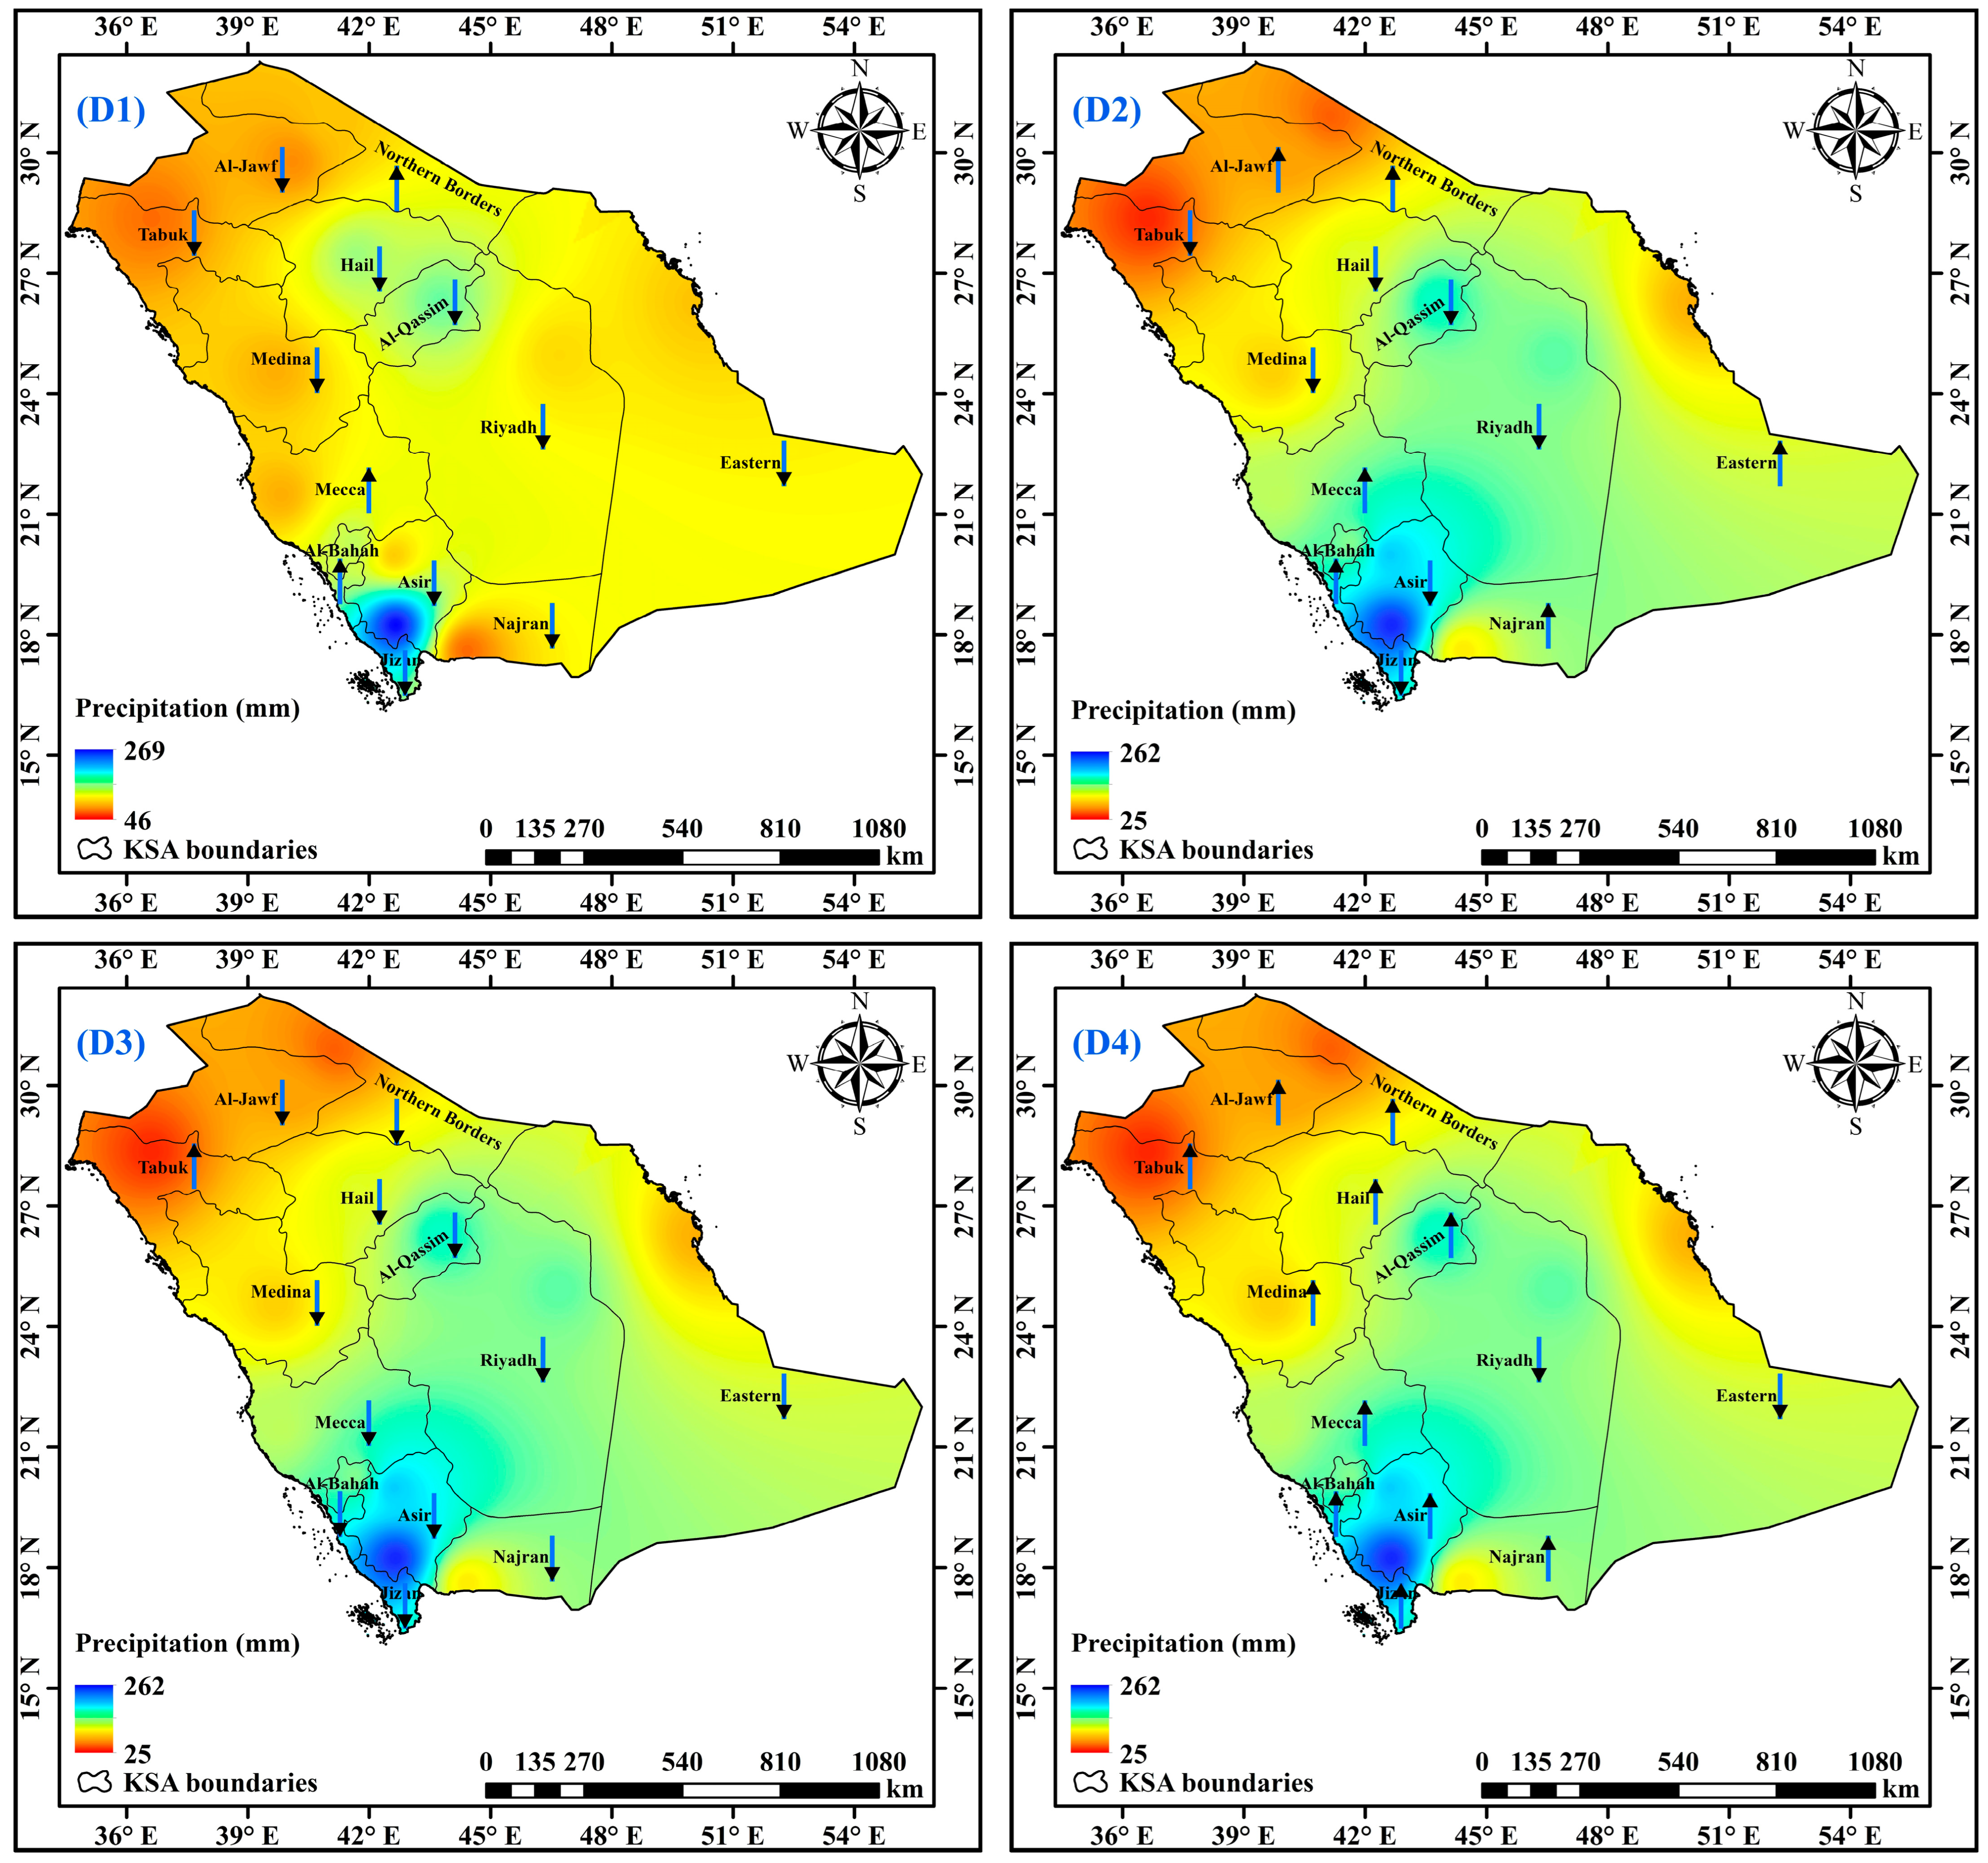
A closer look at decadal investigation (Figure 4), reveals a complex pattern of variability, with alternating phases of weakly positive and strongly negative trends. During the first two decades (1982–1991 and 1992–2001), most stations recorded non-significant changes, with isolated positive slopes in Al-Bahah and Mecca. These results suggest relative stability or even mild enhancement of rainfall during the late 20th century. The early 2000s (2002–2011; D3) marked a critical transition, with widespread and, in some cases, statistically significant declines. Regions such as Al-Jawf, Al-Qassim, Hail, and the Northern Borders all experienced sharp decreases. These declines coincide with severe drought conditions that were reported across much of the Middle East during the early 21st century, highlighting the sensitivity of Saudi rainfall to multi-annual and decadal drought cycles.
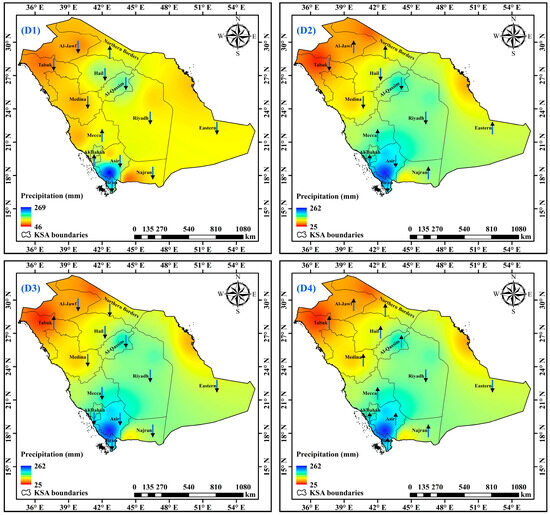
Figure 4.
Decadal spatiotemporal variations of rainfall patterns over the KSA. Where: D1: (1982–1991), D2: (1992–2001), D3: (2002–2011), D4: (2012–2021), arrows refer to trend direction “upward or downward”.
Interestingly, the most recent decade (2012–2021; D4) diverged from this pattern, with positive and, in some cases, significant upward trends. Mecca recorded a statistically significant increase, while Tabuk also exhibited a positive and significant slope. Other stations such as Al-Jawf, Al-Bahah, and Asir showed non-significant but positive slopes, indicating at least a partial recovery. These results raise the possibility that localized convective events and Red Sea Trough dynamics [44], may have contributed to enhanced rainfall in western and northwestern regions, even as broader drying persisted elsewhere.
The heat map of Sen’s slopes (Figure 5) emphasizes sharp regional contrasts. The southwestern highlands (Asir, Al-Bahah, Jizan), which historically contribute the bulk of rainfall through orographic enhancement, all display long-term declines. Such results suggest that weakening monsoon incursions and possible changes in Indian Ocean circulation [45] have reduced the rainfall efficiency of these mountainous zones. In the central plateau (Riyadh, Qassim, Hail, Medina), persistent declines confirm the vulnerability of interior basins, which already experience some of the lowest rainfall totals in the Kingdom. Given the reliance of these regions on intermittent rainfall for groundwater recharge, declining trends pose a direct threat to water security.
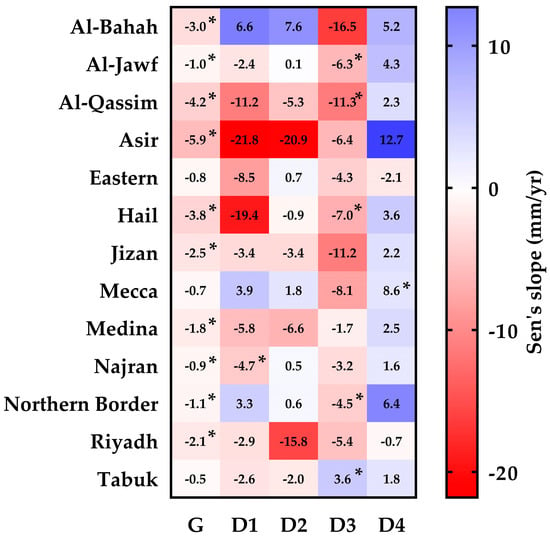
Figure 5.
Sen’s slope results in rainfall across the KSA. Where: G: (1982–2021), D1: (1982–1991), D2: (1992–2001), D3: (2002–2011), D4: (2012–2021), where values with *: significant at (p < 0.05).
By contrast, the coastal and northern regions (Mecca, Tabuk, Eastern Province, Northern Borders) show more mixed signals. The recent increases in Mecca and Tabuk regions may reflect the influence of the Red Sea Trough and Mediterranean storm tracks, which occasionally intensify convective rainfall in these areas [42]. These spatially heterogeneous responses highlight that the Kingdom’s rainfall regime may be governed by a single driver but by the interaction of multiple circulation systems. The observed patterns are consistent with broader regional and global climate signals. The pronounced declines observed during D3 coincide with the strong ENSO episodes of the early 2000s, as well as warming in the Red Sea and Mediterranean basins, both of which can suppress rainfall in the Arabian Peninsula [42]. Negative rainfall trends in Asir and Al-Bahah suggest a possible weakening of the Indian Ocean monsoon system’s northward penetration, potentially linked to Indian Ocean Dipole variability and anthropogenic warming. Conversely, the rainfall recovery in Mecca and Tabuk during D4 may be associated with enhanced Red Sea Trough activity, which can generate localized convective rainfall through the convergence of moist air masses from the Red Sea and dry continental air from inland. These results support the hypothesis that Saudi rainfall is increasingly characterized by episodic and localized convective events, rather than broad-scale seasonal systems, a shift with important hydrological implications [44].
3.2. Seasonal Rainfall Trend Analysis
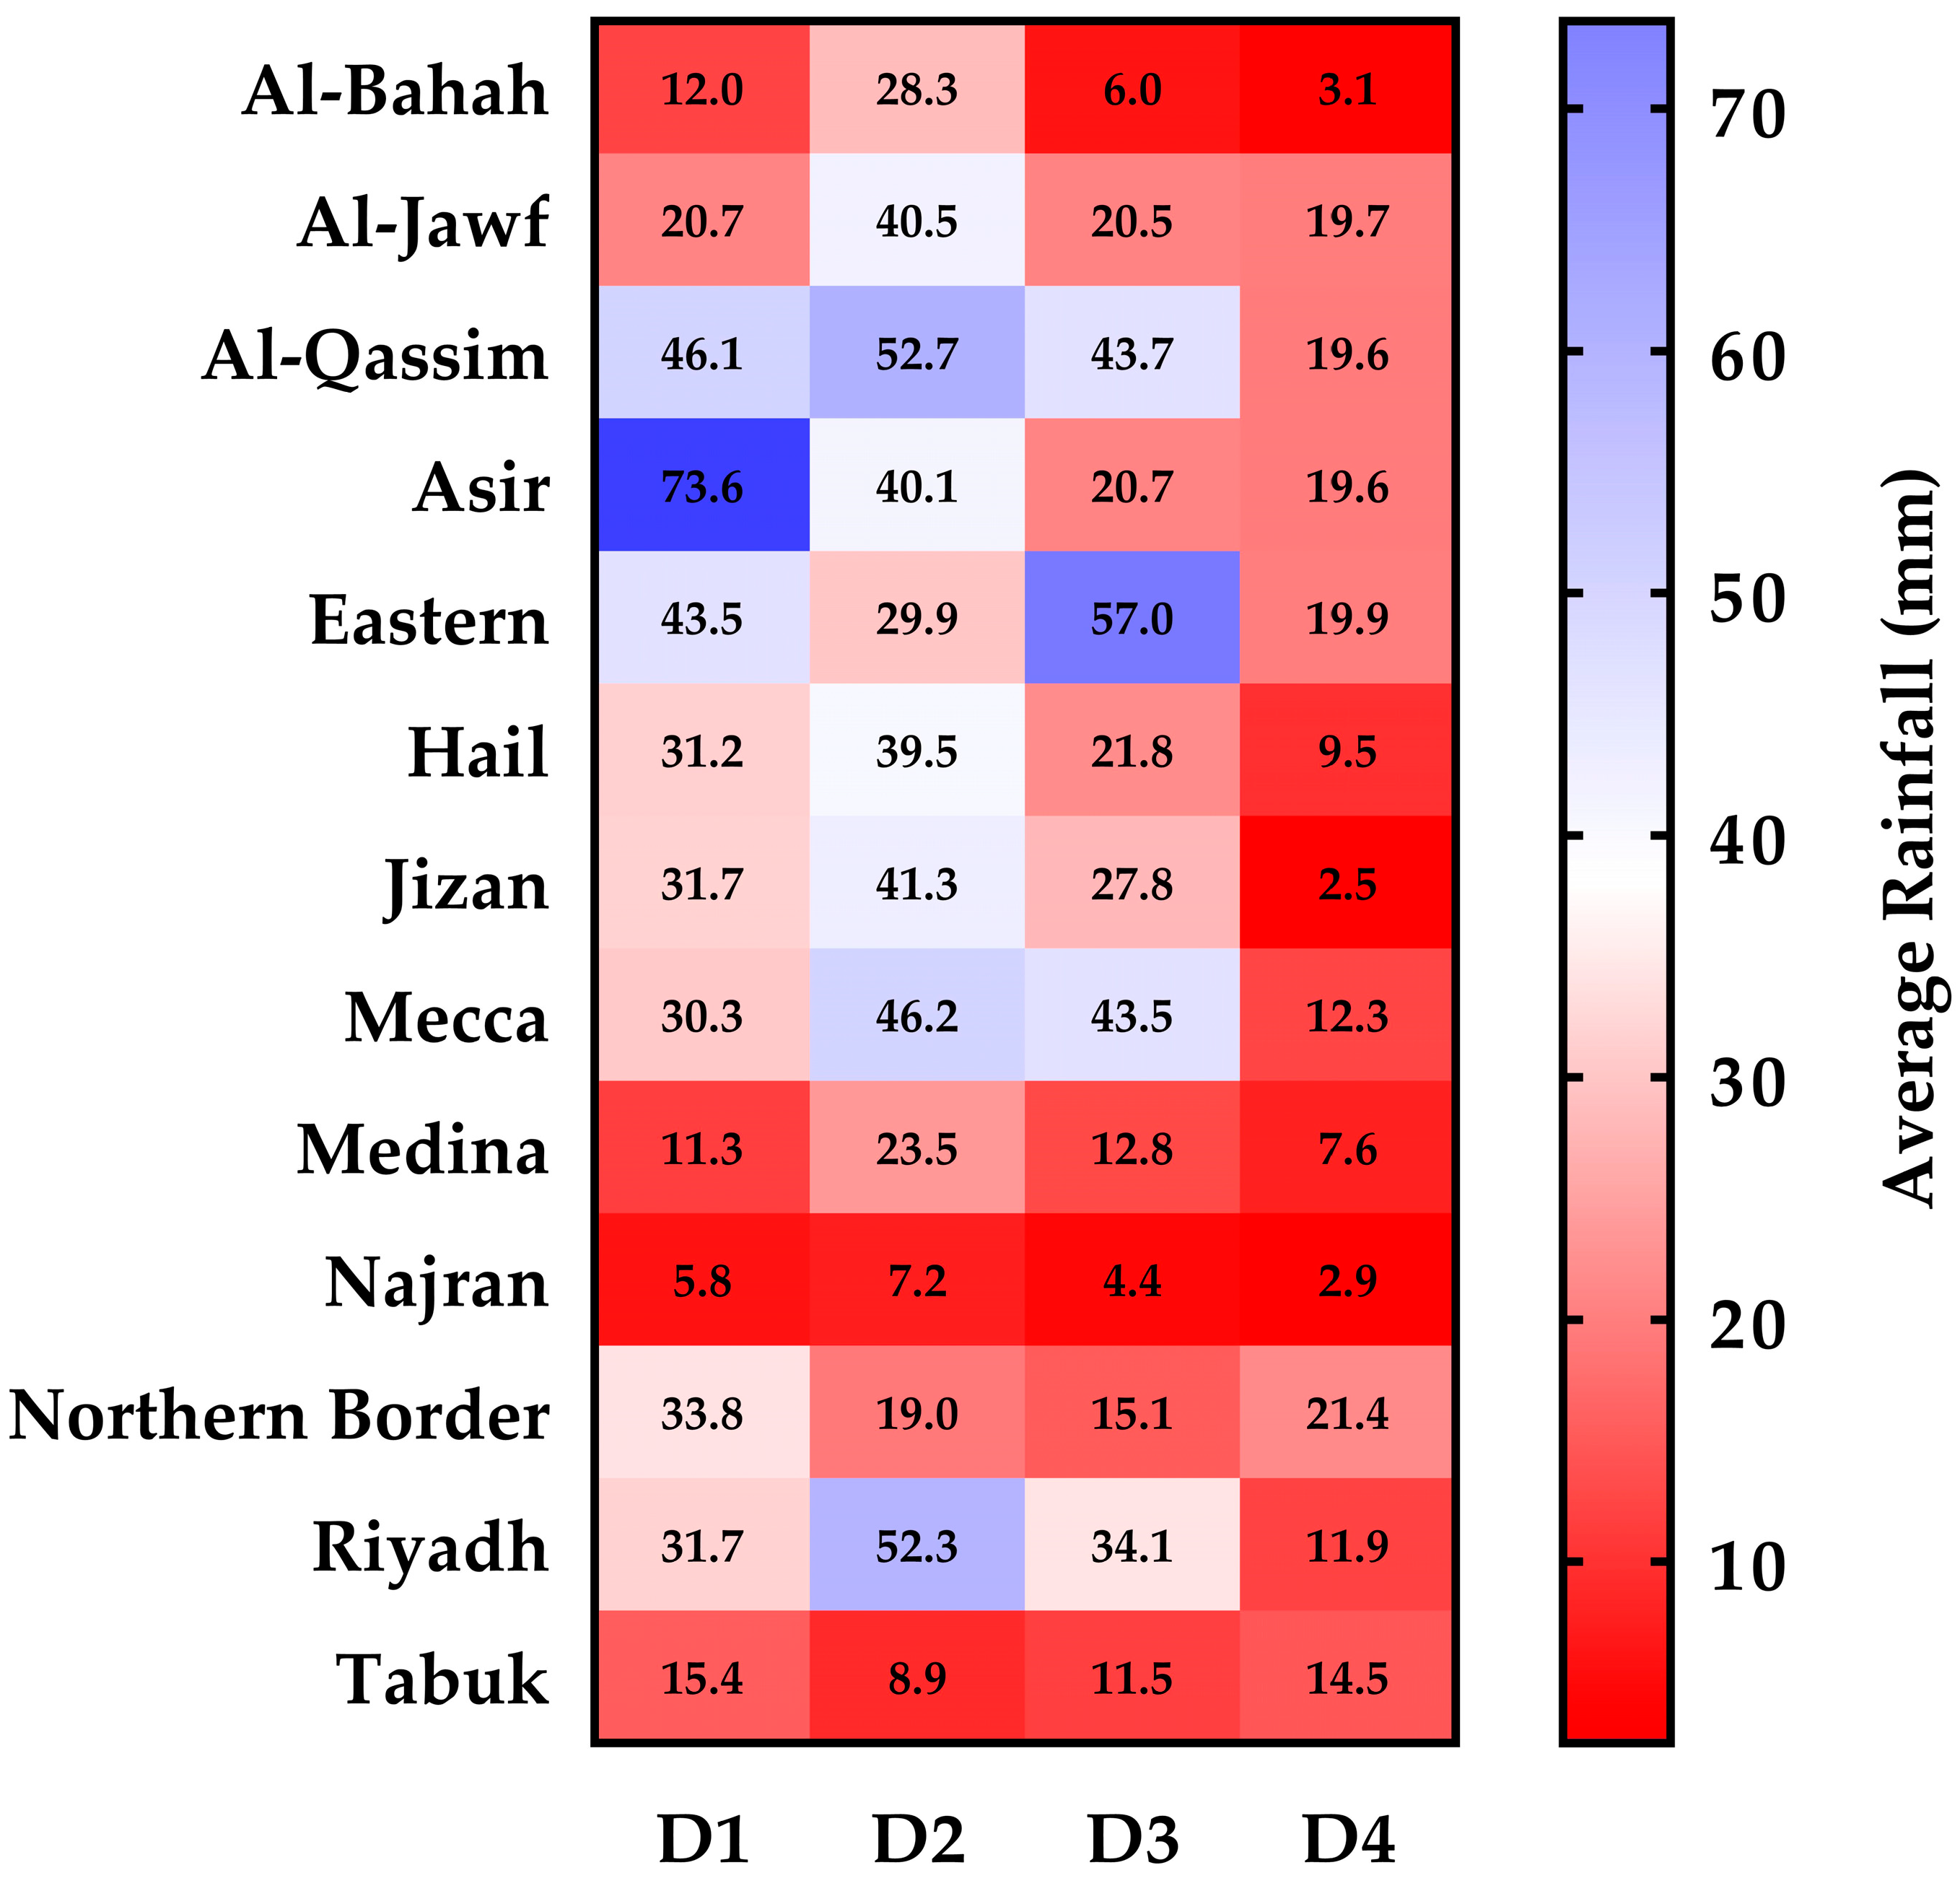
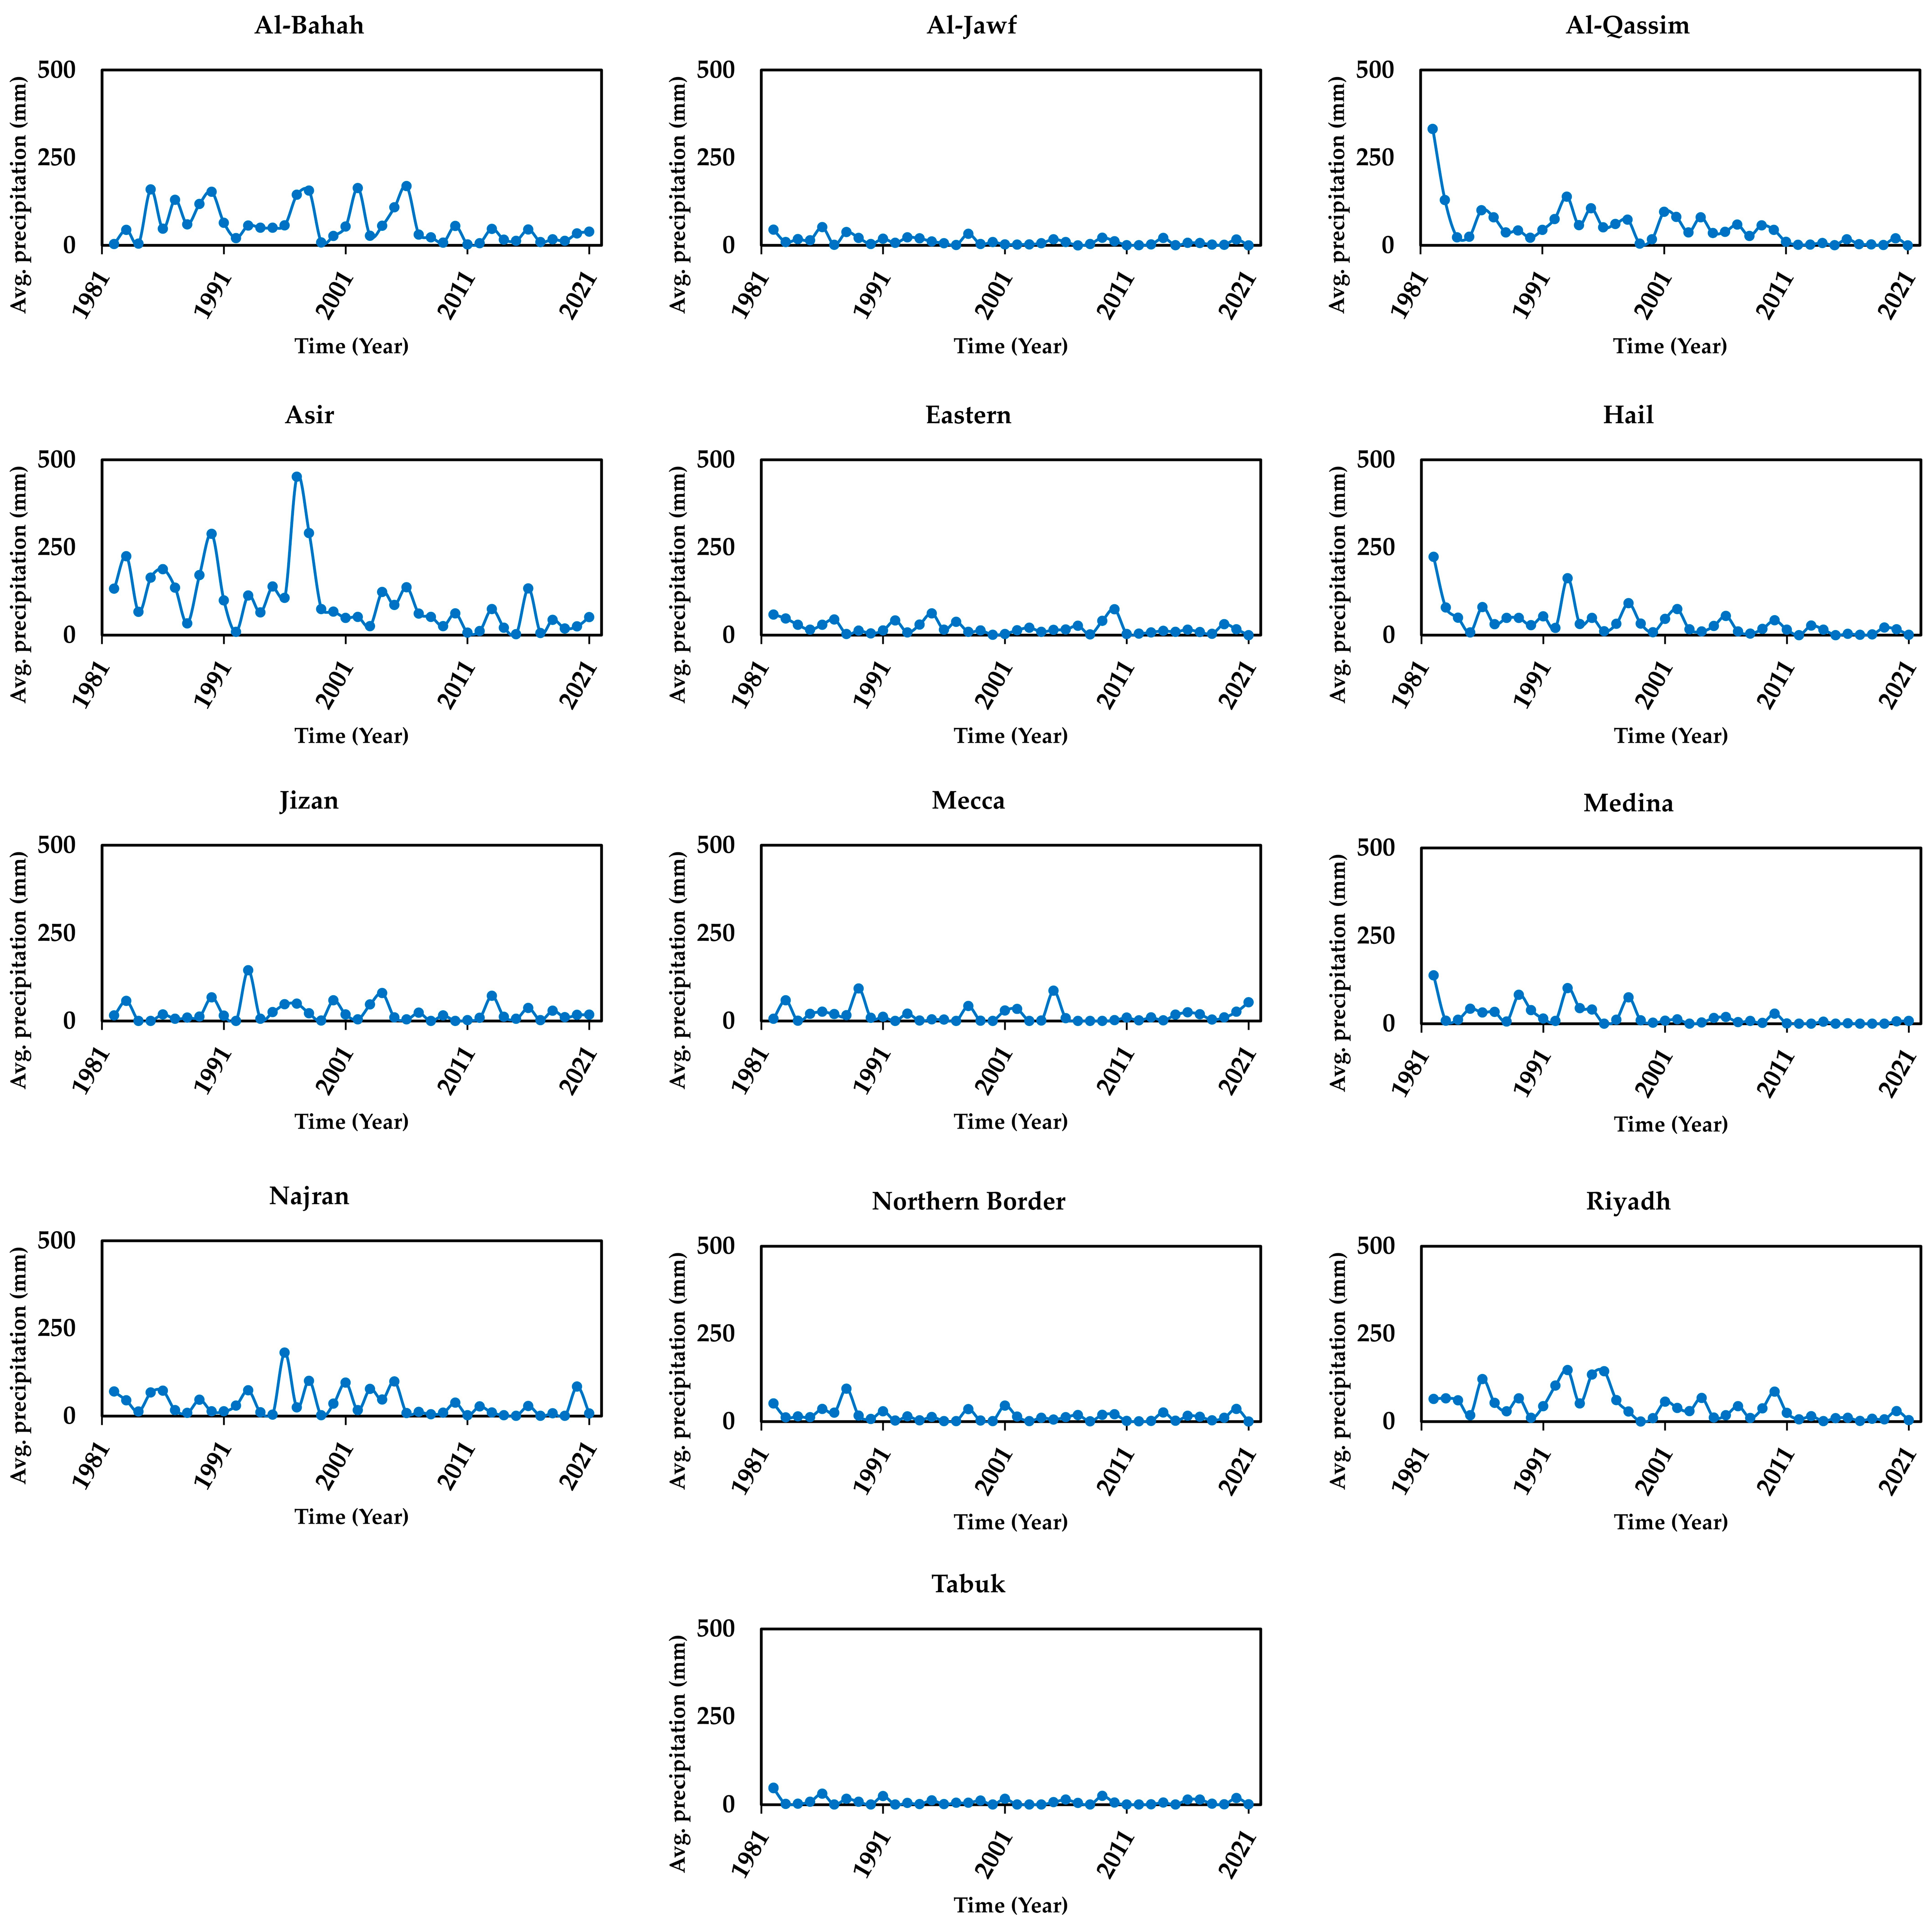
In Saudi Arabia and much of the Arabian Peninsula, rainfall is concentrated in specific months. Seasonal analysis therefore may capture the true timing and intensity of water availability, which annual averages can mask. In addition, long-term annual declines may be driven by changes in just one season (e.g., weakening spring rains or delayed autumn onset) [30]. Hence, without seasonal breakdowns, it is difficult to know whether rainfall loss is uniform across the year or concentrated in specific periods critical for recharge and agriculture. The decadal analysis of winter rainfall across the thirteen administrative regions of Saudi Arabia (Figure 6), reveals a consistent decline in precipitation over the past four decades. Maximum rainfall decreased markedly from 73.6 mm in the first decade (Asir region) to only 21.4 mm in the fourth decade (Northern Borders), while minimum values fell from 5.8 mm in D1 (Najran) to 2.5 mm in D4 (Jizan). This contraction of both the upper and lower bounds indicates a systematic weakening of winter rainfall over time as supported by the annual winter rainfall distribution across the KSA regions from 1982 to 2021.
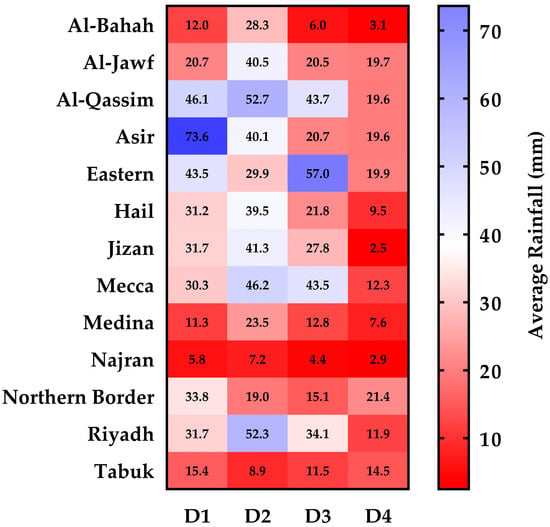
Figure 6.
Decadal average rainfall distribution over the KSA regions in winter. Where: D1: (1982–1991), D2: (1992–2001), D3: (2002–2011), D4: (2012–2021).
At the regional scale, the decline is particularly pronounced in the southwestern highlands, traditionally among the wettest parts of the Kingdom (Figure 7). The Asir region, which registered the highest winter rainfall in D1, experienced a sharp reduction to less than one-third of its initial value by D4. Comparable decreases were observed in Al-Bahah, Mecca, and Riyadh, where relatively high rainfall in D2 was followed by a steep downward trajectory in subsequent decades. The Eastern region exhibited a temporary peak in D3 (57 mm), but rainfall again diminished in D4, consistent with the broader drying signal. Northern regions such as Tabuk and Al-Jawf showed inter-decadal fluctuations, but long-term changes remained negative overall.
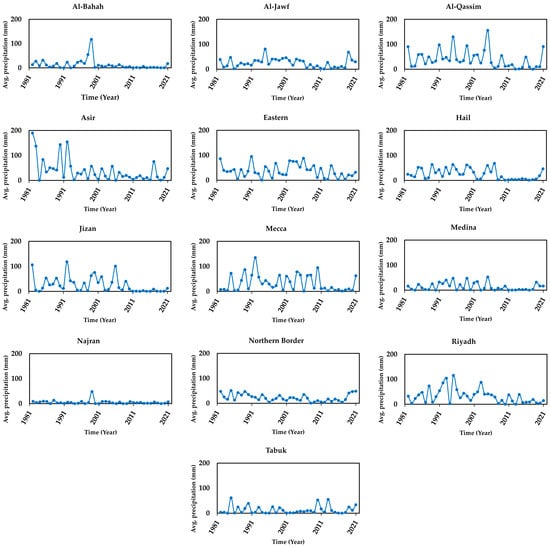
Figure 7.
Rainfall distribution over the KSA regions in winter (1982–2021).
In arid southern regions (Najran, Medina, Jizan), where rainfall was already limited, winter precipitation continued to decline, with Jizan recording the lowest value across all regions in the final decade. Spatially, earlier decades (D1–D2) were characterized by clear rainfall gradients, with the southwestern mountains receiving substantially higher winter precipitation compared to the central and northern regions. By D4, these gradients had largely diminished, and rainfall became uniformly low across the country. This homogenization toward aridity underscores a pervasive drying trend that transcends regional physiographic differences.
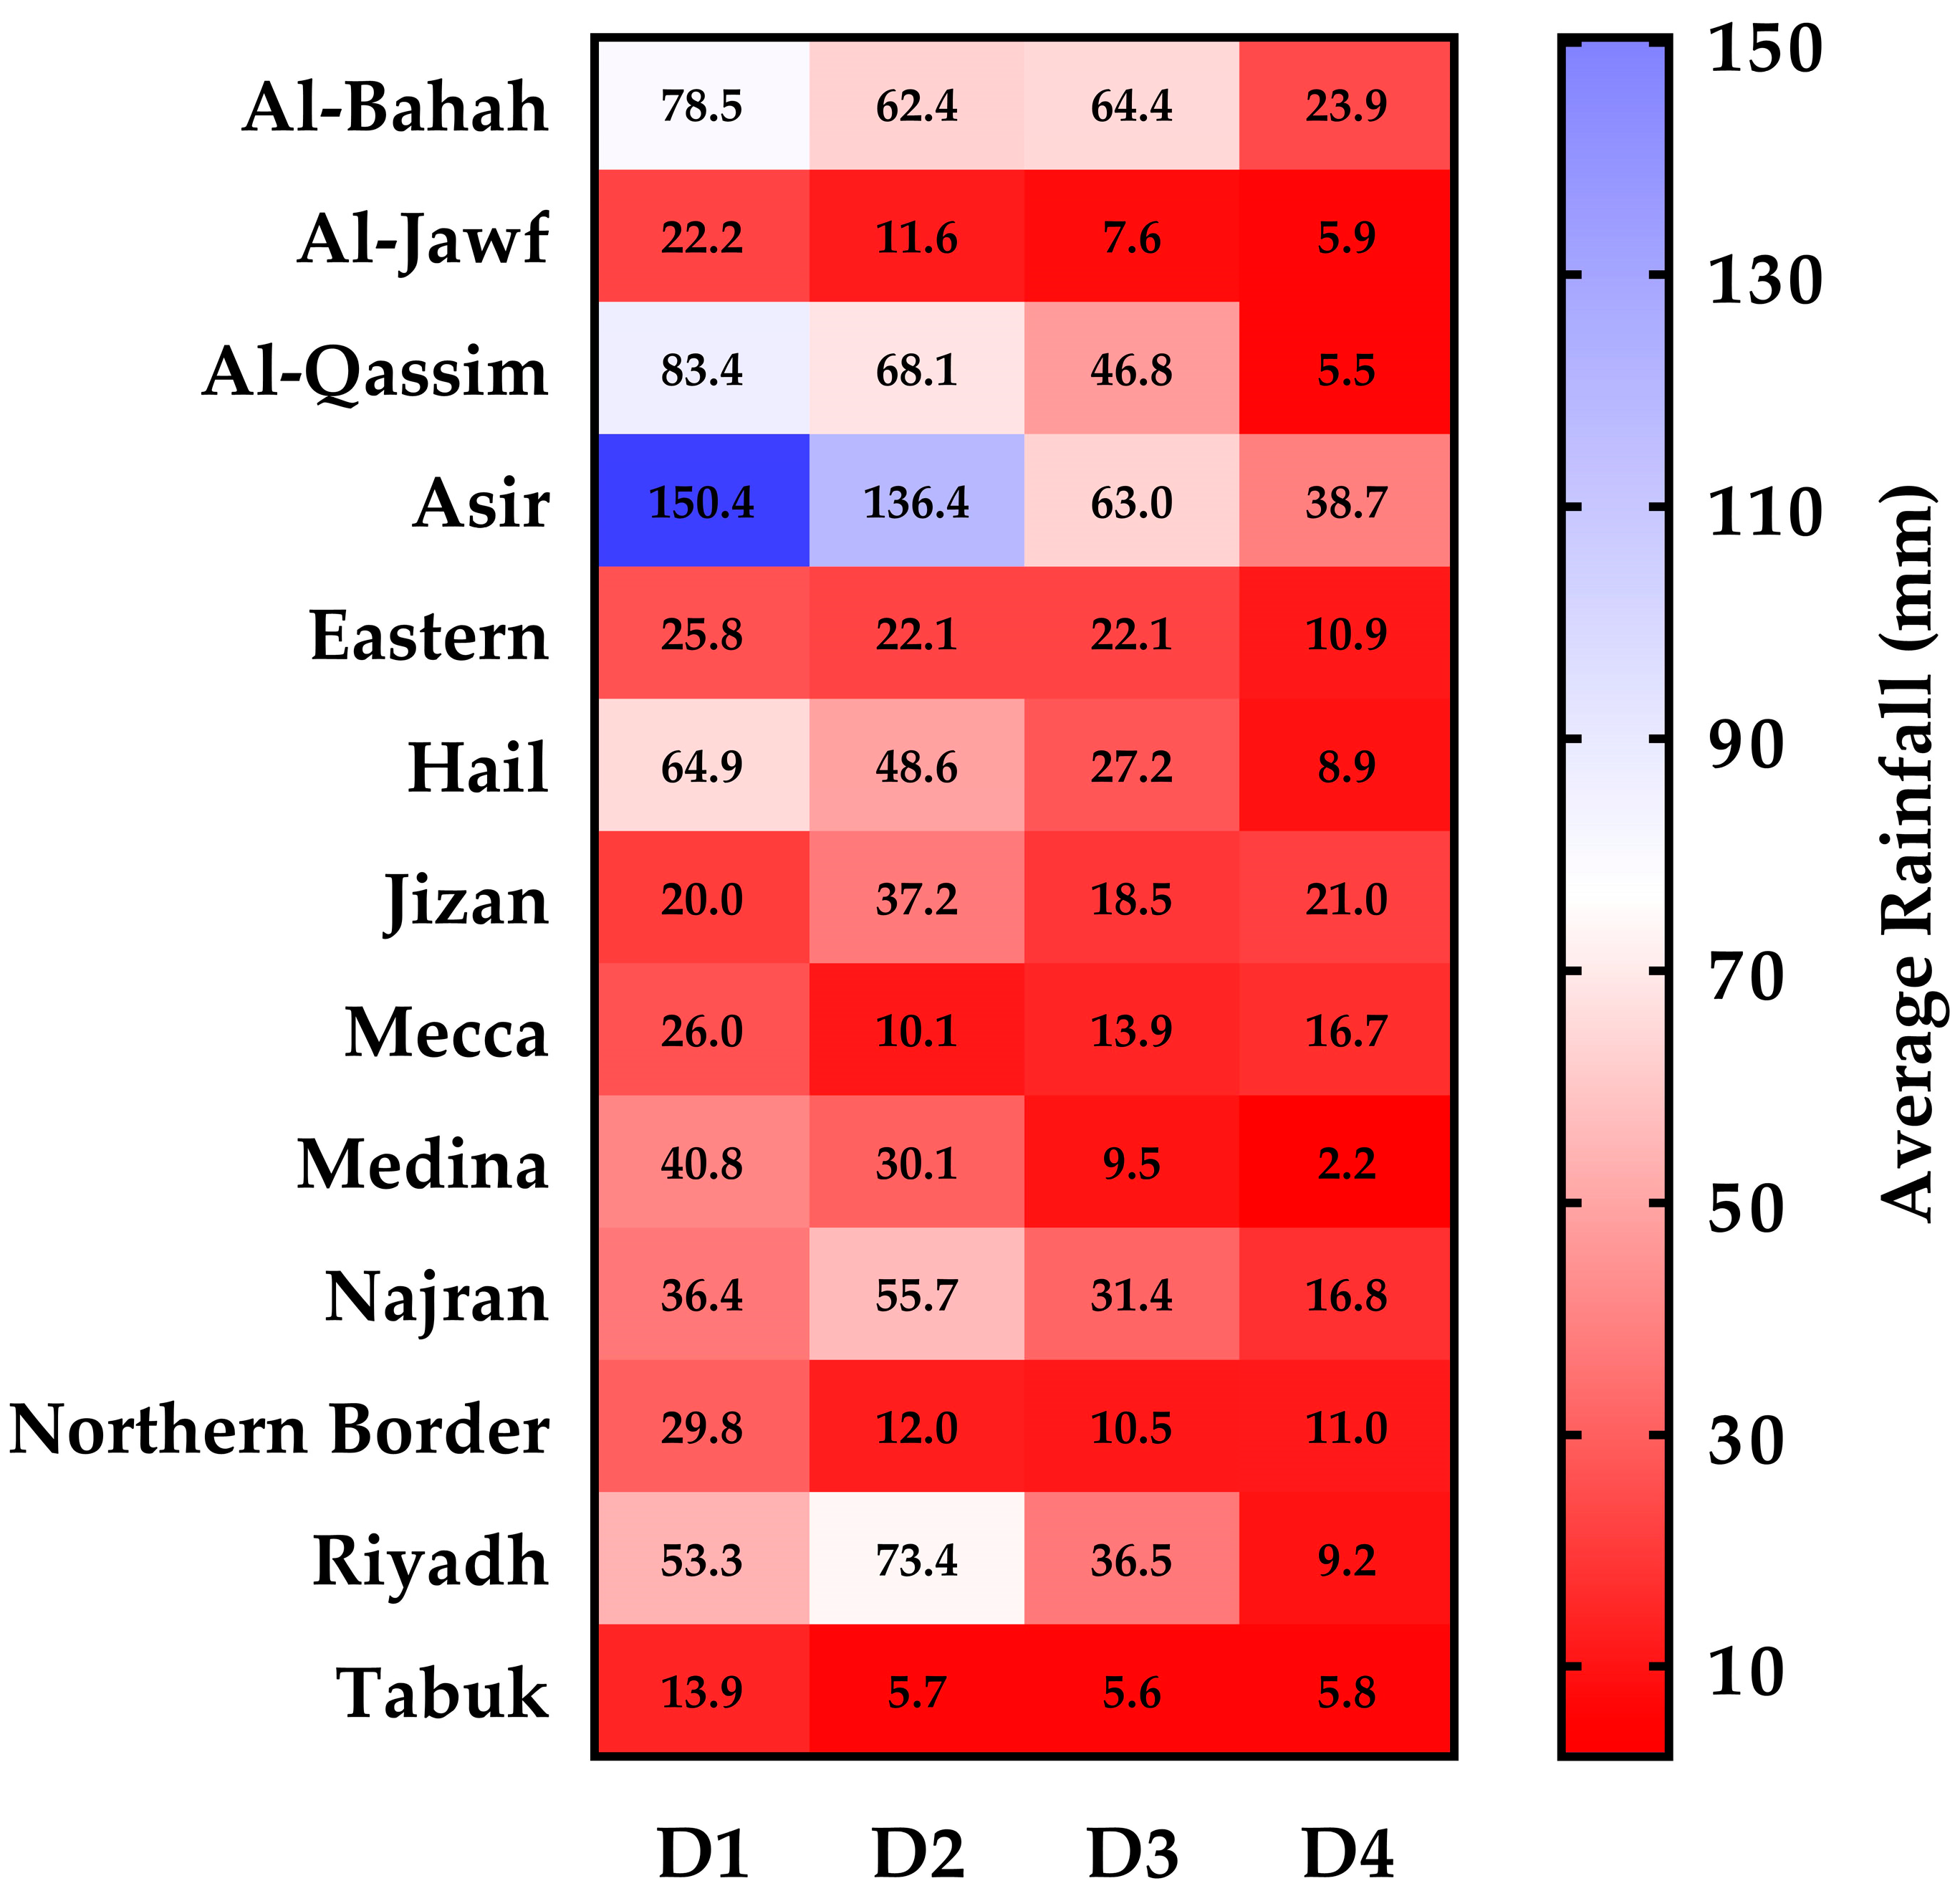
For spring, the analysis of decadal rainfall across the KSA (Figure 8), reveals a marked long-term decline over the past four decades. Maximum rainfall decreased substantially from 150.4 mm in D1 (Asir) to only 38.7 mm in D4, while minimum values declined from 13.9 mm in D1 (Tabuk) to just 2.2 mm in D4 (Medina). These reductions reflect a systematic weakening of spring precipitation, consistent with the broader pattern of aridification observed across the KSA as represented in Figure 9. Regionally, the southwestern highlands (Asir, Al-Bahah), and Al-Qassim initially registered the highest rainfall totals, with Asir peaking at 150.4 mm in D1 and Al-Qassim at 83.4 mm. However, all three regions experienced sharp declines, with rainfall decreasing by more than 70% by D4. Al-Bahah, for example, dropped from 78.5 mm in D1 to only 23.9 mm in D4, while Al-Qassim showed one of the steepest reductions, from 83.4 mm to just 5.5 mm. These results highlight a major contraction in rainfall in regions that historically contributed significantly to spring precipitation.
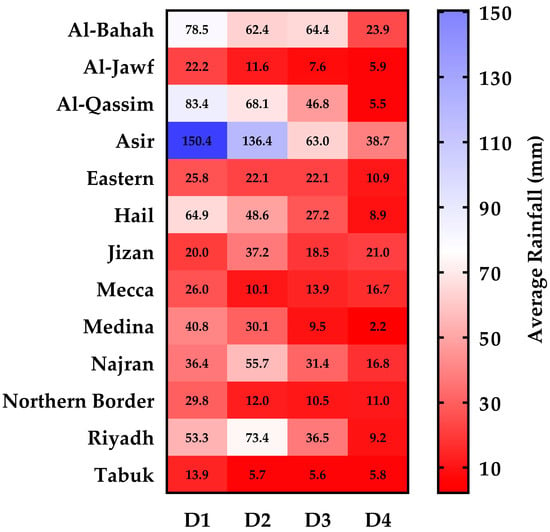
Figure 8.
Decadal average rainfall distribution over the KSA regions in spring. Where: D1: (1982–1991), D2: (1992–2001), D3: (2002–2011), D4: (2012–2021).
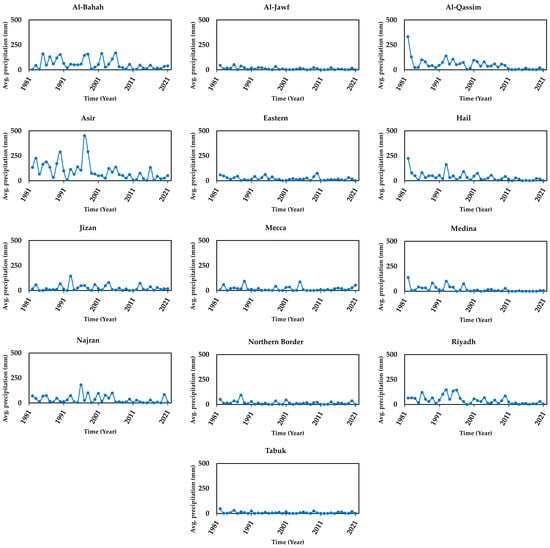
Figure 9.
Rainfall distribution over the KSA regions in spring (1982–2021).
Other regions displayed similar negative trajectories. Riyadh, with relatively high rainfall in D2 (73.4 mm), declined to 9.2 mm in D4. Hail dropped from 64.9 mm in D1 to less than 10 mm in D4, while Medina recorded one of the most dramatic decreases, from 40.8 mm in D1 to just 2.2 mm in D4. In contrast, Jizan and Mecca showed less pronounced declines, and in some decade’s modest increases, although their overall totals remained comparatively low. The Eastern and Northern regions likewise experienced consistent reductions, with values converging toward single-digit levels by the final decade. Spatially, the sharp contrast evident in earlier decades—where the southwestern highlands (Asir, Al-Bahah), and Al-Qassim received significantly higher spring rainfall compared to the arid central and northern regions—has diminished considerably. By D4, rainfall across nearly all regions had converged to uniformly low levels, with only Asir and Al-Bahah maintaining slightly elevated but still greatly reduced totals. This homogenization of rainfall patterns underscores the severity of the decline, with important implications for regional water availability.
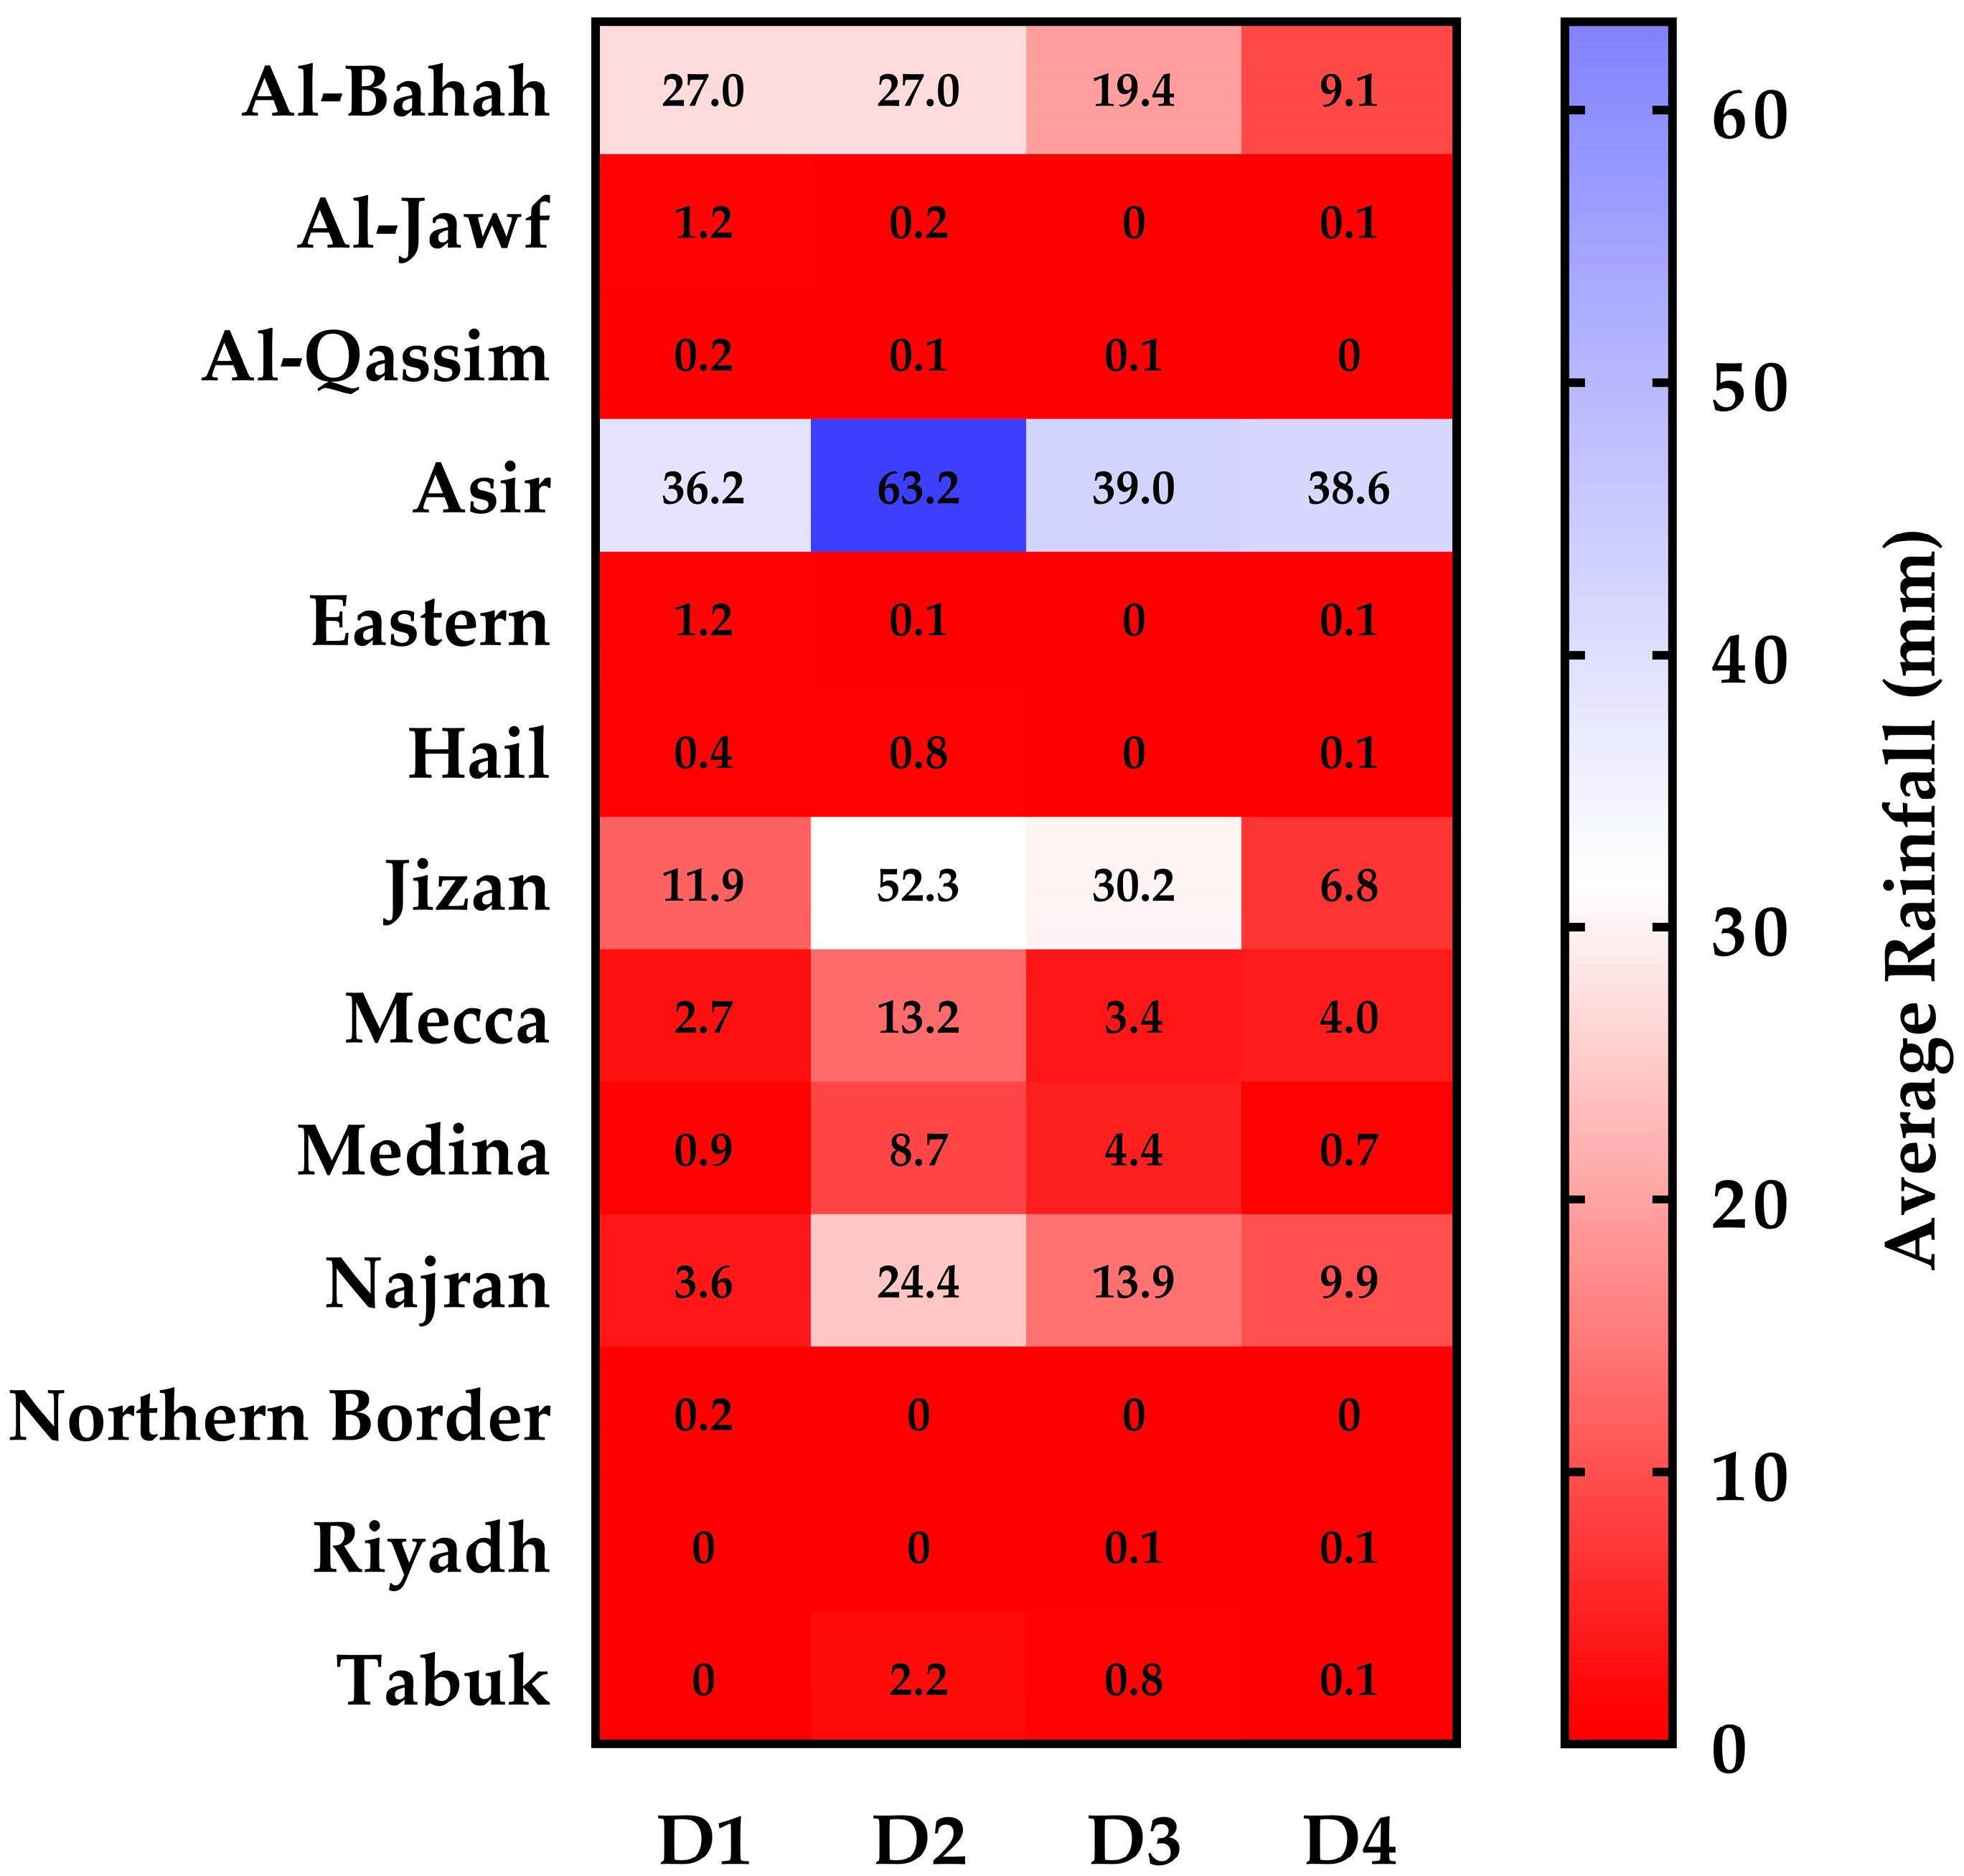
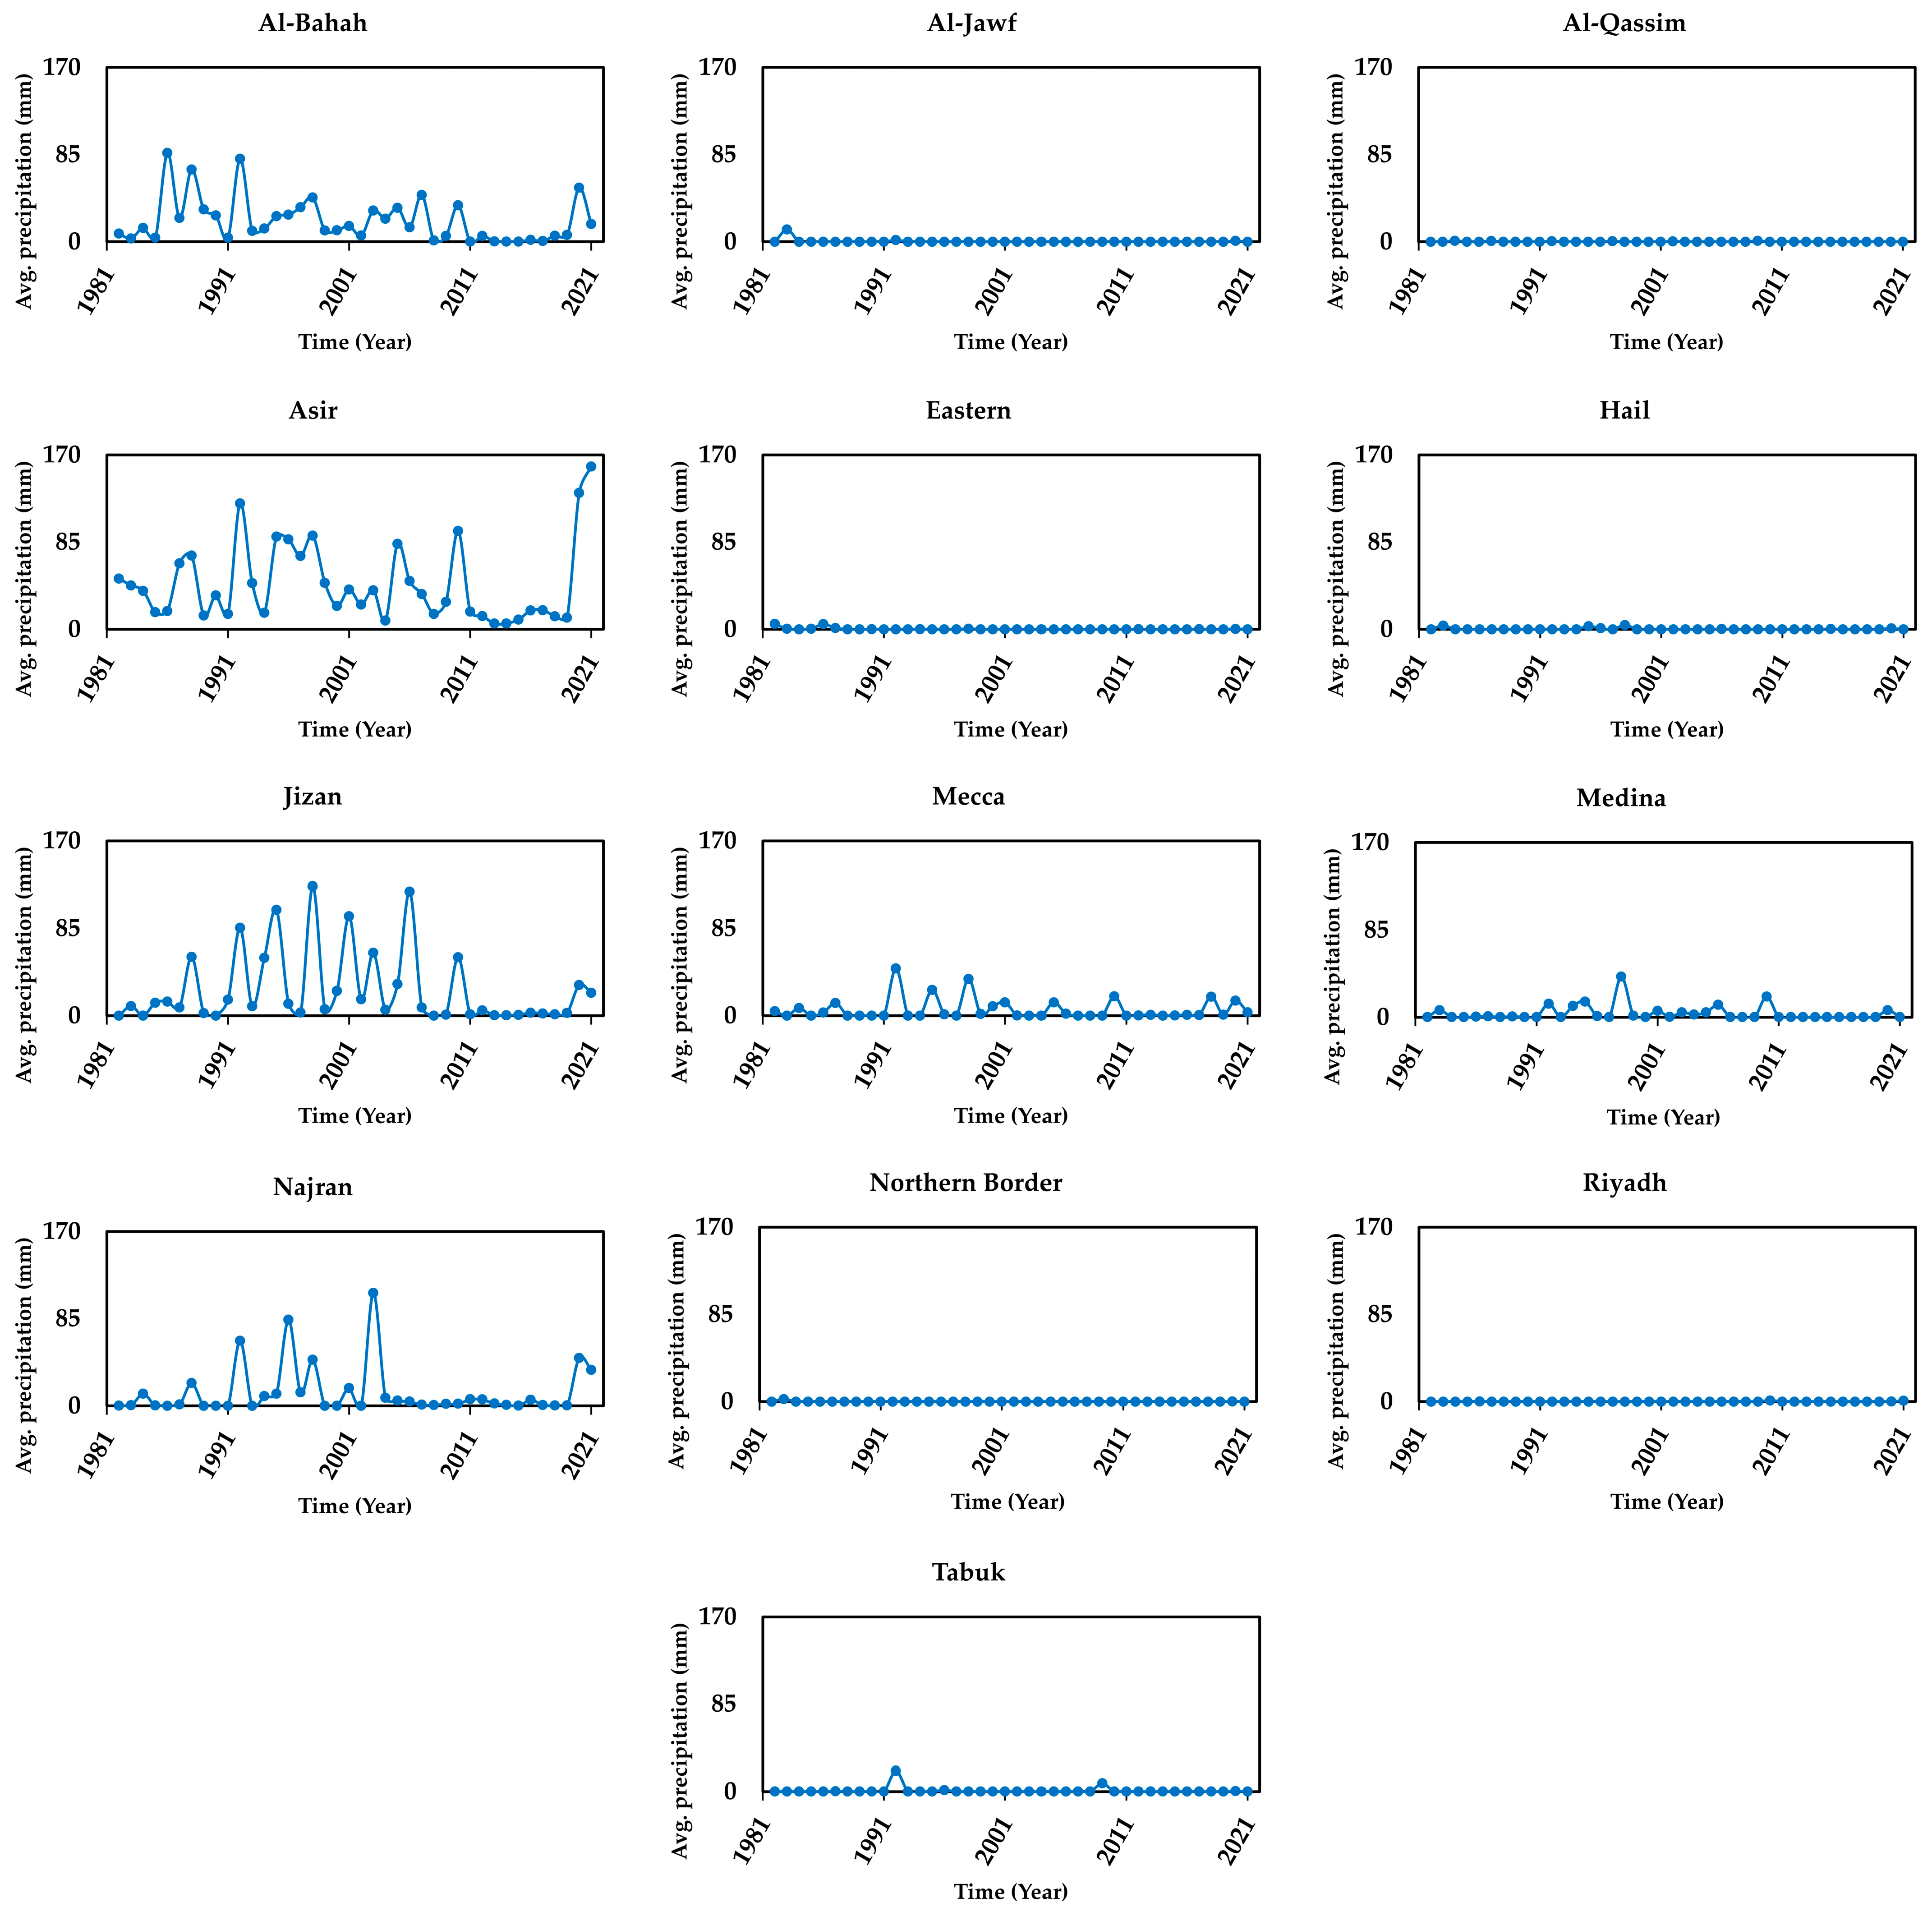
Moving to summer (Figure 10), the decadal analysis reveals strong spatial heterogeneity and temporal variability, with distinct differences compared to the winter and spring seasons. Overall, summer rainfall in the Kingdom is limited, reflecting the dominance of subtropical high-pressure systems during this season. Nevertheless, the results show that certain regions, particularly in the southwest, receive meaningful summer precipitation, while much of the central and northern areas remain nearly rainless throughout the study period as shown in Figure 11. The southwestern highlands, especially Asir, emerge as the primary center of summer rainfall. Asir recorded the highest value across all decades, peaking at 63.2 mm in D2, followed by 39.0 mm in D3 and 38.6 mm in D4. Although these values represent a decline from the D2 peak, Asir consistently maintained the highest summer totals, that may reflect the influence of orographic lifting [45]. Neighboring regions such as Al-Bahah and Najran also recorded relatively higher values compared to the national average, though with a declining trajectory: Al-Bahah fell from 27.0 mm in D1–D2 to just 9.1 mm in D4, while Najran peaked in D2 (24.4 mm) before dropping to 9.9 mm in D4. Jizan showed a similar pattern, with substantial summer rainfall in D2 (52.3 mm) but a sharp reduction to 6.8 mm by D4. These findings underscore the temporal instability of summer rainfall in the southwest, with D2 representing an anomalously wet decade.
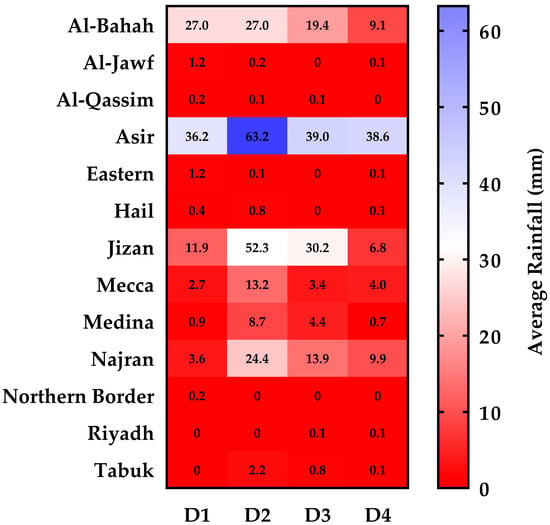
Figure 10.
Decadal average rainfall distribution over the KSA regions in summer. Where: D1: (1982–1991), D2: (1992–2001), D3: (2002–2011), D4: (2012–2021).
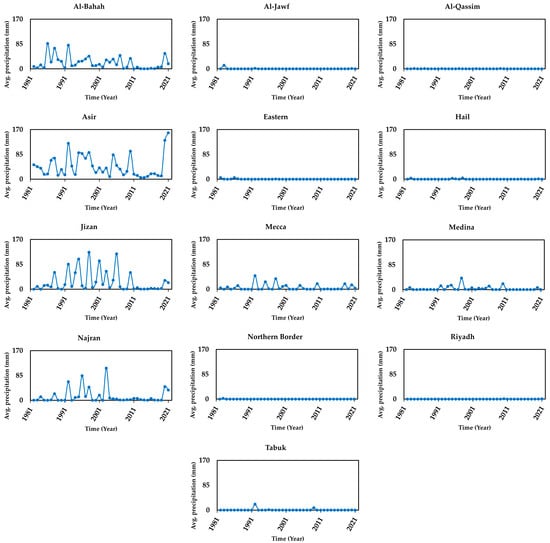
Figure 11.
Rainfall distribution over the KSA regions in summer (1982–2021).
In contrast, most other regions recorded extremely low or negligible summer rainfall. The central and northern areas (Al-Qassim, Hail, Riyadh, Northern Borders, and Al-Jawf) consistently reported values near zero across all decades, with only minor fluctuations. Eastern and Medina exhibited slightly higher totals in D2 (8.7 mm in Medina), but these gains were not sustained in subsequent decades. Mecca recorded modest summer rainfall, with a notable peak in D2 (13.2 mm) but a limited increase thereafter. The spatial distribution of summer rainfall also highlights the localized nature of summer precipitation. While the Asir–Jizan–Najran corridor continues to act as the focal point for convective activity, the remainder of the Kingdom remains largely unaffected [30,42]. By D4, rainfall maxima had declined across nearly all regions, and even the wettest areas experienced reductions compared to earlier decades, suggesting a broader drying trend despite localized persistence of rainfall in the highlands.
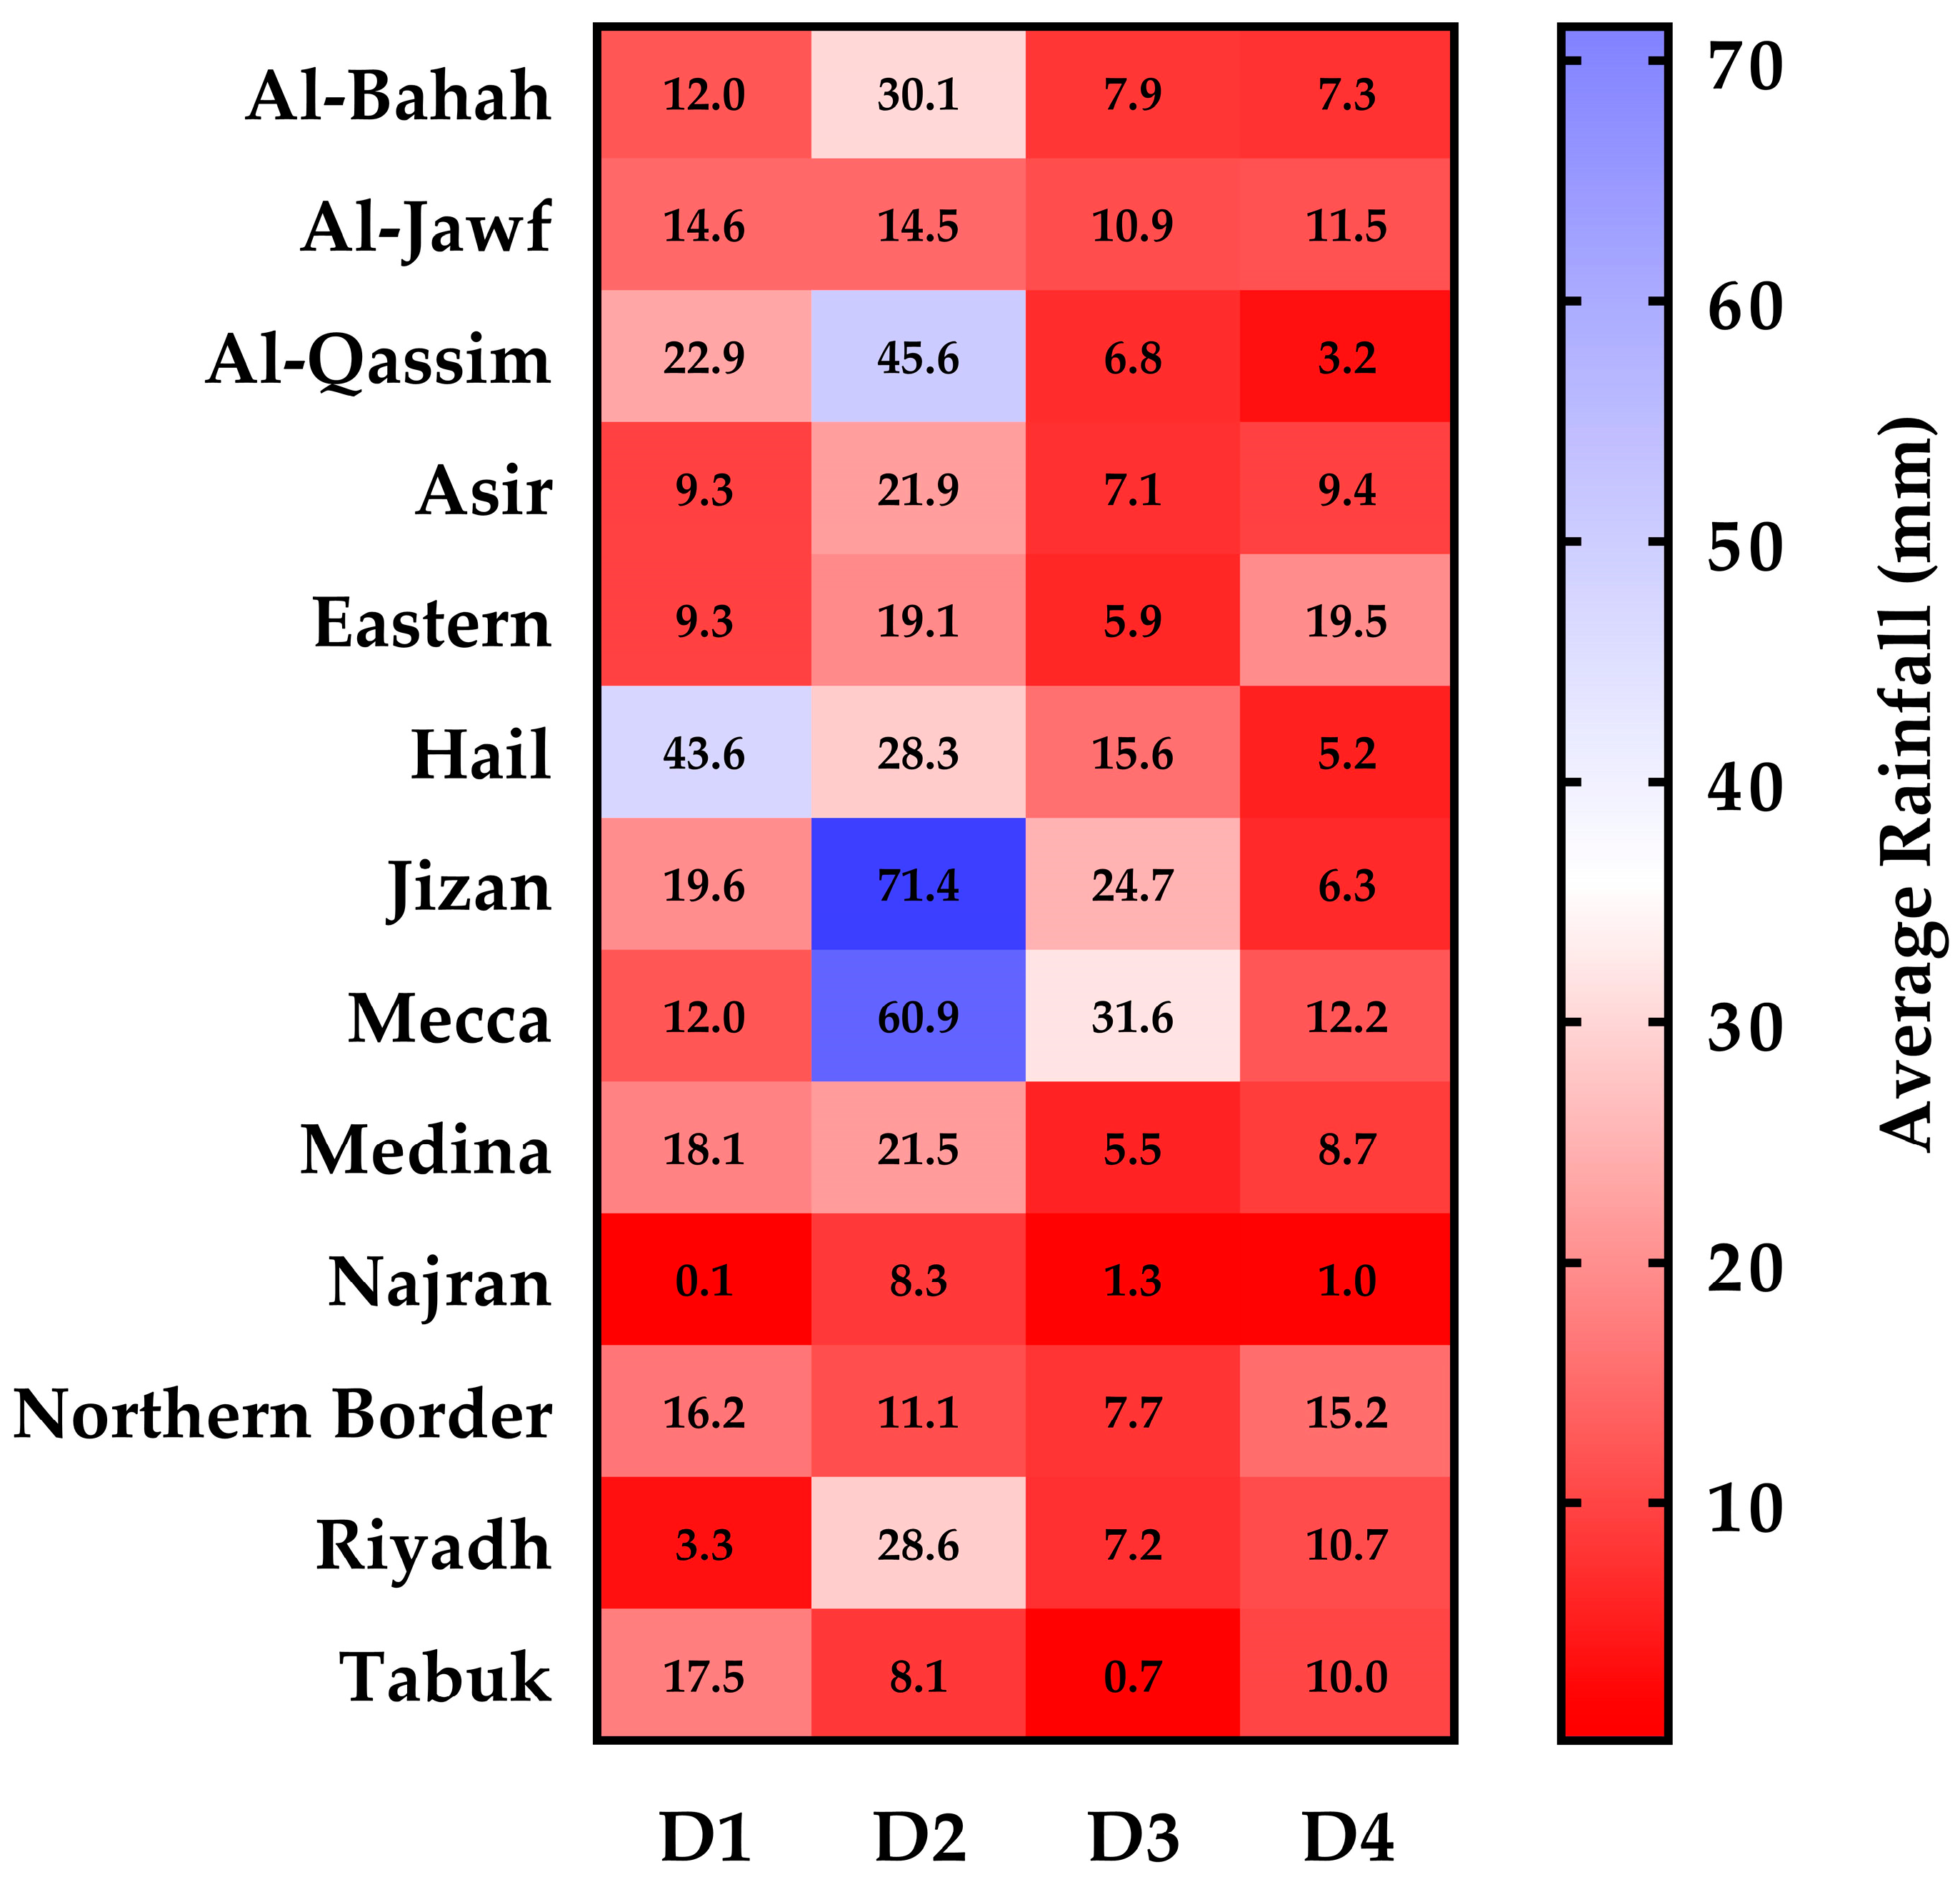
Finally, the decadal assessment of fall rainfall across the thirteen regions of the KSA (Figure 12), reveals strong interdecadal variability and a general declining trajectory after anomalously wet conditions in the second decade (D2). Maximum rainfall peaked at 71.4 mm in D2 (Jizan), before dropping to 31.6 mm in D3 (Mecca) and 19.5 mm in D4 (Eastern region). Minimum values also shifted upward in D2 (8.1 mm, Tabuk) compared to D1 (0.1 mm, Najran), but fell again by D3 and D4, stabilizing near 1.0 mm. These results suggest that D2 was characterized by unusually high fall rainfall across multiple regions, followed by widespread reductions in subsequent decades as Figure 13 depicts. The central and northern regions displayed similar but less pronounced variability. Al-Qassim and Riyadh both experienced sharp increases in D2 (45.6 mm and 28.6 mm, respectively), but rainfall subsequently declined to very low levels by D4 (3.2 mm and 10.7 mm). Hail recorded its highest rainfall in D1 (43.6 mm) but then experienced a continuous decline to just 5.2 mm in D4, making it one of the clearest cases of a persistent downward trend. Northern regions such as Al-Jawf and Northern Borders showed smaller fluctuations but lacked any sustained upward trajectory, maintaining moderate but declining totals over time.
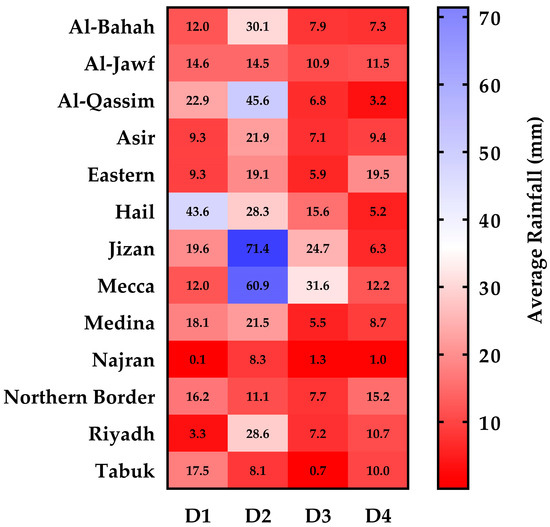
Figure 12.
Decadal average rainfall distribution over the KSA regions in fall. Where: D1: (1982–1991), D2: (1992–2001), D3: (2002–2011), D4: (2012–2021).
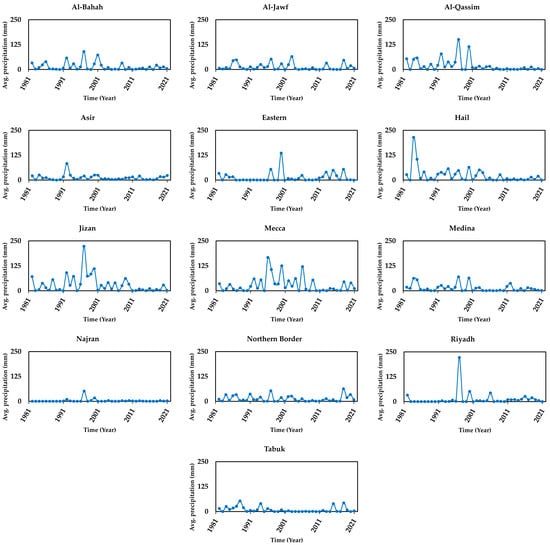
Figure 13.
Rainfall distribution over the KSA regions in fall (1982–2021).
The Eastern region represents an exception, with relatively modest values in D1 (9.3 mm) and D3 (5.9 mm), but a rebound to 19.5 mm in D4, suggesting some degree of localized recovery not seen elsewhere. Nonetheless, this rebound did not offset the broader drying observed across most of the Kingdom. Overall, fall rainfall in the KSA shows strong decadal variability, with a clear anomalous peak in D2 followed by pronounced declines in most regions by D4. The southwestern and western highlands remain the most important centers of fall precipitation, but even these regions have experienced significant reductions in recent decades.
The ranking of rainfall contribution by season highlights substantial spatial heterogeneity in the timing of precipitation across Saudi Arabia. This heterogeneity may reflect the interplay of Mediterranean winter storms, Indian Ocean monsoon incursions, and Red Sea Trough convection, which together shape the Kingdom’s rainfall climatology [42,46]. These seasonal rankings reveal main rainfall regimes across Saudi Arabia: Winter-dominated regime: Found in the north (Al-Jawf, Tabuk, Northern Borders), west (Mecca), and east (Eastern Province). Rainfall here is strongly tied to Mediterranean winter cyclones and frontal disturbances [46], with spring providing supplementary input. Spring-dominated regime: Found in the central plateau (Qassim, Hail, Riyadh, Medina) and southwestern highlands (Al-Bahah, Asir, Najran). Rainfall is concentrated in the transitional spring season, when both westerly systems and convective activity interact [47,48]. Summer rainfall has secondary importance in the highlands only. Autumn-dominated anomaly: Jizan stands out with peak rainfall in autumn, reflecting the region’s unique exposure to tropical convective systems and the Red Sea Trough [42,49]. From a practical perspective, this seasonal diversity has profound implications for water resource management, agricultural planning, and disaster risk reduction. For example, declines in spring rainfall disproportionately affect agriculture in Qassim and Hail, while shifts in autumn rainfall in Jizan directly influence flash flood hazards.
3.3. Rainfall Variations Effect on Watersheds
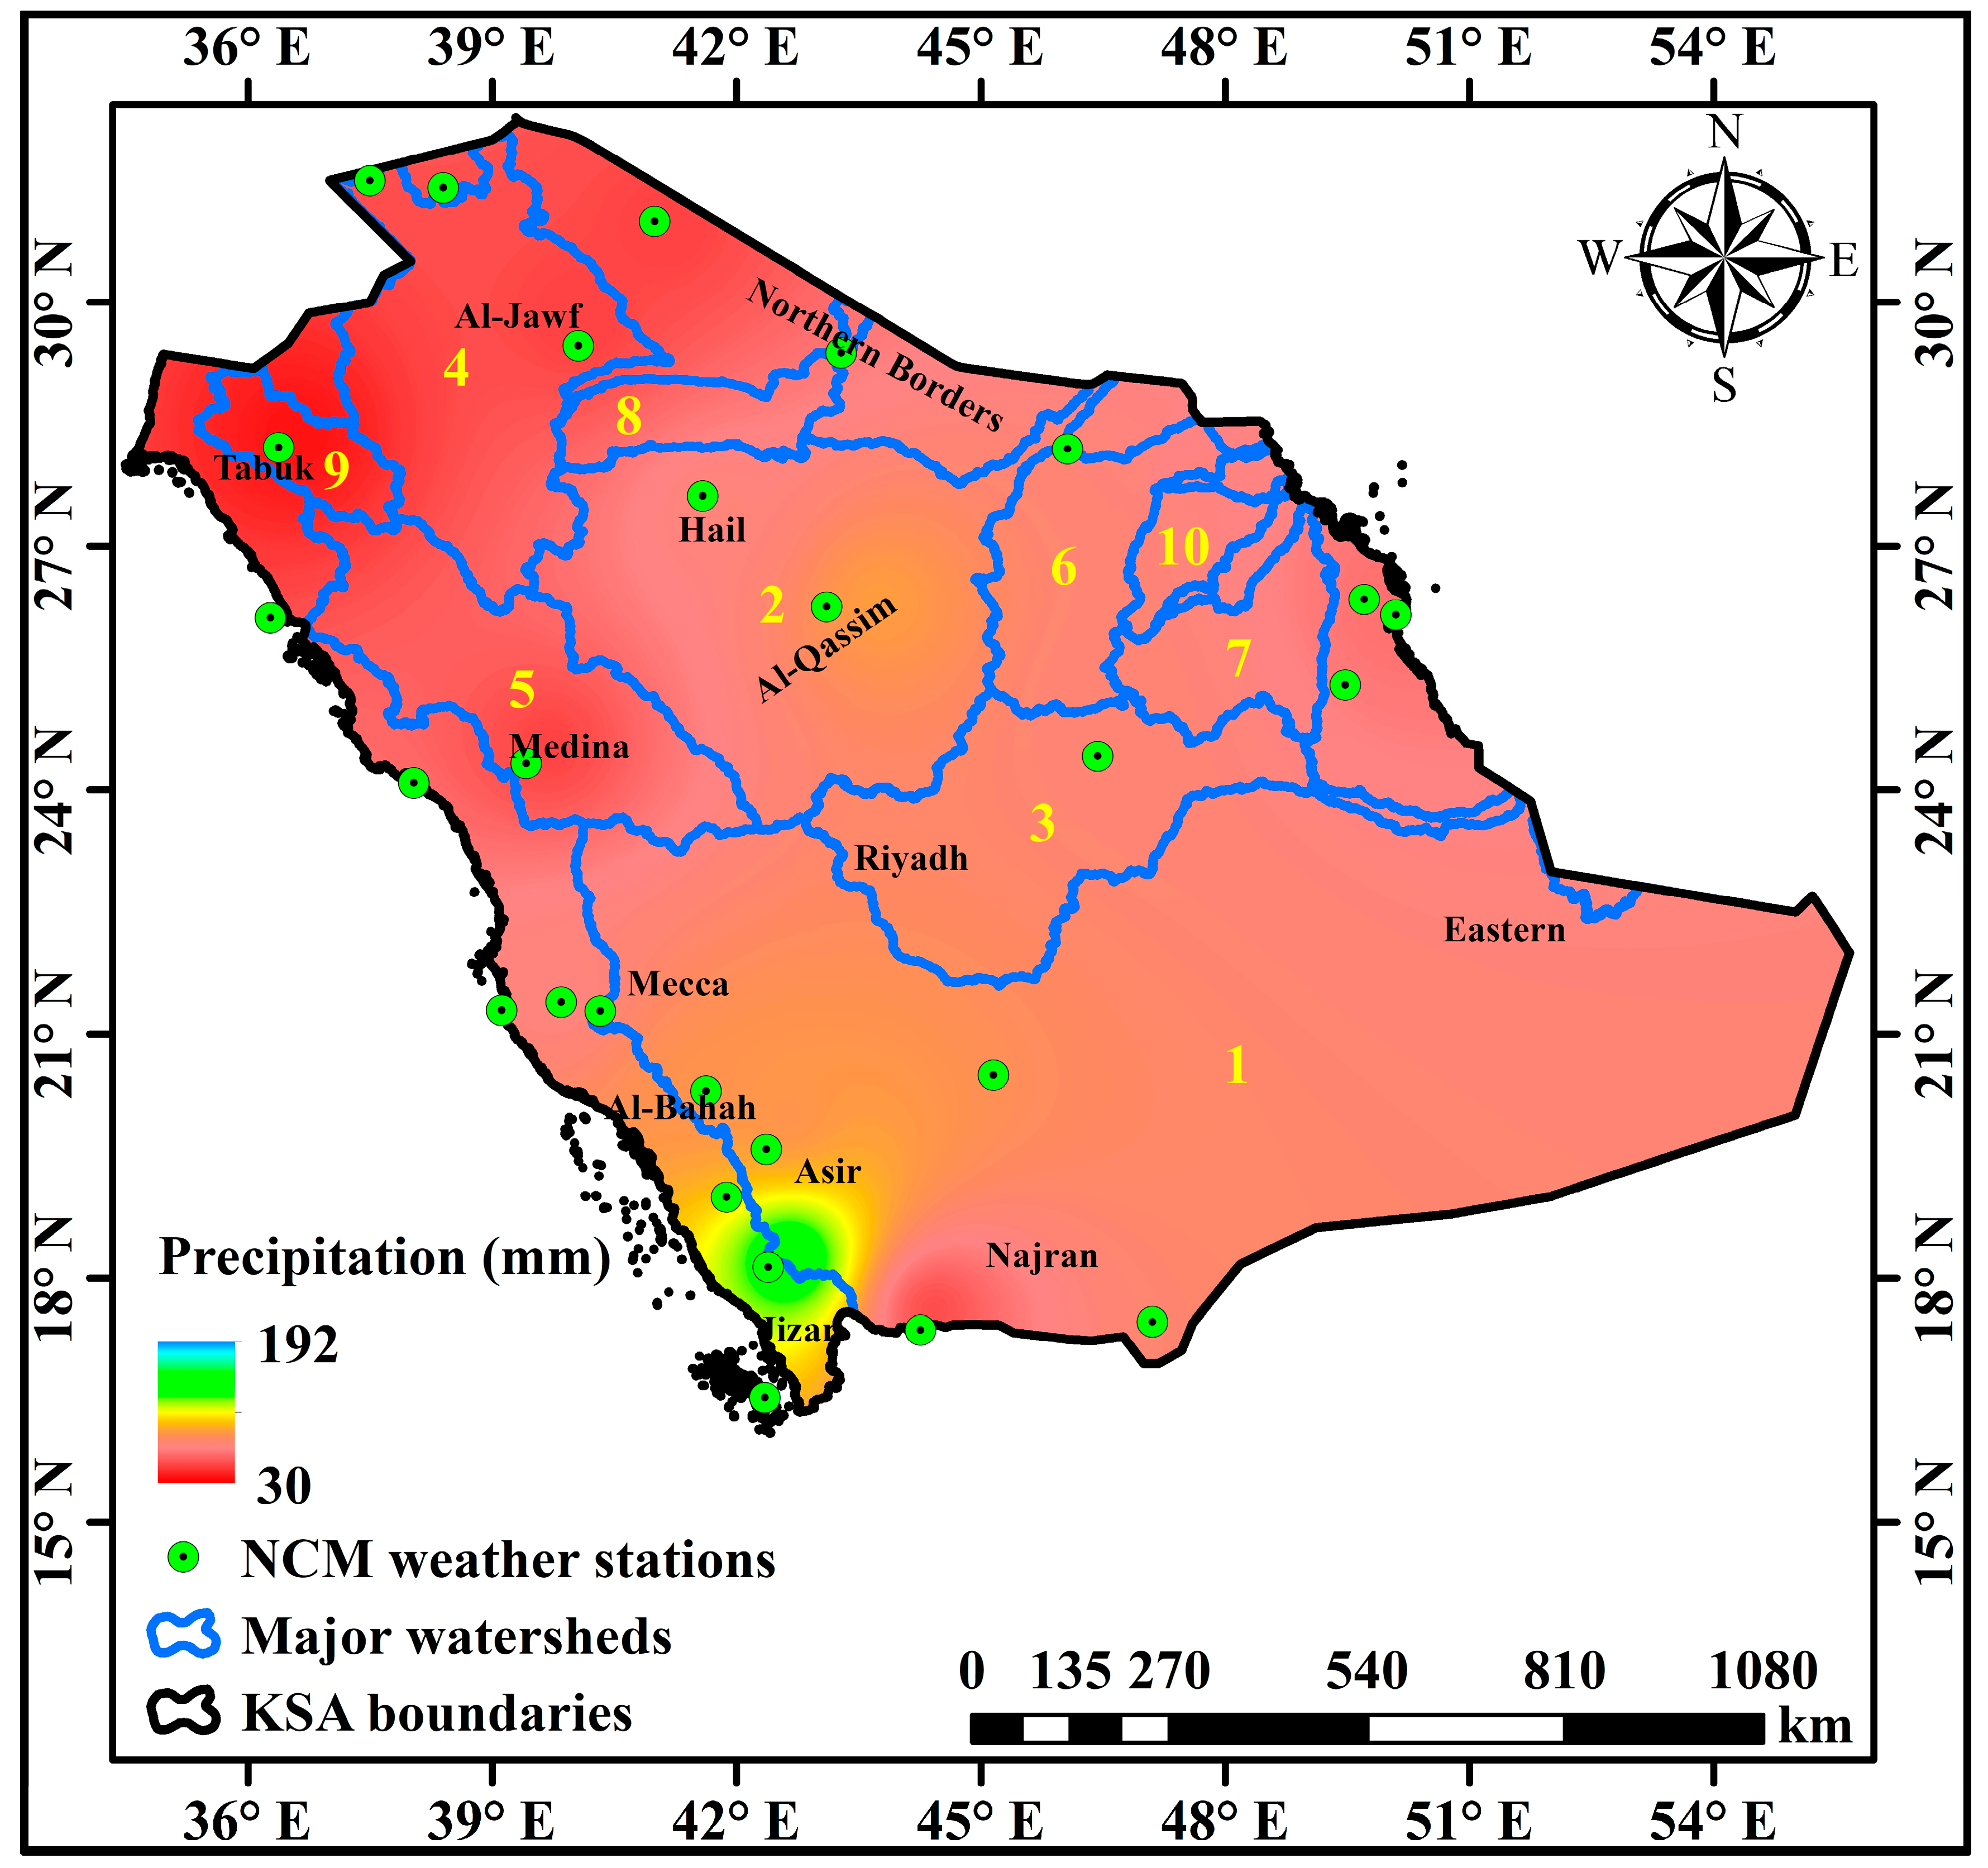
Figure 14 illustrates the spatiotemporal variations of rainfall patterns across the ten major watersheds of Saudi Arabia over the 40-year period (1982–2021). The map integrates both rainfall intensity and spatial distribution, revealing a clear southwest–northeast gradient in precipitation. The southwestern highlands (notably Asir, Al-Bahah, and Jizan, corresponding to Watershed 1) receive the highest annual rainfall, exceeding 150–190 mm, whereas the northern and eastern basins (Watersheds 4, 6, 7, and 10) record markedly lower averages, typically below 50 mm per year. This spatial pattern reflects the orographic influence of the Asir escarpment and the diminishing moisture gradient toward the desert interior and northern plateau.
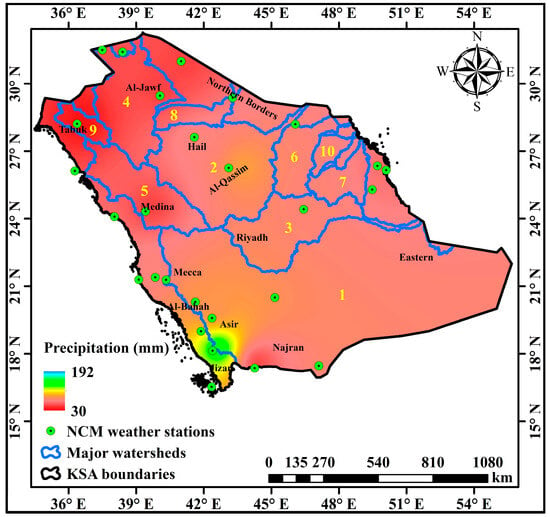
Figure 14.
Spatiotemporal variations of rainfall patterns over major watersheds of the KSA (1982–2021). Where: 1, 2…10: major watersheds in the KSA.
Table 2 mentions the correspondence between watersheds and administrative regions becomes evident. Watershed 1, the largest basin (777,818 km2), spans eight regions—Eastern, Riyadh, Najran, Asir, Mecca, Al-Bahah, Jizan, and Medina—and captures much of the rainfall variability driving recharge in the southwestern and central aquifers. Watershed 2 (221,540 km2) overlaps Riyadh, Al-Qassim, Hail, Medina, and the Eastern Region, representing the central plateau, which exhibits some of the strongest drying trends identified in the regional analysis (notably Al-Qassim and Hail). Conversely, Watersheds 4, 5, and 9, located in the northwestern and northern zones (Al-Jawf, Tabuk, Northern Borders, and Medina), exhibit low rainfall levels, consistent with their arid climatic regime and the declining rainfall trends observed in Figure 14’s red to orange shading.

Table 2.
Major watersheds with corresponding regions and average yearly precipitation.
Watersheds 6, 7, and 10, though smaller in area, lie primarily within the Eastern and Riyadh regions, both characterized by extremely low rainfall (<50 mm) and high interannual variability, contributing marginally to surface water or groundwater recharge. The color transitions in Figure 14—from blue and green in the southwest to yellow and red in the central and northern zones—reflect these distinct hydroclimatic gradients, aligning closely with the regional rainfall trends.
Generally, Figure 14 and Table 2 together underscore the hydroclimatic dichotomy of Saudi Arabia’s major watersheds: a humid southwestern fringe acting as the principal rainfall and recharge zone, contrasting sharply with the vast, arid interior and northern basins exhibiting sustained long-term drying. These spatial relationships are vital for understanding watershed-scale hydrological responses, prioritizing water resource management, and formulating region-specific climate adaptation strategies.
3.4. Practical Implications for Water Resources and Risk Management
The predominance of declining rainfall trends across most regions presents a serious challenge for Saudi Arabia’s water resources and climate resilience. The Kingdom’s main source of fresh water is groundwater, which needs rain to recharge. The fact that it has been raining less often, especially in Asir and Al-Bahah, suggests that the natural replenishment is slowing down. This trend is likely to increase reliance on nonrenewable fossil aquifers and desalination, with significant economic and environmental implications. At the same time, rainfall variability complicates agricultural planning, particularly in Al-Qassim and Hail, where steep declines could threaten rain-fed cultivation and heighten food security risks. Conversely, localized rainfall increases in Mecca and Tabuk raise flash-flood hazards, underscoring the dual challenge of managing both scarcity and excess. To address these emerging risks, policy and management responses should include enhanced early warning systems for extreme rainfall and flooding, adaptive irrigation scheduling and water-efficient technologies, artificial groundwater recharge projects, and continuous groundwater monitoring to detect stress on aquifers. Integrating rainfall variability analyses into Saudi Vision 2030 water and agricultural strategies will further support long-term resilience and sustainable resource management under a changing climate.
The evidence points toward a Saudi rainfall regime that is both in decline and in flux. The long-term trajectory is one of reduced rainfall, consistent with regional climate change projections, but the pathway is punctuated by periods of recovery and strong decadal oscillations, this aligns with observed climate patterns by Elfeki, Jarbou [30], Bucchignani et al. [50]. Hence, such thorough analysis of climate-related information is essential for understanding the effects of climate change on Earth’s systems and guiding adaptation efforts. As it plays a key role in tracking and evaluating long-term climate patterns, allowing researchers to pinpoint regions and hotspots most affected by climate change. It also aids in the creation of climate models and projections, which are valuable for predicting future climate conditions and their potential consequences. Additionally, such investigations help in assessing the success of adaptation strategies and policies, supporting informed, evidence-based decisions. Lastly, it establishes historical climate benchmarks, which are vital for evaluating changes in climate variables over time [3].
Observed multi-decadal declines and increased variability in seasonal rainfall are likely to reduce effective groundwater recharge and increase irrigation demand in affected catchments; the gravity recovery and climate experiment (GRACE) [51] and regional studies [52] show substantial groundwater storage declines in Arabian aquifers linked to reduced recharge and intensified extraction, which would amplify the impact of declining rainfall on agricultural water supply and long-term sustainability. Even modest declines in seasonal rainfall can reduce effective soil moisture and crop yields in arid environments; FAO syntheses [53] and recent assessments for Saudi Arabia [54] indicate that increased temperature and rainfall variability will raise crop water stress and threaten food system resilience unless adaptive irrigation and cropping strategies are implemented.
Several studies document an increasing contribution of intense rainfall events even as mean seasonal totals decline; this increases flash-flood risk in wadis and urban catchments (e.g., Jeddah), meaning agricultural and infrastructure vulnerability may rise despite lower average precipitation [42,55,56]. These hydrological and agricultural consequences underscore the need for watershed-scale adaptation—targeted groundwater management, crop selection and irrigation efficiency measures, and urban flood mitigation. Recent national-level initiatives (e.g., water-management reforms, afforestation/green initiatives) underscore the policy relevance of regionally explicit climate risk assessment [57].
3.5. Study Limitations
This study, though comprehensive, faces several limitations. Rainfall records across Saudi Arabia remain uneven in station density, especially in remote interior basins, which may obscure localized variability. Moreover, the analysis relies solely on ground-based rainfall data; the absence of satellite-derived estimates or high-resolution reanalysis datasets limits the ability to resolve small-scale convective and/or orographic events. Future research should evaluate station-based findings against reanalysis datasets such as ERA5-Land and satellite-derived products like CHIRPS, which could improve spatial completeness and offer independent validation of observed trends. The use of regional averages, while necessary for comparison, tends to smooth out microclimatic differences in wadies, escarpments, and highlands that may be hydrologically significant. Methodologically, the Mann–Kendall and Sen’s slope tests are effective for detecting monotonic trends but are less suited to capturing oscillatory or non-linear behavior driven by large-scale climate modes such as ENSO or the Indian Ocean Dipole (IOD). These methods were selected because they are non-parametric, robust to non-normality and missing data, and capable of providing both trend significance and magnitude, making them widely accepted for hydroclimatic studies. Alternative tests such as Pettitt, Buishand, and ITA focus on change-point detection or homogeneity rather than long-term monotonic trends, which align less with the objectives of this research. Finally, the study focuses on rainfall trends alone, without explicit coupling hydrological or climate models. Future research should incorporate hydrological modeling frameworks such as SWAT, VIC, or PCR-GLOBWB, in combination with climate scenario pathways (RCPs/SSPs), to assess how projected climatic changes may influence runoff generation, groundwater recharge, and water security. This integration would provide a deeper understanding of long-term water resource resilience in Saudi Arabia’s arid and hyper-arid environments.
4. Conclusions
The foundation of the present investigation into rainfall trends across the major watersheds of Saudi Arabia lies in the locally observed rainfall dataset obtained from the National Center for Meteorology (NCM), KSA—a reliable authority that operates the nation’s official weather stations. The dataset comprises 40 years of daily precipitation records (1982–2021) from the 13 administrative regions of the Kingdom, serving as a robust reference for assessing long-term climate variability and change. A long-term analysis of these records reveals that rainfall across Saudi Arabia has generally declined, with occasional recoveries and marked seasonal contrasts. Statistically significant negative trends were detected in ten of the thirteen regions, excluding the Eastern, Mecca, and Tabuk regions, as presented in Table 1. The most pronounced declines occurred in the central plateau and northern interior watersheds, while even the southwestern highlands—historically the most reliable rainfall zone—displayed strong signals of drying, as illustrated in Figure 2, Figure 3 and Figure 4. Specifically, the steepest declines were observed in Hail (−5.4 mm/yr) and Al-Qassim (−4.2 mm/yr), whereas Mecca and Tabuk exhibited slight positive signals in the last decade. These localized rebounds indicate the increasing influence of convective storms and Red Sea Trough dynamics in shaping recent rainfall behavior. Overall, the findings underscore the urgent need for region-specific and multi-scalar climate adaptation strategies that respond to both long-term drying and short-term variability. Seasonal rainfall trend analysis is particularly crucial, as it reveals hidden variability, links rainfall fluctuations to atmospheric drivers, and provides actionable insights for water management, agriculture, and disaster risk reduction. Reliance solely on annual or decadal averages may obscure critical shifts that directly affect communities, particularly in hyper-arid environments where rainfall is both scarce and highly variable.
These changes have big effects. Less rain threatens the recharge of groundwater, makes rain-fed farming harder, and adds to the stress on ecosystems. On the other hand, isolated increases make flash flooding more likely in watersheds that are already in danger. To address these problems, we need to look more closely at the atmospheric and oceanic factors that caused the changes we’ve seen and use high-resolution regional climate predictions to figure out how likely it is that things will grow worse because of climate change. Future research should utilize reanalysis and remote sensing products to elucidate sub-regional variability, particularly the dynamics of wadis, escarpments, and highlands that may diverge from regional averages. Coupled water–climate modeling under different emission pathways will be essential to translate rainfall trends into concrete scenarios of future water availability and hydrological risk. In general, Saudi Arabia’s rainfall patterns are changing in ways that are easy to see, such as extensive drying, seasonal redistribution, and isolated anomalies. These changes have big effects on water security and climate resilience. To protect the Kingdom’s water and agricultural systems from continuous climate change, they will need to be constantly monitored, have strong trend detection, and have integrated adaptation planning. These findings provide critical input for Saudi Arabia’s Vision 2030 water security strategy and emphasize the need for adaptive groundwater management.
Author Contributions
Conceptualization, A.A.A., M.E., N.A. and F.R.; data curation, M.E., N.A. and F.R.; formal analysis, M.E. and F.R.; investigation, M.E. and F.R.; methodology, M.E. and F.R.; project administration, A.A.A.; software, M.E. and F.R.; validation, M.E. and F.R.; visualization, M.E. and F.R.; writing—original draft, M.E. and F.R.; writing—review and editing, A.A.A., A.M., H.M.E.G., A.E.-S., M.E., N.A. and F.R. All authors have read and agreed to the published version of the manuscript.
Funding
This project was funded by the National Plan for Science, Technology and Innovation (MAARIFAH), King Abdulaziz City for Science and Technology, Kingdom of Saudi Arabia, award number (3-17-01-001-0011) and the APC was funded by (MAARIFAH).
Data Availability Statement
The data presented in this study are available on request from the corresponding author due to privacy restrictions.
Acknowledgments
This project was funded by the National Plan for Science, Technology and Innovation (MAARIFAH), King Abdulaziz City for Science and Technology, Kingdom of Saudi Arabia, award number (3-17-01-001-0011).
Conflicts of Interest
No conflicts of interest are declared by the authors in relation to the publication of this research.
References
- Rawat, A.; Kumar, D.; Khati, B.S. A review on climate change impacts, models, and its consequences on different sectors: A systematic approach. J. Water Clim. Change 2024, 15, 104–126. [Google Scholar] [CrossRef]
- Sukmara, R.B.; Wahab, M.F. Climate change in south Kalimantan (Borneo): Assessment for rainfall and temperature. J. Infrastruct. Plan. Eng. 2022, 1, 51–59. [Google Scholar] [CrossRef]
- Panja, A.; Garai, S.; Zade, S.; Sahani, S. Climate Data Extraction for Social Science Research: A Step by Step Process; ICAR: New Delhi, India, 2023. [Google Scholar]
- Liu, R.; Zhang, X.; Wang, W.; Wang, Y.; Liu, H.; Ma, M.; Tang, G. Global-scale ERA5 product precipitation and temperature evaluation. Ecol. Indic. 2024, 166, 112481. [Google Scholar] [CrossRef]
- Sa’adi, Z.; Shahid, S.; Ismail, T.; Chung, E.-S.; Wang, X.-J. Trends analysis of rainfall and rainfall extremes in Sarawak, Malaysia using modified Mann–Kendall test. Meteorol. Atmos. Phys. 2019, 131, 263–277. [Google Scholar] [CrossRef]
- Almazroui, M.; Islam, M.N.; Jones, P.D.; Athar, H.; Rahman, M.A. Recent climate change in the Arabian Peninsula: Seasonal rainfall and temperature climatology of Saudi Arabia for 1979–2009. Atmos. Res. 2012, 111, 29–45. [Google Scholar] [CrossRef]
- El-Rawy, M.; Fathi, H.; Zijl, W.; Alshehri, F.; Almadani, S.; Zaidi, F.K.; Aldawsri, M.; Gabr, M.E. Potential effects of climate change on agricultural water resources in Riyadh region, Saudi Arabia. Sustainability 2023, 15, 9513. [Google Scholar] [CrossRef]
- Kumar, V.; Jain, S.K.; Singh, Y. Analysis of long-term rainfall trends in India. Hydrol. Sci. J. 2010, 55, 484–496. [Google Scholar] [CrossRef]
- Kara, Y.; Yavuz, V.; Temiz, C.; Lupo, A.R. Exploring spatio-temporal precipitation variations in Istanbul: Trends and patterns from five stations across two continents. Atmosphere 2024, 15, 539. [Google Scholar] [CrossRef]
- Mbachu, I. Investigating precipitation pattern and variability in the Niger Delta: A statistical analysis of trends and change points (1972–2022). Bull. Geogr. Phys. Geogr. Ser. 2024, 27–43. [Google Scholar] [CrossRef]
- Vinay, H.; Ghosh, A.; Ojha, S.; Poddar, P.; Basak, P. Trend analysis of rainfall and detection of change point in Terai Zone of West Bengal. Int. J. Environ. Clim. Change 2024, 14, 603–613. [Google Scholar] [CrossRef]
- Almazroui, M. Changes in temperature trends and extremes over Saudi Arabia for the period 1978–2019. Adv. Meteorol. 2020, 2020, 8828421. [Google Scholar] [CrossRef]
- Dawood, M. Spatio-statistical analysis of temperature fluctuation using Mann–Kendall and Sen’s slope approach. Clim. Dyn. 2017, 48, 783–797. [Google Scholar] [CrossRef]
- Agbo, E.; Ekpo, C. Trend analysis of the variations of ambient temperature using Mann-Kendall test and Sen’s estimate in Calabar, southern Nigeria. J. Phys. Conf. Ser. 2021, 1734, 012016. [Google Scholar] [CrossRef]
- Alhaji, U.; Yusuf, A.; Edet, C.; Oche, C.O.; Agbo, E. Trend analysis of temperature in Gombe state using Mann Kendall trend test. J. Sci. Res. Rep. 2018, 20, 1–9. [Google Scholar] [CrossRef]
- Zeleke, T.T.; Zakaria Wani Lukwasa, A.; Ture Beketie, K.; Yayeh Ayal, D. Analysis of spatio-temporal precipitation and temperature variability and trend over Sudd-Wetland, Republic of South Sudan. Clim. Serv. 2024, 34, 100451. [Google Scholar] [CrossRef]
- Waqas, M.; Humphries, U.W.; Hlaing, P.T. Time series trend analysis and forecasting of climate variability using deep learning in Thailand. Results Eng. 2024, 24, 102997. [Google Scholar] [CrossRef]
- Sahu, N.; Nayan, R.; Panda, A.; Varun, A.; Kesharwani, R.; Das, P.; Kumar, A.; Mallick, S.K.; Mishra, M.M.; Saini, A. Impact of changes in rainfall and temperature on production of Darjeeling Tea in India. Atmosphere 2024, 16, 1. [Google Scholar] [CrossRef]
- Panda, A.; Sahu, N. Trend analysis of seasonal rainfall and temperature pattern in Kalahandi, Bolangir and Koraput districts of Odisha, India. Atmos. Sci. Lett. 2019, 20, e932. [Google Scholar] [CrossRef]
- Sridhara, S.; Gopakkali, P.; Nandini, R. Trend analysis of precipitation and temperature over different districts of Karnataka: An aid to climate change detection and cropping system option. Int. J. Environ. Clim. Change 2020, 10, 15–25. [Google Scholar] [CrossRef]
- Meskelu, E.; Ayana, M.; Birhanu, D. Analysis of long-term rainfall trend, variability, and drought in the Awash River Basin, Ethiopia. Theor. Appl. Climatol. 2024, 155, 9029–9050. [Google Scholar] [CrossRef]
- Rahman, G.; Kim, J.-Y.; Kim, T.-W.; Park, M.; Kwon, H.-H. Spatial and temporal variations in temperature and precipitation trends in South Korea over the past half-century (1974–2023) using innovative trend analysis. J. Hydro-Environ. Res. 2025, 58, 1–18. [Google Scholar] [CrossRef]
- Furl, C.; Sharif, H.; Alzahrani, M.; El Hassan, A.; Mazari, N. Precipitation amount and intensity trends across southwest Saudi Arabia. J. Am. Water Resour. Assoc. 2014, 50, 74–82. [Google Scholar] [CrossRef]
- Ahmad, N.; Ajmal, M.; Malik, A.; Rahman, Z.U. Meteorological trend analysis for Najd and Hejaz regions, Saudi Arabia. Meteorol. Atmos. Phys. 2022, 134, 35. [Google Scholar] [CrossRef]
- Alazba, A.A.; Mattar, M.A.; El-Shafei, A.; Radwan, F.; Ezzeldin, M.; Alrdyan, N. Comparative Analysis of ANN, GEP, and Water Advance Power Function for Predicting Infiltrated Water Volume in Furrow of Permeable Surface. Water 2025, 17, 1304. [Google Scholar] [CrossRef]
- Chowdhury, S.; Al-Zahrani, M. Implications of Climate Change on Water Resources in Saudi Arabia. Arab. J. Sci. Eng. 2013, 38, 1959–1971. [Google Scholar] [CrossRef]
- Radwan, F.; Alazba, A.A.; Mossad, A. Flood risk assessment and mapping using AHP in arid and semiarid regions. Acta Geophys. 2019, 67, 215–229. [Google Scholar] [CrossRef]
- Kottek, M.; Grieser, J.; Beck, C.; Rudolf, B.; Rubel, F. World map of the Köppen-Geiger climate classification updated. Meteorol. Z. 2006, 15, 259–263. [Google Scholar] [CrossRef]
- Alazba, A.A.; Mattar, M.A.; El-Shafei, A.; Ezzeldin, M.; Radwan, F.; Alrdyan, N. Water Demand Determination for Landscape Using WUCOLS and LIMP Mathematical Models. Water 2025, 17, 1429. [Google Scholar] [CrossRef]
- Elfeki, A.; Jarbou, B.; Muhammad, L.; Hannachi, A. Spatiotemporal analysis of monthly rainfall over Saudi Arabia and global teleconnections. Geomat. Nat. Hazards Risk 2022, 13, 2618–2648. [Google Scholar] [CrossRef]
- Radwan, F.; Alazba, A.A. Suitable sites identification for potential rainwater harvesting (PRWH) using a multi-criteria decision support system (MCDSS). Acta Geophys. 2023, 71, 449–468. [Google Scholar] [CrossRef]
- Elsherif, S.; El-Zawahry, A.; Soliman, A. Spatio-Temporal Rainfall Variability Analysis, Case Study: KSA. Int. J. Eng. Trends Technol. 2021, 69, 136–143. [Google Scholar] [CrossRef]
- Almazroui, M.; Islam, M.N.; Saeed, S.; Saeed, F.; Ismail, M. Future Changes in Climate over the Arabian Peninsula based on CMIP6 Multimodel Simulations. Earth Syst. Environ. 2020, 4, 611–630. [Google Scholar] [CrossRef]
- MEWA. National Water Strategy. Available online: https://www.mewa.gov.sa/en/Ministry/Agencies/TheWaterAgency/Topics/Pages/Strategy.aspx (accessed on 11 September 2025).
- Estrela, M.J.; Corell, D.; Miró, J.J.; Niclós, R. Analysis of precipitation and drought in the main southeastern Iberian river headwaters (1952–2021). Atmosphere 2024, 15, 166. [Google Scholar] [CrossRef]
- Uwizewe, C.; Jianping, L.; Habumugisha, T.; Bello, A.A. Investigation of the historical trends and variability of rainfall patterns during the March–May Season in Rwanda. Atmosphere 2024, 15, 609. [Google Scholar] [CrossRef]
- dos Santos, L.O.F.; Machado, N.G.; Biudes, M.S.; Geli, H.M.; Querino, C.A.S.; Ruhoff, A.L.; Ivo, I.O.; Lotufo Neto, N. Trends in Precipitation and Air Temperature extremes and their relationship with Sea Surface temperature in the Brazilian midwest. Atmosphere 2023, 14, 426. [Google Scholar] [CrossRef]
- Aditya, F.; Gusmayanti, E.; Sudrajat, J. Rainfall trend analysis using Mann-Kendall and Sen’s slope estimator test in West Kalimantan. Proc. IOP Conf. Ser. Earth Environ. Sci. 2021, 893, 012006. [Google Scholar] [CrossRef]
- Radwan, F.; Alazba, A.A.; Mossad, A. Watershed morphometric analysis of Wadi Baish Dam catchment area using integrated GIS-based approach. Arab. J. Geosci. 2017, 10, 256. [Google Scholar] [CrossRef]
- Radwan, F.; Alazba, A.A.; Mossad, A. Estimating potential direct runoff for ungauged urban watersheds based on RST and GIS. Arab. J. Geosci. 2018, 11, 748. [Google Scholar] [CrossRef]
- Radwan, F.; Alazba, A.A.; Mossad, A. Analyzing the geomorphometric characteristics of semiarid urban watersheds based on an integrated GIS-based approach. Model. Earth Syst. Environ. 2020, 6, 1913–1932. [Google Scholar] [CrossRef]
- Almazroui, M. Rainfall Trends and Extremes in Saudi Arabia in Recent Decades. Atmosphere 2020, 11, 964. [Google Scholar] [CrossRef]
- Luong, T.M.; Dasari, H.P.; Doan, Q.V.; Alduwais, A.K.; Hoteit, I. Organized precipitation and associated large-scale circulation patterns over the Kingdom of Saudi Arabia. Int. J. Climatol. 2024, 44, 3295–3314. [Google Scholar] [CrossRef]
- Al-Mutairi, M.; Abdel Basset, H.; Morsy, M.; Abdeldym, A. On the Effect of Red Sea and Topography on Rainfall over Saudi Arabia: Case Study. Atmosphere 2019, 10, 669. [Google Scholar] [CrossRef]
- Chakraborty, A.; Behera, S.K.; Mujumdar, M.; Ohba, R.; Yamagata, T. Diagnosis of tropospheric moisture over Saudi Arabia and influences of IOD and ENSO. Mon. Weather Rev. 2006, 134, 598–617. [Google Scholar] [CrossRef]
- Patlakas, P.; Stathopoulos, C.; Flocas, H.; Kalogeri, C.; Kallos, G. Regional Climatic Features of the Arabian Peninsula. Atmosphere 2019, 10, 220. [Google Scholar] [CrossRef]
- Hasanean, H.; Almazroui, M. Rainfall: Features and Variations over Saudi Arabia, A Review. Climate 2015, 3, 578–626. [Google Scholar] [CrossRef]
- Luong, T.M.; Dasari, H.P.; Attada, R.; Chang, H.I.; Risanto, C.B.; Castro, C.L.; Zampieri, M.; Vitart, F.; Hoteit, I. Rainfall climatology and predictability over the Kingdom of Saudi Arabia at subseasonal scale. Q. J. R. Meteorol. Soc. 2025, e5015. [Google Scholar] [CrossRef]
- Islam, M.N.; Zamreeq, A.O.; Ismail, M.; Habeebullah, T.M.A.; Ghulam, A.S. Jazan Rainfall’s Seasonal Shift in Saudi Arabia: Evidence of a Changing Regional Climate. Atmosphere 2025, 16, 300. [Google Scholar] [CrossRef]
- Bucchignani, E.; Mercogliano, P.; Panitz, H.-J.; Montesarchio, M. Climate change projections for the Middle East–North Africa domain with COSMO-CLM at different spatial resolutions. Adv. Clim. Change Res. 2018, 9, 66–80. [Google Scholar] [CrossRef]
- Seraphin, P.; Gonçalvès, J.; Hamelin, B.; Stieglitz, T.; Deschamps, P. Influence of intensive agriculture and geological heterogeneity on the recharge of an arid aquifer system (Saq–Ram, Arabian Peninsula) inferred from GRACE data. Hydrol. Earth Syst. Sci. 2022, 26, 5757–5771. [Google Scholar] [CrossRef]
- Alshehri, F.; Mohamed, A. Analysis of Groundwater Storage Fluctuations Using GRACE and Remote Sensing Data in Wadi As-Sirhan, Northern Saudi Arabia. Water 2023, 15, 282. [Google Scholar] [CrossRef]
- Turral, H.; Burke, J.; Faurès, J.-M. Climate Change, Water and Food Security; Food and Agriculture Organization of the United Nations (FAO): Rome, Italy, 2011. [Google Scholar]
- Rahman, M.M.; Akter, R.; Abdul Bari, J.B.; Hasan, M.A.; Rahman, M.S.; Abu Shoaib, S.; Shatnawi, Z.N.; Alshayeb, A.F.; Shalabi, F.I.; Rahman, A.; et al. Analysis of Climate Change Impacts on the Food System Security of Saudi Arabia. Sustainability 2022, 14, 14482. [Google Scholar] [CrossRef]
- Sefry, S.A.; El-Haddad, B.A.; AbuAlfadael, E.Y.; Youssef, A.M. Extreme Rainfall Events in Saudi Arabia as a Result of Climate Change: A Case Study: The Devastating Jeddah Flood on November 25, 2022. In Environmental Hazards in the Arabian Gulf Region: Assessments and Solutions; Abd el-aal, A.E.-A.K., Al-Enezi, A., Karam, Q.E., Eds.; Springer Nature: Cham, Switzerland, 2024; pp. 519–542. [Google Scholar] [CrossRef]
- Abdelkader, M.M.; Al-Amoud, A.I.; El Alfy, M.; El-Feky, A.; Saber, M. Assessment of flash flood hazard based on morphometric aspects and rainfall-runoff modeling in Wadi Nisah, central Saudi Arabia. Remote Sens. Appl. Soc. Environ. 2021, 23, 100562. [Google Scholar] [CrossRef]
- Jasechko, S.; Seybold, H.; Perrone, D.; Fan, Y.; Shamsudduha, M.; Taylor, R.G.; Fallatah, O.; Kirchner, J.W. Rapid groundwater decline and some cases of recovery in aquifers globally. Nature 2024, 625, 715–721. [Google Scholar] [CrossRef] [PubMed]
Disclaimer/Publisher’s Note: The statements, opinions and data contained in all publications are solely those of the individual author(s) and contributor(s) and not of MDPI and/or the editor(s). MDPI and/or the editor(s) disclaim responsibility for any injury to people or property resulting from any ideas, methods, instructions or products referred to in the content. |
© 2025 by the authors. Licensee MDPI, Basel, Switzerland. This article is an open access article distributed under the terms and conditions of the Creative Commons Attribution (CC BY) license (https://creativecommons.org/licenses/by/4.0/).

