Abstract
Marine heatwaves (MHWs) have been shown to exert a substantial influence on marine ecosystems and associated industries. Consequently, the development of accurate prediction models is imperative for mitigating ecological risks. This study concentrates on the East China Sea, employing sea surface temperature (SST) data from the OISST v2.1 dataset, which spans from 1982 to 2024, for the purpose of examining the spatial and temporal characteristics of six significant MHW indicators. The results reveal a clear annual increase in all six indicators. This study employed the deep learning-based SegRNN_ST model to forecast future MHW trends. It integrated a spatiotemporal attention mechanism and was optimized using mean absolute error (MAE) and mean squared error (MSE) as loss functions. And the coefficient of determination (R2) was utilized as a performance metric for predicting MHWs in the East China Sea. The findings indicate that the improved SegRNN_ST model increased the R2 by 8% compared to the original model, with MSE and MAE showing reductions of 20% and 15%, respectively. This study demonstrates fewer errors than SegRNN and enhanced accuracy in predicting MHWs. This study introduces a new method for predicting and providing early warnings of MHWs, improving the accuracy of forecasts for extreme marine weather events.
1. Introduction
Marine heatwaves (MHWs) are defined by the occurrence of elevated seawater temperatures, wherein the sea surface temperature (SST) surpasses a predetermined threshold. The phenomena have the capacity to extend over thousands of kilometers and persist for a duration ranging from several days to several months [1]. They induce substantial and enduring impacts on marine ecosystems, including rapid habitat loss, decline in kelp forests, extensive seagrass diminution, coral bleaching, harmful algal blooms, and significant reductions in fish, seabird, and marine mammal populations. In addition, these phenomena have been shown to have a significant negative impact on the yield of fisheries and aquaculture [2,3,4,5,6,7,8]. A prominent warming trend is evident in the SST of the East China Sea, with an acceleration rate that substantially surpasses the global mean. Monitoring and analyzing characteristics and forecasting future MHWs in this area are pivotal within marine scientific research concerning global warming [9,10,11]. The impact of MHWs on marine ecosystems has been shown to be both extensive and enduring. Furthermore, they have the capacity to exert a substantial influence on regional climates by modifying ocean–atmosphere interactions. This effect stands in contrast to the gradual, long-term increase in ocean surface temperatures. Precise prediction of the spatiotemporal progression of MHWs is imperative for ecological preservation and disaster mitigation [11,12,13,14].
Recent advancements in deep learning technology have demonstrated substantial benefits in predicting marine environments [15,16]. Utilizing multi-source satellite data, Chen et al.’s TemproNet model [17] forecasts subsurface temperatures in the South China Sea. In TemproNet, a transformer is employed as an encoder. The results indicate that the TemproNet model achieves an RMSE of 0.52 °C and an R2 value of 0.83 in predicting temperature profiles within the upper 200 m of the South China Sea. Sun et al. [18] merged real-time weather prediction models that cover periods from 2 weeks to 1 year with a convolutional neural network (CNN) to improve the accuracy of forecasts. This underscores the advantages of integrating physical models with deep learning techniques in marine forecasting. The appropriateness of transformers for predicting variations in ocean temperature remains a subject of debate [19,20,21]. Recent advancements have led to substantial progress in our understanding of the spatial distribution characteristics, evolving patterns, and developmental mechanisms of MHWs. Nevertheless, the accurate forecasting of MHW events remains a formidable challenge [22]. The enhancement of the precision of MHWs forecasts is imperative for the timely dissemination of disaster warnings and the effective mitigation of ecological impairment. Improving the accuracy and timeliness of heatwave forecasts can shift disaster response from reactive to proactive. Precise early warnings create critical windows for ecosystem protection, enabling targeted interventions such as precision irrigation, endangered species relocation, wetland water replenishment, and preventive fire control. This effectively reduces risks of irreversible damage—including forest fires, biological mortality, and habitat loss—while significantly enhancing ecosystems’ climate resilience.
This study examines the East China Sea, utilizing deep learning techniques to combine spatiotemporal attention mechanisms with long-term SST data, which improves the effectiveness of the SegRNN model. The study examines the patterns and evolution of marine heatwaves across spatial and temporal dimensions, along with predictions of sea surface temperatures. This study proposes a novel approach and scientific framework for forecasting MHWs within future climate warming scenarios. It provides technical assistance for the establishment of early warning systems and ecological conservation strategies.
2. Materials and Methods
2.1. Study Area
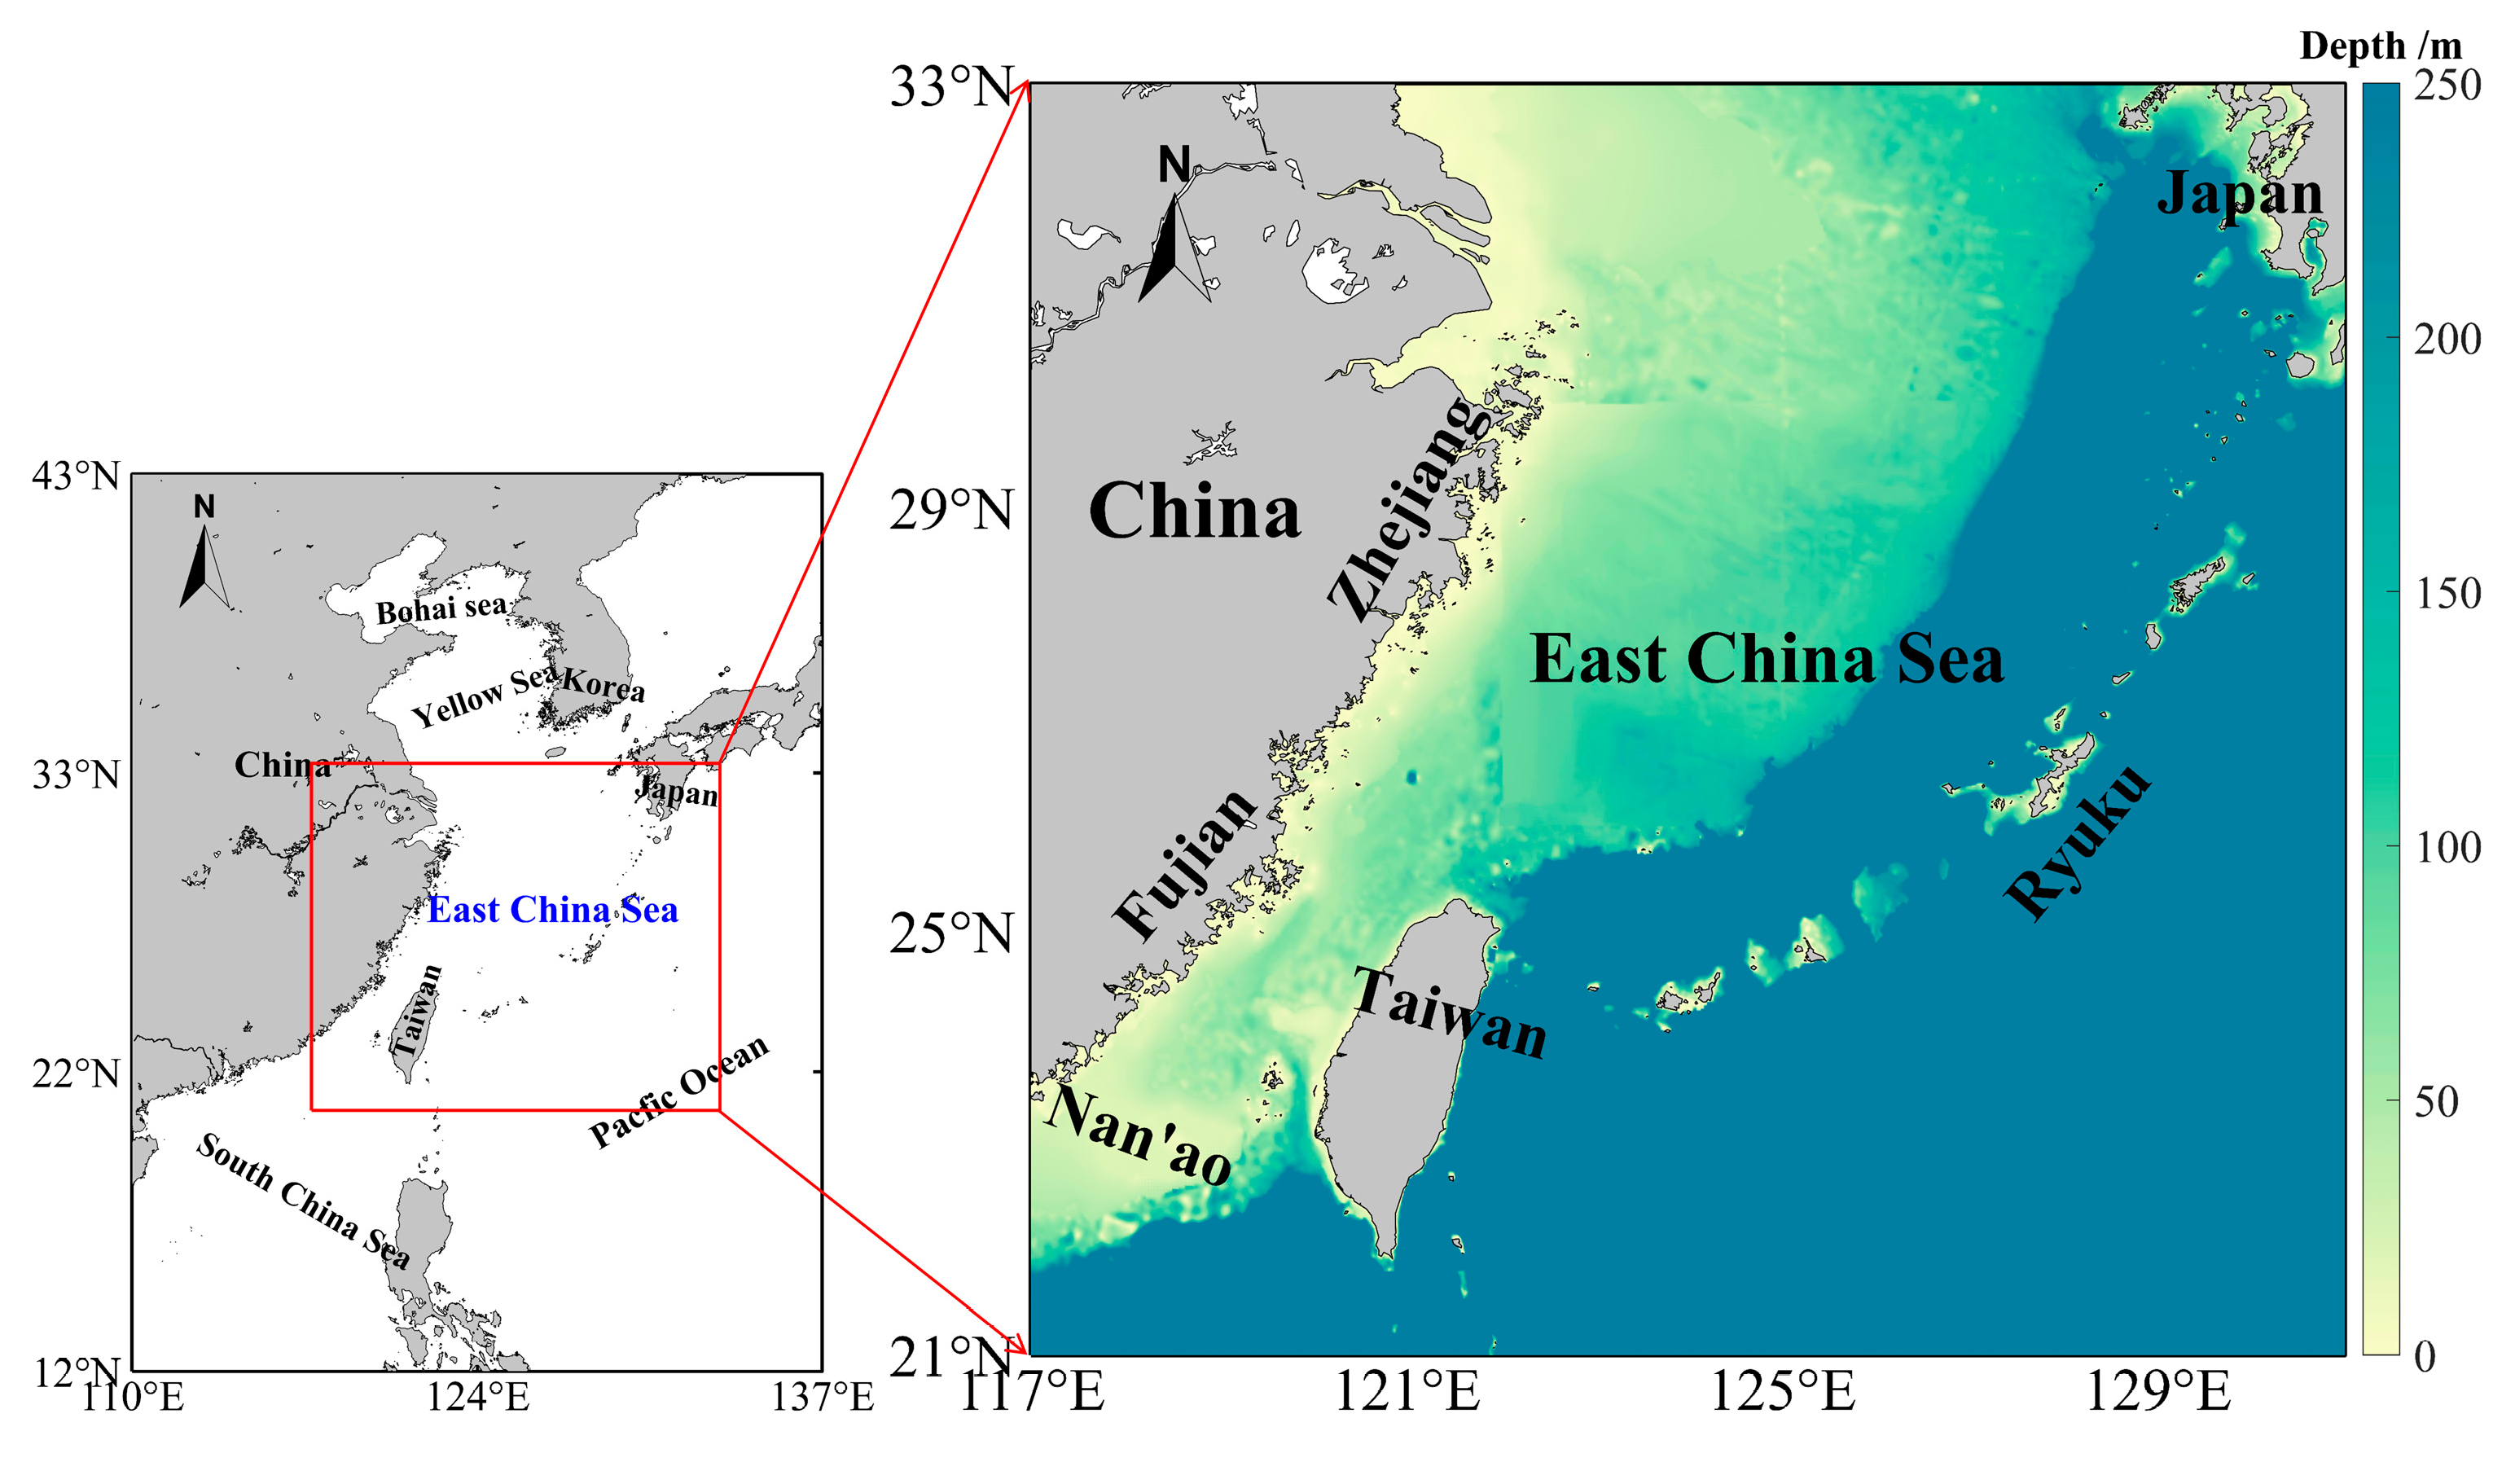
The East China Sea is bordered by the Yellow Sea to the north, the Ryukyu Islands and the Pacific Ocean to the east, the Taiwan Strait to the south, and the Chinese mainland to the west. Covering an area exceeding 770,000 square kilometers, its geographic coordinates extend from 21°54.0′ to 33°11.1′ north latitude and from 117°08.9′ to 131°00.0′ east longitude. It is a marginal sea within the northwest Pacific Ocean, in the eastern part of the Eurasian continent (see Figure 1). The region is distinguished by a multitude of river mouths, bays, and extensive shallow continental shelves, as well as a diverse array of marine ecosystems that are rich in biological resources. These features are further compounded by its transition through tropical, subtropical, and temperate zones, thus exhibiting a pronounced biodiversity gradient. The sea plays a crucial role in the long-term socioeconomic development of China’s coastal regions. It is also among the most vulnerable areas to climate change due to its location within the East Asian monsoon zone, where it is significantly affected by variations in the East Asian monsoon system, including the West Pacific subtropical high-pressure system and the East Asian winter and summer monsoons. Furthermore, the Kuroshio Current—one of the world’s largest subtropical boundary currents—exerts a significant influence, with fluctuations in its strength impacting the region [23]. Over recent decades, the marine environment of the East China Sea has undergone notable changes, largely due to its unique geographic characteristics, climatic conditions, and intense human activity. These alterations include observable warming, frequent marine heatwaves, eutrophication, harmful algal blooms, and declines in biodiversity and marine resources [24]. The prevalence and intensity of marine heatwaves have exhibited a marked increase in recent years, a phenomenon that has been predominantly attributed to global warming. This environmental change has had significant ramifications for various aspects of coastal ecosystems, including fisheries, marine habitats, and socioeconomic activities in these regions.
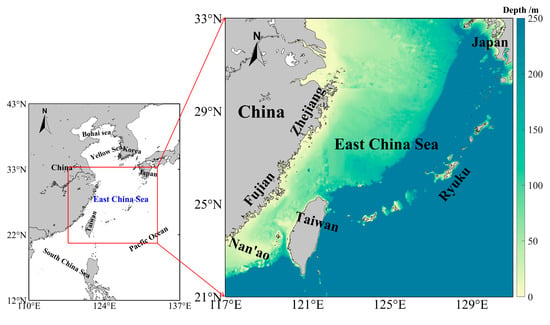
Figure 1.
Study area (water depth data from NOAA https://www.ncei.noaa.gov/products/etopo-global-relief-model/ accessed on 15 July 2025).
2.2. Marine Heatwave
Hobday et al. [1] define MHWs as extreme SST events occurring in specific marine regions. These events are characterized by daily SSTs surpassing a threshold set at the 90th percentile of SST during the climate baseline period, which spans from 1982 to 2011, for a minimum duration of five consecutive days. When the interval between two successive events is less than two days, they are regarded as a single MHW event. The evaluation of MHWs encompasses a multifaceted analysis that considers their intensity, duration, and spatial extent. These elements serve as pivotal indicators of their impacts. Recent observations indicate a marked increase in the frequency, severity, and duration of MHWs, primarily attributable to the intensification of global warming. This study evaluates six indicators of MHWs: average intensity, maximum intensity, cumulative intensity, duration, frequency, and total number of days. Detailed definitions of each indicator are provided in Table 1. The study calculated the average variations in these six indicators for each MHW event in the East China Sea from 1982 to 2024 and analyzed their interannual fluctuations.

Table 1.
Meaning of marine heatwave index.
2.3. OISST v2.1
This study employed the NOAA’s Optimal Interpolation SST Version 2.1 (OISST v2.1) dataset to identify MHWs [25,26,27]. The dataset comprises global observations collected from satellites, ships, and buoys, which were interpolated to produce SST maps. Buoy data were adjusted for platform discrepancies and sensor biases in satellite and ship observations [28,29,30]. This research utilizes SST data with a spatial resolution of 0.25° and a daily temporal resolution, covering the period from January 1982 to December 2024.
2.4. SegRNN_ST Model and Evaluation
2.4.1. SegRNN_ST Model
To accurately predict the spatiotemporal evolution trends of marine heatwaves in the East China Sea, this paper proposes an improved SegRNN_ST (Segment Recurrent Neural Network for Spatiotemporal modeling) model. Specifically designed for long-time-series ocean environmental data, its core employs segmentation techniques to divide lengthy sea surface temperature time series into multiple segments, significantly enhancing the model’s training and inference efficiency.
Architecturally, the encoder employs bidirectional gated recurrent units to simultaneously capture both “past-to-future” and “future-to-past” dependencies in heatwave evolution, thereby enhancing understanding of their generation and dissipation processes. To characterize the spatial co-occurrence and temporal persistence of heatwaves, the model introduces a decoupled spatiotemporal attention mechanism. This mechanism separately quantifies the instantaneous spatial correlations between different marine stations and the temporal dependencies within the same location during the heatwave persistence process.
During decoding and prediction, the model employs a parallel multi-step prediction strategy, directly outputting the entire future prediction period’s heatwave state. This effectively avoids the error accumulation issues inherent in traditional recurrent predictions, ensuring stable forecast outcomes. In summary, the SegRNN_ST model achieves efficient and precise simulation and prediction of the complex spatiotemporal phenomenon of marine heatwaves through its unique structural design. The specific architecture and computational principles of the model are detailed in Appendix A.
2.4.2. Normalization and Evaluation
SegRNN_ST tackles the challenge of distribution shift in time-series data by implementing a simple normalization process on the input sequence prior to encoding. Subsequently, the normalized values are reintegrated following decoding. The calculation formulas are delineated in Equations (1) and (2).
Additionally, the model utilizes mean absolute error (MAE) and mean squared error (MSE) as loss functions to address the common occurrence of noise or extreme values in ocean temperature data, such as instrument malfunctions or short-term heatwave events, while the coefficient of determination (R2) is used as the evaluation metric. MAE exhibits reduced sensitivity to outliers due to its linear increase in loss (L1 norm), which helps avoid gradient explosion or major fluctuations. The formulas for these calculations are provided in Equations (3)–(5).
In Equations (1)–(5), represents the meaning, while denotes the predicted value. Furthermore, to assess the stability of model fit quality, we calculated the 95% confidence interval for the evaluation metric using the bootstrap method (based on 5000 repeated samples).
3. Results
3.1. Spatial Distribution Characteristics of MHWs
The East China Sea, a semi-enclosed shelf sea in the northwest Pacific Ocean exhibiting tropical, subtropical, and temperate characteristics, possesses a thermodynamic environment profoundly shaped by the intrusion of warm Kuroshio Current waters, modulation by the East Asian monsoon, and massive freshwater dilution from rivers. This unique combination creates a natural breeding ground for marine heatwaves (MHWs). Against the backdrop of persistent global warming, this region exhibits a pronounced trend of sea surface warming. However, significant gaps remain in our systematic understanding of the generation mechanisms, evolutionary patterns, and ecological impacts of MHW—an extreme thermal event within this context [31]. Therefore, elucidating the spatiotemporal patterns and dynamic drivers of MHW within this complex system is not only crucial for revealing the regional ocean’s response and feedback to global warming but also holds urgent practical significance for predicting and mitigating the ecological stress it imposes.
3.1.1. Spatial–Temporal Variation Characteristics
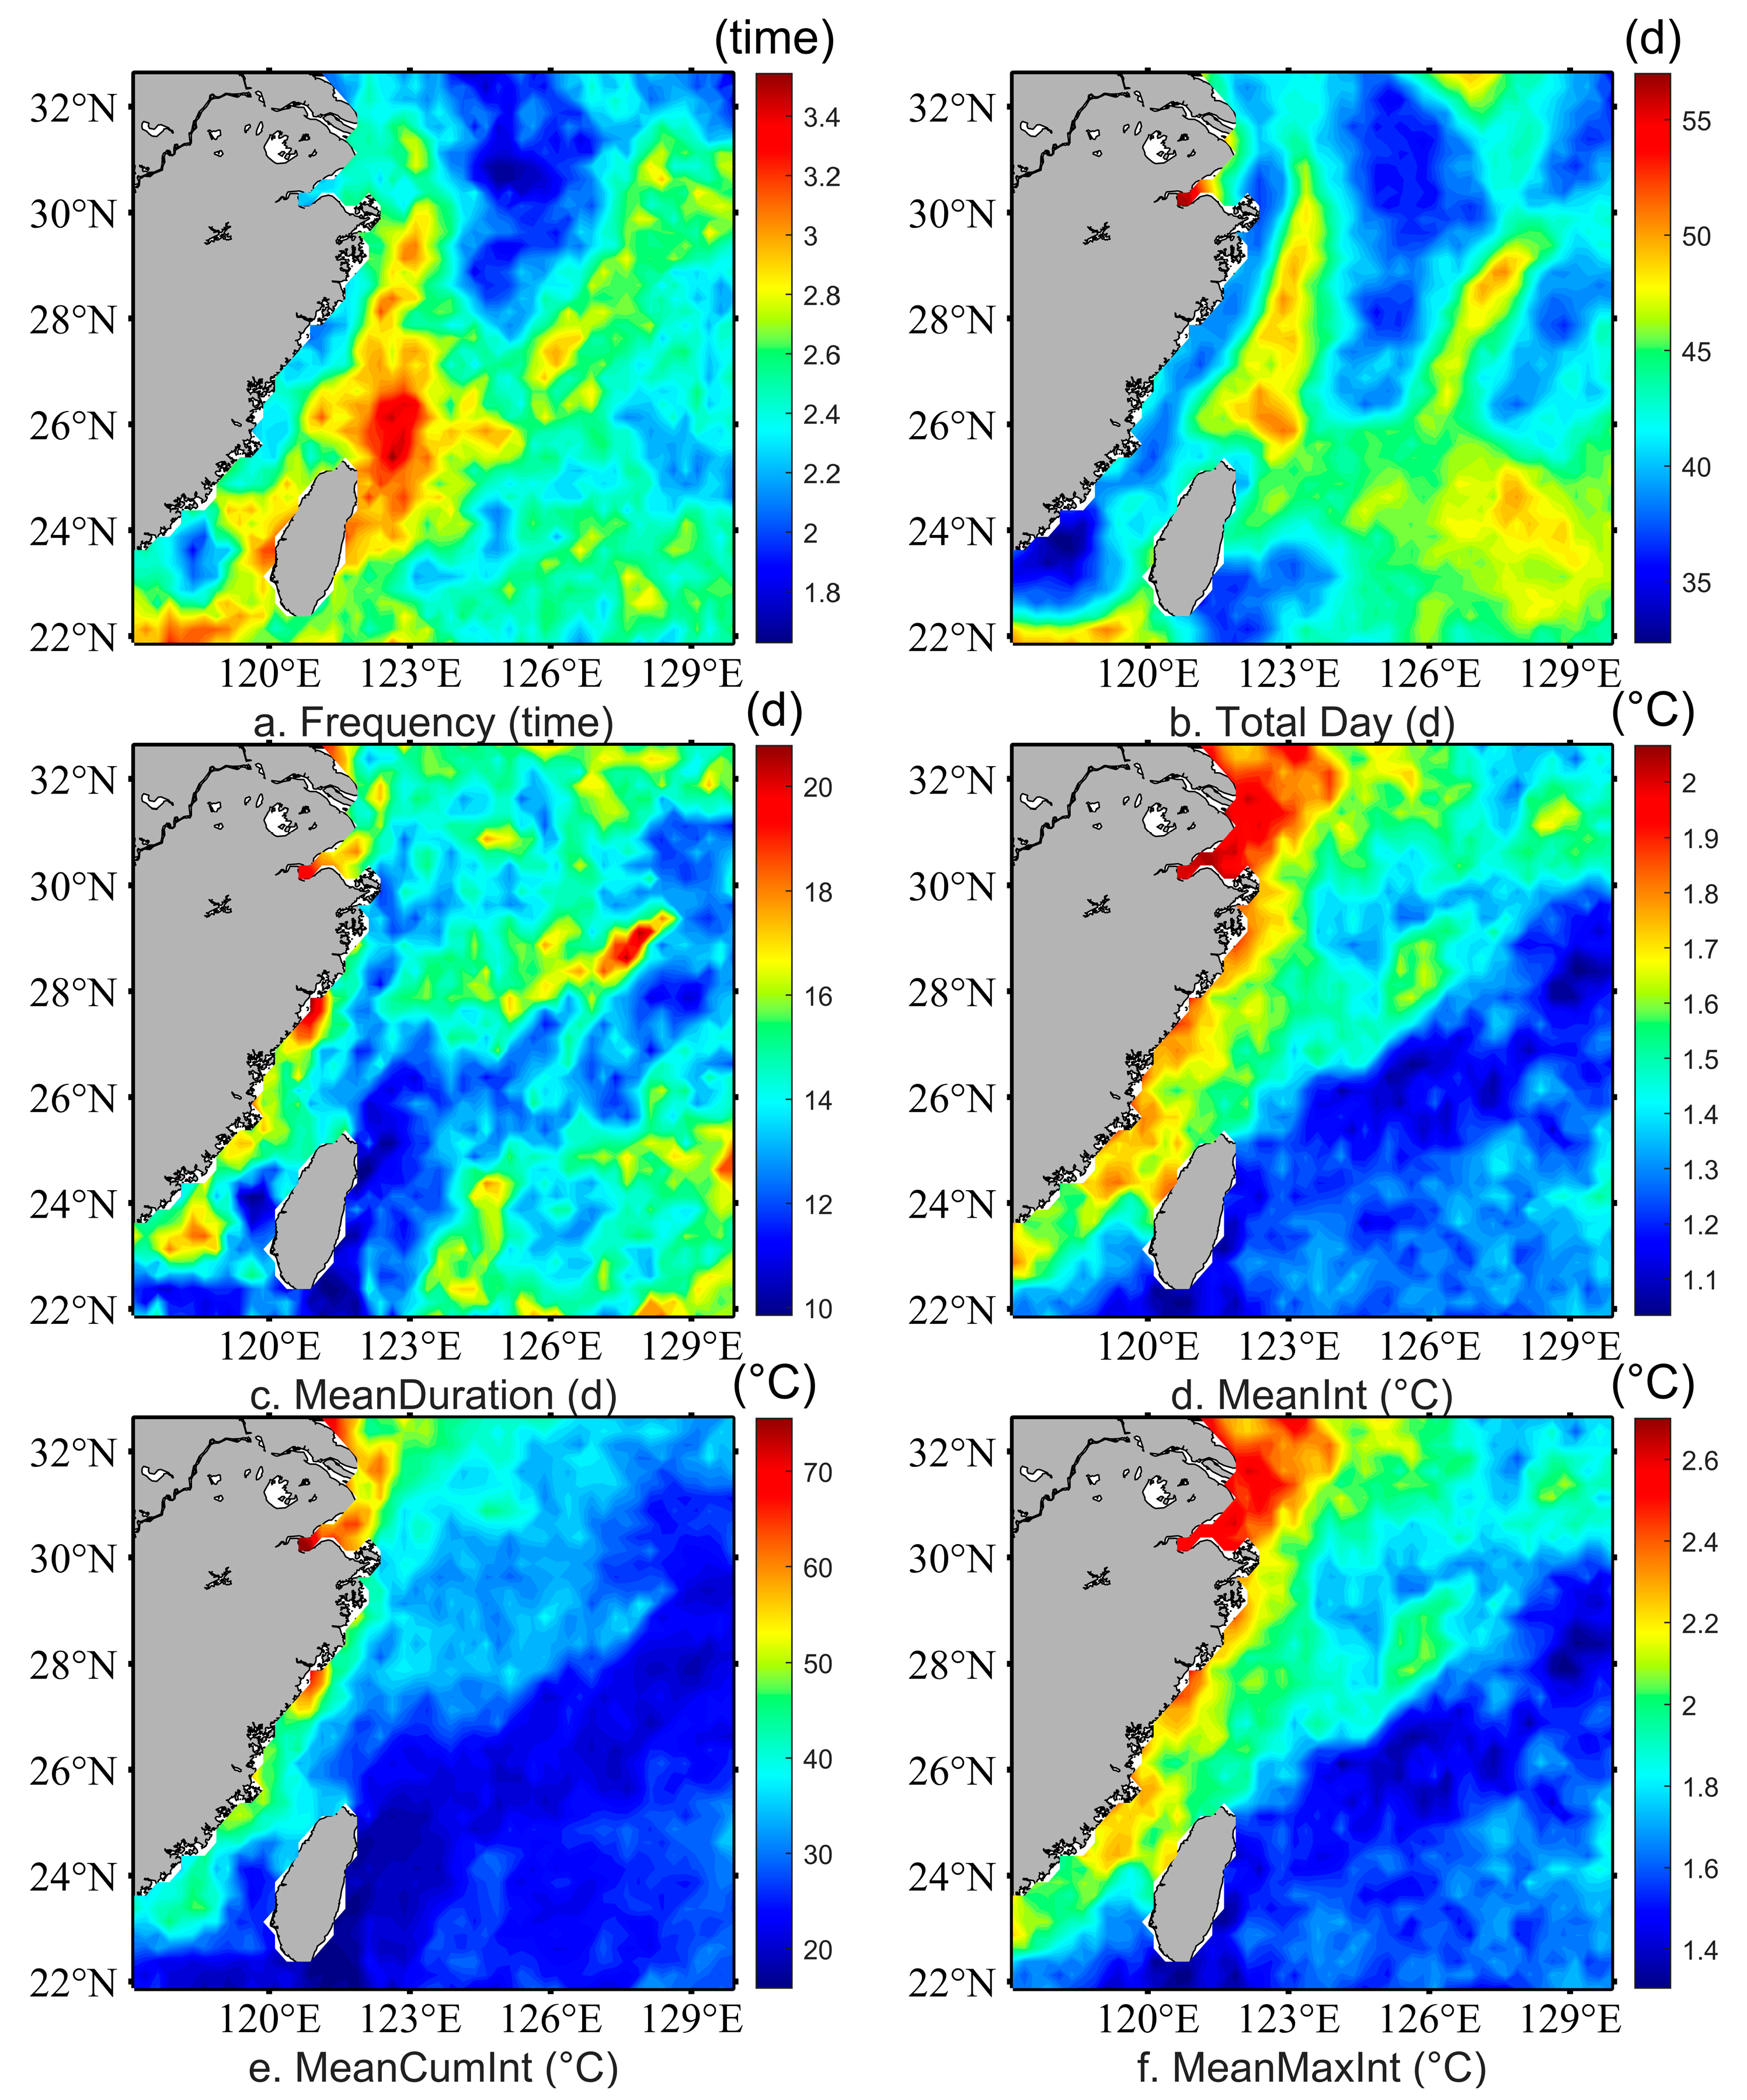
This study investigates changes in surface ocean heatwaves within the East China Sea from 1982 to 2024, utilizing SST data from 1982 to 2011 as the 30-year baseline for the historical climate. Figure 2 presents the analysis outcomes. The figure delineates various metrics associated with MHWs: Figure 2a illustrates the annual average frequency, Figure 2b displays the total number of days, Figure 2c depicts the average duration, Figure 2d indicates the average intensity, Figure 2e summarizes the cumulative intensity, and Figure 2f shows the maximum intensity. The spatial distribution of MHW occurrences across the East China Sea exhibits considerable variability, with an average of 1–4 events per year (Figure 2a). Regions with a high frequency of events, defined as more than three occurrences per year, are primarily located on the continental shelf slope fold zone north of Taiwan and near the Dongsha Islands. These regions are also found in waters west of the Ryukyu Islands. These areas are subject to influences from the branches of the Kuroshio Current and topographic uplift (the topographic uplift effect refers to the dynamic and thermal processes generated when air currents encounter mountainous terrain and are forced to climb along the windward slope), which contribute to persistent temperature anomalies [32]. Conversely, regions experiencing lower frequency—1–2 events per year—are mainly located in the northern mid-latitude waters of the East China Sea and along the Chinese mainland coast. We can attribute this distribution pattern to the temperature buffering effects of coastal upwelling and freshwater input [33].
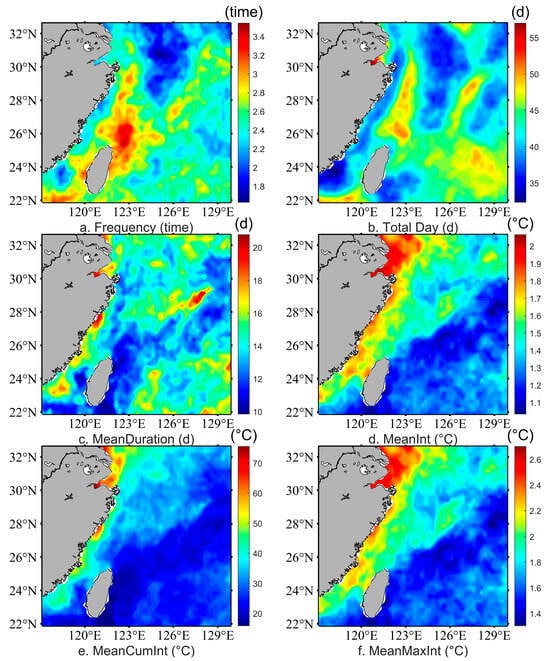
Figure 2.
The spatial variation characteristics of MHWs in the East China Sea from 1982 to 2024. (a) Annual average occurrence frequency of MHWs; (b) annual average total number of days of MHWs; (c) annual average duration of MHWs; (d) annual average intensity of MHWs; (e) annual average cumulative intensity of MHWs; (f) annual average maximum intensity of MHWs.
The total number of MHW days, as shown in Figure 2b, and their occurrence frequency indicate a distinct spatial pattern, with increased event frequencies noted in areas with longer cumulative durations (30–50 days per year). These areas encompass the central East China Sea and several offshore locations. MHWs in this region occur frequently but are limited in total annual days, generally much lower than those seen in the high-frequency zone of the central East China Sea. This disparity shows that heatwave events near the Taiwan Strait happen frequently but are short-lived, marked by sudden, brief episodes of limited duration. In the outer sea area of the Yangtze River estuary, 1–2 events occur each year, with some lasting more than 15 days (refer to Figure 2c). The occurrence of extended single events is linked to the distinct physical processes of the shallow shelf sea, characterized by notable thermal inertia and stable stratification in summer.
The analysis of the intensity index (Figure 2d–f) indicates that the mean intensity of MHWs in the East China Sea varies from 1 to 2 °C, with peak intensities surpassing 2.5 °C. The MHW event off the Yangtze River estuary in September 2023 persisted for 29 days, attaining a maximum intensity of 2.76 °C. Both instances demonstrate a distribution pattern characterized by higher intensities near the coast and lower intensities in the open sea. The offshore region of the Yangtze River estuary exhibits zones of extreme intensity, with average intensities exceeding 1.8 °C and maximum intensities surpassing 2.5 °C. This phenomenon is associated with the shallow warm cap effect caused by freshwater discharge from the Yangtze River, the rising coastal water temperatures attributable to human activities, and surface heat accumulation driven by the summer monsoon [34]. The spatial gradient of cumulative intensity is most pronounced, ranging from 20 to 70 °C, decreasing from the continental shelf toward the Okinawa Trough, indicating the continental shelf’s capacity to retain heat in shallow waters.
3.1.2. Analysis of MHWs’ Changing Trend
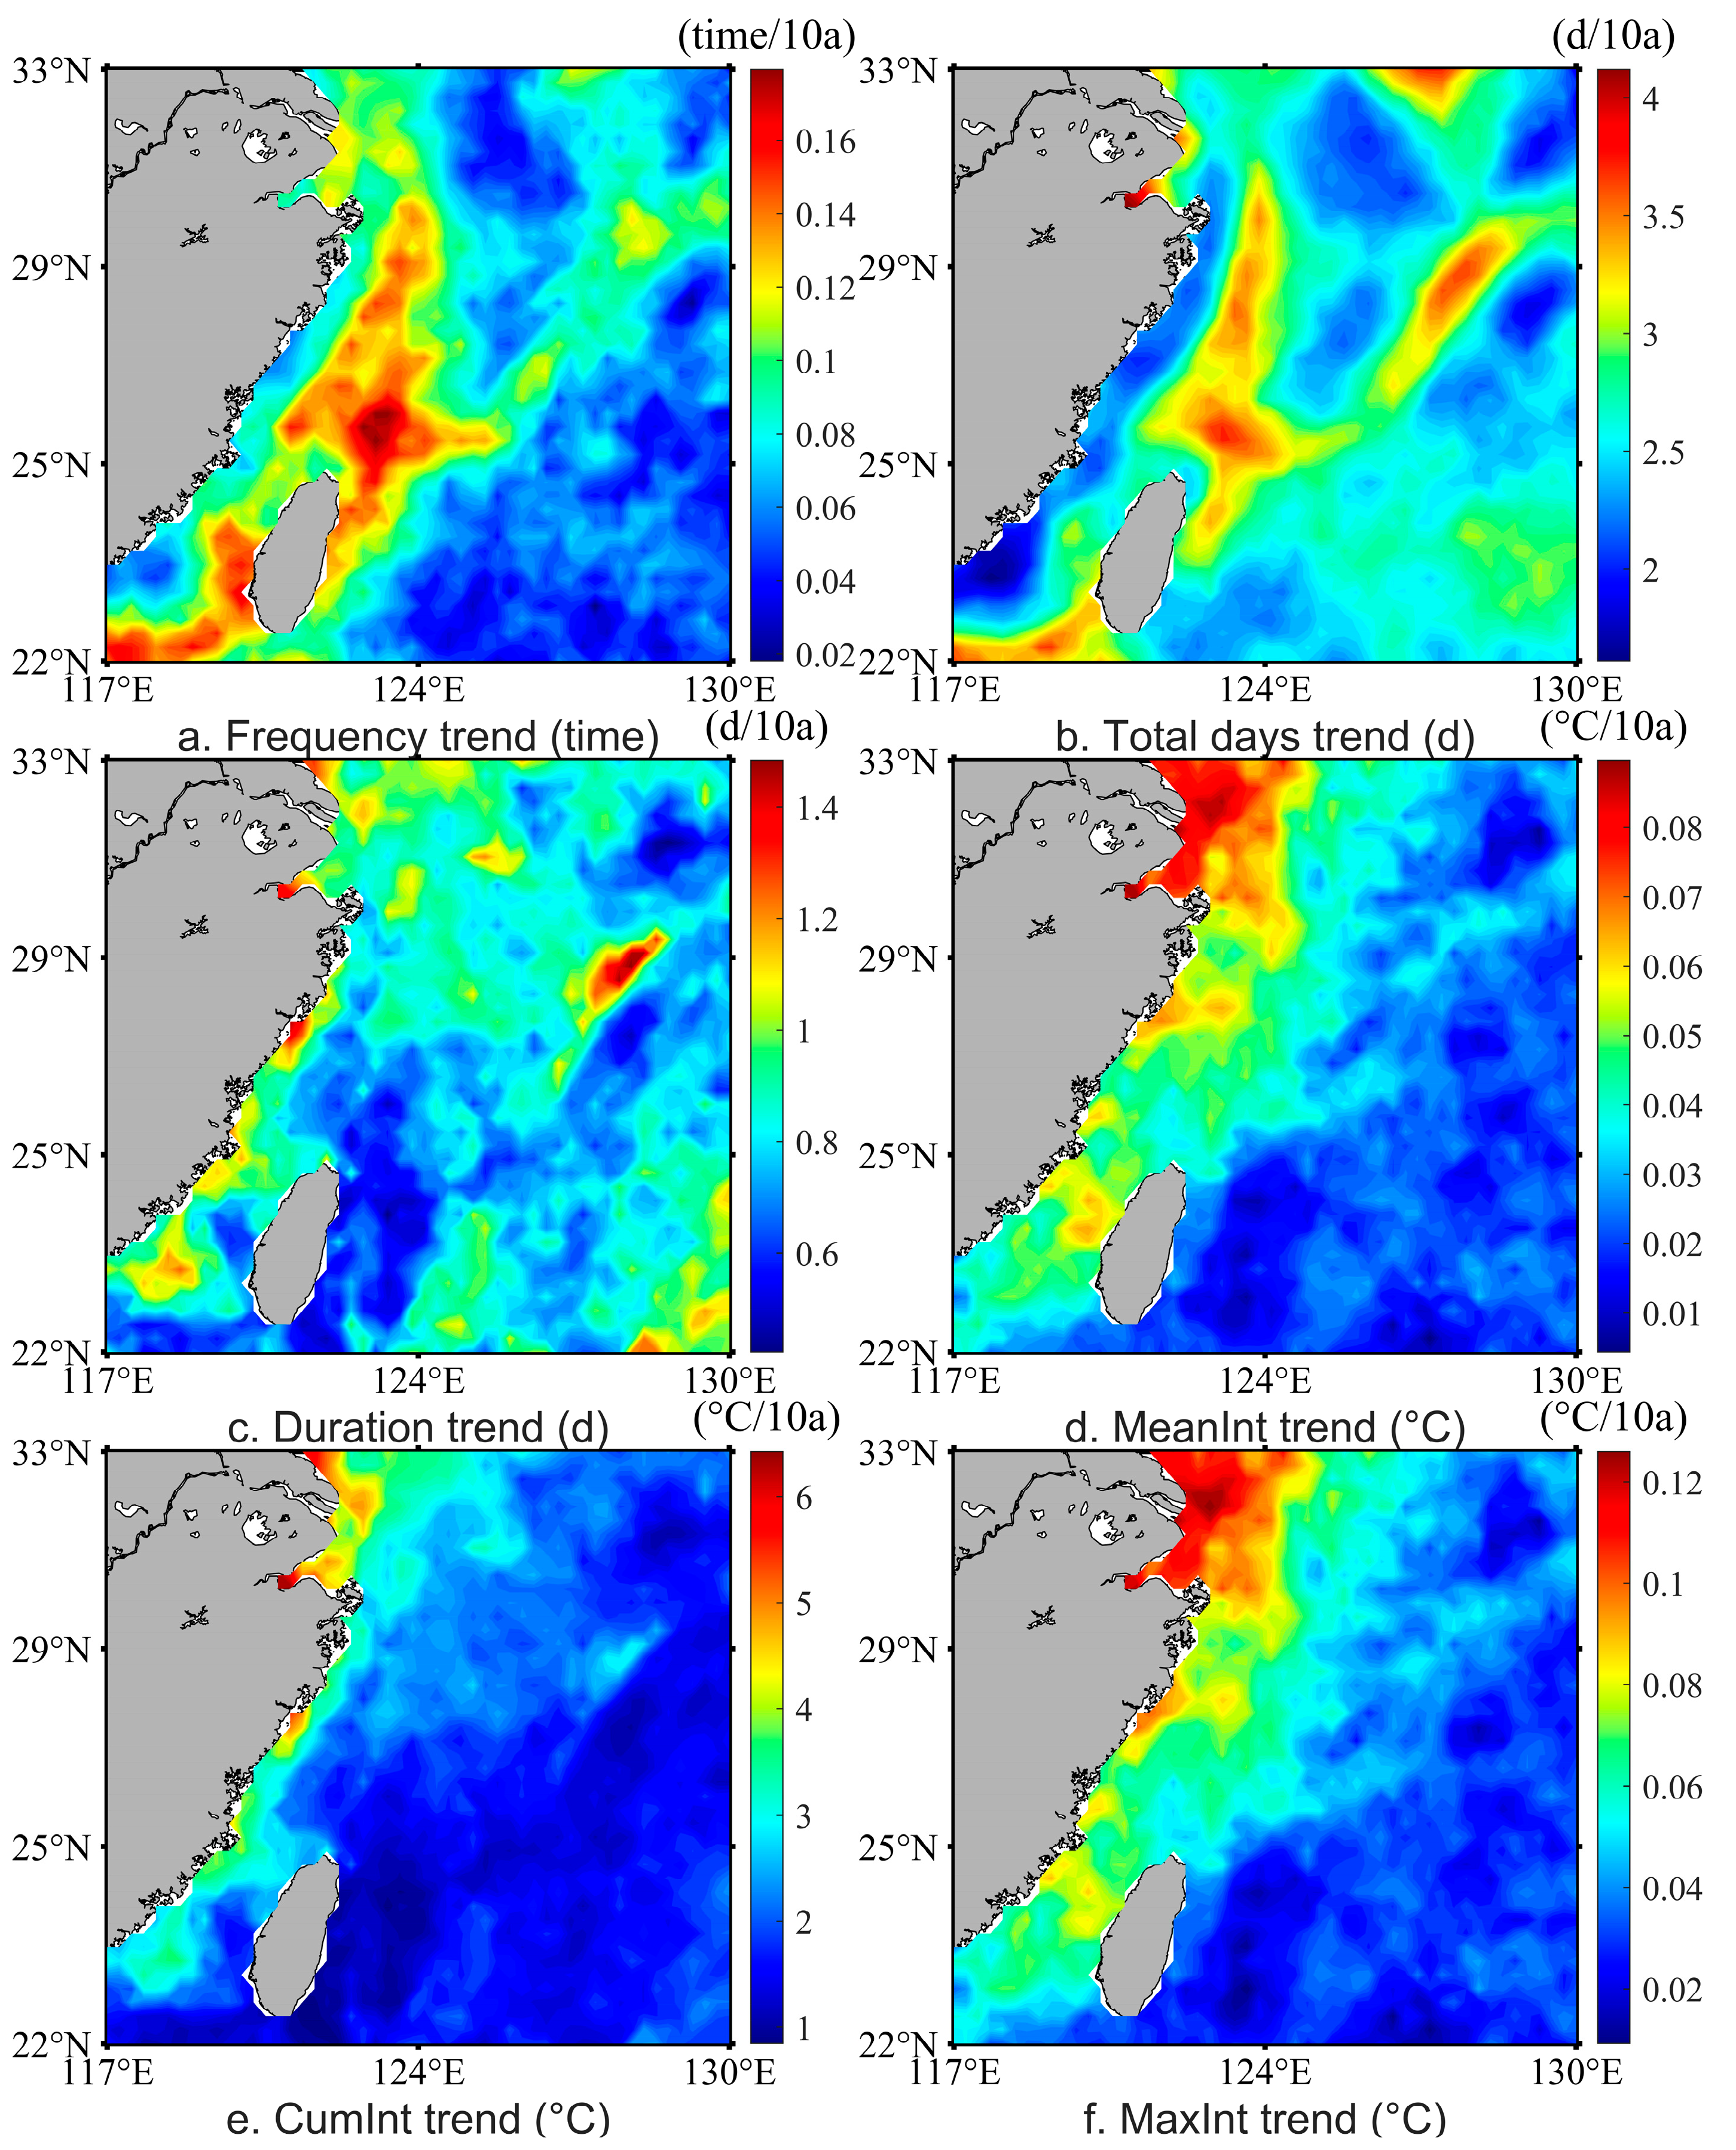
Recent studies show that significant and ongoing warming is affecting the global ocean. Each decade over the past fifty years has recorded higher temperatures than the previous one. Ocean heat content reached a record high in 2022, making it the warmest year since modern ocean observations began [35,36]. This trend reflects the intensification of global climate change and underscores the impact of human activities on marine ecosystems. The East China Sea, an important region of the northwest Pacific Ocean, has seen notable changes in its marine environment, especially during MHWs. A trend analysis was performed on the interannual variations in six MHW indicators in the East China Sea, using SST data from 1982 to 2024 (Figure 3). The least squares method was applied to examine the interannual fluctuations across these six indicators.
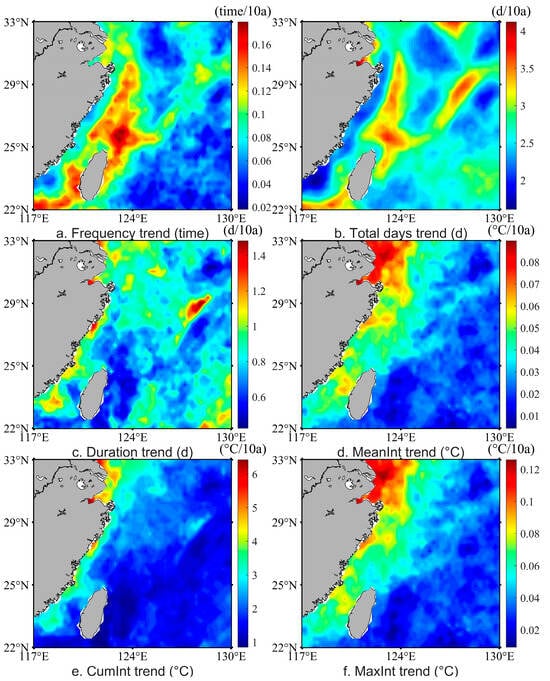
Figure 3.
Linear trends in MHW indicators in the East China Sea from 1982 to 2024. (a) Annual occurrence frequency of MHWs; (b) annual total number of days of MHWs; (c) annual duration of MHWs; (d) annual intensity of MHWs; (e) annual cumulative intensity of MHWs; (f) annual maximum intensity of MHWs.
Figure 3a illustrates that the frequency of MHWs in the East China Sea has demonstrated a linear upward trend, increasing from 0.02 to 0.16 occurrences per year between 1982 and 2024. Notable enhancements were observed south of the Taiwan Strait near the Dongsha Islands, north of Taiwan Island, and west of the Ryukyu Islands near Chiwei Yu. Figure 3b indicates that the annual total number of MHW days has risen linearly by 1.5 to 6 days, with the spatial distribution primarily conforming to the linear trend in occurrence frequency. A distinctive pattern was identified in the waters adjacent to the Yangtze River estuary, where, despite minimal fluctuations in occurrence frequency, there was a significant increase in the total number of MHW days annually. This phenomenon can be ascribed to the thermodynamic effects of freshwater discharge from the Yangtze River on the local marine environment [37]. Figure 3c demonstrates that the mean duration of individual MHW events is increasing at a rate of 0.4 to 1.4 days per year, a trend that is particularly prominent in coastal waters near the mainland. This escalation is correlated with the reduction in coastal upwelling or local temperature elevations induced by anthropogenic activities [38].
The average intensity of MHWs increases annually by 0.01 to 0.09 °C (Figure 3d), with the most substantial increases observed in the high-latitude waters of the East China Sea, particularly north of the Yangtze River estuary. The maximum intensity of MHWs exhibits an annual increase of 0.02 to 0.12 °C (Figure 3f), with its spatial distribution closely mirroring the linear trend of the average intensity. The cumulative intensity of MHWs shows an annual increase of 1 to 7 °C (Figure 3e), with SST anomalies predominantly concentrated near the Yangtze River estuary. This escalation is primarily associated with the influence of nutrients and suspended particles introduced by the Yangtze River freshwater discharge on surface heat exchange mechanisms [39]. All six indicators of MHWs within the East China Sea demonstrate significant linear increasing trends, aligning with the global trajectory of ocean heatwaves, with growth rates surpassing the global average [40].
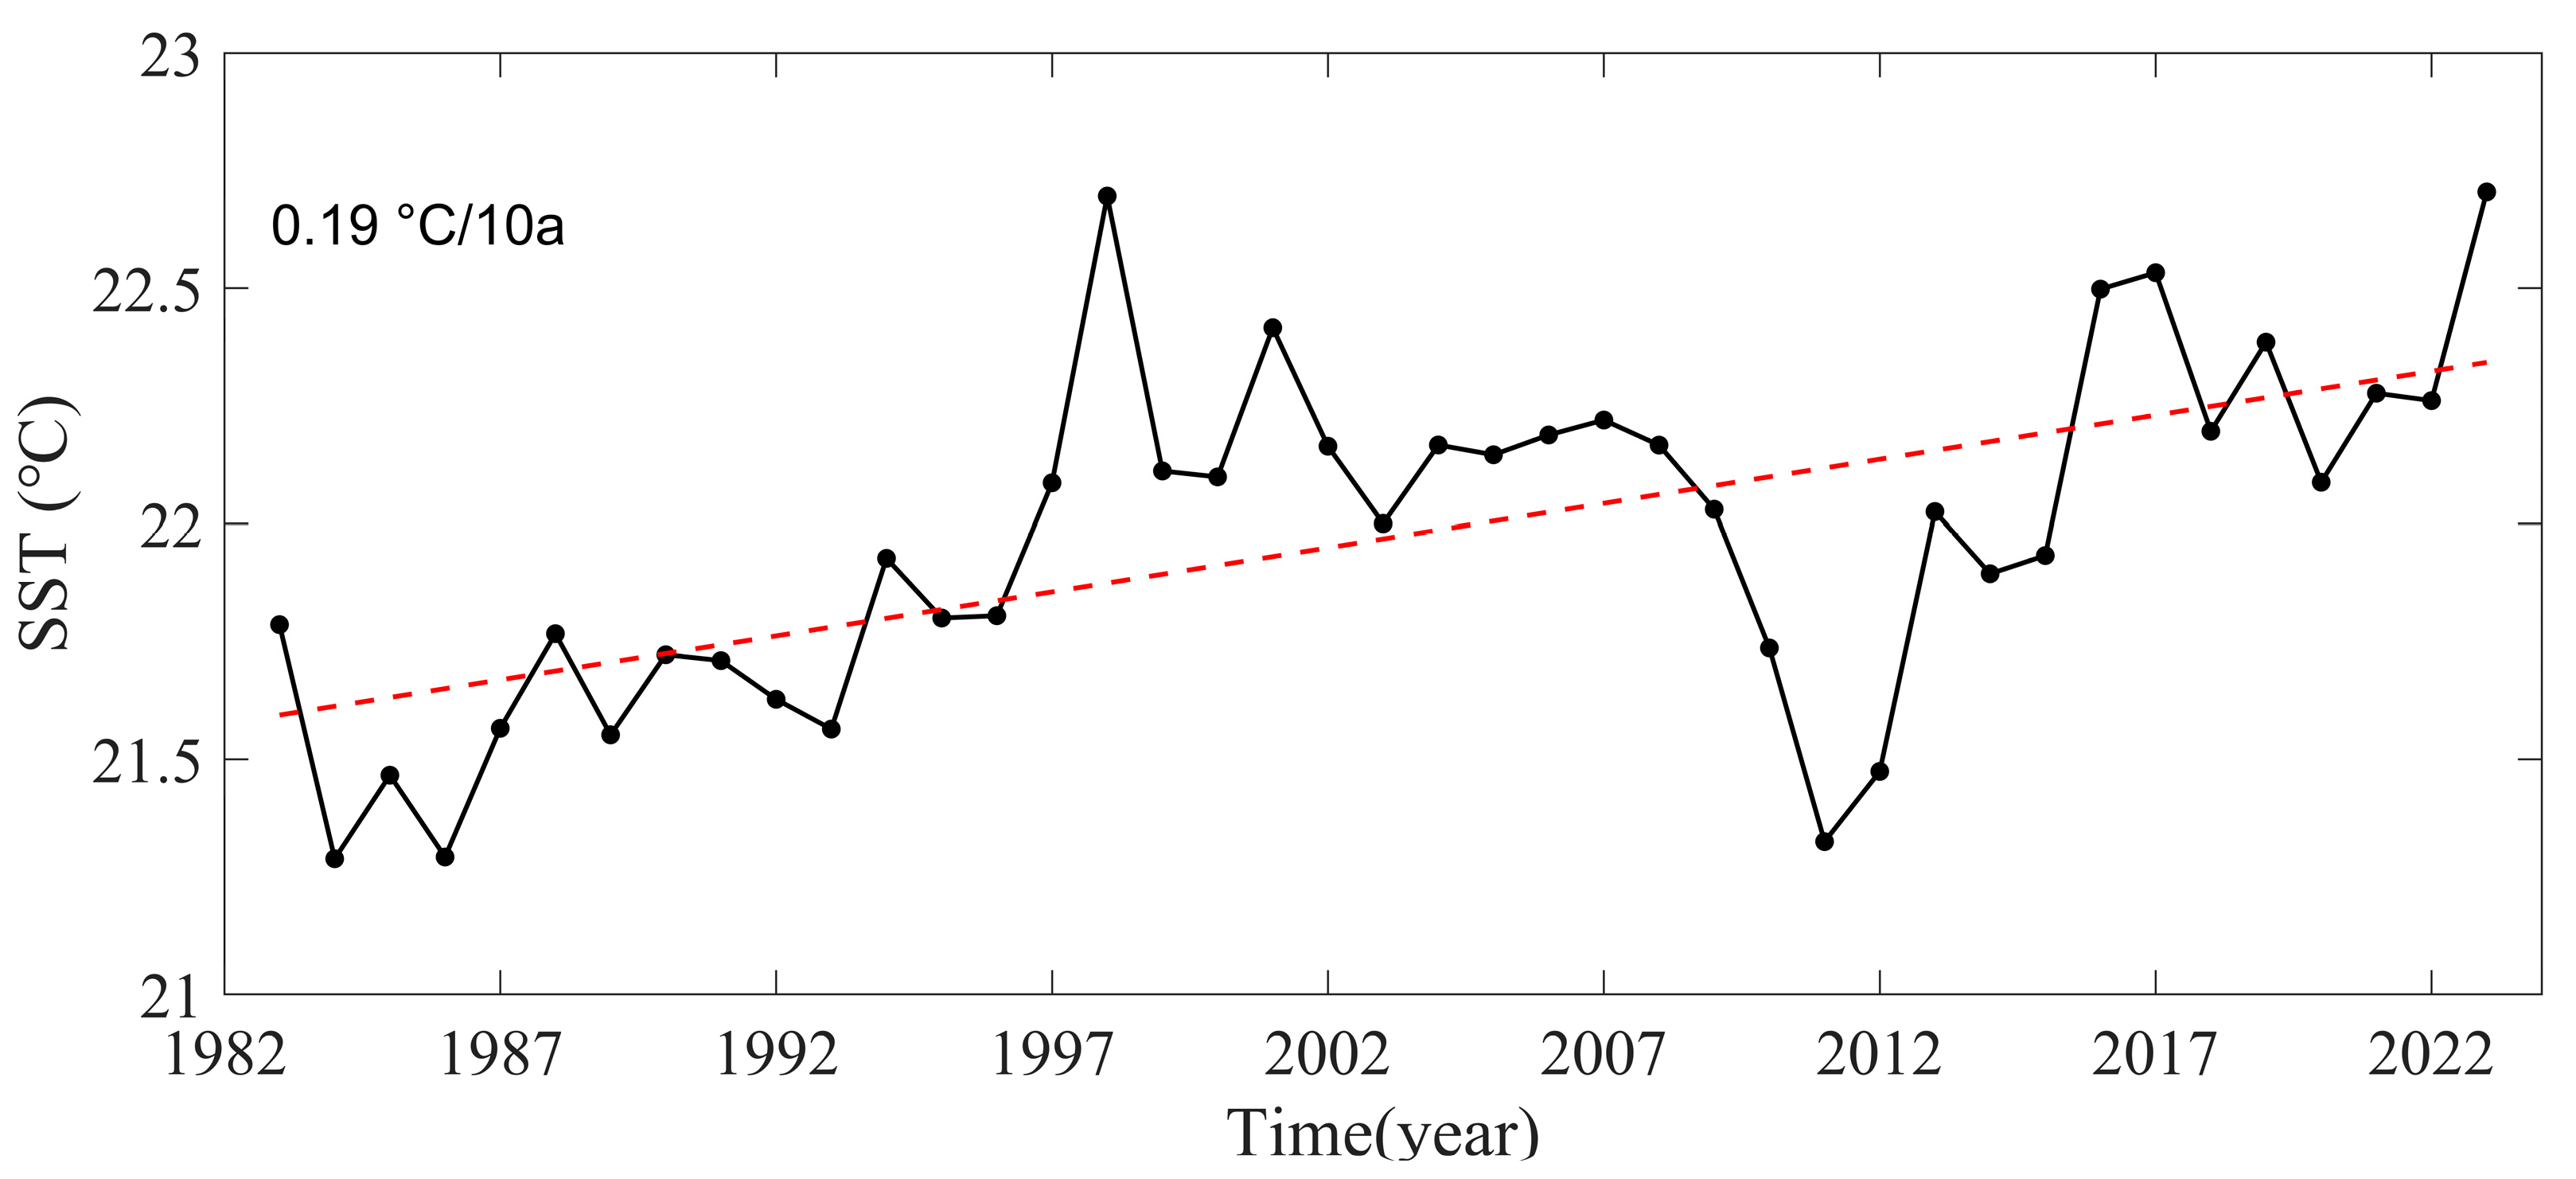
This study used a method that considers different areas to calculate the average sea SST and six MHW indicators in the East China Sea, providing a better view of yearly changes. A linear regression analysis was performed utilizing the least squares method to discern trends in SST and the six indicators specific to the region. Figure 4 illustrates the time series (black solid line) and corresponding trend (red dashed line) of SST in the East China Sea from 1982 to 2024. The graph demonstrates a consistent increase in SST over the past 42 years, with an average annual rise of 0.19 °C per decade.
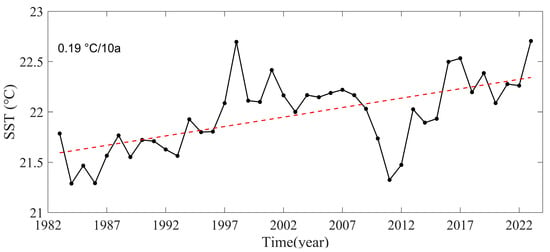
Figure 4.
Trends in average SST in the East China Sea from 1982 to 2024. (the black solid line represents the time series of SST from 1982 to 2024, and the red dotted line represents the trend of change).
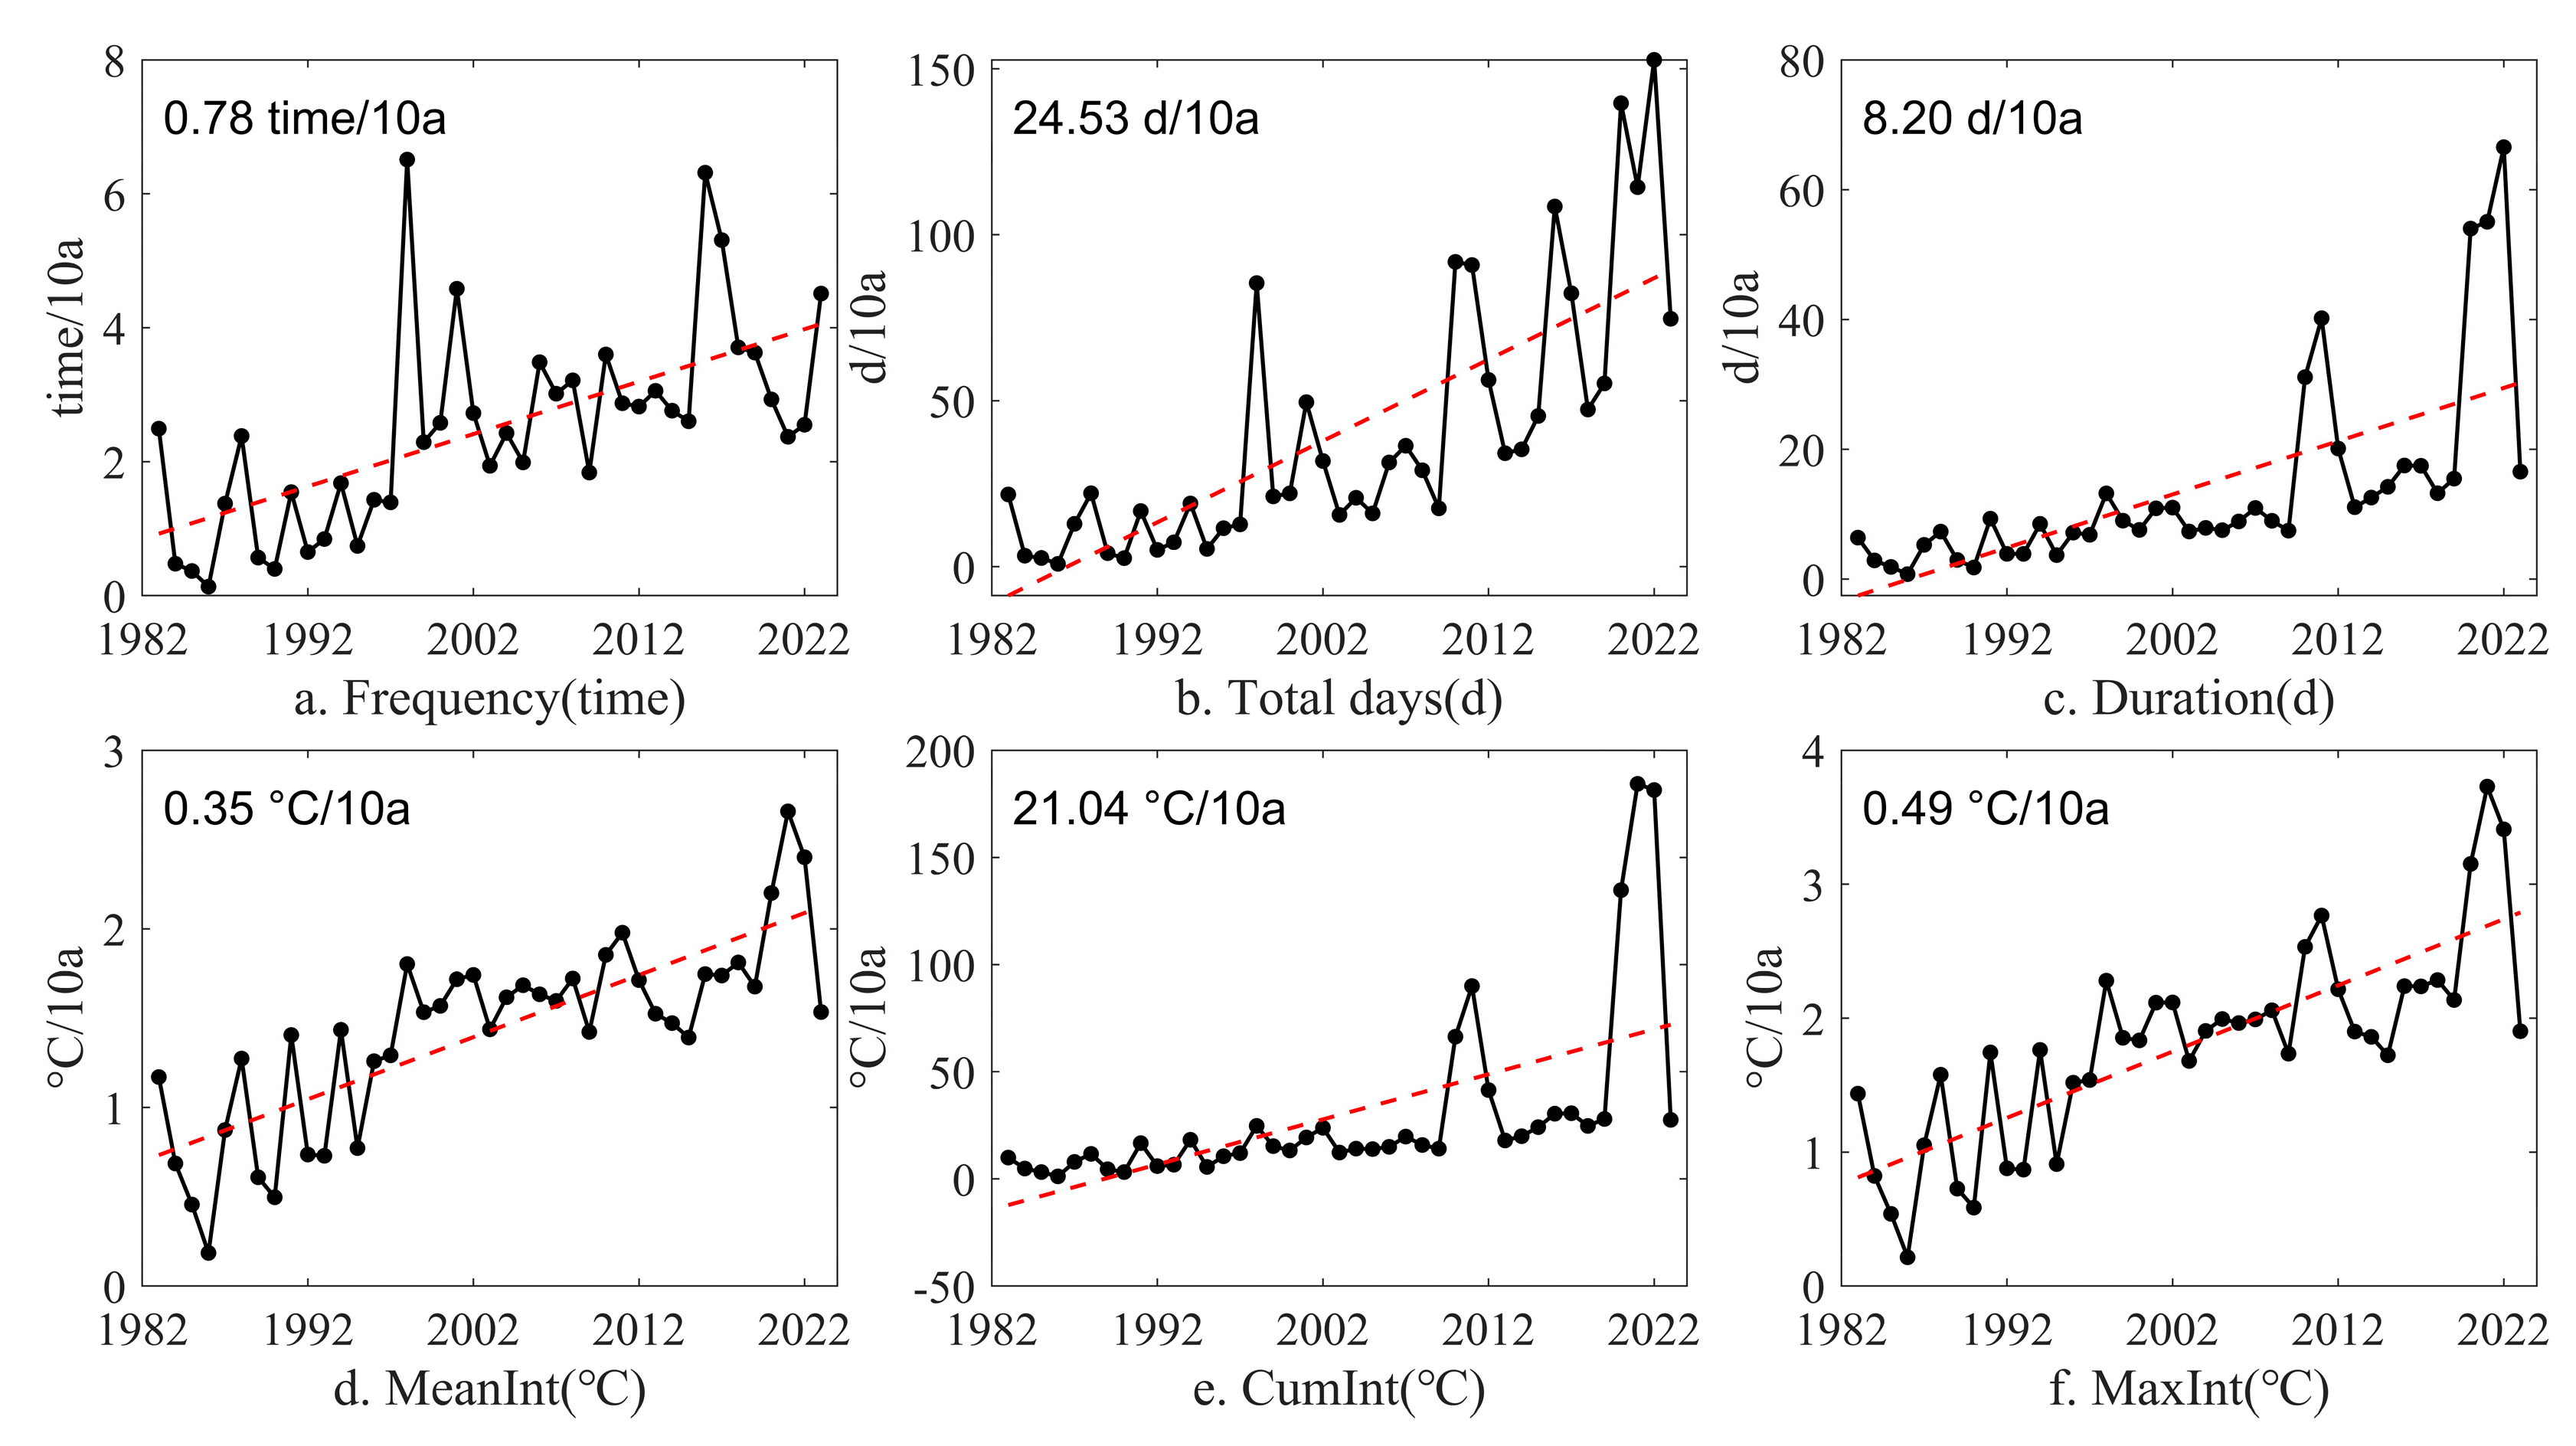
Figure 5 depicts the time series (black solid line) and trend (red dashed line) of six MHW indicators in the East China Sea from 1982 to 2024. All six characteristics of MHWs exhibit a conspicuous upward trend over this period. The frequency increased by 0.78 events per decade (Figure 5a), the total number of days rose by 24.53 (Figure 5b), the duration of individual events expanded by 8.2 days (Figure 5c), the average intensity grew by 0.35 °C (Figure 5d), the cumulative intensity reached 21.04 °C (Figure 5e), and the maximum intensity increased by 0.49 °C (Figure 5f). The linear trend in the total number of days stands out as the most significant indicator, whereas the increase in average intensity is comparatively modest. Changes in SST primarily drive the increases in both the duration and intensity of MHWs [41].
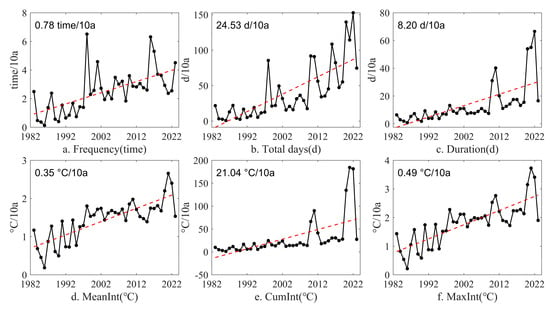
Figure 5.
Trends in six MHW indicators from 1982 to 2024. (a) Annual occurrence frequency trend of MHWs; (b) annual total number trend of days of MHWs; (c) annual duration trend of MHWs; (d) annual intensity trend of MHWs; (e) annual cumulative intensity trend of MHWs; (f) annual maximum intensity trend of MHWs. (The black solid line represents the time series of SST from 1982 to 2024, and the red dotted line represents the trend of change).
Figure 5 illustrates a definitive linear escalation in the frequency, duration, and number of days associated with MHWs, all of which surpass the pace of SST increases observed during the corresponding period. Analysis indicates that as global warming has persisted and intensified over the past four decades, MHW events in the East China Sea are undergoing significant modifications. The frequency of occurrence has increased markedly, and both the duration of individual events and their overall impact are escalating at an accelerated rate, implying that extreme marine heat events within this region are becoming progressively more severe and rapid. This statistical evidence corroborates the assertion that global warming contributes to the augmentation of extreme marine heat events [42].
3.2. MHW Trend Analysis
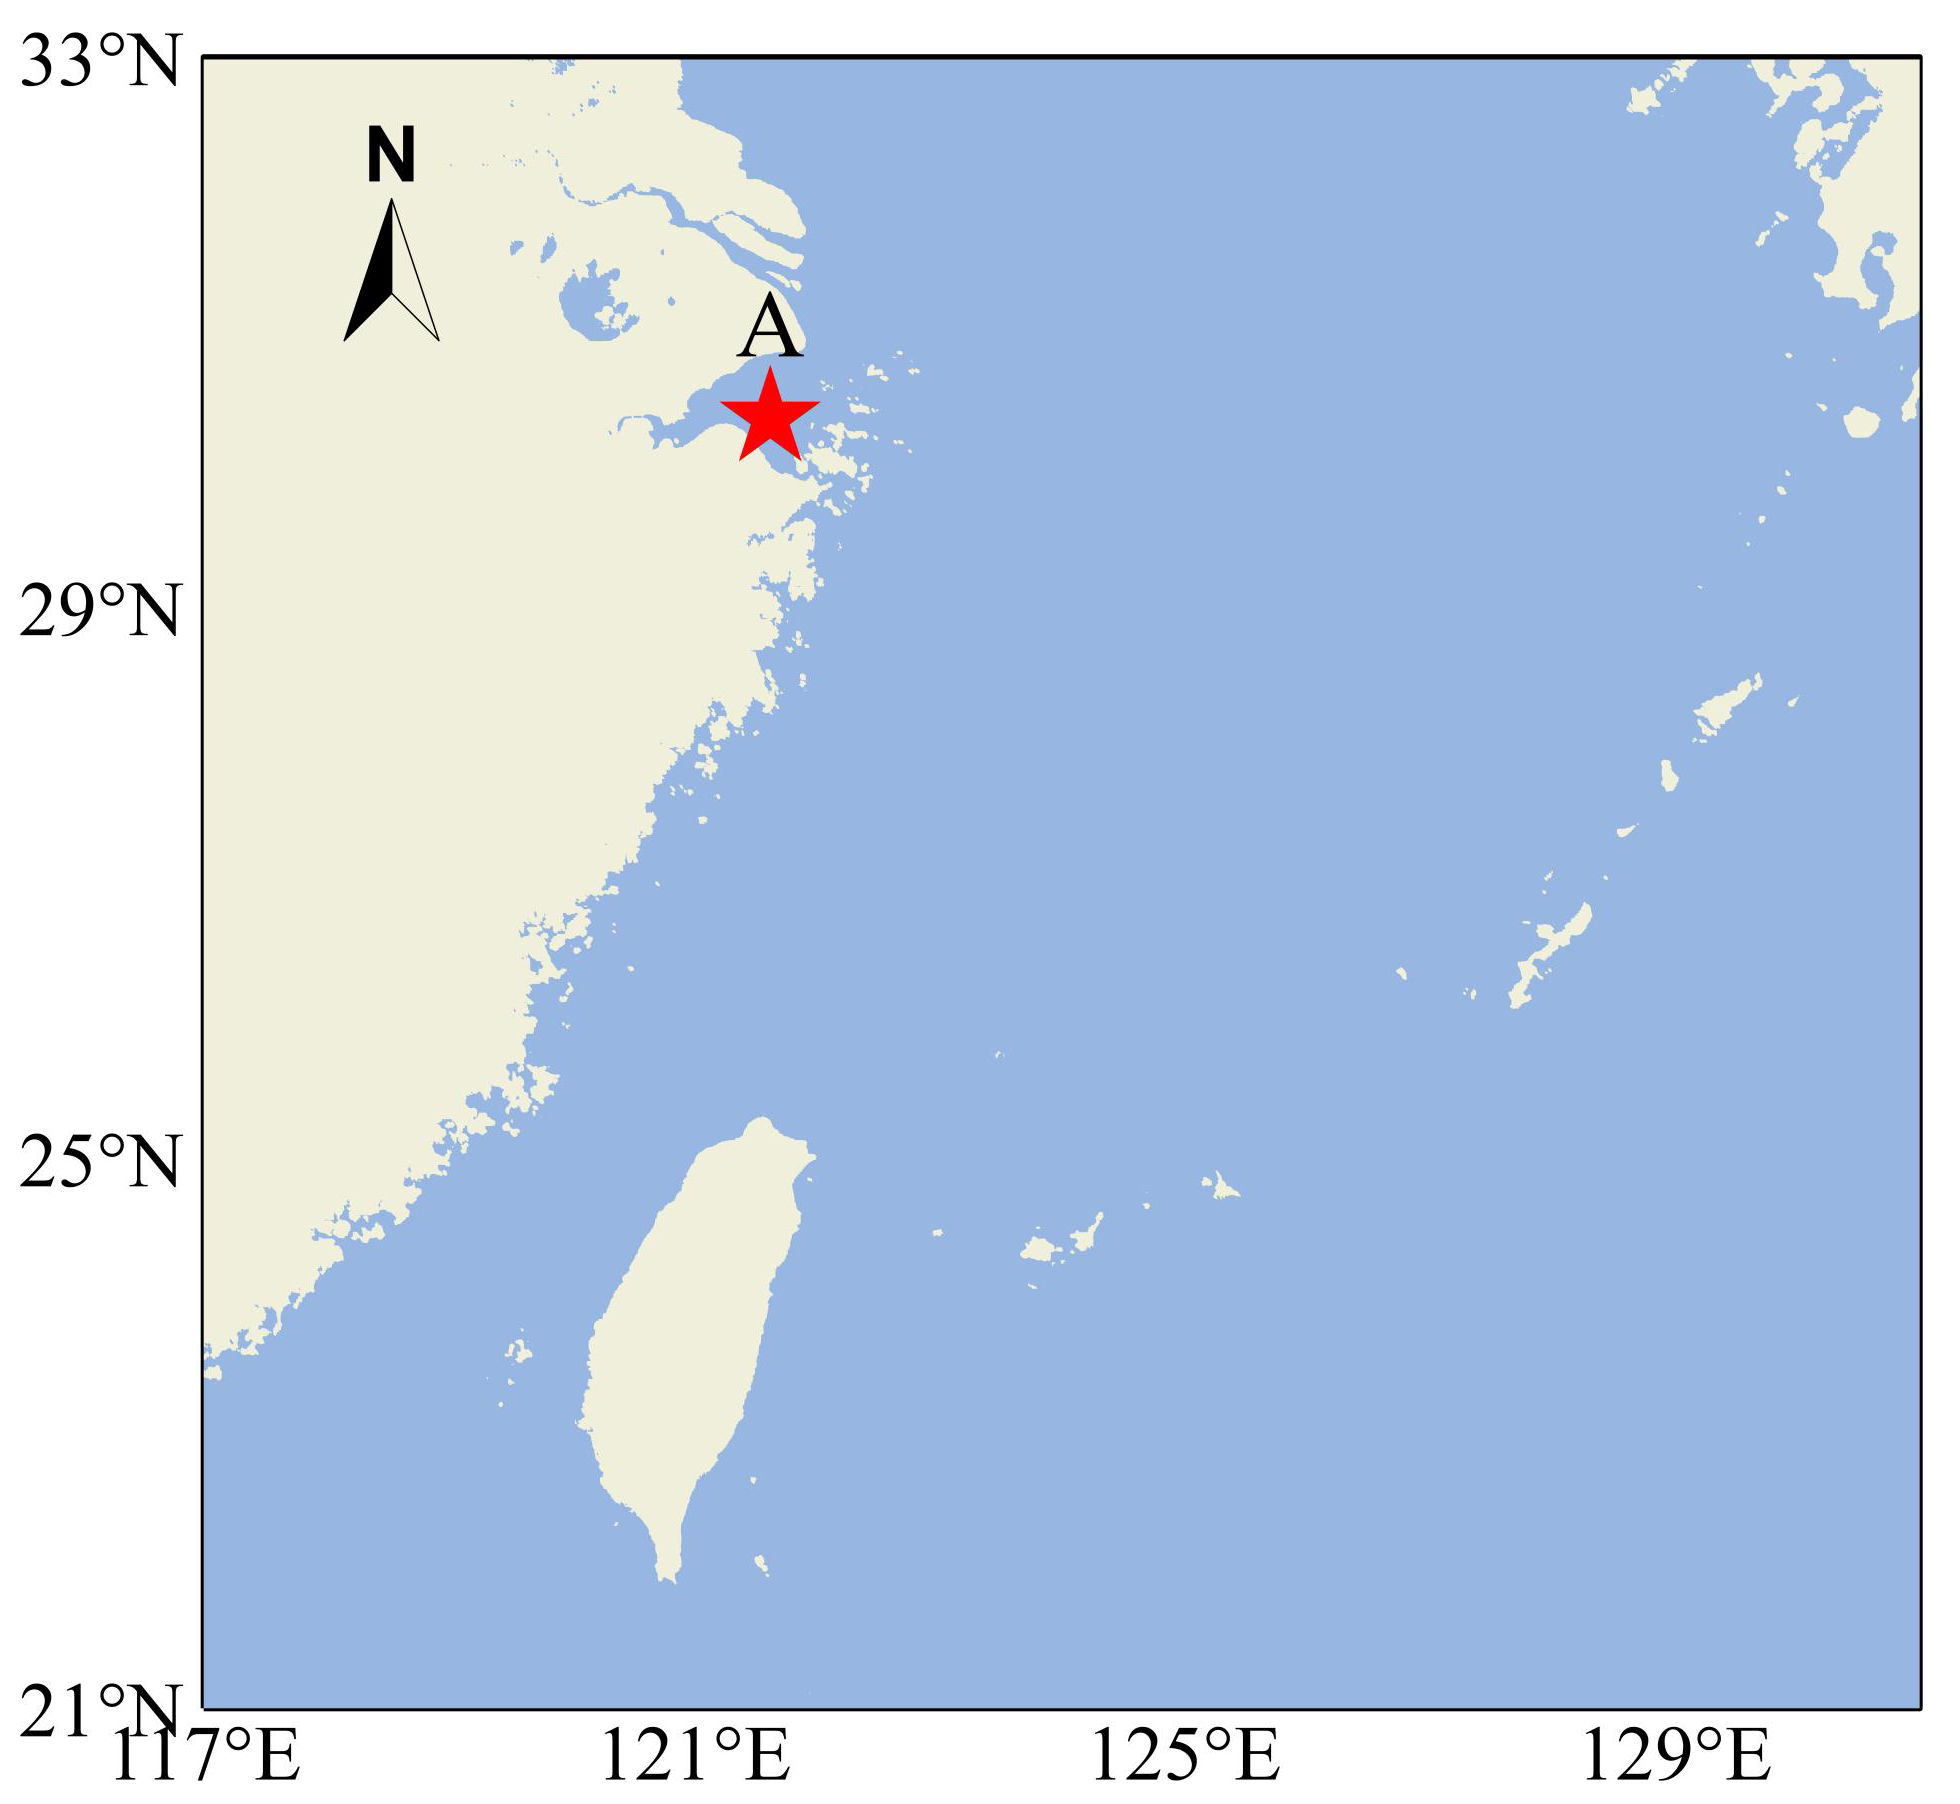
The spatiotemporal distribution characteristics of MHWs in the East China Sea reveal a significant concentration of high-intensity events near the Yangtze River estuary. This region experiences frequent heatwaves that are markedly more intense than those observed in adjacent waters. The spatial distribution feature indicates that sea surface temperature anomalies (SSTAs) in the Yangtze River estuary display greater fluctuations, with a higher incidence of extreme events. This study designated the area near the Yangtze River estuary as Observation Point A to examine the evolution patterns of MHWs, considering regional characteristics, as depicted in Figure 6. The station was selected owing to its representative spatial distribution and its efficacy in reflecting the temperature variation characteristics of zones with high-intensity MHWs.
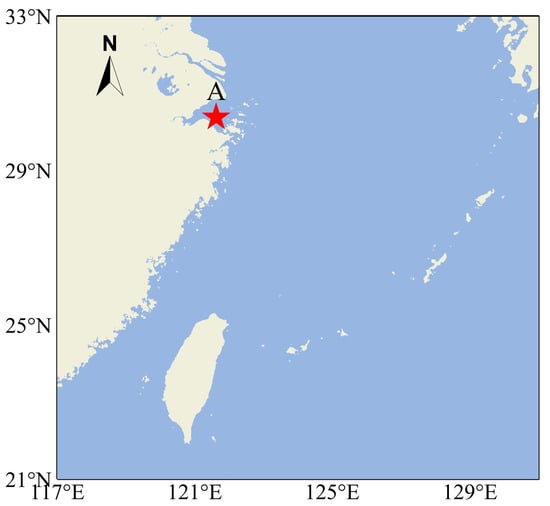
Figure 6.
Yangtze River estuary MHW observation point. (A is the name of the site, and the red marker indicates the site’s location).
This study compiled and structured monitoring data on heatwave events from the MHW observation points in the waters near the Yangtze River estuary for 2023, capturing the key parameters of all heatwave events for that year, such as start time, end time, and duration. Table 2 presents the results. We identified 10 significant MHWs in the waters adjacent to the Yangtze River estuary in 2023. The most intense event lasted 41 days, exceeding both the intensity and duration typical for the region in 2023.

Table 2.
Site A 2023 marine heatwave event.
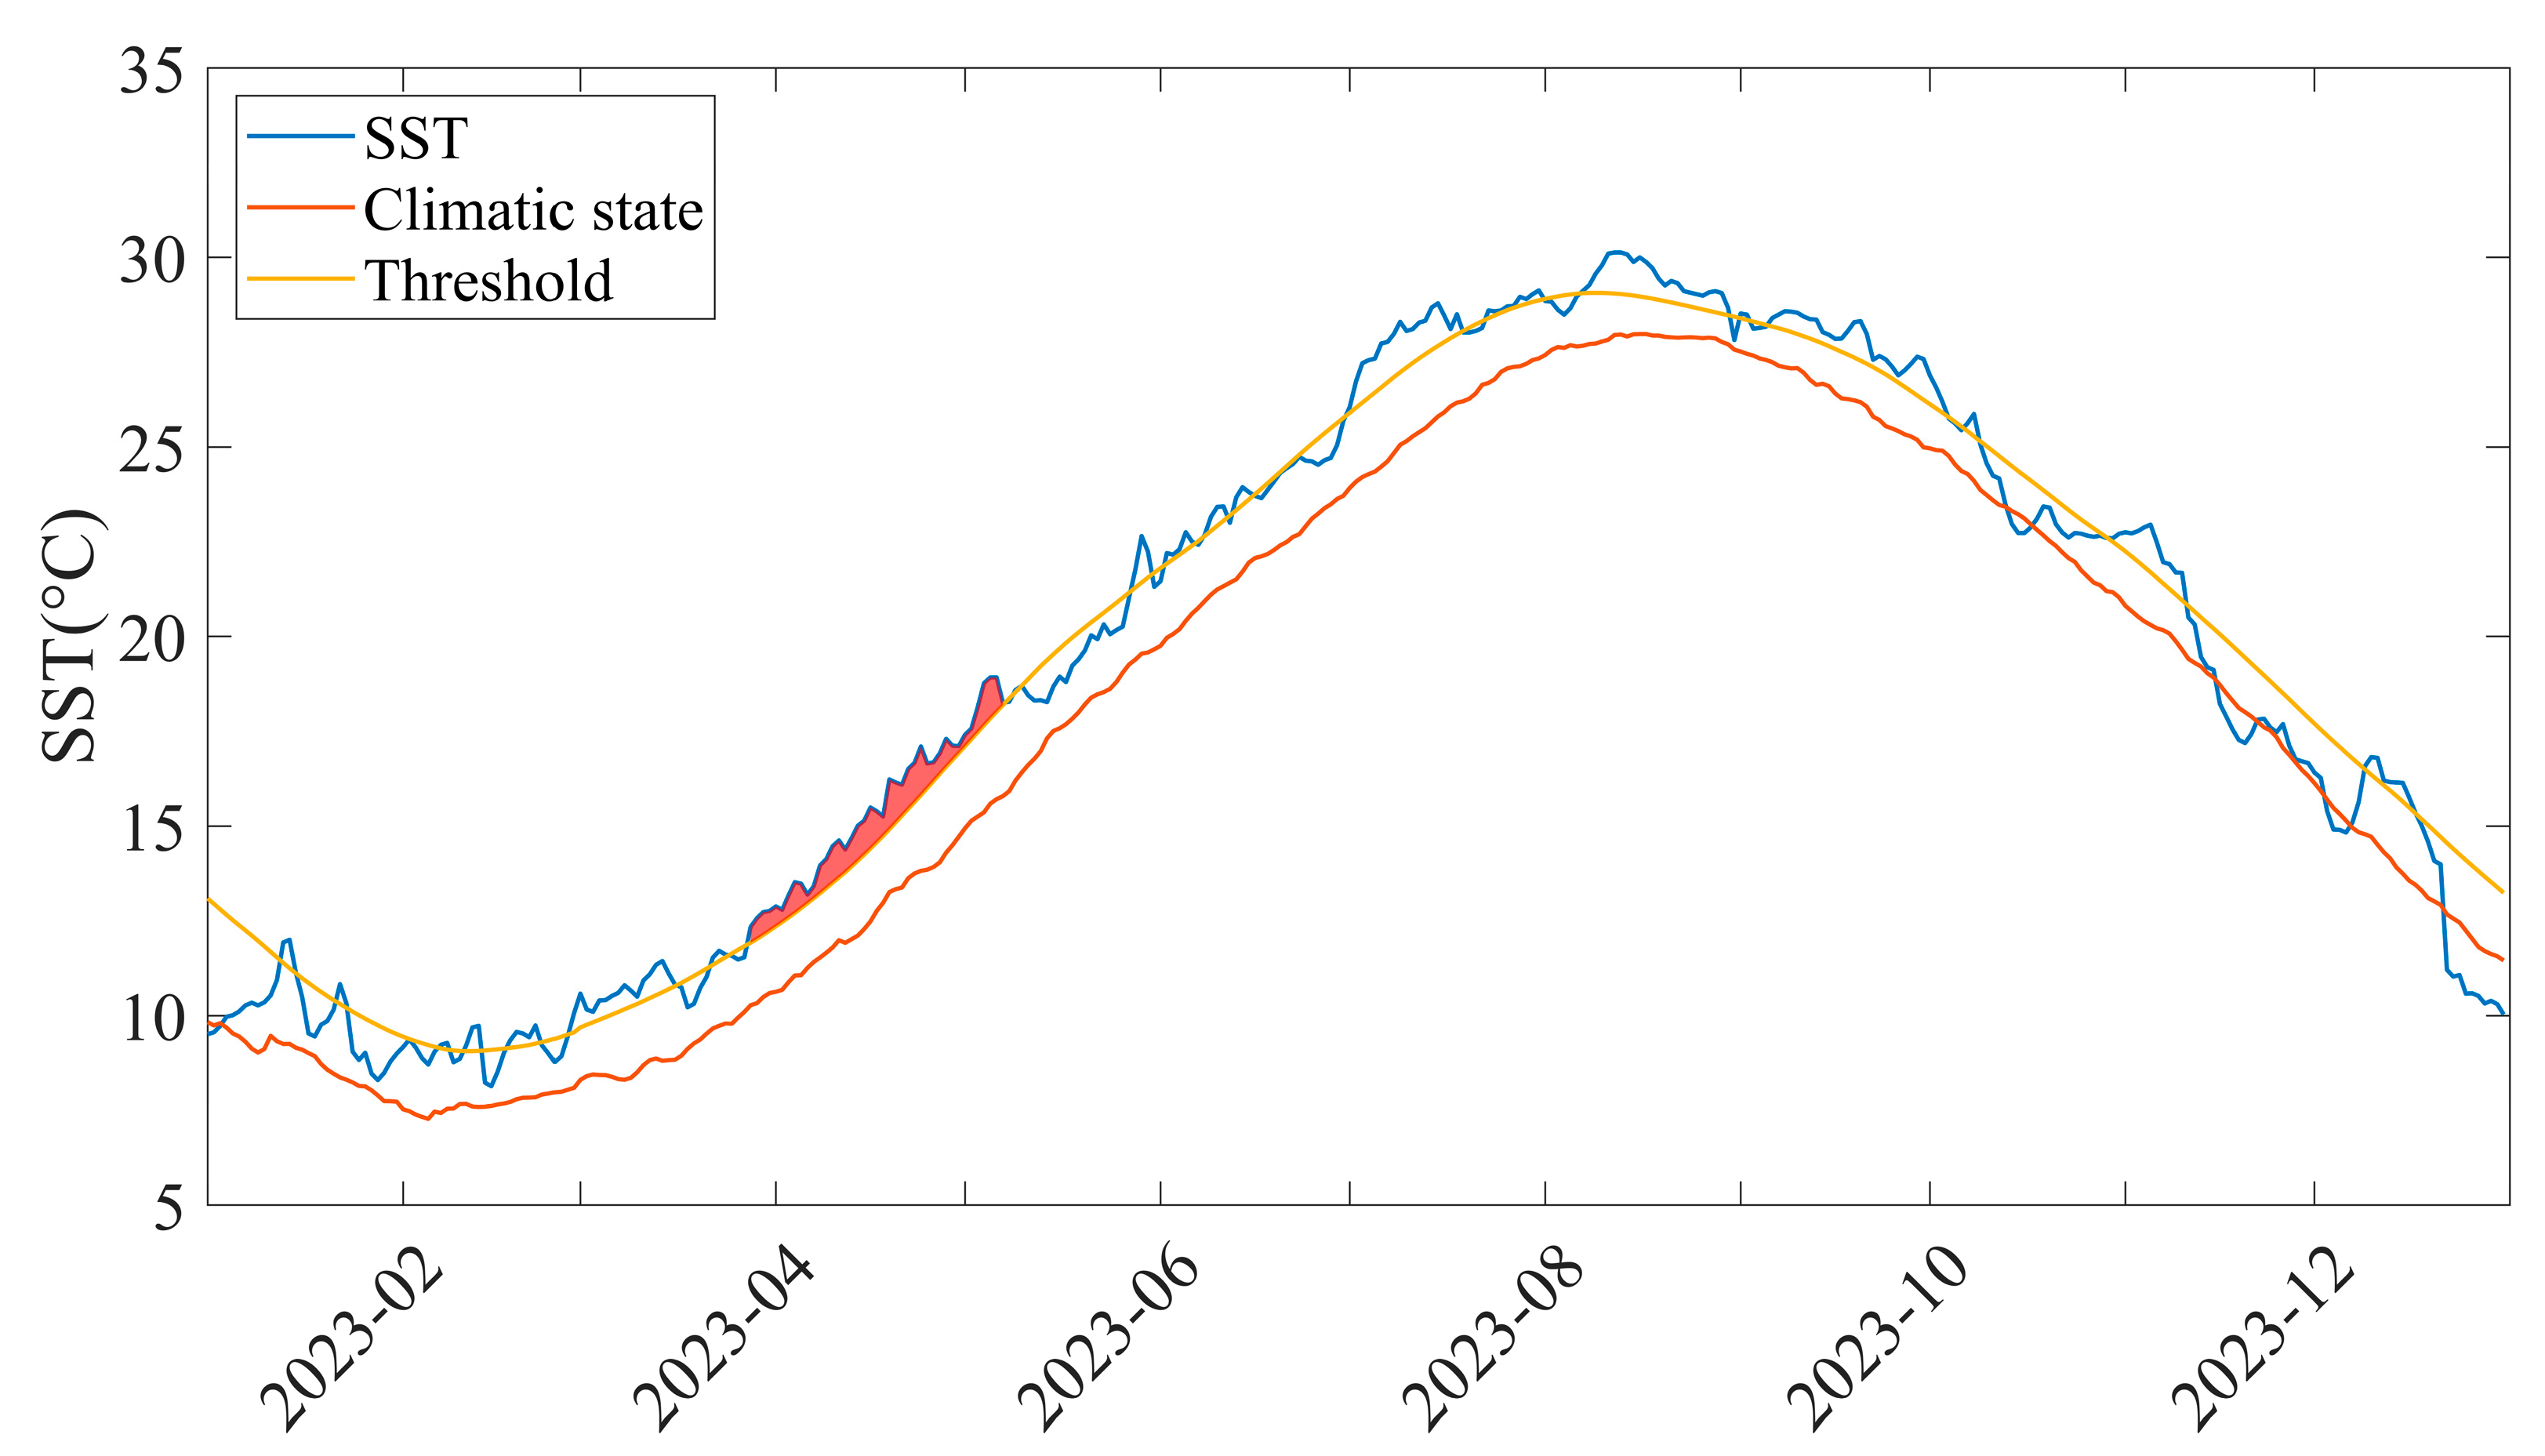
Figure 7 depicts the occurrence of the most severe heatwave in the waters proximal to the Yangtze River estuary in 2023. The blue curve represents the time series of SST, whereas the orange curve indicates the climate baseline period. The red curve illustrates the climate state threshold, and the red shaded region emphasizes the most intense heatwave event. Figure 7 demonstrates that the SST variation curve remains relatively stable, with significant deviations from the climate average primarily observed during the summer and winter seasons.
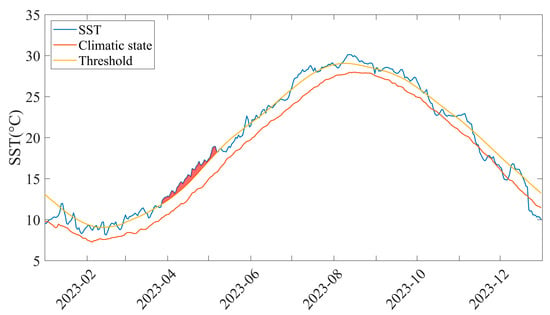
Figure 7.
Strongest heatwave in 2023 in the waters near the Yangtze River estuary. (The red shaded areas indicate the strongest MHWs events at this site in 2023).
This study forecasts variations in SST employing the advanced SegRNN_ST model. This model incorporates a spatiotemporal attention mechanism into the SegRNN framework to effectively capture the spatial and temporal characteristics of SST sequences. The dataset comprises SST data derived from the OISST v1 dataset, covering the period from 1982 to 2024. The data are partitioned into training and testing sets, with a division ratio of 70% for training and 30% for testing. The evaluation of the model’s performance employs three regression metrics—mean squared error (MSE), mean absolute error (MAE), and R-squared (R2)—to measure the accuracy of the predictions. Table 3 delineates the outcomes of the enhanced error analysis, which are based on the average results of five experimental repetitions.

Table 3.
Comparison of evaluation results before and after model improvement.
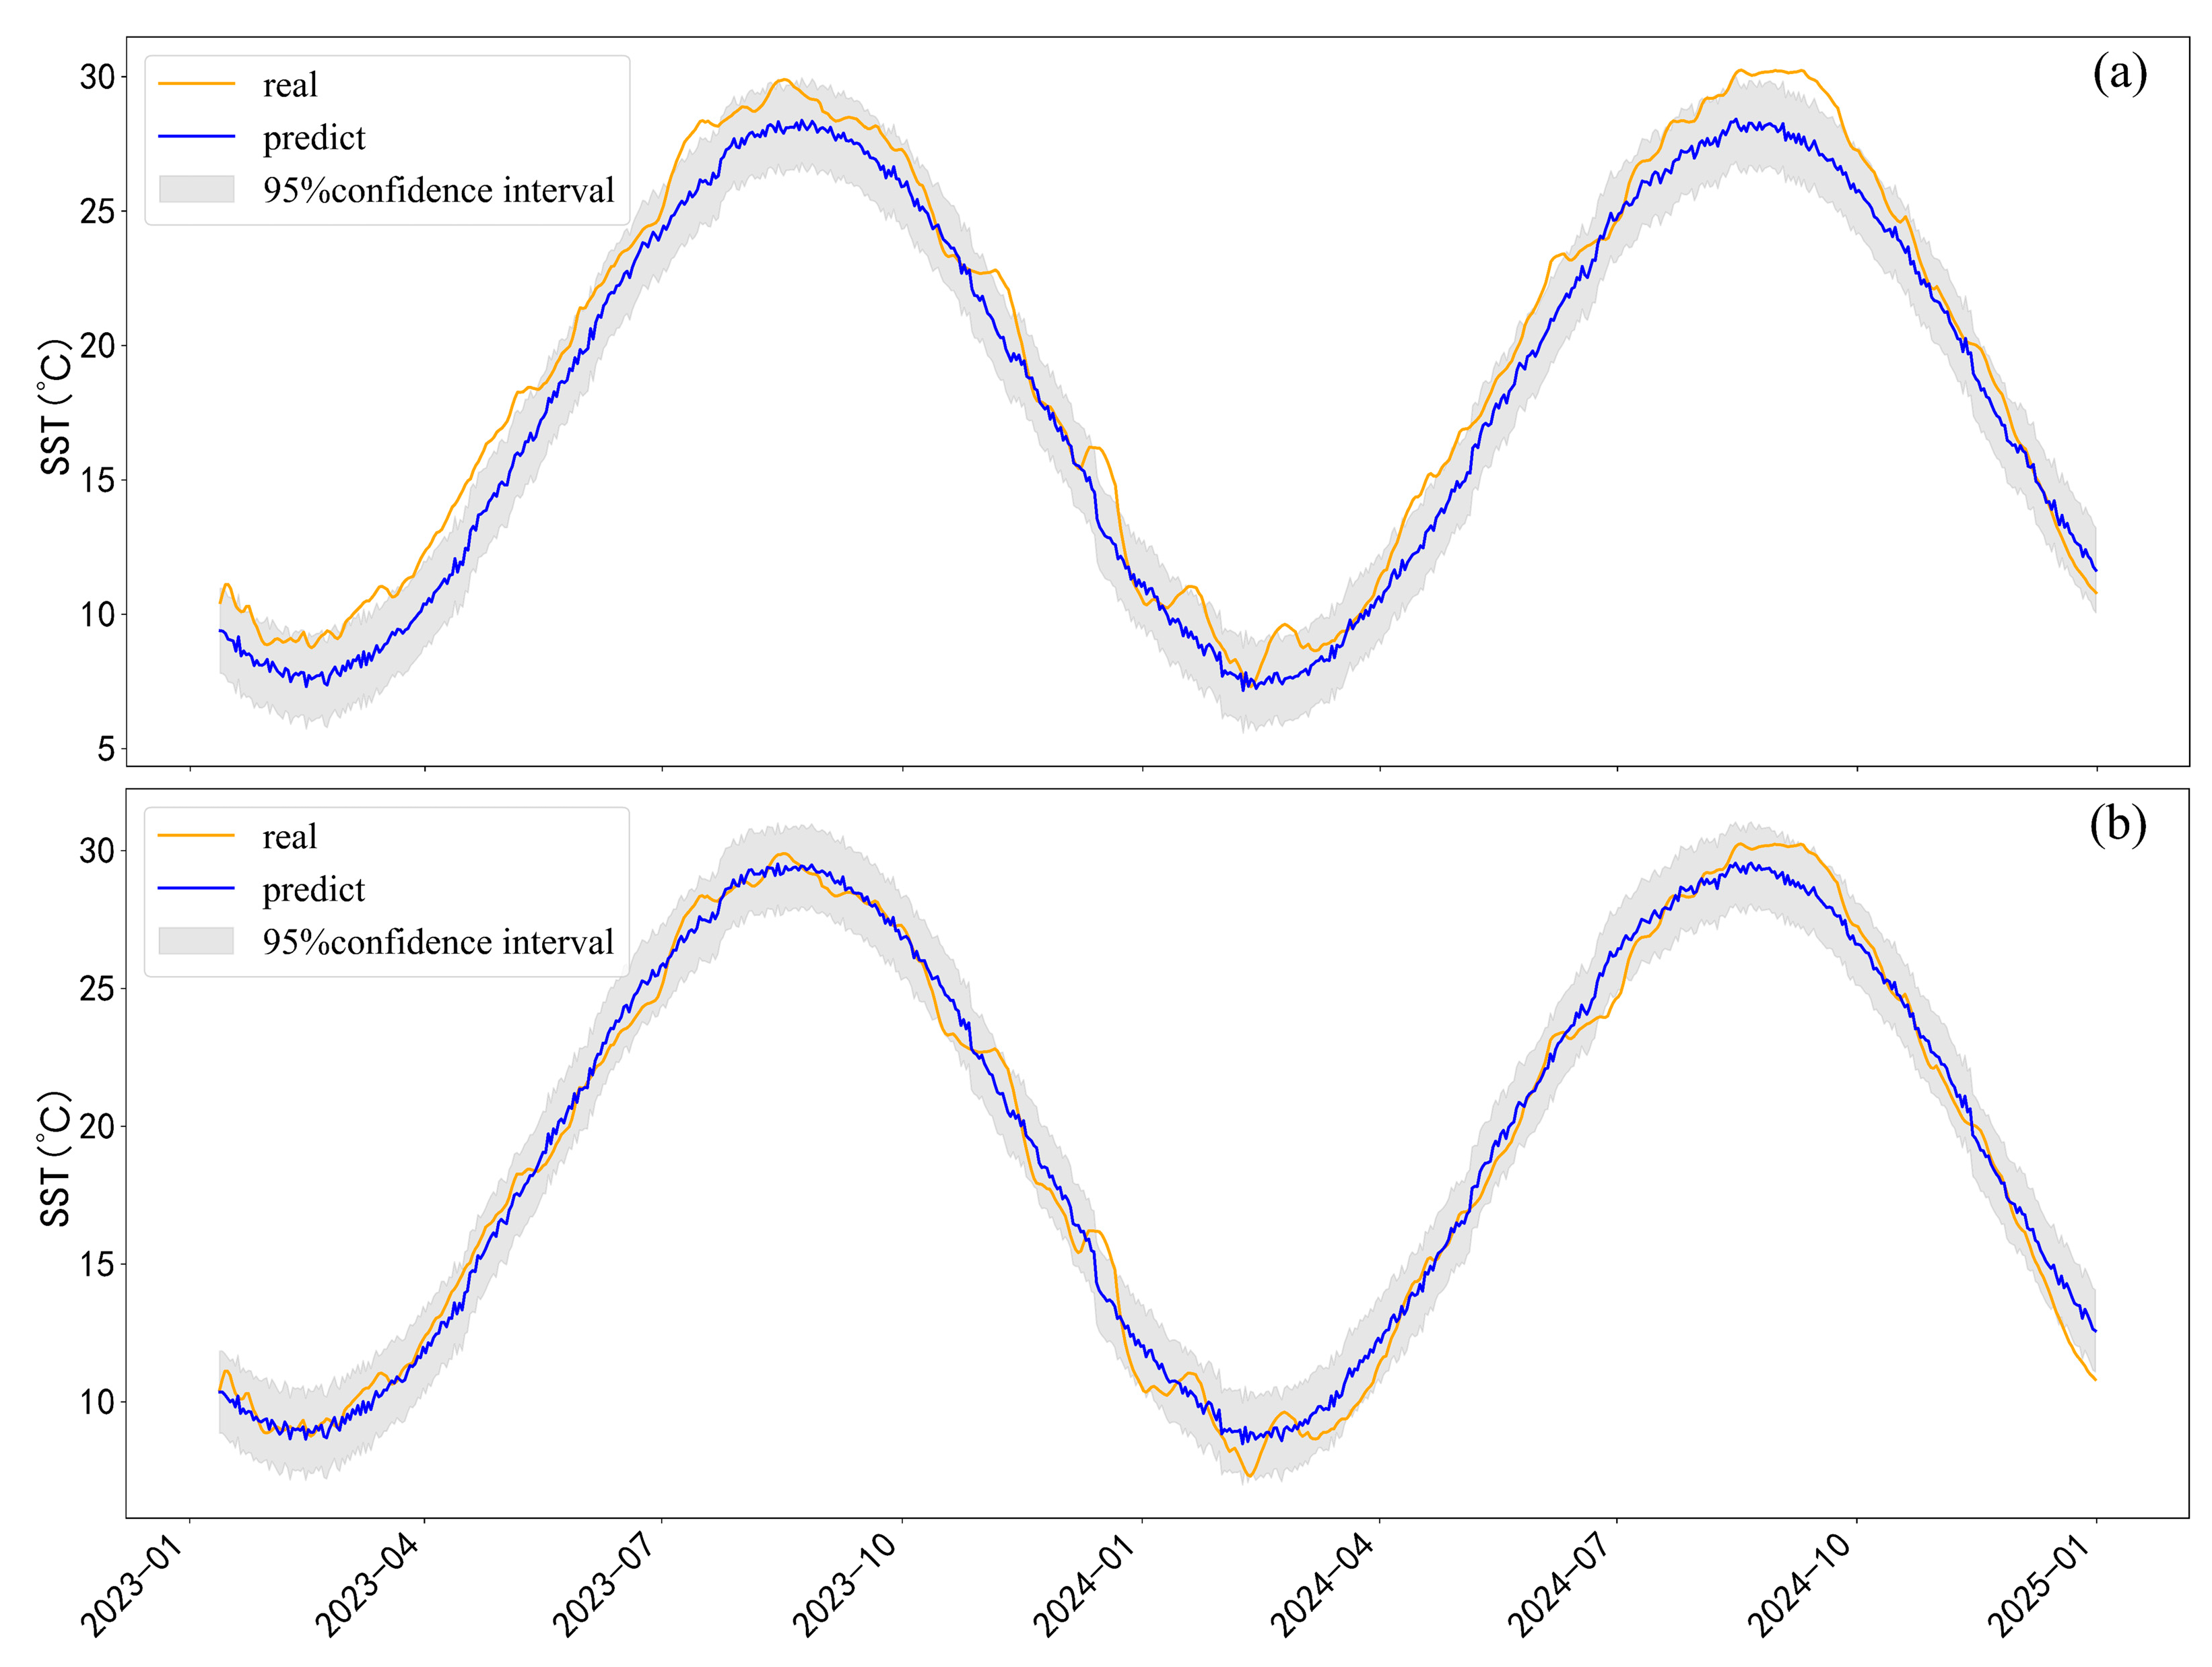
The analysis shows that the improved SegRNN_ST model used in this study gives more accurate results for SST trends than the SegRNN model. Specifically, the mean squared error (MSE) and mean absolute error (MAE) decreased by 20% and 15%, respectively, while the coefficient of determination (R2) went up by 8% to 0.959. This indicates that the model is useful for predicting SST in the East China Sea. Specifically, the mean squared error (MSE) and mean absolute error (MAE) were reduced by 20% and 15%, respectively, while the coefficient of determination (R2) increased by 8% to 0.959. This evidence demonstrates the model’s applicability for SST prediction in the East China Sea. Figure 8 depicts the predictive performance of both the original and optimized models on the test dataset.
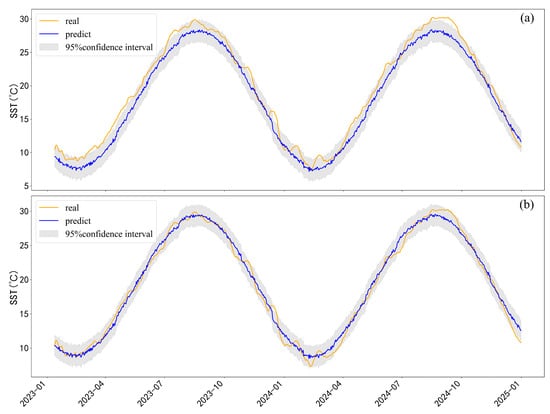
Figure 8.
Prediction results of SST in the sea area near the Yangtze River estuary based on the SegRNN model and SegRNN_ST model. The prediction step length is 720 days. (a) shows the prediction results of the SegRNN model; (b) shows the prediction results of the optimized SegRNN_ST model.
Figure 8b demonstrates that the SegRNN_ST model exhibits a more robust alignment between predicted outcomes and measured data, thereby improving the accuracy of SST predictions. Figure 8b shows that the SegRNN_ST model aligns more closely with the measured data, enhancing the accuracy of SST predictions. This model effectively simulates SST in the East China Sea. This model is appropriate for simulating SST in the East China Sea.
4. Discussion
MHWs pose a considerable threat to human society and marine ecosystems, adversely affecting fisheries resources and coral reef systems in the East China Sea while also potentially impacting regional climate patterns. The ecological stability of the East China Sea, a vital area for fisheries, is increasingly jeopardized by MHWs. Now, MHW monitoring faces several challenges, including insufficient spatiotemporal data resolution, the lack of long-term observational records, and limited accuracy of predictive models. This study conducted an analysis of the spatiotemporal characteristics of surface MHWs in the East China Sea from 1982 to 2024, utilizing the climate baseline period of 1982–2011. Additionally, the study developed the SegRNN_ST model to forecast sea surface temperatures (SSTs) within the region, thereby aiding in the prediction of future marine heatwaves. Enhancing monitoring and early warning systems for MHWs, together with a comprehensive investigation into their underlying causes and mechanisms, is imperative for addressing this global challenge.
The results indicate notable regional differences in MHWs across the East China Sea. High-frequency zones, occurring over three times a year, are mainly found along the northern slope of the Taiwan Shelf, close to the Dongsha Islands, and west of the Ryukyu Islands. Regional topographical features in these zones closely connect to the Kuroshio Current branch. In contrast, low-frequency zones, which occur once or twice annually, are found in the northern East China Sea and surrounding waters, likely due to upwellings and freshwater influx. The total number of days and frequency distribution show consistency; however, events in the high-frequency zone of the Taiwan Strait are generally shorter in duration. In contrast, the outer sea off the Yangtze River estuary, while having a lower frequency, can support incidents lasting more than 15 days. The intensity distribution shows higher values in coastal areas and lower values in the open sea, highlighting the outer sea near the Yangtze River estuary as a zone of significant intensity. Human activities, the warm cap effect, and heat buildup from the summer monsoon all contribute to this phenomenon. From the continental shelf to the oceanic trench, the intensity gradually decreases, underscoring the advantages of shallow water for thermal accumulation. The variability characteristics of marine heatwaves in the East China Sea are closely linked to regional climate warming. The frequency, duration, intensity, and overall impact of marine heatwaves have significantly increased in recent trends. These changes are occurring at a rate that surpasses the rise in sea surface temperatures, suggesting a heightened response to global warming in this region.
MHWs are characterized by prolonged and atypical increases in ocean temperatures, typically lasting from several weeks to months or longer. This research has improved the SegRNN model by replacing its main part with a bidirectional gated recurrent unit (GRU) and adding a spatiotemporal attention mechanism to better capture the spatial and temporal features of SST data. This study marks the first application of the SegRNN_ST model to the prediction of MHW trends. The experimental results demonstrate that the improved model performs exceptionally well, with a 20% reduction in mean squared error (MSE) and a 15% reduction in mean absolute error (MAE), alongside an increase of 8% in the coefficient of determination (R2), reaching a value of 0.959. The combination of segmentation with recurrent neural networks (RNNs) overcomes the constraints of traditional RNNs in managing extended sequences by utilizing hierarchical modeling and local–global collaborative optimization while preserving spatiotemporal dynamics. This method accurately captures complex spatiotemporal nonlinear dynamics, ensuring a balance between efficiency and performance, while providing a new framework for the intelligent analysis of long-term time series. Future studies should examine the regulatory mechanisms of regional ocean–atmosphere interactions and human activities on marine heatwaves to enhance the precision of predicting their evolution trends in the context of climate change.
5. Conclusions
Marine heatwaves inflict significant and lasting harm on marine ecosystems. MHWs can drive marine organisms to migrate over larger geographic areas and may result in alterations to population structure. They can greatly influence regional climate systems by changing sea–air interactions. This study used OISST v2.1 SST data to analyze the spatiotemporal distribution characteristics of MHWs in the East China Sea and applied an optimized SegRNN_ST model for 720-step SST predictions, offering methodological support for future MHWs.
Forecasts for the area are challenging given that MHWs involve prolonged abnormal increases in sea surface temperature, typically lasting from weeks to months or longer; accurate forecasting relies on precise temperature modeling over extended durations. This requirement heightens prediction uncertainty and complicates the development of models. This study produced dependable predictive outcomes by utilizing reanalysis data and deep learning models. Future studies must utilize higher-resolution observational data, employ ensemble approaches with various models, and integrate physical-data fusion methods to improve prediction accuracy. This will bolster the scientific foundation for early warning and response strategies regarding marine heatwaves in the East China Sea and worldwide.
Author Contributions
Conceptualization, W.X., B.G., V.S.M., Z.X. (Zhiyong Xu), C.W. and J.S.S.; methodology, W.X., Z.X. (Zheng Xu), and V.S.M.; software, W.X.; validation, W.X., B.G., and V.S.M.; formal analysis, W.X.; investigation, W.X.; resources, B.G.; data curation, W.X.; writing—original draft preparation, W.X.; writing—review and editing, B.G.; visualization, W.X.; supervision, B.G.; project administration, B.G.; funding acquisition, B.G. and Z.X. (Zheng Xu). All authors have read and agreed to the published version of the manuscript.
Funding
This work was mainly supported by the CRSRl Open Research Program (Program SN: CKWV202592); the Key R&D projects in Zhejiang Province (No. 2023C03120); the Open Research Fund Program of Key Laboratory for Water Ecology Management and Protection in River Source Areas, Ministry of Water Resources (No. 2024slbjh02); the National Natural Science Foundation of China (No. U2243226); Consultation and Evaluation Program of the Department of Chinese Academy of Science (No. 2020-ZW11-A-023); and Zhejiang Provincial Virtual Simulation Experiment Projects (virtual simulation experiment project of monitoring of suspended sediment in coastal waters using remote sensing); Science and Technology Program of Department of Natural Resources of Zhejiang Provincial, China (No. 2024ZJDZ039).
Data Availability Statement
The original contributions presented in this study are included in the article. Further inquiries can be directed to the corresponding author.
Conflicts of Interest
The authors declare no conflicts of interest.
Abbreviations
The following abbreviations are used in this manuscript:
| MHWs | Marine Heatwaves |
| SST | Sea Surface Temperature |
| MAE | Mean Absolute Error |
| MSE | Mean Squared Error |
| Coefficient of Determination | |
| CNN | Convolutional Neural Network |
| SSTA | Sea Surface Temperature Anomaly |
| SegRNN | Segment Recurrent Neural Network |
| PMF | Parallel Multi-step Forecasting |
Appendix A
Appendix A.1. SegRNN_ST Model Construction and Evaluation
SegRNN (Segment Recurrent Neural Network) is a model specifically designed for long-term time-series forecasting. Its main idea is to reduce RNN iterations by using segmented iteration and parallel multi-step forecasting (PMF), effectively addressing the issues of vanishing gradients and low computational efficiency faced by traditional RNN when handling long-term time-series data [43,44]. SegRNN struggles to capture lagged responses and bidirectional correlations among MHWs. This study introduces an improved SegRNN_ST model to analyze trends in MHWs in the East China Sea. The model is customized for the original SegRNN architecture and focuses on studying SST in this region. The model includes the following components:
Appendix A.1.1. Encoding
During the encoding phase, SegRNN uses segmentation techniques to divide time-series data into multiple segments, thereby reducing the number of RNN iterations. Given a time-series channel , it is divided into multiple segments , where is the length of each segment and is the number of segments. Each segment is transformed into through a learnable linear projection and an ReLU activation function, where is the dimension of the gated recurrent unit (GRU) hidden state. In a GRU, the hidden state represents the internal memory or summary of the GRU cell at a specific time step. It encapsulates the essence of all past input information that the network has “remembered” from the beginning of the sequence up to the current time step. The transformed is input into the GRU for recursive iteration to capture temporal features. For each time step in , the GRU computation process is as follows: after iterations, the hidden state at the last time step contains all temporal features of the original sequence and is passed to the decoding stage [45].
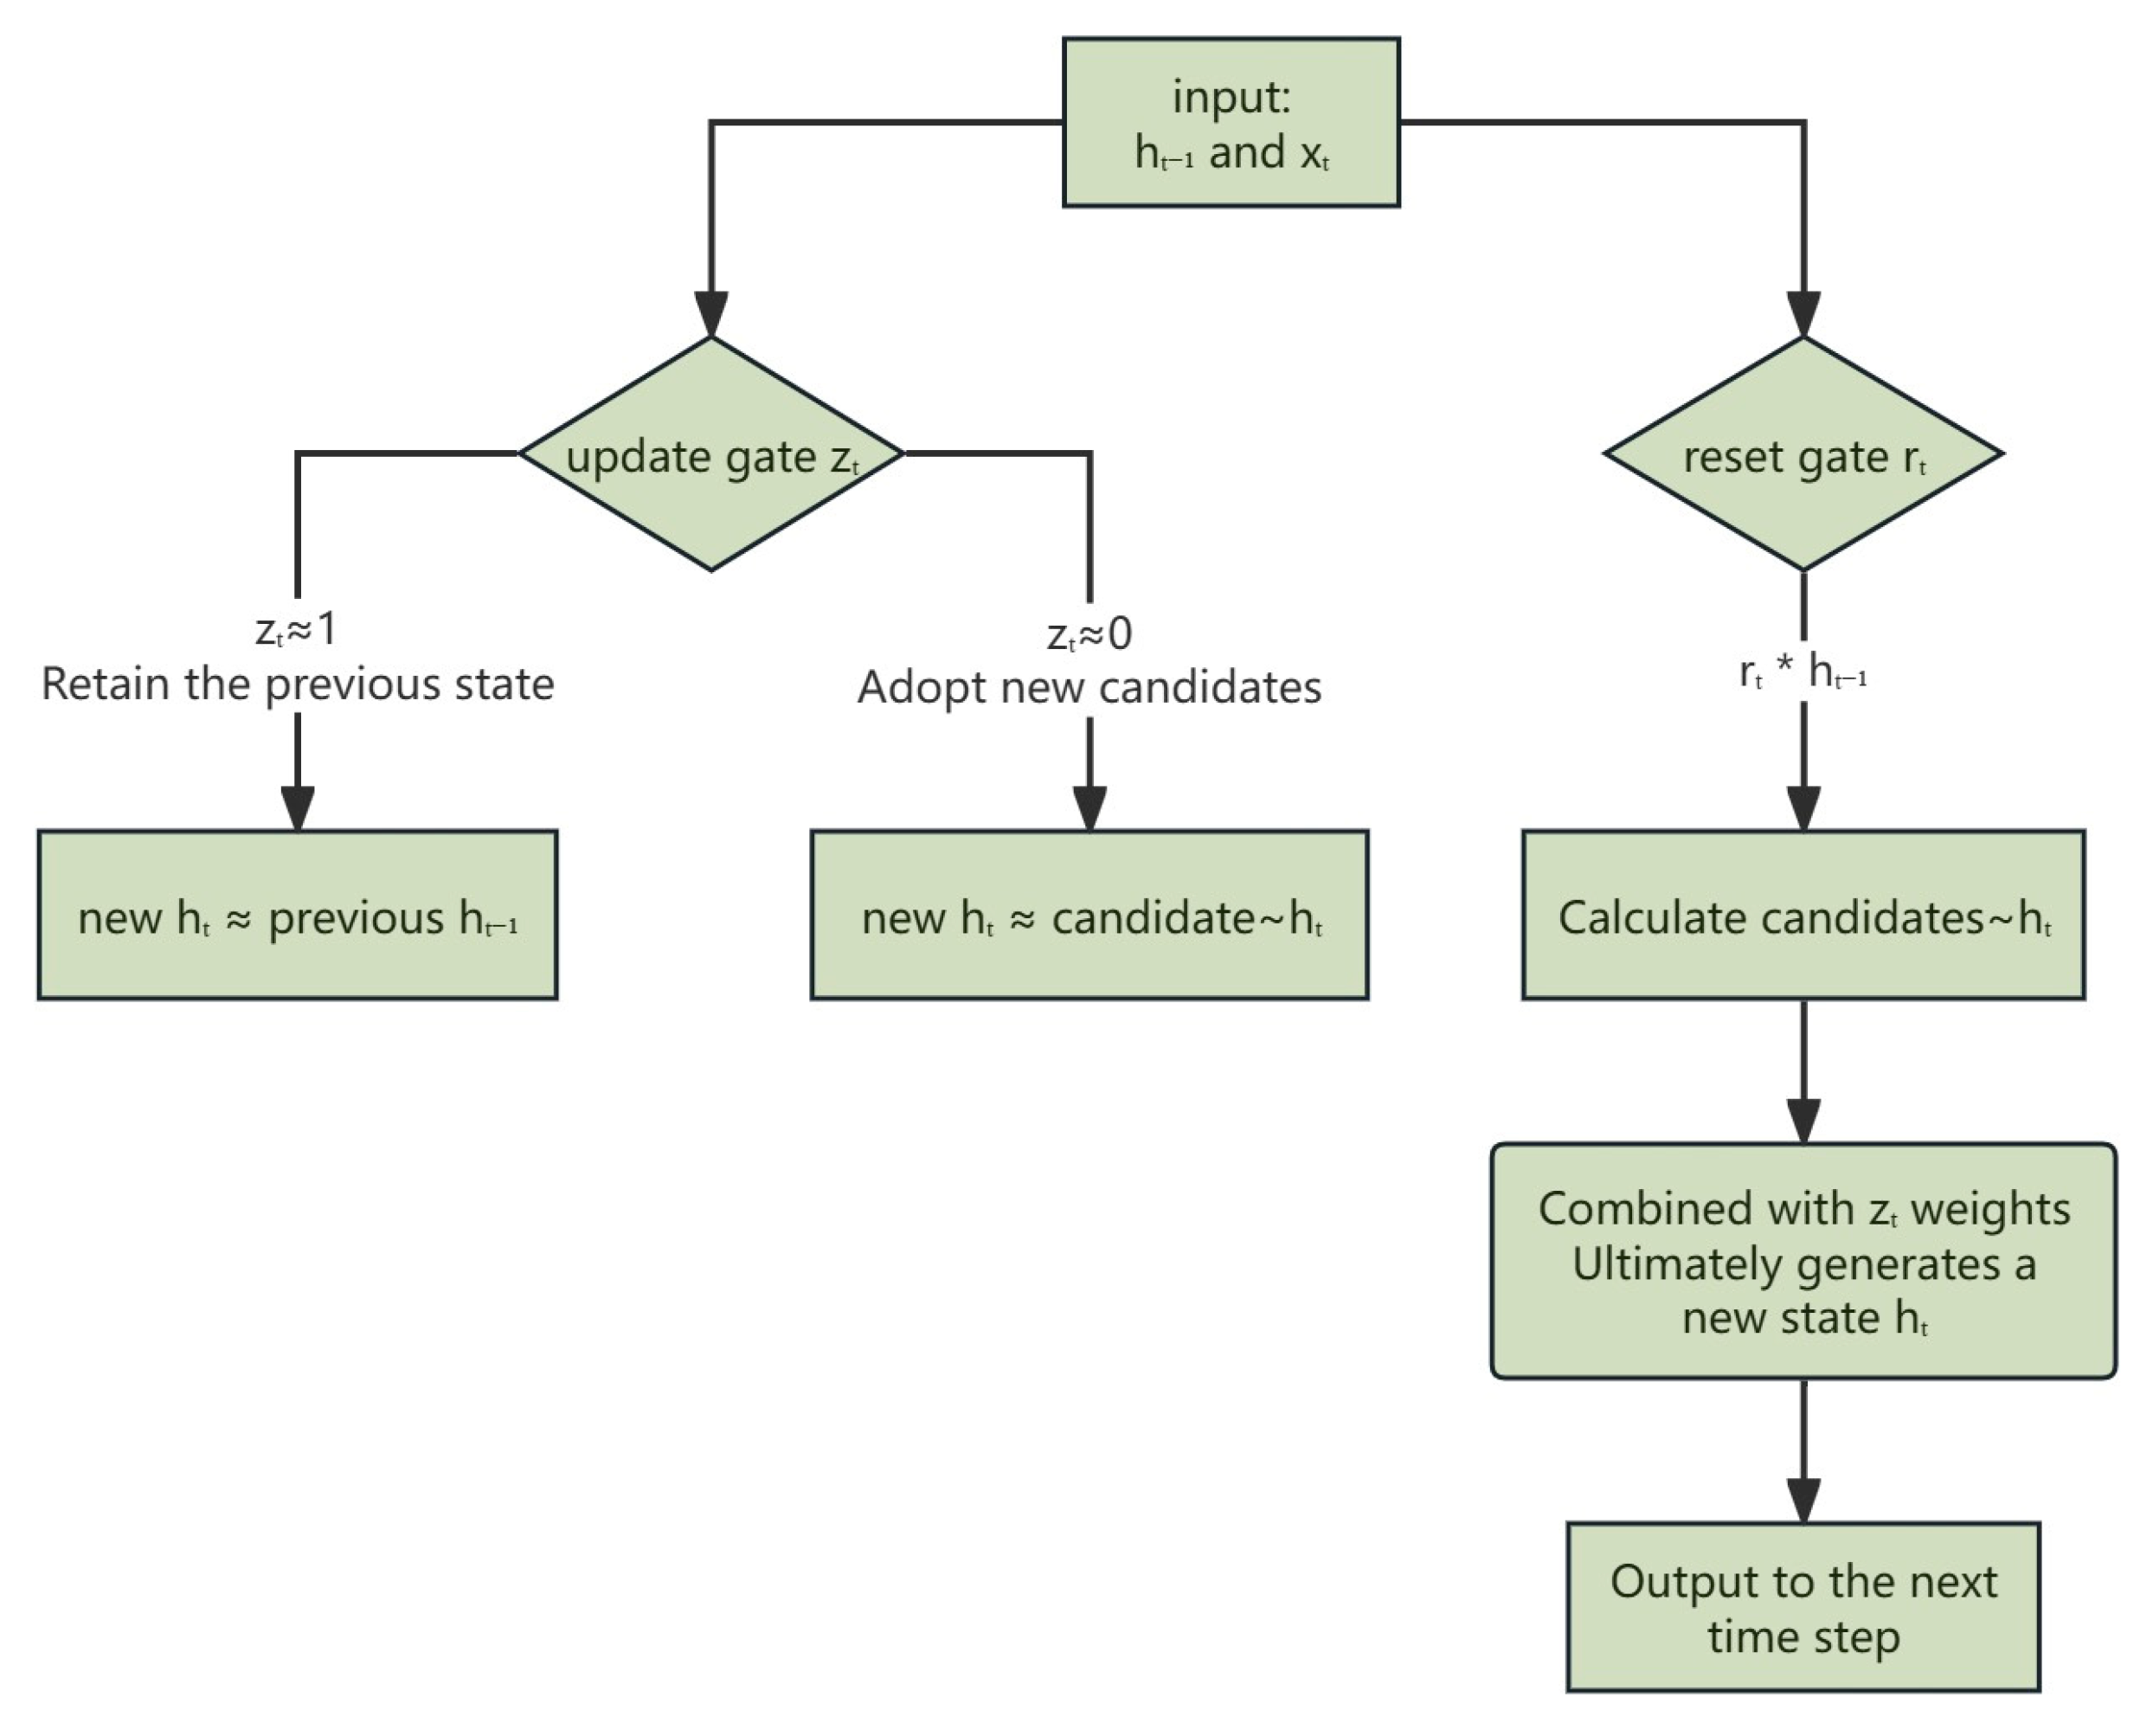
GRU primarily comprises four components: the update gate, the reset gate, the candidate hidden state, and the final hidden state. The update gate determines the extent to which information in the current hidden state originates from the previous hidden state and the current input; the reset gate evaluates the amount of information from the last hidden state that should be disregarded to more effectively capture the current input information; the candidate hidden state is computed based on the current input and the preceding hidden state, representing the potential hidden state at the current time; and the final hidden state is a weighted combination of the update gate and the candidate hidden state [46]. The specific calculation formulas are provided in Equations (A1)–(A4).
In Equations (A1) and (A2), and are the outputs of the update gate and output reset gate, respectively, with a range of 0–1. is the hidden state at the previous time step, and is the input at the current time step. In Equation (3), is the candidate hidden state, is the final hidden state at the current time step, is the weight matrix for each gate, is the bias term for each gate, is the Sigmoid activation function, and is the hyperbolic tangent activation function. The specific principle is illustrated in Figure A1.
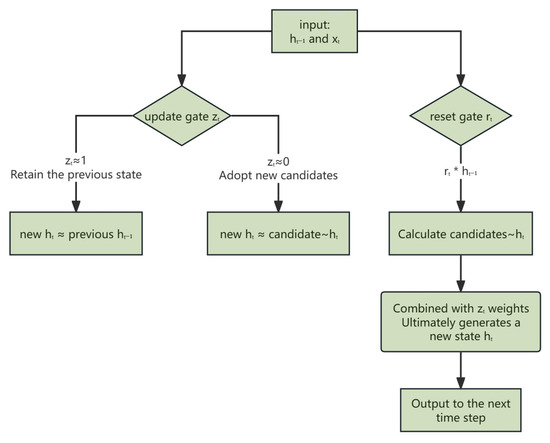
Figure A1.
The principle of the update door and the reset door. (“*” denotes multiplication).
Figure A1.
The principle of the update door and the reset door. (“*” denotes multiplication).
This study utilizes a bidirectional GRU to specifically address the uniqueness and stochastic nature of MHW events. The architecture consists of two separate GRU units: one processing the forward temporal information (from past to future) and the other managing the backward information (from future to past) [47]. The integration of these forward and backward GRU units improves the accuracy in capturing bidirectional dependencies within the time-series data. The corresponding calculations are represented by Equations (A5)–(A7).
In Equation (A5), is the hidden state of the forward GRU; in Equation (A6), is the hidden state of the backward GRU; in Equation (A7), “” denotes vector concatenation. By combining forward and backward information, the bidirectional GRU can more comprehensively capture patterns in time series and reduce information loss.
This manuscript presents the SegRNN model, which addresses the spatiotemporal dependence of MHWs in the East China Sea by incorporating a specialized spatiotemporal attention mechanism in the encoding process. This methodology dissects the conventional combined spatiotemporal attention into two distinct modules: spatial attention and temporal attention. Spatial attention delineates the relationships among various spatial locations at a given time, whereas temporal attention emphasizes dependencies at the same location across multiple time points. The outputs from these modules are subsequently integrated and fused [48]. This separation enhances efficiency in processing multi-dimensional spatiotemporal data by diminishing computational complexity. The core concept is summarized as follows:
- (a)
- Spatial attention: For each time step , first extract the spatial feature , calculate the query , key , and value matrices, then calculate the spatial attention weight , and finally weight the output , as calculated in Equations (A8)–(A10):
- (b)
- Temporal attention: Similarly, for each spatial position , first extract the time series , calculate the query , key , and value matrices, then calculate the spatial attention weight , and finally output the weighted , as shown in Formulas (A11)–(A13):
Appendix A.1.2. Decoding
In the decoding phase, SegRNN_ST minimizes iterations by employing a parallel multi-step forecasting (PMF) strategy, effectively circumventing the error accumulation issue found in traditional recursive multi-step forecasting (RMF). Since the segmentation technique disrupts the original recursive structure, the decoding stage must introduce position embeddings to identify the position of each segment, where represents the number of segments within the prediction range. Each position embedding is concatenated from relative position encoding and channel position encoding [33]. The relative position encoding indicates the position of each segment within the entire sequence, whereas the channel position encoding denotes the position of the current sequence in the multi-channel sequence.
The decoding phase utilizes the same bidirectional GRU units as the encoding phase. The final state from the encoding phase is replicated times and combined with the positional embeddings from . The combinations are fed in parallel to the bidirectional GRU unit, producing output vectors . In contrast to conventional recurrent decoding, the computation of each vector in PMF operates independently of prior time step results, enabling parallel computation within the sample and thus improving inference speed. The output vector is regularized through Layer Normalization and Dropout layers, and then transformed into via a learnable linear prediction layer . Finally, is reshaped into , representing the final prediction result.
References
- Hobday, A.J.; Alexander, L.V.; Perkins, S.E.; Smale, D.A.; Straub, S.C.; Oliver, E.C.J.; Benthuysen, J.A.; Burrows, M.T.; Donat, M.G.; Feng, M.; et al. A hierarchical approach to defining marine heatwaves. Prog. Oceanogr. 2016, 141, 227–238. [Google Scholar] [CrossRef]
- Gabriele, C.M.; Amundson, C.L.; Neilson, J.L.; Straley, J.M.; Baker, C.S.; Danielson, S.L. Sharp decline in humpback whale (Megaptera novaeangliae) survival and reproductive success in southeastern Alaska during and after the 2014–2016 Northeast Pacific marine heatwave. Mamm. Biol. 2022, 102, 1113–1131. [Google Scholar] [CrossRef]
- Smith, K.E.; Burrows, M.T.; Hobday, A.J.; King, N.G.; Moore, P.J.; Sen Gupta, A.; Thomsen, M.S.; Wernberg, T.; Smale, D.A. Biological Impacts of Marine Heatwaves. Ann. Rev. Mar. Sci. 2023, 15, 119–145. [Google Scholar] [CrossRef]
- Roberts, S.D.; Van Ruth, P.D.; Wilkinson, C.; Bastianello, S.S.; Bansemer, M.S. Marine Heatwave, Harmful Algae Blooms and an Extensive Fish Kill Event During 2013 in South Australia. Front. Mar. Sci. 2019, 6, 610. [Google Scholar] [CrossRef]
- Strydom, S.; Murray, K.; Wilson, S.; Huntley, B.; Rule, M.; Heithaus, M.; Bessey, C.; A Kendrick, G.; Burkholder, D.; Fraser, M.W.; et al. Too hot to handle: Unprecedented seagrass death driven by marine heatwave in a World Heritage Area. Glob. Change Biol. 2020, 26, 3525–3538. [Google Scholar] [CrossRef]
- Hughes, T.P.; Kerry, J.T.; Álvarez-Noriega, M.; Álvarez-Romero, J.G.; Anderson, K.D.; Baird, A.H.; Babcock, R.C.; Beger, M.; Bellwood, D.R.; Berkelmans, R.; et al. Global warming and recurrent mass bleaching of corals. Nature 2017, 543, 373–377. [Google Scholar] [CrossRef]
- Jones, T.; Parrish, J.K.; Lindsey, J.; Wright, C.; Burgess, H.K.; Dolliver, J.; Divine, L.; Kaler, R.; Bradley, D.; Sorenson, G.; et al. Marine bird mass mortality events as an indicator of the impacts of ocean warming. Mar. Ecol. Prog. Ser. 2024, 737, 161–181. [Google Scholar] [CrossRef]
- Jacox, M.G.; Alexander, M.A.; Bograd, S.J.; Scott, J.D. Thermal displacement by marine heatwaves. Nature 2020, 584, 82–86. [Google Scholar] [CrossRef]
- Scannell, H.A.; Pershing, A.J.; Alexander, M.A.; Thomas, A.C.; Mills, K.E. Frequency of marine heatwaves in the North Atlantic and North Pacific since 1950. Geophys. Res. Lett. 2016, 43, 2069–2076. [Google Scholar] [CrossRef]
- Darmaraki, S.; Somot, S.; Sevault, F.; Nabat, P.; Narvaez, W.D.C.; Cavicchia, L.; Djurdjevic, V.; Li, L.; Sannino, G.; Sein, D.V. Future evolution of Marine Heatwaves in the Mediterranean Sea. Clim. Dyn. 2019, 53, 1371–1392. [Google Scholar] [CrossRef]
- Wu, L.; Cai, W.; Zhang, L.; Nakamura, H.; Timmermann, A.; Joyce, T.; McPhaden, M.J.; Alexander, M.; Qiu, B.; Visbeck, M.; et al. Enhanced warming over the global subtropical western boundary currents. Nat. Clim. Change 2012, 2, 161–166. [Google Scholar] [CrossRef]
- Choi, H.-Y.; Park, M.-S.; Kim, H.-S.; Lee, S. Marine heatwave events strengthen the intensity of tropical cyclones. Commun. Earth Environ. 2024, 5, 1–8. [Google Scholar] [CrossRef]
- Yu, S.; Wang, Z.; Jiang, Z.; Li, T.; Ding, X.; Wei, X.; Liu, D. Marine Heatwave and Terrestrial Drought Reduced CO2 Uptake in the East China Sea in 2022. Remote Sens. 2024, 16, 849. [Google Scholar] [CrossRef]
- Chen, Y.; Wei, Y.; Zheng, Y.; Wu, X.; Liu, Q.; Li, R.; Sun, L.; Zhao, B.; Yin, S.; Liu, H.; et al. Influence of ocean-atmosphere interactions on typhoon track and intensity: A case study for typhoon “Hato” (1713). Nat. Hazards 2025, 121, 7609–7624. [Google Scholar] [CrossRef]
- Feng, M.; Boschetti, F.; Ling, F.; Zhang, X.; Hartog, J.R.; Akhtar, M.; Shi, L.; Gardner, B.; Luo, J.-J.; Hobday, A.J. Predictability of sea surface temperature anomalies at the eastern pole of the Indian Ocean Dipole—using a convolutional neural network model. Front. Clim. 2022, 4, 925068. [Google Scholar] [CrossRef]
- Mi, C.; Yi, A.; Xue, J.; Dong, C.; Shan, H. Forecasting summer marine heatwaves in the South China Sea using explainable machine learning models. Deep Sea Res. Part I Oceanogr. Res. Pap. 2025, 218. [Google Scholar] [CrossRef]
- Chen, Q.; Cai, C.; Chen, Y.; Zhou, X.; Zhang, D.; Peng, Y. TemproNet: A transformer-based deep learning model for seawater temperature prediction. Ocean Eng. 2024, 293, 116651. [Google Scholar] [CrossRef]
- Sun, D.; Jing, Z.; Liu, H. Deep learning improves sub-seasonal marine heatwave forecast. Environ. Res. Lett. 2024, 19, 064035. [Google Scholar] [CrossRef]
- Zhe, L.; Zhongwen, R.; Lujia, P.; Xu, Z. MTS-Mixers: Multivariate Time Series Forecasting via Factorized Temporal and Channel Mixing. arXiv 2023. [Google Scholar] [CrossRef]
- Vaswani, A.; Shazeer, N.; Parmar, N.; Uszkoreit, J.; Jones, L.; Gomez, A.N.; Kaiser, L.; Polosukhin, I. Attention Is All You Need. arXiv 2017. [Google Scholar] [CrossRef]
- Zeng, A.; Chen, M.; Zhang, L.; Xu, Q. Are Transformers Effective for Time Series Forecasting? arXiv 2022. [Google Scholar] [CrossRef]
- Farchadi, N.; McDonnell, L.H.; Ryan, S.; Lewison, R.L.; Braun, C.D. Marine heatwaves are in the eye of the beholder. Nat. Clim. Change 2025, 15, 236–239. [Google Scholar] [CrossRef]
- Tan, H.; Cai, R.; Yan, X.; Li, C. Amplification of Winter Sea surface temperature response over East China Seas to global warming acceleration and slowdown. Int. J. Clim. 2020, 41, 2082–2099. [Google Scholar] [CrossRef]
- Xu, W.; Liu, Z.; Gao, L.; Lei, X.; Zhang, Y. Changes in Global Marine Heatwaves in a Non-stationary Climate. Geophys. Res. Lett. 2025, 52, e2024GL114497. [Google Scholar] [CrossRef]
- Huang, B.; Liu, C.; Banzon, V.; Freeman, E.; Graham, G.; Hankins, B.; Smith, T.; Zhang, H.-M. Improvements of the Daily Optimum Interpolation Sea Surface Temperature (DOISST) Version 2.1. J. Clim. 2021, 34, 2923–2939. [Google Scholar] [CrossRef]
- Reynolds, R.W.; Smith, T.M.; Liu, C.; Chelton, D.B.; Casey, K.S.; Schlax, M.G. Daily High-Resolution-Blended Analyses for Sea Surface Temperature. J. Clim. 2007, 20, 5473–5496. [Google Scholar] [CrossRef]
- Banzon, V.; Smith, T.M.; Chin, T.M.; Liu, C.; Hankins, W. A long-term record of blended satellite and in situ sea-surface temperature for climate monitoring, modeling and environmental studies. Earth Syst. Sci. Data 2016, 8, 165–176. [Google Scholar] [CrossRef]
- Wang, Y.; Zhang, C.; Tian, S.; Chen, Q.; Li, S.; Zeng, J.; Wei, Z.; Xie, S. Seasonal cycle of marine heatwaves in the northern South China Sea. Clim. Dyn. 2023, 61, 3367–3377. [Google Scholar] [CrossRef]
- Zhang, X.; Zheng, F.; Zhu, J.; Chen, X. Observed Frequent Occurrences of Marine Heatwaves in Most Ocean Regions during the Last Two Decades. Adv. Atmos. Sci. 2022, 39, 1579–1587. [Google Scholar] [CrossRef]
- Yang, Y.; Sun, W.; Yang, J.; Lim Kam Sian, K.T.C.; Ji, J.; Dong, C. Analysis and prediction of marine heatwaves in the Western North Pacific and Chinese coastal region. Front. Mar. Sci. 2022, 9, 1048557. [Google Scholar] [CrossRef]
- Oh, H.; Chu, J.-E.; Min, Y.; Kim, G.-U.; Jeong, J.; Lee, S.; Lee, J.; Jeong, J.-Y. Late-arriving 2023 summer marine heatwave in the East China Sea and implications for global warming. Npj Clim. Atmos. Sci. 2024, 7, 294. [Google Scholar] [CrossRef]
- Sato, H.; Takemura, K.; Ito, A.; Umeda, T.; Maeda, S.; Tanimoto, Y.; Nonaka, M.; Nakamura, H. Impact of an unprecedented marine heatwave on extremely hot summer over Northern Japan in 2023. Sci. Rep. 2024, 14, 1–14. [Google Scholar] [CrossRef] [PubMed]
- Liu, S.; Zuo, J.; Shu, Y.; Ji, Q.; Cai, Y.; Yao, J. The intensified trend of coastal upwelling in the South China Sea during 1982-2020. Front. Mar. Sci. 2023, 10, 1084189. [Google Scholar] [CrossRef]
- Li, Z.; Wang, F.; Li, B.; Du, D.; Zhang, H.; Song, Y.; Du, S.; Sun, L. Paleoenvironmental changes and East Asian winter monsoon evolution: Evidence from coastal sedimentary sequence of the Last Glacial in the Shandong Peninsula, China. Front. Earth Sci. 2022, 19, 135–148. [Google Scholar] [CrossRef]
- Shi, P.; Li, Y.; Biswas, A.; Wei, K.; Hou, M. Spatial-temporal evolution and intrinsic drivers of compound drought and heatwave events in Mainland China. Sci. Total. Environ. 2024, 948, 174834. [Google Scholar] [CrossRef]
- Cheng, L.; Abraham, J.; Trenberth, K.E.; Fasullo, J.; Boyer, T.; Mann, M.E.; Zhu, J.; Wang, F.; Locarnini, R.; Li, Y.; et al. Another Year of Record Heat for the Oceans. Adv. Atmos. Sci. 2023, 40, 963–974. [Google Scholar] [CrossRef]
- Zhao, Y.; Yu, R.-C.; Kong, F.-Z.; Li, X.-Y.; Wang, J.-X. Seasonal impacts of Kuroshio intrusion on pico-phytoplankton dynamics near the Changjiang River estuary. Mar. Environ. Res. 2024, 202, 106789. [Google Scholar] [CrossRef]
- Plume, G.; Walter, R.K.; Cobb, I.; Dalsin, M.; Mazzini, P.L.F.; Shunk, N.P.; Robbins, I.; Connolly, T.P. Vertical structure of subsurface marine heatwaves in a shallow nearshore upwelling system. Sci. Rep. 2025, 15, 1–13. [Google Scholar] [CrossRef]
- Jiang, Y.; Zhao, F.; Shi, X.; Cao, L.; Zeng, C. Fronts affect fish community structure in the Yangtze River estuary and its adjacent area. J. Sea Res. 2024, 199, 102507. [Google Scholar] [CrossRef]
- Lipfert, L.; Hand, R.; Brönnimann, S. A Global Assessment of Heatwaves Since 1850 in Different Observational and Model Data Sets. Geophys. Res. Lett. 2024, 51, e2023GL106212. [Google Scholar] [CrossRef]
- Oliver, E.C.J. Mean warming not variability drives marine heatwave trends. Clim. Dyn. 2019, 53, 1653–1659. [Google Scholar] [CrossRef]
- Oliver, E.C.J.; Donat, M.G.; Burrows, M.T.; Moore, P.J.; Smale, D.A.; Alexander, L.V.; Benthuysen, J.A.; Feng, M.; Gupta, A.S.; Hobday, A.J.; et al. Longer and more frequent marine heatwaves over the past century. Nat. Commun. 2018, 9, 1324. [Google Scholar] [CrossRef]
- Bergsma, S.; Zeyl, T.; Anaraki, J.R.; Guo, L. C2FAR: Coarse-to-Fine Autoregressive Networks for Precise Probabilistic Forecasting. arXiv 2023. [Google Scholar] [CrossRef]
- Tan, Y.; Xie, L.; Cheng, X. Neural Differential Recurrent Neural Network with Adaptive Time Steps. arXiv 2023. [Google Scholar] [CrossRef]
- Lin, S.; Lin, W.; Wu, W.; Zhao, F.; Mo, R.; Zhang, H. SegRNN: Segment Recurrent Neural Network for Long-Term Time Series Forecasting. arXiv 2023. [Google Scholar] [CrossRef]
- Bai, L.; Zhao, R.; Lin, S.; Chai, Z.; Wang, X. An improved GRU method for slope stress prediction. Sci. Rep. 2025, 15, 1–18. [Google Scholar] [CrossRef] [PubMed]
- Saraswat, R.; Kumar, A. Stock Price Forecasting With Integration of Sectoral Behavior: A Deep Auto-Optimized Multimodal Framework. J. Forecast. 2025, 44, 1767–1784. [Google Scholar] [CrossRef]
- Dibiantara, D.P.; Adha, A.; Darmawan, M.S.; Imjai, T.; Russell, J.; Laory, I. Spatio–temporal enhanced anomaly detection in FRP bridge monitoring using MPCA, biGRU, and attention mechanisms. J. Civ. Struct. Health Monit. 2025, 15, 1837–1855. [Google Scholar] [CrossRef]
Disclaimer/Publisher’s Note: The statements, opinions and data contained in all publications are solely those of the individual author(s) and contributor(s) and not of MDPI and/or the editor(s). MDPI and/or the editor(s) disclaim responsibility for any injury to people or property resulting from any ideas, methods, instructions or products referred to in the content. |
© 2025 by the authors. Licensee MDPI, Basel, Switzerland. This article is an open access article distributed under the terms and conditions of the Creative Commons Attribution (CC BY) license (https://creativecommons.org/licenses/by/4.0/).

