Article

Estimation of Hydraulic Characteristics of Unsaturated Loess with SEM Images Based on Fractal Theory

1
School of Water and Environment, Chang’an University, No. 126 Yanta Road, Xi’an 710054, China
2
Key Laboratory of Subsurface Hydrology and Ecological Effects in Arid Region of the Ministry of Education, Chang’an University, No. 126 Yanta Road, Xi’an 710054, China
3
Key Laboratory of Eco-Hydrology and Water Security in Arid and Semi-Arid Regions of the Ministry of Water Resources, Chang’an University, No. 126 Yanta Road, Xi’an 710054, China
*
Author to whom correspondence should be addressed.
Water 2025, 17(21), 3072; https://doi.org/10.3390/w17213072
Submission received: 18 September 2025 / Revised: 17 October 2025 / Accepted: 25 October 2025 / Published: 27 October 2025
(This article belongs to the Section Hydrogeology)

Abstract

The accurate determination of the soil-water characteristic curve (SWCC) and unsaturated hydraulic conductivity is vital across multiple disciplines, including hydrogeology, soil science and geotechnical engineering. Nevertheless, conventional techniques for measuring these unsaturated soil parameters are often laborious and time-consuming, posing significant practical challenges. This research presents a new technique for estimating SWCC and unsaturated hydraulic conductivity by employing fractal theory and utilizing a three-dimensional fractal dimension (Ds). The results revealed that all three soils exhibited fractal characteristics in their particle surfaces, with Ds values of 2.611 for Malan loess, 2.688 for paleosol, and 2.771 for remolded loess. The complexity of the pore structure was in the order of remolded loess > paleosol > Malan loess. The test results of the soil-water characteristic curve indicate that the water storage capacity of the three soils was in the order of paleosol > remolded loess > Malan loess. Compared with the Brooks-Correy fitting curve, the fractal model is feasible in predicting the soil-water characteristic curve. Two models were used to predict the unsaturated hydraulic conductivities of three types of soil, and the results were compared with the measured values. By comparing the R2 and RMSE values of the fractal model and the Brooks-Corey model, it was found that the fractal model proposed in this paper can effectively predict the unsaturated hydraulic properties of these three types of soil. This study provides a simple and effective alternative for predicting the SWCC and unsaturated hydraulic conductivity of unsaturated soils, with potential applications in various earth science fields.

1. Introduction

The soil-water characteristic curve (SWCC) and the unsaturated hydraulic conductivity of soil are key parameters for characterizing the hydraulic behaviors of unsaturated soil [1,2,3]. They are of great significance in the prevention and control of geological disasters, the simulation of hydrological processes, and the design of geotechnical engineering [4,5]. As a typical aeolian unsaturated soil in China, the unique vertical joints and macro porous structure of Chinese loess leads to significant nonlinearity and complexity in its hydraulic response [6,7]. Under the superimposed influence of climate change and human activities, disasters such as landslides and collapsibility frequently occur in the Chinese Loess Plateau region, and their triggering mechanisms are closely related to the water migration process [8,9,10]. However, traditional SWCC prediction methods (such as empirical formula methods and physical-empirical model methods) are limited by problems such as the vague physical meaning of parameters and large prediction deviations in the high suction range. These shortcomings hinder the ability of such methods to accurately represent the structural properties inherent to natural loess [11,12,13].
Accurate estimation of unsaturated soil hydraulic conductivity constitutes a fundamental requirement across multiple geoscience disciplines, such as civil/petroleum engineering, hydrogeology, pedology, vadose zone hydrology, and engineering geology [14,15,16]. The SWCC serves as the cornerstone for analyzing unsaturated soil hydraulic properties, yet conventional laboratory testing method faces significant challenges such as time-intensive procedures, high costs, and susceptibility to equipment limitations and operator bias [17]. To address these constraints, three primary modeling approaches have emerged for SWCC prediction: empirical formulations, physico-empirical models, and fractal geometry techniques [18,19]. Empirical models, exemplified by van Genuchten, Brooks-Corey, and Fredlund & Xing equations, establish mathematical relationships between soil physical indices and SWCC parameters [20,21,22]. While widely implemented across various soil types, these models suffer from inherent limitations such as ambiguous parameter physicality and constrained applicability. For instance, the van Genuchten model demonstrates superior fitting performance for clays, whereas Brooks-Corey shows particular efficacy for sandy soils. For other soil types, they may generate big prediction errors. The Fredlund & Xing model, despite its computational precision, lacks mechanistic interpretation of parameters, impeding fundamental understanding [23,24]. Physico-empirical models attempt to bridge particle size distribution (PSD) with SWCC characteristics through semi-theoretical frameworks. However, their practical utility remains constrained by notable prediction deviations in high-suction regimes and insufficient generalization capabilities [11,25]. In contrast, fractal geometry approaches have revolutionized SWCC prediction by leveraging the intrinsic self-similarity of soil pore-grain systems [26,27,28,29]. Many scholars such as Rieu and Sposito [30], Tyler and Wheatcraft [31], Xu [32] and Tao et al. [33] have established fractal models which effectively linked the microscopic soil structure with the macroscopic hydraulic behavior. These models eliminate empirical parameter arbitrariness by directly linking fractal dimensions (quantifying pore/granular complexity) to measurable soil physical properties. The fractal paradigm offers dual advantages: (1) Enhanced prediction accuracy through physically grounded parameterization of pore topology-water retention relationships; (2) Mechanistic insights into how hierarchical soil structures govern hydraulic responses. By integrating multiscale pore network characteristics, fractal models circumvent experimental variability while elucidating structure-property interactions, emerging as an efficient alternative for concurrent SWCC and unsaturated hydraulic conductivity determination [34,35].
Since its inception by Mandelbrot [36], fractal theory has undergone profound development in soil science, evolving into a multidimensional research framework. In porous media studies, three key parameters, particle fractal dimension, pore fractal dimension, and three-dimensional fractal dimension, have emerged as critical descriptors of structural characteristics, each presenting unique advantages and limitations [37,38,39]. The particle fractal dimension primarily characterizes the complexity of particle size distribution. Its strength lies in directly reflecting particle size distribution patterns, facilitating understanding of spatial packing characteristics and filling modes [40]. This proves particularly valuable for investigating porous media properties such as packing density and specific surface area. For instance, in soil research, it enables analysis of particle aggregation states to evaluate soil aeration and water retention capacity. However, this approach focuses exclusively on particulate matter while neglecting pore architecture and particle-pore interactions, thereby failing to comprehensively capture complex physical processes within porous media [41]. Conversely, the pore fractal dimension quantifies the structural complexity of void spaces, encompassing pore size distribution, morphology, and connectivity [37,39,42]. This parameter proves indispensable for analyzing fluid transport mechanisms, particularly in petrophysical studies of seepage patterns. Nevertheless, its principal limitation stems from examining pore networks in isolation, disregarding particle-induced pore constraints and their three-dimensional synergistic effects, resulting in incomplete characterization of complex porous systems [43,44]. In contrast, the three-dimensional fractal dimension demonstrates superior comprehensive capabilities. This holistic parameter integrates the structural complexity of porous media in three-dimensional space, simultaneously accounting for particle distribution patterns, pore network characteristics, and their spatial interdependencies. Such integration enables more authentic and complete representation of actual porous structures [38,45]. Natural loess, as a typical unsaturated porous medium, exhibits heterogeneous particle assemblages and intricate pore networks [6,7]. Compared to conventional fractal dimensions, the three-dimensional approach significantly enhances prediction accuracy for fluid flow patterns by overcoming previous limitations. It enables quantitative characterization of particulate and porous features while objectively reflecting loess physical properties and textural composition [46,47].
In this study, a joint prediction mode was constructed by combining fractal theory and unsaturated soil mechanics to predict the SWCC and unsaturated hydraulic conductivity of three different soils, aiming to explore the ability of the three-dimensional fractal theory in characterizing their hydraulic properties. This research provides a theoretical basis for the risk assessment of geological disasters and the precise simulation of unsaturated seepage in the Chinese Loess Plateau and promoting the in-depth application of fractal theory in environmental geotechnical engineering.

2. Materials and Methods

2.1. Sampling and Preparation

The study area is located in Jingyang County (Xianyang City, Shaanxi Province), in the Guanzhong Plain. The site spans 108°29′40″–108°58′23″ E and 34°26′37″–34°44′57″ N, covering 780 km2 of terrain sloping from NW to SE. Well-exposed, complete loess-paleosol sequences characterize the terrace strata (Figure 1a).
The loess layers in the southern plateau of Jingyang are well exposed. The schematic diagram of the typical loess profile in the southern plateau of Jingyang is shown in Figure 1b. The planting soil is located at the top layer, with a thickness of about 2–3 m. Next is the Malan loess, with a thickness of about 10 m. Below the Malan loess, there is a layer composed of about 4.5 m of paleosol and calcium nodules, with the paleosol being light purplish red and about 3.8 m thick. The lower part contains a layer of about 0.7 m of calcium nodules. The alternating sequence of the Middle Pleistocene Lishi loess and paleosol is the main stratum of the southern plateau of Jingyang, with a thickness of approximately 70 m. The Lishi loess is mainly composed of fine particles and has a color of grayish yellow. Some layers have a large number of snail shells distributed in them. The bottom of the paleosol layer contains calcium nodules.
In the study area, the maximum depth affected by water infiltration is approximately 10 m underground. The depth of Malan loess from the ground surface was approximately 2–3 m, and that of the first paleosol layer was approximately 13–15 m (Figure 1b). The depth of the Malan loess layer and the first layer of paleosol is precisely within this range. In engineering projects in the loess regions, Malan loess, which is widely used as a natural foundation and fill material, undergoes structural reformation due to disturbance during the construction process, thereby significantly altering its hydraulic properties. To study the applicability of fractal theory in loess region, this research takes the undisturbed Malan loess, undisturbed paleosol soil, and remolded loess as the research objects (For convenience, the three types of soils will be collectively referred to as Malan loess, paleosol, and remolded loess in the subsequent sections of this paper). According to the undisturbed soil sample preparation method stipulated in the Chinese Standard for Geotechnical testing method [48], undisturbed Malan loess and undisturbed paleosol were collected from the distinct loess strata with obvious outcrops. The baseline characteristics of the soil samples are provided in Table 1.
Grain-size analysis (Figure 1c) revealed distinct differences between Malan loess and paleosol: Malan loess is silt-dominated with low clay content, while paleosol exhibits significantly higher clay content, indicative of contrasting depositional and pedogenic processes [49].
The mineral composition of Malan loess and paleosol is shown in Table 2. Malan loess is usually formed in arid or semi-arid regions, where wind-sediment deposits undergo relatively weak weathering and leaching processes. The primary carbonates and calcium-containing minerals in the sediments, when subjected to leaching, form secondary carbonates that are preserved. Therefore, the carbonate content in loess is relatively high. Paleosol is usually formed under warmer and more humid climatic conditions, which are conducive to the decomposition and transformation of minerals in the soil. Clay minerals are usually gradually formed during the soil formation process through the weathering, leaching, and deposition of parent rocks. In warm and humid climates, these processes are more active, so the content of clay minerals is also relatively high. Additionally, the content of clay minerals is also affected by soil leaching processes. During soil formation, elements that are easily mobile, such as Na, Ca, and Mg, undergo significant leaching loss, while elements with relatively weak mobility, such as Al and Si, are relatively enriched. These processes further influence the formation and distribution of clay minerals, resulting in a higher content of clay minerals in paleosol than in loess.

2.2. Theoretical Background

2.2.1. Fractal Model of SWCC and Unsaturated Hydraulic Conductivity

Fractal theory is an effective method to predict soil hydraulic properties based on soil structure and has made great contributions to the development of unsaturated soil theory and application. According to Xu [32] and Tao et al. [33], the fractal model describing the three-dimensional fractal dimension and SWCC can be described as follows:
S e = θ θ r θ s θ r = ψ aev ψ 3 D s , ψ ψ aev 1 , ψ < ψ aev
where Se is effective saturation (%), ψ is matrix suction (kPa), θ is soil volumetric water content (cm3/cm3), θs is soil saturated volumetric water content (cm3/cm3), ψaev is air-entry value (kPa), θr is the residual moisture content (cm3/cm3) and Ds is the three-dimensional fractal dimension.
Regarding the unsaturated hydraulic conductivity, Mualem [50] proposed the model (Equation (2)) for determining the relative hydraulic conductivity of unsaturated soil as:
k r θ = S e 0.5 θ r θ d x ψ x / θ r θ s d x ψ x 2
where kr(θ) is the relative hydraulic conductivity, and kr(θ) = k(θ)/ks, k(θ) is the unsaturated hydraulic conductivity (cm/s), ks is the saturated hydraulic conductivity (cm/s).
To derive the fractal model for determining the relative hydraulic conductivity for unsaturated soils, first, the derivative of Equation (1) yields:
d θ = ( θ s θ r ) D s 3 ψ aev 3 D s ψ D s 4 d ψ
If θ = x, then dθ = dx. Then, substituting Equation (3) into Equation (2) gives:
k r ψ = S e 0.5 ψ d ψ θ s θ r D s 3 ψ aev 3 D s ψ D s 5 d ψ ψ d ψ aev θ s θ r D s 3 ψ aev 3 D s ψ D s 5 d ψ 2
where ψd is the maximum suction value (kPa). Since ψaev much less than ψd, and Ds < 3, (ψaev/ψd)4−Ds is close to 0 and can be neglected. Therefore, Equation (4) can be further simplified as:
k r ψ = S e 0.5 ψ aev ψ 4 D s 2
Substitute the expression of Se (Equation (1)) into Equation (5), and according to the relationship among the relative hydraulic conductivity, unsaturated hydraulic conductivity and saturated hydraulic conductivity (kr(ψ) = k(ψ)/ks), the mathematical expression of unsaturated hydraulic conductivity based on fractal theory is:
k ψ = k s ,                                                                 ψ ψ aev k ψ = k s ψ aev ψ 9.5 2.5 D s ,           ψ > ψ aev

2.2.2. Theory of Three-Dimensional Fractal Dimension Calculation

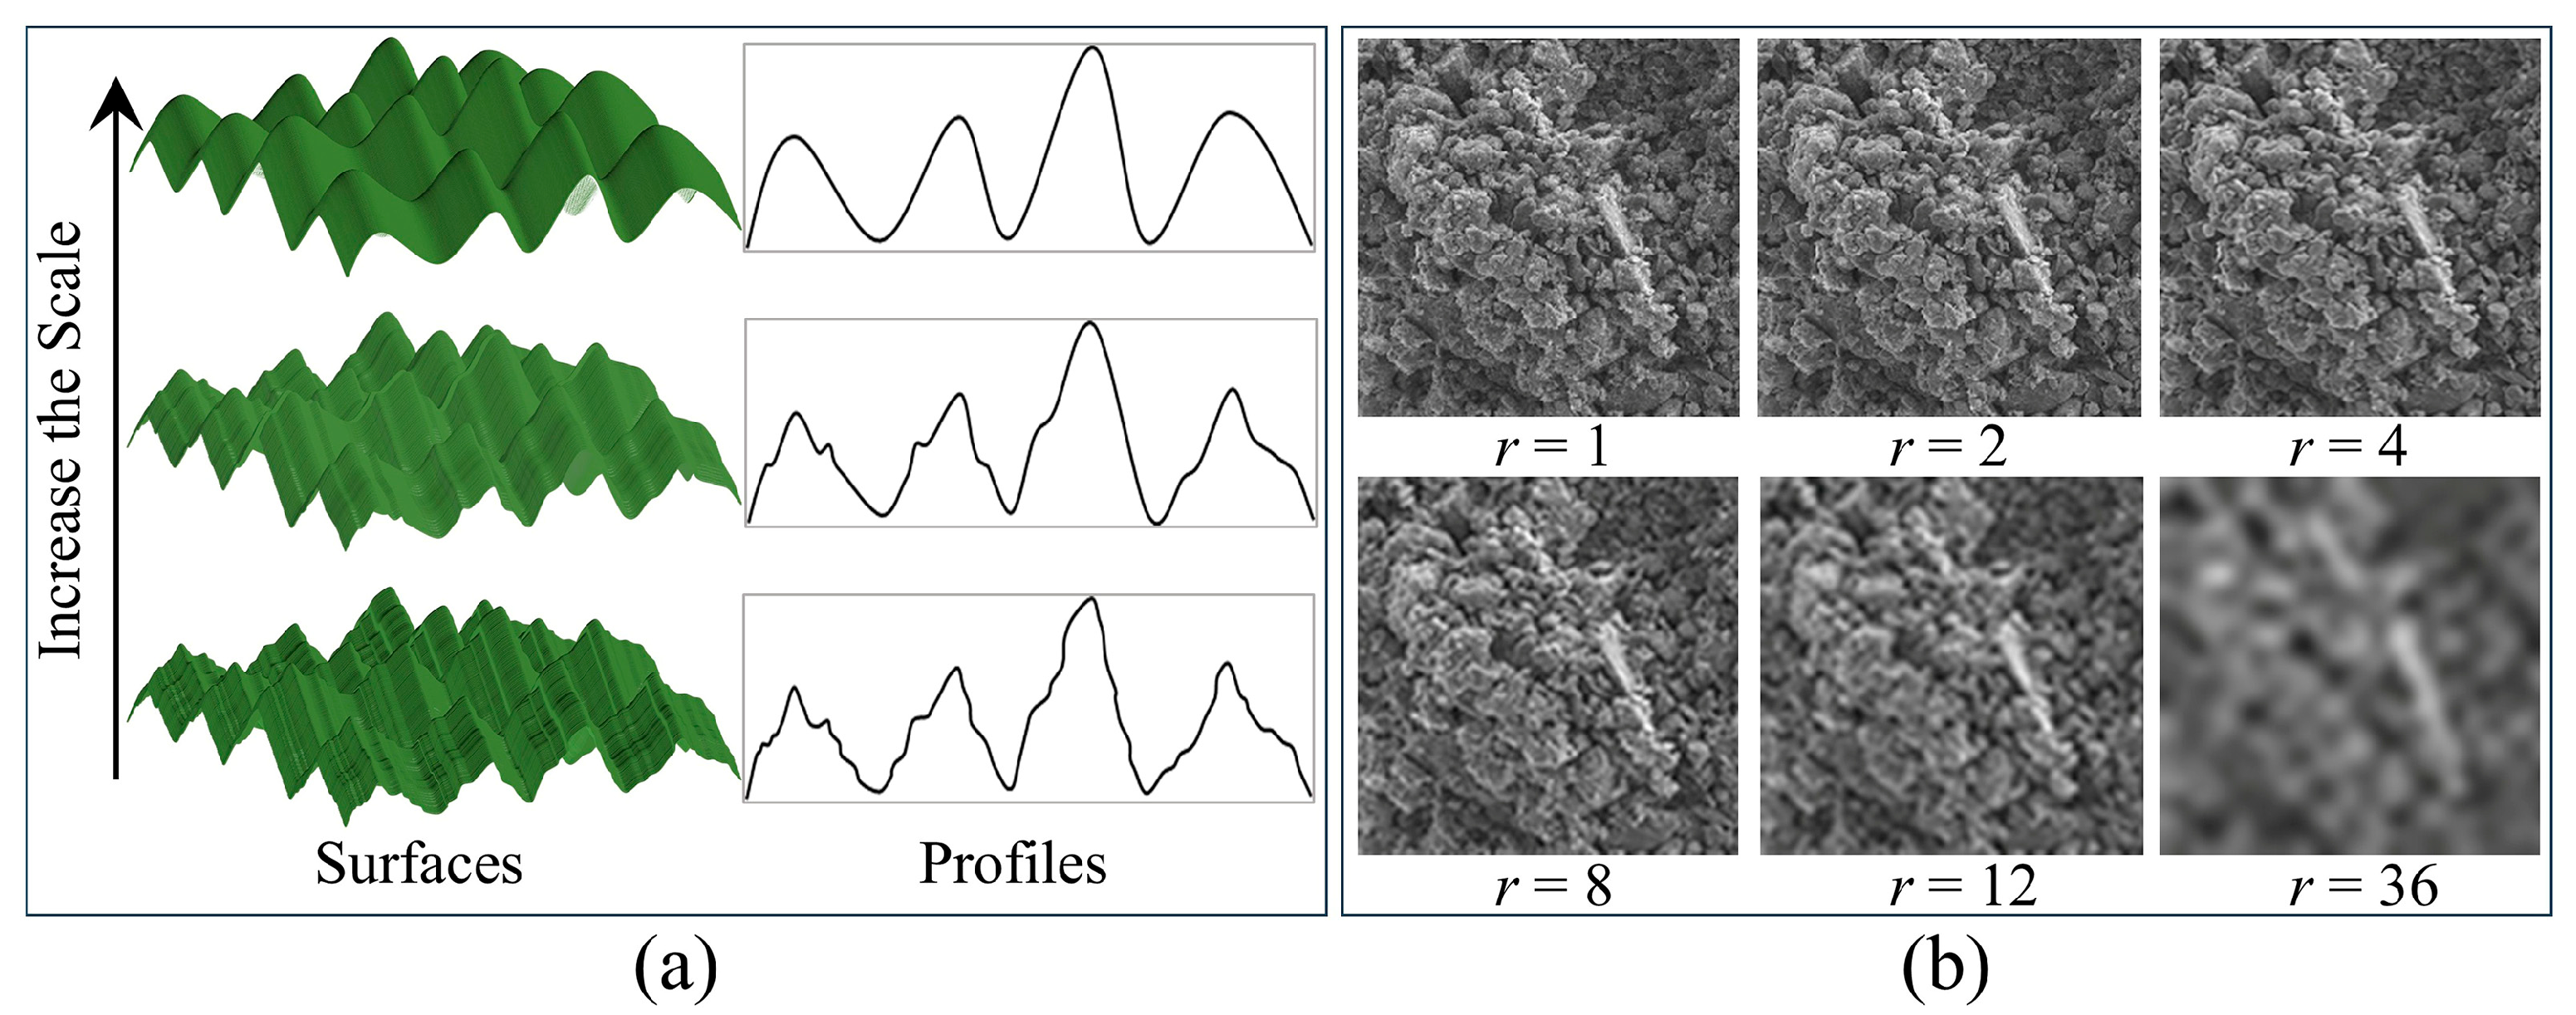
One of the defining characteristics of the fractal dimension (Ds) of porous media is that it is determined by the measurement scale r. As shown in Figure 2a, as the calculation scale r is gradually increased, the information of the surface undulation of the image will gradually decrease, and the image becomes blurrier. The three-dimensional fractal dimension (Ds) of the soil microstructure was calculated based on the scale-dependent surface area method. Surface areas (A(r)) were computed at multiple measurement scales (r), where r was defined as an integer multiple of the SEM image pixel size. Surface area A(r) at each scale was derived from three-dimensionally reconstructed surfaces of SEM images (Figure 2b). This reconstruction process generated triangular meshes representing the imaged surface topography, and the total surface area of the mesh at scale r provided A(r).
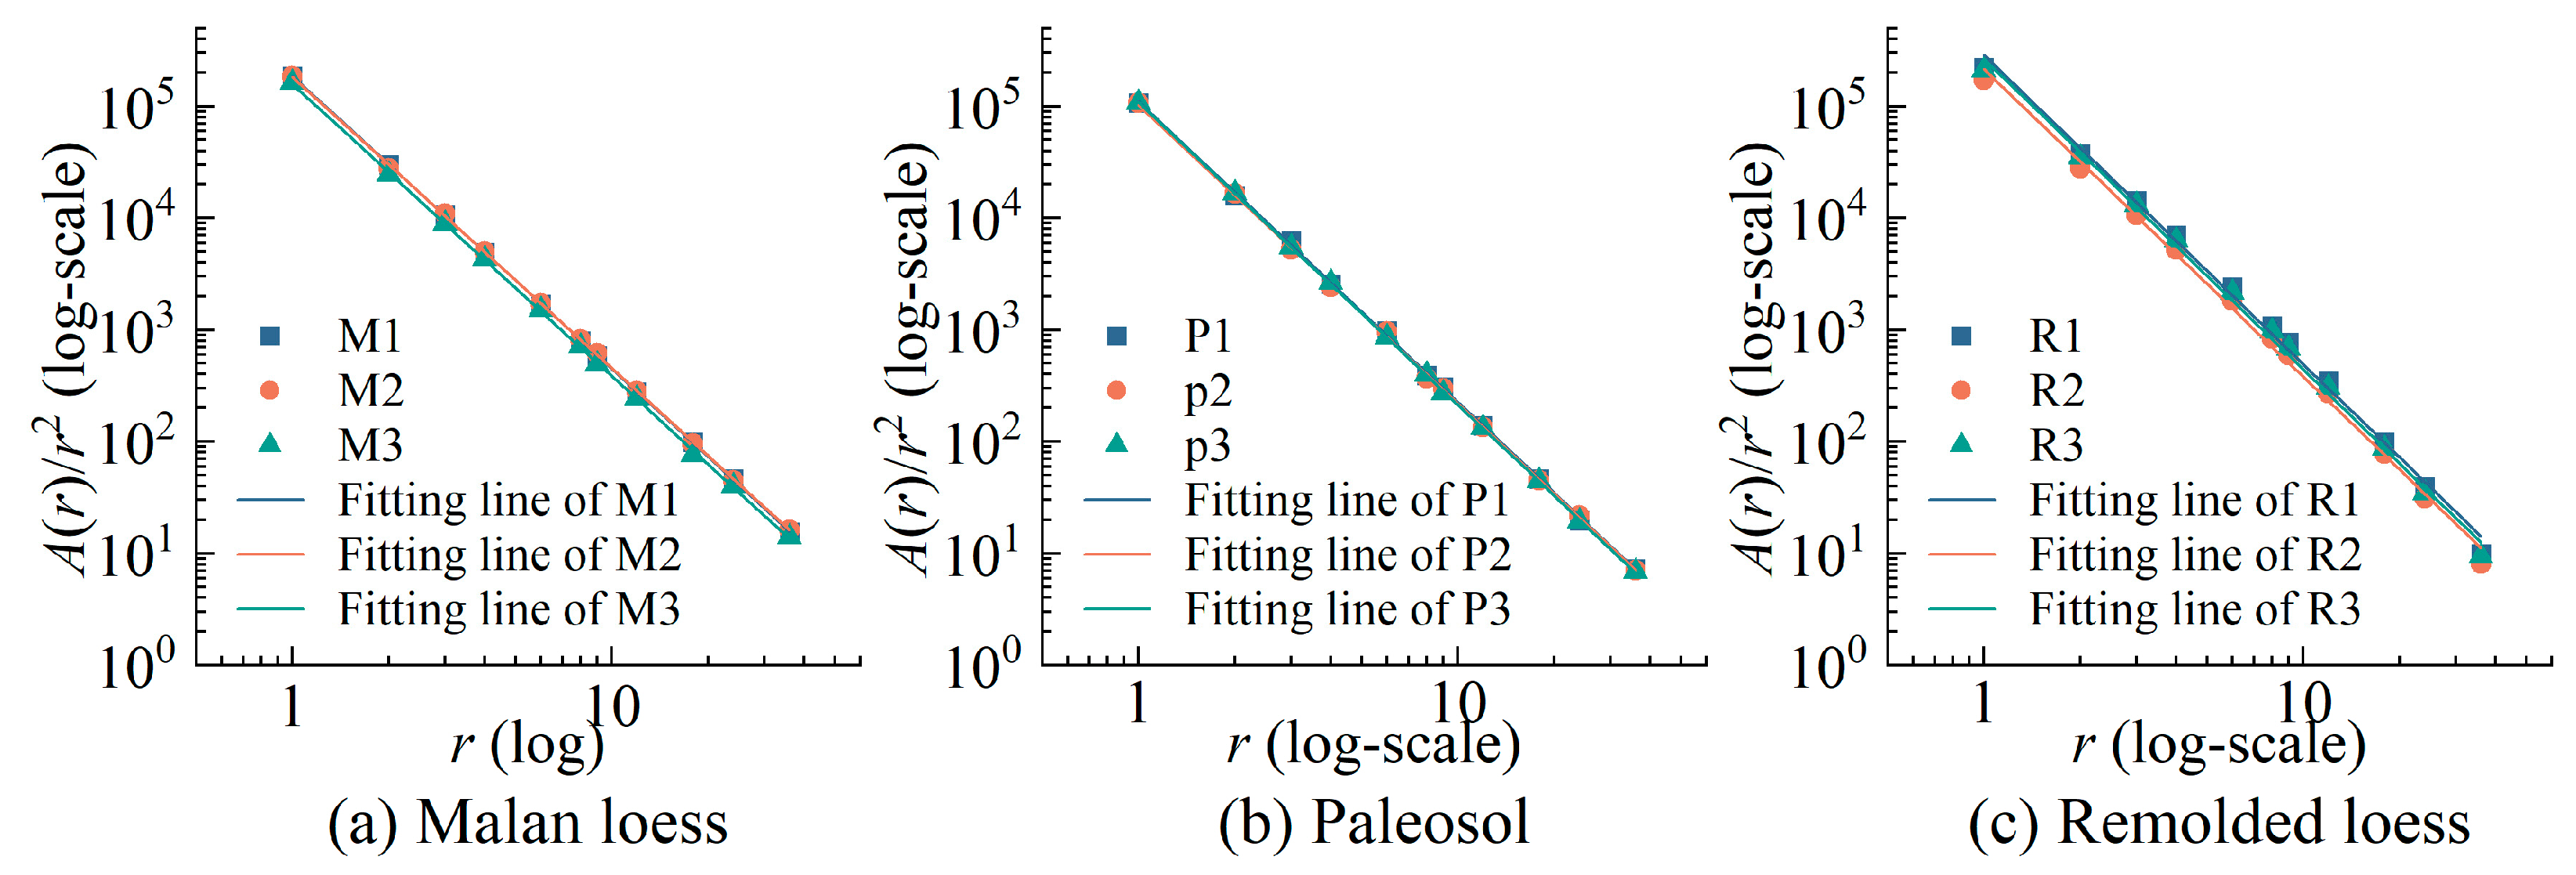
The fractal dimension Ds is given by the negative slope of the linear regression line in the log-log plot of normalized surface area A(r)/r2 versus scale r (Equation (7)):
lg A r r 2 = D s lg r + lg C 0
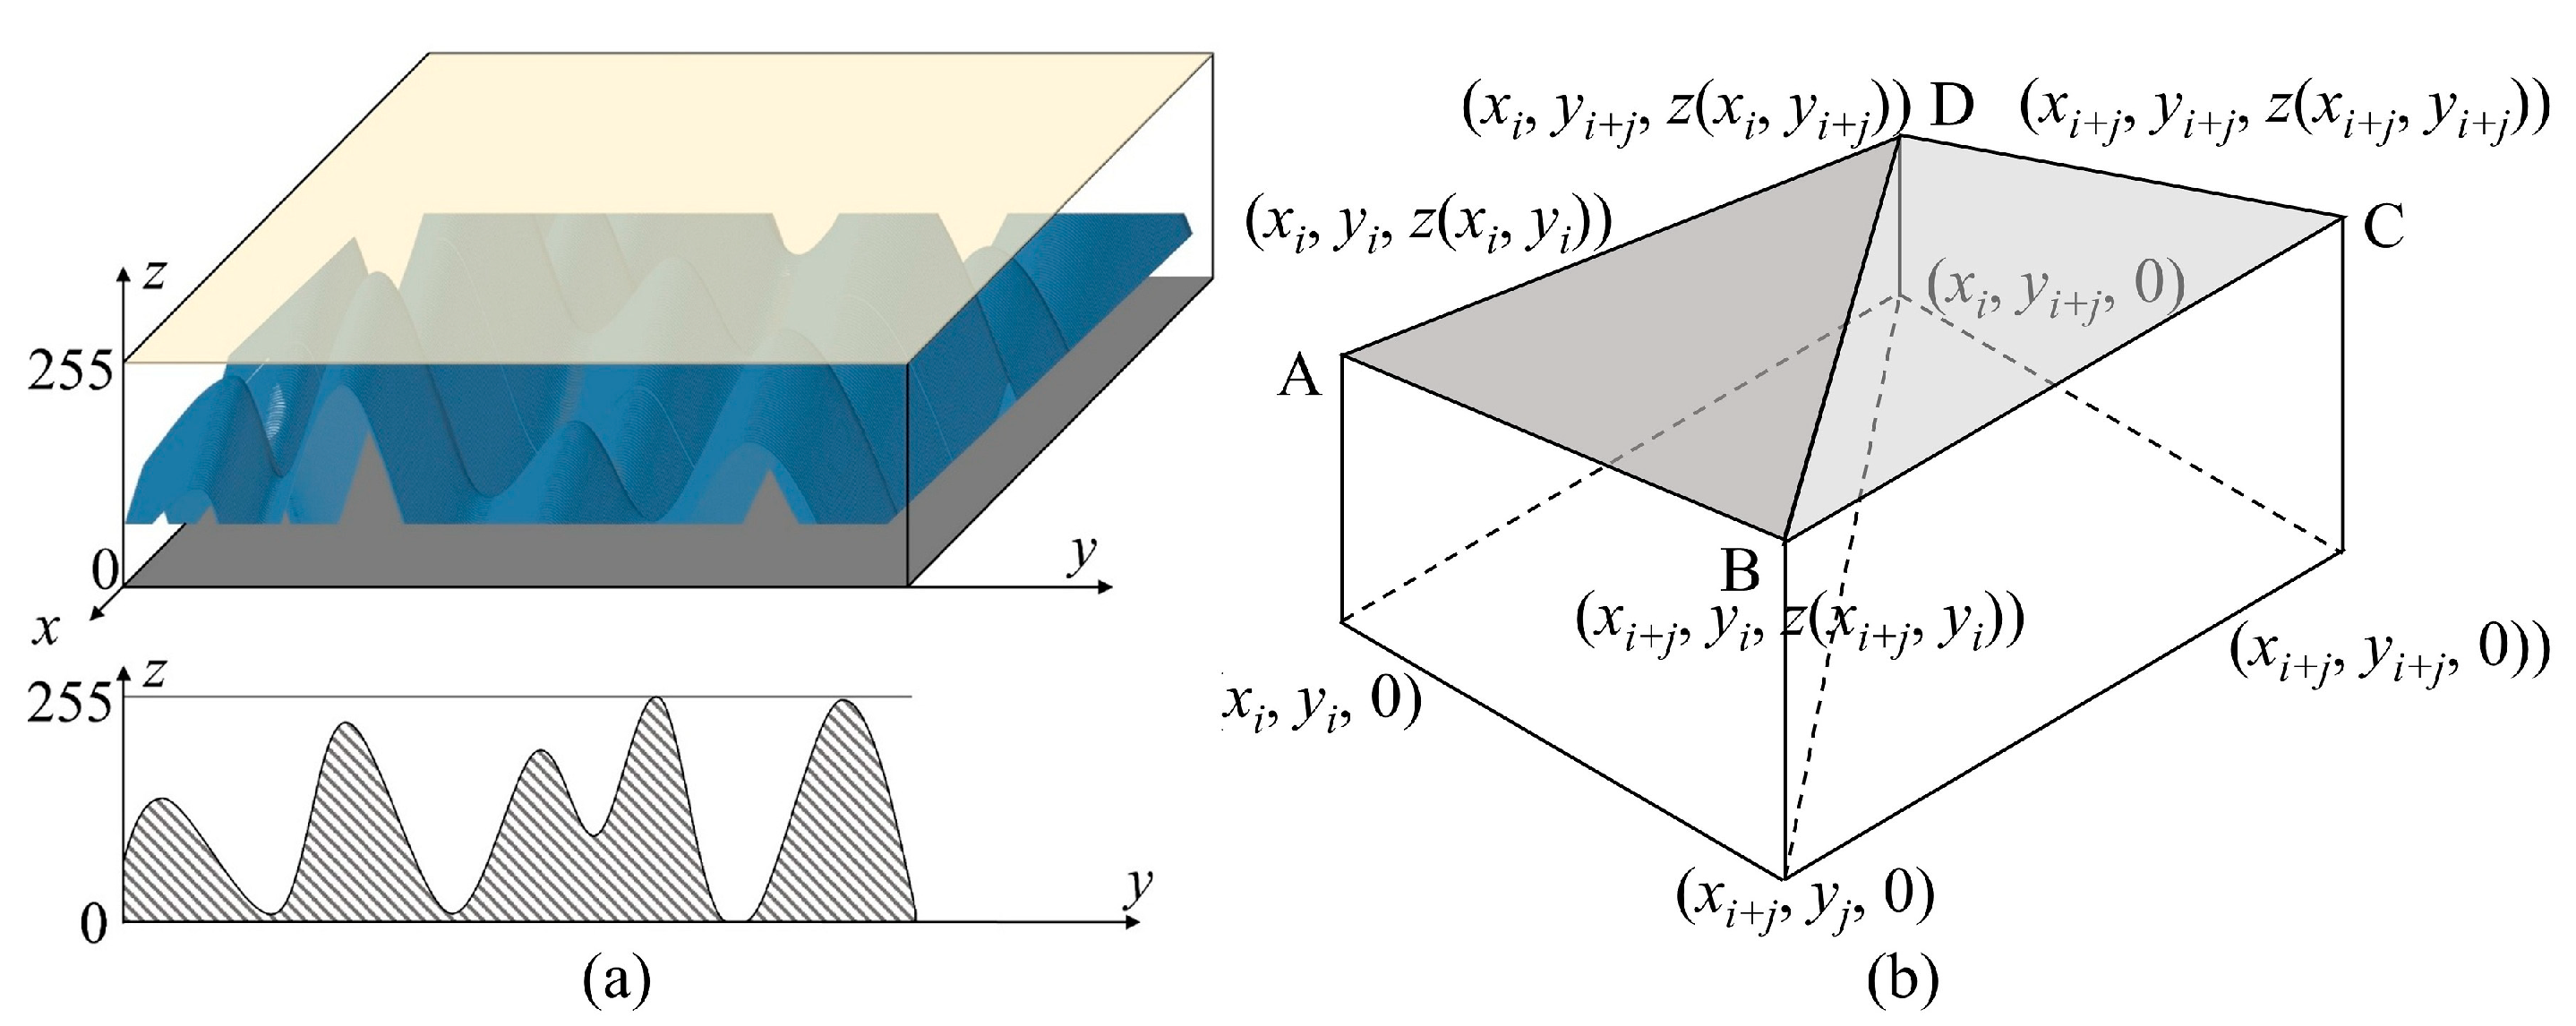
The geometric parameters such as the surface area and volume of soil pores and particles are the basis for calculating the fractal dimension. Assuming that the surfaces of microscopic particles (pores) in the soil have fractal properties, the SEM images are processed in three dimensions using Arcgis 10.3, and then the surface area A(r) is calculated by applying the principle of irregular triangular grids. The scale r is taken as an integer multiple of the minimum pixel size of SEM (Figure 2b). As shown in Figure 3a, a plane parallel to the x-y plane is drawn at the lowest point of the three-dimensional image. The space between this lowest plane and the interface is regarded as soil particles, and similarly, the space between the highest plane and the interface is regarded as pores. As shown in Figure 3b, four points A, B, C, and D are selected on the three-dimensional undulating surface. Connecting the coordinate points can obtain two spatial triangles, and the sum of their areas can be regarded as the approximate value of the surface area of the region enclosed by these four points. The volume of the space between this region and any plane can be approximated by the volume between the spatial triangle and the plane. By reducing the spacing between points A, B, C, and D, the approximate value can be gradually approached to the exact value.
In Figure 3b, the sum of the areas of the spatial triangles can be calculated by using the Heron’s formula (Equation (8)):
A i = p i p i A B p i B D p i A D + q i q i B C q i C D q i B D
p i = 1 2 A B + B D + A D ,   q i = 1 2 B C + C D + B D
where Ai represents the sum of the areas of the irregular grid spaces of the ith one; ǀABǀ indicates the distance between points A and B in the figure, and so on. The distances between each point are calculated using spatial coordinates, taking ǀABǀ as an example.
A B = x i + j x i 2 + y j y i 2 + z x i + j , y j z x i , y j 2
Introduce Δx = xi+jxi, Δy = yi+jyi, and assume that the SEM image consists of m*n pixels. Then, the three-dimensional surface area A(r) of the SEM image can be calculated by the following equation:
A r = lim Δ x 0 Δ y 0 i = 0 m j = 0 n A i
When calculating the fractal dimension, it is necessary to perform scaling processing on the pixels of the image. Moreover, according to the calculation method of fractal dimension, it can be known that when the soil has fractal characteristics, in the logarithmic coordinate axis, A(r)/r2 and r under different scaling multiples are in a linear relationship. Therefore, the magnification factor of the original image has little influence on this study. In this study, we choose to use an image with a magnification factor of 800 times to calculate the three-dimensional fractal dimension.

2.2.3. Calculation of Key Parameters

The fractal model for characterizing soil-water properties, as expressed in Equation (1), incorporates three principal unknown parameters in addition to the fractal dimension. These include the saturated water content (θs), the residual water content (θr), and the air entry value (ψaev). The saturated water content (θs, cm3/cm3) refers to the water content of soil or rock-soil medium when it is in a fully saturated state (all pores are filled with water), and it is determined by the inundation saturation method [51,52]. The residual moisture content (θs, cm3/cm3) is an important parameter for the hydraulic characteristics of unsaturated soil and plays a significant role in the study of the hydraulic and mechanical properties of unsaturated soil. This paper adopts the natural air-drying method to determine the residual moisture content of soil samples. ψaev is the critical point on the SWCC, indicating that the maximum pores in the soil are unable to resist the applied suction and thus lose water [53]. Based on the Young-Laplace equation [54], the expression of ψaev is:
ψ aev = 2 T s cos α R
where Ts signifies the surface tension of the liquid (typically 0.072 N/m), and α represents the contact angle (ψaev indicates that the largest pores in the soil cannot withstand the applied suction force. At this point, the soil is nearly saturated. it is usually assumed that α = 0° and cosα = 1), and R is the maximum pore radius of the soil and can be obtained from the quantitative analysis of SEM images.
The IPP 6.0 software was used for the quantitative analysis of SEM image. Initially, the original images underwent brightness and contrast enhancement to improve the discernibility of pore and particle boundaries. A median filter was then applied to correct isolated pixel errors. This was followed by the use of a low-value filter to remove random noise, thereby simplifying and increasing the accuracy of image segmentation. Finally, pore boundaries were automatically detected based on the HSI color model, and the image was binarized. In the resulting binary image, each pixel is represented as either white (soil particles) or black (pores). The detailed steps can be found in Xu et al. [55] and Wen et al. [56].

2.2.4. Error Analysis

The root mean square error (RMSE) and the coefficient of determination (R2) are commonly used evaluation metrics in regression models, which are employed to assess the predictive performance and fitting effect of the model. R2 represents the proportion of variance in the dependent variable that is predictable from the independent variable [57]. The closer the coefficient of determination is to 1, the better the model fits. The definition of the coefficient of determination is:
R 2 = 1 S S R S S T
where SSR is the sum of squared residuals, representing the sum of the squared deviations between the model’s predicted values and the actual values, reflecting the unexplained variation. SST, the total sum of squares, quantifies the total variation in the observed data. It is computed as the cumulative total of squared differences between each data point and the global mean of the response variable, reflecting the total variation in the data. SSR and SST can be calculated using the following formulas:
S S R = i = 1 n ( y i Y i ) 2
S S T = i = 1 n ( y i Y ¯ ) 2
where yi is the observed value of the ith data point, Yi is the predicted value of the ith data point by the model, and Y ¯ is the mean of all the predicted value.
RMSE is the average value of the squared errors between the predicted values of the regression model and the actual observed values. The calculation formula is as shown in Equation (9). The smaller the value of RMSE, the more accurate the model’s prediction.
R M S E = i = 1 n ( y i Y i ) 2 n

2.3. Laboratory Test

2.3.1. SEM Test

Soil microstructure (pores and particles) was examined using environmental scanning electron microscopy (SEM) on sample fresh surfaces [58]. Undisturbed soil samples were trimmed to cylinders (approximately 2 cm height × 1 cm diameter) and freeze-dried. To stabilize particles and obtain a fresh fracture surface, samples were prepared following Xu et al. [7] and Luo et al. [59]. Samples were then gold-coated and imaged using an FEI Nova NanoSEM 230 (Thermo Fisher, Waltham, MA, USA) scanning electron microscope.

2.3.2. Measurement of SWCC and Unsaturated Hydraulic Conductivity

To validate the fractal model of the SWCC detailed above, measuring and determining the SWCC is needed. In this study, the filter paper method was used to measure the SWCC of soil samples during the humidification process. The operation of filter paper method of measuring SWCC includes sample drying and weighing, sample humidification, sample water balance, measurement and weighing, etc. [60,61]. Two soil samples with a quality difference in no more than 3 g were selected as one group for water addition. The soil samples were humidified using the water film transfer method. The soil samples after adding water were wrapped in protective films and sealed. Two pre-prepared soil samples with the same moisture content were placed in the same sealed bag. They were left to stand in a constant temperature and humidity environment for 3 days to allow the moisture in the soil samples to diffuse evenly. After 3 days, the weights of the ring knife and the soil samples were re-measured to calculate the actual moisture content of the soil samples. If the error between the actual moisture content and the pre-determined moisture content does not exceed 3%, then it is considered that the soil sample has met the test standard. When the water in the filter paper and the soil reaches the equilibrium state, the matrix suction can be obtained through the weighing of the filter paper and the conversion of the determination curve, and the water content can be obtained through the mass calculation of the upper and lower soil samples. In this paper, Whatman’s No. 42 filter paper, which is widely used, was selected. And the rate curve equation of this filter paper is shown in Equation (17) [61].
log ψ = 5.327 0.0779 w f         w f < 45.3 %                               log ψ = 2.412 0.0135 w f         w f 45.3 %
where ψ is matric suction (kPa), wf (g/g) is the mass moisture content of the filter paper. The specific operation procedures can be referred to in ASTM [61] and Li et al. [62].
Transient profile method is an important technical means for modern research on unsaturated soil mechanics [62,63]. In this study, the filter paper method and the transient profile method were combined to construct a set of high-precision transient hydraulic parameter testing system. The test device is shown in Figure 4a, consisting of the upper water supply system and the lower soil column. The entire soil column was placed on a semi-circular acrylic stand to ensure its stability. The entire device is enclosed in an acrylic cylinder to prevent evaporation and the environmental temperature is 20 °C.
The volume water content profiles and water head profiles along the soil column at different times were measured during the test. Using these profiles, the unsaturated hydraulic conductivity curve can be calculated (Figure 4b). The detailed process of calculating the unsaturated hydraulic conductivity using transient profile method can be found in Li et al. [62] and Ngyuen et al. [63].

3. Results and Discussion

3.1. Three-Dimensional Fractal Dimension

Based on the scale effect of the three-dimensional surface area of the pores, set the calculation scale r = 1, 2, 3, 4, 6, 8, 9, 12, 24, 36. Utilizing the principle of irregular triangular grids, the particle (pore) surface area A(r) was calculated. The results were shown in Figure 5. Figure 5 shows the double logarithmic relationship curve between the calculated values of particle (pore) surface area and the measurement scale (A(r)/r2r). The calculated values of surface area decrease significantly with the continuous increase in the calculation scale. And the three soil samples can be linearly fitted, confirming that the microscopic particle (pore) surface areas of the three soil bodies have fractal properties. The fractal dimension Ds is the negative slope of the fitted straight line and the fitting parameters were shown in Table 3. The fractal dimensions Ds of Malan loess, paleosol and remolded loess are 2.611, 2.688 and 2.771, respectively. As shown in Figure 5 and Table 3, for the same type of soil, the obtained Ds values from different shooting areas are relatively close, with differences in less than 1% among the three. The influence of sampling area variability on Ds can be disregarded.
Fractal dimension is an important parameter for quantifying the complexity and heterogeneity of soil pore structure. Its value reflects the self-similarity characteristics of the pore space. The complexity of a pore system is directly indicated by its fractal dimension; values closer to 3 denote greater intricacy, manifested through a broader pore size distribution and more irregular pore morphologies [64]. Therefore, in terms of the complexity of pore networks, remolded loess > paleosol > Malan loess. During the process of soil formation, Malan loess mainly undergoes physical weathering and retains the sorting characteristics of the original aeolian sediments. The particle size is relatively uniform, mainly composed of silt, lacking fine clay and organic matter. The pore structure is simple and highly interconnected, presenting a relatively regular pore network with a low fractal dimension [65,66]. Paleosol has undergone long-term chemical weathering and biological modification, resulting in the decomposition of primary minerals into secondary clay minerals, an increase in clay content, and the presence of organic matter. The pore system becomes more complex, featuring the coexistence of micropores, mesopores and macropores at multiple levels, and the fractal dimension increases [42,67]. For remolded loess, during the remolding process, the soil structure of loess changes. The primary large pores are destroyed, the contact between particles becomes tighter, and the number of small pores increases [68]. In addition, compaction occurred during the remolding process. The compaction process causes changes in the soil pore structure, thereby increasing the irregularity of the pore structure and maximizing the fractal dimension [68].

3.2. Prediction Curve of Soil-Water Characteristics Based on Fractal Theory

3.2.1. The Test Data of SWCC

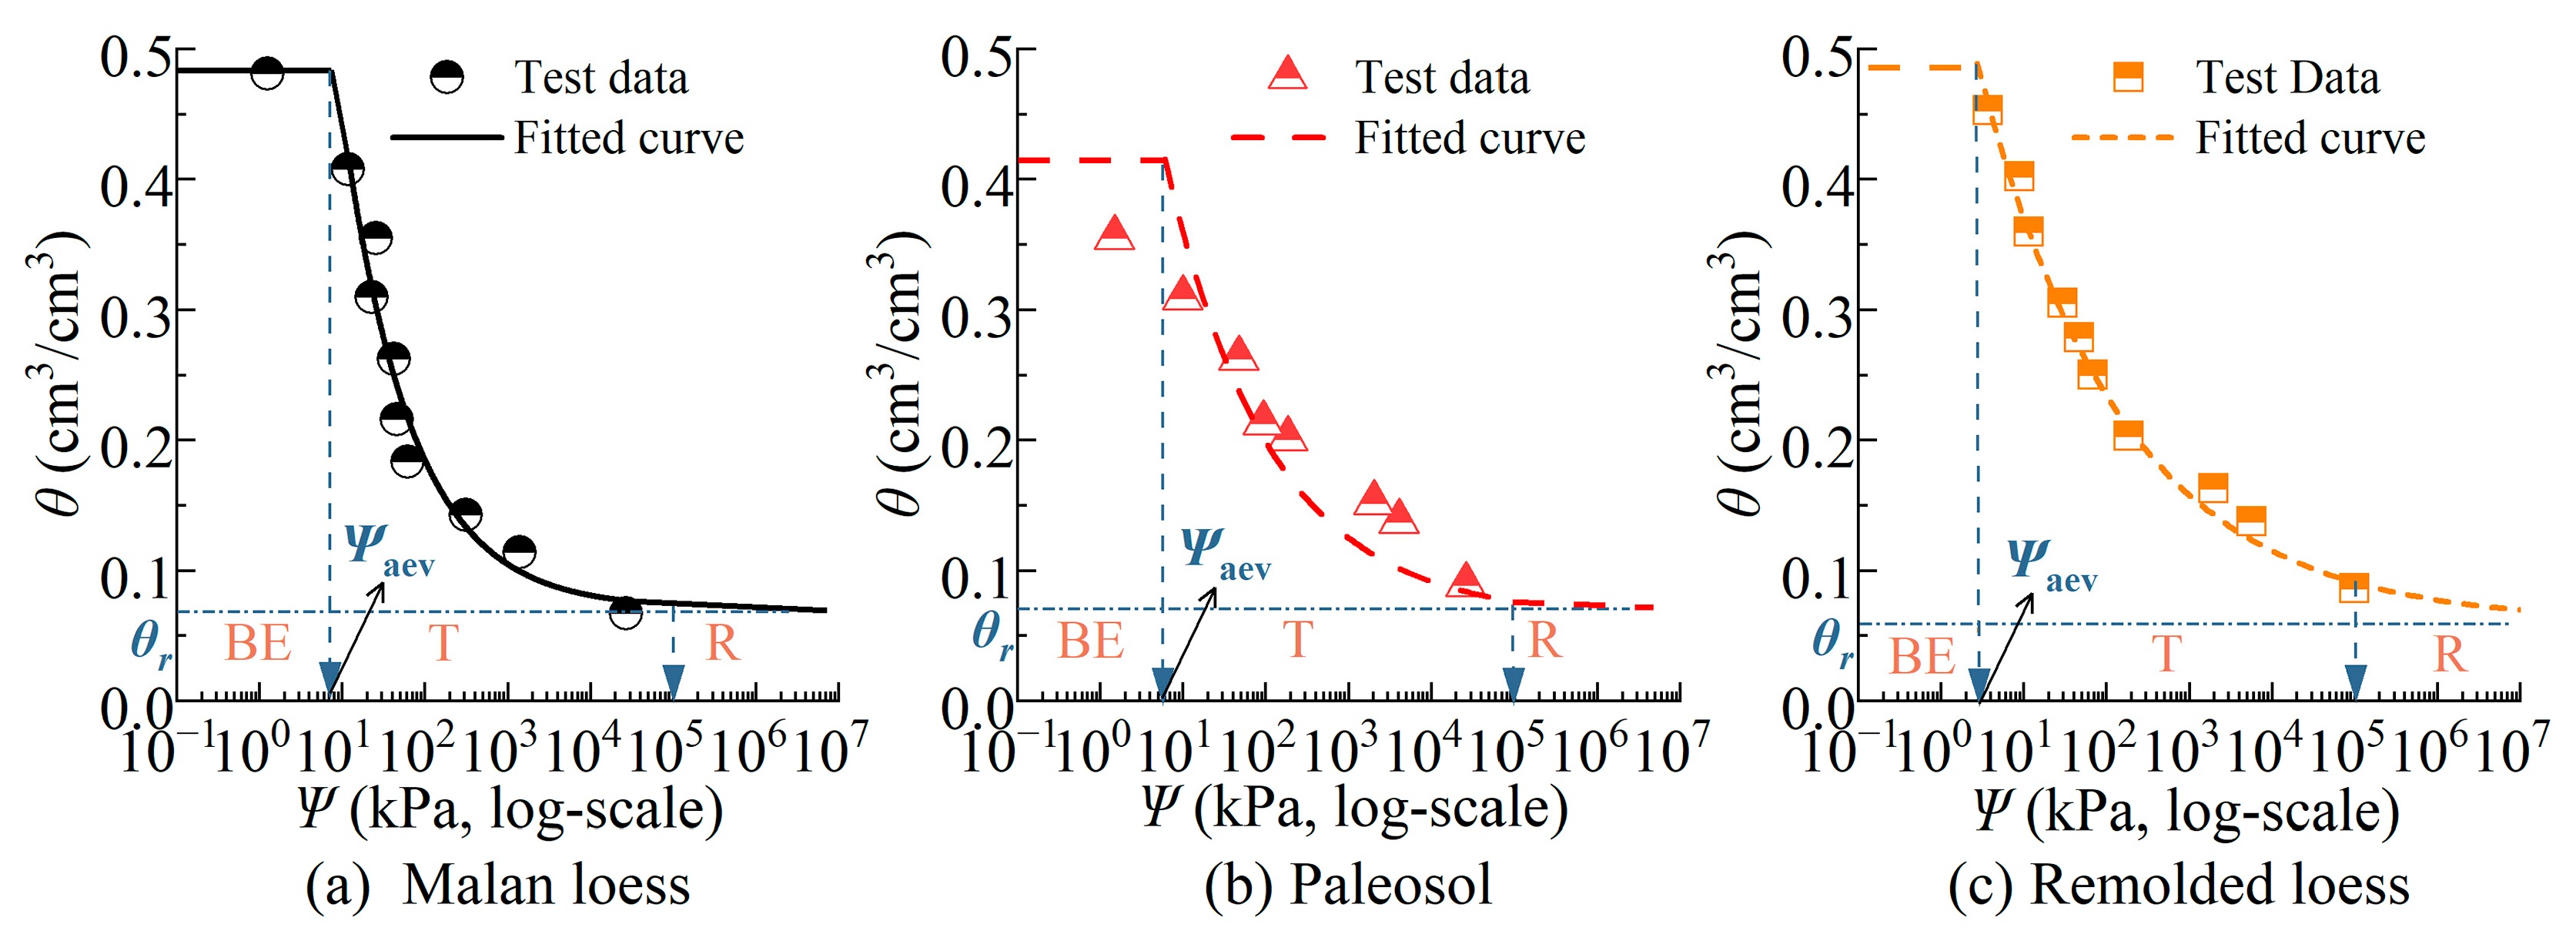
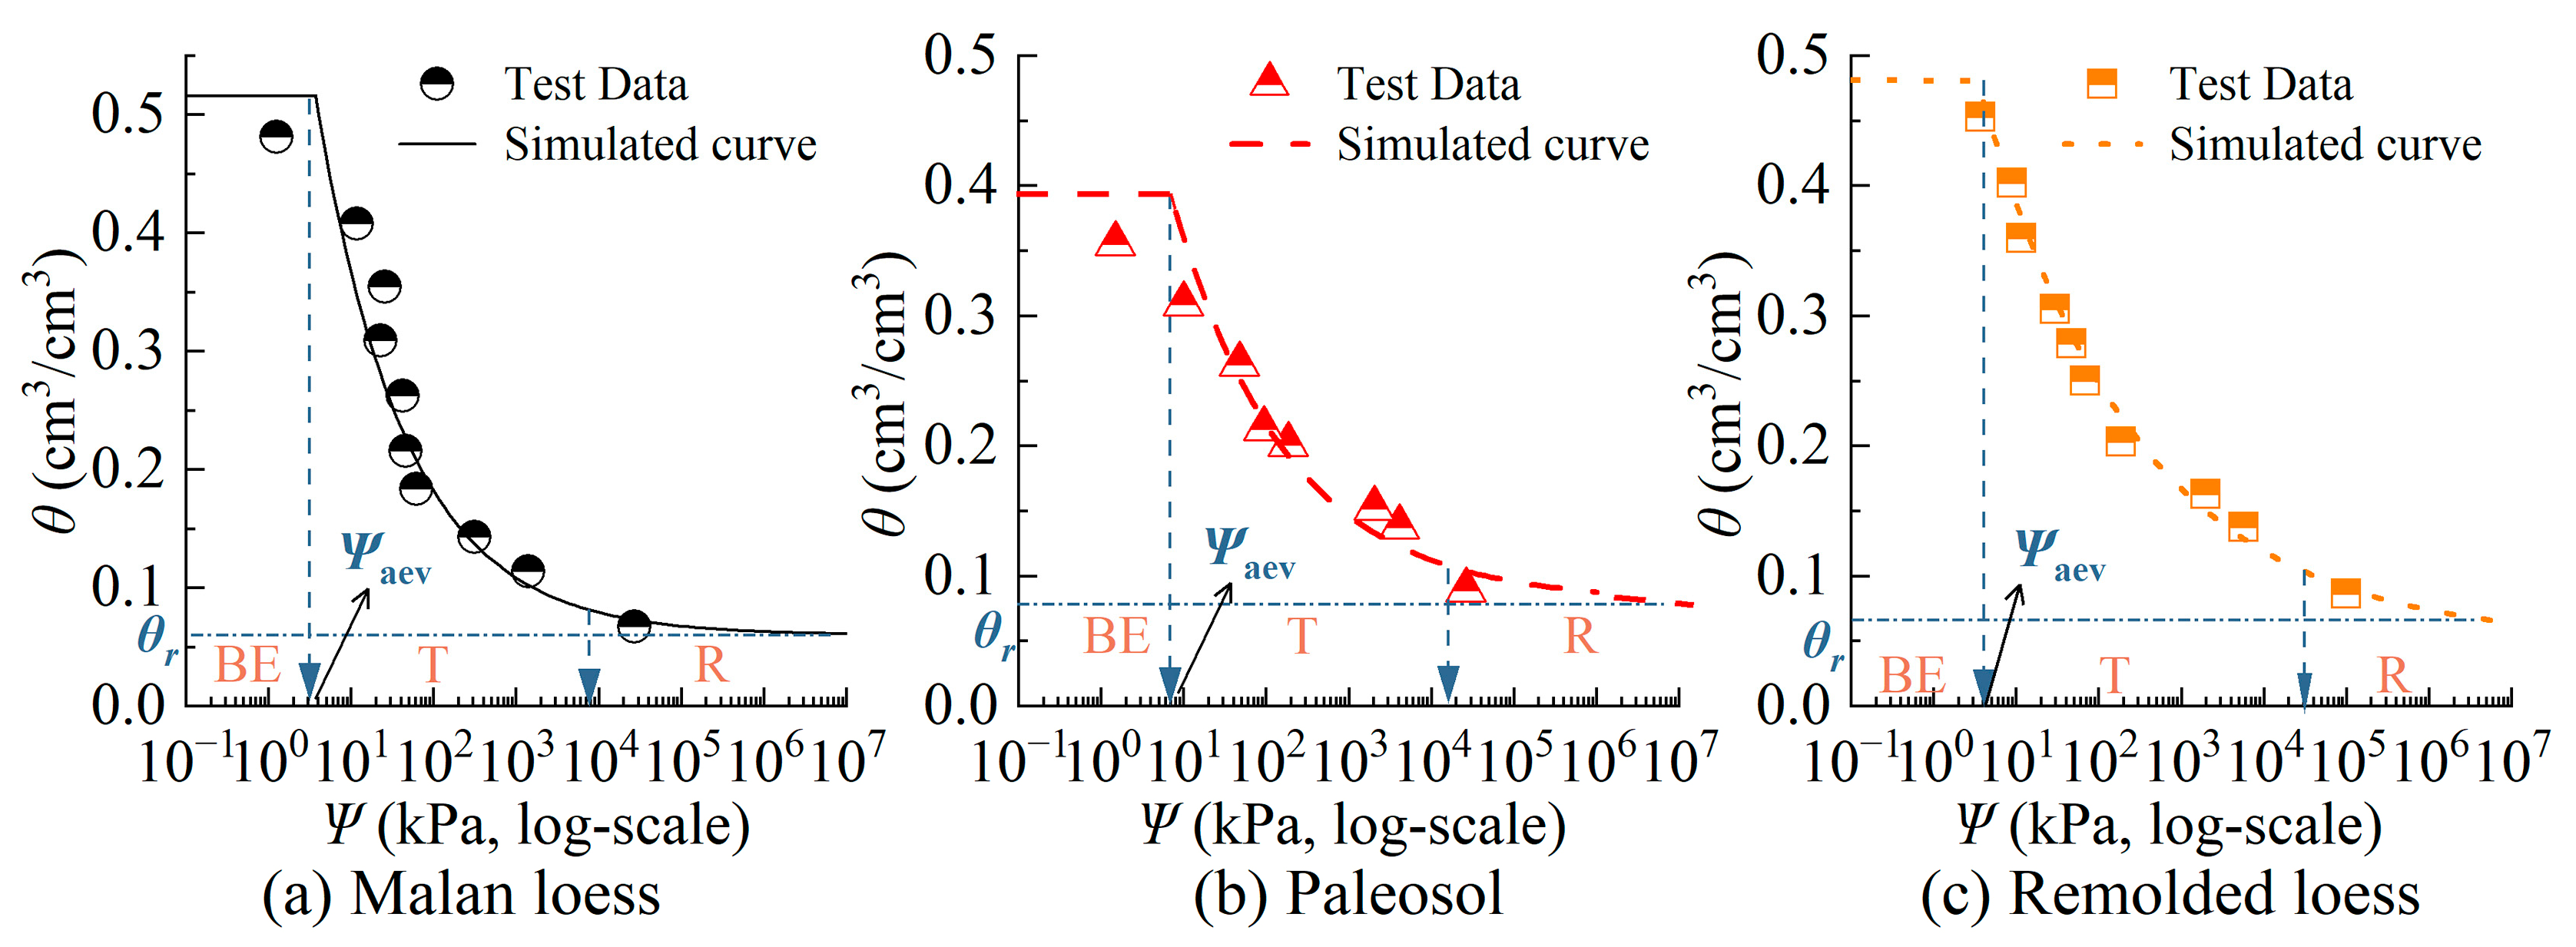
The traditional Brooks-Corey equation was used to fit the SWCC test data measured by the filter paper method. The parameter ‘n’ characterizes the rate of inflection observed within the transient zone and serves as an indicator of how uniformly distributed the pore sizes are. Values closer to unity suggest a more homogeneous pore structure, whereas lower values indicate greater variability. A summary of the fitted parameters for the Brooks-Corey model is provided in Table 4, and the corresponding model curves are displayed in Figure 6.
Figure 6 displays the SWCCs for the three investigated soil types, which were obtained via the filter paper technique and subsequently modeled using the Brooks-Corey equation. Marked discrepancies can be seen in both the water retention at equivalent suction levels and the slopes of the corresponding curves, reflecting distinct hydraulic properties. Malan loess exhibits a steeper decline in the transitional zone and covers a broader saturated-transitional region compared to paleosol (Figure 6a,b), indicating faster moisture release and easier water movement. In contrast, paleosol transitions earlier into the residual stage, confirming its stronger water retention capacity [68,69]. The remolded loess shows a transitional zone wider than that of Malan loess but with a gentler slope than paleosol (Figure 6c). Based on the Brooks-Corey model fitting, the water storage capacity ranks as follows: paleosol > remolded loess > Malan loess.
The variation in SWCC across soil samples is primarily governed by particle size distribution and the compaction degree of the soil skeleton. Soils with higher proportions of fine-grained materials exhibit enhanced particle adsorption capacity. Furthermore, increased clay content correlates with a reduced inflection rate in the transitional section of the curve [60]. Particle composition also directly affects pore structure: coarse particles form larger pores, whereas fine particles promote smaller pore channels [70].
The steep transitional zone in the curve of Malan loess reflects a rapid and concentrated water release process. Due to its formation through physical weathering, Malan loess retains the sorting characteristics of aeolian deposits, resulting in relatively uniform pore sizes [71]. This uniformity favors capillary-dominated water transport, causing significant changes in water content over a narrow suction range. In contrast, paleosol undergoes long-term chemical weathering and biological activity, transforming primary minerals into secondary clay minerals. Coarse particles are reduced through leaching or fragmentation, while fine particles accumulate, leading to poor sorting. Fine particles fill larger pores, forming a multi-level pore network [72], which increases water retention complexity and heterogeneity. Consequently, its SWCC is flatter, and water release occurs over a wider suction range. For remolded loess, the original structure is altered during remolding: macropores are destroyed, particle contact tightens, and smaller pores increase while total porosity decreases [73]. Compaction further enhances pore irregularity and reduces sorting, thereby improving water retention and slowing down water release.
The fitting parameters are shown in Table 4. Values of θr, ψaev, and r2 are 0.0708 cm3/cm3, 7.203 kPa, and 0.889 for Malan loess; 0.0827 cm3/cm3, 6.541 kPa, and 0.854 for Paleosol; and 0.0623 cm3/cm3, 2.74 kPa, and 0.962 for remolded loess. Generally, soils with high water storage capacity exhibit greater ψaev, indicating higher suction resistance to air entry and better water retention by small pores. Soils with low water retention show lower ψaev and rapid water release under low suction [60,74]. Similarly, a high θr reflects strong adsorption by fine particles and micropores under high suction (>104 kPa), while a low θr indicates limited residual moisture [75].
However, the ψaev and θr values derived from the Brooks-Corey model do not align consistently with the actual water storage capacities of these soils. This discrepancy suggests that while the Brooks-Corey model accurately captures suction changes in the transitional zone, it performs less reliably in characterizing the boundary (low-suction) and residual (high-suction) zones. One reason is that filter paper measurements at very high and low water contents, specifically beyond ψaev and below θr, provide less reliable suction data for model fitting [60,61]. Since ψaev and θr are a priori unknown, all measured data points were included in the fitting process.

3.2.2. The Predicted SWCC Based on Fractal Theory

Fractal theory is an effective method for predicting soil hydraulic properties based on soil structure. In this section, the three-dimensional fractal dimension is measured based on SEM microscopic images, and combined with the θs, ψaev and θr measured in Section 2.2.3 to predict the SWCCs for the three soil types (Table 5). The predicted curves were compared against experimental data, and an error assessment was conducted to evaluate the applicability of the fractal model.
Since the ψaev and θr of the fractal model were actually measured, the test data points below air-entry suction were excluded during model comparison. As shown in Figure 6 and Figure 7, the fractal-based model captures the water retention behavior across soil types. For Malan loess (Figure 7a), the predicted curve agrees well with measured data above ψaev (Boundary zone), indicating effective structural characterization. The prediction for Paleosol (Figure 7b) is generally flat and shows slight deviation in the medium-suction range (102–104 kPa), which can be attributed to its complex aggregated and fissured structure resulting from strong pedogenesis, leading to greater sample variability despite controlled testing conditions [76]. Remolded loess (Figure 7c) exhibits excellent agreement between prediction and measurement. The fractal model consistently ranks water storage capacity as paleosol > remolded loess > Malan loess, aligning with the Brooks-Corey model results. The values of R2 between predicted and measured curves are 0.891, 0.879, and 0.973, respectively. The values of RMSE between predicted and measured curves are 0.0037, 0.0121, 0.0011, respectively.
Compared with the Brooks-Corey model, the fractal model of the SWCC can also well describe the water-holding capacity of the three types of soil. The three parameters of the fractal model all have actual physical meanings and can be obtained through simple tests or calculations [77]. In contrast, the parameter n of the Brooks-Corey model depends on model fitting in this study. It requires conducting SWCC tests first (such as using a pressure plate apparatus, filter paper method, etc.) to obtain data and then fitting the data to achieve the SWCC. The fractal model is much simpler than the Brooks-Corey model. The three-dimensional fractal dimension and the air-entry value can be determined directly through the analysis of SEM images, streamlining the required analytical process. Then, by using the water-saturated method and air-drying method to obtain the residual water content, the SWCC of the corresponding soil can be obtained [28,40].

3.3. Prediction of Unsaturated Hydraulic Conductivity Based on Fractal Theory

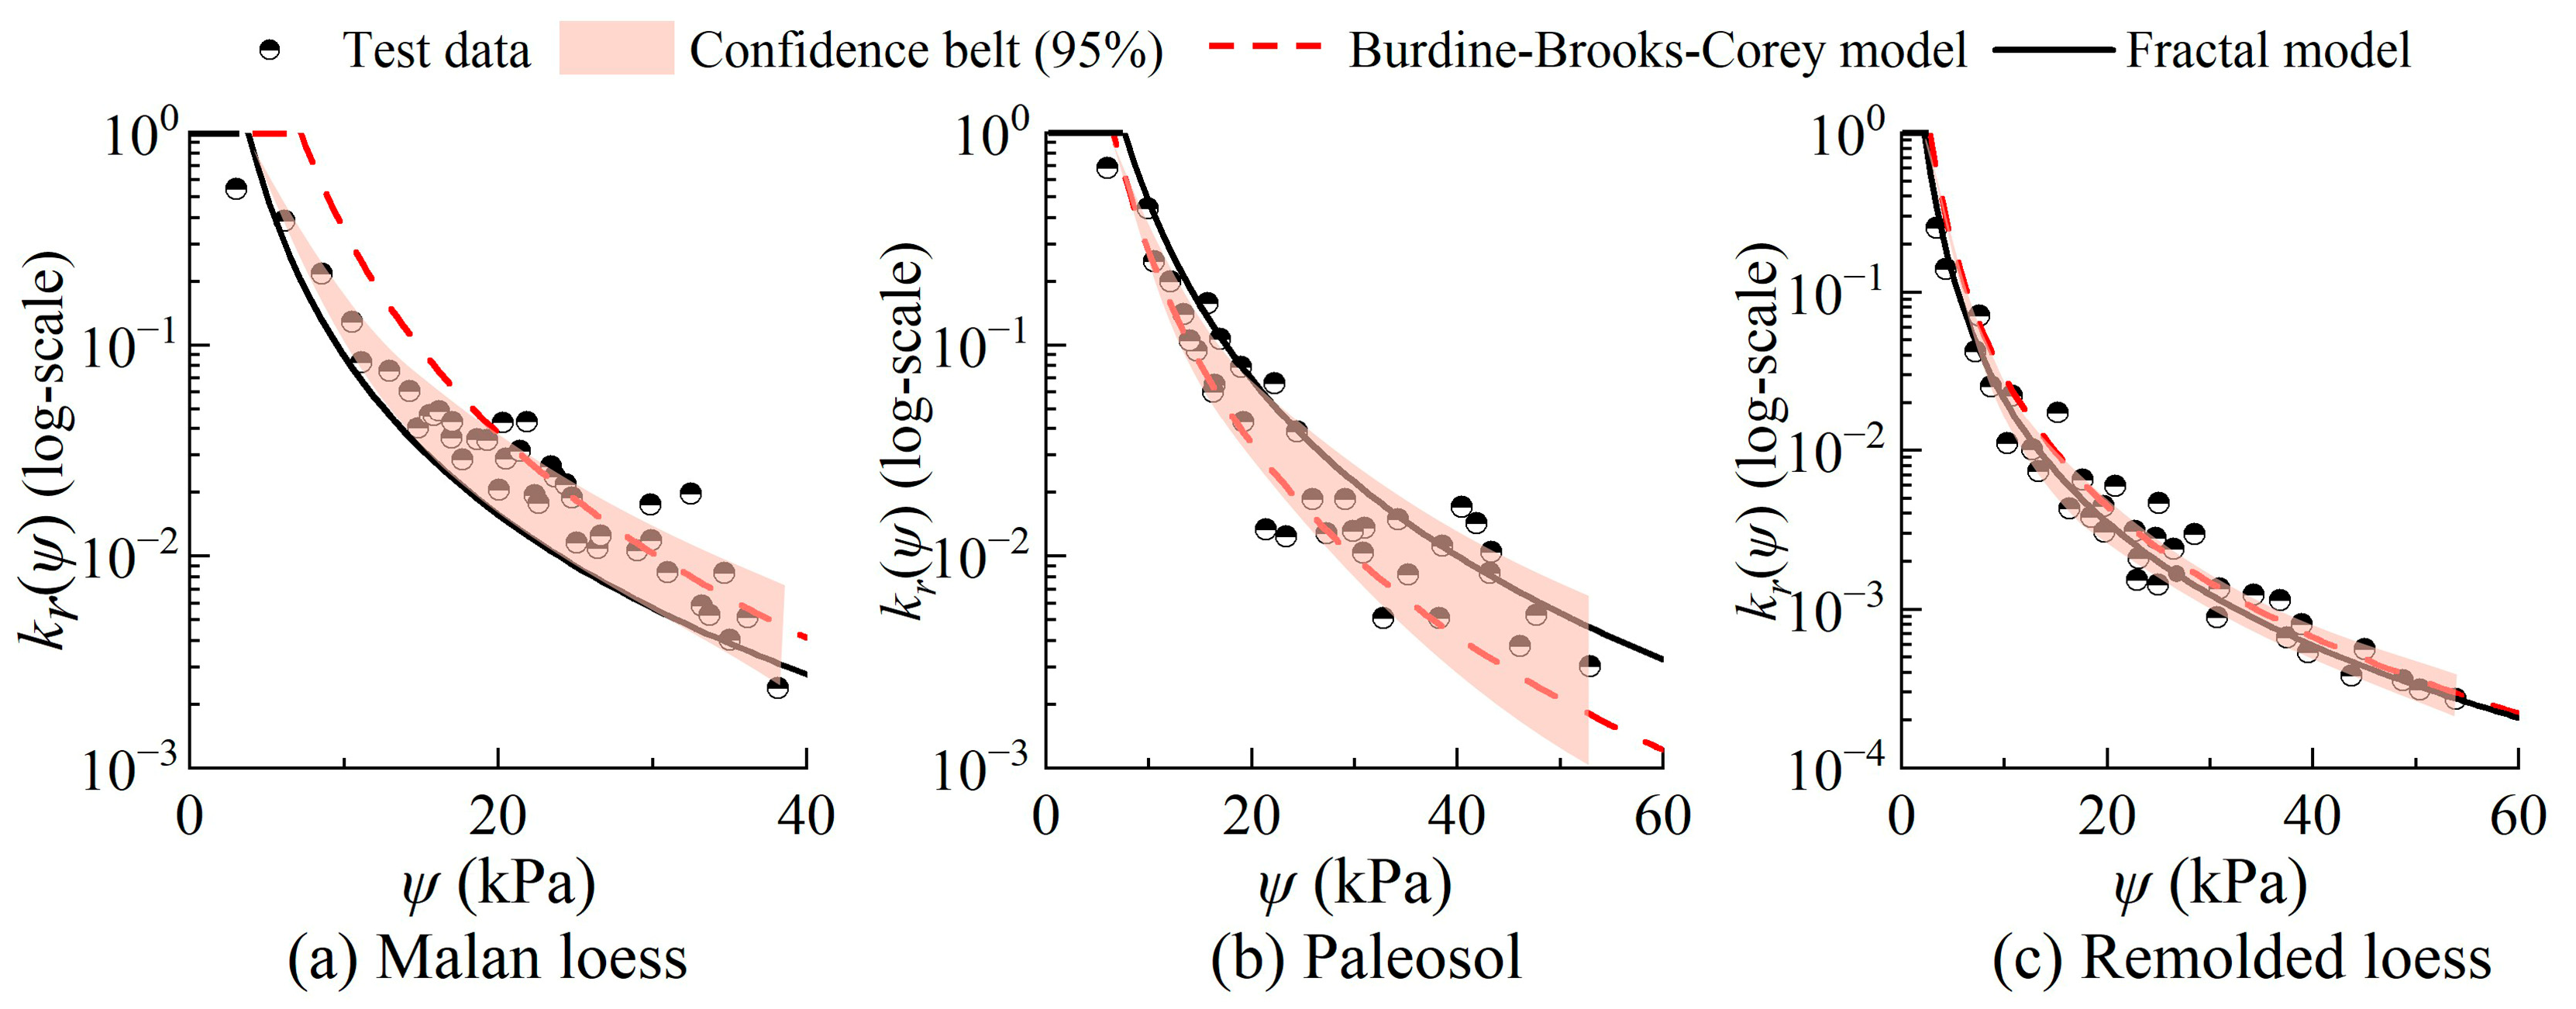
By incorporating the Young-Laplace equation, the fractal model of unsaturated hydraulic conductivity establishes a relationship between matric suction and the structural properties of the soil. This approach explicitly accounts for pore interconnectivity, thereby deriving a functional relationship between matric suction and hydraulic conductivity in unsaturated media [32,33]. To evaluate its predictive capability, the fractal model for unsaturated hydraulic conductivity was applied to generate hydraulic conductivity curves for the three investigated soil types. For comparative purposes, predictions from the Burdine-Brooks-Corey model were also generated and benchmarked against the fractal model’s results [20,78,79].
The unsaturated hydraulic conductivity values measured for the three soils are presented in Figure 8, alongside the corresponding predictive curves derived from the fractal and Burdine-Brooks-Corey models. Test data for both undisturbed soils (Malan loess and paleosol) show notable scatter, especially in Paleosol, due to inherent structural heterogeneity despite sampling efforts to minimize weight variations [80]. In contrast, the remolded loess, which original large pores were destroyed during the remolding process, has better homogeneity, and thus the test data of the unsaturated hydraulic conductivity are more concentrated [67].
Predictive performance differed between models. For Malan loess, the Burdine-Brooks-Corey model overestimates conductivity, while the fractal model underestimates it. However, both capture the decreasing trend with increasing suction. The fractal model aligns well with data at low suction (Figure 8a). For paleosol, the Burdine-Brooks-Corey model consistently underestimates conductivity, with growing deviation as suction rises. The fractal model slightly overestimates but shows good consistency across the entire suction range (Figure 8b). Both models perform excellently for remolded loess, matching test data closely (Figure 8c).
The calculation results of determination coefficients (R2) for the prediction curves of the fractal model and the Burdine-Brooks-Corey model were summarized in Table 6. The R2 values of the fractal model prediction curves for Malan loess, paleosol, and remolded loess are 0.915, 0.918, and 0.929, respectively, while those of the Burdine-Brooks-Corey model are 0.864, 0.825, and 0.925, respectively. The values of RMSE the fractal model prediction curves for Malan loess, paleosol, and remolded loess are 1.23, 1.07, and 0.043, respectively, while those of the Burdine-Brooks-Corey model are 6.37, 2.81, and 1.01, respectively (Note, when calculating the RMSE here, both the predicted value and the measured value are in units of 10−6 cm/s). The fractal model not only shows excellent predictive performance for homogeneous remolded loess but also outperforms the Burdine-Brooks-Corey model in predicting unsaturated hydraulic conductivity of non-homogeneous soils such as natural Malan loess, and paleosol. In this paper, the Burdine-Brooks-Corey model only shows good fitting effects for homogeneous remolded loess.
The use of 3D fractal theory to predict the unsaturated hydraulic characteristics of loess creates a high-accuracy, low-cost parametric tool, which is critical for construction, ecological recovery, and hazard prevention in these areas. This methodological advancement bridges the gap between theoretical modeling and practical applications in geotechnical engineering and environmental sciences.

4. Conclusions

This paper presents a simple and easily determinable estimation method for the SWCC and the unsaturated hydraulic conductivity of unsaturated soils based on fractal theory using the three-dimensional fractal dimension. The main conclusions drawn from this study are as follows:
(1)
Malan loess, paleosol, and remolded loess all exhibit fractal pore-surface characteristics, with three-dimensional fractal dimensions (Ds) being 2.611, 2.688, and 2.771, respectively. Pore structure complexity follows the order: remolded loess > paleosol > Malan loess.
(2)
For SWCC, the fractal model demonstrated relatively good predictive capabilities. The R2 and RMSE values of the fractal model for the three types of soil are: 0.891, 0.879, 0.973, and 0.0037, 0.0121, 0.0011. The water storage capacity of the three soils was in the order of paleosol > remolded loess > Malan loess.
(3)
Based on the analysis of three soil types, the fractal model demonstrates superior overall performance in predicting unsaturated hydraulic conductivity compared to the Burdine-Brooks-Corey model. While both models perform excellently for homogeneous remolded loess, the fractal model significantly outperforms the Burdine-Brooks-Corey model for the more heterogeneous natural soils (Malan loess and paleosol). This is quantitatively supported by higher R2 and substantially lower RMSE values for the fractal model’s predictions across these undisturbed soils.
In terms of predicting the unsaturated hydraulic conductivity, the fractal model can predict unsaturated hydraulic conductivity more accurately for heterogeneous soils (Malan loess and paleosol). Both models perform well for homogeneous remolded loess.
The fractal model quantifies the microscopic characteristics such as the pore structure and particle distribution of loess, providing a powerful tool for understanding and predicting its macroscopic engineering behavior in real environments. For instance, the fractal model enables us to predict the soil-water characteristic curves under different stress conditions or dry densities based on a small amount of experimental data. This is crucial for simulating the changes in water content and matrix suction within slopes under rainfall infiltration conditions and can more accurately assess the stability of slopes. However, it should be noted that this model still has certain limitations. For example, it only measures the wetting curve and does not obtain the drying curve. Moreover, when using the Young-Laplace equation, α is set to 0°, while ignoring the actual contact angle lag phenomenon observed in cohesive soils, thereby underestimating the air entry value. Future research will focus on this aspect.

Author Contributions

Conceptualization, Y.W. and P.L.; methodology, Y.W. and J.W.; investigation, Y.W. and X.H.; writing—original draft preparation, Y.W. and P.L.; writing—review and editing, Y.W., P.L. and J.W.; visualization, Y.W. and X.H.; supervision, P.L. and J.W.; project administration, P.L.; funding acquisition, P.L. and J.W. All authors have read and agreed to the published version of the manuscript.

Funding

This research work was funded by the National Natural Science Foundation of China (42272302, 42472316 and 42090053); the National Key Research and Development Program of China (2023YFC3706901); and the Fundamental Research Funds for the Central Universities, CHD (300102293725 and 300102295201).

Data Availability Statement

The data presented in this study are available on request from the corresponding author due to privacy.

Acknowledgments

The authors express their sincere gratitude to the experts who carefully reviewed this article and provided suggestions for comments.

Conflicts of Interest

The authors declare no conflicts of interest.

References

  1. Badakhsahan, E.; Vaunat, J.; Scarfone, R. A hysteretic water retention model incorporating the soil deformability and its application to rainfall-induced landslides. Comput. Geotech. 2025, 178, 106912. [Google Scholar] [CrossRef]
  2. Zhai, Q.; Rahardjo, H. Estimation of permeability function from the soil-water characteristic curve. Eng. Geol. 2015, 199, 148–156. [Google Scholar] [CrossRef]
  3. Lu, N.; Kaya, M.; Godt, J.W. Interrelations among the soil-water retention, hydraulic conductivity, and suction-stress characteristic curves. J. Geotech. Geoenviron. Eng. 2014, 140, 04014007. [Google Scholar] [CrossRef]
  4. Beyzaei, C.Z.; Bray, J.D.; Cubrinovski, M.; Bastin, S.; Stringer, M.; Jacka, M.; van Ballegooy, S.; Riemer, M.; Wentz, R. Characterization of silty soil thin layering and groundwater conditions for liquefaction assessment. Can. Geotech. J. 2020, 57, 253–276. [Google Scholar] [CrossRef]
  5. Liu, W.; Lin, G.C.; Su, X. Effects of pre-dynamic loading on hydraulic properties and microstructure of undisturbed loess. J. Hydrol. 2023, 622, 129690. [Google Scholar] [CrossRef]
  6. Peng, J.B.; Wang, Q.Y.; Zhuang, J.Q.; Leng, Y.Q.; Fan, Z.J.; Wang, S.K. Dynamic formation mechanism of landslide disaster on the Loess Plateau. J. Geomech. 2020, 26, 714–730. (In Chinese) [Google Scholar] [CrossRef]
  7. Xu, P.P.; Zhang, Q.Y.; Qian, H.; Hou, K. Investigation into microscopic mechanisms of anisotropic saturated permeability of undisturbed Q2 loess. Environ. Earth Sci. 2020, 79, 412. [Google Scholar] [CrossRef]
  8. Chen, Y.F.; Li, P.Y.; Wang, Y.H.; Li, J.H. Unraveling the Mystery of Water-Induced Loess Disintegration: A Comprehensive Review of Experimental Research. Sustainability 2024, 16, 2463. [Google Scholar] [CrossRef]
  9. Peng, D.L.; Xu, Q.; Liu, F.Z.; He, Y.S.; Zhang, S.; Qi, X.; Zhao, K.Y.; Zhang, X.L. Distribution and failure modes of the landslides in Heitai terrace, China. Eng. Geol. 2018, 236, 97–110. [Google Scholar] [CrossRef]
  10. Leshchinsky, B.; Olsen, M.J.; Mohney, C.; O’Banion, M.; Bunn, M.; Allan, J.; McClung, R. Quantifying the sensitivity of progressive landslide movements to failure geometry, undercutting processes and hydrological changes. J. Geophys. Res.-Earth Surf. 2019, 124, 616–638. [Google Scholar] [CrossRef]
  11. Chai, J.C.; Khaimook, P. Prediction of soil-water characteristic curves using basic soil properties. Transp. Geotech. 2020, 22, 100295. [Google Scholar] [CrossRef]
  12. Gao, X.L.; Zhang, Y.C.; Huang, H.W.; Liu, D.F.; Liu, Z.F. Soil-water characteristics and hysteresis effects of loess considering deformation. Rock Soil Mech. 2023, 44, 2350–2359. [Google Scholar] [CrossRef]
  13. Zhang, F.; Zhao, C.; Lourenço, S.D.N.; Dong, S.; Jiang, Y. Factors affecting the soil-water retention curve of Chinese loess. Bull. Eng. Geol. Environ. 2021, 80, 717–729. [Google Scholar] [CrossRef]
  14. Gao, Z.Y.; Chai, J.C. Method for predicting unsaturated permeability using basic soil properties. Transp. Geotech. 2022, 34, 100754. [Google Scholar] [CrossRef]
  15. Bordoni, M.; Bittelli, M.; Valentino, R.; Chersich, S.; Meisina, C. Improving the estimation of complete field soil water characteristic curves through field monitoring data. J. Hydrol. 2017, 552, 283–305. [Google Scholar] [CrossRef]
  16. Fattah, M.Y.; Salim, N.M.; Irshayyid, E.J. Determination of the soil-water characteristic curve of unsaturated bentonite-sand mixtures. Environ. Earth Sci. 2017, 76, 201. [Google Scholar] [CrossRef]
  17. Li, X.J.; Hu, C.Z.; Li, F.Y.; Gao, H.L. Determining soil water characteristic curve of lime treated loess using multiscale structure fractal characteristic. Sci. Rep. 2020, 22, 21569. [Google Scholar] [CrossRef]
  18. Lu, N. Generalized soil water retention equation for adsorption and capillarity. J. Geotech. Geoenviron. Eng. 2016, 142, 04016051. [Google Scholar] [CrossRef]
  19. Yang, H.Q.; Zhang, L.L. Bayesian back analysis of unsaturated hydraulic parameters for rainfall-induced slope failure: A review. Earth-Sci. Rev. 2024, 251, 104714. [Google Scholar] [CrossRef]
  20. Brooks, R.H.; Corey, A.T. Hydraulic properties of porous media and their relation to drainage design. Trans. ASAE 1964, 7, 26–28. [Google Scholar] [CrossRef]
  21. Fredlund, D.G.; Xing, A. Equations for the soil-water characteristic curve. Can. Geotech. J. 1994, 31, 521–532. [Google Scholar] [CrossRef]
  22. Van Genuchten, M.T. A closed-form equation for predicting the hydraulic conductivity of unsaturated soils. Soil Sci. Soc. Am. J. 1980, 44, 892–898. [Google Scholar] [CrossRef]
  23. Pan, P.; Shang, Y.Q.; Lyu, Q.; Yang, Y. Periodic recurrence and scale-expansion mechanism of loess landslides caused by groundwater seepage and erosion. Bull. Eng. Geol. Environ. 2019, 78, 1143–1155. [Google Scholar] [CrossRef]
  24. Dawit, K.; Samuel, F. Comparison and applicability of selected soil erosion estimation models. Hydrology 2021, 9, 79–87. [Google Scholar] [CrossRef]
  25. Bayat, H.; Rastgo, M.; Zadeh, M.M.; Vereecken, H. Particle size distribution models, their characteristics and fitting capability. J. Hydrol. 2015, 529, 872–889. [Google Scholar] [CrossRef]
  26. Zhao, J.Y.; Li, S.Y.; Wang, C.; You, T.T.; Liu, X.Y.; Zhao, Y.C. A universal soil-water characteristic curve model based on the particle size distribution and fractal theory. J. Hydrol. 2023, 622, 129691. [Google Scholar] [CrossRef]
  27. Yang, C.L.; Wu, J.H.; Li, P.Y.; Wang, Y.H.; Yang, N.N. Evaluation of Soil-Water Characteristic Curves for Different Textural Soils Using Fractal Analysis. Water 2023, 15, 772. [Google Scholar] [CrossRef]
  28. Chen, K.; Liang, F.Y.; Wang, C. A fractal hydraulic model for water retention and hydraulic conductivity considering adsorption and capillarity. J. Hydrol. 2021, 602, 126763. [Google Scholar] [CrossRef]
  29. Tao, G.L.; Chen, Y.Y.; Xiao, H.L.; Chen, Y.; Peng, W. Comparative analysis of soil–water characteristic curve in fractal and empirical models. Adv. Mater. Sci. Eng. 2020, 2020, 1970314. [Google Scholar] [CrossRef]
  30. Rieu, M.; Sposito, G. Fractal fragmentation soil porosity and soil water properties. Soil Sci. Soc. Am. J. 1991, 55, 1231–1238. [Google Scholar] [CrossRef]
  31. Tyler, S.W.; Wheatcraft, S.W. Fractal scaling of soil particle size distributions: Analysis and limitations. Soil Sci. Soc. Am. J. 1992, 56, 362–369. [Google Scholar] [CrossRef]
  32. Xu, Y.F. Calculation of unsaturated hydraulic conductivity using a fractal model for the pore-size distribution. Comput. Geotech. 2004, 31, 549–557. [Google Scholar] [CrossRef]
  33. Tao, G.; Chen, Y.; Xiao, H.; Chen, Q.; Wan, J. Determining soil–water characteristic curves from mercury intrusion porosimeter test data using fractal theory. Energies 2019, 12, 752. [Google Scholar] [CrossRef]
  34. Chen, W.; Liang, Y.J. New methodologies in fractional and fractal derivatives modeling. Chaos Solitons Fractals 2017, 102, 72–77. [Google Scholar] [CrossRef]
  35. Islam, T.; Gandhi, P. Fabrication of multscale fractal-like structures by controlling fluid interface instability. Sci. Rep. 2016, 6, 37187. [Google Scholar] [CrossRef]
  36. Mandelbrot, B.B. How long is the coast of britain? statistical self-similarity and fractional dimension. Science 1967, 156, 636–638. [Google Scholar] [CrossRef] [PubMed]
  37. Lu, S.; Zhu, Q.; Ying, H. The effect of pore size distribution on the fractal evaporative interface in porous media. Appl. Therm. Eng. 2024, 246, 122960. [Google Scholar] [CrossRef]
  38. Cousins, T.A.; Ghanbarian, B.; Daigle, H. Three-dimensional lattice boltzmann simulations of single-phase permeability in random fractal porous media with rough pore-solid interface. Transp. Porous Media 2018, 122, 527–546. [Google Scholar] [CrossRef]
  39. Xia, Y.X.; Cai, J.C.; Wei, W.; Hu, X.Y.; Wang, X.; Ge, X.M. A new method for calculating fractal dimensions of porous media based on pore size distribution. Fractals—Complex Geom. Patterns Scaling Nat. Soc. 2018, 26, 1850006. [Google Scholar] [CrossRef]
  40. Bai, Y.F.; Qin, Y.; Lu, X.R.; Zhang, J.T.; Chen, G.S.; Li, X.J. Fractal dimension of particle-size distribution and their relationships with alkalinity properties of soils in the western Songnen Plain, China. Sci. Rep. 2020, 10, 20603. [Google Scholar] [CrossRef]
  41. Ghanbarian, B.; Daigle, H. Fractal dimension of soil fragment mass-size distribution: A critical analysis. Geoderma 2015, 245, 98–103. [Google Scholar] [CrossRef]
  42. Alaoui, A.; Lipiec, J.; Gerke, H.H. A review of the changes in the soil pore system due to soil deformation: A hydrodynamic perspective. Soil Tillage Res. 2011, 115–116, 1–15. [Google Scholar] [CrossRef]
  43. Sun, K.; Wang, H.; Pei, Z.Y.; Wang, H.C.; Sun, X.T.; Li, Y.; Sun, G.R.; Alatengsuhe; Yang, J.J.; Su, X.M. Particle-size fractal dimensions and pore structure characteristics of soils of typical vegetation communities in the Kubuqi Desert. Front. Environ. Sci. 2023, 10, 1044224. [Google Scholar] [CrossRef]
  44. Xiong, Q.R.; Baychev, T.G.; Jivkov, A.P. Review of pore network modelling of porous media: Experimental characterisations, network constructions and applications to reactive transport. J. Contam. Hydrol. 2016, 192, 101–117. [Google Scholar] [CrossRef]
  45. Wang, J.M.; Qin, Q.; Guo, L.L.; Feng, Y. Multi-fractal characteristics of three-dimensional distribution of reconstructed soil pores at opencast coal-mine dump based on high-precision CT scanning. Soil Tillage Res. 2018, 182, 144–152. [Google Scholar] [CrossRef]
  46. Liu, H.Q.; Xie, H.P.; Wu, F.; Li, C.B. A novel box-counting method for quantitative fractal analysis of three-dimensional pore characteristics in sandstone. Int. J. Min. Sci. Technol. 2024, 34, 479–489. [Google Scholar] [CrossRef]
  47. Wen, T.D.; Chen, X.R.; Luo, Y.W.; Shao, L.T.; Niu, G. Three-dimensional pore structure characteristics of granite residual soil and their relationship with hydraulic properties under different particle gradation by X-ray computed tomography. J. Hydrol. 2023, 618, 129230. [Google Scholar] [CrossRef]
  48. GB/T50123-2019; Standard for Geotechnical Testing Method; Ministry of Water Resources of the People’s Republic of China; Ministry of Housing and Urban-Rural Development of the People’s Republic of China. China Architecture & Building Press: Beijing, China, 2019.
  49. Sun, Y.B.; Lu, H.Y.; An, Z.S. Grain size of loess, paleosol and red clay deposits on the Chinese Loess Plateau: Significance for understanding pedogenic alteration and palaeomonsoon evolution. Palaeogeogr. Palaeoclimatol. Palaeoecol. 2006, 241, 129–138. [Google Scholar] [CrossRef]
  50. Mualem, Y. A new model for predicting the hydraulic conductivity of unsaturated porous media. Water Resour. Res. 1976, 12, 513–522. [Google Scholar] [CrossRef]
  51. Eyo, E.U.; Ng’ambi, S.; Abbey, S.J. An overview of soil–water characteristic curves of stabilised soils and their influential factors. J. King Saud Univ.-Eng. Sci. 2022, 34, 31–45. [Google Scholar] [CrossRef]
  52. Zhang, J.H.; Hu, H.R.; Peng, J.H.; Zhang, Y.Y.; Zhang, A.S. Enhanced understanding of subgrade soil hydraulic characteristics: Effects of wetting–drying cycles and stress states on subgrade water migration. J. Hydrol. 2024, 635, 131165. [Google Scholar] [CrossRef]
  53. Soltani, A.; Azimi, M.; Boroomandnia, A.; O’Kelly, B.C. An objective framework for determination of the air-entry value from the soil–water characteristic curve. Results Eng. 2021, 12, 100298. [Google Scholar] [CrossRef]
  54. Fu, Y.P.; Liao, H.J.; Chai, X.Q.; Li, Y.; Lv, L.L. A hysteretic model considering contact angle hysteresis for fitting soil-water characteristic curves. Water Resour. Res. 2021, 57, e2019WR026889. [Google Scholar] [CrossRef]
  55. Xu, P.P.; Zhang, Q.Y.; Qian, H.; Li, M.N.; Yang, F.X. An investigation into the relationship between saturated permeability and microstructure of remolded loess: A case study from Chinese Loess Plateau. Geoderma 2021, 382, 114744. [Google Scholar] [CrossRef]
  56. Wen, T.D.; Luo, Y.W.; Tang, M.Y.; Chen, X.S.; Shao, L.T. Effects of representative elementary volume size on three-dimensional pore characteristics for modified granite residual soil. J. Hydrol. 2024, 643, 132006. [Google Scholar] [CrossRef]
  57. Cakmakyapan, S.; Demirhan, H. A Monte Carlo-based pseudo-coefficient of determination for generalized linear models with binary outcome. J. Appl. Stat. 2017, 44, 2458–2482. [Google Scholar] [CrossRef]
  58. Li, P.Y.; Li, J.H.; Wu, J.H.; Wang, Y.H.; Chen, Y.F. Effects of loess-paleosol interbedding on soil moisture transport and soil microstructure. Hydrogeol. Eng. Geol. 2024, 51, 1–11. (In Chinese) [Google Scholar]
  59. Luo, Y.W.; Wen, T.D.; Lin, X.; Chen, X.S.; Shao, L.T. Quantitative analysis of pore-size influence on granite residual soil permeability using CT scanning. J. Hydrol. 2024, 645, 132133. [Google Scholar] [CrossRef]
  60. Shwan, B.J. Soil–water retention curve determination for sands using the filter paper method. J. Geotech. Geoenviron. Eng. 2024, 150, 04024020. [Google Scholar] [CrossRef]
  61. ASTM D5298; Standard Test Method for Measurement of Soil Potential (Suction) Using Filter Paper. American Society for Testing and Materials: West Conshohocken, PA, USA, 2016. [CrossRef]
  62. Li, H.; Li, T.L.; Jiang, R.J.; Wang, Y.; Zhang, Y.G. A New Method to Simultaneously Measure the Soil–Water Characteristic Curve and Hydraulic Conductivity Function Using Filter Paper. Geotech. Test. J. 2020, 43, 1541–1551. [Google Scholar] [CrossRef]
  63. Nguyen, B.T.; Ishikawa, T.; Zhu, Y.L.; Subramanian, S.S.; Ngyuen, T.T. New simplified transient method for determining the coefficient of permeability of unsaturated soil. Eng. Geol. 2022, 300, 106564. [Google Scholar] [CrossRef]
  64. Liu, H.N.; Xie, Z.; Yu, R.X.; Zhang, N. A New Three-dimensional Fractal Dimension Model to Describe the Complexity of Concrete Pores. J. Adv. Concr. Technol. 2022, 20, 127–138. [Google Scholar] [CrossRef]
  65. Huang, C.Q.; Zhao, W.; Liu, F.; Tan, W.F.; Koopal, L.K. Environmental significance of mineral weathering and pedogenesis of loess on the southernmost Loess Plateau, China. Geoderma 2011, 163, 219–226. [Google Scholar] [CrossRef]
  66. Chai, N.P.; Zhao, Z.P.; Li, X.K.; Xiao, J.; Jin, Z.D. Chemical weathering processes in the Chinese Loess Plateau. Geosci. Front. 2024, 15, 101842. [Google Scholar] [CrossRef]
  67. Jiang, M.M.; Zhang, F.G.; Hu, H.J.; Cui, Y.J.; Peng, J.B. Structural characterization of natural loess and remolded loess under triaxial tests. Eng. Geol. 2014, 181, 249–260. [Google Scholar] [CrossRef]
  68. Raghuram, A.S.S.; Mounika, N.; Basha, B.M.; Moghal, A.A.B. Soil Water Characteristic Curves of Soils Exhibiting Different Plasticity. Int. J. Geosynth. Ground Eng. 2023, 9, 25. [Google Scholar] [CrossRef]
  69. Mu, Q.Y.; Meng, L.L.; Lu, Z.; Zhang, L.M. Hydro-mechanical behavior of unsaturated intact paleosol and intact loess. Eng. Geol. 2023, 323, 107245. [Google Scholar] [CrossRef]
  70. Krisnanto, S.; Rahardjo, H.; Fredlund, D.G.; Leong, E.C. Water content of soil matrix during lateral water flow through cracked soil. Eng. Geol. 2016, 210, 168–179. [Google Scholar] [CrossRef]
  71. Gao, X.Y.; Xie, W.L.; Yuan, K.Z.; Liu, Q.Q. Mechanical properties and microstructural evolution of Malan loess with depth: Insights from multivariate statistical models. Soil Tillage Res. 2025, 251, 106548. [Google Scholar] [CrossRef]
  72. Huang, C.Q.; Tan, W.F.; Wang, M.K.; Koopal, L.K. Characteristics of the fifth paleosol complex (S5) in the southernmost part of the Chinese Loess Plateau and its paleo-environmental significance. Catena 2014, 122, 130–139. [Google Scholar] [CrossRef]
  73. Shao, X.X.; Zhang, H.Y.; Tan, Y. Collapse behavior and microstructural alteration of remolded loess under graded wetting tests. Eng. Geol. 2018, 233, 11–22. [Google Scholar] [CrossRef]
  74. Rajput, U.; Sharma, S.; Swami, D.; Joshi, N. Rapid assessment of soil–water retention using soil texture-based models. Environ. Earth Sci. 2024, 83, 454. [Google Scholar] [CrossRef]
  75. Chen, M.Y.; Chen, X.Y.; Wang, L.; Tian, F.C.; Yang, Y.M.; Zhang, X.J.; Yang, Y.P. Water adsorption characteristic and its impact on pore structure and methane adsorption of various rank coals. Environ. Sci. Pollut. Res. 2022, 29, 29870–29886. [Google Scholar] [CrossRef] [PubMed]
  76. McDowell, T.M.; Mason, J.A.; Vo, T.; Marin-Spiotta, E. Hydrology of a semiarid loess-paleosol sequence, and implications for buried soil connection to the modern climate, plant-available moisture, and loess tableland persistence. J. Geophys. Res. Earth Surf. 2022, 127, e2022JF006800. [Google Scholar] [CrossRef]
  77. Xia, Y.X.; Cai, J.C.; Wei, W. Fractal structural parameters from images: Fractal dimension, lacunarity, and succolarity. Model. Flow Transp. Fractal Porous Media 2021, 2021, 11–24. [Google Scholar] [CrossRef]
  78. Burdine, N. Relative permeability calculations from pore size distribution data. J. Pet. Technol. 1953, 5, 71–78. [Google Scholar] [CrossRef]
  79. Ghanbarian, B.; Loannidis, M.A.; Hunt, A.G. Theoretical insight into the empirical tortuosity-connectivity factor in the Burdine-Brooks-Corey water relative permeability model. Water Resour. Res. 2017, 53, 10395–10410. [Google Scholar] [CrossRef]
  80. Zhao, Z.Y.; Hou, X.K.; Shen, W.; Zhang, M.M.; Chen, J.C.; Li, P.; Li, T.L.; Hu, X.Y. Permeability and microstructure evolution of loess-paleosol sequence: Analysis of prediction model based on deposition time. Catena 2025, 257, 109176. [Google Scholar] [CrossRef]
Figure 1. Sampling point location and sample particle size distribution. (a) sampling point location, (b) distribution of strata at the sampling points, (c) particle size distribution curve.
Water 17 03072 g001
Figure 2. Fractal dimension scale effect (a) illustration of increased surface fractals, (b) SEM image of partially calculated scale.
Water 17 03072 g002
Figure 3. The principle of three-dimensional space surface area calculation. (a) three-dimensional schematic diagram, (b) diagram of spatial triangle coordinates.
Water 17 03072 g003
Figure 4. Experimental setup and experimental principle of transient profile method. (a) test device of the transient profile test device, (b) experimental principle of transient profile method.
Water 17 03072 g004
Figure 5. Linear fitting of three-dimensional fractal dimensions.
Water 17 03072 g005
Figure 6. The test data of SWCC obtained by the filter paper method and the fitting curve of the Brooks-Corey model (BE, Boundary effect zone; T, Transition zone; R, Residual zone).
Water 17 03072 g006
Figure 7. SWCCs predicted based on fractal theory (BE, Boundary effect zone; T, Transition zone; R, Residual zone).
Water 17 03072 g007
Figure 8. Comparison of the predicted curve of the unsaturated relative hydraulic conductivity with the test data.
Water 17 03072 g008
Table 1. Basic characteristics of Malan loess and Paleosol.
ParametersMalan LoessPaleosolRemolded Loess
Nature density ρ (g/cm3)1.501.78
Nature mass moisture content ω (g/g)0.1540.1400.120
Dry density ρd (g/cm3)1.301.561.4
Specific gravity Gs2.702.722.71
Saturated mass moisture content (g/g)0.4000.2720.349
Saturated volume moisture content θs (cm3/cm3)0.5200.4240.489
Void ratio e01.0850.7440.935
USCS classificationSiltSiltSilt
Table 2. The mineral composition of Malan loess and paleosol (%).
SamplesQuartzPlagioclaseFeldsparIlliteMuscoviteKalbiteCalciteHematite
Malan loess42.213.812.210.810.17.72.50.7
Paleosol43.615.44.316.813.26.70.00.0
Table 3. The fitting results of the fractal dimensions of the three types of soil.
SamplesExpression of Fitting Liner2Ds D ¯ s
Malan loessM1y = −2.615x + 5.2680.9972.6152.611
M2y = −2.606x + 5.2620.9982.606
M3y = −2.612x + 5.1950.9932.612
PaleosolP1y = −2.698x + 5.0330.9962.6982.688
P2y = −2.686x + 5.0120.9972.686
P3y = −2.680x + 5.0410.9962.680
Remolded loessR1y = −2.761x + 5.3420.9962.7612.771
R2y = −2.770x + 5.3150.9962.770
R3y = −2.781x + 5.2460.9972.781
Table 4. The fitting parameters of the Brooks-Corey model for the SWCC.
Samplesθr (cm3/cm3)ψaev (kPa)nr2
Malan loess0.07087.2033.2030.889
Paleosol0.08276.5413.0260.854
Remolded loess0.06232.742.7260.962
Table 5. The key parameters of the fractal model for SWCC.
SamplesMalan LoessPaleosolRemolded Loess
M1M2M3P1P2P3R1R2R3
R (μm)110.745.969.715.318.827.445.552.244.9
ψaev (kPa)1.3353.2212.1199.6897.8495.3973.2452.8323.292
θr (cm3/cm3)0.05420.05920.06330.08210.07940.08240.07420.07340.0732
ψ ¯ aev (kPa)2.2257.6454.123
θ ¯ r (cm3/cm3)0.05890.08130.0716
R20.8910.8790.973
RMSE0.00370.01210.0011
Table 6. Error analysis of the unsaturated hydraulic conductivity prediction model.
Samplesksat (cm/s)Burdine-Brooks-Corey ModelFractal Dimension Model
R2RMSER2RMSE
Malan loess7.203 × 10−60.8646.370.9151.23
Paleosol4.87 × 10−60.8252.810.9181.07
Remolded loess1.68 × 10−50.9251.010.9290.043
Disclaimer/Publisher’s Note: The statements, opinions and data contained in all publications are solely those of the individual author(s) and contributor(s) and not of MDPI and/or the editor(s). MDPI and/or the editor(s) disclaim responsibility for any injury to people or property resulting from any ideas, methods, instructions or products referred to in the content.