Article

Rainfall and Runoff Characteristics of Alluvial Gullies in the Upper Burdekin Catchment

1
College of Science and Engineering, James Cook University, Douglas, QLD 4814, Australia
2
Tropical Water and Aquatic Ecosystem Research, James Cook University, Douglas, QLD 4814, Australia
*
Author to whom correspondence should be addressed.
Water 2025, 17(21), 3071; https://doi.org/10.3390/w17213071 (registering DOI)
Submission received: 1 October 2025 / Revised: 21 October 2025 / Accepted: 24 October 2025 / Published: 27 October 2025

Abstract

Gully erosion is a major driver of land degradation globally, particularly in semi-arid regions where it is fundamentally controlled by rainfall and runoff dynamics. Understanding how rainfall translates into runoff in gullied landscapes is crucial for predicting erosion processes and modelling runoff to inform land management strategies. In this study, rainfall-runoff analysis was conducted using high-resolution rainfall and runoff data from intensely monitored alluvial gullies in the semi-arid regions of northern Australia. Runoff responses were strongly seasonal, with flashy but low-volume flows during the early wet season (October–November) and prolonged, high-discharge events during peak rainfall months (December–March). Antecedent soil moisture had a limited influence on runoff generation, likely due to rapid wetting–drying cycles and shallow infiltration depths. Notably, rainfall-runoff behavior diverged with catchment-to-gully area ratio (Aca): linear runoff to rainfall responses were observed where gullies were eroded to the catchment limit (Aca ≈ 1) whereas high-Aca systems (Aca > 5) exhibited threshold, stepwise behavior with upslope contributions activating at ~26 mm event rainfall. Field infiltration tests showed upslope catchment infiltration capacity was ~70% higher than on gully floors (~36 vs. 21 mm h−1). This indicates greater near-surface storage and delayed upslope runoff, consistent with an activation threshold for upslope contributions. Mean rainfall–runoff ratios were higher in low-Aca gullies (≈0.52–0.68) than in high-Aca systems (≈0.40–0.46). These findings have implications for rainfall-runoff modelling, process-based understanding of gully erosion and gully management in semi-arid environments.

1. Introduction

The relationship between rainfall and surface runoff processes is complex and multifaceted. Early studies by Horton [1] and by Dunne and Black [2] established the fundamental links between rainfall and different runoff regimes such as Hortonian (infiltration-excess) and saturation-excess overland flows. Later research showed surface runoff processes are influenced not only by rainfall amount but also by rainfall intensity, duration, and temporal distribution [3,4,5,6]. Rainfall intensities exceeding the infiltration capacity drive Hortonian runoff, while long-duration rainfall often leads to a saturation limit and eventual runoff [5]. The temporal distribution of rainfall regulates soil moisture dynamics—including wetting and drying cycles, thereby modulating infiltration capacities and runoff response [7]. Surface runoff is also influenced by soil permeability, slope, and vegetation cover. For example, vegetation reduces flow velocity by increasing hydraulic roughness and infiltration capacity [8,9]. At the same time, steeper slopes provide higher energy gradients for faster flows, and less permeable soils (e.g., clays) impede infiltration, leading to increased runoff [10].
A particularly damaging consequence of excessive runoff is soil erosion, which is often high in landscapes with variable rainfall, sparse vegetation cover and low infiltration capacity soils [11]. Among runoff-driven erosion forms, gully erosion is globally recognized as a problematic soil erosion process, as it involves the formation of deep, incised channels that rapidly transport large volumes of sediment downstream, often leading to irreversible land degradation [12,13]. Rainfall is the primary driver of gully formation through direct raindrop impact and runoff generation, which both detach and transport sediment [14,15]. The intensity, duration, and frequency of rainfall events play a crucial role in determining erosion rates, as high-intensity storms generate more kinetic energy and surface runoff, leading to increased gully expansion rates [16].
In northern Australia, gully erosion is a major source of terrestrial sediment runoff into the Great Barrier Reef (GBR) lagoon, placing significant stress on the marine ecosystem [17,18]. Growing concerns about poor water quality on the GBR have prompted substantial investment in catchment-scale water quality improvements, including gully and streambank remediation, with over $900 million allocated and additional funding committed over the coming decades [19,20]. Given the limited resources, optimizing the investment return on gully remediation requires strategies informed by a process-based understanding of gully erosion [21]. In the GBR catchment, where gully erosion is primarily driven by rainfall and runoff, this requires a clear account of event-scale rainfall–runoff dynamics. However, current understanding of these dynamics remains limited, particularly regarding runoff-generation processes and differences in rainfall–runoff relationships among gullies with contrasting morphological characteristics. Addressing this gap is imperative not only for management, but also for predictive runoff modelling and for estimating runoff across ungauged gullies with differing characteristics.
Prior studies in the GBR catchments focused on hydrological processes at different spatial and temporal scales. Using daily rainfall and runoff data, Jarihani et al. [22] showed that runoff generation processes in the Upper Burdekin catchment are primarily driven by rainfall amount and intensity, with sensitivity to antecedent soil moisture and ground cover varying seasonally. The sensitivity is particularly heightened during drier months, highlighting the dominance of infiltration-excess (Hortonian) overland flow outside peak wet-season saturation. In the same catchment, Post et al. [23] used a regionalized modelling approach to develop rainfall-runoff relationships and found they varied across the region, indicating that a single, basin-wide equation to predict runoff from rainfall would be inappropriate. In contrast, Jarvis et al. [24] fitted a single, basin-wide annual rainfall-runoff regression using spatially averaged rainfall to explain interannual variability in Burdekin river discharge at the main outlet. All these studies have focused on large spatial scales using coarser rainfall and runoff data (daily to annually) without event-scale analysis. While catchment-scale studies are valuable for understanding regional rainfall-runoff dynamics that contribute to large river systems, they can miss finer-scale hydrological variations significant at the plot level (<1 km2). This limitation is particularly relevant in semi-arid landscapes with alluvial gullies, where gully formation significantly alters local hydrology by changing surface morphology, lowering phreatic levels, and removing vegetation [25]. As a result, rainfall-runoff relationships derived at the catchment or river scale are not directly informative for gully-scale dynamics, where local landscape conditions and event-scale metrics influence the runoff generation process. In this study, an event-scale analysis using high-resolution (10 s) rainfall and runoff records is undertaken to quantify rainfall-runoff behavior at the gully scale. Only a few studies have undertaken event-scale analyses at the plot scale in both hillslope [26,27] and alluvial-gully settings [28,29] in the GBR catchment. However, these investigations focused primarily on quantifying sediment export and did not conduct detailed rainfall–runoff analyses.
This study presents an analysis of three hydrological years (2023–2025) of high-resolution hydrological data from five intensively monitored alluvial gullies in the Upper Burdekin catchment, North Queensland, Australia. The main objectives of the research were to: (1) assess the characteristics of rainfall-runoff dynamics in landscapes with alluvial gullies; (2) examine divergence in the rainfall–runoff relationship between gullies with different upslope catchment extent relative to gully size and (3) discuss a conceptual model linking rainfall to runoff processes in alluvial gullies. The study is spatially unique and methodologically novel, combining high-resolution (10 s) rainfall–runoff records with the catchment-to-gully area ratio (Aca) as a new site metric to diagnose differences in rainfall–runoff relationships among alluvial gullies

2. Materials and Methods

2.1. Site Description

General Characteristics

The study is located in the catchment of Continong Creek, a tributary of the upper Burdekin River, North Queensland, Australia (Figure 1). The Upper Burdekin catchment (area: ~36,000 km2, mean annual discharge: ~4500 GL yr−1) is the most hydrologically active sub-catchment of the Burdekin Catchment (130,000 km2, mean annual discharge: ~9000 GL yr−1), which is the second largest catchment draining to the GBR lagoon [30]. The region also has the highest gully density by area in GBR catchment [31].
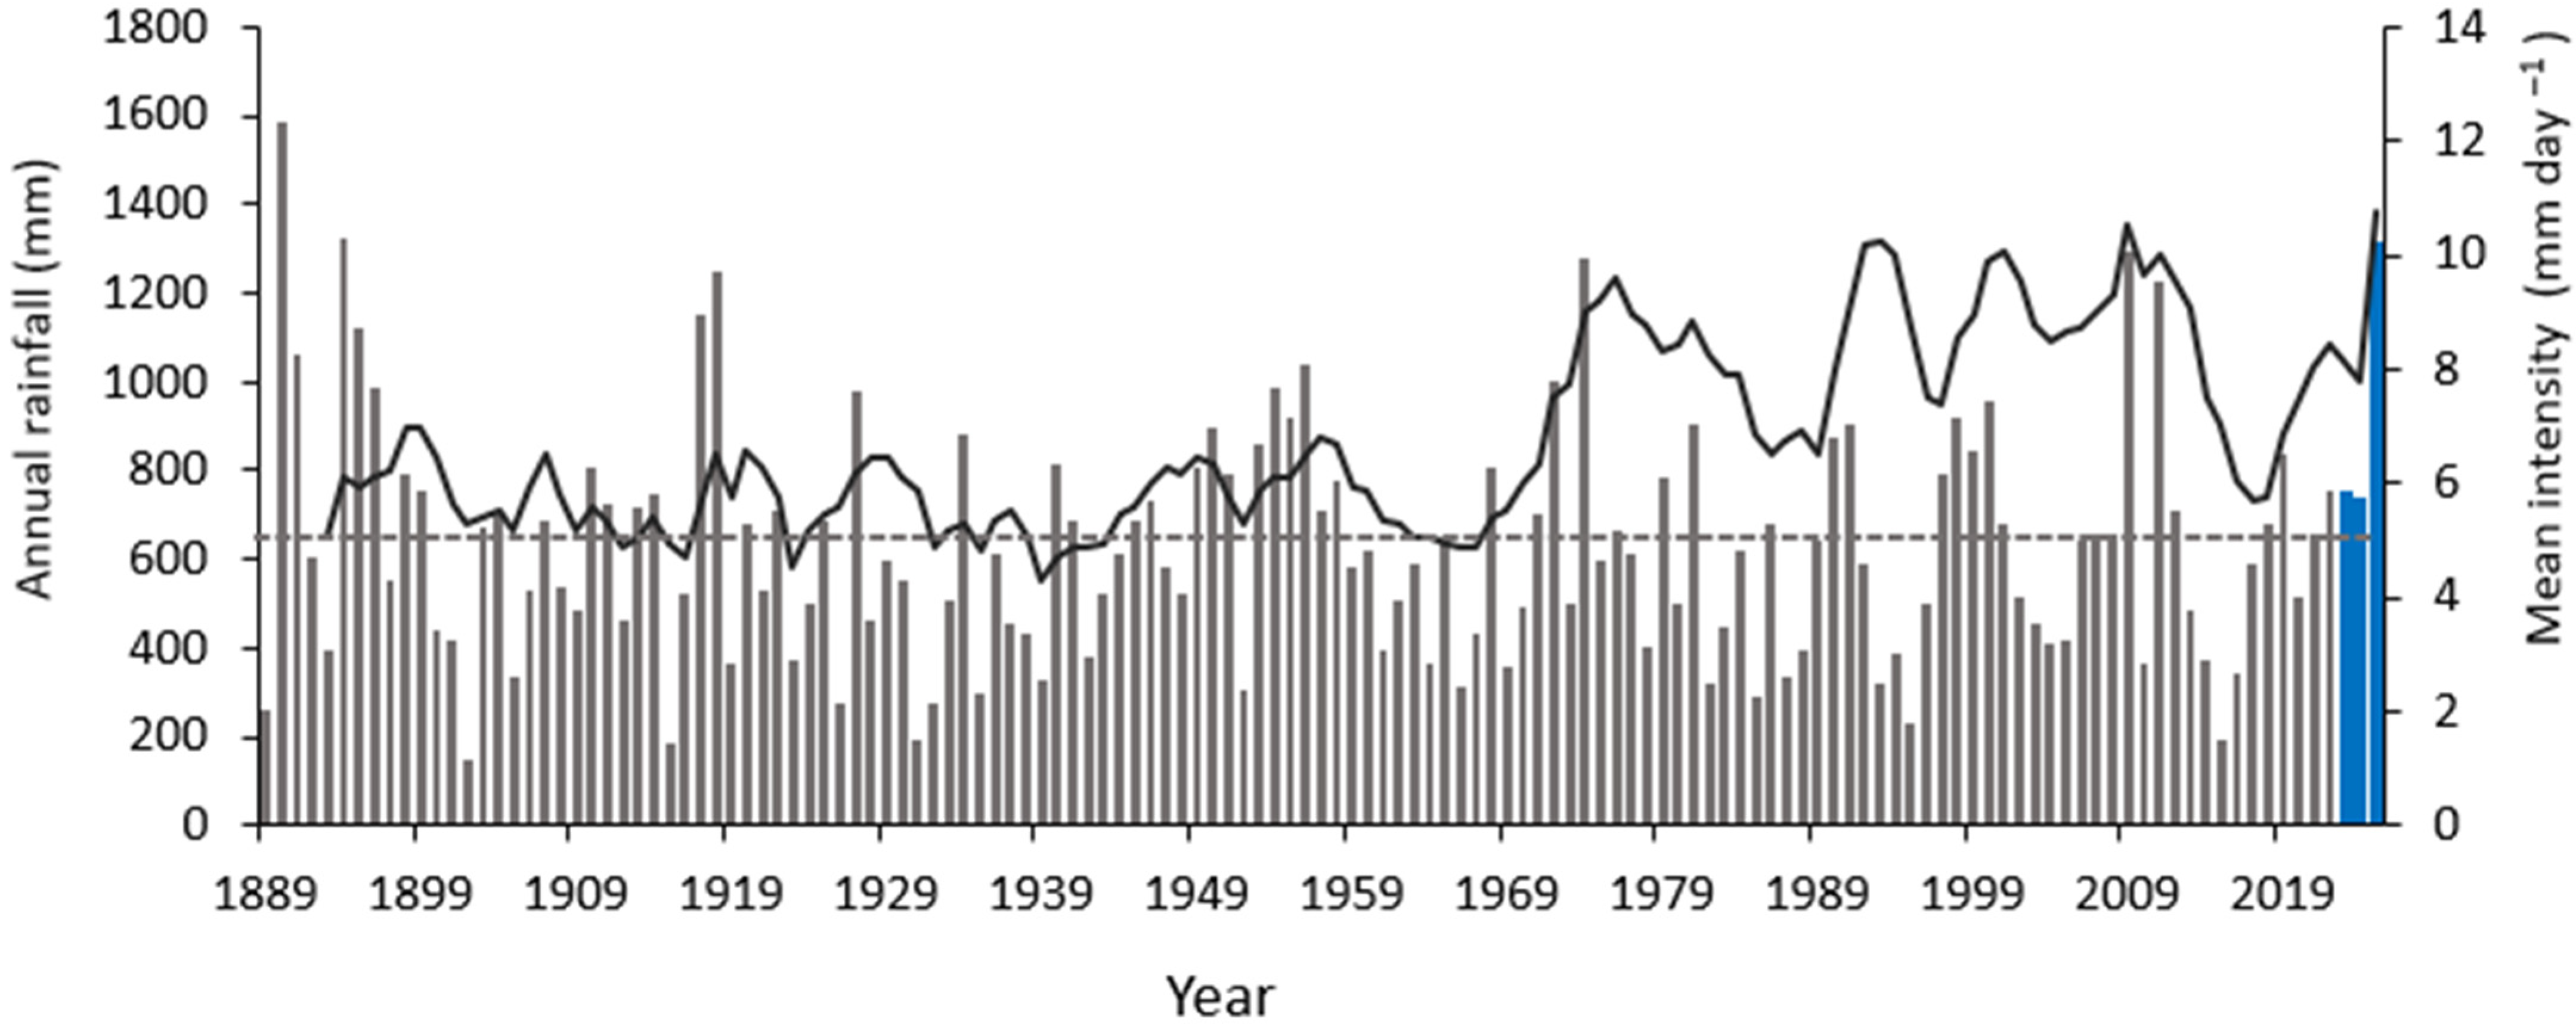
The gullies examined in this study are approximately 1 km upstream of the confluence of Continong Creek and the Burdekin River. Quaternary alluvium deposited by the Burdekin dominates the surface geology of the study site. Bedrock outcrops ranging from intrusive granitoid to extrusive rhyolite of Carboniferous age [32] are sporadically exposed along incised channels. Texture-contrast soils with a sandy loam topsoil and an underlying clayey subsoil dominate the study site and are characteristic of the Upper Burdekin catchment [33]. They are mapped as Brown Chromosols and Brown Sodosols based on the Australian Soil Classification System (ASC) [34]. These soils are particularly susceptible to gully erosion due to their structural instability and geochemical characteristics [35,36]. The area experiences a dry-tropical climate, characterized by a distinct wet season from December to April followed by a prolonged dry season for the rest of the year. The mean annual rainfall, based on historical records from 1989 to 2025, is 634 mm per year, exhibiting inter-annual variability (coefficient of variation 42%) associated with the phases of the Southern Oscillation [37]. Over 70% of the annual rainfall is concentrated in the wet season, typically delivered through short-duration, high-intensity events [22]. However, extended periods of rainfall may occur during monsoonal or cyclonic events [38]. Since 1970, the mean daily rainfall intensity has approximately doubled, increasing from ~5 mm d−1 to >10 mm d−1 (Figure 2). Vegetation is dominated by Eucalyptus crebra (narrow-leaved ironbark) with a dense grass layer dominated by Heteropogon contortus (black speargrass), Themeda triandra (kangaroo grass), Bothriochola pertusa (Indian couch) and Cenchrus ciliaris (buffel grass). The area is mainly used as grazing grounds for cattle, exclusively for beef production. In general, the Upper Burdekin catchment has experienced an all-time maximum in stocking rate since 2000 [39].

2.2. Gully-Specific Description

Morphometric parameters (Table 1), including catchment area and gully area, were derived from a hydrologically corrected, high-resolution Digital Terrain Model (DTM) based on Light Detection and Ranging (LiDAR) data. Measurements were performed using the Spatial Analyst tools in ArcGIS Pro 3.4. It is important to note that all parameters only represent the portion of gullies above the monitoring points. Catchment to gully area ratio (Aca) was defined as a total upslope contributing area draining to the monitoring point divided by area of the gully upstream of that point.

2.3. Hydrological Monitoring

In each gully, a tipping-bucket rain gauge (Hyquest TB7; HyQuest Solutions, New South Wales (NSW), Australia) with a resolution of 0.2 mm per tip was installed near the terminus of gully. To measure runoff depth in the outlet channel, a Submersible Level and Temperature sensor (SBLT; Dwyer Instruments, Michigan City, IN, USA), which uses a pressure transducer to measure hydrostatic pressure and calculate water depth, was deployed. SBLT tubes were installed vertically with tips sitting approximately 0.1 m above the active channel bed. Measurements of the height were taken after runoff events to account for the changes in vertical bed movement. The velocity of surface runoff was measured using velocity sensor (Starflow; Unidata, Western Australia, Australia). All hydrological equipment was connected to LoggerNet 4.1 for digitization and data storage at a frequency of 0.1 Hz, with the data simultaneously transmitted to an online server via telemetry (Figure 3). An optical camera (Tapo C310 Link; TP-Link, Rydalmere, NSW, Australia) with a frame rate of 30 fs−1 (frames per second) was installed in all five gullies to: (1) visually measure water depth using a stage board; (2) estimate surface flow velocities; and (3) provide redundancy for hydrological equipment during periods of malfunction or failure. Hydrological monitoring began in the 2022/2023 wet season for all gullies except L1, where monitoring commenced during the 2023/2024 wet season.

2.4. Rainfall Analysis

Inter-gauge coherence in daily rainfall across the gully network was assessed, which covers ~1 km2. Because gauges showed sufficient agreement (R2 > 0.93), we treated rainfall as spatially uniform and constructed a reference rainfall timeseries representative of the site. All rainfall totals, means, intensity, frequency, and duration metrics were computed from this site-representative series. Rainfall intensity, frequency, and duration analyses were conducted at temporal window of 10 min to characterize rainfall patterns, following the method described in [40]. The 10 min window was selected as it captures short-lived rainfall bursts within storms that are often masked when rainfall intensity is calculated using coarser temporal resolutions such as hourly or daily averages [41]. Hydrological years (July to June) were used to avoid dividing parts of the same wet seasons (which usually occur from November to March) into separate years [22]. For the event-based rainfall–runoff analysis, the rainfall recorded at each gully gauge was used, applying the event definition described in Section 2.4.

2.5. Data Preparation and Event Definition

The data preparation described in this section pertains to the treatment of raw SBLT depth data before discharge estimation (Section 2.5). In each gully, two types of correction factors were applied to the time-series stage data to address (1) high-frequency noise at low stages and (2) the installation height of the SBLT sensors. The high-frequency stage data observed below the threshold depth of 0.05 m were considered noise and removed by applying the low-pass filter. Subsequently, the sensor height from the bed was added to the filtered data to obtain the true depth of the water level. Bed level fluctuations were observed following storm events throughout the wet season. Depth corrections were applied based on post-event sensor height measurements to account for these changes. Finally, the corrected depths were validated by comparing them with the water level heights observed in the camera footage against the stage meter board.
The selection of a minimum inter-event (MIT) duration is critical in event-based studies, as it affects the calculated storm metrics such as rainfall depth, intensity, and duration, thereby affecting quantification of hydrological processes and the subsequent interpretation of their relationship to gully dynamics [42]. We used a 3-h MIT to define runoff events. In our rainfall series, 90% of intra-day rainless gaps are ≤≈3.6 h, and independent evidence shows runoff typically ceases within ~3 h of rainfall ending (camera footage and water-level records). Thus, 3 h is a conservative, site-consistent separator between adjacent storms and is consistent with prior Australian practice using a 3-h MIT [43,44]. To eliminate false detections of runoff events, a two-step filtering procedure was applied. First, events shorter than three minutes were flagged as false. Second, events with flat hydrographs were also excluded, as they were likely due to sensor responses to ambient noise rather than actual hydrograph signals. Further, flows in the channels are flashy, with stages rising and falling quickly with rainfall. Most sub-three-minute events exhibited flat stage hydrographs, further supporting the robustness of the filtering process. Rainfall associated with each runoff event was defined as the cumulative precipitation that occurred concurrently with the event, as well as prior rainfall limited to periods with dry intervals not exceeding 3 h. This definition was further constrained by including only rainfall that fell after the conclusion of the previous runoff event, thus ensuring that each event was analyzed in the context of a discrete, continuous rainfall period. All the event detection and filtering processes were programmatically automated and conducted using a Python 3.1 program supplemented by visual checks using camera footage.

2.6. Estimating Discharge

The Hydrologic Engineering Center—River Analysis System (HEC-RAS) hydrodynamic 2-D model was used to develop a discharge rating curve for each gully [45]. An ultra-high resolution Digital Terrain Model (DTM) with a spatial resolution of 0.01 m was used as a base terrain model in HEC-RAS. A 2-D flow area with a mesh size of 0.1 m was defined encompassing the gauging stations in the gully channel and was enforced onto the terrain. Hydraulic properties, including channel cross-section and energy slope for the flow computation, were derived from the base DTM. HEC-RAS simulations were conducted under unsteady flow conditions, allowing for the dynamic modelling of time-dependent variations in discharge, velocity, and water surface elevation, which is observed in gully systems [46]. To accurately derive discharge, we first established multiple Rating Curves (RCs) based on a range of Manning’s n values. We then applied a two-stage validation process to select the most physically realistic RC. First, because these gullies are flashy, ephemeral systems with no baseflow, we rejected any RC that overestimated the total flow depth relative to the total event rainfall [46]. Second, we validated the remaining RCs by comparing their modelled flow velocity to values estimated independently using Space-Time Image Velocimetry (STIV) [47]. The RC that yielded the highest agreement with the STIV data was adopted for all discharge calculations.
Q = a h b
where Q is discharge (m3/s), a and b are empirical coefficients derived from the rating curve. It is important to note that the velocity meter frequently encountered difficulties in recording continuous velocity data across the hydrograph, suggesting that the installed velocimetry equipment may not be well-suited for hydrologically flashy environments characterized by highly turbid and dynamic surface runoff. Additionally, in some conditions, they underestimated velocities by at least 30% compared to those established with other method [46]. Similarly, calculating discharge using STIV-derived velocity was not possible due to the limitations of the method for events occurring during low visibility or nighttime. As a result, discharge was estimated from the stage–discharge rating curve (Equation (1)) for each gully using the recorded water-depth data. Runoff volume (v) for each event was then calculated using the following equation:
V = i = 0 n Q t i Δ t
where Q t i is discharge at timestamp t i , Δ t is the logging interval (10 s), and n is the number of samples in the event

2.7. Rainfall-Runoff Analysis

Runoff volume was normalized by the total catchment area to derive runoff depth, allowing direct comparison with rainfall depth [22,48]. Runoff ratios were then calculated for each event separately for each gully. Descriptive statistical parameters were calculated for each site to assess the runoff and runoff ratio variability both within and across each gully. To assess intra-annual variability, both runoff and runoff ratio for all sites were combined and aggregated monthly. Analyses used only gauge-recorded events. Events missed because of equipment malfunction were not interpolated or reconstructed. Further, runoff data for JJ2 and Gil2 for 2024–2025 were excluded from these analyses as remediation of these gullies had begun. An intensive remediation method involving surface modification, subsoil amelioration and the installation of engineered hydraulic structures was undertaken in both gullies, resulting in significant changes in hydraulic properties.

2.8. Statistical Analysis

Multiple regressions were used to assess the influence of rainfall characteristics (event rainfall, duration, I10, and average intensity) on runoff during wet and dry seasons. One-day and two-day prior rainfall totals were used as proxies for antecedent soil moisture [22]. To test the hypothesis that rainfall–runoff relations differ among gullies with different catchment-to-gully area ratios (Aca), we grouped gullies into low Aca (Aca ≈ 1) and high Aca (Aca ≥ 5). Low-Aca gullies are eroded to the catchment limit, meaning the active gully planform is roughly the same as the upslope contributing area because headcuts have captured almost all local drainage. In these systems, runoff is generated entirely within the gully footprint, covering the floor and immediate margins, which reflects short flow paths, limited storage, and infiltration excess conditions. On the contrary, high-Aca gullies have larger upslope source areas, so runoff can arise from both the gully footprint and the upslope once soils have wetted enough to establish connectivity, which can change the rainfall and runoff relation. To evaluate the divergence in relationships, segmented (breakpoint) regression analyses were conducted for each group, with statistical significance testing evaluated to assess the presence of threshold-dependent behavior. Breakpoint was tested using an F-test comparing a single-break piecewise linear model (4 parameters) against a single straight line (2 parameters). If the improvement was not significant (p > 0.05), a single linear model was accepted; otherwise, the segmented model was reported. Breakpoint uncertainty was quantified using a nonparametric bootstrap (B = 1000) and reported 95% percentile confidence interval. Additionally, after identifying the breakpoint, we tested the significance of the slope change (β_post–β_pre) with a Wald t-test and reported the corresponding p-value and 95% confidence interval. Previous studies have utilized segmented regression to analyze non-linear relationships and model threshold-dependent behaviors in hydrological responses, emphasizing its critical role in understanding the complex dynamics of rainfall and runoff processes.

2.9. Infiltration Test

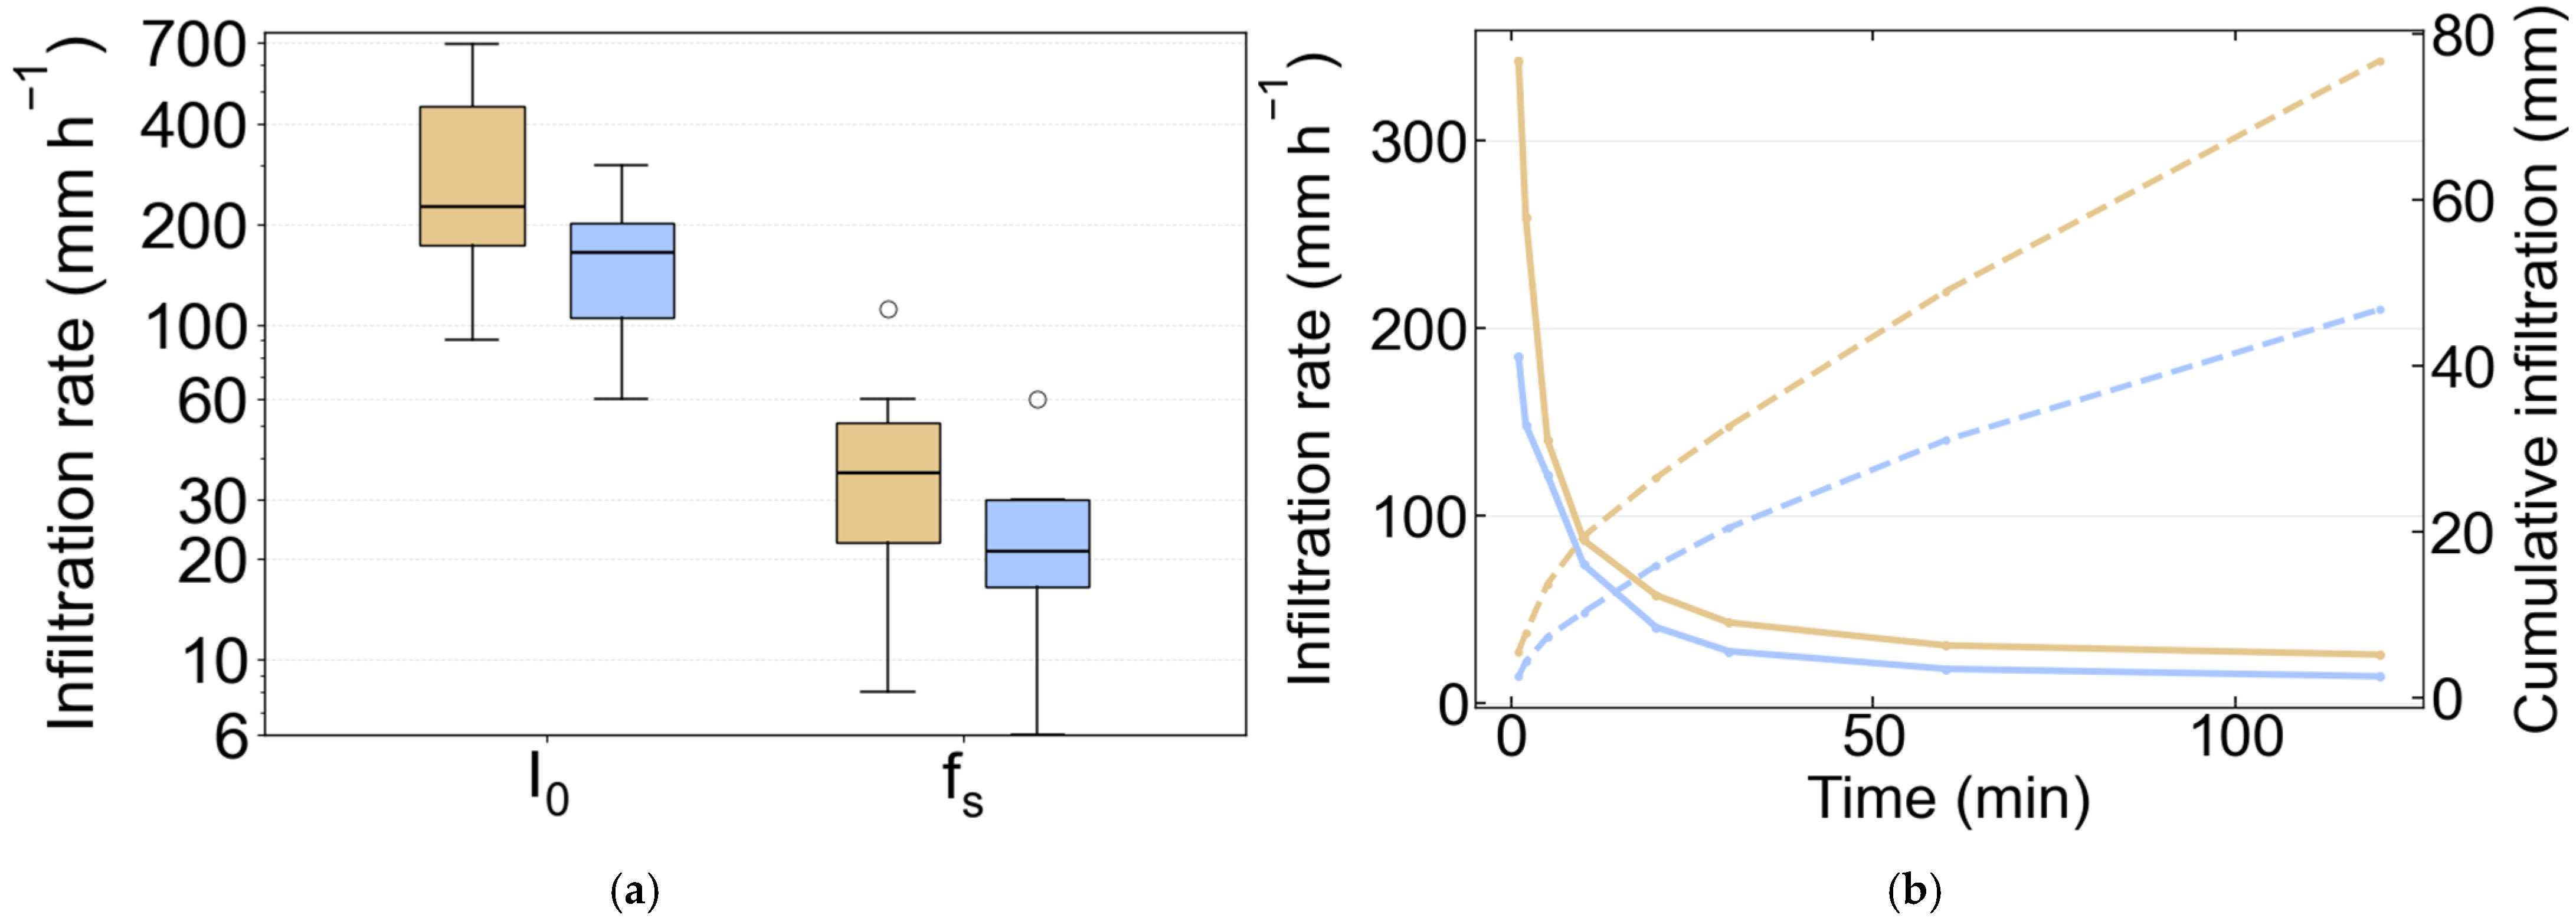
Single-ring infiltration tests were undertaken to compare near-surface infiltration in the upslope catchment and within the gully, and to provide an indicative measure of soil infiltration capacity [49]. A metal ring (15.5 cm diameter) was inserted a few centimeters into the soil, filled to a known head, and the decline in water level was read at defined time intervals (Figure 4). The infiltration sites were chosen to represent the dominant terrain in each of the settings. Infiltration curves were constructed for each test to determine initial and steady-state infiltration rates. A total of 21 measurements were taken at independent locations distributed across the catchment (n = 13) and the gully area (n = 8), and results are summarized for each of these two zones [49]. These metrics are used qualitatively to support the interpretation of rainfall–runoff behavior and are not included as predictive covariates in statistical model.

3. Results

3.1. Rainfall Characteristics

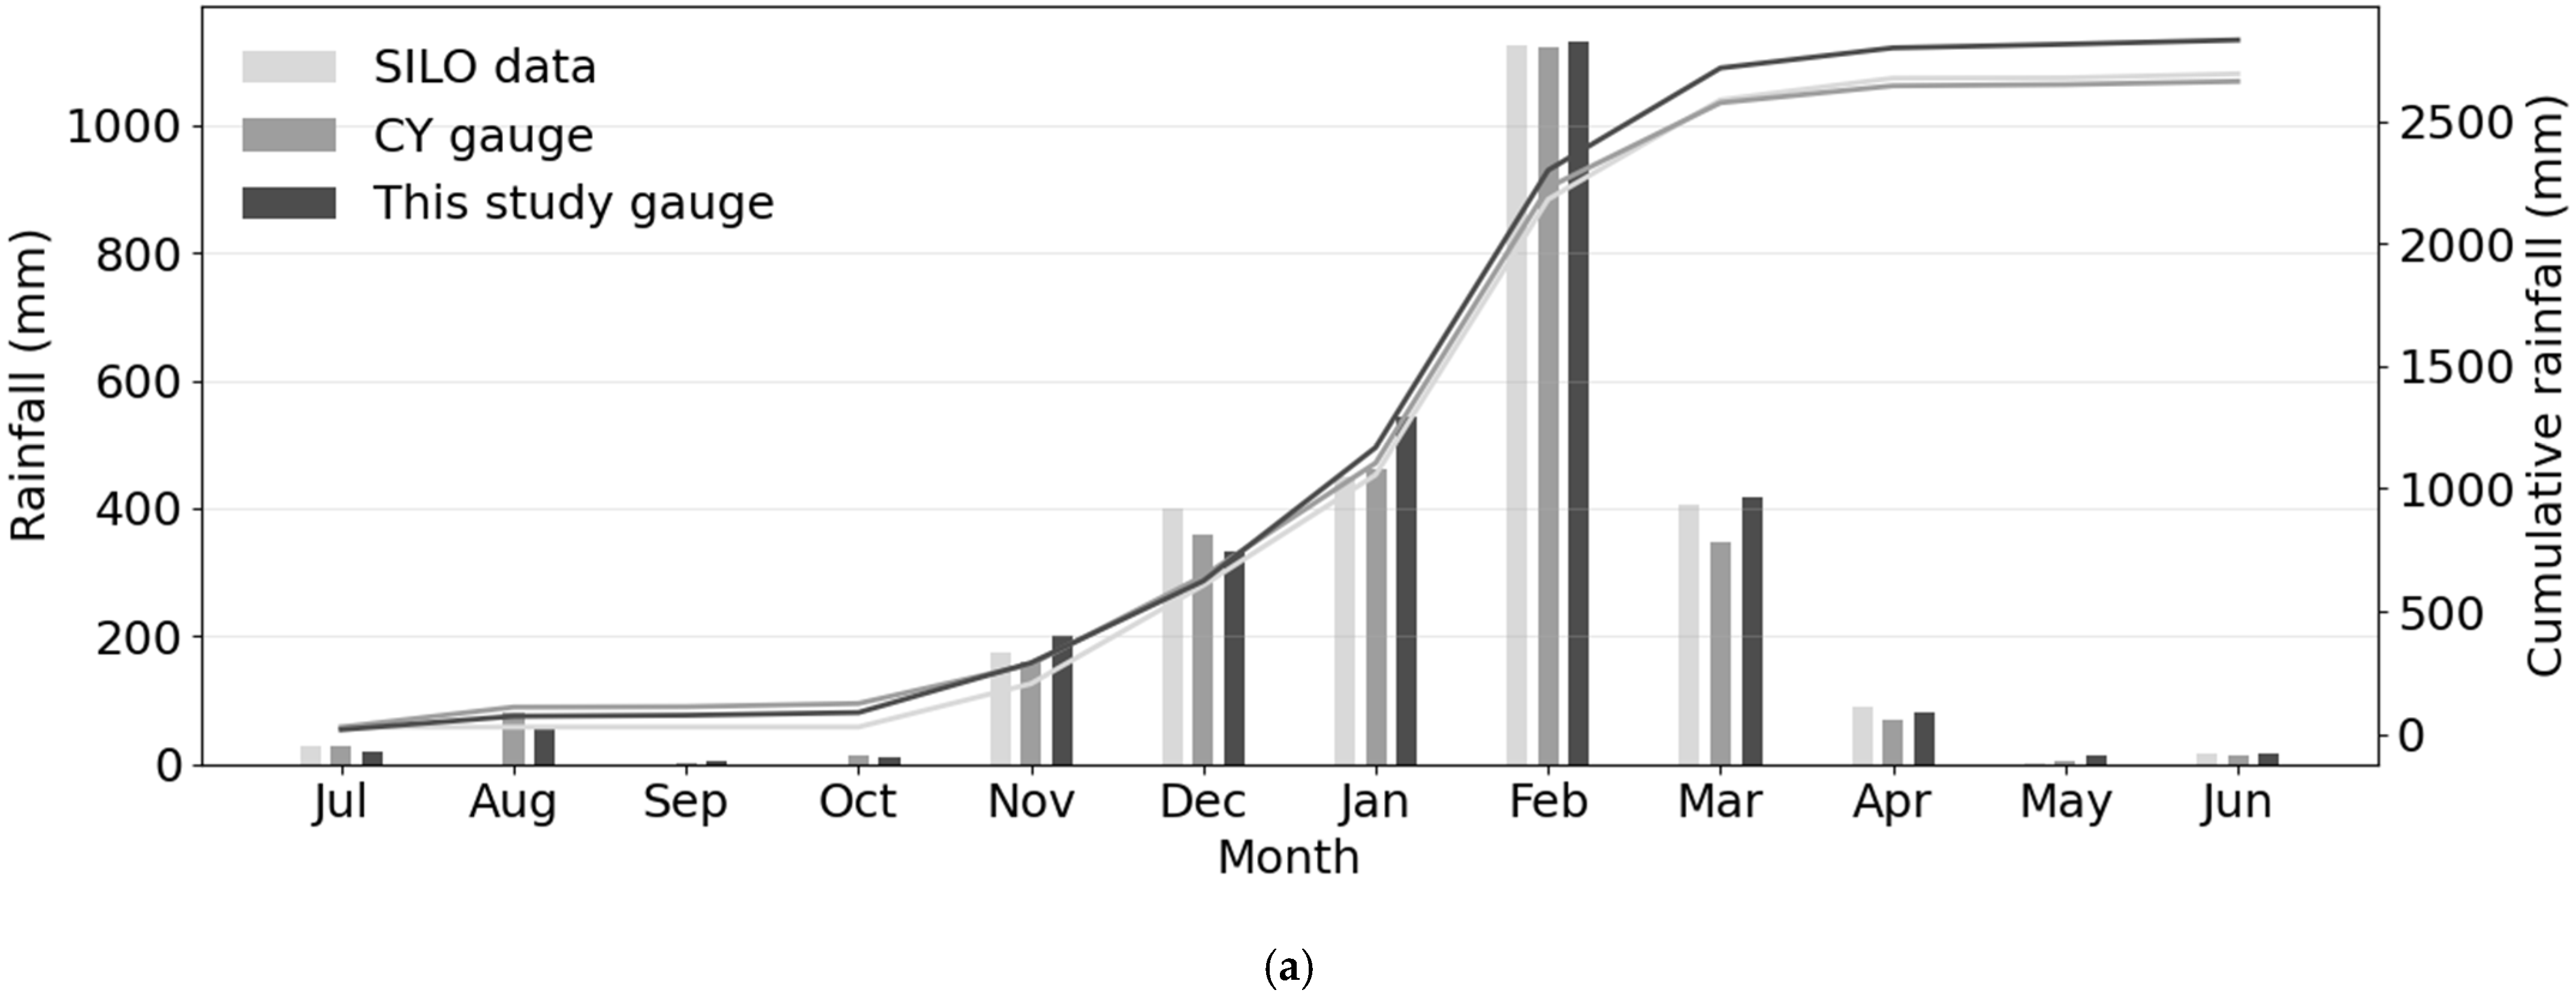
A total of 2830 mm of rainfall was recorded during the study period (3 years), with a mean annual total of 943 mm—higher than the site’s long-term mean (1889 to 2025) of 634 mm year−1 (Figure 5a). Monthly rainfall totals from Scientific Information for Landowners (SILO) and the Continong Yard (CY) gauge, located ~5 km north of the study site, were broadly comparable over the study period, supporting the completeness of the study-site gauge record (Figure 5a). Rainfall was highly seasonal: pooled across the study period, ~95% fell between November and March. February was the monsoon peak (~40% of the total), whereas September contributed only 0.1%. The maximum daily rainfall was 180 mm recorded on 1 February 2025. This 24 h total exceeded the combined three-year rainfall for July, August, September, October, April, May, and June, highlighting the extreme variability of daily rainfall.
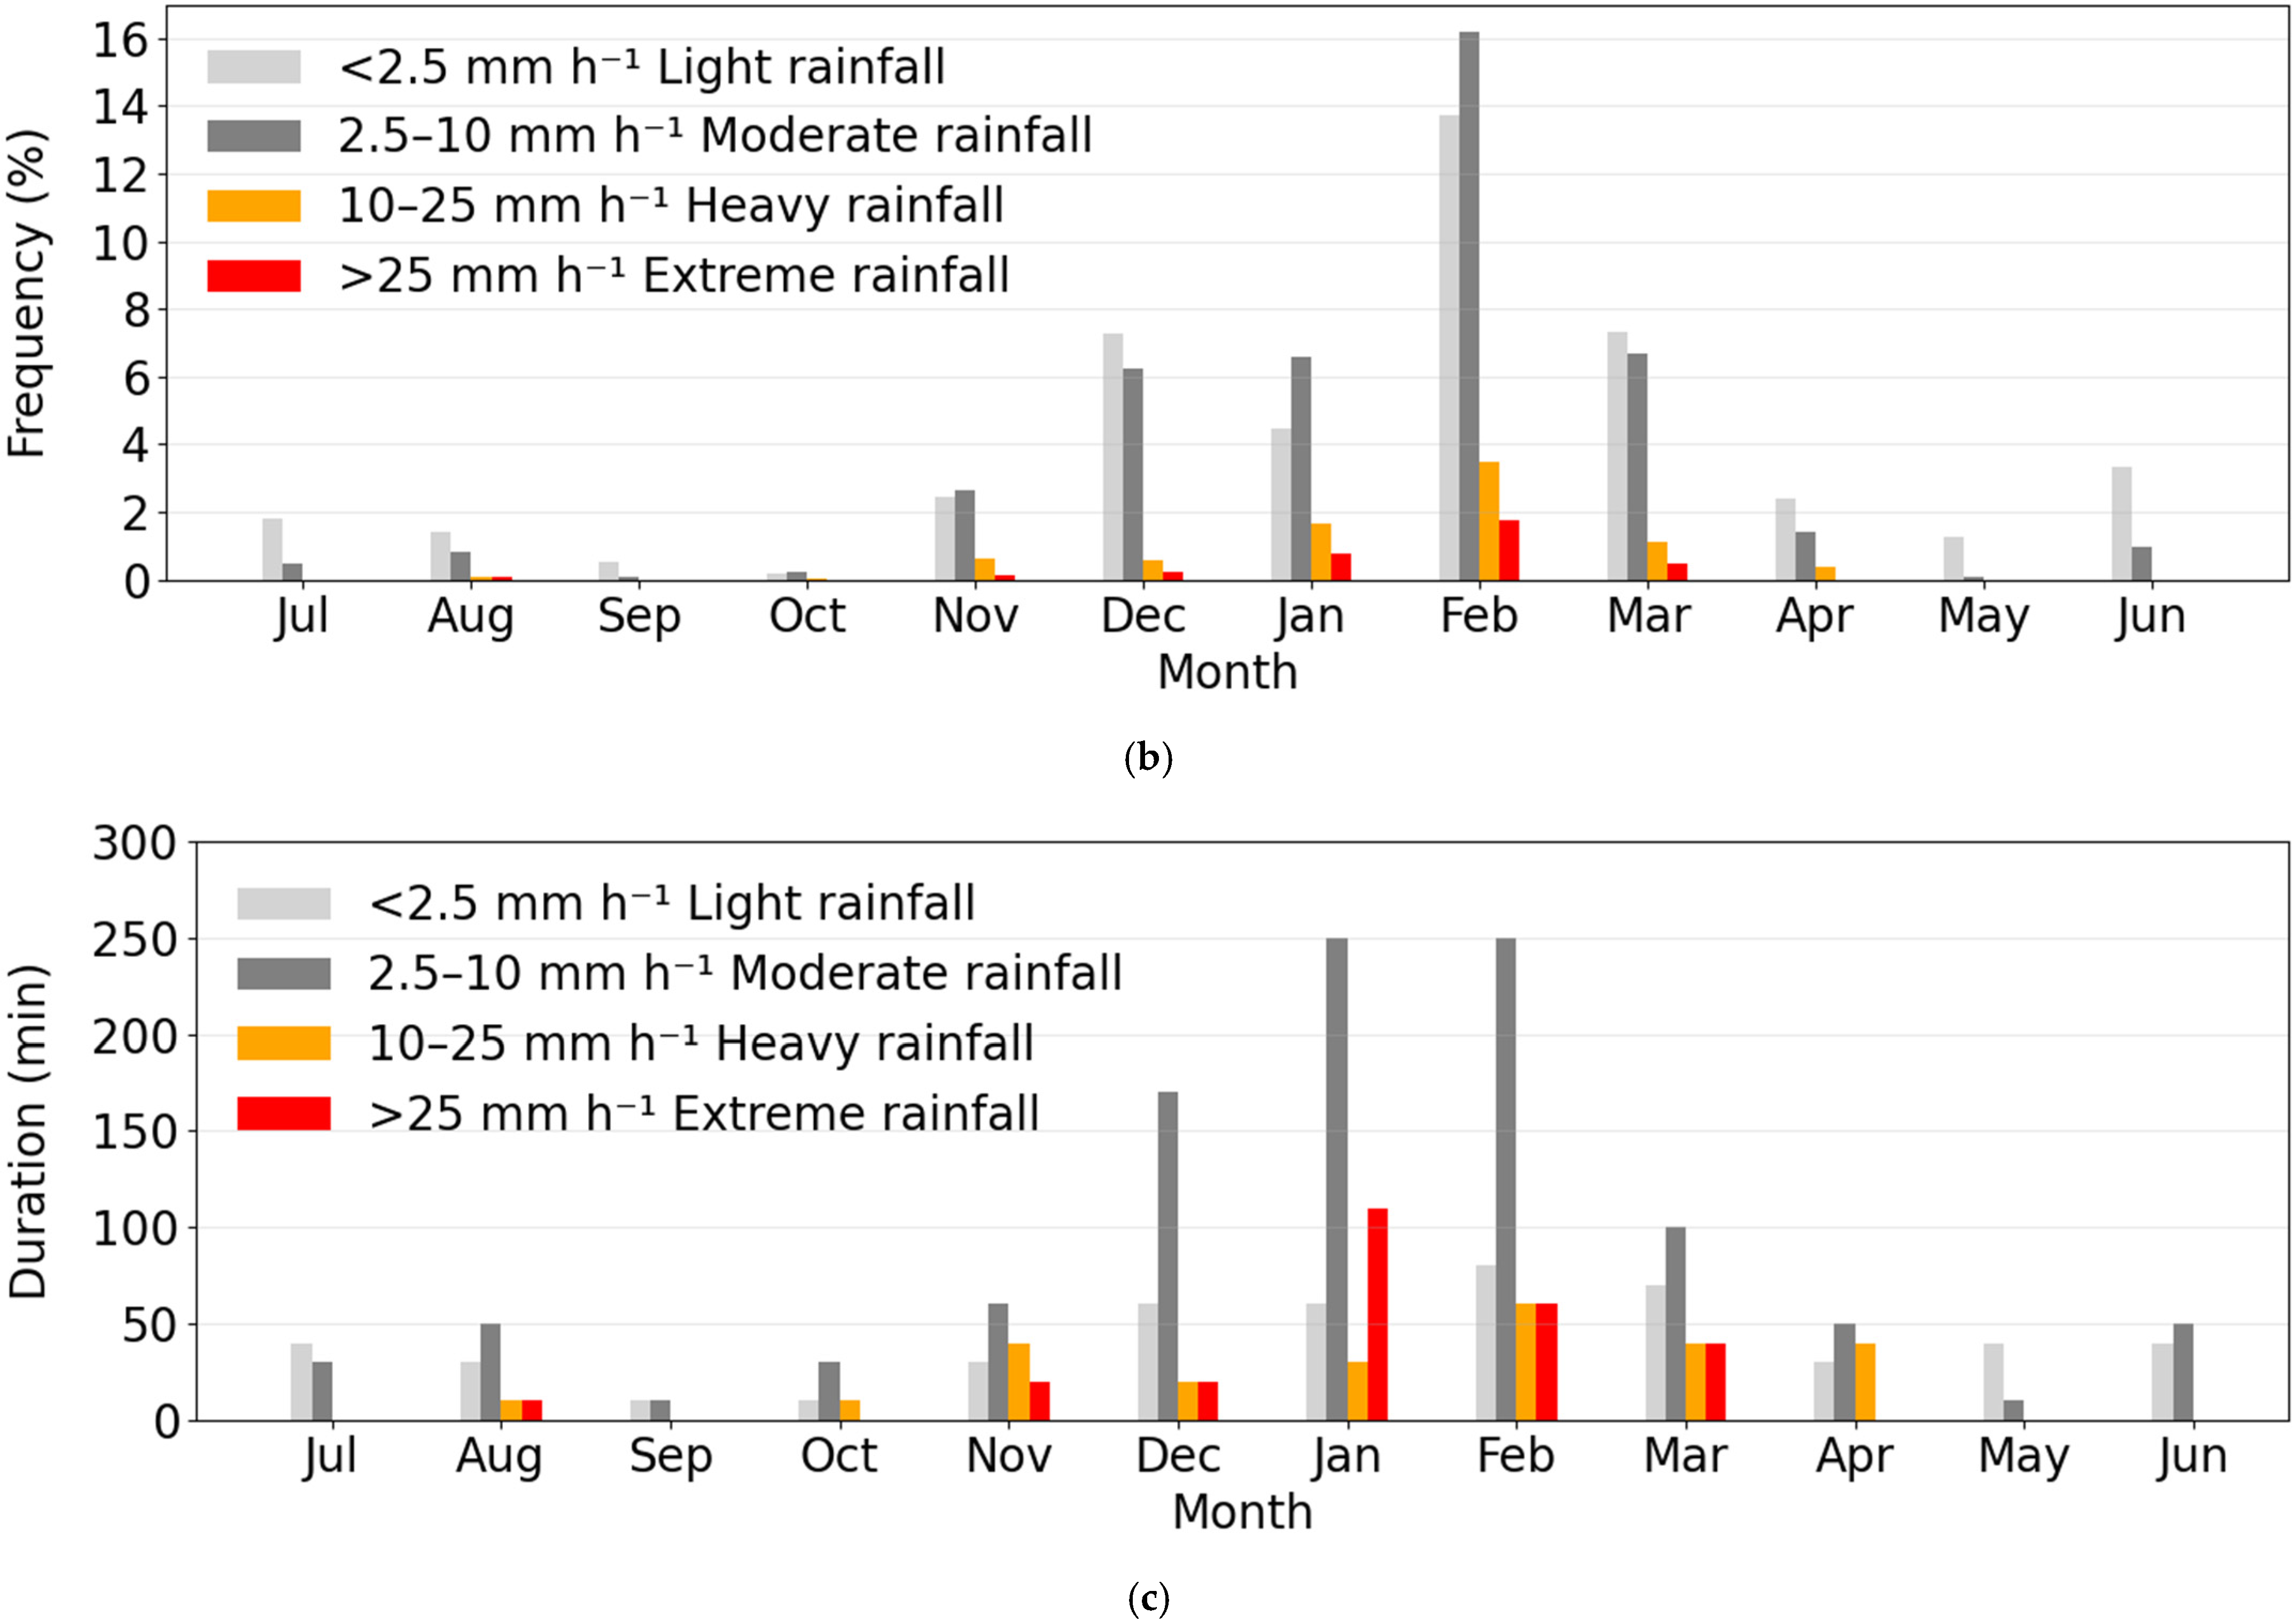
Seasonal variation in rainfall intensity was also evident (Figure 5b). Dry season (April–October) was exclusively dominated by light to moderate rainfall events (<10 mm h−1). Light to moderate rainfall also occurred during the wet season, but heavy to extreme intensity (>10 mm h−1) rain also fell. The duration of each rainfall-intensity category increased from the dry season into the wet season, peaking in January–February (Figure 5c).

3.2. Runoff Variability

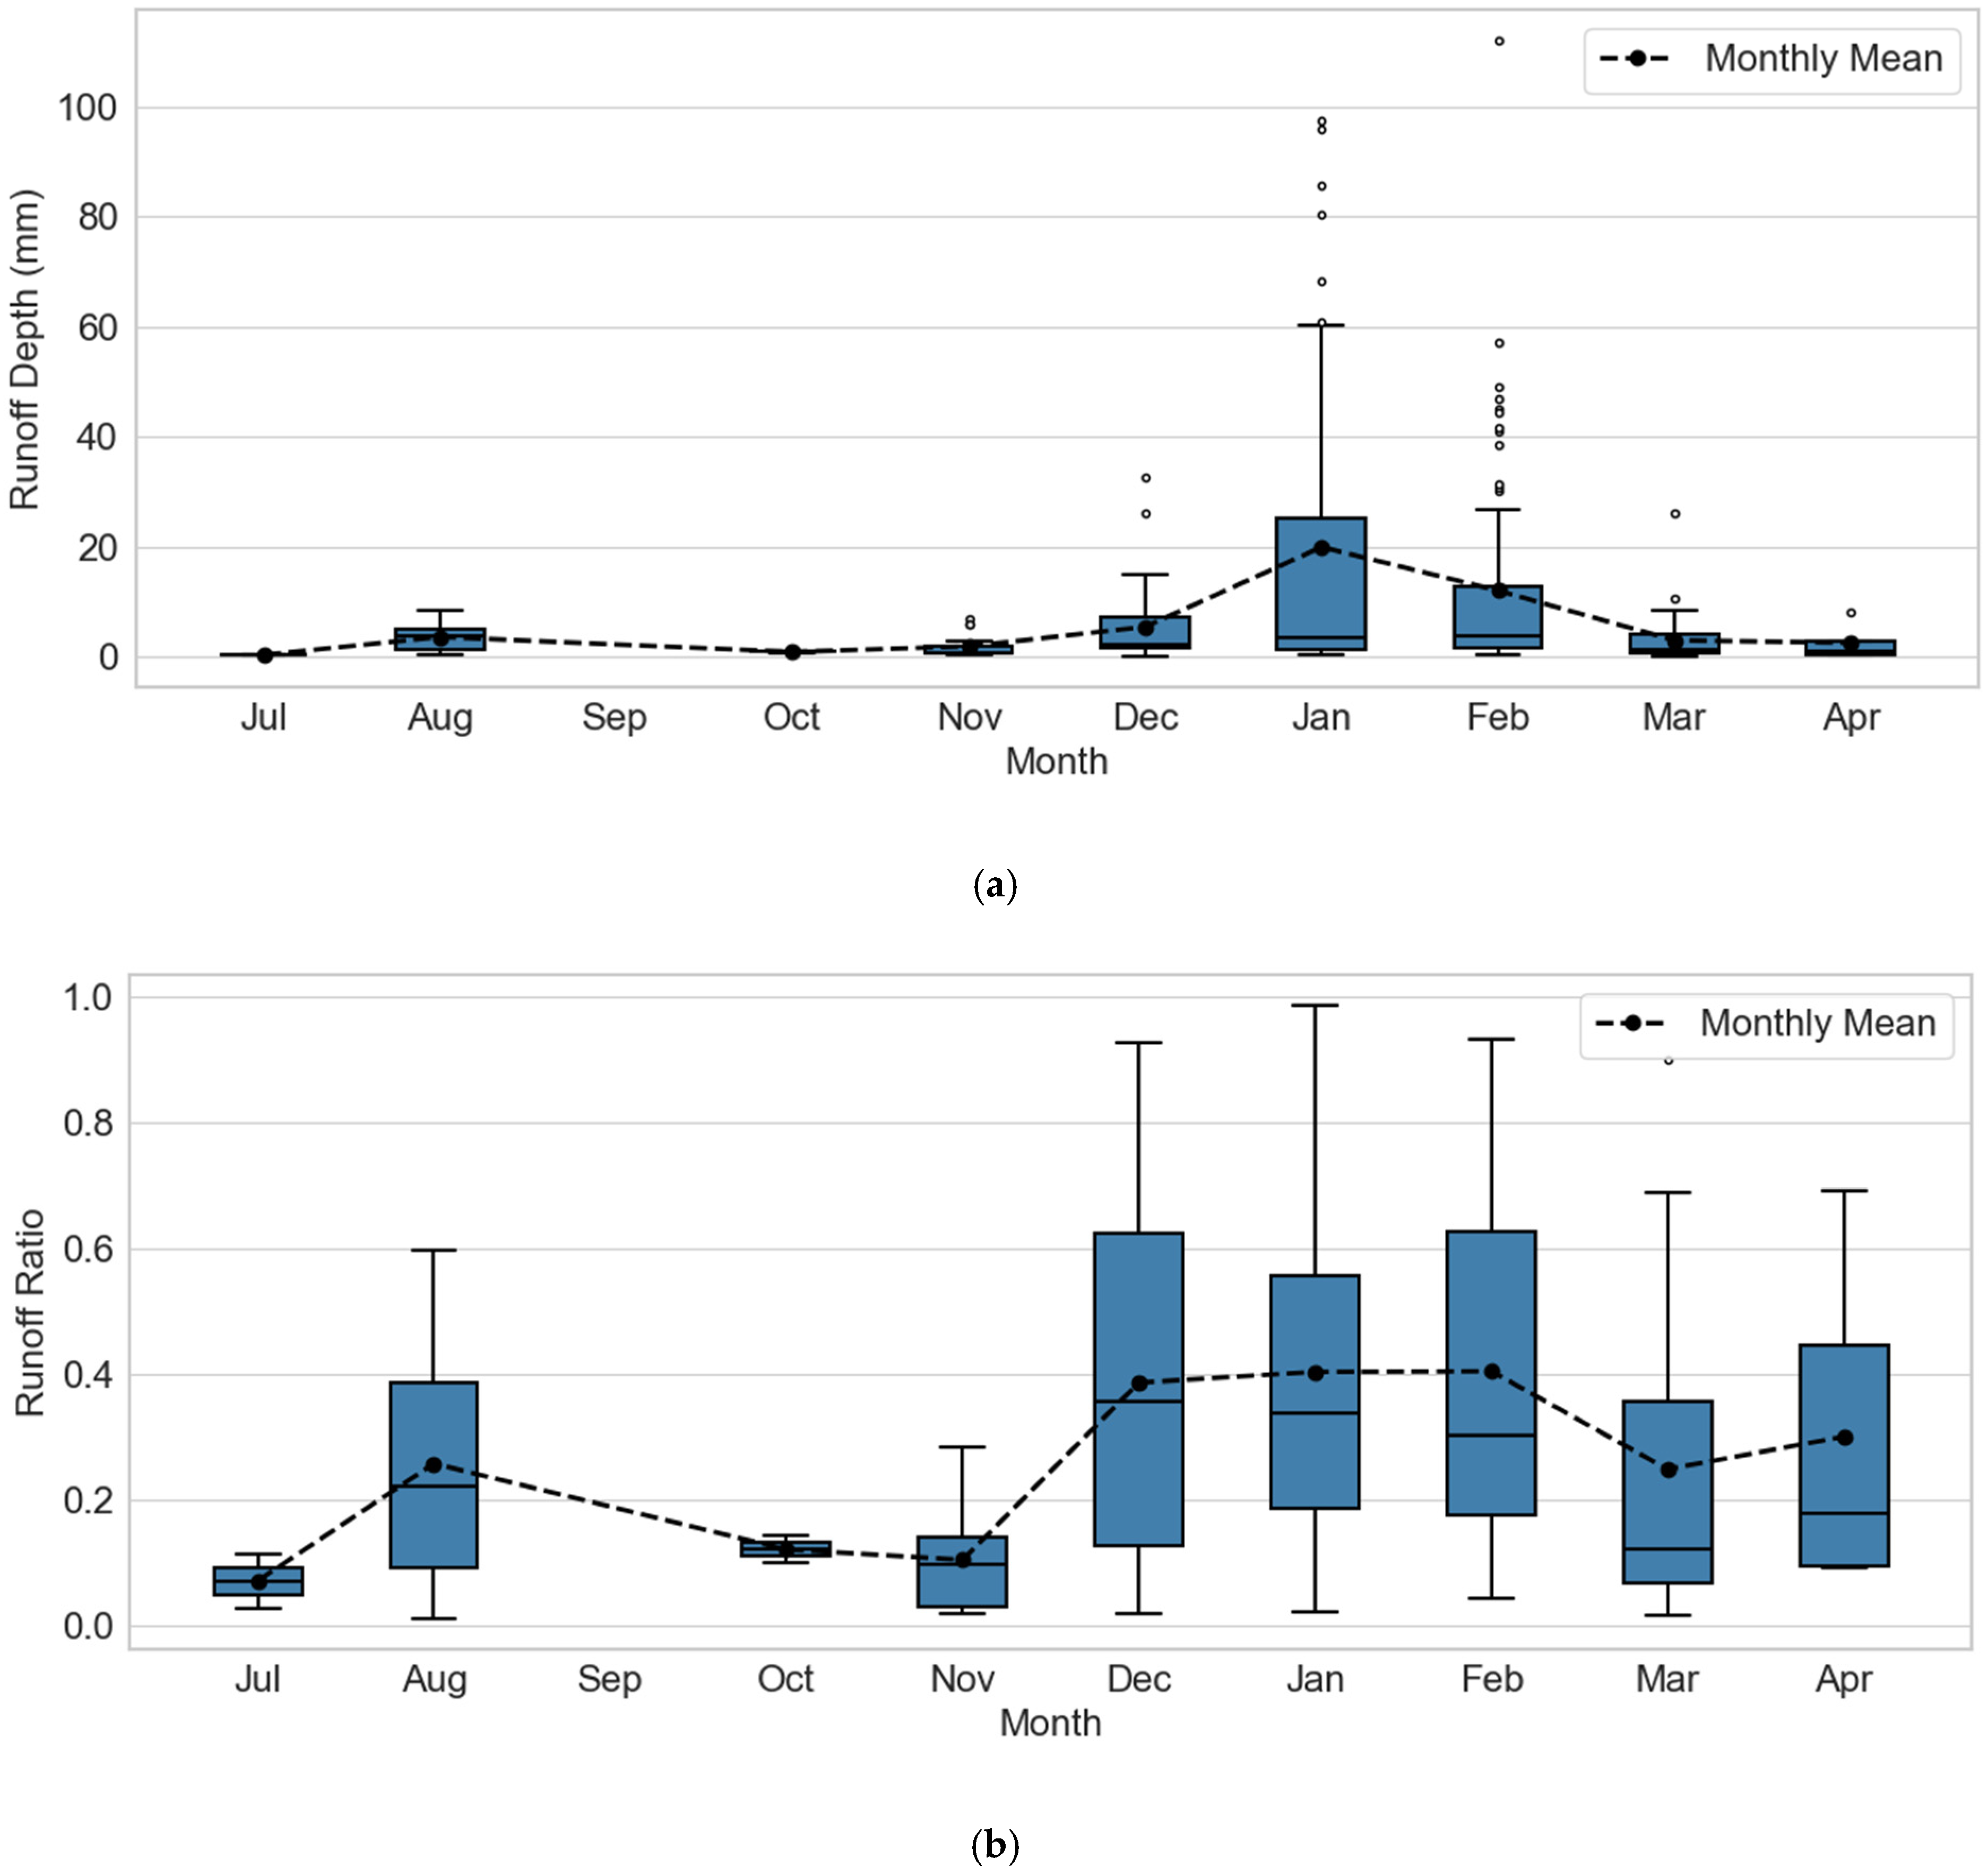
To assess spatial and temporal variations in runoff response, both within and between gullies, event-scale rainfall (P), runoff depth (R), and the rainfall–runoff ratio (RR) were analysed. R is defined as the runoff volume normalized by the total catchment area (i.e., gully plus upslope area), while RR represents the ratio of R to P for a given event and serves as a measure of runoff efficiency. These normalizations allow direct comparison of runoff responses across catchments of different sizes. The descriptive statistics of these parameters are provided in Table 2 and the monthly distribution of R and RR are provided in Figure 6. For all gullies, R exhibited substantial event-to-event variability, with coefficients of variation (CV) exceeding 100% within each gully. High-Aca gullies (JJ2 and JJ5) showed the highest variability (CV = 264% and 259%, respectively). Their mean R values were also considerably lower—approximately half those of the gullies with low-Aca gullies (Gil1, Gil2 and Lei1), which exhibited CVs ranging from 141% to 180%. Similarly, mean RR values for JJ2 (0.45) and JJ5 (0.34) were lower than those for the other gullies, which ranged from 0.52 to 0.68.
In terms of temporal variability, dry-season runoff depths were consistently lower than wet-season depths, ranging from 0.8 to 7 mm, consistent with the lower rainfall totals recorded during this period (Figure 6a). The monthly average runoff ratios follow a similar trend to both runoff and rainfall, with drier months showing lower efficiency in generating runoff (0.07 to 0.3) compared to wet season events (0.1 to 0.4). A total of ~220 events were analysed over the study period (Figure 6b).

3.3. Relationship Between Rainfall Characteristics and Runoff

Multiple linear regression models were employed to investigate the functional relationships between rainfall characteristics and runoff depth, analyzed separately for the wet (November–March) and dry (April–October) seasons (Table 3). The predictor variables considered were total event rainfall (P), antecedent rainfall over 1 day (1dA) and 2 days (2dA), average rainfall intensity, rainfall duration, and peak 10 min intensity (I10).
Total event rainfall (P) was the dominant predictor of wet season runoff depth with a strong positive correlation between the two variables (standardized β = 0.66, p < 0.001). A model incorporating only total rainfall explained 81% of the variance in runoff depth (adjusted R2 = 0.81). Rainfall duration and peak 10 min intensity (I10) also demonstrated statistically significant positive associations with runoff depth (p < 0.001), but their explanatory power was lower (adjusted R2 = 0.26). In contrast, average rainfall intensity did not significantly predict runoff depth (p = 0.22) without any explanatory power (adjusted R2 = 0.01). Similarly, the inclusion of antecedent rainfall (1dA or 2dA) alongside total rainfall did not significantly enhance model performance (adjusted R2 remained at 0.81), and the coefficients for both 1dA (p = 0.957) and 2dA (p = 0.709) were not statistically significant.
In the dry season, although I10 showed the highest predictive power (adjusted R2 = 0.13), the relationship was insignificant (p = 0.102). Runoff and all other metrics were not related significantly statistically, possibly due to small sample size (n = 15).

3.4. Near-Surface Soil Infiltration Characteristics

The infiltration tests revealed a contrast in near-surface hydraulic properties between the gully floors and the upslope catchment areas (Table 4, Figure 7). The median steady-state infiltration capacity (fs) in the upslope catchment was 36 mm h−1, almost twice the median value of 21 mm h−1 measured within the gullies. This marked disparity was established more rapidly in the gullies, which reached steady state in a median time (Ts) of 20 min, compared to 30 min for the catchment soils. The pattern of markedly higher infiltration rate in the catchment was consistent across all metrics. The median cumulative infiltration depth required to reach steady-state conditions, F(Ts), was 14 mm for the gully soils compared to 32 mm for the upslope catchment, indicating that less water is needed to saturate the surface and initiate persistent runoff within the gullies.

3.5. Divergent Rainfall-Runoff Responses in Low- vs. High-Aca Gullies

Breakpoint analysis revealed a statistically significant (p < 0.001) segmentation in the rainfall–runoff relationship for the gullies with high-Aca values, represented by JJ2 and JJ5, with a breakpoint occurring near 26 mm (95% CI = [20–35 mm]) of event rainfall and a duration of approximately 3 h (Figure 8a). The slope increased markedly beyond this breakpoint, indicating enhanced runoff response under higher rainfall inputs. A Wald t-test confirmed that the change in slope (β_post–β_pre) was statistically significant (t = 2.25, p = 0.03), with a 95% confidence interval for the slope change ranging from 0.4 to 0.9, suggesting a robust increase in rainfall sensitivity after the threshold. In contrast, a single linear model was sufficient to characterise the rainfall-runoff relationship for the gullies with low Aca values, comprising Gil1, Gil2, and Lei1 (Figure 8b).
To further investigate the role of upslope contributions, hydrographs from all gullies were analysed for a high-intensity rainfall event on 31 January 2024, during which approximately 100 mm of rainfall was recorded over six hours, with an average intensity of 15 mm h−1 (Figure 9). All gullies responded rapidly to the initial 30 mm h−1 rainfall, exhibiting a runoff response within 15 min. The first peak flow occurred uniformly across gullies, with Gil1 (the largest gully area) registering the highest initial peak at 0.27 m3 s−1. A subsequent increase in rainfall intensity (~60 mm h−1) resulted in a second peak, during which JJ2 and JJ5 surpassed Gil1 in peak flow. The third and highest peak emerged approximately 1.5 h into the event, corresponding to sustained rainfall of 60 mm h-1 over a 20-min window. Notably, JJ2 exhibited a sharp increase in peak flow, nearly quadrupling its second peak value. A key distinction between hydrographs from high-Aca and low-Aca gullies is observed in the third peak. While both groups experienced a rise in flow, the low-Aca gullies rapidly receded to near pre-peak levels. In contrast, the high-Aca gullies maintained elevated flow levels for a significantly longer duration. Cumulative flow data further underscored this divergence: the high-Aca group exhibited a steeper rise in runoff volume and continued flowing for up to two hours after rainfall cessation, whereas low-Aca gullies ceased flowing within 30 min. These findings suggest that gullies with similar areas may exhibit markedly different hydrological dynamics depending on the magnitude of upslope runoff input. Moreover, this divergence appears to be threshold-dependent, with the third peak in hydrographs of high-Aca gullies likely representing a transition from localized gully response to combined gully and upslope catchment-driven runoff.

4. Discussion

4.1. Rainfall-Runoff Relationship

The rainfall patterns observed in this study are consistent with the broader trends of the Upper Burdekin catchment, which is characterized by a distinct wet season spanning November to March marked by intense and frequent rainfall events, followed by a dry season with infrequent and low-intensity rainfall [22]. The wet seasons during the study were unusually wet despite coinciding with an ENSO (El Niño-Southern Oscillation) phase usually associated with drier conditions. This anomaly—most evident in northern Australia—was driven by the combined effects of a positive Southern Annular Mode (SAM) and warmer-than-average tropical sea-surface temperatures, which increased atmospheric moisture and produced above-average rainfall over the study period.
Despite relatively uniform rainfall across the gully network (R2 > 0.93), runoff varied both within and among gullies (coefficient of variation 141–264%). Event-scale variability was explained primarily by total event rainfall (81%), indicating a strong dependence of runoff volume on rainfall amount. By contrast, rainfall intensity had a much weaker effect; its linear relationship with runoff depth was modest (R2 = 0.20). This limited explanatory power is consistent with rapid saturation of the shallow gully soils: infiltration tests show a median ~20 min time to reach steady state. Adding antecedent rainfall (1- and 2-day totals) did not improve the rainfall-runoff relationship (Table 3), suggesting that, at the scale of alluvial gullies, antecedent moisture has only a short-lived influence due to rapid wetting–drying cycles. At the broader catchment scale in the Upper Burdekin, a late-season lag between rainfall and runoff ratio has been reported and attributed to antecedent soil moisture [20]. This underscores a scale dependence in moisture-memory effects. These findings align with studies showing that gullied landscapes—especially those incised into low-permeability substrates—have minimal storage and produce overland flow with limited dependence on prior soil moisture [10,11]. Similar behaviour has been reported in arid regions by Acworth et al. [9], although they attribute it to intrinsic soil hydraulic properties rather than erosion. In this study, gully erosion reduced steady-state infiltration on gully floors by ~42% relative to the upslope catchment (≈21 vs. 36 mm h−1). However, it must be acknowledged that point-scale, single-ring infiltration tests do not fully capture the effective hydraulic properties of the entire upslope catchment area. Nevertheless, these tests were conducted across several representative sites, including those with varying vegetation and soil types, to account for landscape spatial heterogeneity.
Interestingly, when the analysis was limited to dry-season events, no predictors showed any significant relationship with runoff. This apparent lack of relationship likely reflects low statistical power due to the small sample size rather than a true statistical relationship. In the dry tropics of northern Australia, dry-season rainfall is less frequent and less intense, resulting in fewer runoff events. In this study, the dry season accounts for only 5% of the total rainfall and 6% of total runoff events. Accordingly, dry-season events contribute little information to estimating the event-scale rainfall–runoff relationship at these gullies, and inference in this study is, therefore, mainly based on the wet-season.
The rainfall-runoff relationship is dynamic and is expected to change with long-term climate trends [50]. Historical rainfall records indicate an increase in daily intensity since about 1970 (Figure 2). Within the process framework adopted here, such a shift would be expected to increase the runoff efficiency and to increase the frequency of upslope activation at high-Aca sites (see Section 4.2). The consequence is more runoff per unit rainfall and greater erosional capacity, driven especially by short-duration, high-intensity bursts [41]. However, in the absence of long-term event-scale runoff observations at the study location, the magnitude of any historical shift in the rainfall-runoff relation cannot be quantified.

4.2. Divergence in Rainfall-Runoff Relationship

Gully erosion alters surface topography and hydrological function by increasing slope gradients, enhancing hydrological connectivity, and lowering the local base level [51]. These topographic changes reduce the potential for water storage and lead to more rapid and concentrated runoff [12]. Based on this, we hypothesize that the rainfall-runoff relationship will differ between gullies with limited upslope contributing areas—characterized by low catchment-to-gully area ratios (low Aca)—and those with larger contributing areas (high Aca), due to differences in runoff generation, flow concentration, and retention capacity. To test this hypothesis, rainfall-runoff relationships were examined using piecewise regression analysis for the low-Aca and high-Aca gully groups separately. Breakpoint or piecewise regression analysis revealed distinct rainfall–runoff relationships between these systems. The suitability of a simple linear model for the low-Aca gully group further supports the dominance of direct rainfall-driven runoff and the limited influence of antecedent soil moisture, consistent with the hydrological behavior typical of gully-dominated systems [11]. The segmented regression observed for the high-Aca cohort indicates threshold-dependent runoff generation from the upslope catchment. In these gullies, substantial rainfall—approximately 26 mm—is required to initiate significant runoff contributions from the upslope catchment. This interpretation is strongly supported by our infiltration data, which showed that a median cumulative depth of 32 mm is required to reach a steady-state infiltration rate in the catchment, compared to just 14 mm within the gullied area. Furthermore, the median steady-state infiltration rate in the catchment (36 mm h−1) was nearly twice that within the gully. This high infiltration capacity, coupled with the catchment’s dense grass cover, woody vegetation, and low gradient, suggests that the rainfall threshold required to generate surface runoff from the upland area is consequently high. The threshold identified by breakpoint analysis may therefore reflect the initiation of subsurface flow contributions from the catchment rather than direct surface runoff. This is consistent with the concept that in catchments with low gradients and dense ground cover, the “soil bucket” must be filled first, leading to greater losses via infiltration and evapotranspiration before runoff begins [48,52,53]. This mechanism is further evidenced by the mean RR of High-Aca gullies (0.40 to 0.46) being lower than that of the low-Aca gullies (0.52 to 0.68). Over the study period, about 28% of storms reached intensities above the catchment steady-state infiltration rate and about 20 % exceeded 26 mm total depth, indicating conditions conducive to catchment runoff. However, the actual occurrence depends on intensity, timing, and antecedent moisture (Figure 10). Furthermore, establishing a robust functional relationship between the activation threshold and a wider range of Aca values requires further investigation.
In the GBR catchment, very few studies have reported RR values from event-scale analysis. Bartley et al. [54] observed annual variability in RR across sites, with a low ground cover site yielding RR = 0.45–0.71 and better-covered sites consistently reporting below 0.14. These high RR values at the low-cover site align with our low-Aca gullies, which are eroded to the catchment limit and are effectively bare, whereas the lower RR at better-covered sites is consistent with higher infiltration and reduced runoff generation. However, it is important to note that their study was conducted during a relatively drier period, when the annual rainfall total averaged around 300 mm, substantially lower than during this study period, which averaged around 1000 mm. Under the wetter periods, RR values for good ground cover would be expected to increase significantly due to elevated runoff driven by the combination of higher antecedent soil moisture and storm intensity.

4.3. Conceptual Model of Rainfall-Runoff Process

A conceptual model of rainfall-runoff processes for alluvial gully systems with different Aca is presented in Figure 11. This model synthesizes observed rainfall-runoff relationships and infiltration results from this study, highlighting distinct seasonal dynamics and the differential responses of gullies with differing Aca characteristics.
Pre Wet Season (June–September): During the dry season, rainfall is infrequent, of low volume and intensity (Figure 5b). Most events produce no measurable runoff as rainfall intensities rarely exceed the high initial infiltration capacity (f0) of the dry-season catchment soils (see Table 4). The few events that generate a response exhibit a delayed timing-to-peak and low RP, primarily due to high initial abstraction (including interception and soil moisture storage) as depicted in Figure 9. Consequently, RR values remain low—especially in gullies with high Aca, where vegetated upslope zones and thicker soil profiles with greater storage capacity act as major water sinks.
Early Wet Season (October–November): Rainfall increases soil moisture, reducing the infiltration capacity of the gully floor itself. With rising rainfall totals and intensities exceeding fs (21 mm h−1), Hortonian overland flow (infiltration-excess) becomes the dominant runoff-generation process within the gully. This leads to a sharp increase in RR across all gullies, with the magnitude depending on gully dimensions and rainfall intensity. Significantly, runoff responses vary within individual gullies. Lower reaches that are deeply incised into low-permeability clay or bedrock generate Hortonian flow with short lag times and sharp hydrograph peaks, whereas proximal/headcut zones and immediate upslope margins, with greater profile thickness and more permeable soils, act as temporary storage via vertical infiltration [55], preferential flow through macropore flow (e.g., cracks and tree roots) [52] and ephemeral surface ponding [40]. Infiltration tests capture this heterogeneity, with steady-state rates within gullies ranging from ~16–30 mm h−1 (Table 4). For high-Aca gullies, runoff generation remains confined mainly to the gully and its immediate boundaries, with limited contribution from the wider catchment, which is still able to infiltrate most rainfall.
Peak Wet Season (December–March): High-intensity convective storms and elevated antecedent soil moisture mark this season. In low-Aca gullies, the RR approaches 100%, as the limited catchment area readily saturates. For high-Aca gullies, a critical hydrological transition occurs: the saturation and activation of the entire contributing catchment area. This leads to a non-linear, drastic increase in both peak discharge and flow duration. The specific pathway of this contribution is governed by catchment properties. Dense ground cover, low gradients, and high infiltration rates promote subsurface stormflow (throughflow) as the dominant mechanism, resulting in a delayed, attenuated hydrograph (see Figure 9). Alternatively, in areas with shallower soils, saturation-excess overland flow may dominate once the entire soil profile becomes saturated. Therefore, the scale and properties of the contributing catchment, not just the gully itself, are the fundamental determinants of runoff timing and volume in these systems.
Late Wet Season (April–May): This period is characterized by lower-intensity, shorter-duration rainfall events, similar to the early-wet period. In low-Aca gullies, runoff characteristics resemble the early-wet season because the relatively thin soil “bucket” in and around the gullies quickly returns to moisture deficit after the peak wet season. In high-Aca gullies, antecedent moisture persists across the upslope contributing area, maintaining broader connectivity and enhancing runoff response; as a result, RR values (~20–70%) are higher than in the early-wet period (~10–50%), despite similar rainfall characteristics.

4.4. Implications and Significance

The findings from this study have important implications for calculating runoff depth in ungauged gully catchments, rainfall-runoff modelling in gully systems and management. Inaccurate delineation of the contributing area leads to significant errors in runoff predictions from rainfall-runoff models. For instance, assuming a large contributing area for a small event overestimates runoff volume, whereas assuming negligible upslope contributions during a significant storm event leads to its underestimation. Therefore, accurately defining the Aca and its hydrological thresholds is essential for predicting runoff in gully-dominated landscapes. For gullies with low Aca values (≈1), a simple linear model may be sufficient to derive the RR. In contrast, gullies with high Aca values (>1.5) may require separate models to account for runoff thresholds linked to upslope activation. This study underscores the need for further research into the role of catchment characteristics, particularly shape and form, in influencing runoff thresholds and the hydraulic erosion of gully heads [56].
Most process-based gully erosion models utilize some form of rainfall-runoff model as the engine that drives the erosion process [35]. In data-poor regions, runoff is often approximated from rainfall and catchment area, implicitly assuming a single linear rainfall-runoff relation. While this provides a first-order estimate, our results suggest that future models should allow for a threshold-type response, particularly in high-Aca gullies. The existence of a threshold for high-Aca gullies also implies a dichotomy in erosional processes, where sub-threshold events may drive gully erosion through internal processes. In contrast, above-threshold events are the primary driver of gully expansion as they scour the headcut margins. Hence, models of gully erosion must capture this proces divergence. While the 26 mm threshold was robustly detected in this study, further investigation across a wider range of geographical and Aca values is needed to fully confirm its regional applicability.
The study also highlights the need to apply different management methods based on the variation in hydrological and erosional responses of gullies to rainfall. While in-situ treatment within the gully may be adequate for low-Aca systems, high-Aca gullies are more likely to require additional hydrological interventions in the upslope catchment that manage both surface and subsurface flows [29,57,58]. For example, installing diversion banks or porous check dams along the contour can significantly reduce the flow energy thereby limiting hydraulic scour at the gully head and along the channel [27]. Furthermore, high-Aca gullies may be prioritised for remediation efforts given their increased likelihood of hydrological connectivity and ongoing morphological expansion.

5. Conclusions

This study presents a three-year dataset of intensively monitored rainfall and runoff from five alluvial gullies in the Upper Burdekin catchment, combined with soil infiltration data, marking the first detailed investigation of its kind in the region. The study period experienced above-average rainfall (943 mm), with a maximum daily peak of 180 mm. Although the wet season spans from November to March, nearly 50% of the three-year total fell in February alone, underscoring the highly seasonal and episodic nature of rainfall in semi-arid northern Australia.
Runoff responses exhibited strong temporal variation, with higher RR ratio occurring during the wetter months, closely tracking both rainfall depth and intensity. Early wet season events generated flashy, low-volume runoff under dry soil conditions, whereas peak wet season storms produced prolonged and higher-magnitude flows. Antecedent rainfall contributed little to explaining additional variability in runoff, suggesting that rapid wetting–drying cycles and limited soil storage capacity constrain its influence at the gully scale. Field infiltration tests showed upslope steady-state infiltration was ~70% higher than on gully floors (~36 vs. 21 mm h−1) and reached steady state within ~20–30 min, supporting delayed upslope runoff and the observed activation threshold.
A key finding of this study is the contrasting rainfall–runoff relationship between gullies that are eroded to the catchment limit and the ones with excess catchment. Gullies with low Aca show linear runoff response to rainfall. In contrast, high-Aca cohorts exhibit a stepwise linear response to rainfall, showing threshold-dependent behavior. We observed that a minimum of 26 mm of rainfall depth is required for the upslope catchment to contribute flow into the gullies. Given the relatively high near-surface infiltration capacity (~36 mm h−1), dense vegetation, and very low relief, the effective threshold for Hortonian overland flow generation is likely even higher in this catchment.
These findings have important implications for rainfall–runoff modelling and water quality estimation in gully-dominated landscapes. In gullies with low Aca, a simple linear model may be sufficient to derive the relationships. However, in high-Aca gullies, runoff behavior is more complex, and segmented linear models may be needed to account for hydrological thresholds associated with upslope flow contributions. Recognizing and incorporating these thresholds, along with the spatial variability in gully hydrological response, is essential for improving sediment load predictions and erosion risk assessments in these dynamic systems.
More broadly, this study advances our understanding of rainfall–runoff processes in alluvial gullies with differing catchment-to-gully area ratios. By explicitly differentiating gully types based on hydrological behaviour it provides a foundation for more accurate process-based modelling, more targeted remediation strategies, and improved interpretation of water quality dynamics across diverse gully systems in northern Australia. Ultimately, the process-based approach adopted in this study is applicable in gully-dominated landscapes worldwide.

Author Contributions

Conceptualization, P.P., J.K., B.J. and S.S.; formal analysis, P.P.; investigation, P.P. and L.F.B.; data curation, L.F.B.; writing—original draft preparation, P.P.; writing—review and editing, J.K., B.J. and S.S.; funding acquisition, J.K. All authors have read and agreed to the published version of the manuscript.

Funding

This research was funded by the Queensland Government, Australia, through the Reef Water Quality Program, administered by the Queensland Department of Primary Industries, under Grant RP310. Additional internal support was provided by the Hunter Research Project and the College of Science and Engineering (CSE) MRF Competitive Funding scheme, both administered by James Cook University, Australia.

Data Availability Statement

The data presented in this study are available on request from the corresponding author. The data are not publicly available due to privacy.

Acknowledgments

The authors acknowledge the institutions and individuals who supported this research. Specially, James Cook University (JCU) for providing the necessary equipment and financial support, and the Huner Research grant for funding data collection and fieldtrips. Additionally, we also thank the Queensland Government’s Department of Primary Industries (DPI) for providing the study site and other logistical and financial support. We are grateful to Simon Hunt (DPI) for being the focal person and assisting in setting up the monitoring stations. Lastly, we thank Zoe Bainbridge (Commonwealth Scientific and Industrial Research Organization, CSIRO) and Stephen Lewis (JCU) for providing valuable feedback during the writing of this paper.

Conflicts of Interest

The authors declare no conflicts of interest.

Abbreviations

The following abbreviations are used in this manuscript:
AbbreviationsFull form
GBRGreat Barrier Reef
LiDARLight Detection and Ranging
DTMDigital Terrain Model
DEMDigital Elevation Model
SBLTSubmersible Level Transmitter
HEC-RASHydrologic Engineering Center—River Analysis System
2-DTwo Dimension
SILOScientific Information for Landowners
GISGeographic Information System
IQRInterquartile Range
CVCoefficient of Variation
F-testFisher’s test
1dA1 Day
2dA2 Day
RRRunoff ratio

References

  1. Horton, R.E. The Role of Infiltration in the Hydrologic Cycle. Trans. Am. Geophys. Union 1933, 14, 446–460. [Google Scholar] [CrossRef]
  2. Dunne, T.; Black, R.F. Partial Area Contributions to Storm Runoff in a Small New England Watershed. Water Resour. Res. 1970, 6, 1296–1311. [Google Scholar] [CrossRef]
  3. Buchanan, B.; Auerbach, D.A.; Knighton, J.; Evensen, D.; Fuka, D.R.; Easton, Z.; Wieczorek, M.; Archibald, J.A.; McWilliams, B.; Walter, T. Estimating Dominant Runoff Modes across the Conterminous United States. Hydrol. Process. 2018, 32, 3881–3890. [Google Scholar] [CrossRef]
  4. Agnew, L.J.; Lyon, S.; Gérard-Marchant, P.; Collins, V.B.; Lembo, A.J.; Steenhuis, T.S.; Walter, M.T. Identifying Hydrologically Sensitive Areas: Bridging the Gap between Science and Application. J. Environ. Manag. 2006, 78, 63–76. [Google Scholar]
  5. Walter, M.T.; Walter, M.F.; Brooks, E.S.; Steenhuis, T.S.; Boll, J.; Weiler, K. Hydrologically Sensitive Areas: Variable Source Area Hydrology Implications for Water Quality Risk Assessment. J. Soil Water Conserv. 2000, 55, 277–284. [Google Scholar] [CrossRef]
  6. Wu, Q.; Zhang, Z.; Zhang, G.; Jian, S.; Zhang, L.; Ran, G.; Zhao, D.; Lv, X.; Hu, C. Rainfall-Runoff Processes in the Loess Plateau, China: Temporal Dynamics of Event Rainfall-Runoff Characteristics and Diagnostic Analysis of Runoff Generation Patterns. Hydrol. Earth Syst. Sci. Discuss. 2020, 2020, 1–31. [Google Scholar]
  7. Yi, X.; Luo, J.; Wang, P.; Guo, X.; Deng, Y.; Du, T.; Wang, H.; Jiao, C.; Yuan, G.; Shao, M. Spatial and Temporal Variations in Soil Moisture for a Tamarisk Stand under Groundwater Control in a Hyper-Arid Region. Water 2023, 15, 3403. [Google Scholar] [CrossRef]
  8. Farley, K.A.; Jobbágy, E.G.; Jackson, R.B. Effects of Afforestation on Water Yield: A Global Synthesis with Implications for Policy. Glob. Chang. Biol. 2005, 11, 1565–1576. [Google Scholar] [CrossRef]
  9. Ilstedt, U.; Malmer, A.; Elke, V.; Murdiyarso, D. The Effect of Afforestation on Water Infiltration in the Tropics: A Systematic Review and Meta-Analysis. For. Ecol. Manage. 2007, 251, 45–51. [Google Scholar] [CrossRef]
  10. Arnold, J.; Srinivasan, R.; Muttiah, R.S.; Williams, J.R. Large Area Hydrologic Modeling and Assessment Part I: Model Development 1. JAWRA J. Am. Assoc. Am. WATER Resour. Assoc. 1998, 34, 73–89. [Google Scholar]
  11. Poesen, J.; Nachtergaele, J.; Verstraeten, G.; Valentin, C. Gully Erosion and Environmental Change: Importance and Research Needs. Catena 2003, 50, 91–133. [Google Scholar] [CrossRef]
  12. Valentin, C.; Poesen, J.; Li, Y. Gully Erosion: Impacts, Factors and Control. Catena 2005, 63, 132–153. [Google Scholar] [CrossRef]
  13. Nkonya, E.; Mirzabaev, A.; von Braun, J. Economics of Land Degradation and Improvement—A Global Assessment for Sustainable Development; Springer: Cham, Switzerland, 2016. [Google Scholar]
  14. Marzen, M.; Iserloh, T.; Casper, M.C.; Ries, J.B. Quantification of Particle Detachment by Rain Splash and Wind-Driven Rain Splash. Catena 2015, 127, 135–141. [Google Scholar] [CrossRef]
  15. Horton, R.E. Erosional Development of Streams and Their Drainage Basins: Hydrophysical Approach to Quantitative Morphology. Bull. Geol. Soc. Am. 1945, 56, 275–370. [Google Scholar] [CrossRef]
  16. Nearing, M.A.; Kimoto, A.; Nichols, M.H.; Ritchie, J.C. Spatial Patterns of Soil Erosion and Deposition in Two Small, Semiarid Watersheds. J. Geophys. Res. Earth Surf. 2005, 110, 1–11. [Google Scholar] [CrossRef]
  17. McCloskey, G.L.; Baheerathan, R.; Dougall, C.; Ellis, R.; Bennett, F.R.; Waters, D.; Darr, S.; Fentie, B.; Hateley, L.R.; Askildsen, M. Modelled Estimates of Fine Sediment and Particulate Nutrients Delivered from the Great Barrier Reef Catchments. Mar. Pollut. Bull. 2021, 165, 112163. [Google Scholar] [CrossRef] [PubMed]
  18. Wilkinson, S.N.; Olley, J.M.; Furuichi, T.; Burton, J.; Kinsey-Henderson, A.E. Sediment Source Tracing with Stratified Sampling and Weightings Based on Spatial Gradients in Soil Erosion. J. Soils Sediments 2015, 15, 2038–2051. [Google Scholar] [CrossRef]
  19. State of Queensland. Reef Water Quality Report Card 2020. Available online: https://reportcard.reefplan.qld.gov.au/ (accessed on 16 June 2025).
  20. Daley, J.S.; Stout, J.C.; Brooks, A.P. Prioritising Gully Remediation in a Great Barrier Reef Catchment: An Approach Using Two Independent Methods of Assessing Erosion Activity in 22,300 Gullies. J. Environ. Manage. 2024, 357, 120688. [Google Scholar] [CrossRef] [PubMed]
  21. Brooks, A.P.; Thwaites, R.; Spencer, J.; Pietsch, T.; Daley, J. A Gully Classification Scheme to Underpin Great Barrier Reef Water Quality Management: 1st Edition; Griffith Centre for Coastal Management, Griffith University: Brisbane, QLD, Australia, 2019. [Google Scholar]
  22. Jarihani, B.; Sidle, R.C.; Bartley, R.; Roth, C.H.; Wilkinson, S.N. Characterisation of Hydrological Response to Rainfall at Multi Spatio-Temporal Scales in Savannas of Semi-Arid Australia. Water 2017, 9, 540. [Google Scholar] [CrossRef]
  23. Post, D.A. Regionalizing Rainfall-Runoff Model Parameters to Predict the Daily Streamflow of Ungauged Catchments in the Dry Tropics. Hydrol. Res. 2009, 40, 433–444. [Google Scholar] [CrossRef]
  24. Jarvis, D.; Stoeckl, N.; Chaiechi, T. Applying Econometric Techniques to Hydrological Problems in a Large Basin: Quantifying the Rainfall-Discharge Relationship in the Burdekin, Queensland, Australia. J. Hydrol. 2013, 496, 107–121. [Google Scholar] [CrossRef]
  25. Prosser, I.P. Improving How Gully Erosion and River Sediment Transport Processes Are Represented in Queensland Catchment Models A Report to the Queensland Water Modelling Network; Department of Environment and Science: Brisbane, QLD, Australia, 2018.
  26. Bartley, R.; Hawdon, A.; Post, D.A.; Roth, C.H. A Sediment Budget for a Grazed Semi-Arid Catchment in the Burdekin Basin, Australia. Geomorphology 2007, 87, 302–321. [Google Scholar] [CrossRef]
  27. Koci, J.; Sidle, R.C.; Kinsey-Henderson, A.E.; Bartley, R.; Wilkinson, S.N.; Hawdon, A.A.; Jarihani, B.; Roth, C.H.; Hogarth, L. Effect of Reduced Grazing Pressure on Sediment and Nutrient Yields in Savanna Rangeland Streams Draining to the Great Barrier Reef. J. Hydrol. 2020, 582, 124520. [Google Scholar] [CrossRef]
  28. Hawdon, A.; Henderson, A.; Bartley, R.; Abbott, B.; Mitchell, K.; Marano, J.; Ahwang, K.; Behzadnia, S.; Maskell, T. Quantifying the Effectiveness of Gully Remediation on Water Quality: Results from Landholders Driving Change Monitoring and Demonstration Sites; Milestone Report to LDC; CSIRO Publishing: Melbourne, VIC, Australia, 2023. [Google Scholar]
  29. Brooks, A.P.; Spencer, J.; Doriean, N.J.C.; Thwaites, R.; Daley, J.; Pietsch, T.; Hacker, J.; Stout, J. The Effectiveness of Alluvial Gully Remediation in Great Barrier Reef Catchments. Int. Soil Water Conserv. Res. 2025, 13, 102–121. [Google Scholar] [CrossRef]
  30. State of Queensland. Reef 2050 Water Quality Improvement Plan 2017–2022; Department of the Environment, Tourism, Science and Innovation: Brisbane, QLD, Australia, 2018. [Google Scholar]
  31. Tindall, D.; Marchand, B.; Gilad, U.; Goodwin, N.; Denham, R.; Byer, S. Gully Mapping and Drivers in the Grazing Lands of the Burdekin Catchment Remote Sensing Centre On Behalf of Reef Water Quality Environmental Policy and Planning Department of Environment and Heritage Protection; Department of Science, Information Technology, Innovation: Brisbane, QLD, Australia, 2014.
  32. Geoscience Australia. Detailed Surface Geology–Upper Burdekin Basalt Provinces; Geoscience Australia: Canberra, ACT, Australia, 2020.
  33. Rogers, L.G.; Cannon, M.G.; Barry, E. V Land Resources of the Dalrymple Shire; Department of Natural Resources, Queensland: Brisbane, QLD, Australia, 1999.
  34. Isbell, R.F. The Australian Soil Classification, 2nd ed.; CSIRO Publishing: Melbourne, VIC, Australia, 2016. [Google Scholar]
  35. Sidle, R.C.; Jarihani, B.; Kaka, S.L.I.; Koci, J.; Al-Shaibani, A. Hydrogeomorphic Processes Affecting Dryland Gully Erosion: Implications for Modelling. Prog. Phys. Geogr. 2019, 43, 46–64. [Google Scholar] [CrossRef]
  36. Brooks, A.; Shellberg, J.; Knight, J.; Spencer, J. Alluvial Gully Erosion: An Example from the Mitchell Fluvial Megafan, Queensland, Australia Alluvial Gully Erosion: An Example from the Mitchell Fl Uvial Megafan, Queensland, Australia. Earth Surf. Process. Landf. 2009, 34, 613–628. [Google Scholar] [CrossRef]
  37. Nicholls, N. The El Niño/Southern Oscillation and Australian Vegetation. Vegetatio 1991, 91, 23–36. [Google Scholar] [CrossRef]
  38. Meehl, G.A.; Arblaster, J.M. Decadal Variability of Asian-Australian Monsoon-ENSO-TBO Relationships. J. Clim. 2011, 24, 4925–4940. [Google Scholar] [CrossRef]
  39. Lewis, S.E.; Bartley, R.; Wilkinson, S.N.; Bainbridge, Z.T.; Henderson, A.E.; James, C.S.; Irvine, S.A.; Brodie, J.E. Land Use Change in the River Basins of the Great Barrier Reef, 1860 to 2019: A Foundation for Understanding Environmental History across the Catchment to Reef Continuum. Mar. Pollut. Bull. 2021, 166, 112193. [Google Scholar] [CrossRef] [PubMed]
  40. Dunkerley, D. How Is the Intensity of Rainfall Events Best Characterised? A Brief Critical Review and Proposed New Rainfall Intensity Index for Application in the Study of Landsurface Processes. Water 2020, 12, 929. [Google Scholar] [CrossRef]
  41. Dunkerley, D.L. Rainfall Intensity Bursts and the Erosion of Soils: An Analysis Highlighting the Need for High Temporal Resolution Rainfall Data for Research under Current and Future Climates. Earth Surf. Dyn. 2019, 7, 345–360. [Google Scholar] [CrossRef]
  42. Dunkerley, D. Identifying Individual Rain Events from Pluviograph Records: A Review with Analysis of Data from an Australian Dryland Site. Hydrol. Process. 2008, 22, 5024–5036. [Google Scholar] [CrossRef]
  43. Visser, J.B.; Wasko, C.; Sharma, A.; Nathan, R. Changing Storm Temporal Patterns with Increasing Temperatures across Australia. J. Clim. 2023, 36, 6247–6259. [Google Scholar] [CrossRef]
  44. Wasko, C.; Sharma, A.; Johnson, F. Does Storm Duration Modulate the Extreme Precipitation-Temperature Scaling Relationship? Geophys. Res. Lett. 2015, 42, 8783–8790. [Google Scholar] [CrossRef]
  45. US Army Corps of Engineers. HEC-RAS River Analysis System, Version 6.0: User’s Manual; CPD-68; Hydrologic Engineering Center: Davis, CA, USA, 2021. [Google Scholar]
  46. Kinsey-henderson, A.; Hawdon, A.; Bartley, R.; Mitchell, K.; Marano, J.; Gibbs, M.; Morris, J.; Maskell, T. Estimating Velocity and Discharge in Gullies; CSIRO Publishing: Melbourne, VIC, Australia, 2024. [Google Scholar]
  47. Fujita, I.; Watanabe, H.; Tsubaki, R. Development of a Non-Intrusive and Efficient Flow Monitoring Technique: The Space-Time Image Velocimetry (STIV). Int. J. River Basin Manag. 2007, 5, 105–114. [Google Scholar] [CrossRef]
  48. Hou, X.; Cao, J.; Yang, H. Characteristics of Spatial and Temporal Distribution of Heavy Rainfall and Surface Runoff Generating Processes in the Mountainous Areas of Northern China. Water 2025, 17, 970. [Google Scholar] [CrossRef]
  49. Cook, F.J. The Twin-Ring Method for Measuring Saturated Hydraulic Conductivity and Sorptivity in the Field; CSIRO Publishing: Melboourne, VIC, Australia, 2002. [Google Scholar]
  50. Zhang, S.; Li, Z.; Lin, X.; Zhang, C. Assessment of Climate Change and Associated Vegetation Cover Change on Watershed-Scale Runoff and Sediment Yield. Water 2019, 11, 1373. [Google Scholar] [CrossRef]
  51. Mor-Mussery, A.; Laronne, J.B. The Effects of Gully Erosion on the Ecology of Arid Loessial Agro-Ecosystems, the Northern Negev, Israel. Catena 2020, 194, 104712. [Google Scholar] [CrossRef]
  52. Vandekerckhove, L.; Poesen, J.; Wijdenes, D.O.; Nachtergaele, J.; Kosmas, C.; Roxo, M.J.; De Figueiredo, T. Thresholds for Gully Initiation and Sedimentation in Mediterranean Europe. Earth Surf. Process. Landf. 2000, 25, 1201–1220. [Google Scholar] [CrossRef]
  53. Turner, R.D.R.; Vardy, S.; Warne, M. Sediment, Nutrient and Pesticide Loads: Great Barrier Reef Great Barrier Reef Catchment Loads Monitoring Program View Project Water Quality Guidelines View Project; Department of Science, Information Technology, Innovation and the Arts: Brisbane, QLD, Australia, 2014.
  54. Bartley, R.; Roth, C.H.; Ludwig, J.; McJannet, D.; Liedloff, A.; Corfield, J.; Hawdon, A.; Abbott, B.; Thurow, T.L.; Wilcox, B.P. Runoff and Erosion from Australia’s Tropical Semi-Arid Rangelands: Influence of Ground Cover for Differing Space and Time Scales. Hydrol. Process. 2006, 20, 3317–3333. [Google Scholar] [CrossRef]
  55. Douglas-Mankin, K.R.; Roy, S.K.; Sheshukov, A.Y.; Biswas, A.; Gharabaghi, B.; Binns, A.; Rudra, R.; Shrestha, N.K.; Daggupati, P. A Comprehensive Review of Ephemeral Gully Erosion Models. Catena 2020, 195, 104901. [Google Scholar] [CrossRef]
  56. Vanmaercke, M.; Poesen, J.; Van Mele, B.; Demuzere, M.; Bruynseels, A.; Golosov, V.; Bezerra, J.F.R.; Bolysov, S.; Dvinskih, A.; Frankl, A.; et al. How Fast Do Gully Headcuts Retreat? Earth-Science Rev. 2016, 154, 336–355. [Google Scholar] [CrossRef]
  57. Reef and Rainforest Research Centre (Ed.) Lessons for Gully Management: A Synthesis of Key Findings from the NESP Tropical Water Quality Hub Research; Report to the National Environmental Science Program; Reef and Rainforest Research Centre Limited: Cairns City, QLD, Australia, 2021. [Google Scholar]
  58. Koci, J.; Wilkinson, S.N.; Hawdon, A.A.; Kinsey-Henderson, A.E.; Bartley, R.; Goodwin, N.R. Rehabilitation Effects on Gully Sediment Yields and Vegetation in a Savanna Rangeland. Earth Surf. Process. Landf. 2021, 46, 1007–1025. [Google Scholar] [CrossRef]
Figure 1. Study area within the Upper Burdekin catchment. The Upper Burdekin catchment boundary is delineated by a red polygon on the gully-density map (modified from Tindall et al., 2014 [31]). The red triangle shows the study location shown at a higher resolution in the right panel. Polygons delineate gully boundaries; red squares mark monitoring sites. Blue arrows indicate flow direction in Continong Creek and the Burdekin River.
Water 17 03071 g001
Figure 2. Annual rainfall derived from the Scientific Information for Land Owners (SILO) 5 km gridded dataset, using the single grid cell that covers the study area (i.e., a gridded estimate at 5 km areal support, not a point gauge). Grey bars: annual totals (mm) since 1889. Blue bars: annual totals during the study period. Grey dashed line: long-term yearly mean rainfall (mm). Orange line: 5-year moving average of the daily rainfall intensity (mm day−1) computed from the same grid cell to illustrate multi-decadal variability.
Water 17 03071 g002
Figure 3. Schematic showing the monitoring configuration at five gullies, accompanied by photographs below (not to scale).
Water 17 03071 g003
Figure 4. Example of land conditions above gully headcut (left) and within the gully (right) where infiltration tests were carried out.
Water 17 03071 g004
Figure 5. (a) Monthly rainfall totals during the study period. Light grey = SILO data, grey = CY gauge and dark grey = study site gauge. The corresponding lines show the cumulative rainfall for each data source during the study period. (b) Monthly distribution of frequency of different rainfall intensities (10 min window) across the three-year period. (c) Duration of each rainfall category taken as the longest run of 10 min windows.
Water 17 03071 g005aWater 17 03071 g005b
Figure 6. Monthly distribution of (a) Runoff Depth and (b) Runoff Ratio. Data represents a three-year record aggregated from five intensively monitored alluvial gullies. The boxplots illustrate the median, interquartile range, and outliers for each monthly dataset.
Water 17 03071 g006
Figure 7. (a) Distribution of initial (I0) and steady-state (fs) infiltration rates for Gully (blue: n = 8) and Catchment (tan: n = 12). Boxes show the interquartile range (IQR) with the median as a horizontal line; whiskers extend to 1.5 × IQR; circles denote outliers. (b) Median infiltration by zone. Solid lines show the median infiltration rate (primary y-axis) and dashed lines show the median cumulative infiltration (secondary y-axis). Colors indicate zone: blue = gully, tan = catchment.
Water 17 03071 g007
Figure 8. Combined rainfall-runoff plot of (a) gullies with high Aca (JJ2 and JJ5) and (b) gullies with low Aca (Gil1, Gil2 and Lei1).
Water 17 03071 g008
Figure 9. Flow hydrographs of a major event recorded on 31 January 2024 are shown with rainfall (top) and cumulative flow (below). Note the increased discharge for high Aca gullies after midnight of 31st January.
Water 17 03071 g009
Figure 10. Cumulative frequency of event intensity (Left) and rainfall depth (Right). Dashed vertical lines mark catchment infiltration rate (Left) and modelled rainfall threshold for upslope runoff activation (Right). The proportion of events to the right of each line represents exceedance.
Water 17 03071 g010
Figure 11. Conceptual diagram showing seasonal variation in the rainfall-runoff processes in alluvial gullies in the Upper Burdekin. The light pink area shows the gully footprint bounded by the catchment envelope in a dashed polygon. The blue color fill shows the area of catchment contribution to the gully runoff. Note the differences in runoff responses (hydrograph) with increasing Aca as catchment wetness or cumulative rainfall increases.
Water 17 03071 g011
Table 1. Morphometric parameters of alluvial gullies under intensive monitoring. Aca is calculated as total catchment area to gully area and DtD refers to the distance to the drainage divide measured from the farthest retreating headcut to the farthest point on the bounding catchment boundary. Note the substantial difference in the catchment to gully area ratio.
GullyCatchment Area (m2)Gullied Area (m2)AcaDtD (m)Average Depth (m)
JJ276,14012,9325.94977.7
JJ594,190680013.97487.0
Gil118,00016,0121.1354.1
Gil210,21474671.474.6
Lei111,20698491.1636.8
Table 2. Descriptive statistics of event rainfalls recorded during the study period.
GullyDescriptive StatisticsPPeak I10Mean IntensityRRR
(mm)(mm h−1)(mm h−1)(mm)
JJ2Max9911345960.96
Min25<1<10.02
Mean1529660.45
Standard Deviation 19258150.21
Coefficient of variation (%)1218412726484
JJ5Max19598321120.69
Min24<1<10.01
Mean2230780.34
Standard Deviation 32228200.19
Coefficient of variation (%)14273117259110
Gil1Max9910163980.99
Min22<1<10.03
Mean153112100.61
Standard Deviation 192315180.30
Coefficient of variation (%)1257612618065
Gil2Max8810672800.91
Min38<110.05
Mean203915130.52
Standard Deviation 202617180.28
Coefficient of variation (%)1026612014161
Lei1Max9010938860.95
Min5121<10.03
Mean314110130.68
Standard Deviation 412410190.26
Coefficient of variation (%)1345810714565
Table 3. Multilinear regression results of runoff and different parameters during wet and dry seasons. P is event rainfall (mm), I10 is peak intensity (mm h−1) 1dA and 2dA stand for one-day and two-day antecedent rainfalls, respectively.
Wet Season (Nov–March) n = 204
ParameterCoefficient (ß)Multiple RAdjusted R2Standard ErrorInterceptp-Values
P0.660.900.818.17−3.840.00
Duration0.040.510.2616.013.630.00
I100.340.450.2016.60−2.440.00
Mean Intensity0.120.080.0018.558.530.23
P & 1dAP: 0.66; 1dA: 0.000.900.818.19−3.83P: 0.00; 1dA: 0.96
P & 2dAP: 0.66; 2dA: 0.010.900.818.18−3.91P: 0.00; 2dA: 0.71
Table 4. Summary of near-surface infiltration characteristics for the gully and upslope catchment zones. Values are presented as median (interquartile range). I0: initial infiltration rate; fs: steady-state infiltration rate; Ts: time to reach steady state; F60: cumulative infiltration after 60 min.
MetricGully Zone (n = 8)Upslope Catchment Zone
(n = 12)
Initial Infiltration Rate (mm h−1)165 (105–202)225 (172–450)
Steady-State Infiltration Rate, fs (mm h−1)21 (16–30)36 (22–51)
Time to Steady State, Ts (min)20 (18–26)25 (20–42)
Cumulative Infiltration at Ts (mm)14 (3–37)32 (10–157)
Cumulative Infiltration at 120 min (mm)53 (29–64)75 (45–126)
Disclaimer/Publisher’s Note: The statements, opinions and data contained in all publications are solely those of the individual author(s) and contributor(s) and not of MDPI and/or the editor(s). MDPI and/or the editor(s) disclaim responsibility for any injury to people or property resulting from any ideas, methods, instructions or products referred to in the content.