Article

The Shrinkage of Lakes on the Semi-Arid Inner Mongolian Plateau Is Still Serious

1
China Aero Geophysical Survey and Remote Sensing Center for Natural Resources, China Geological Survey, Beijing 100083, China
2
Key Laboratory of Aerial Geophysics and Remote Sensing Geology, Ministry of Natural Resources, Beijing 100083, China
3
State Key Laboratory of Remote Sensing Science, School of Geography, Beijing Normal University, Beijing 100875, China
*
Author to whom correspondence should be addressed.
Water 2025, 17(21), 3056; https://doi.org/10.3390/w17213056 (registering DOI)
Submission received: 27 September 2025 / Revised: 21 October 2025 / Accepted: 22 October 2025 / Published: 24 October 2025
(This article belongs to the Special Issue Remote Sensing of Spatial-Temporal Variation in Surface Water)

Abstract

In the Inner Mongolia Plateau Lake Zone (IMP), situated in China’s semi-arid region, its lake water storage change plays a critical role in wetland ecosystem conservation and regional water security through its lake water storage dynamics. To investigate long-term lake water storage (LWS) changes, this study proposes a novel lake monitoring framework that reconstructs historical lake level time series and estimates water level variations in lakes without altimetry data. Using multi-source satellite data, we quantified LWS variations (2000–2021) across 109 lakes (≥5 km2) on the IMP and examined their spatiotemporal patterns. Our results reveal a net decline of 1.21 Gt in total LWS over the past two decades, averaging 0.06 Gt/yr. A distinct shift occurred around 2012: LWS decreased by 10.82 Gt from 2000 to 2012 but increased by 9.61 Gt from 2013 to 2021. Spatially, significant LWS reductions were concentrated in the central and eastern IMP, resulting from intensive water diversion and groundwater exploitation. In contrast, increases were observed mainly in the western and southern regions, driven by enhanced precipitation and reduced aridity. The findings improve understanding of lake dynamics in semi-arid China over the last two decades and offer technical guidance for sustainable water resource management.

1. Introduction

Water resources are a critical constraint on regional development in arid and semi-arid regions. Lakes, as key repositories of surface water resources, directly reflect the hydrological status of regional water resources through changes in their area, water level, and storage volume [1,2,3,4]. In recent years, however, intensified anthropogenic pressures (e.g., mining and agriculture) and climate change have triggered unprecedented hydrological imbalances [5]. Lakes, being highly sensitive to such influences, are undergoing significant transformations worldwide—especially in arid and semi-arid zones, where their storage is inherently vulnerable due to low precipitation and high evaporation [2,6,7,8,9]. Characterized by low precipitation yet high potential evaporation, these lakes exhibit storage vulnerability to subtle flux perturbations. Consequently, a number of them (e.g., Aral Sea, Chahannur Lake, Anguli-Nuur Lake, and Daihai Lake) have shrunk remarkably in recent decades, changes that carry potentially profound ecological and socioeconomic consequences [6,10,11,12]. Consequently, continuous spatiotemporal monitoring of lake characteristics is essential for regional water-resource management and ecological protection.
Conventionally, lake dynamics are monitored through in situ gauging stations, with water storage changes typically being calculated by lake water balance methods (difference between inflow and outflow) or derived from variations in water level and surface area [5,13]. Although these approaches offer high accuracy and temporal resolution, they demand significant time, economic investment, and manpower. Operational challenges in remote areas further exacerbate data scarcity and discontinuity, impeding accurate large-scale evaluations of lake storage changes [5,14]. Fortunately, recent advances in remote sensing provide an effective alternative: optical and altimetry satellites now enable large-scale monitoring of lake dynamics. These platforms support long-term and systematic observations, facilitating study of previously inaccessible lakes [3,7,15,16].
Radar altimeters (e.g., TOPEX/Poseidon, ENVISAT, Jason-1/2/3, and CryoSat-2) have enabled water level monitoring of inland lakes [17,18,19,20,21,22]. However, their large footprint limits applicability to small water bodies [8,16]. In contrast, laser altimeters feature smaller footprints and higher vertical accuracy, allowing precise water level retrieval across lakes of varying sizes. ICESat data specifically demonstrates reliable horizontal and altimetric precision [7,8,17,23,24,25]. However, discontinuous satellite operations and orbital constraints often prevent long-term, consistent monitoring consequently. The existing water storage change studies have been primarily focused on a small number of lakes/reservoirs and limited to a relatively short period [3,26,27].
A persistent bottleneck remains in the temporal monitoring of water level and storage variations in areas lacking altimetry coverage. In these regions, change rates are usually extrapolated based on drainage sub-regions and lake types, which precludes a comprehensive assessment of the investigated lakes [7,26]. In recent decades, related research on Tibetan Plateau lakes has expanded rapidly [23,26,28,29,30,31,32,33,34], yet comprehensive and long-term studies quantifying water levels and storage in arid and semi-arid regions remain relatively scarce [3]. The Inner Mongolia Plateau Lake Zone (IMP)—one of China’s most densely lake-concentrated areas—exemplifies this gap. Hosting nearly a thousand lakes of varying sizes across northern China’s semi-arid belt, the IMP serves a vital ecological functional zone and security barrier. Concurrently, despite marked lake-area reductions [10,35], systematic studies on the IMP have been sparse, with most studies focused on specific major lakes and the remainder only addressing changes in lake surface area [11,13,36,37,38,39,40], leaving the majority of lakes in this region effectively unmonitored to detection limitations.
Quantifying spatiotemporal variations in lake water storage (LWS) across the IMP is therefore essential for an assessment of regional water resources. This study (i) reconstructs lake water levels (2000–2021) and establishes a monitoring framework to estimate water level changes in lakes lacking altimetry data (Section 2.3); (ii) investigates all lakes with surface area greater than 5 km2 and analyzes long-term trends (Section 3.2); (iii) quantifies spatiotemporal LWS variations for 109 lakes (Section 4.1); and (iv) examines drivers of LWS changes (Section 4.2). This integrated approach enables a comprehensive reconstruction of both historical lake dynamics and real-time monitoring capacity. The framework thereby provides both methodological advances and theoretical foundations for lake water resource assessment in semi-arid regions.

2. Materials and Methods

2.1. Study Area

The Inner Mongolian Plateau Lake Zone (IMP, 31°42′–53°19′ N, 92°45′–126°04′ E), one of mainland China’s five major lake zones, forms part of the North and Northwest Lake Zone [4,14,35]. Covering 1.96 million km2 across five provinces—Inner Mongolia Autonomous Region, Ningxia Hui Autonomous Region, Gansu, Shaanxi, and Shanxi—IMP features a typical arid to semi-arid region with an average annual rainfall of 332 mm, lake evaporation of 946 mm, and a drought index of 2.85. Consequently, lake water storage dynamics critically impact wetland ecosystem conservation and regional water resource security [36]. Most lakes on the IMP are either water-filled depressions on the grasslands or relic lakes from ancient river channels. They are characterized by gentle basin topography and shallow water bodies, with average depths typically ranging between 1 and 10 m. In fact, the average depth of many lakes is even less than 5 m [13,37,41,42]. This study examines 109 lakes whose historical maximum area reached or exceeded 5 km2. Representing more than 84.7% of the aggregate lake area on the IMP, these water bodies robustly capture the region’s overall limnological dynamics (Figure 1). These lakes were categorized into three hydrological subregions based on surface water resource zones: western and southern (including Yellow River Basin and Northwest Inland River Basin), central and eastern (including Liaohe River Basin, Haihe River Basin, and Inner Mongolia Inland River Basin), and northeastern (including Songhua River Basin).

2.2. Materials

This study employed multi-source satellite data: Landsat-5/7/8 and Sentinel-2 optical imagery to extract lake surface areas and ICESat/GLAH14, ICESat-2/ATL13, and CryoSat-2 (SIN+LRM) altimetry data to monitor water level changes. Additional datasets were also incorporated for accuracy verification and attribution analysis were also incorporated. Specifications for all datasets are provided in Table 1.

2.3. Methods

The framework of this study entails four components: data acquisition and preparation, reconstruction of lake level time series, estimation of water level in unobserved lakes, and calculating lake water storage changes (Figure 2). Specific methods are discussed in the following sections.

2.3.1. Data Acquisition and Preparation

The specific lake area extraction process followed a published method [43], utilizing multi-source satellite imagery (Landsat 5/7/8 and Sentinel-2) with <20% cloud cover. For the unfrozen seasons (May–October) from 2000 to 2021, monthly lake surface areas across the IMP were derived by integrating the NDVI, MNDWI, and EVI indices. This included both natural lakes and artificial reservoirs while excluding ephemeral water features from rainfall or snowmelt. Water classification adhered to these criteria: (1) EVI < 0.1 and (2) MNDWI > NDVI or MNDWI > EVI. Persistent water pixels were identified using a >25% water occurrence frequency threshold, from which lake areas were derived. This process resulted in the identification of 109 lakes (containing 81 natural lakes and 28 reservoirs) that had a surface area of at least 5 km2.
By intersecting ICESat/ICESat-2/CryoSat-2 retrievals with lake surface mask, the altimetry footprints outside the lake inundation extent were then removed. For measurements during the same observational cycle, outliers exceeding three standard deviations from the mean were removed [8]. The median elevation of the remaining over-lake footprints represents the water level on the observation date. Combined with the geoid-to-reference ellipsoid adjustment, multi-source altimetry water level data were unified to the WGS 84 ellipsoid and EGM 2008 vertical datum.

2.3.2. Reconstruction of Long-Term Lake Level Series

The transit schedules of the ICESat, CryoSat-2, and ICESat-2 altimetry satellites over the different lakes are illustrated in Figure A1, Figure A2 and Figure A3, respectively. The discontinuous nature of satellite altimetry records, resulting from limited operational periods and specific orbital configurations, necessitates the reconstruction of lake water level time series. An exponential function of water level and storage capacity implies a logarithmic water level–surface area correlation [3]. Leveraging this derived relationship, missing water levels were reconstructed by fitting level–area curves to time-series lake area data, generating continuous water level records.

2.3.3. Estimation of Water Level in Unobserved Lakes

Satellite altimetry data from ICESat, CryoSat-2, or ICESat-2 cover 57 lakes in the study area. However, only 8 lakes were observed by all three satellites. The remaining 52 lakes lack sufficient altimetry data, due to either absence of satellite overpasses or insufficient observational records (less than 3 years). Consequently, it is impossible to construct level–area curves for these lakes [3]. As shown in Figure 1, lakes with altimetry data are marked with blue points, while those without are denoted by grey points.
For lakes lacking altimetry data, similarity-based parameter regionalization was applied [45,46,47]. The procedure consisted of three steps. First, time series of lake area changes (ΔA) and water level changes (ΔH) were derived for the 57 lakes, with fitting functions established for each of them. We then assumed—based on Tobler’s First Law of Geography—that spatial adjacent lakes share similar geomorphic properties and would therefore have identical ΔA-ΔH fitting functions. Finally, water level changes (ΔH) for the unobserved lakes were derived by inputting their lake area changes (ΔA) into the corresponding ΔA-ΔH fitting functions.

2.3.4. Calculating Lake Water Storage Changes

Since LWS variations cannot be directly measured, they were generally estimated using lake area and water level data [3,7,16]. Seasonal means (May–October monthly data) were calculated to represent annual lake area and water level values. They were input into the trapezoidal cylinder volume Equation (1) to calculate annual LWS variation (ΔV):
Δ V i = 1 3 × ( A i + A i 1 + A i × A i 1 ) × ( H i H i 1 )
where ΔVi is LWS variation at time i, Ai and Ai−1 are the lake area at time i and i − 1, respectively, and Hi and Hi−1 are the water level at time i and i − 1, respectively.
Equation (1) was applied to quantify LWS variations for lakes with altimetry data. For lakes lacking altimetry, LWS changes were calculated using Equation (2), substituting water level changes (ΔH) regionally estimated from lake area changes (ΔA).
Δ V i = 1 3 × ( A i + A i 1 + A i × A i 1 ) × Δ H

3. Results

3.1. Accuracy Validation of Lake Level and LWS Estimation on the IMP

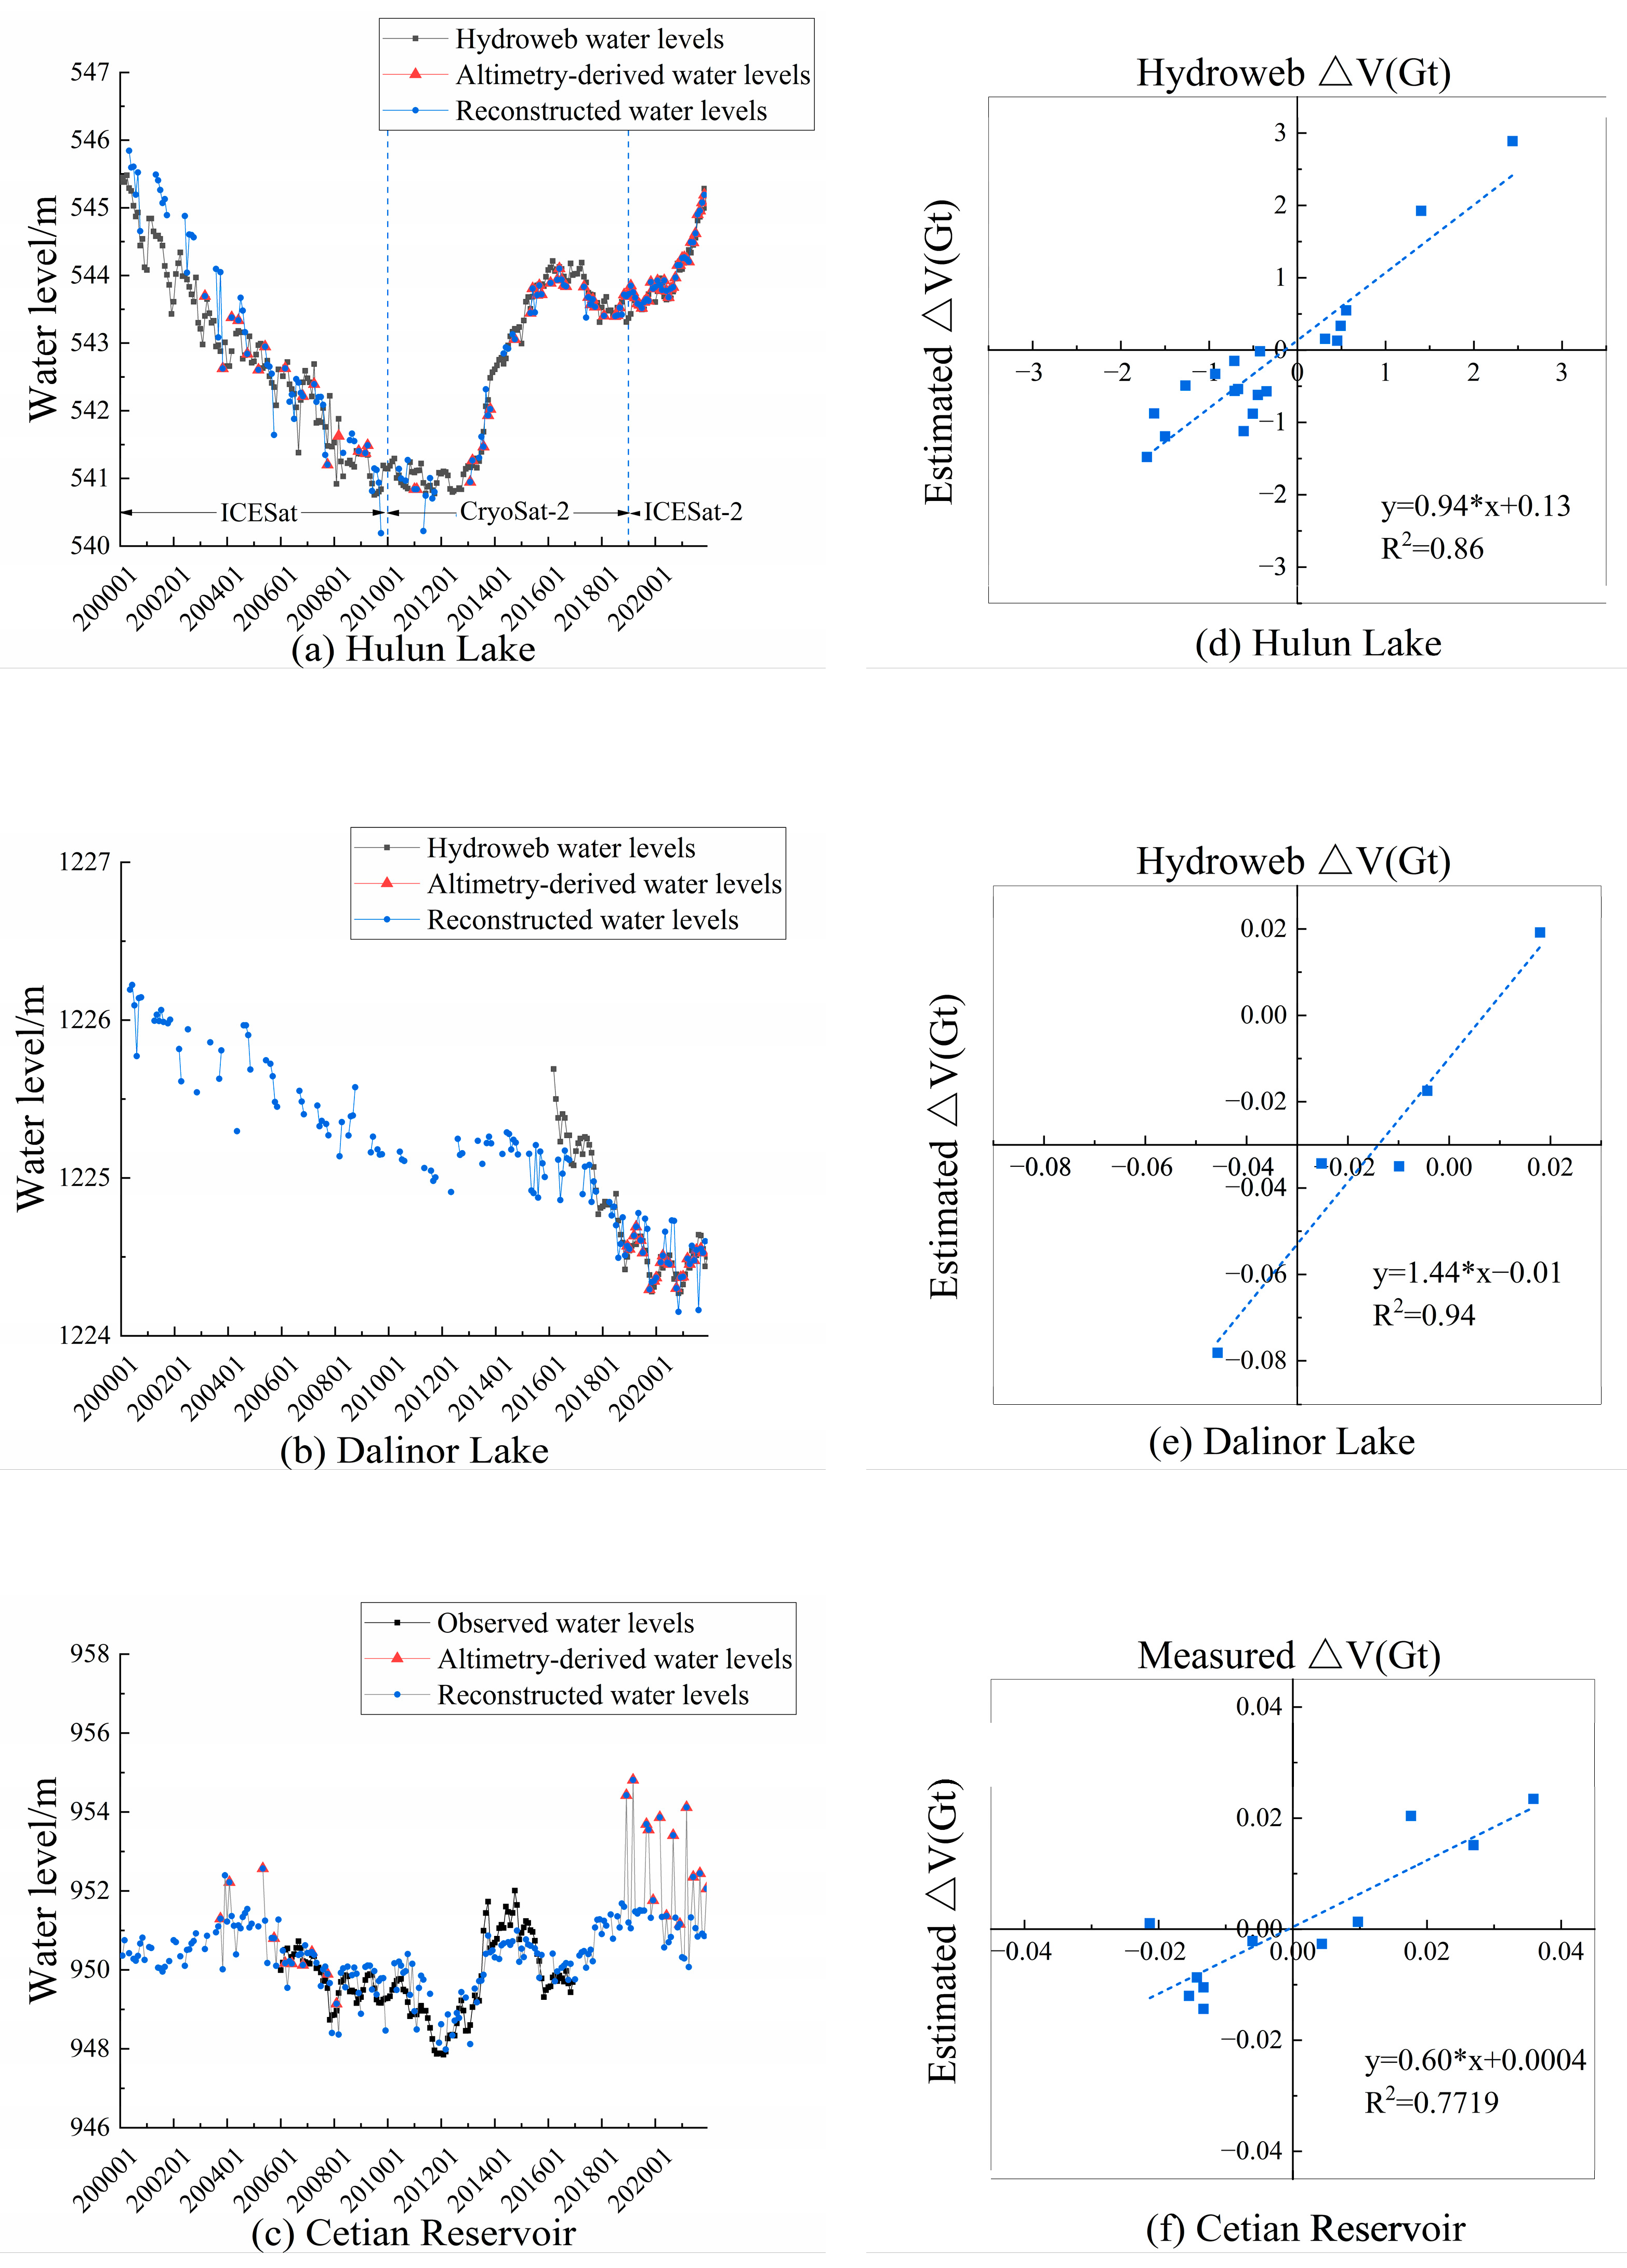
The monthly water levels of lakes (greater than 5 km2) on the IMP were derived from ICESat, ICESat-2, and Cryosat-2 satellites. The accuracy of altimetry-derived water levels was validated using Hydroweb data from Hulun Lake and Dalinor Lake or observed data from Cetian Reservoir (Figure 3); accuracy was assessed using Root Mean Square Error (RMSE) and the correlation coefficient.
Although Hydroweb provided dynamic water level data for approximately 54 lakes in China, only Hulun Lake and Dalinor Lake on the IMP was covered. Figure 3a illustrates that ICESat-2 data achieved the highest accuracy at Hulun Lake (RMSE: 0.10 m; correlation coefficient: 0.96), followed by Cryosat-2 data (RMSE: 0.17 m; correlation coefficient: 0.99) and ICESat data (RMSE: 0.25 m; correlation coefficient: 0.95). The reconstructed water level shows an RMSE of 0.46 m and an R2 of 0.95 against Hydroweb data. Figure 3b demonstrates strong agreement between ICESat-2 data and Hydroweb measurements for Dalinor Lake (RMSE: 0.06 m; correlation coefficient: 0.84). Meanwhile, the reconstructed water levels yield an RMSE of 0.22 m and a correlation coefficient of 0.77 against Hydroweb data.
The validation at Cetian Reservoir further confirms the reliability of our data. As shown in Figure 3c, a comparison between in situ hydrological station measurements (2006–2017) and altimetry-derived water levels (ICESat only) shows strong agreement, with an RMSE of 0.23 m and a correlation coefficient of 0.93. Reconstructed water levels further also maintain strong consistency with observations (RMSE: 0.56 m; correlation coefficient: 0.83).
In summary, the water levels extracted from all three altimetry satellites exhibited high precision. It is noteworthy that, unlike natural lakes, reservoirs exhibit stronger water level fluctuations due to anthropogenic regulation [16], though monthly water level composites from satellite altimetry show marginally reduced accuracy.
Correspondingly, water storage variations of Hulun Lake, Dalinor Lake, and Cetian Reservoir were validated against independent datasets. As shown in Figure 3, the estimated water storage variations for both Hulun Lake and Dalinor Lake agree well with the Hydroweb data (Hulun: RMSE: 0.47 Gt; R2: 0.91; Dalinor: RMSE: 0.02 Gt; R2: 0.97). Similarly, estimates for Cetian Reservoir show strong consistency with gauge measurements (RMSE: 0.009 Gt; R2: 0.88).

3.2. Spatiotemporal Dynamics of Lake Level and Storage

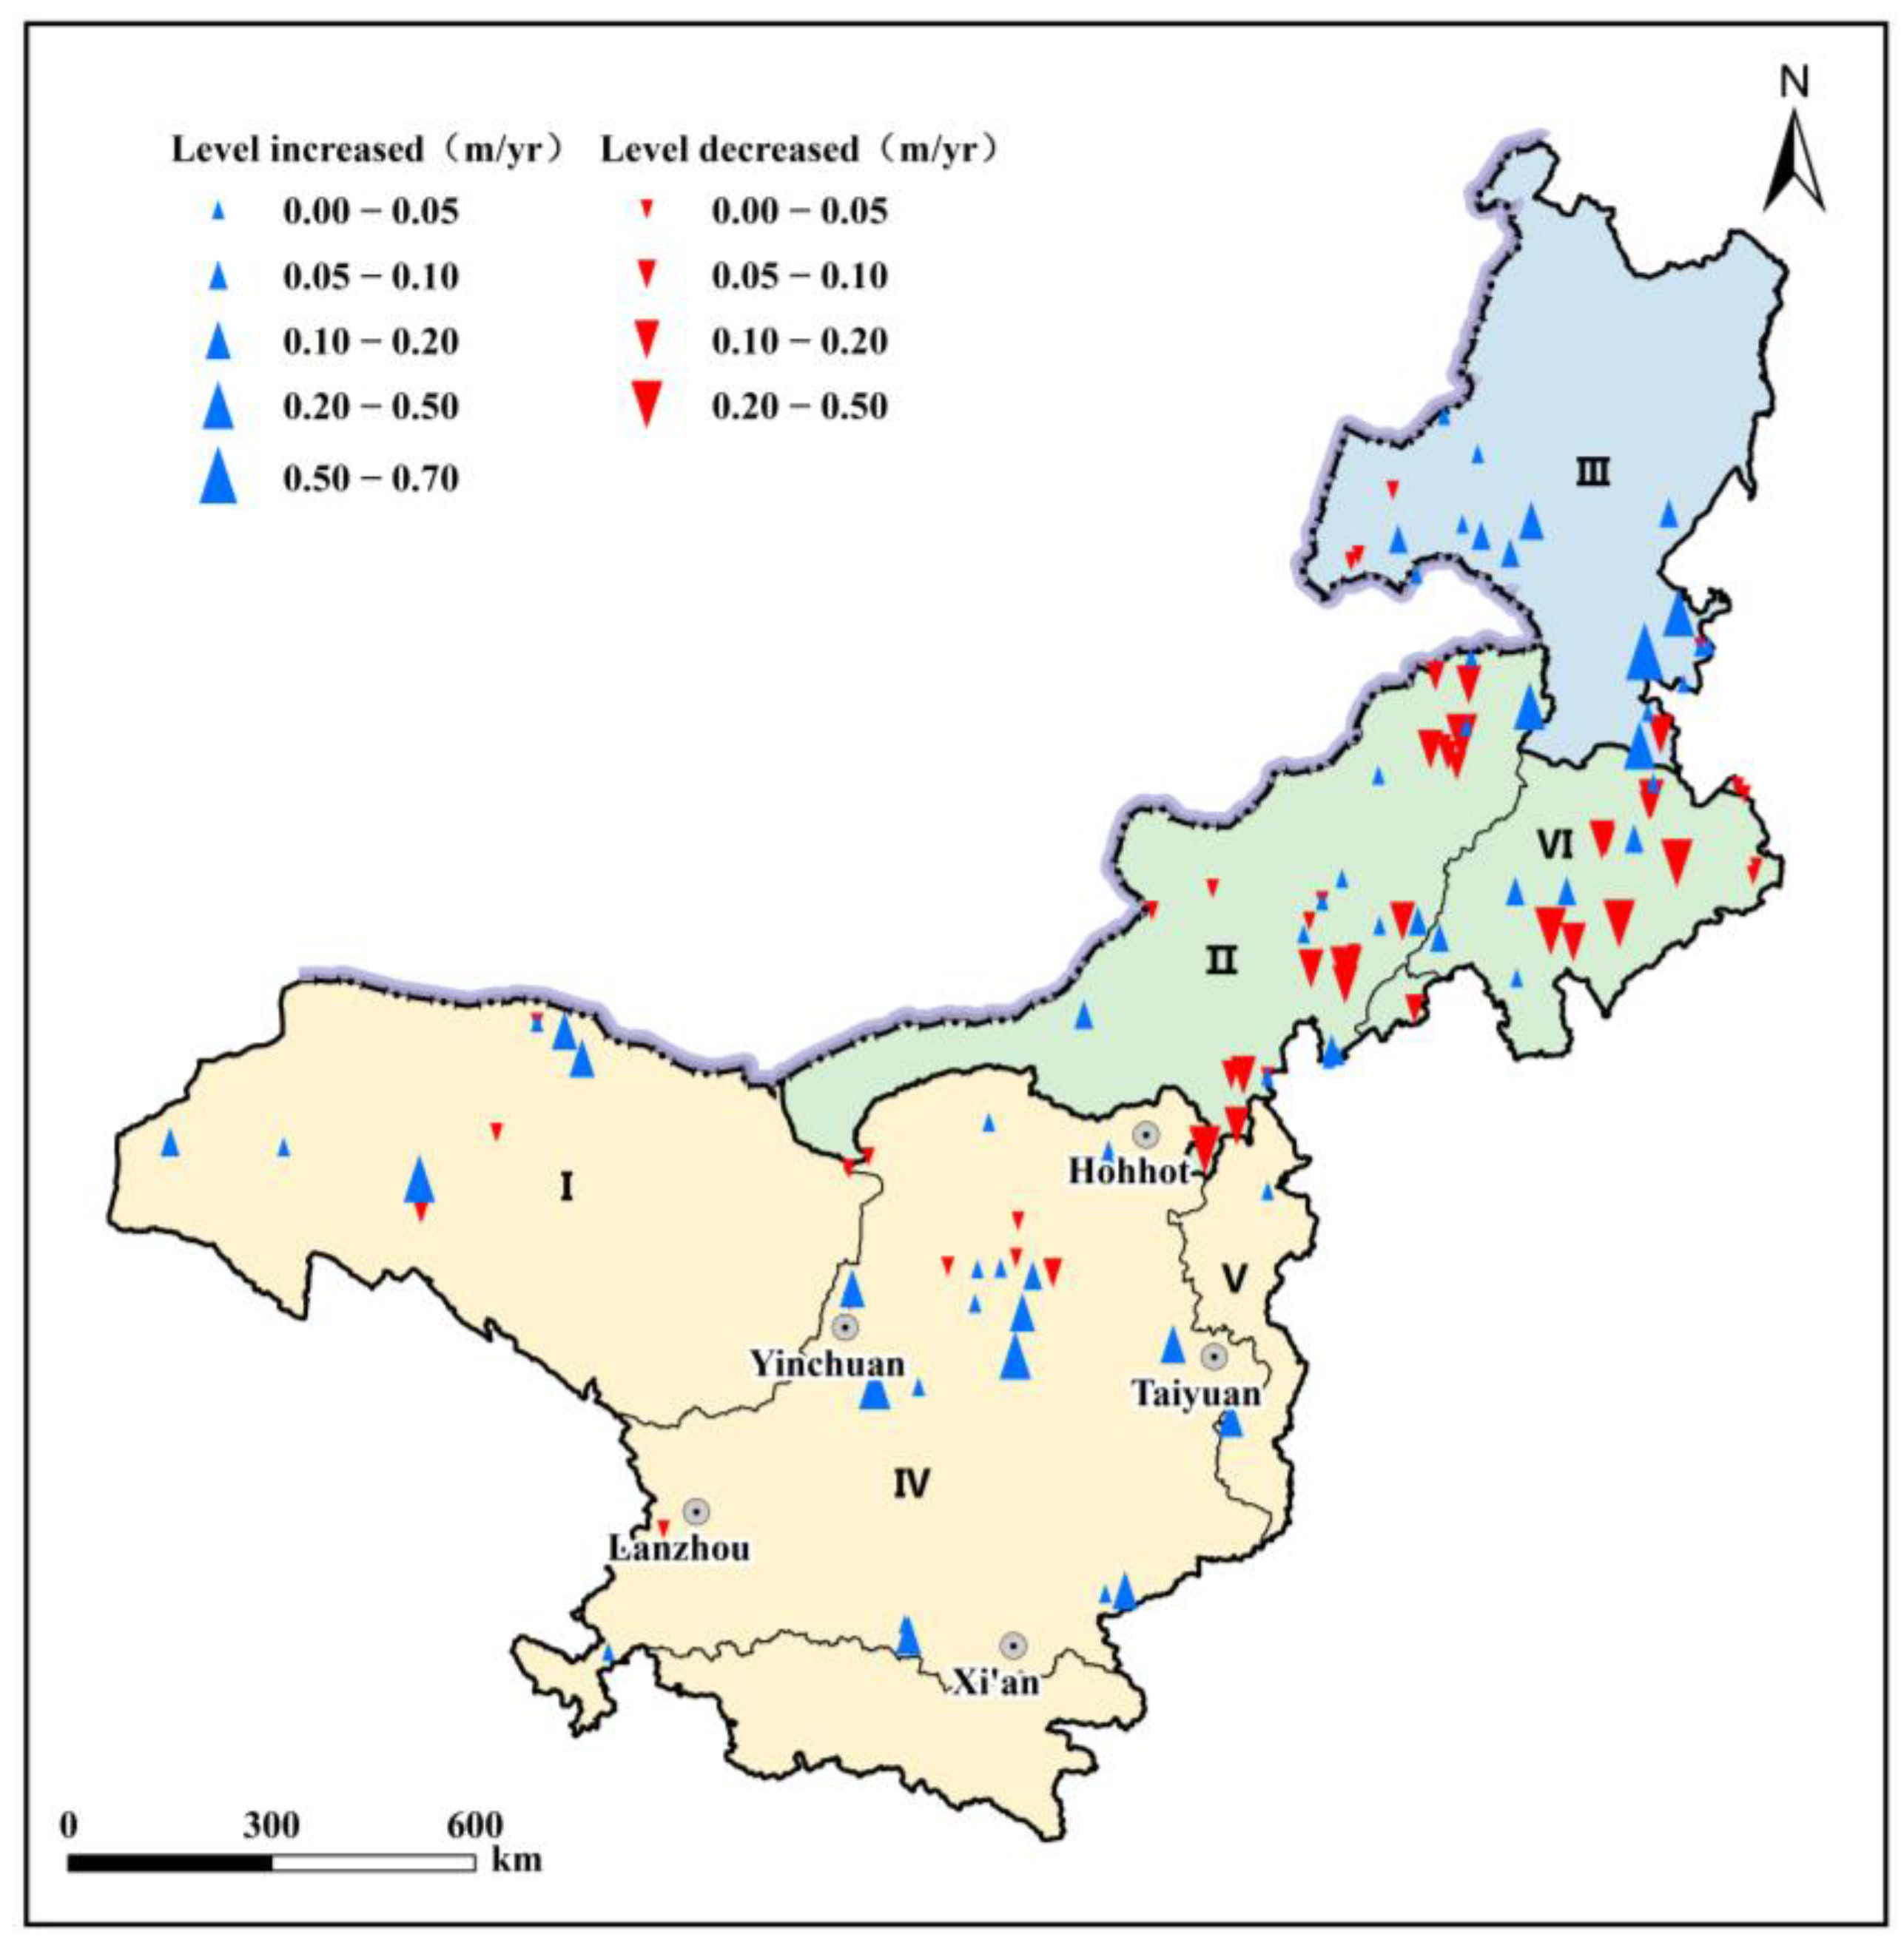
Analysis of lakes (and reservoirs) larger than 5 km2 since 2000 reveals distinct trends in water level and storage (Figure 4 and Figure 5). Among the 109 lakes studied, 49 exhibited rising water levels, 40 showed declining trends, and the remaining 20 experienced no substantial cumulative change (below ±0.20 m). The spatial variability of these trends across different surface water resource zones is summarized in Table 2. Overall, lakes with decreasing water level are concentrated on the central and eastern IMP, predominantly within the Inner Mongolia Inland River Basin (II) and Liaohe River Basin (VI), whereas lakes in other regions exhibited a general upward trend.
The total water storage of lakes (≥5 km2) on the IMP experienced a net decrease of approximately 1.21 Gt between 2000 and 2021, with an average decline rate of 0.06 Gt/yr. This overall trend, however, conceals a notable shift around 2012; a continuous loss occurred during 2000–2012, followed by a recovery with an increase of 9.61 Gt from 2013 to 2021. Spatially, LWS changes reveal significant regional variability (Figure 5). Lakes on the central and eastern IMP experienced substantial water storage losses, whereas those in the western and southern regions showed increases.
Table 3 quantifies the changes in water storage for both natural lakes (81) and reservoirs (28) across surface water resource zones from 2000 to 2021. With the exception of the Northwest Inland River Basin (I) and the Liao River Basin (VI), all other basins experienced an increase in reservoir water storage. The most significant increase occurred in the Songhua River Basin (III), with a rise of 0.77 Gt, followed by the Yellow River Basin (IV) with an increase of 0.13 Gt. Except for the Hai River Basin (V), where reservoirs constitute two of the three lakes, the limited number of reservoirs in other basins implies that the overall LWS change is primarily determined by the changes in natural lakes.
The most significant decrease occurred in the Inner Mongolia Inland River Basin (II), which loses 1.16 Gt (0.06 Gt/yr). This was followed by the Songhua River Basin (III) and the Liao River Basin (VI), with a loss of 0.55 Gt (0.03 Gt/yr) and 0.15 Gt (0.01 Gt/yr), respectively. In contrast, the Yellow River Basin (IV) showed the most substantial increase in lake water storage, rising by 0.54 Gt (0.03 Gt/yr) over the period. The Northwest Inland River Basin (I) and the Hai River Basin (V) also registered a total increase of 0.08 Gt and 0.02 Gt, although their average annual change rounded to 0.00 Gt/yr.
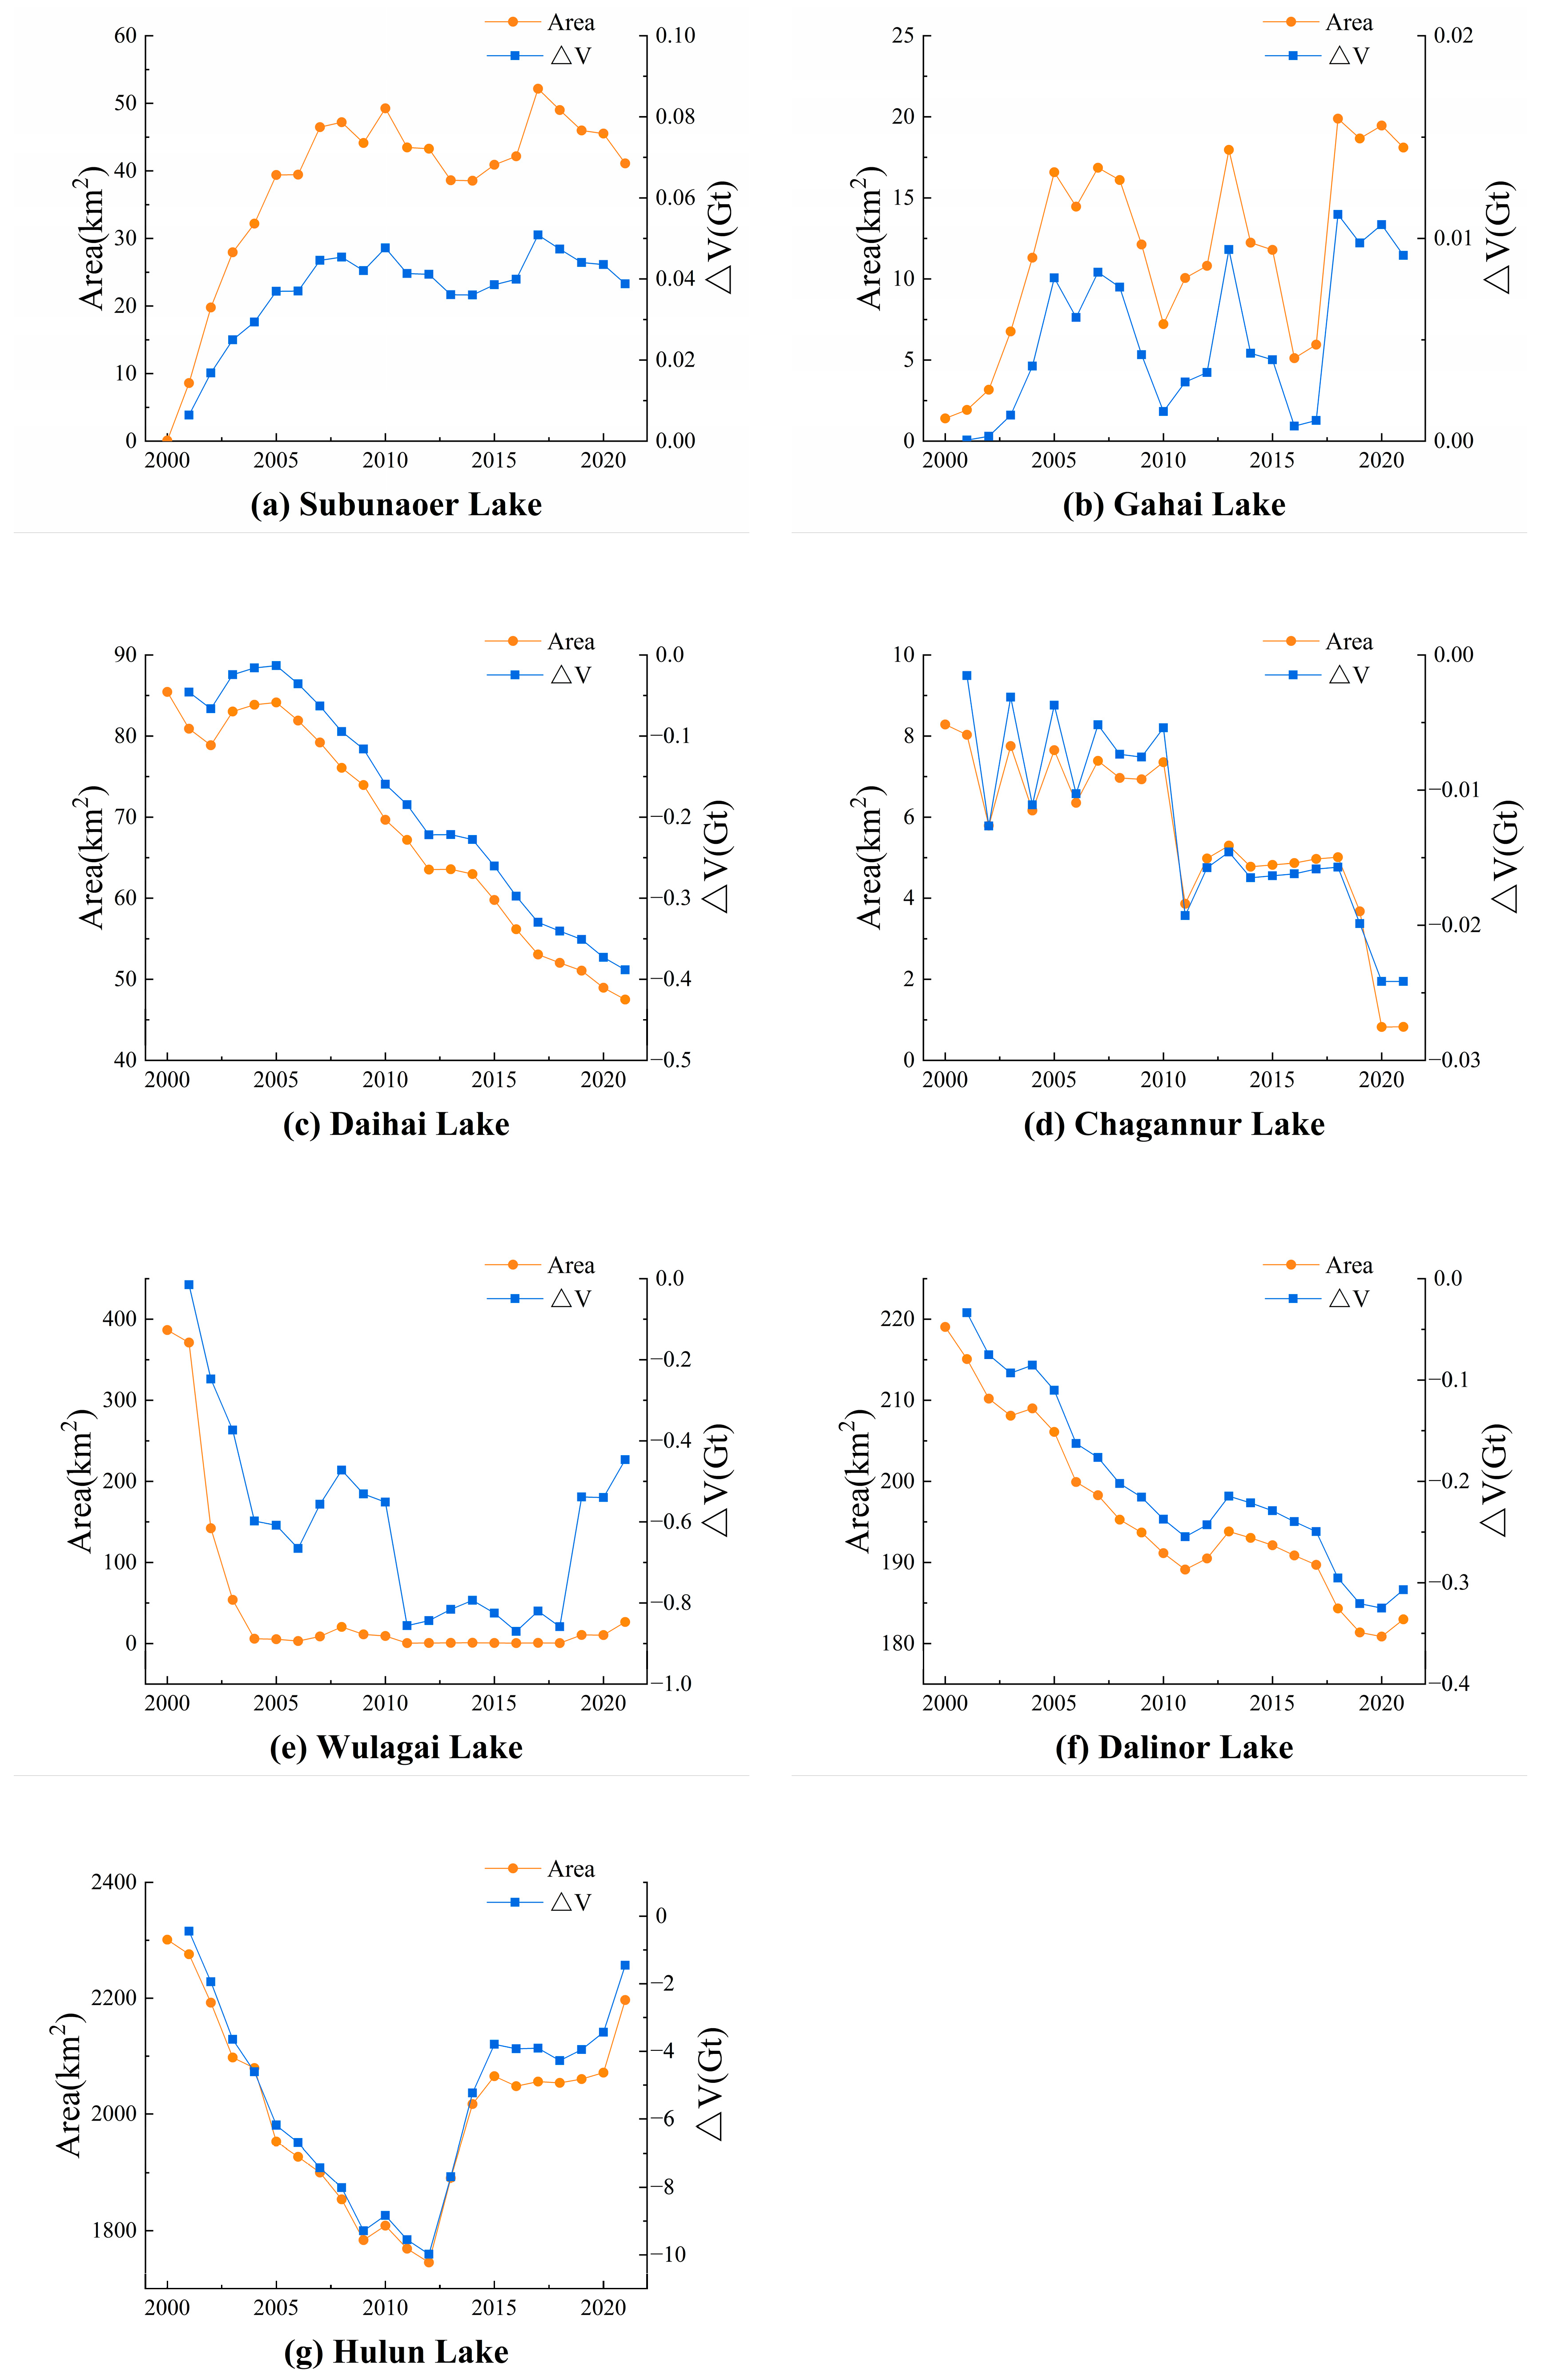
In addition to human-regulated reservoirs whose water level changes dramatically, Subunaoer Lake (also known as the East Juyan Sea) on the IMP has experienced a significant water level rise, averaging 0.13 m/yr, with a corresponding storage increase of 0.002 Gt/yr since 2000, attributable to the Heihe water diversion project [41,48,49] (Figure 6a). Similarly, Gahai Lake has benefited from ecological water replenishment measure, leading to a level increase by 0.05 m/yr and a storage gain of 0.0004 Gt/yr (Figure 6b). In contrast, lakes such as Daihai, Chagannur, Wulagai, Dalinor, and Hulun Lake have experienced notable declines, with average water level (and storage) decreases of 0.28 m/yr (0.02 Gt/yr), 0.26 m/yr (0.001 Gt/yr), 0.12 m/yr (0.02 Gt/yr), 0.07 m/yr (0.01 Gt/yr), and 0.03 m/yr (0.07 Gt/yr), respectively, from 2000 to 2021 (Figure 6c–g).

4. Discussion

4.1. Regional Variation in Lake Water Storage Changes on the IMP

Based on surface water resource zones, these lakes are divided into three hydrological subregions: western and southern IMP (Yellow River Basin and Northwest Inland River Basin), central and eastern IMP (Liaohe River Basin, Haihe River Basin, and Inner Mongolia Inland River Basin), and northeastern IMP (Songhua River Basin).
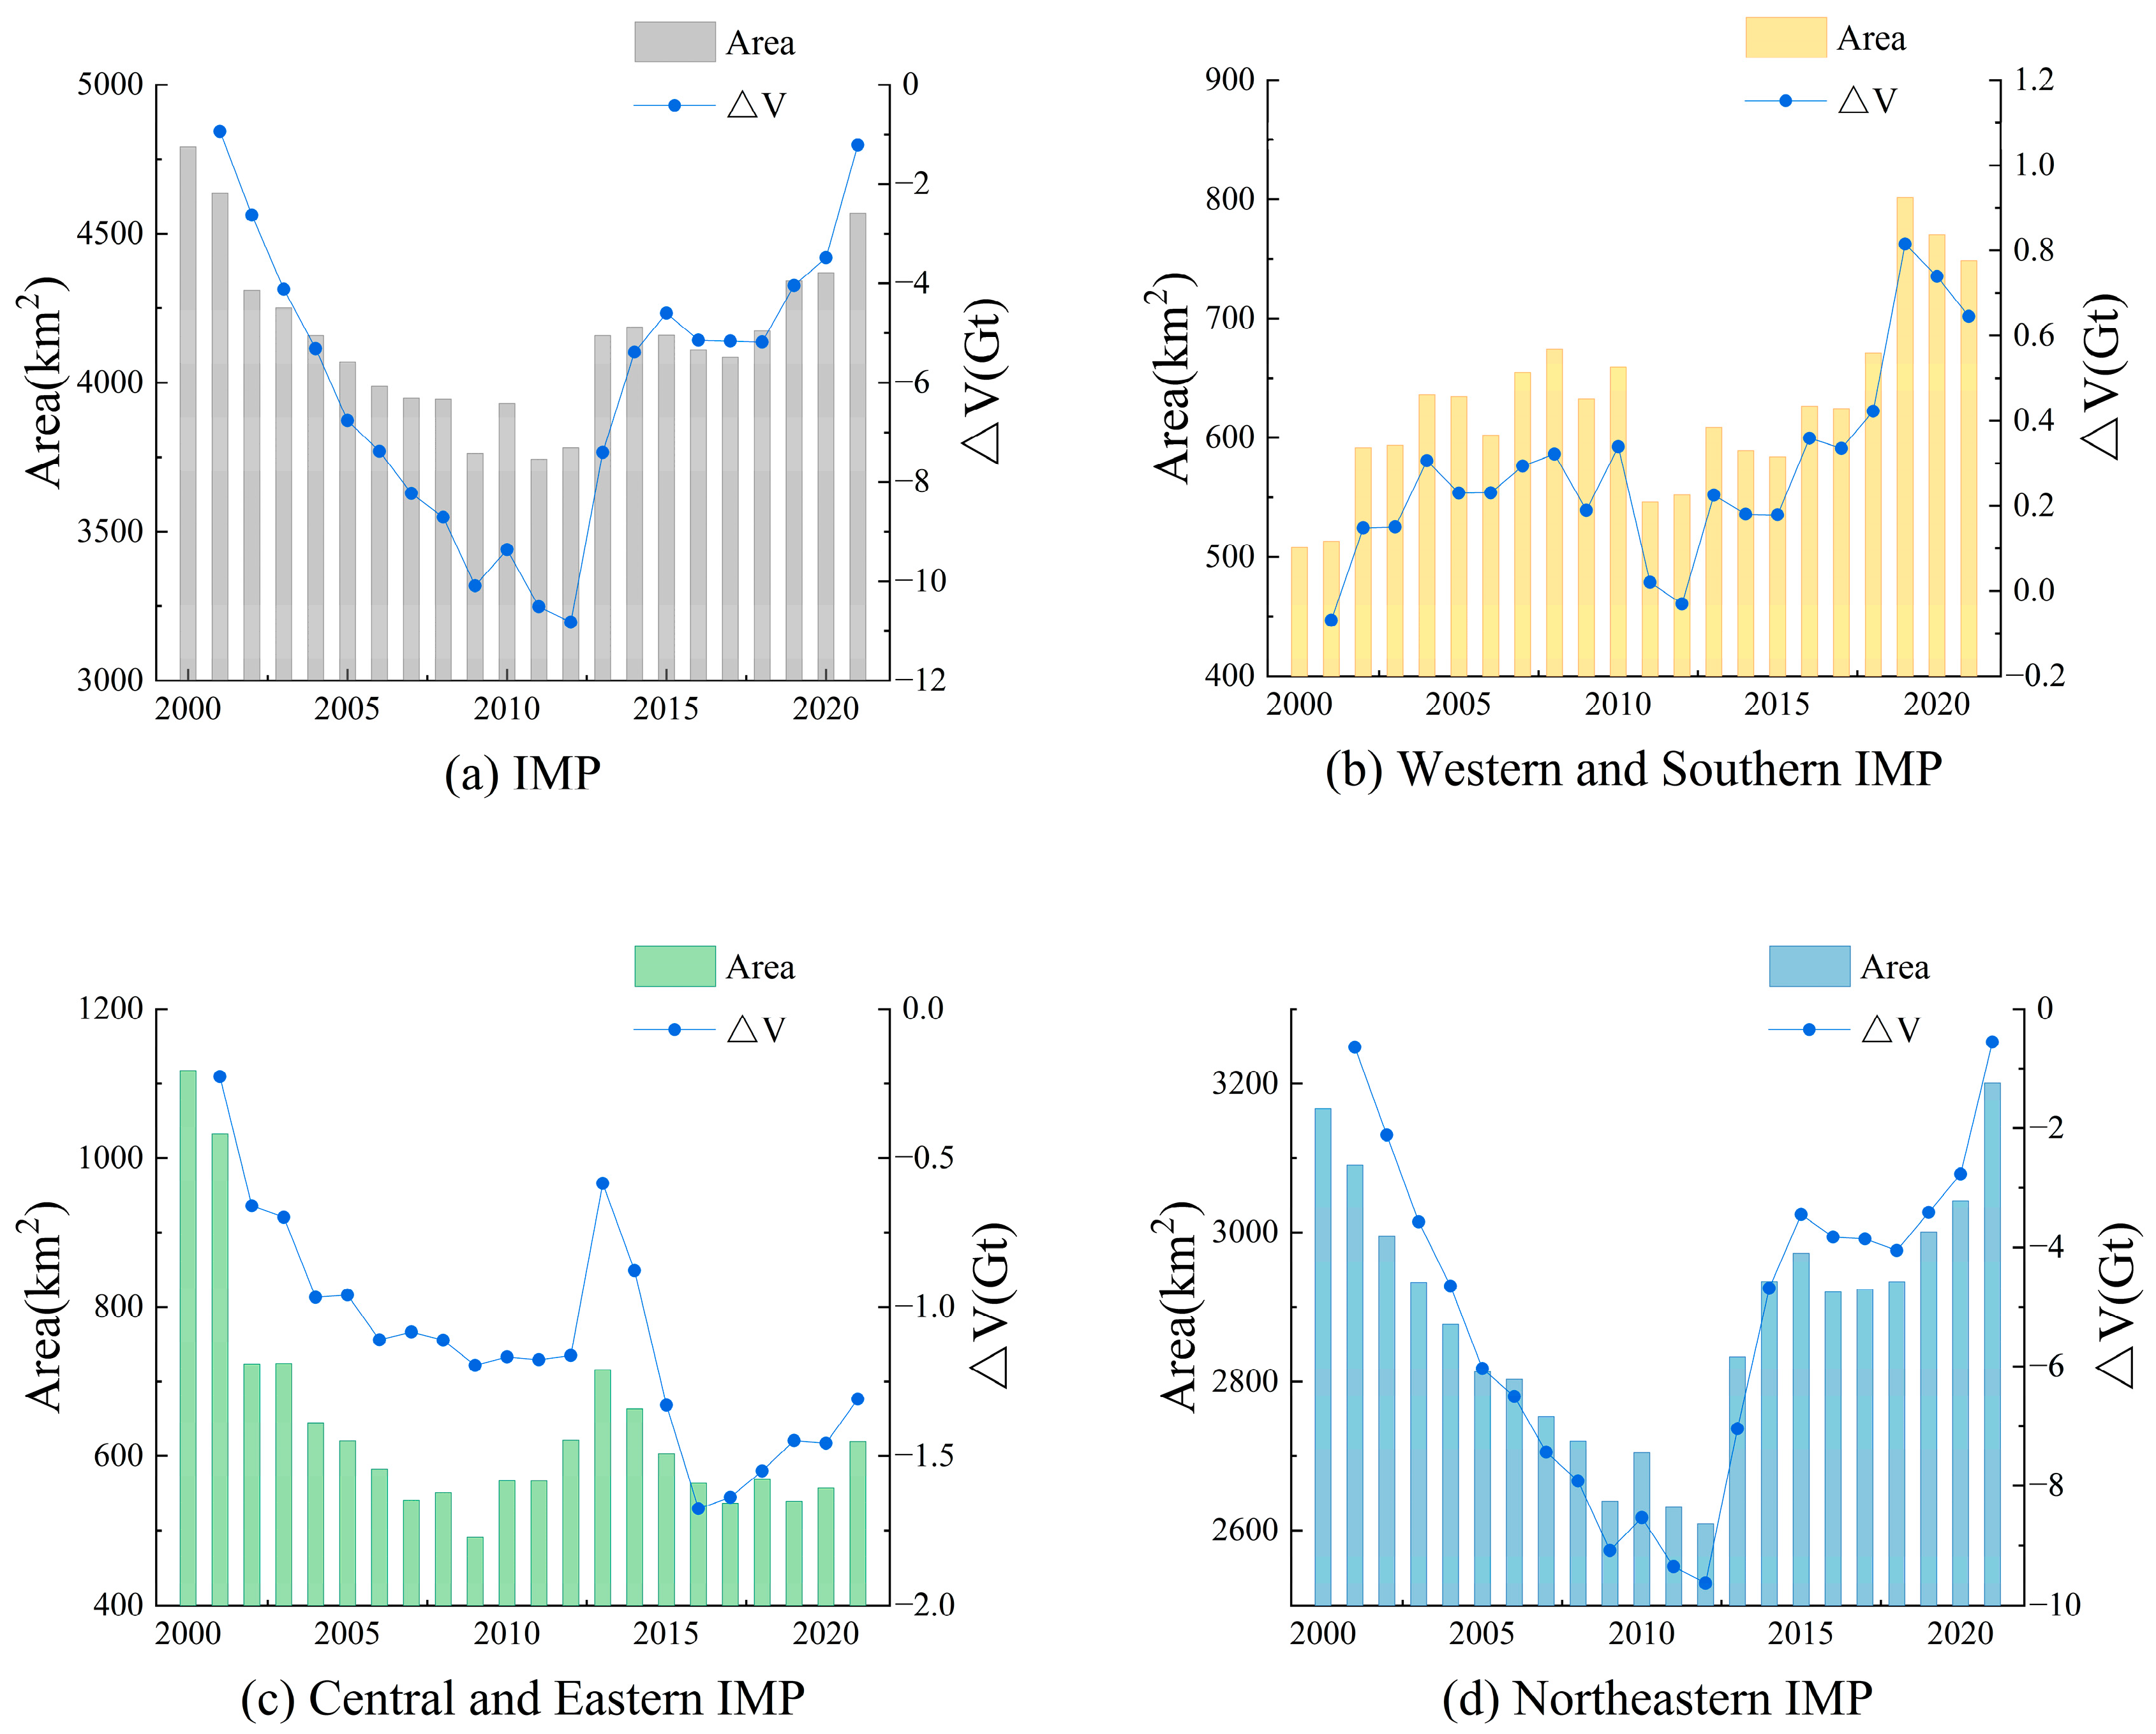
LWS volume on the western IMP increased by a total of 0.65 Gt from 2000 to 2021. Although storage levels decreased in several years, the region showed an overall sustained increase during 2000–2019. By 2019, storage volume peaked at 0.81 Gt above the baseline, after which it entered a period of decline (Figure 7b).
In contrast, LWS volume on the central–eastern IMP exhibited the most severe decrease, with a total reduction of 1.31 Gt from 2000 to 2021. Except for minor increases in 2012 and 2013, the region experienced an overall continuous decline in storage volume throughout 2000–2021. After reaching its lowest point in 2016, 1.68 Gt below the baseline, subsequently, a gradual recovery began (Figure 7c).
LWS volume on the northeastern IMP decreased by a total of 0.55 Gt from 2000 to 2021. A continuous decline in storage volume persisted, reaching its lowest level in 2012, before storage volume generally started to increase, rising by a total of 9.08 Gt (Figure 7d).

4.2. Key Drivers of Lake Water Storage Changes on the IMP

4.2.1. Western and Southern IMP: Areal Expansion and Storage Increase Driven by Enhanced Precipitation and Reduced Aridity

The findings are not entirely consistent with previous studies, which often suggest that, under the influence of natural and anthropogenic factors, lakes on the IMP generally exhibit declining water levels, shrinking areas, and reduced water storage [13,36]. In contrast, this study reveals significant regional differences in LWS changes across IMP. Specifically, lakes larger than 5 km2 in the western region showed an increase in water storage, while those in the central–eastern region exhibited a notable decrease. In the northeastern region, lakes larger than 5 km2 demonstrated an initial decline followed by an increase in water storage.
This spatial variability is further reflected in lake area changes. From 2000 to 2021, the total area of lakes (≥5 km2) in the western and southern IMP expanded from 507.85 km2 to 748.61 km2, marking an overall expansion of 47.41%, accompanied by a water storage rise of 0.65 Gt. Notable examples include Wuliangsuhai Lake and Xinghai Lake, expanding significantly by 45% and 94%, respectively, compared to the start year. Additionally, Subunaoer Lake, which had previously dried up, recovered to a surface area of 41 km2.
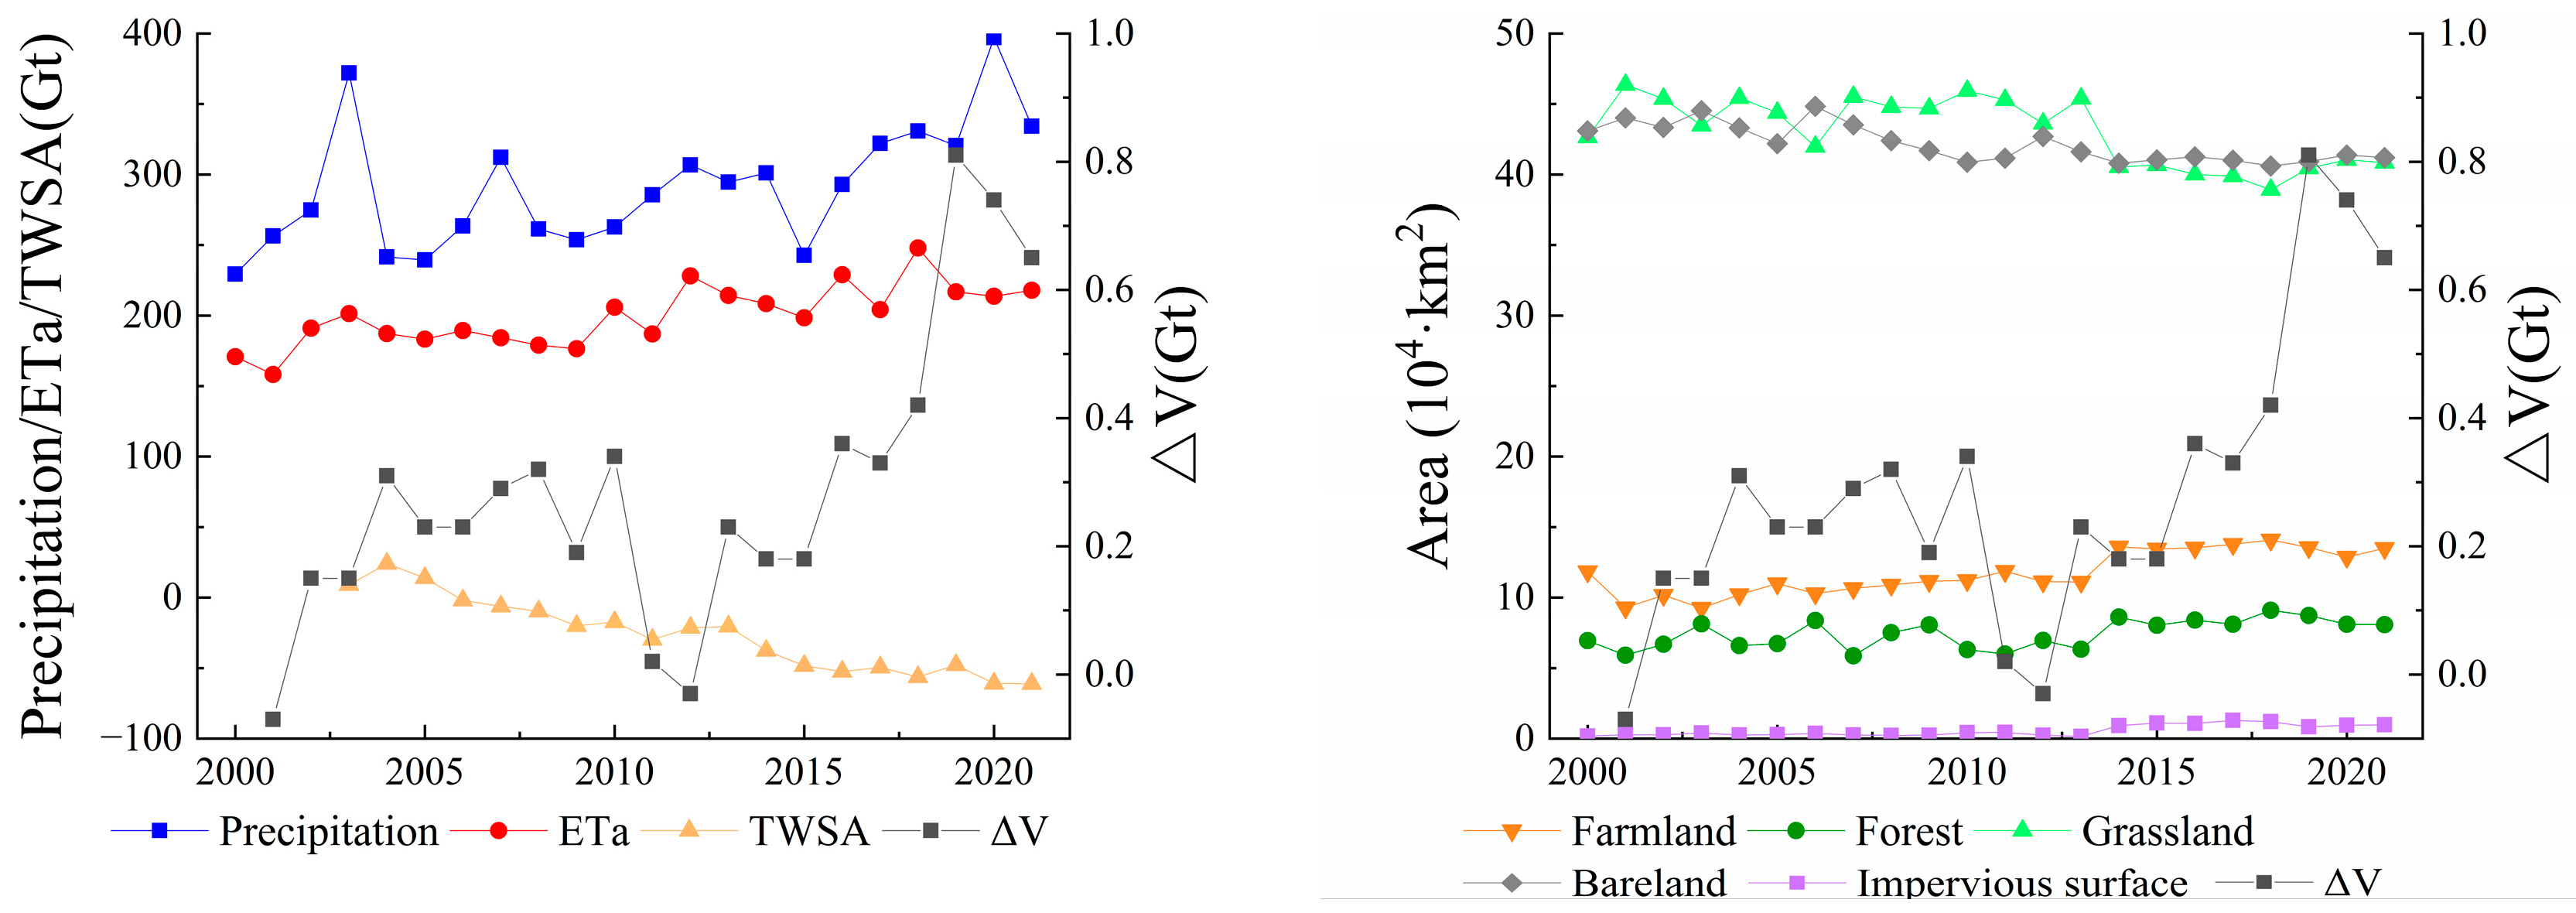
The expansion of lakes in this region is primarily driven by increased precipitation (Figure 8). Compared to 2000, the annual precipitation in 2021 rose from 229.38 Gt to 334.16 Gt, with an average annual increase of 4.99 Gt/yr, a rate higher than that of ETa (2.24 Gt/yr). This shift is reflected in a declining drought index (the ratio of potential evapotranspiration to precipitation), decreasing from 4.84 to 3.26, consequently enhancing water availability and leading to increased direct precipitation recharge and other indirect recharge to lakes by 0.18 Gt and 0.51 Gt, respectively. The former was calculated by aggregating the annual precipitation corresponding to all lake areas in the western and southern IMP. The latter was estimated using the water balance method, derived by subtracting surface evaporation and changes in lake water storage from the direct precipitation recharge.
The western and southern IMP is predominantly covered by grassland and bare land, which decreased by 18,000 km2 and 19,000 km2, respectively. Conversely, farmland area has expanded rapidly since 2014, with an increase exceeding 16,600 km2 compared to its 2000 level. Forest area exhibited an upward trend from 2000 to 2014 before stabilizing post-2014. Although impervious surfaces represent a small fraction of the total area, they have expanded by 7900 km2 since 2000. Consequently, the decline in agricultural water consumption is considered a contributing factor to the observed increase in lake water storage in the region.
Additionally, benefiting from ecological conservation and restoration projects in areas such as the Qilian mountains and the Yellow River Basin, lakes including Subunaoer Lake, Wuliangsuhai Lake, and Xinghai Lake exhibited more pronounced surface area expansion [36,41,49,50].

4.2.2. Central–Eastern IMP: Storage Decline and Surface Shrinkage from Intensive Water Diversion and Groundwater Exploitation

From 2000 to 2021, the central–eastern IMP experienced a severe reduction in lake area, with the total area of lakes (≥5 km2) contracting by 44.55%, from 1117.32 km2 to 619.51 km2, accompanied by a water storage loss of 1.31 Gt. Notably, Daihai Lake, Chagannur Lake, and Dalinor Lake exhibited significant area reductions, shrinking by 44%, 90%, and 16%, respectively.
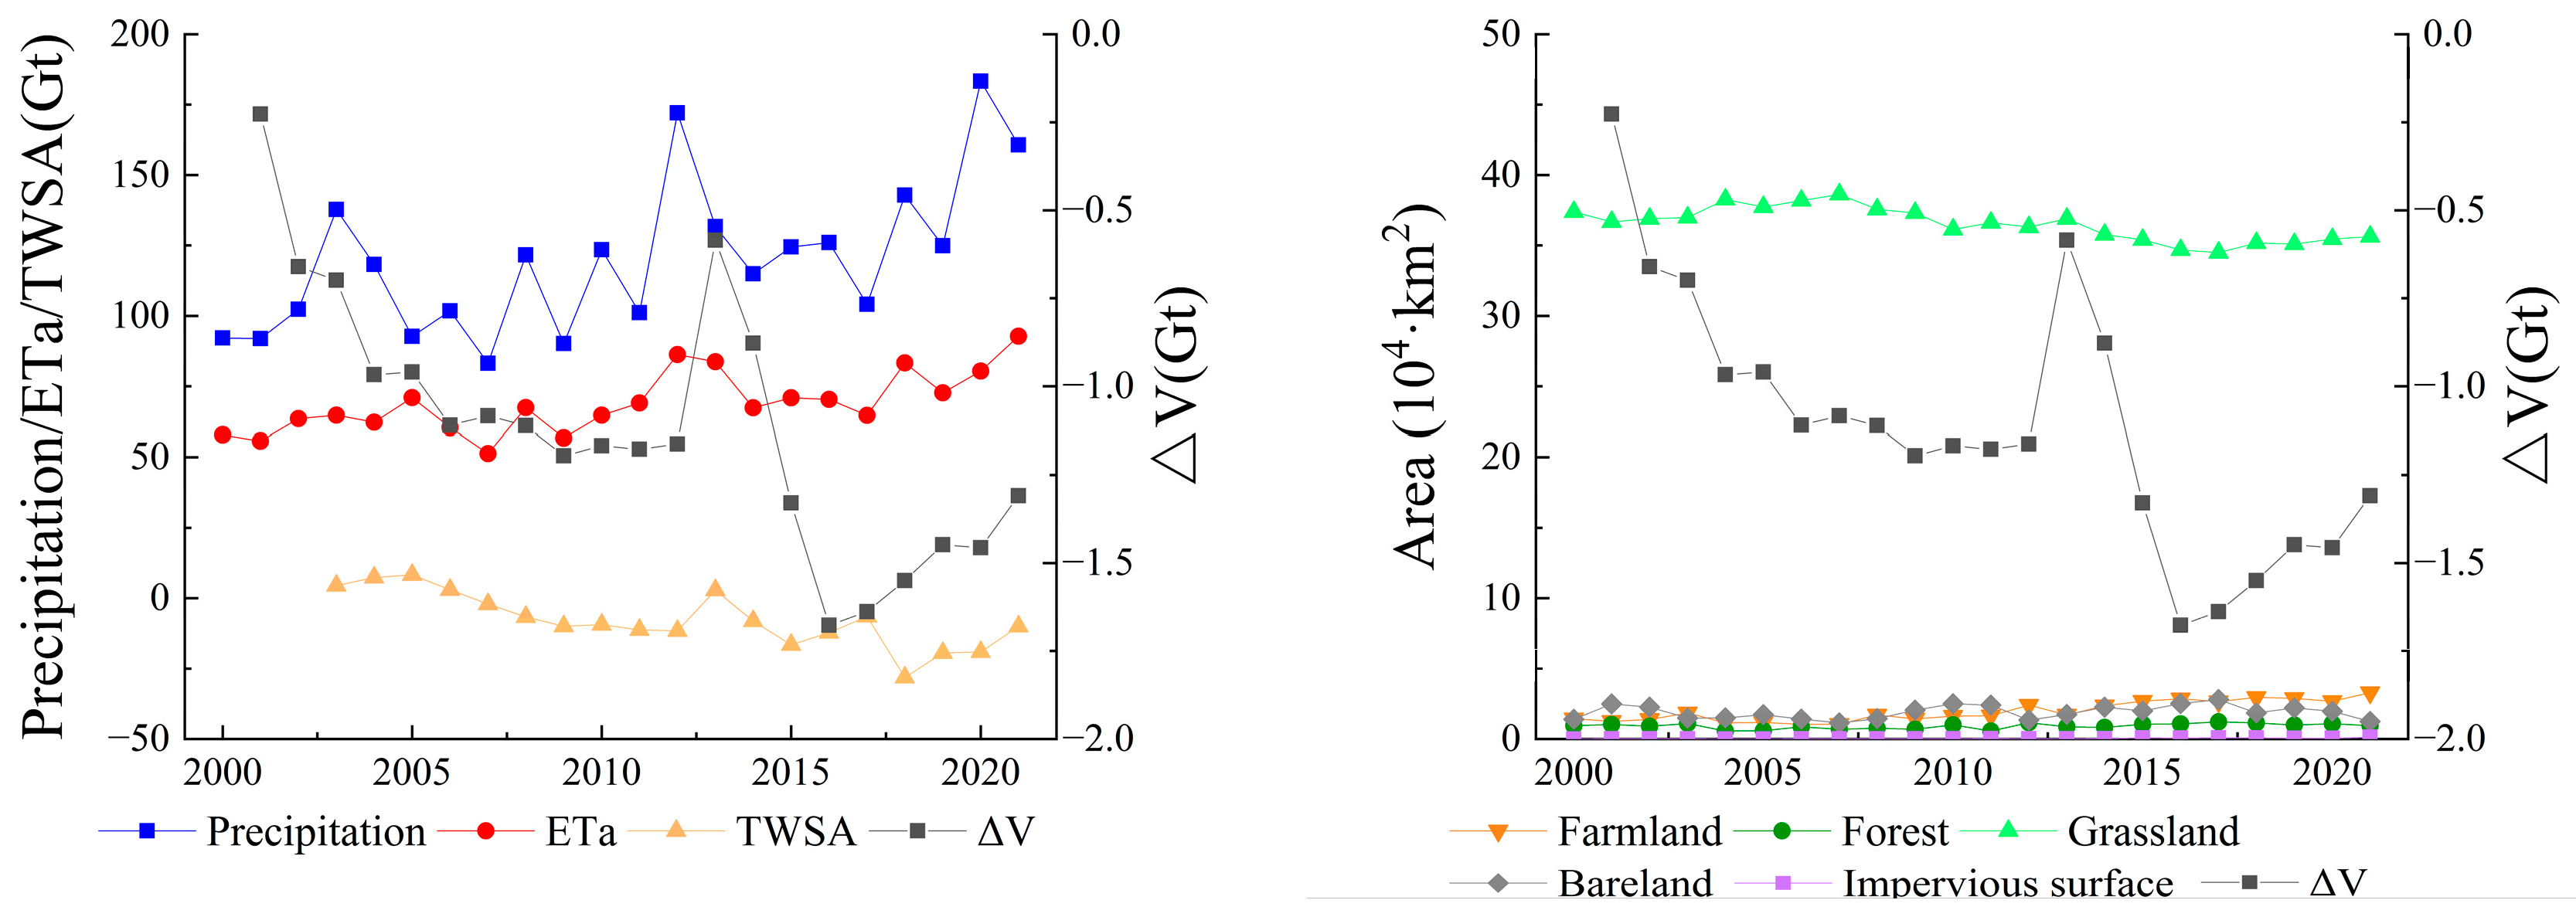
Despite an average annual precipitation increase of 3.27 Gt/yr and an increase in evapotranspiration by 1.66/yr from 2000 to 2021, the drought index decreases by 0.12/yr, LWS diminished at an annual rate of 0.06 Gt/yr (Figure 9). The central–eastern IMP is predominantly covered by grassland, which decreased by 17,500 km2. Concurrently, the primary driver was extensive agricultural expansion; farmland nearly doubled, increasing from 14,500 km2 to 33,100 km2 (Figure 9). According to the National Statistical Yearbook, the cultivated land area in the Inner Mongolia Autonomous Region has increased by 28,000 km2, while groundwater reserves have decreased by 43.8 Gt, resulting in a reduced recharge of groundwater to lakes. These anthropogenic pressures substantially reduced recharge to lakes from both river systems and groundwater sources. Surface water diversion for irrigation and groundwater extraction are the primary drivers of lake contraction in this region.

4.2.3. Northeastern IMP: Decline–Recovery–Net Loss Trend from Precipitation Deficit and Ecological Replenishment

From 2000 to 2021, the total area of lakes (≥5 km2) in the northeastern IMP fluctuated between 3166.23 km2 and 3200.57 km2. The dynamics were dominated by the largest lake in the region, Hulun Lake, accounted for 67% of the total lake area [36]. Meanwhile, other lakes remained relatively stable. The changes unfolded in two distinct phases:
Shrinkage Phase (2000–2012): The area decreased from 3166.23 km2 to 2609.09 km2, accompanied by a reduction of 9.63 Gt in water storage volume (Figure 10). The contraction of Hulun Lake was primarily driven by reduced precipitation and inflow [51]. This period was a dry season, with annual precipitation declining from 0.57 Gt (1980–2000) to 0.35 Gt (2001–2013) [52]. Consequently, the annual runoff of its major tributaries, the Wuerxun River and Kherlen River, plummeted from approximately 0.9 Gt and 0.6 Gt to about 0.1 Gt each [52]. Combined, the reduced inflow from precipitation and surface runoff resulted in a total deficit of 16.1 Gt in water supply to the lake [6].
Recovery Phase (Post-2012): The area subsequently rebounded to 3200.57 km2, and water storage volume rose by 9.08 Gt (Figure 10). During this period, the areas of farmland, forest, and grassland exhibited minimal changes. Following 2012, the implementation of water conservancy projects, notably the river diversion project channeling water from the Hailar River to Hulun Lake, facilitated a steady increase in both the lake’s area and water storage volume. Furthermore, increased precipitation, notably the heavy rainfall in 2013, was also a primary factor contributing to the lake recovery [13,51].

5. Conclusions

Based on Landsat-5/7/8 and Sentinel-2 optical satellite imagery, combined with ICESat/ICESat-2 and CryoSat-2 altimetry data, this study conducted continuous monitoring of water level and storage changes (2000–2021) for lakes ≥5 km2 across the IMP. Key findings include:
(1)
Reconstructed water levels for lakes lacking altimetry data showed strong consistency with validation data (Hulun Lake RMSE = 0.46 m; Dalinor Lake RMSE = 0.22 m; Cetian Reservoir RMSE = 0.56 m) using water level/area fitting relationships. Lake water storage (LWS) changes exhibited high reliability (Hulun Lake RMSE = 0.63 Gt; Dalinor Lake RMSE = 0.02 Gt; Cetian Reservoir RMSE = 0.009 Gt).
(2)
Among the studied lakes (≥5 km2), 49 exhibited water level increases, 40 showed decreases, and 20 experienced minimal changes. Decreasing trends dominated central–eastern regions, while increasing levels prevailed elsewhere.
(3)
Using 2000 as the baseline year, the total LWS has decreased by 1.21 Gt until 2021. The western lakes gained storage, the central–eastern lake storage has declined significantly, and northeastern lake storage followed a decline-to-recovery trajectory. These spatial patterns demonstrate partial agreement with prior studies.

Author Contributions

Conceptualization, J.B. and F.G.; methodology, J.B. and Y.Z. (Yichi Zhang); software, Y.Z. (Yue Zhuo) and J.B.; validation, J.B. and Y.Z. (Yue Zhuo); formal analysis, N.X. and Y.G.; investigation, R.L.; resources, F.G. and B.Y.; data curation, Y.Z. (Yue Zhuo); writing—original draft preparation, J.B.; writing—review and editing, J.B.; visualization, J.B.; supervision, B.Y.; project administration, J.B.; funding acquisition, J.B. All authors have read and agreed to the published version of the manuscript.

Funding

This work was supported by the China Geological Survey through the project “Remote Sensing Quantitative Survey and Monitoring of Water Cycle Elements and Natural Resources in a River Basin” (Grant No. DD20230500106).

Data Availability Statement

The raw data supporting the conclusions of this article will be made available by the authors on request.

Acknowledgments

The China lake dataset (1960s–2020) is provided by National Tibetan Plateau/Third Pole Environment Data Center (http://data.tpdc.ac.cn).

Conflicts of Interest

The authors declare no conflicts of interest.

Appendix A

This appendix documents the lake designations and satellite transit times for the ICESat, CryoSat-2, and ICESat-2 altimetry missions. ICESat (February 2003–October 2009) captured data over 25 lakes on the Inner Mongolia Plateau (Figure A1), followed by CryoSat-2 (July 2010–December 2018) with coverage of 38 lakes (Figure A2) and ICESat-2 (January 2019–December 2021) with 70 lakes (Figure A3). As previously noted, only eight lakes were consistently observed across all three satellite missions.
Figure A1. The transit times of the ICESat altimetry satellite over different lakes. The x-axis represents lake numbers, the y-axis represents satellite transit times, blue short bars indicate satellite transits, and blank areas indicate no satellite transit occurred that month.
Water 17 03056 g0a1
Figure A2. The transit times of the Cryosat-2 altimetry satellite over different lakes. The x-axis represents lake numbers, the y-axis represents satellite transit times, blue short bars indicate satellite transits, and blank areas indicate no satellite transit occurred that month.
Water 17 03056 g0a2
Figure A3. The transit times of the ICESat-2 altimetry satellite over different lakes. The x-axis represents lake numbers, the y-axis represents satellite transit times, blue short bars indicate satellite transits, and blank areas indicate no satellite transit occurred that month.
Water 17 03056 g0a3

References

  1. Li, X.; Long, D.; Huang, Q.; Han, P.; Zhao, F.; Wada, Y. High-temporal-resolution water level and storage change data sets for lakes on the Tibetan Plateau during 2000–2017 using multiple altimetric missions and Landsat-derived lake shoreline positions. Earth Syst. Sci. Data 2019, 11, 1603–1627. [Google Scholar] [CrossRef]
  2. Woolway, R.I.; Kraemer, B.M.; Lenters, J.D.; Merchant, C.J.; O’Reilly, C.M.; Sharma, S. Global lake responses to climate change. Nat. Rev. Earth Environ. 2020, 1, 388–403. [Google Scholar] [CrossRef]
  3. Zhang, C.; Lv, A.; Jia, S.; Qi, S. Longterm multisource satellite data fusion reveals dynamic expansion of lake water area and storage in a hyperarid basin of China. J. Hydrol. 2022, 610, 127888. [Google Scholar] [CrossRef]
  4. Zhang, G.; Yao, T.; Chen, W.; Zheng, G.; Shum, C.K.; Yang, K.; Piao, S.; Sheng, Y.; Yi, S.; Li, J.; et al. Regional differences of lake evolution across China during 1960s–2015 and its natural and anthropogenic causes. Remote Sens. Environ. 2019, 221, 386–404. [Google Scholar] [CrossRef]
  5. An, C.; Zhang, F.; Chan, N.W.; Johnson, V.C.; Shi, J. A review on the research progress of lake water volume estimation methods. J. Environ. Manag. 2022, 314, 115057. [Google Scholar] [CrossRef]
  6. Cao, Y.; Fu, C.; Wang, X.; Dong, L.; Yao, S.; Xue, B.; Wu, H.; Wu, H. Decoding the dramatic hundred-year water level variations of a typical great lake in semi-arid region of northeastern Asia. Sci. Total Environ. 2021, 770, 145353. [Google Scholar] [CrossRef]
  7. Luo, S.; Song, C.; Ke, L.; Zhan, P.; Fan, C.; Liu, K.; Chen, T.; Wang, J.; Zhu, J. Satellite Laser Altimetry Reveals a Net Water Mass Gain in Global Lakes with Spatial Heterogeneity in the Early 21st Century. Geophys. Res. Lett. 2022, 49, e2021GL096676. [Google Scholar] [CrossRef]
  8. Cooley, S.W.; Ryan, J.C.; Smith, L.C. Human alteration of global surface water storage variability. Nature 2021, 591, 78–81. [Google Scholar] [CrossRef] [PubMed]
  9. Wang, J.; Song, C.; Reager, J.T.; Yao, F.; Famiglietti, J.S.; Sheng, Y.; MacDonald, G.M.; Brun, F.; Schmied, H.M.; Marston, R.A.; et al. Recent global decline in endorheic basin water storages. Nat. Geosci. 2018, 11, 926–932. [Google Scholar] [CrossRef]
  10. Tao, S.; Fang, J.; Zhao, X.; Zhao, S.; Shen, H.; Hu, H.; Tang, Z.; Wang, Z.; Guo, Q. Rapid loss of lakes on the Mongolian Plateau. Proc. Natl. Acad. Sci. USA 2015, 112, 2281–2286. [Google Scholar] [CrossRef] [PubMed]
  11. Chen, X.; Wang, Y.; Pei, H.; Guo, Y.; Zhang, J.; Shen, Y. Expansion of irrigation led to inland lake shrinking in semi-arid agro-pastoral region, China: A case study of Chahannur Lake. J. Hydrol. Reg. Stud. 2022, 41, 101086. [Google Scholar] [CrossRef]
  12. Cretaux, J.-F.; Letolle, R.; Bergé-Nguyen, M. History of Aral Sea level variability and current scientific debates. Glob. Planet. Change 2013, 110, 99–113. [Google Scholar] [CrossRef]
  13. Cai, Z.; Jin, T.; Li, C.; Ofterdinger, U.; Zhang, S.; Ding, A.; Li, J. Is China’s fifth-largest inland lake to dry-up? Incorporated hydrological and satellite-based methods for forecasting Hulun lake water levels. Adv. Water Resour. 2016, 94, 185–199. [Google Scholar] [CrossRef]
  14. Fang, F.; Li, H.; Wan, W.; Zhu, S.; Wang, Z.; Hong, Y.; Wang, H. Assessment of Water Storage Change in China’s Lakes and Reservoirs over the Last Three Decades. Remote Sens. 2019, 11, 1467. [Google Scholar] [CrossRef]
  15. Duan, Z.; Bastiaanssen, W.G.M. Estimating water volume variations in lakes and reservoirs from four operational satellite altimetry databases and satellite imagery data. Remote Sens. Environ. 2013, 134, 403–416. [Google Scholar] [CrossRef]
  16. Crétaux, J.F.; Abarca-del-Río, R.; Bergé-Nguyen, M.; Arsen, A.; Drolon, V.; Clos, G.; Maisongrande, P. Lake Volume Monitoring from Space. Surv. Geophys. 2016, 37, 269–305. [Google Scholar] [CrossRef]
  17. Carabajal, C.C.; Boy, J.-P. Lake and reservoir volume variations in South America from radar altimetry, ICESat laser altimetry, and GRACE time-variable gravity. Adv. Space Res. 2021, 68, 652–671. [Google Scholar] [CrossRef]
  18. Crétaux, J.F.; Arsen, A.; Calmant, S.; Kouraev, A.; Vuglinski, V.; Bergé-Nguyen, M.; Gennero, M.C.; Nino, F.; Abarca Del Rio, R.; Cazenave, A.; et al. SOLS: A lake database to monitor in the Near Real Time water level and storage variations from remote sensing data. Adv. Space Res. 2011, 47, 1497–1507. [Google Scholar] [CrossRef]
  19. Chen, J.; Liao, J. Monitoring lake level changes in China using multi-altimeter data (2016–2019). J. Hydrol. 2020, 590, 125544. [Google Scholar] [CrossRef]
  20. Kim, J.-W.; Lu, Z.; Lee, H.; Shum, C.K.; Swarzenski, C.M.; Doyle, T.W.; Baek, S.-H. Integrated analysis of PALSAR/Radarsat-1 InSAR and ENVISAT altimeter data for mapping of absolute water level changes in Louisiana wetlands. Remote Sens. Environ. 2009, 113, 2356–2365. [Google Scholar] [CrossRef]
  21. Medina, C.E.; Gomez-Enri, J.; Alonso, J.J.; Villares, P. Water level fluctuations derived from ENVISAT Radar Altimeter (RA-2) and in-situ measurements in a subtropical waterbody: Lake Izabal (Guatemala). Remote Sens. Environ. 2008, 112, 3604–3617. [Google Scholar] [CrossRef]
  22. Birkett, C.M.; O’Brien, K.; Kinsey, S.; Ricko, M.; Li, Y. Enhancement of a global lake and reservoir database to aid climate studies and resource monitoring utilizing satellite radar altimetry. J. Great Lakes Res. 2022, 48, 37–51. [Google Scholar] [CrossRef]
  23. Zhang, G.; Xie, H.; Kang, S.; Yi, D.; Ackley, S.F. Monitoring lake level changes on the Tibetan Plateau using ICESat altimetry data (2003–2009). Remote Sens. Environ. 2011, 115, 1733–1742. [Google Scholar] [CrossRef]
  24. Ryan, J.C.; Smith, L.C.; Cooley, S.W.; Pitcher, L.H.; Pavelsky, T.M. Global Characterization of Inland Water Reservoirs Using ICESat-2 Altimetry and Climate Reanalysis. Geophys. Res. Lett. 2020, 47, e2020GL088543. [Google Scholar] [CrossRef]
  25. Xu, N.; Ma, Y.; Wei, Z.; Huang, C.; Li, G.; Zheng, H.; Wang, X.H. Satellite observed recent rising water levels of global lakes and reservoirs. Environ. Res. Lett. 2022, 17, 074013. [Google Scholar] [CrossRef]
  26. Luo, S.; Song, C.; Zhan, P.; Liu, K.; Chen, T.; Li, W.; Ke, L. Refined estimation of lake water level and storage changes on the Tibetan Plateau from ICESat/ICESat-2. Catena 2021, 200, 105177. [Google Scholar] [CrossRef]
  27. Wang, J.; Gao, Y. Monitoring long-term water storage of lakes and reservoirs in arid ungauged basin based on underwater topography derived from multi-source satellite data. Sci. Total Environ. 2025, 966, 178662. [Google Scholar] [CrossRef]
  28. Jiang, L.; Nielsen, K.; Andersen, O.B.; Bauer-Gottwein, P. A Bigger Picture of how the Tibetan Lakes Have Changed over the Past Decade Revealed by CryoSat-2 Altimetry. J. Geophys. Res. Atmos. 2020, 125, e2020JD033161. [Google Scholar] [CrossRef]
  29. Qiao, B.; Zhu, L. Difference and cause analysis of water storage changes for glacier-fed and non-glacier-fed lakes on the Tibetan Plateau. Sci. Total Environ. 2019, 693, 133399. [Google Scholar] [CrossRef]
  30. Xu, F.; Zhang, G.; Woolway, R.I.; Yang, K.; Wada, Y.; Wang, J.; Crétaux, J.-F. Widespread societal and ecological impacts from projected Tibetan Plateau lake expansion. Nat. Geosci. 2024, 17, 516–523. [Google Scholar] [CrossRef]
  31. Zhang, G.; Bolch, T.; Chen, W.; Cretaux, J.F. Comprehensive estimation of lake volume changes on the Tibetan Plateau during 1976–2019 and basin-wide glacier contribution. Sci. Total Environ. 2021, 772, 145463. [Google Scholar] [CrossRef]
  32. Zhang, G.; Yao, T.; Xie, H.; Yang, K.; Zhu, L.; Shum, C.K.; Bolch, T.; Yi, S.; Allen, S.; Jiang, L.; et al. Response of Tibetan Plateau lakes to climate change: Trends, patterns, and mechanisms. Earth-Sci. Rev. 2020, 208, 103269. [Google Scholar] [CrossRef]
  33. Zhu, L.; Ju, J.; Qiao, B.; Liu, C.; Wang, J.; Yang, R.; Ma, Q.; Guo, L.; Pang, S. Physical and biogeochemical responses of Tibetan Plateau lakes to climate change. Nat. Rev. Earth Environ. 2025, 6, 284–298. [Google Scholar] [CrossRef]
  34. Song, C.; Huang, B.; Ke, L. Modeling and analysis of lake water storage changes on the Tibetan Plateau using multi-mission satellite data. Remote Sens. Environ. 2013, 135, 25–35. [Google Scholar] [CrossRef]
  35. Ma, R.; Yang, G.; Duan, H.; Jiang, J.; Wang, S.; Feng, X.; Li, A.; Kong, F.; Xue, B.; Wu, J.; et al. China’s lakes at present: Number, area and spatial distribution. Sci. China Earth Sci. 2010, 54, 283–289. [Google Scholar] [CrossRef]
  36. Xu, Y.; Gun, Z.; Zhao, J.; Cheng, X. Variations in lake water storage over Inner Mongolia during recent three decades based on multi-mission satellites. J. Hydrol. 2022, 609, 127719. [Google Scholar] [CrossRef]
  37. Wang, S.; Xu, C.; Zhang, W.; Chen, H.; Zhang, B. Human-Induced water loss from closed inland Lakes: Hydrological simulations in China’s Daihai lake. J. Hydrol. 2022, 607, 127552. [Google Scholar] [CrossRef]
  38. Miao, Q.; Liu, X.; Shi, H.; Wei, Z.; Luo, Y.; Wang, Y.; Gonçalves, J.M.; Feng, W. Lake-area shrinkage driven by the combined effects of climate change and human activities. Ecol. Indic. 2025, 175, 113606. [Google Scholar] [CrossRef]
  39. Naeem, M.; Zhang, Y.; Nourani, V.; Tian, X.; Miao, P. Both climate and anthropogenic impacts on recent lake area change in the Erdos Plateau. J. Environ. Manag. 2025, 373, 123443. [Google Scholar] [CrossRef] [PubMed]
  40. Song, W.; A, Y.; Wang, Y.; Xue, B. Landsat Satellite Image-Derived Area Evolution and the Driving Factors Affecting Hulun Lake from 1986 to 2020. Remote Sens. 2023, 15, 2682. [Google Scholar] [CrossRef]
  41. Shi, X.; Wang, S.; Zhao, S.; Sun, B.; Yu, H.; Zhang, F.; Zhang, Q. Evaluating the effects of ecological water replenishment on lake water exchange in semi-arid regions insights from an 11-year modeling study. J. Environ. Manag. 2025, 391, 126491. [Google Scholar] [CrossRef]
  42. Ma, R.; Chen, P.; Zhang, B.; Zhao, L.; Ning, K. Identification of ecological restoration standard for lakes on the Inner Mongolia Plateau, China. Ecol. Indic. 2024, 162, 111993. [Google Scholar] [CrossRef]
  43. Xing, N.; Gan, F.; Yan, B.; Bai, J.; Guo, Y.; Zhuo, Y.; Li, R. Dynamic Monitoring and Change Analysis of Lake Area on the Inner-Mongolian Plateau over the Past 22 Years. Remote Sens. 2024, 16, 2210. [Google Scholar] [CrossRef]
  44. Guo, Y.; Gan, F.; Yan, B.; Bai, J.; Xing, N.; Zhuo, Y. Evaluation of Terrestrial Water Storage Changes and Major Driving Factors Analysis in Inner Mongolia, China. Sensors 2022, 22, 9665. [Google Scholar] [CrossRef] [PubMed]
  45. Mihret, T.T.; Zemale, F.A.; Worqlul, A.W.; Ayalew, A.D.; Fohrer, N. Unlocking watershed mysteries: Innovative regionalization of hydrological model parameters in data-scarce regions. J. Hydrol. Reg. Stud. 2025, 57, 102163. [Google Scholar] [CrossRef]
  46. Wallner, M.; Haberlandt, U.; Dietrich, J. A one-step similarity approach for the regionalization of hydrological model parameters based on Self-Organizing Maps. J. Hydrol. 2013, 494, 59–71. [Google Scholar] [CrossRef]
  47. Li, H.; Zhang, Y. Regionalising rainfall-runoff modelling for predicting daily runoff: Comparing gridded spatial proximity and gridded integrated similarity approaches against their lumped counterparts. J. Hydrol. 2017, 550, 279–293. [Google Scholar] [CrossRef]
  48. Li, X.; Jiang, X.; Lei, Y. Suitable water surface area of the tail lake under the constraint of water diversion scheme in arid areas based on emergy theory. J. Hydrol. Reg. Stud. 2023, 49, 101491. [Google Scholar] [CrossRef]
  49. Zhang, M.; Wang, S.; Fu, B.; Gao, G.; Shen, Q. Ecological effects and potential risks of the water diversion project in the Heihe River Basin. Sci. Total Environ. 2018, 619–620, 794–803. [Google Scholar] [CrossRef]
  50. Chen, Q.; Wang, S.; Ni, Z.; Guo, Y.; Zhang, H. Dynamic and driving evolution of lake basin pressure in cold and arid regions based on a new method: A case study of three lakes in Inner Mongolia, China. J Environ. Manag. 2021, 298, 113425. [Google Scholar] [CrossRef]
  51. Zhou, Y.; Dong, J.; Xiao, X.; Liu, R.; Zou, Z.; Zhao, G.; Ge, Q. Continuous monitoring of lake dynamics on the Mongolian Plateau using all available Landsat imagery and Google Earth Engine. Sci. Total Environ. 2019, 689, 366–380. [Google Scholar] [CrossRef] [PubMed]
  52. Gao, H.; Ryan, M.; Li, C.; Sun, B. Understanding the Role of Groundwater in a Remote Transboundary Lake (Hulun Lake, China). Water 2017, 9, 363. [Google Scholar] [CrossRef]
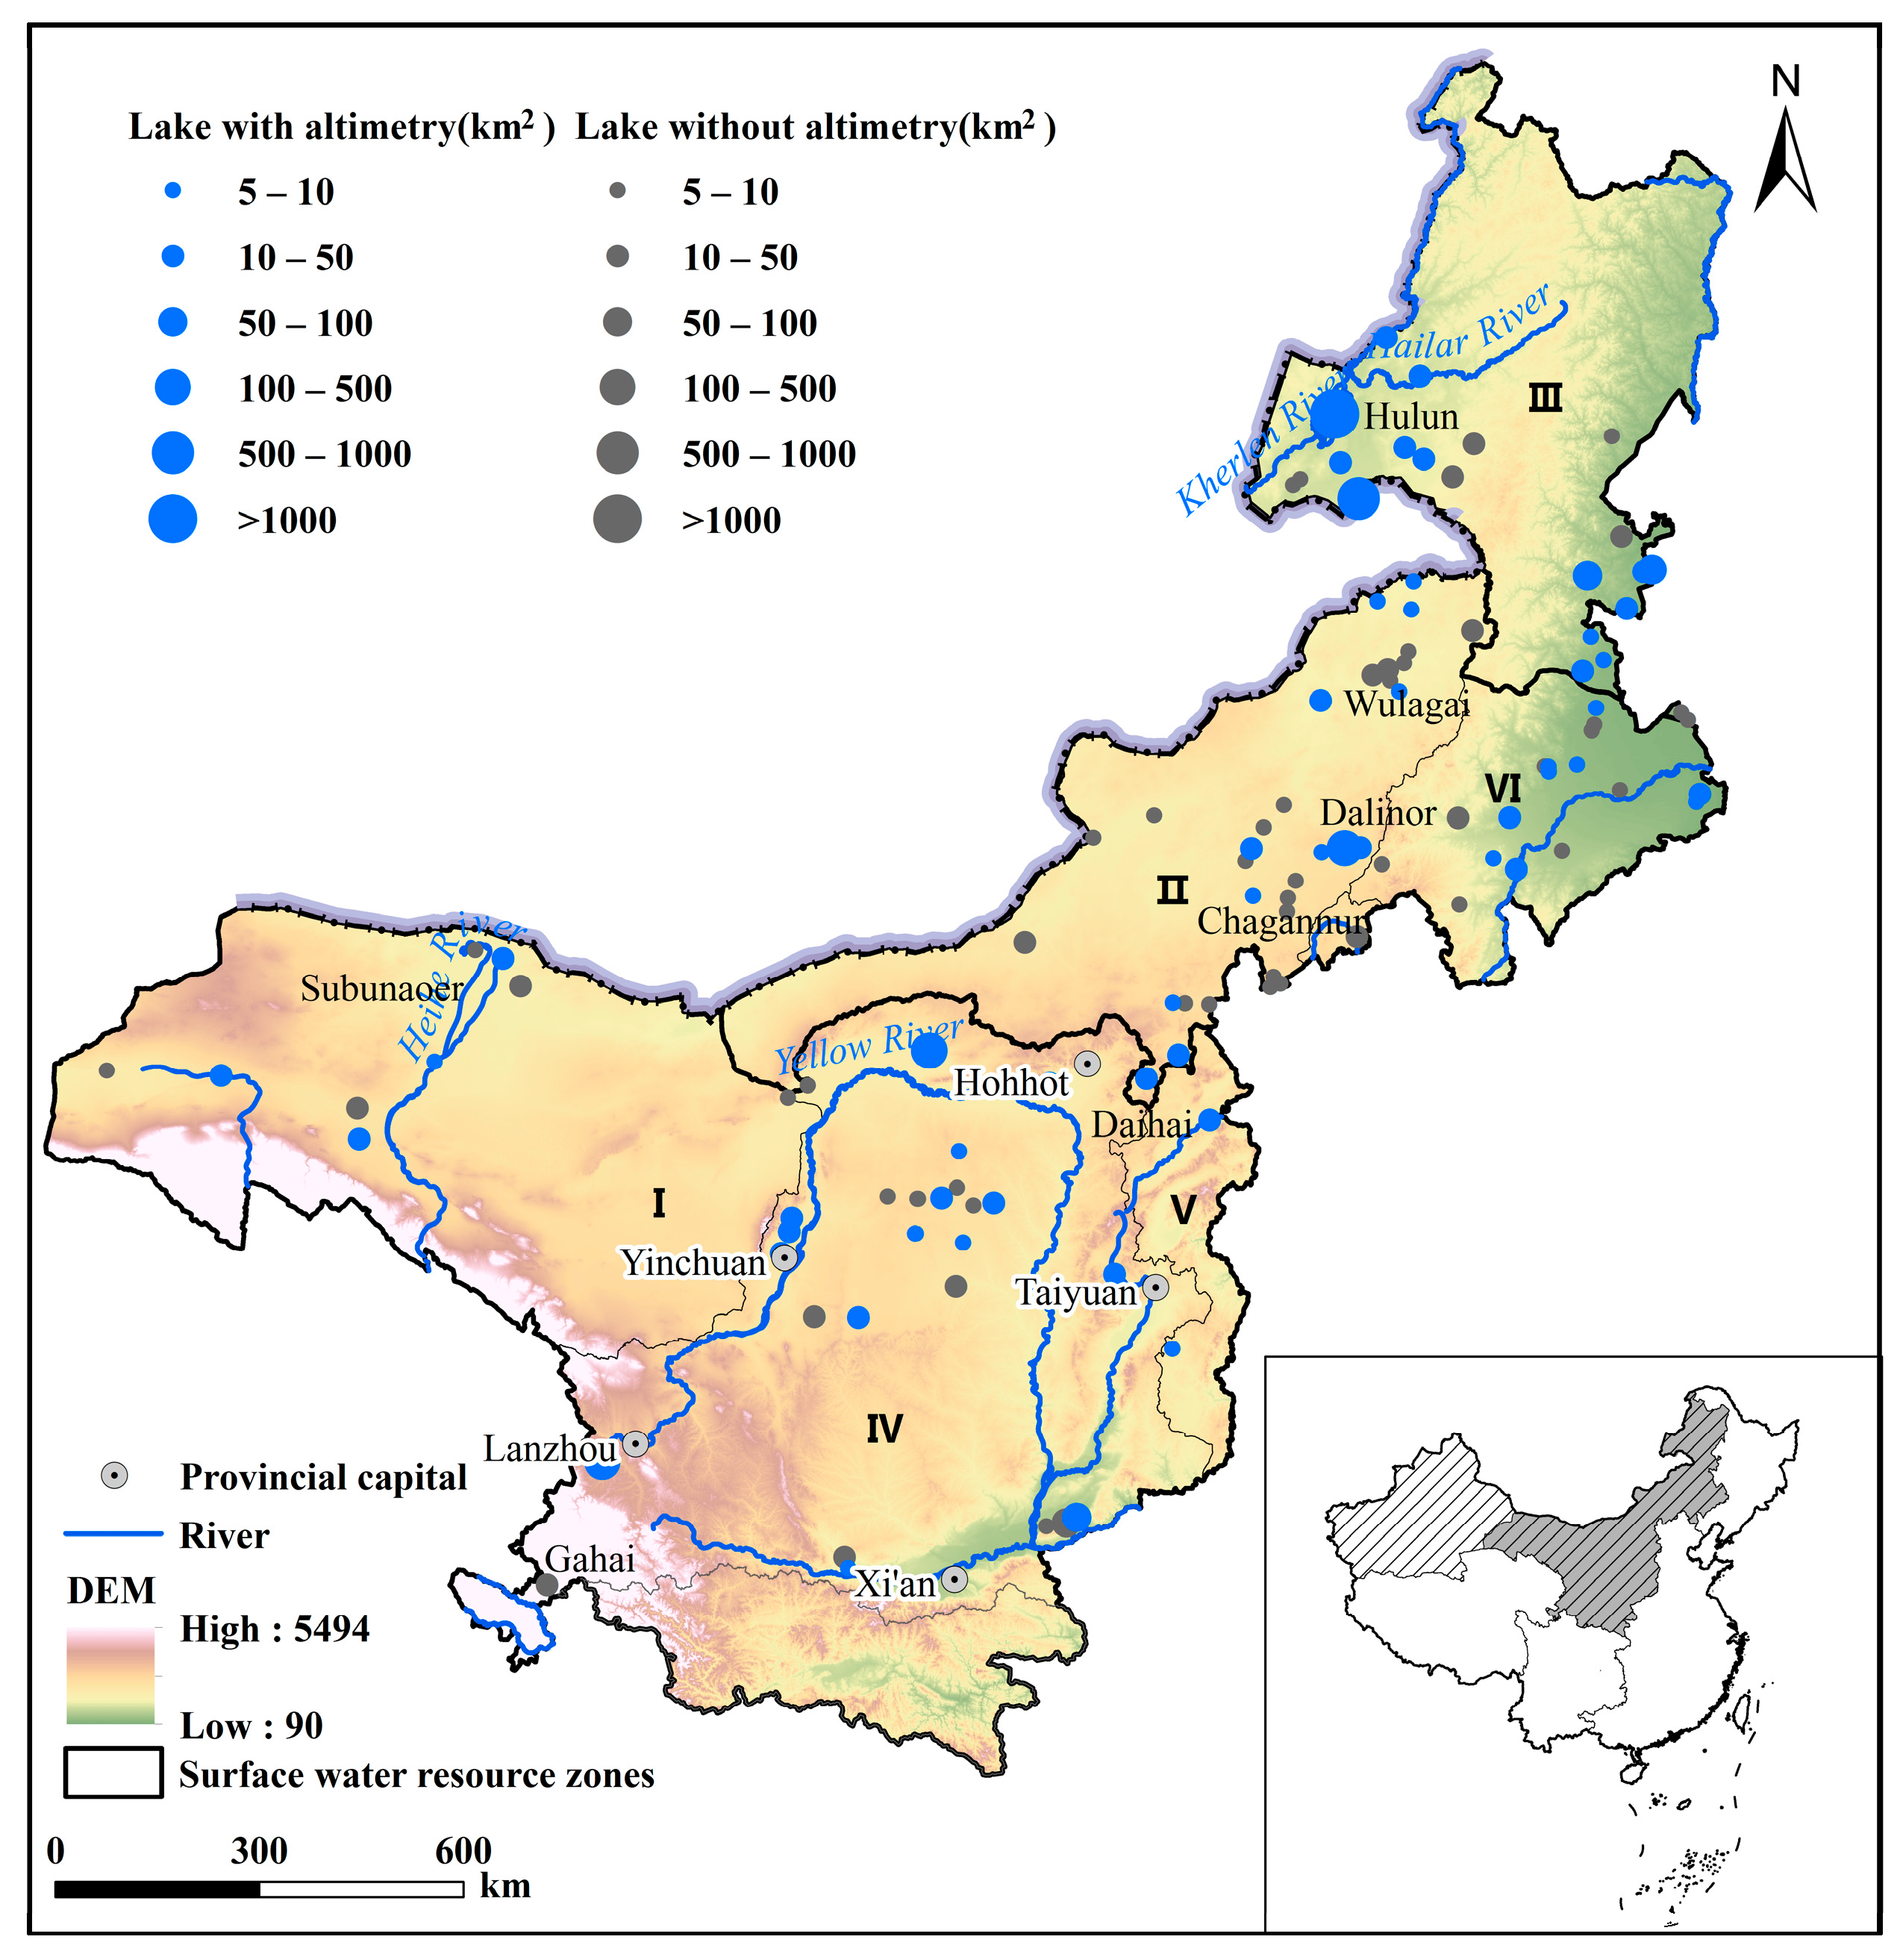
Figure 1. Inner Mongolian Plateau (MP) and the distribution of 109 lakes within it. Blue (gray) points are for lakes with (without) altimetry, and their size is proportional to the lake size. I is Northwest Inland River Basin; II is Inner Mongolia Inland River Basin; III is Songhua River Basin; IV is Yellow River Basin; V is Haihe River Basin; and VI is Liaohe River Basin. The map was created using ESRI ArcGIS 10.4 (http://www.esri.com/). Map Approval Number: GS(2023)2767.
Water 17 03056 g001
Figure 2. Framework of remote-sensing-based dynamic monitoring of lake water storage.
Water 17 03056 g002
Figure 3. Validation of lake water level retrieval and storage change estimation.
Water 17 03056 g003
Figure 4. Variation characteristics of lake water level on the IMP from 2000 to 2021. Map Approval Number: GS(2023)2767.
Water 17 03056 g004
Figure 5. Variation characteristics of lake water storage on the IMP from 2000 to 2021. Map Approval Number: GS(2023)2767.
Water 17 03056 g005
Figure 6. Lake area and water storage changes of several typical lakes.
Water 17 03056 g006
Figure 7. Lake area and water storage changes on the IMP (a) and three spatial regions: the western and southern IMP (b); the central and eastern IMP (c); and the northeastern IMP (d).
Water 17 03056 g007
Figure 8. The relationship between changes in lake water storage on the western and southern IMP and climatic factors as well as land use types (TWSA: the terrestrial water storage anomalies).
Water 17 03056 g008
Figure 9. The relationship between changes in lake water storage on the central and eastern IMP and climatic factors as well as land use types.
Water 17 03056 g009
Figure 10. The relationship between changes in lake water storage on the northeastern IMP and climatic factors as well as land use types.
Water 17 03056 g010
Table 1. List of the relevant information of the dataset used in this study.
ItemDatasetAttributeApplication PurposeSource
1Landsat 5/7/8 [43]Spatial resolution: 30 m
Temporal scale: 16 days Time span: 2000–2021
Extract water area and LUCChttp://glovis.usgs.gov/
(accessed on 1 June 2025)
2Sentinel-2 [43]Spatial resolution: 10–30 m
Temporal scale: 5 days
Time span: 2019–2021
Extract water area and LUCChttps://scihub.copernicus.eu/
(accessed on 1 May 2023)
3ICEsatFootprints: 70 m
Temporal scale: 183 days
Time span: 2002.03–2009.10
Extract water levelhttps://nsidc.org/data/GLAH14/versions/34
(accessed on 1 June 2025)
4ICEsat-2Footprints: 17 m
Temporal scale: 91 days
Time span: 2018.10–2021.12
Extract water levelhttps://nsidc.org/data/ATL13/versions/6
(accessed on 1 June 2025)
5Cryosat-2Footprints: 800 m
Temporal scale:369 days
Time span: 2010.07–2021.08
Extract water levelhttps://science-pds.cryosat.esa.int
(accessed on 1 June 2025)
6China LakeDataset [4]Spatial resolution: 1:250,000
Temporal scale: 5 years
Time span: 2000–2020
Provide boundary information of lakeshttps://doi.org/10.11888/Hydro.tpdc.270302
7Hydroweb [18] Provides dense time series of water level data in large lakes and reservoirsVerify the accuracy of water level and water storage changeshttps://hydroweb.next.theia-land.fr/
(accessed on 20 June 2025)
8In-situ observations of lake level and water storage Spatial resolution: single reservoir
Temporal scale: daily
Time span: 2006–2017
Verify the accuracy of water level and water storage changesHai River Water Conservancy Commission
9PrecipitationSpatial resolution: 10 km
Temporal scale: monthly Time span: 2000–2021
Cause analysisFusion of Global Precipitation Measurement (GPM) data and in situ precipitation data
10Evapotranspiration (Eta)Spatial resolution: 1 km
Temporal scale: monthly Time span: 2000–2021
Cause analysisModel simulation (Complementary relationship principle)
11GRACE/
GRACE-FO [44]
Spatial resolution: 100 km Temporal scale: monthly Time span: 2003–2021Cause analysis (Extract TWSA)https://nasagrace.unl.edu/
(accessed on 1 June 2025)
Table 2. Number of lakes with increasing and decreasing water levels by surface water resource zones (2000–2021).
The Variability of Water LevelIMPIIIIIIIVVVI
Water level rise (lakes)4967121725
Water level down (lakes)4021854110
No obvious change (lakes)20085502
Notes: Annotation: I—Northwest Inland River Basin; II—Inner Mongolia Inland River Basin; III—Songhua River Basin; IV—Yellow River Basin; V—Haihe River Basin; VI—Liaohe River Basin.
Table 3. Spatiotemporal variability of lake water storage in surface water resource zones (2000–2021).
The Variability of LWS (Gt)IMPIIIIIIIVVVI
Natural lakes−2.120.10−1.25−1.320.41−0.01−0.04
Reservoirs0.90−0.020.090.770.130.03−0.11
Sum−1.210.08−1.16−0.550.540.02−0.15
Notes: I—Northwest Inland River Basin; II—Inner Mongolia Inland River Basin; III—Songhua River Basin; IV—Yellow River Basin; V—Haihe River Basin; VI—Liaohe River Basin.
Disclaimer/Publisher’s Note: The statements, opinions and data contained in all publications are solely those of the individual author(s) and contributor(s) and not of MDPI and/or the editor(s). MDPI and/or the editor(s) disclaim responsibility for any injury to people or property resulting from any ideas, methods, instructions or products referred to in the content.