Article

Plants Decrease Network Complexity and Increase Environmental Stability of Microbial Communities, Shifting the Dominant Environmental Controls from Carbon-Related Factors to pH in Newly Formed Wetlands

1
Environment Research Institute, Shandong University, Qingdao 266237, China
2
School of Environment, Beijing Normal University, Beijing 100875, China
3
Center for Volatile Interactions (VOLT), Department of Biology, University of Copenhagen, 2100 Copenhagen, Denmark
4
Department of Civil and Environmental Engineering, The Hong Kong Polytechnic University, Hong Kong, China
*
Author to whom correspondence should be addressed.
Water 2025, 17(21), 3054; https://doi.org/10.3390/w17213054 (registering DOI)
Submission received: 22 September 2025 / Revised: 16 October 2025 / Accepted: 23 October 2025 / Published: 24 October 2025
(This article belongs to the Section Soil and Water)

Abstract

Soil microorganisms are crucial regulators of wetland ecological functions and are significantly influenced by plants. However, the ecological patterns underlying soil microbial responses to plants during wetland restoration remain poorly understood. Soil samples from sections with and without plants in each wetland were collected to investigate the impact of plants on soil microbial communities using high-throughput absolute quantification sequencing and analysis of soil physicochemical properties. Results showed that environmental drivers exerted stronger effects on microbial communities in areas without plants. Soil microbial networks in areas without plants were more complex and stable, while plants enhanced the contribution of stochastic processes to microbial community assembly. In areas with plants, pH was the most important environmental driver of soil microbial community variations, while organic carbon was the primary driver in areas without plants. Moreover, bacteria exhibited higher sensitivity than fungi to the same environmental variation in both areas with and without plants. In summary, our findings elucidate the responses of soil microbial ecological patterns to plants in newly formed wetlands, while emphasizing that the major environmental drivers of soil microbial communities are influenced by plants. This study provides important implications for enhancing wetland restoration efficiency.

1. Introduction

Wetlands are ecologically significant ecosystems with unique hydrological conditions and noted for providing essential ecosystem services such as water purification, biodiversity conservation, and climate regulation [1,2,3]. Since the year 1700, inland wetlands have diminished by approximately 3.4 million km2, resulting in a 21% net global loss [4]. Ecological issues arising from wetland loss, such as biodiversity decline and increased greenhouse gas emissions, have attracted significant concern [5,6]. Consequently, wetland restoration efforts have been increasingly implemented [7,8]. Growing evidence indicates that the effectiveness of wetland restoration is highly influenced by soil microbial communities, as they are fundamental components of wetland ecosystems underpin biogeochemical cycles and support multiple ecosystem functions [9,10,11]. Meanwhile, among wetland restoration strategies, plant management is considered one of the primary measures [12]. Therefore, understanding how soil microbial communities respond to plants is essential for improving wetland restoration.
The relationship between plants and microorganisms has long been a focus in ecological research [13,14,15]. Plants and associated microorganisms form a tightly interwoven complex [16]. For instance, the rhizosphere effect induced by plants shapes distinct microbial communities compared to bulk soil, generally with lower microbial diversity in the rhizosphere due to selective effects [17,18,19]. Nevertheless, soil microbial responses to plants vary among ecosystems [20,21], and extrapolations from non-wetland systems may not be appropriate. Although previous research has investigated the influence of plants on bacterial composition and diversity in restored wetland [22], evaluations of both bacterial and fungal ecological characteristics, particularly co-occurrence networks and community assembly, remain insufficient. Microbial co-occurrence networks are fundamental to ecosystem functioning [23]. However, current findings on whether plants increase the complexity and stability of soil microbial networks remain inconsistent, likely due to the differences in plants and ecosystem types [24,25]. Moreover, clarifying soil microbial community assembly processes is fundamental to the effective use of microbial communities in improving ecosystem functioning [26]. Soil microbial community structure is shaped by a combination of stochastic processes and deterministic processes [27,28]. Nevertheless, the contribution of stochastic and deterministic processes changes in responses to habitat succession and external disturbance [29,30]. Consequently, clear understanding of the effects of plants on soil microbial communities during wetland restoration requires further investigation.
Soil microorganisms serve as key indicators of soil health and are highly responsive to environmental changes [31]. Environmental factors, including soil pH, bulk density, and nutrient availability, exert strong effects on soil microbial communities [32,33]. Importantly, the dominant drivers of microbial communities vary across ecosystems [34]. For instance, soil salinity is the main driving factor of microbial community dynamics in coastal wetlands [35], whereas nitrate nitrogen is the primary driver in karst forest [36]. Moreover, a study of farmland succession showed that following plants colonization, soil bulk density (BD) ceased to be the primary factor influencing microbial community changes [37]. These findings suggest that the dominant environmental drivers of soil microbial communities differ depending on ecosystem type and plant presence. In general, fresh organic inputs from plants (e.g., litter and root exudates) modify the soil microenvironment, enhance nutrient availability, and consequently influence soil microbial communities [38,39]. Therefore, further exploration of how plants influence the relationship between soil environment and microbial communities is essential for identifying effective plant-microbe management strategies during wetland restoration.
Recently, in plains with high groundwater levels, coal-mining-induced land subsidence has led to the formation of new wetlands with well-defined formation histories. Wetlands typically exhibit spatial heterogeneity due to topographic variations and fluctuating hydrological regimes, which result in the coexistence of patches with and without plants [40]. These wetlands with diverse developmental states and patch heterogeneity provide ideal natural laboratories for exploring how plants influence microbial ecological patterns during wetland restoration. Most studies on wetland patch dynamics have relied on remote sensing to track landscape dynamics during succession [41,42]. Although recent studies have examined soil organic matter and microbial communities in newly formed wetlands created by coal-mining subsidence [43,44], comprehensive investigations of soil microbial composition, co-occurrence networks, assembly processes, and environmental drivers in response to plants in wetlands remain limited.
Given these research gaps, this study focuses on exploring the influence of plants on soil microbial ecological patterns and associated environmental drivers during wetland restoration. We selected four representative wetland sites, including three naturally successional wetlands (aged 2, 5, and 16 years) and one artificially managed wetland. Within each site, paired patches with and without plants were sampled. Soil samples were analyzed for physicochemical properties and microbial ecological patterns using high-throughput sequencing and bioinformatic analyses. We hypothesize: (1) plants significantly influence soil microbial ecological patterns, including community structure, diversity, co-occurrence networks, and assembly processes during wetland restoration; (2) the presence of plants mediate the relationship between soil microbial communities and environmental factors.

2. Materials and Methods

2.1. Study Area Description, Experimental Design and Soil Sampling

The study was carried out in a representative plain coal-mining region located in Jining City, Shandong Province, northern China (116.65°–117.04° E, 34.89°–35.53° N) (Figure S1). The region has a silty loam soil texture and experiences a temperate monsoon climate, with yearly averages of 777.1 mm precipitation and 14.1 °C temperature. Due to extensive coal mining, ground subsidence occurred, leading to water accumulation and the formation of wetlands. Before subsidence, the area was used for continuous crop rotation and exhibited low environmental heterogeneity. Four representative wetlands were selected for this study, including three naturally successional wetlands (aged 2, 5, and 16 years) and one artificially managed lake wetland (managed form 2019). All four wetlands were formed as a result of coal-mining subsidence. The three naturally successional wetlands have not been subjected to human disturbance, while the artificially managed lake wetland has undergone soil and water regulation and plant management. The subsidence time and management methods were determined based on documented records and remote sensing images. Each wetland was divided into patches with and without plants. The areas with plants were dominated by typical wetland plant species such as reeds (Phragmites australis) and cattails (Typha orientalis). These wetlands provided an ideal setting to investigate the effects of plants on soil microbial communities across different states of wetland formation and restoration (Figure S2).
Soil samples were collected in July 2023. At each of the four wetland sites, five 1 × 1 m plots were established in both the areas with plants and adjacent (5 m) areas without plants. A five-point approach was applied in every plot to collect surface soils (0–20 cm), which were then pooled and homogenized into one composite sample. In total, 40 soil samples were obtained, comprising 20 from areas with plants and 20 from areas without plants. Each collected sample was separated into two parts: one applied to physicochemical properties measurements and the other to microbial community sequencing. Simultaneously, aluminum boxes with a defined volume and weight were employed to collect soil samples in each plot to determine soil moisture content and BD. All samples were immediately stored in insulated boxes with ice packs at 4 °C and delivered to the laboratory for subsequent analyses.

2.2. Soil Physicochemical Analysis

Firstly, all fresh soil samples were sieved using 2-mm nylon sieve to eliminate visible plant and animal debris. After sieving, part of the fresh soil was subjected to direct testing, while the rest was air-dried under room temperature. Fresh soil and potassium chloride (KCl, 2M) solution (mass to volume = 1:4) was extracted to determine total phosphorus (TP), nitrate nitrogen (NO3-N), and ammonium nitrogen (NH4+-N) using continuous flow auto-analyzer (Scalars San++, Skylar Analytical B.V., Breda, The Netherlands). After mixing air-dried soil and deionized water at 1:2.5 and 1:5 ratios, pH and electrical conductivity (EC) were measured with the pH meter (PHS-3E; Shanghai INESA, Shanghai, China) and conductivity meter (DDS-307A; Shanghai INESA, Shanghai, China), respectively. Soil cation exchange capacity (CEC) was determined after adding [Co(NH3)6]Cl3 (1.66 cmol/L) to air-dried soil, shaking and centrifugation based on spectrophotometric method. In addition, the aluminum boxes were oven-dried to stable weight to calculate moisture and BD based on cutting ring method.
Air-dried soil was finely ground for total nitrogen (TN) determination and treated with 0.5 M HCl to remove inorganic carbon prior to soil organic carbon (SOC) measurement. Determination of the contents of TN and SOC was conducted with an elementary analyzer (Vario EL III, Elementar Analysensysteme, Langenselbold, Germany). The separation of particulate organic carbon (POC), heavy POC (HPOC), and mineral-associated organic carbon (MAOC) was based on a combined method of density and particle size. Air-dried soil (10 g) was placed into 50 mL sodium iodide (NaI, 1.6 g cm−3), treated with ultrasound (60 J cm−3), centrifuged (1800× g). After filtering the supernatant, POC (<1.6 g cm−3) was obtained on GF/C filter membrane. After washing the NaI in pellet with deionized water (no white precipitation after silver nitrate was added), the washed soils were then separated with a 53 μm sieve. The residual soils on the sieve were heavy POC (>53 μm) and the soils that passed through the sieve were MAOC (<53 μm). Finally, after soils were oven-dried at 60 °C to a constant weight, the contents of POC, heavy POC, and MAOC were quantified using elementary analyzer (Vario EL III, Elementar Analysensysteme, Langenselbold, Germany) [45,46].
The contents of bacterial necromass carbon (BNC) and fungal necromass carbon (FNC) in soil were determined using the amino sugars (ASs) method, as ASs are specifically associated with microbial necromass and occur at minimal levels in plant materials [47,48]. ASs included muramic acid (MurA), glucosamine (GlcN), and galactosamine (GalN). The extraction and measure methods were according to previous description [43]. Finally, the values of MNC and FNC were calculated as: FNC = (GlcN/179.17 2 × MurA/251.3) × 179.17 × 9 and BNC = MurA × 45.

2.3. Soil Extracellular Enzyme Activities Analysis

Soil extracellular enzyme activities (EEAs) involved in the carbon cycle (β-1,4-glucosidase [BG]), the nitrogen cycle (β-1,4-N-acetylglucosaminidase [NAG] and leucine aminopeptidase [LAP]) and the phosphorus cycle (acid phosphatase [AP]) were determined using fluorescence method [49,50]. In summary, fresh soil (2.75 g) was placed in a 150 mL beaker and mixed with sodium acetate buffer (91 mL). The mixture was magnetically stirred for 1 min to prepare a soil suspension. Aliquots of the soil suspension and corresponding fluorogenic substrates were dispensed into black 96-well microplates without enzymes. A blank control was prepared by replacing the soil suspension with deionized water. Details of the fluorogenic substrates are provided in Table S1. Standard curves were generated using 100 μM solutions of 4-methylumbelliferone (MUB) for BG, NAG, and AP, and 7-amino-4-methylcoumarin (MUC) for LAP. For every sample, standard point, and blank control, four replicates were included. The plates were incubated at 25 °C for 3 h, after which 5 μL of 1 M sodium hydroxide solution was added to each well to terminate the reaction. Fluorescence intensity was recorded on a multimode microplate reader (EnSpire, PerkinElmer, Shelton, CT, USA) at 365 nm excitation and 450 nm emission.

2.4. Microbial DNA Extraction, PCR Amplification, Absolute Quantitative Sequencing and Data Processing

DNA extraction from 40 fresh soil samples was performed using the FastDNA® Spin Kit (MP Biomedicals, Santa Ana, CA, USA) under the manufacturer’s recommended protocol. A NanoDrop One Spectrophotometer (Thermo Fisher Scientific, Waltham, MA, USA) was used to assess DNA purity and concentration. Prior to amplification, synthetic spike-in standards were added to each DNA sample to enable absolute quantification of gene copy numbers [51]. Primer pair 515F (5′-GTGCCAGCMGCCGCGG-3′) and 907R (5′-CCGTCAATTCMTTTRAGTTT-3′) were used to amplify V4–V5 regions of the bacterial 16S rRNA gene and spike-ins. Primer pair ITS1 (5′-CTTGGTCATTTAGAGGAAGTAA-3′) and ITS2 (5′-GCTGCGTTCTTCATCGATGC-3′) was used to amplify ITS1 region of the fungal internal transcribed spacer (ITS) gene and spike-ins. Each PCR reaction was carried out in a 10 μL mixture consisting of 1 μL 10× TopTaq Buffer, 0.8 μL dNTPs (2.5 mM), 0.2 μL of each primer (10 μM), 0.2 μL TopTaq DNA Polymerase (Qiagen GmbH, Hilden, Germany), 1 μL template DNA, and nuclease-free water to reach the final volume. PCR amplification was conducted on an ABI 2720 Thermal Cycler (Thermo Fisher Scientific, USA) under the following program: initial denaturation at 94 °C for 2 min, followed by 20–23 cycles (for bacteria) or 26 cycles (for fungi) of denaturation at 94 °C for 30 s, annealing at 55 °C for 30 s, and extension at 72 °C for 1 min, with a final extension at 72 °C for 10 min. Sequencing of PCR products was performed on the Illumina NovaSeq platform (Illumina, San Diego, CA, USA) with a paired-end (2 × 250 bp) strategy.
QIIME2 [52] was employed to process raw sequencing data for quality control, statistical analysis, and taxonomic annotation. The “cutadapt” plugin was used to remove adapter sequences and primers. The “DADA2” plugin was applied to quality-filter, dereplicate, denoise, merge reads, remove chimeras, and assign amplicon sequence variants (ASVs) [53]. Bacterial ASVs were classified through the SILVA rRNA database (138.2) [54], and fungal ASVs were classified through the UNITE database (9.0) [55]. Absolute copy numbers of selected ASVs were calculated based on standard curves generated from spike-in controls. To ensure analytical robustness, bacterial ASVs detected in fewer than 15% of samples and fungal ASVs detected in fewer than 10% of samples were excluded from downstream analyses. Rarefaction curves and ASV accumulation boxplots indicated that the remaining samples were sufficient to capture the majority of microbial diversity (Figures S3 and S4). Finally, 6442 bacterial ASVs and 2156 fungal ASVs were retained for further analysis.

2.5. Data Analyses

All data analyses and visualizations were conducted using R v4.4.3. The calculation of microbial α-diversity, β-diversity and the redundancy analysis (RDA) were performed using the “vegan” v2.6-4 package. The richness and Shannon indices were used to represent microbial richness and diversity, respectively. β-diversity was evaluated based on Bray-Curtis distance. Principal coordinates analysis (PCoA) was conducted at the ASV level to assess microbial community dissimilarity (based on Bray-Curtis distance) in areas with and without plants across four wetlands with different states. Permutational multivariate analysis of variance (PERMANOVA) was used for significance testing. Mantel tests were applied to determine which environmental factors shaped microbial community composition. Linear regression models were constructed to explore the association between environmental dissimilarity (Euclidean distance of soil physicochemical properties) and microbial similarity (1–Bray-Curtis dissimilarity). Piecewise structural equation modeling (SEM) was conducted with “piecewiseSEM” v2.3.0.1 package [56] to evaluate the impacts of wetland states, soil physicochemical parameters, soil nutrients, and microbial diversity on soil EEAs. Soil physicochemical parameters included pH, EC, moisture, BD, and CEC. Nutrient parameters included TP, TN, NH4+-N, NO3-N, SOC, BNC, FNC, HPOC, POC, and MAOC. Microbial diversity variables (richness and Shannon indices) included both bacterial and fungal communities. Microbial community assembly processes were inferred using a null model approach. The quantifying assembly processes based on entire-community null model analysis (QPEN) was employed to estimate the importance of deterministic processes (heterogeneous selection and homogeneous selection) and stochastic processes (dispersal limitation, homogeneous dispersal, and drift) using the “iCAMP” v1.5.1 package [57].
To examine microbial co-occurrence patterns, the “ggClusterNet” v0.1.0 package [58] was used to calculate topological characteristics of networks, and Gephi software v0.10 was employed for visualization. To reduce false positives, only ASVs occurring in over 30% of samples were retained. Spearman correlation analyses (p < 0.01) were used as the basis for building the networks. The correlation coefficient (ρ) threshold was set at 0.9 for bacteria and 0.8 for fungi. In the networks, ASVs were treated as nodes and their significant correlations as edges. Average degree refers to the average number of connections per node. Average path length indicates the mean distance between nodes. Betweenness centralization reflects the extent to which certain nodes act as intermediaries within the network. High modularity values and a greater number of modules suggest stronger network compartmentalization. Network robustness was evaluated by randomly removing 50% of the nodes (ASVs) and repeating this process 100 times.

3. Results

3.1. Microbial Composition and Structure in Areas with and Without Plants

A total of 58 bacterial phyla and 15 fungal phyla were detected from our samples. The dominant bacterial phyla (with relative abundance > 5%) included Pseudomonadota (24.27%), Chloroflexota (16.35%), Acidobacteriota (11.70%), Bacillota (9.19%), Actinomycetota (8.89%), Thermodesulfobacteriota (5.47%) and Bacteroidota (5.10%) (Figure 1a). The dominant fungal phyla (with a relative abundance > 5%) included Ascomycota (44.79%), Rozellomycota (28.89%), Chytridiomycota (6.57%) and Basidiomycota (5.58%) (Figure 1b). In terms of both absolute copies and relative abundance, the dominant bacterial and fungal phyla were consistent between areas with and without plants. Although over 98% of the ASVs were shared between the two areas (Figure S5), their abundance varied. The Manhattan plot showed that 80 bacterial ASVs and 12 fungal ASVs significantly (p < 0.05) shifted between areas with and without plants (Figure S6). In areas with plants, the number of enriched ASVs was fewer than the number of depleted ASVs for both bacteria and fungi. Specifically, 24 bacterial and 5 fungal ASVs were enriched, while 56 bacterial and 7 fungal ASVs were depleted in areas with plants. Among these, the phylum with the most variable bacterial ASVs was Chloroflexota (17 ASVs), and for fungi, Chytridiomycota (4 ASVs). Overall, both bacterial and fungal α-diversity and β-diversity showed no significant differences between areas with and without plants, although a general decreasing trend in α-diversity in areas with plants was observed (Figures S7 and S8).
The results of PCoA with PERMANOVA showed that microbial community structure differed significantly (p < 0.001) among the four wetlands states in both areas with and without plants. In addition, the plants increased (R2: 0.72 > 0.69, p < 0.001) the effects of wetland states on bacterial community structure, while it slightly reduced (R2: 0.51 < 0.53, p < 0.001) the effects on fungal community structure (Figure 1c,d).

3.2. Co-Occurrence Network Structure and Stability

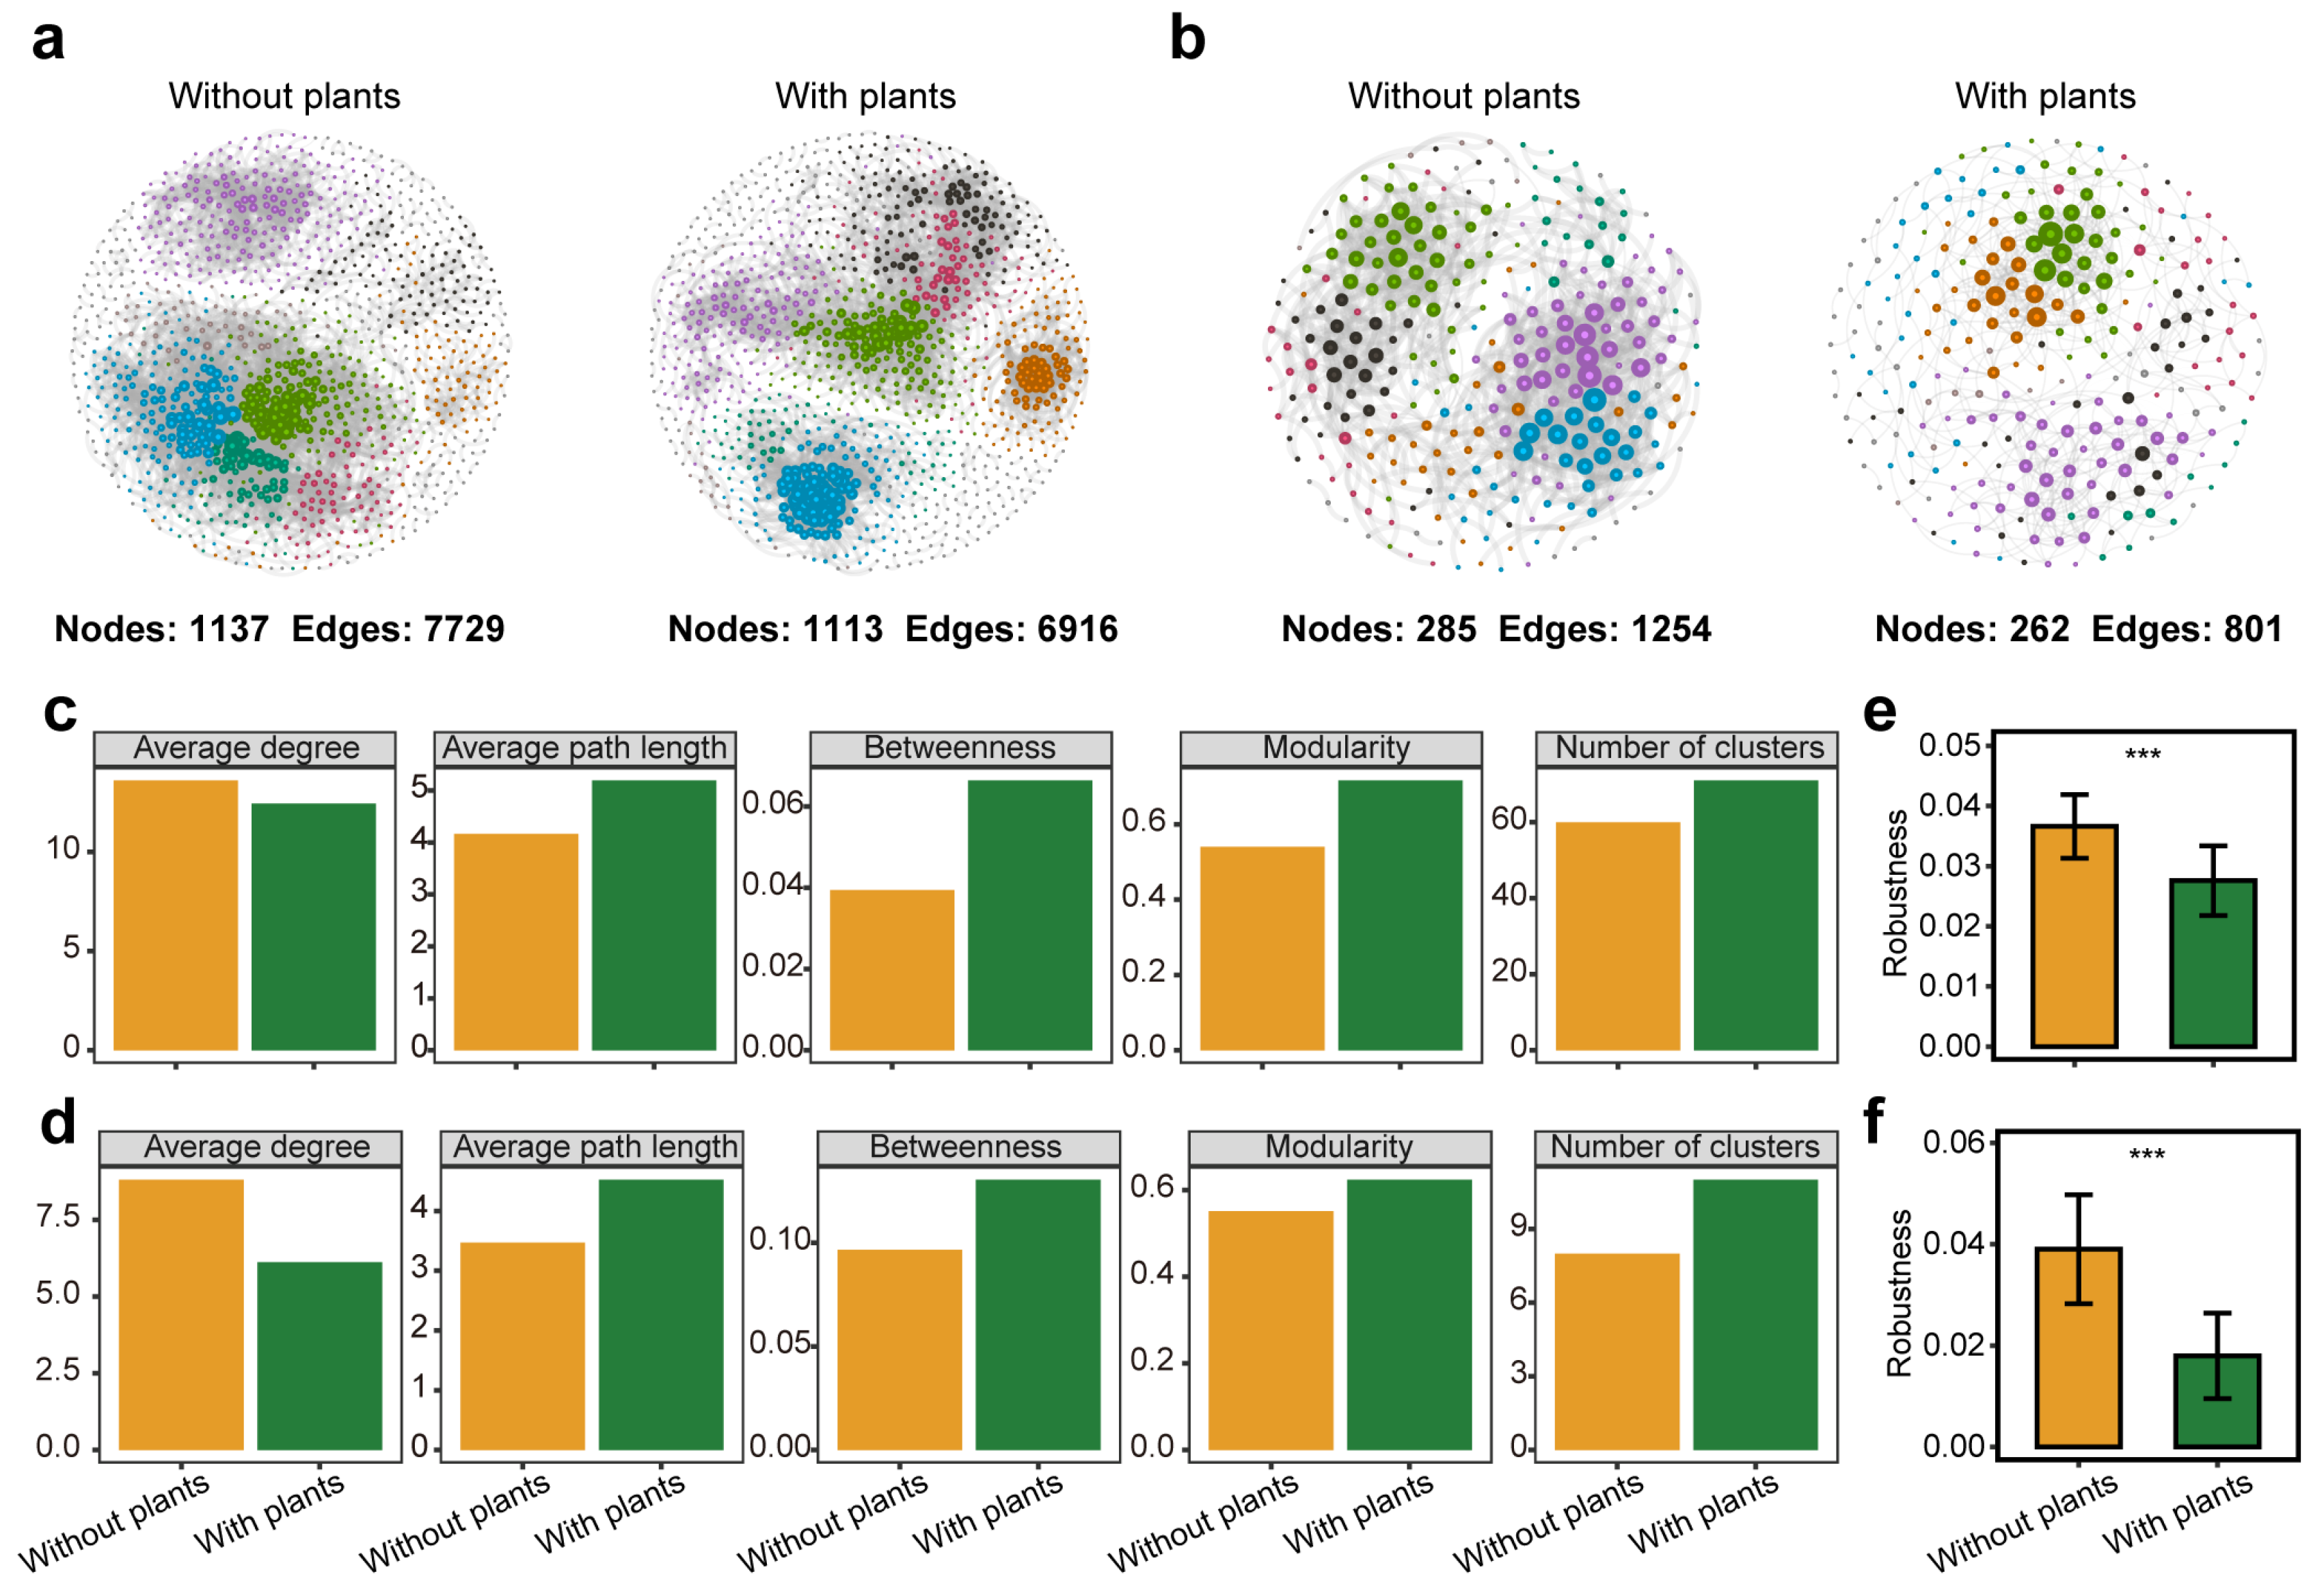
Microbial co-occurrence networks were constructed to compare bacterial and fungal community complexity and stability between areas with and without plants (Figure 2a,b). All co-occurrence networks were non-random and followed a scale-free structure, characterized by a power-law distribution of node degrees (R2 > 0.9) (Figure S9). In areas with plants, microbial networks exhibited higher levels of centralization, modularization and differentiation, as indicated by higher betweenness, modularity and number of clusters. Additionally, microbial networks had longer average path length and lower average degree in areas with plants (Figure 2c,d). Network robustness analysis revealed that networks in areas without plants were more stable than those in areas with plants after the random removal of 50% of ASVs (Figure 2e,f). Notably, bacterial and fungal networks exhibited similar trends across all metrics.

3.3. Microbial Community Assembly Mechanisms

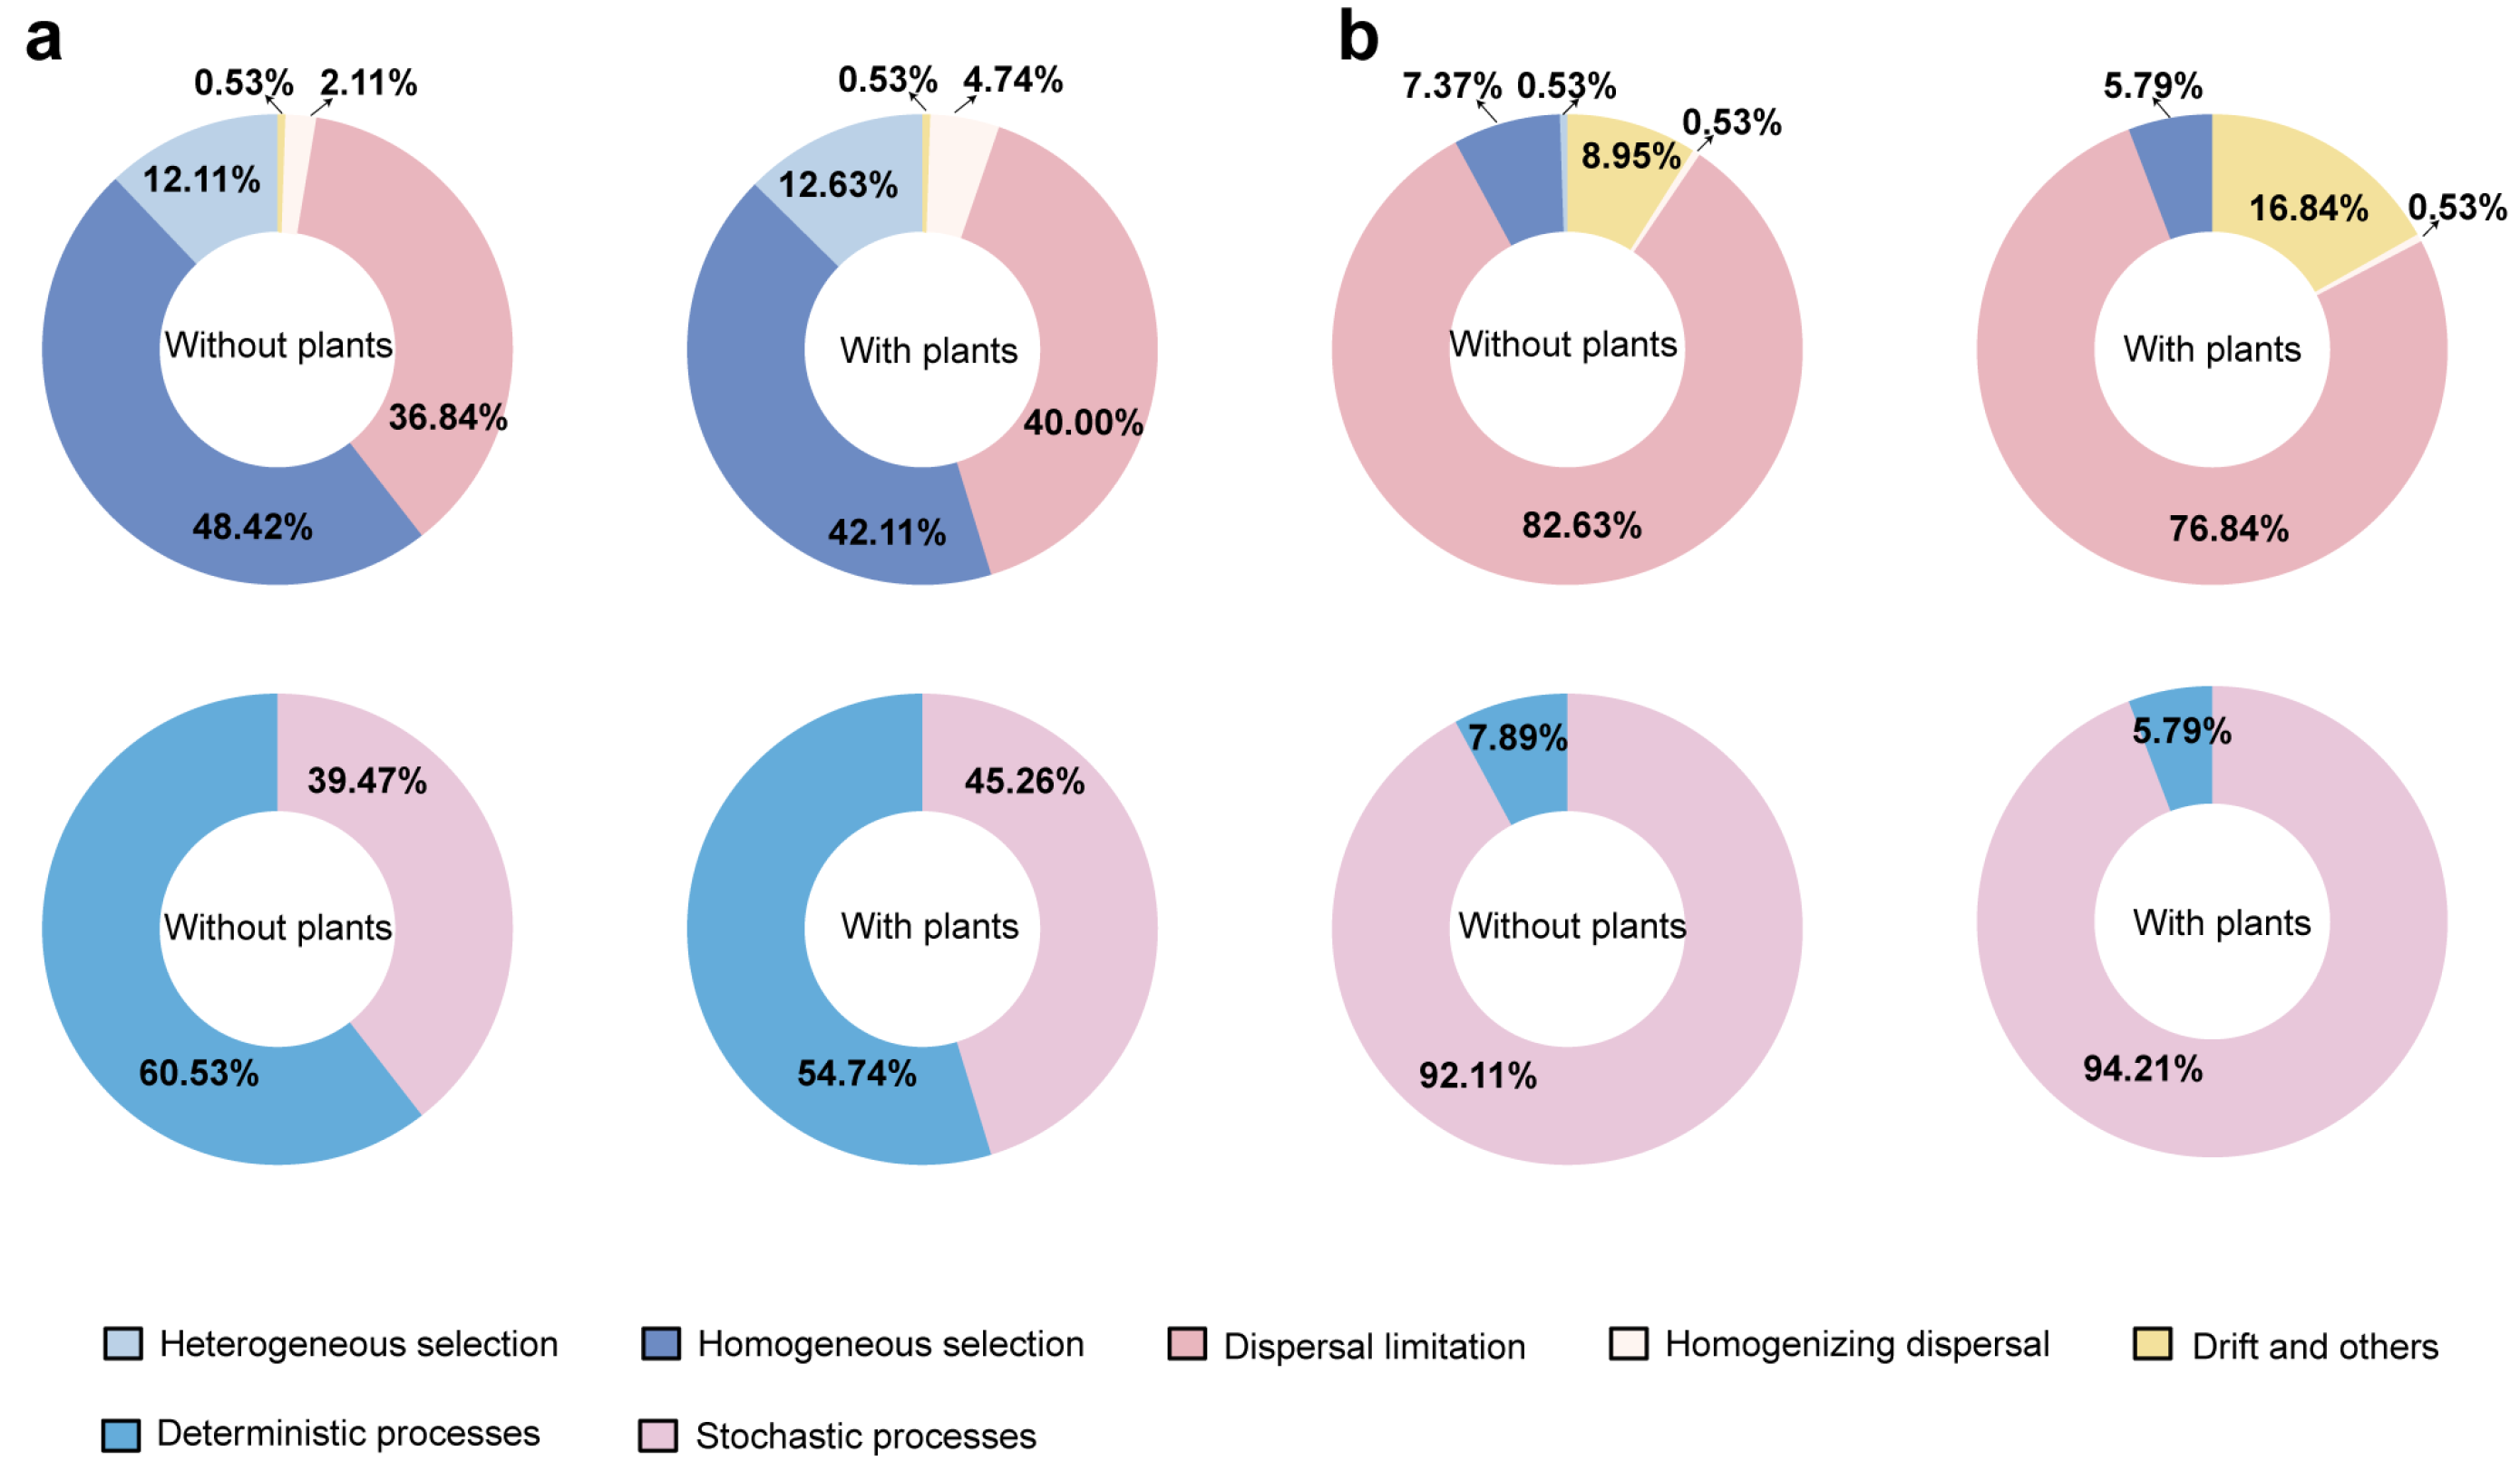
The iCAMP models were constructed to assess the relative contributions of stochastic (neutral-based) and deterministic (niche-based) processes on microbial community assembly (Figure 3). The results showed that the stochastic processes exerted a greater effect on both bacterial and fungal communities in areas with plants compared to areas without plants (Figure 3a,b). In general, deterministic processes primarily governed bacterial community assembly, whereas stochastic processes played the main role in shaping fungal communities. Notably, homogeneous selection accounted for the largest proportion (48.42% in areas without plants and 42.11% in areas with plants) of bacterial community assembly. Dispersal limitation accounted for the largest proportion (82.63% in areas without plants and 76.84% in areas with plants) of fungal community assembly.

3.4. Environmental Factors Affecting Microbial Communities and Extracellular Enzyme

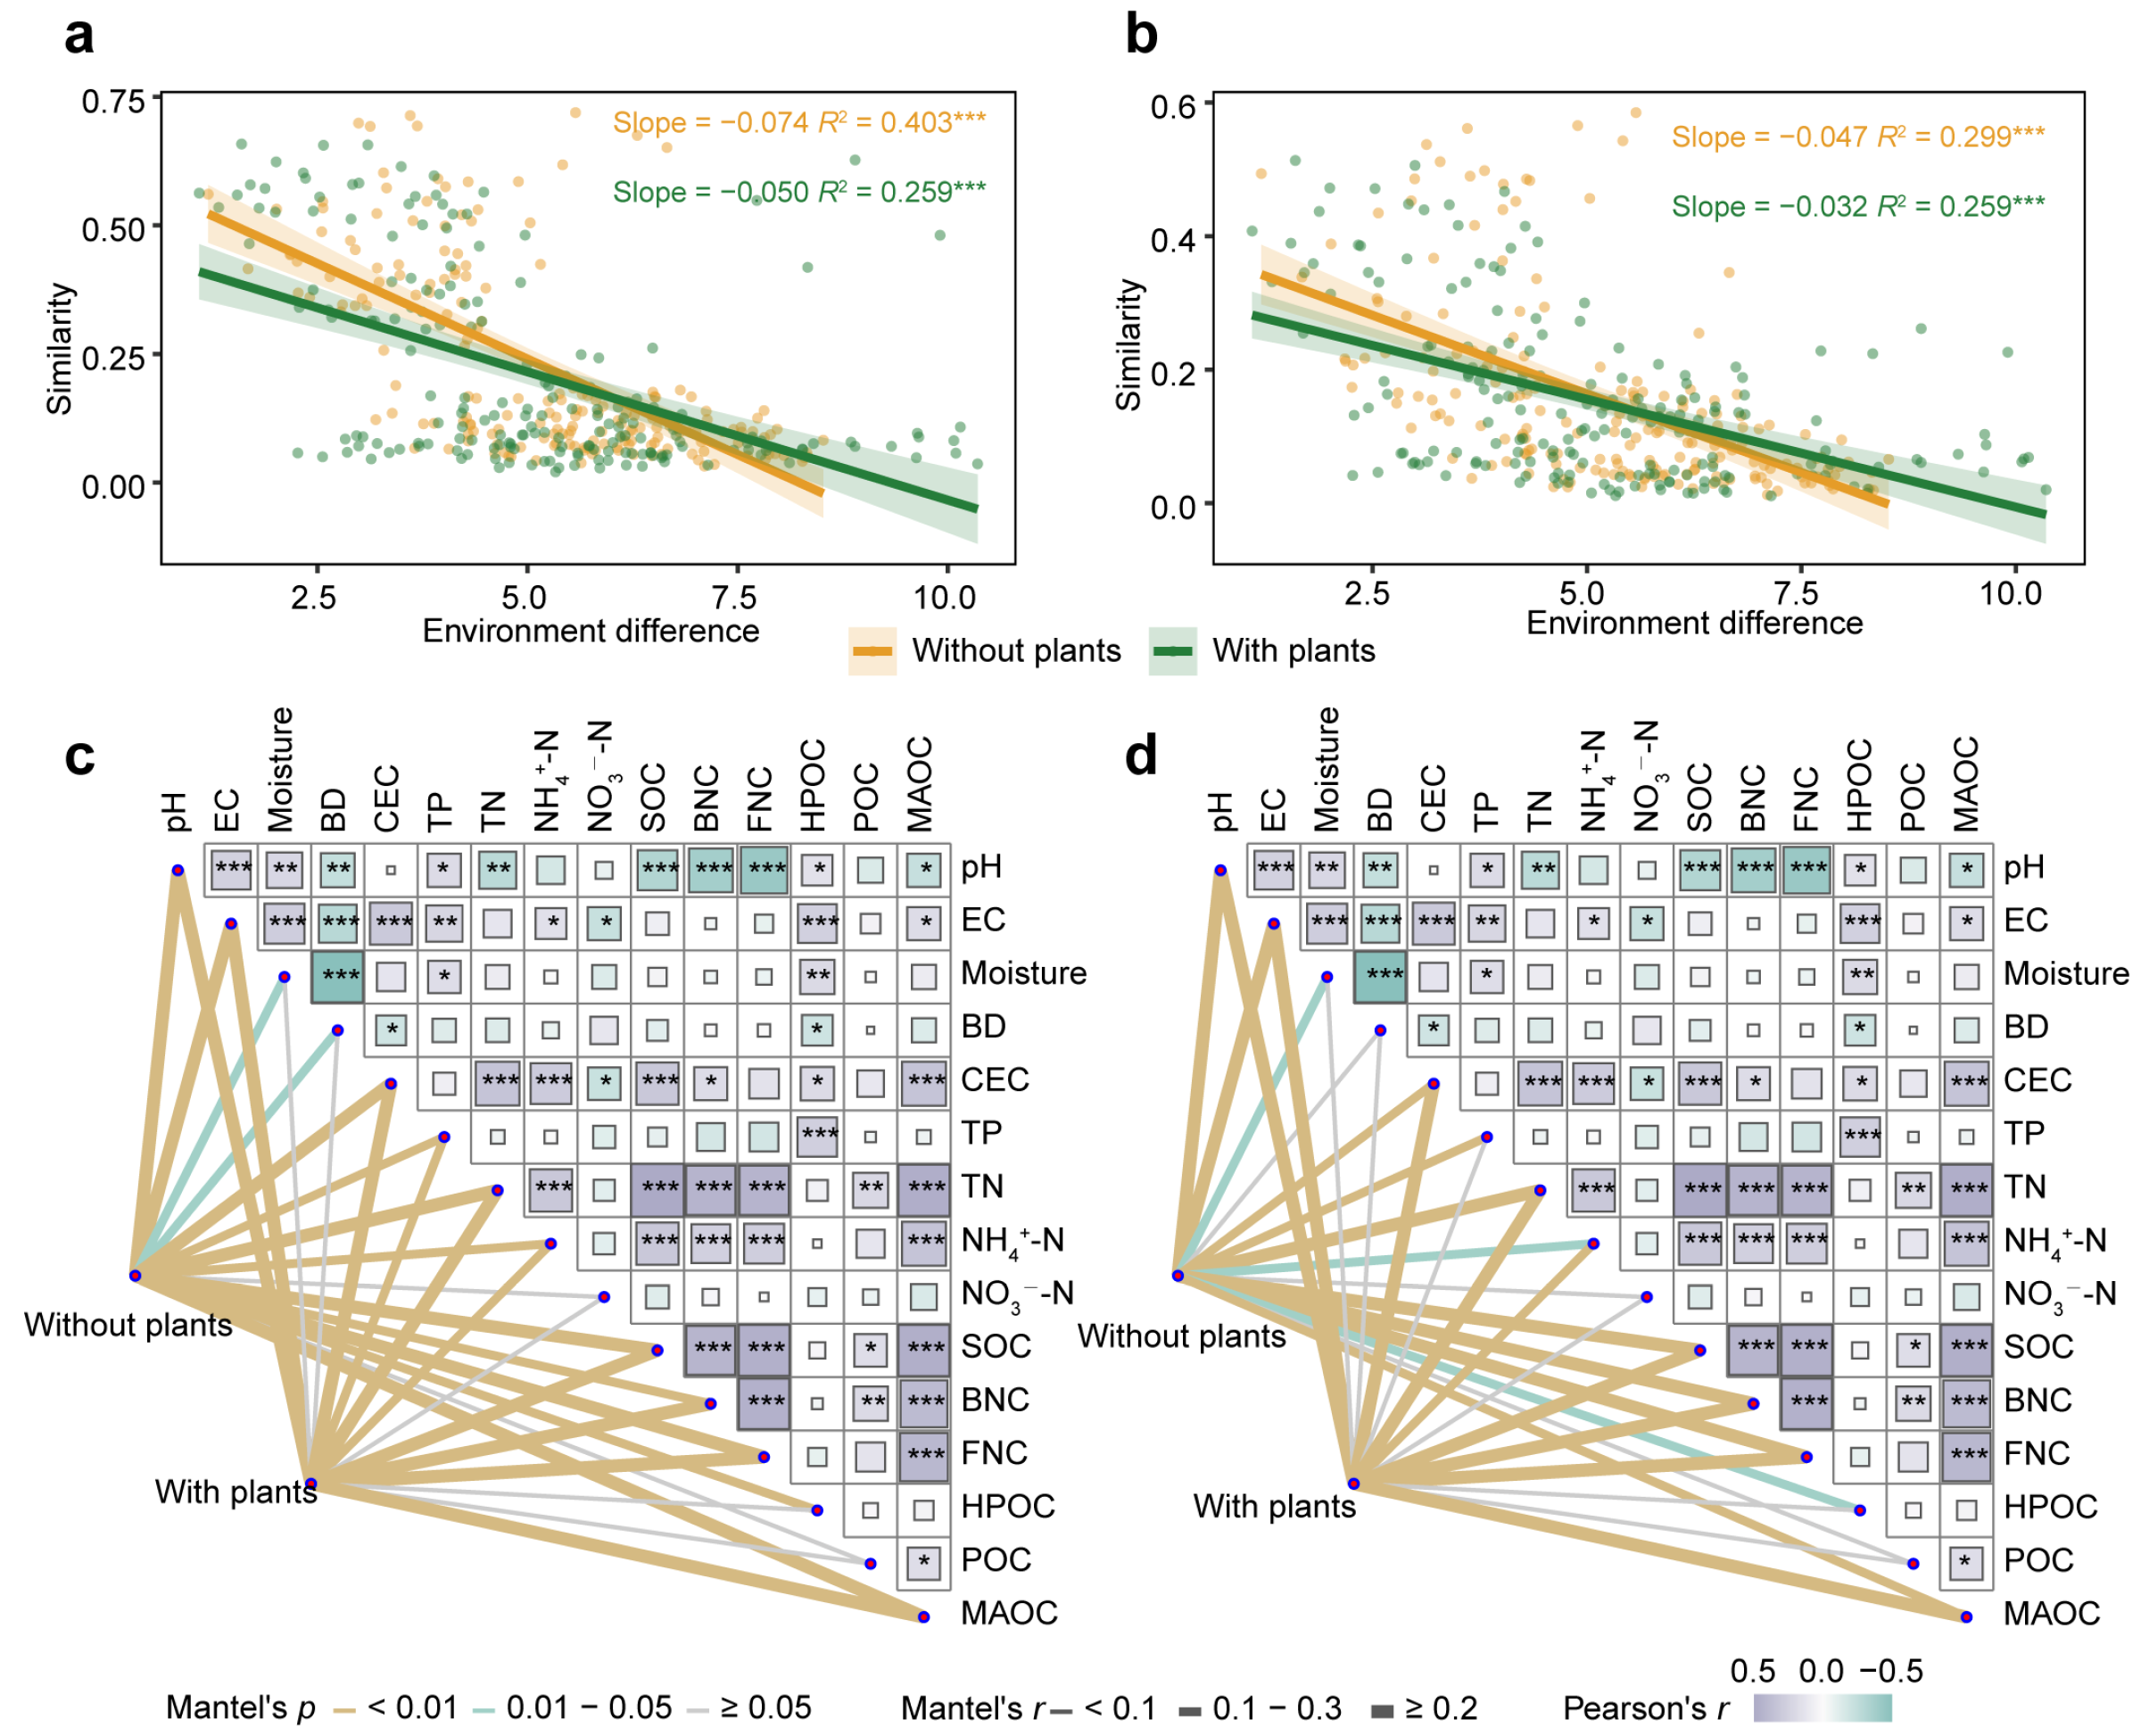
To compare the environmental factors driving microbial communities in areas with and without plants, linear regression models were constructed between environmental differences and microbial similarity (Figure 4a,b). Environmental factors significantly (p < 0.001) affected microbial communities, where greater environmental differences corresponded to lower microbial similarity. Compared with the areas with plants, both bacterial community (slope: −0.074 < −0.050) and fungal community (slope: −0.047 < −0.032) in areas without plants were more affected by environmental variation. Mantel test results further confirmed this pattern, indicating that environmental drivers exerted greater effects on microbial communities in areas without plants than areas with plants (Figure 4c,d). Specifically, moisture, BD and HPOC significantly (p < 0.05) affected bacterial communities only in areas without plants. Moisture, TP and HPOC significantly (p < 0.05) affected fungal communities only in areas without plants.
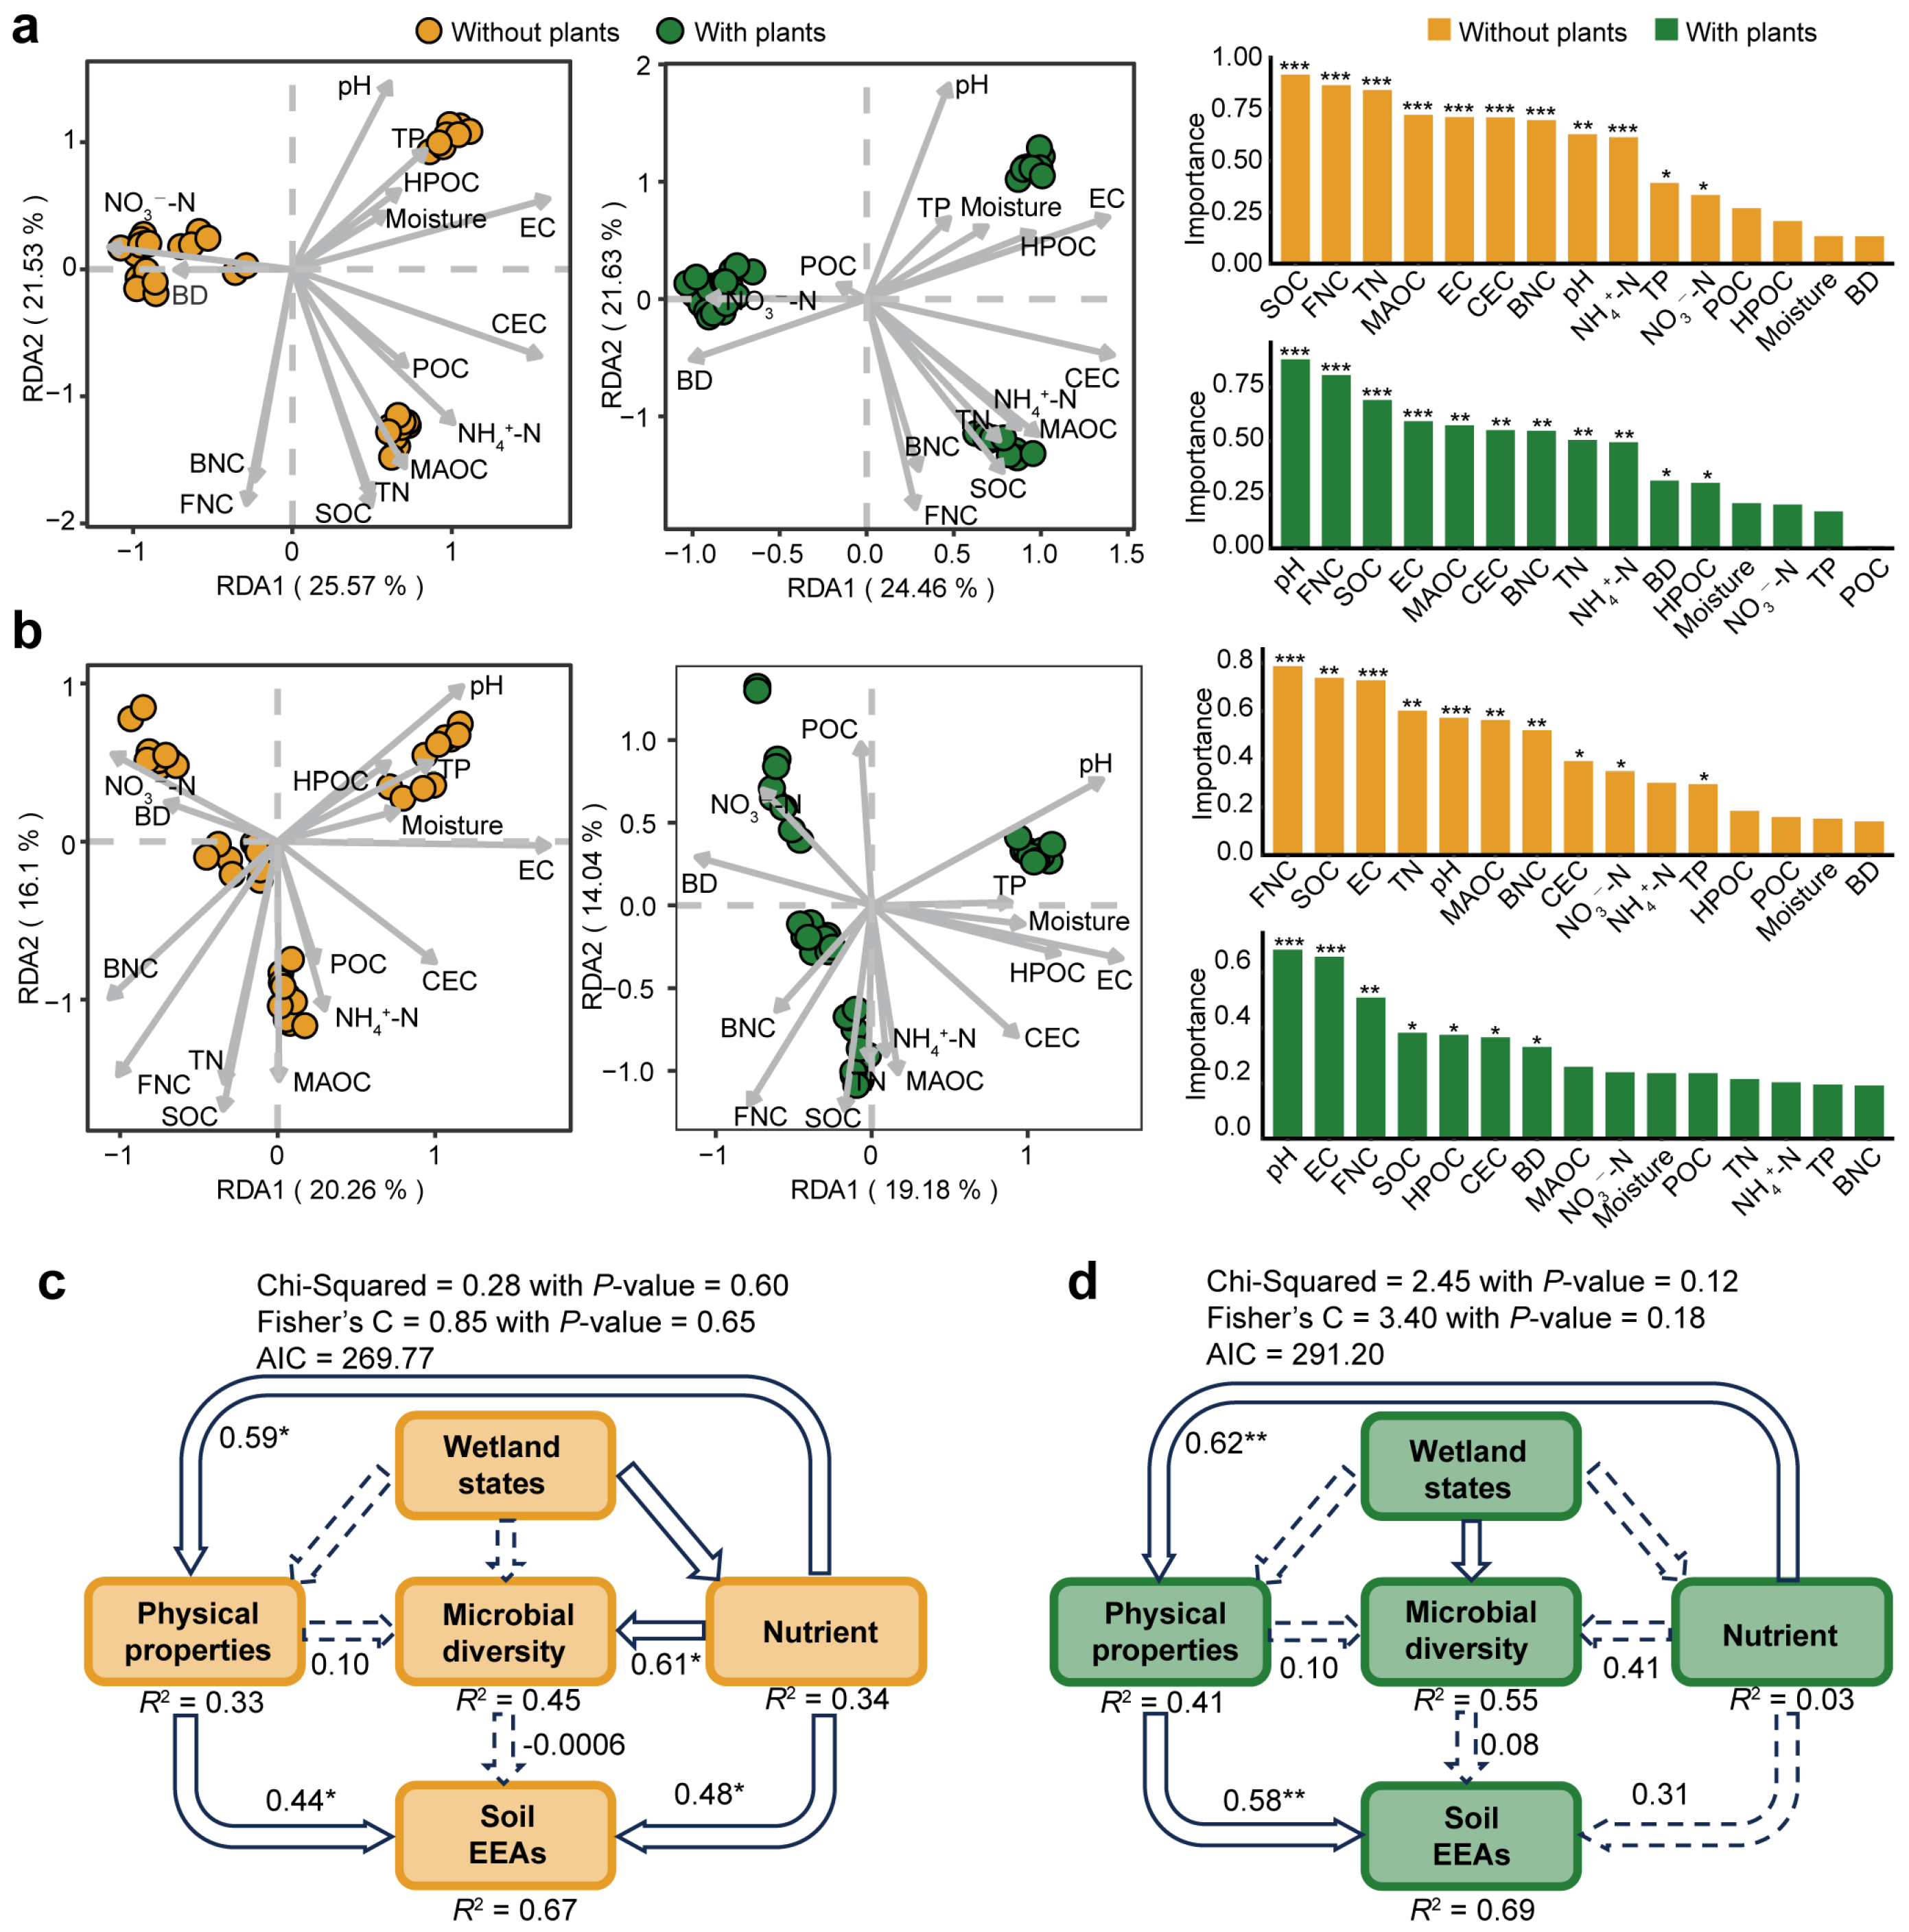
We further investigated the relative importance of environmental drivers on microbial communities and potential functions in areas with and without plants (Figure 5). The results of RDA revealed that pH was the most influential environmental variable for bacterial and fungal communities in areas with plants. However, in areas without plants, SOC and FNC were the most influential environmental variables for bacterial and fungal communities, respectively (Figure 5a,b). In addition, structural equation models were constructed to compare the influence of wetland states, soil physical properties, nutrients and microbial diversity on soil EEAs in both areas with and without plants (Figure 5c,d). Similarly to soil microbial community patterns, soil EEAs in areas without plants was more influenced by environmental drivers than in areas with plants. In areas without plants, soil EEAs was significantly affected by physical properties (R2 = 0.44, p < 0.05) and soil nutrients (R2 = 0.48, p < 0.05). By contrast, in areas with plants, soil EEAs was significantly associated only with soil physical properties (R2 = 0.58, p < 0.01). Additionally, microbial diversity in areas without plants was significantly (R2 = 0.61, p < 0.05) affected by soil nutrient levels.

4. Discussion

4.1. Variations in Soil Microbial Community Characteristics Under the Presence of Plants

Characterizing the dynamics of microbial community structure is essential for understanding ecological succession and guiding wetland restoration management [22,59]. In this study, plants increased the dissimilarity of bacterial community structures based on Bray-Curtis distance among wetlands at different states (three naturally successional and one artificial states) (Figure 1c). This phenomenon may be related to increased inputs of labile carbon from plant root exudates and litter, which are considered a major driver of short-term dynamics in soil communities [60]. Labile compounds (e.g., organic acids and amino acids) can enhance microbial activity and turnover, thereby amplifying differences in community structure, which is called the “priming effect” [61,62]. However, a similar increase in community dissimilarity was not observed in fungal communities (Figure 1d), likely due to different survival strategies. Bacteria, which are generally r-strategy, are characterized by small size and high turnover rates, making them more sensitive to nutrient fluctuations. In contrast, fungi are typically K-strategy, exhibiting slower growth and greater resistance to environmental change. Similar findings have been reported in other studies on newly formed wetland succession and plant succession [44,63]. In our study, the dominant fungal phyla (Ascomycota, Rozellomycota, Chytridiomycota, and Basidiomycota) all include saprotrophic taxa (Figure 1b). Compared with bacteria, saprotrophic fungi are less sensitive to highly labile plant-derived carbon, but play important roles in the decomposition of recalcitrant soil carbon [64]. This functional distinction further supports the observed differences in bacterial and fungal community responses to wetland states. Moreover, fungi are known to be more tolerant than bacteria to environmental fluctuations [65]. This trend is consistent with our findings, which showed that environmental variables had greater impact on bacterial communities than on fungal communities in both areas with and without plants (Figure 4).
In this study, bacterial and fungal α-diversity and β-diversity showed no significant differences between areas with and without plants, which was inconsistent with our hypothesis (Figures S7 and S8). A previous meta-analysis suggested that plants generally reduce microbial diversity by selectively enriching specific taxa from the bulk soil species pool. However, this varies depending on ecosystem and plant types [18]. In contrast, a study in saline coastal soil found that plant-derived organic matter inputs can enhance microbial diversity [66]. These contrasting findings highlight that the influence of plants on the soil microbiome is highly context-dependent, shaped by both plant traits and environmental conditions [67]. In our study, the lack of significant diversity differences may reflect a balance between plant-driven selection and increased organic matter availability. Specifically, frequent hydrological fluctuations in wetland environments likely homogenize environmental conditions between areas with and without plants, thereby reducing plant-mediated selection pressure. Moreover, wetlands are naturally rich in organic matter [68], suggesting that nutrient availability is not a limiting factor for microbial growth and thereby diminishing the impact of additional plant-derived inputs. Additionally, the lack of diversity changes may be partially attributed to the dominance of a single plant species within the system. Numerous studies have highlighted that plant diversity, rather than plant presence alone, has a pivotal role in enhancing microbial diversity, ecosystem functions, and soil health [17,69,70]. Therefore, effective restoration strategies for wetlands should place greater emphasis on selecting diverse plant species.

4.2. Ecological Processes Regulating Soil Microbial Communities

Deciphering the mechanisms that drive community assembly processes remains a core theme in ecological research [71]. Microbial community assembly is jointly regulated by both abiotic influence (e.g., environmental filtering) and biotic influence (e.g., microbial competition and cooperation) [72]. As we hypothesized, the presence of plants altered microbial community assembly, as evidenced by the increased contribution of stochastic processes in areas with plants (Figure 3). Our results suggest that the increase due to two factors: a weakened environmental selection effect and reduced microbial interspecific interactions. Specifically, the correlation between environmental dissimilarity and microbial similarity showed that microbial communities in areas without plants were more strongly structured by environmental conditions than those in areas with plants (Figure 4 and Figure 5). Meanwhile, ecological network analysis indicated that microbial co-occurrence networks in areas without plants were more complex, suggesting stronger microbial interactions (Figure 2). These results collectively indicate a shift toward stochastic processes in areas with plants. Additionally, plants provide diverse ecological niches [73], which may promote ecological drift, particularly in fungal communities (Figure 3b), thereby strengthen the contribution of stochastic processes to fungal assembly. In both areas with and without plants, deterministic processes predominated in bacterial community assembly, whereas stochastic processes predominated in fungal community assembly (Figure 3), which was also observed in forest ecosystems [74]. This discrepancy likely reflects differences in ecological strategy. Bacteria (r-strategy) exhibit faster growth rates and more rapid responses to environmental changes (Figure 4), which make them more susceptible to environmental filtering [75,76]. However, ecosystem context also plays a crucial role. For example, in lake ecosystems impacted by cyanobacterial harmful algal blooms, both bacterial and fungal communities are largely governed by stochastic processes, although their assembly dynamics vary temporally [30]. Indeed, numerous studies have demonstrated that the balance between deterministic and stochastic processes in microbial community assembly varies across ecosystem types and spatial scales [77,78]. Therefore, improving our understanding of microbial assembly mechanisms under different ecological and plants contexts is essential for informing ecosystem management strategies. Overall, our findings provide theoretical support for guiding the restoration and plant-microbe based management of newly formed wetlands through targeted soil microbial community reconstruction.
Microbial co-occurrence networks not only help predict community assembly processes, but also reveal complex interactions (including competition, cooperation, and mutualism) that underpin ecosystem functioning [79,80]. Here, microbial ecological networks in areas without plants were more complex and stable than those in areas with plants (Figure 2). We propose two possible explanations for this pattern. Firstly, in areas without plants, the absence of relatively stable fresh carbon inputs from plants may necessitate stronger microbial interactions (evidenced by higher average degree, lower average path length, and lower betweenness) to maintain ecological functioning and optimize resource use. Although the carbon content was not significantly different between the two area types, all carbon-related indicators (SOC, BNC, FNC, HPOC, POC, and MAOC) showed increasing trends in areas with plants (Figure S10). Furthermore, RDA results revealed that carbon availability was the key environmental factor influencing microbial communities in areas without plants, whereas pH was the dominant driver in areas with plants (Figure 5a,b). This indirectly suggests that carbon availability plays a central role in shaping microbial networks in areas without plants. Secondly, the reduced network complexity observed in areas with plants may be associated with the declining trend in microbial α-diversity (Figure S7) [81]. In areas with plants, plants may selectively enhance specific microbial taxa and interactions, contributing to higher modularity and a greater number of network clusters [24]. Despite higher modularity, microbial networks in areas with plants were less stable (Figure 2c–f), likely due to the high temporal dynamics of the rhizosphere [82]. Importantly, the influence of plants on microbial networks is highly dependent on ecosystem type and soil conditions [25]. For instance, a study in alpine grasslands found that plant diversity exerted stronger effects under low drought conditions, whereas plant biomass had a greater influence under high drought stress [83]. These findings underscore that effective plant management in wetland restoration requires careful consideration of both soil background and climatic context.

4.3. Environmental Factors Affecting Soil Microbial Communities

Soil physicochemical properties are key environmental factors that directly affect microbial communities, influencing their structure, assembly processes, and co-occurrence patterns [84,85]. In line with our hypothesis, the presence of plants mediate the effects of environmental factors on microbial communities. Results from both Mantel tests and linear regression models indicated that microbial communities were more tightly linked to environmental variables in areas without plants than in areas with plants (Figure 4). This difference may be attributed to the ability of plants to modify their surrounding soil microenvironment via root exudation. Such modifications can buffer environmental fluctuations and mediate microbe–soil interactions [86]. In areas without plants, microbial communities are more directly exposed to external environmental conditions, making them more vulnerable to physicochemical changes. In addition, bacterial communities exhibited greater sensitivity to environmental variation compared to fungal communities (Figure 4a,b), likely due to differences in ecological strategies and functional traits. Fungi often form stable symbiotic relationships with plants, providing them with increased resilience to environmental disturbances [63,74]. Meanwhile, bacteria typically function as pioneer species with r-strategist traits, which are characterized by rapid growth and high responsiveness to environmental changes. In contrast, fungi tend to follow a K-strategy that contributes to their stability under fluctuating conditions.
Numerous studies have demonstrated the significant influence of pH on soil microorganisms [87,88] and complex interactions between organic carbon and soil microorganisms [89,90], which is consistent with our findings (Figure 4c,d and Figure 5a,b). However, the role of pH and organic carbon differed between areas with and without plants. In areas with plants, pH was identified as the primary environmental driver of microbial community composition. In contrast, carbon availability was the dominant driver in areas without plants, with SOC exerting the greatest influence on bacterial communities and FNC being the most important driver for fungal communities (Figure 5a,b). This pattern may be explained by the continuous inputs of root exudates and litter in areas with plants, which alleviates carbon limitation and reduces the relative importance of carbon as an environmental factor [91]. SEMs further supported this trend for soil EEA, a key indicator of microbial functional potential [80,92]. In areas without plants, both soil physical properties and nutrient levels significantly influenced EEA, whereas in areas with plants, only physical properties showed significant effects (Figure 5c,d). Additionally, nutrient status was positively associated with soil microbial diversity only in areas without plants, suggesting that microbial communities in areas with plants are less limited by nutrient availability. Collectively, these findings highlight the importance of tailoring restoration strategies to local conditions in newly formed wetlands, taking into account plants, soil nutrient states, and their combined effects on microbial community structure and ecosystem functioning.

5. Conclusions

The study found that soil microbial communities in areas with plants exhibited less complex and stable ecological networks although diversity did not change significantly. Moreover, microbial community structure and functional potential (as indicated by soil EEAs) were less sensitive to environmental variation in areas with plants. This pattern also explains the enhanced role of stochastic processes on soil microbial communities in areas with plants, through both biotic (weaker ecological networks) and abiotic (weaker environmental filtering) mechanisms. Although environmental variability significantly altered microbial communities in both areas with and without plants, the dominant environmental drivers differed. In areas with plants, pH was the most influential factor, likely because organic matter was not a limiting resource. In contrast, in areas without plants, carbon-related factors (SOC for bacteria and FNC for fungi) played dominant roles, suggesting the complex interaction between microbial communities and organic carbon. Additionally, bacterial community assembly was more governed by deterministic processes and showed greater sensitivity to wetland states and environmental changes compared to fungi, likely due to differences in ecological strategies. Overall, this study highlights the response of soil microbial ecological patterns and environmental drivers to plants during the formation and restoration of wetlands. These findings provide new insights for developing plant-microbe-mediated strategies to support the ecological restoration and sustainable management of wetland ecosystems.

Supplementary Materials

The following supporting information can be downloaded at: https://www.mdpi.com/article/10.3390/w17213054/s1, Figure S1: Geographic location of study areas; Figure S2: Photographic overview of sampling areas. Figure S3: Rarefaction curves of observed bacterial ASVs reached the saturation stage with increase in sequencing depth in areas without (a) and with (b) plants. Bacterial ASVs accumulation boxplots reached the saturation stage with the increase number of samples in areas without (c) and with (d) plants. Figure S4: Rarefaction curves of observed fungal ASVs reached the saturation stage with increase in sequencing depth in areas without (a) and with (b) plants. Fungal ASVs accumulation boxplots reached the saturation stage with the increase number of samples in areas without (c) and with (d) plants. Figure S5: Upset plot showing bacterial (a) and fungal (b) species identified in areas with and without areas. Horizonal bar on left represents number of species identified in each group. Dots and lines represent subsets of species. Vertical histogram represents number of species in each subset. Figure S6: Manhattan plot showing the soil microorganisms enriched and depleted in areas with plants. Figure S7: Bacterial (a) and fungal (b) α-diversity in areas with and without plants. Figure S8: Bacterial (a) and fungal (b) β-diversity in areas with and without plants. Figure S9: Degree distribution of nodes of bacterial co-occurrence network in areas without (a) and with (b) plants, and fungal co-occurrence network in areas without (c) and with (d) plants. *** p < 0.001. Figure S10: Soil physicochemical properties in areas with and without plants. Table S1: Substrate information for soil extracellular enzyme activities determination.

Author Contributions

Conceptualization, J.L. and Y.W. (Yijing Wang); methodology, Y.W. (Yijing Wang) and J.D.; software, Y.W. (Yijing Wang) and C.L.; formal analysis, Y.W. (Yijing Wang); investigation, Y.W. (Yijing Wang), X.L., Y.Z. and Y.W. (Yan Wang); writing—original draft preparation, Y.W. (Yijing Wang); writing—review and editing, Y.W. (Yijing Wang), J.D., X.L., C.L., Y.Z., Y.W. (Yan Wang) and J.L.; visualization, Y.W. (Yijing Wang); project administration, J.L.; funding acquisition, J.L. and J.D. All authors have read and agreed to the published version of the manuscript.

Funding

This research was funded by the National Natural Science Foundation of China (No. 42577009 and 42407311).

Data Availability Statement

The original contributions presented in this study are included in the article. Further inquiries can be directed to the corresponding author.

Acknowledgments

We thank ShuwanYan in the Environment Research Institute, Shandong University for help with figure preparation. We also thank Chengjia Zhang and Nannan Dong of the Core Facilities for Life and Environmental Sciences, State Key laboratory of Microbial Technology of Shandong University for assistance with carbon and nitrogen analyses using the Elemental Analyzer (Vario EL III, Elementar Analysensysteme, Langenselbold, Germany).

Conflicts of Interest

The authors declare no conflicts of interest.

References

  1. Schuerch, M.; Spencer, T.; Temmerman, S.; Kirwan, M.L.; Wolff, C.; Lincke, D.; McOwen, C.J.; Pickering, M.D.; Reef, R.; Vafeidis, A.T.; et al. Future Response of Global Coastal Wetlands to Sea-Level Rise. Nature 2018, 561, 231–234. [Google Scholar] [CrossRef]
  2. Janse, J.H.; Van Dam, A.A.; Hes, E.M.A.; De Klein, J.J.M.; Finlayson, C.M.; Janssen, A.B.G.; Van Wijk, D.; Mooij, W.M.; Verhoeven, J.T.A. Towards a Global Model for Wetlands Ecosystem Services. Cur. Opin. Environ. Sustain. 2019, 36, 11–19. [Google Scholar] [CrossRef]
  3. Wang, F.; Sanders, C.J.; Santos, I.R.; Tang, J.; Schuerch, M.; Kirwan, M.L.; Kopp, R.E.; Zhu, K.; Li, X.; Yuan, J.; et al. Global Blue Carbon Accumulation in Tidal Wetlands Increases with Climate Change. Natl. Sci. Rev. 2021, 8, nwaa296. [Google Scholar] [CrossRef] [PubMed]
  4. Fluet-Chouinard, E.; Stocker, B.D.; Zhang, Z.; Malhotra, A.; Melton, J.R.; Poulter, B.; Kaplan, J.O.; Goldewijk, K.K.; Siebert, S.; Minayeva, T.; et al. Extensive Global Wetland Loss over the Past Three Centuries. Nature 2023, 614, 281–286. [Google Scholar] [CrossRef]
  5. Temmink, R.J.M.; Lamers, L.P.M.; Angelini, C.; Bouma, T.J.; Fritz, C.; Van De Koppel, J.; Lexmond, R.; Rietkerk, M.; Silliman, B.R.; Joosten, H.; et al. Recovering Wetland Biogeomorphic Feedbacks to Restore the World’s Biotic Carbon Hotspots. Science 2022, 376, eabn1479. [Google Scholar] [CrossRef] [PubMed]
  6. Murray, N.J. The Extent and Drivers of Global Wetland Loss. Nature 2023, 614, 234–235. [Google Scholar] [CrossRef]
  7. Liu, N.; Wang, Q.; Zhou, R.; Zhang, R.; Tian, D.; Gaffney, P.P.J.; Chen, W.; Gan, D.; Zhang, Z.; Niu, S.; et al. Elevating Water Table Reduces Net Ecosystem Carbon Losses from Global Drained Wetlands. Glob. Change Biol. 2024, 30, e17495. [Google Scholar] [CrossRef]
  8. He, Q.; Li, Z.; Daleo, P.; Lefcheck, J.S.; Thomsen, M.S.; Adams, J.B.; Bouma, T.J. Coastal Wetland Resilience through Local, Regional and Global Conservation. Nat. Rev. Biodivers. 2025, 1, 50–67. [Google Scholar] [CrossRef]
  9. Calderón, K.; Spor, A.; Breuil, M.-C.; Bru, D.; Bizouard, F.; Violle, C.; Barnard, R.L.; Philippot, L. Effectiveness of Ecological Rescue for Altered Soil Microbial Communities and Functions. ISME J. 2017, 11, 272–283. [Google Scholar] [CrossRef] [PubMed]
  10. Averill, C.; Anthony, M.A.; Baldrian, P.; Finkbeiner, F.; van den Hoogen, J.; Kiers, T.; Kohout, P.; Hirt, E.; Smith, G.R.; Crowther, T.W. Defending Earth’s Terrestrial Microbiome. Nat. Microbiol. 2022, 7, 1717–1725. [Google Scholar] [CrossRef] [PubMed]
  11. Candry, P.; Abrahamson, B.; Stahl, D.A.; Winkler, M.H. Microbially Mediated Climate Feedbacks from Wetland Ecosystems. Glob. Change Biol. 2023, 29, 5169–5183. [Google Scholar] [CrossRef] [PubMed]
  12. Liu, N.; Ma, Z. Ecological Restoration of Coastal Wetlands in China: Current Status and Suggestions. Biol. Conserv. 2024, 291, 110513. [Google Scholar] [CrossRef]
  13. Peay, K.G.; Baraloto, C.; Fine, P.V.A. Strong Coupling of Plant and Fungal Community Structure across Western Amazonian Rainforests. ISME J. 2013, 7, 1852–1861. [Google Scholar] [CrossRef]
  14. Rodriguez, P.A.; Rothballer, M.; Chowdhury, S.P.; Nussbaumer, T.; Gutjahr, C.; Falter-Braun, P. Systems Biology of Plant-Microbiome Interactions. Mol. Plant 2019, 12, 804–821. [Google Scholar] [CrossRef]
  15. Zhai, C.; Yang, Y.; Kong, L.; Wang, X.; Hou, J.; Zeng, Q.; Ge, A.; Yao, B.; Zhou, Z.; Feng, J.; et al. Nitrogen Deposition Decouples Grassland Plant Community from Soil Bacterial and Fungal Communities along a Precipitation Gradient. J. Ecol. 2025, 113, 1269–1280. [Google Scholar] [CrossRef]
  16. Martin, F.M.; Uroz, S.; Barker, D.G. Ancestral Alliances: Plant Mutualistic Symbioses with Fungi and Bacteria. Science 2017, 356, eaad4501. [Google Scholar] [CrossRef]
  17. Philippot, L.; Raaijmakers, J.M.; Lemanceau, P.; Van Der Putten, W.H. Going Back to the Roots: The Microbial Ecology of the Rhizosphere. Nat. Rev. Microbiol. 2013, 11, 789–799. [Google Scholar] [CrossRef] [PubMed]
  18. Ling, N.; Wang, T.; Kuzyakov, Y. Rhizosphere Bacteriome Structure and Functions. Nat. Commun. 2022, 13, 836. [Google Scholar] [CrossRef]
  19. Yu, Y.; Zhou, Y.; Janssens, I.A.; Deng, Y.; He, X.; Liu, L.; Yi, Y.; Xiao, N.; Wang, X.; Li, C.; et al. Divergent Rhizosphere and Non-rhizosphere Soil Microbial Structure and Function in Long-term Warmed Steppe Due to Altered Root Exudation. Glob. Change Biol. 2024, 30, e17111. [Google Scholar] [CrossRef]
  20. Dong, X.; Man, H.; Liu, C.; Wu, X.; Zhu, J.; Zheng, Z.; Ma, D.; Li, M.; Zang, S. Changes in Soil Bacterial Community along a Gradient of Permafrost Degradation in Northeast China. Catena 2023, 222, 106870. [Google Scholar] [CrossRef]
  21. Saltonstall, K.; Van Breugel, M.; Navia, W.; Castillo, H.; Hall, J.S. Soil Microbial Communities in Dry and Moist Tropical Forests Exhibit Distinct Shifts in Community Composition but Not Diversity with Succession. Microbiol. Spectr. 2025, 13, e01931-24. [Google Scholar] [CrossRef]
  22. Ge, M.; Gao, J.; McClellan, S.A.; Hou, A.; Yu, J.; Yang, J.; Song, T.; Guan, B. Changes of Bacterial Communities in Restored Phragmites australis Wetlands Indicate the Improvement of Soil in the Yellow River Delta. Land Degrad. Dev. 2023, 34, 1897–1909. [Google Scholar] [CrossRef]
  23. Wagg, C.; Schlaeppi, K.; Banerjee, S.; Kuramae, E.E.; van der Heijden, M.G.A. Fungal-Bacterial Diversity and Microbiome Complexity Predict Ecosystem Functioning. Nat. Commun. 2019, 10, 4841. [Google Scholar] [CrossRef]
  24. Mendes, L.W.; Kuramae, E.E.; Navarrete, A.A.; Van Veen, J.A.; Tsai, S.M. Taxonomical and Functional Microbial Community Selection in Soybean Rhizosphere. ISME J. 2014, 8, 1577–1587. [Google Scholar] [CrossRef]
  25. Wang, D.; Deng, S.; Yang, H.; Li, N.; Feng, Q.; Liu, J.; Yin, H. The Microbial Network Exhibits Higher Complexity in the Rhizosphere than in Bulk Soils along Elevational Gradients in the Alpine Forests. Appl. Soil Ecol. 2025, 213, 106264. [Google Scholar] [CrossRef]
  26. Fan, Q.; Liu, K.; Wang, Z.; Liu, D.; Li, T.; Hou, H.; Zhang, Z.; Chen, D.; Zhang, S.; Yu, A.; et al. Soil Microbial Subcommunity Assembly Mechanisms Are Highly Variable and Intimately Linked to Their Ecological and Functional Traits. Mol. Ecol. 2024, 33, e17302. [Google Scholar] [CrossRef] [PubMed]
  27. Stegen, J.C.; Lin, X.; Konopka, A.E.; Fredrickson, J.K. Stochastic and Deterministic Assembly Processes in Subsurface Microbial Communities. ISME J. 2012, 6, 1653–1664. [Google Scholar] [CrossRef] [PubMed]
  28. Riddley, M.; Hepp, S.; Hardeep, F.; Nayak, A.; Liu, M.; Xing, X.; Zhang, H.; Liao, J. Differential Roles of Deterministic and Stochastic Processes in Structuring Soil Bacterial Ecotypes across Terrestrial Ecosystems. Nat. Commun. 2025, 16, 2337. [Google Scholar] [CrossRef] [PubMed]
  29. Liu, L.; Zhu, K.; Krause, S.M.B.; Li, S.; Wang, X.; Zhang, Z.; Shen, M.; Yang, Q.; Lian, J.; Wang, X.; et al. Changes in Assembly Processes of Soil Microbial Communities during Secondary Succession in Two Subtropical Forests. Soil Biol. Biochem. 2021, 154, 108144. [Google Scholar] [CrossRef]
  30. Zhao, Z.; Gao, H.; Yang, Y.; Deng, Y.; Ju, F. Fungi as a Critical Component of Lake Microbiota in Response to Cyanobacterial Harmful Algal Blooms. Environ. Sci. Technol. 2025, 59, 11167–11180. [Google Scholar] [CrossRef]
  31. Hermans, S.M.; Buckley, H.L.; Case, B.S.; Curran-Cournane, F.; Taylor, M.; Lear, G. Using Soil Bacterial Communities to Predict Physico-Chemical Variables and Soil Quality. Microbiome 2020, 8, 79. [Google Scholar] [CrossRef]
  32. De Nijs, E.A.; Hicks, L.C.; Leizeaga, A.; Tietema, A.; Rousk, J. Soil Microbial Moisture Dependences and Responses to Drying–Rewetting: The Legacy of 18 Years Drought. Glob. Change Biol. 2019, 25, 1005–1015. [Google Scholar] [CrossRef] [PubMed]
  33. Huang, J.; Liu, X.; Liu, J.; Zhang, Z.; Zhang, W.; Qi, Y.; Li, W.; Chen, Y. Changes of Soil Bacterial Community, Network Structure, and Carbon, Nitrogen and Sulfur Functional Genes under Different Land Use Types. Catena 2023, 231, 107385. [Google Scholar] [CrossRef]
  34. Lv, L.; Zhang, J.; Bourque, C.P.-A.; Xiang, Q.; Zhang, J.; Yang, X.; Zhu, J.; Ma, J. Soil Depth Affects Bacterial, but Not Fungal Community Structure and Assembly in Robinia pseudoacacia Plantations. Eur. J. Soil Biol. 2025, 126, 103747. [Google Scholar] [CrossRef]
  35. Zhang, J.; Zhang, Q.; Zhang, C.; Wang, R.; Wang, H.; Zheng, P. Vegetation Succession Enhances Microbial Diversity, Network Complexity, and Stability in Coastal Wetlands, Underscoring the Pivotal Role of Soil Salinity and Key Microbial Species. J. Environ. Manag. 2025, 388, 125997. [Google Scholar] [CrossRef] [PubMed]
  36. Peng, W.; Song, M.; Du, H.; Jiang, S.; Zeng, F.; Chen, H.; Song, T. Assembly Processes and Networks of Soil Microbial Communities along Karst Forest Succession. Catena 2025, 248, 108574. [Google Scholar] [CrossRef]
  37. Liu, J.; Jia, X.; Yan, W.; Zhong, Y.; Shangguan, Z. Changes in Soil Microbial Community Structure during Long-term Secondary Succession. Land Degrad. Dev. 2020, 31, 1151–1166. [Google Scholar] [CrossRef]
  38. Barberán, A.; McGuire, K.L.; Wolf, J.A.; Jones, F.A.; Wright, S.J.; Turner, B.L.; Essene, A.; Hubbell, S.P.; Faircloth, B.C.; Fierer, N. Relating Belowground Microbial Composition to the Taxonomic, Phylogenetic, and Functional Trait Distributions of Trees in a Tropical Forest. Ecol. Lett. 2015, 18, 1397–1405. [Google Scholar] [CrossRef]
  39. Yang, W.; Cai, A.; Wang, J.; Luo, Y.; Cheng, X.; An, S. Exotic Spartina Alterniflora Loisel. Invasion Significantly Shifts Soil Bacterial Communities with the Successional Gradient of Saltmarsh in Eastern China. Plant Soil 2020, 449, 97–115. [Google Scholar] [CrossRef]
  40. Chen, X.; Zhang, M.; Zhang, W. Landscape Pattern Changes and Its Drivers Inferred from Salt Marsh Plant Variations in the Coastal Wetlands of the Liao River Estuary, China. Ecol. Indic. 2022, 145, 109719. [Google Scholar] [CrossRef]
  41. Wang, X.; Xiao, X.; Xu, X.; Zou, Z.; Chen, B.; Qin, Y.; Zhang, X.; Dong, J.; Liu, D.; Pan, L.; et al. Rebound in China’s Coastal Wetlands Following Conservation and Restoration. Nat. Sustain. 2021, 4, 1076–1083. [Google Scholar] [CrossRef]
  42. Zhang, Z.; Liu, J.; Gao, H.; Wang, F.; Shang, B.; Zhang, M.; Fu, T. Spatial Pattern of Critical Wetland Patches and Its Influencing Factors in a Coastal Area, North China. J. Environ. Manag. 2025, 373, 123741. [Google Scholar] [CrossRef]
  43. Liu, X.; Wang, Y.; Zhao, Y.; Zhang, X.; Wang, Y.; Cao, Q.; Liu, J. Microbial Necromass Carbon Contributed to Soil Organic Carbon Accumulation and Stabilization in the Newly Formed Inland Wetlands. Environ. Res. 2025, 264, 120397. [Google Scholar] [CrossRef]
  44. Wang, Y.; Zheng, G.; Li, C.; Zhao, Y.; Dong, J.; Wang, Z.; Lu, G.; Chen, Z.; Dong, Z.; Liu, K.; et al. Natural Succession and Artificial Management Have Different Effects on Soil Microbial Ecological Patterns in Wetland Resulting from Land-Use Change. Appl. Soil Ecol. 2025, 205, 105783. [Google Scholar] [CrossRef]
  45. Lavallee, J.M.; Soong, J.L.; Cotrufo, M.F. Conceptualizing Soil Organic Matter into Particulate and Mineral-associated Forms to Address Global Change in the 21st Century. Glob. Change Biol. 2020, 26, 261–273. [Google Scholar] [CrossRef]
  46. Liu, F.; Qin, S.; Fang, K.; Chen, L.; Peng, Y.; Smith, P.; Yang, Y. Divergent Changes in Particulate and Mineral-Associated Organic Carbon upon Permafrost Thaw. Nat. Commun. 2022, 13, 5073. [Google Scholar] [CrossRef] [PubMed]
  47. Zhang, X.; Amelung, W. Gas Chromatographic Determination of Muramic Acid, Glucosamine, Mannosamine, and Galactosamine in Soils. Soil Biol. Biochem. 1996, 28, 1201–1206. [Google Scholar] [CrossRef]
  48. Joergensen, R.G. Amino Sugars as Specific Indices for Fungal and Bacterial Residues in Soil. Biol. Fertil. Soils 2018, 54, 559–568. [Google Scholar] [CrossRef]
  49. Sinsabaugh, R.L.; Lauber, C.L.; Weintraub, M.N.; Ahmed, B.; Allison, S.D.; Crenshaw, C.; Contosta, A.R.; Cusack, D.; Frey, S.; Gallo, M.E.; et al. Stoichiometry of Soil Enzyme Activity at Global Scale. Ecol. Lett. 2008, 11, 1252–1264. [Google Scholar] [CrossRef]
  50. Yang, T.; Li, X.; Hu, B.; Li, F.; Wei, D.; Wang, Z.; Huang, L.; Bao, W. Climate and Soil Properties Shape Latitudinal Patterns of Soil Extracellular Enzyme Activity and Stoichiometry: Evidence from Southwest China. Appl. Soil Ecol. 2024, 197, 105319. [Google Scholar] [CrossRef]
  51. Smets, W.; Leff, J.W.; Bradford, M.A.; McCulley, R.L.; Lebeer, S.; Fierer, N. A Method for Simultaneous Measurement of Soil Bacterial Abundances and Community Composition via 16S rRNA Gene Sequencing. Soil Biol. Biochem. 2016, 96, 145–151. [Google Scholar] [CrossRef]
  52. Bolyen, E.; Rideout, J.R.; Dillon, M.R.; Bokulich, N.A.; Abnet, C.C.; Al-Ghalith, G.A.; Alexander, H.; Alm, E.J.; Arumugam, M.; Asnicar, F.; et al. Reproducible, Interactive, Scalable and Extensible Microbiome Data Science Using QIIME 2. Nat. Biotechnol. 2019, 37, 852–857. [Google Scholar] [CrossRef]
  53. Callahan, B.J.; McMurdie, P.J.; Rosen, M.J.; Han, A.W.; Johnson, A.J.A.; Holmes, S.P. DADA2: High-Resolution Sample Inference from Illumina Amplicon Data. Nat. Methods 2016, 13, 581–583. [Google Scholar] [CrossRef]
  54. Yilmaz, P.; Parfrey, L.W.; Yarza, P.; Gerken, J.; Pruesse, E.; Quast, C.; Schweer, T.; Peplies, J.; Ludwig, W.; Glöckner, F.O. The SILVA and “All-Species Living Tree Project (LTP)” Taxonomic Frameworks. Nucleic Acids Res. 2014, 42, D643–D648. [Google Scholar] [CrossRef] [PubMed]
  55. Kõljalg, U.; Larsson, K.; Abarenkov, K.; Nilsson, R.H.; Alexander, I.J.; Eberhardt, U.; Erland, S.; Høiland, K.; Kjøller, R.; Larsson, E.; et al. UNITE: A Database Providing Web-based Methods for the Molecular Identification of Ectomycorrhizal Fungi. New Phytol. 2005, 166, 1063–1068. [Google Scholar] [CrossRef]
  56. Lefcheck, J.S. piecewiseSEM: Piecewise Structural Equation Modelling in r for Ecology, Evolution, and Systematics. Methods Ecol. Evol. 2016, 7, 573–579. [Google Scholar] [CrossRef]
  57. Ning, D.; Yuan, M.; Wu, L.; Zhang, Y.; Guo, X.; Zhou, X.; Yang, Y.; Arkin, A.P.; Firestone, M.K.; Zhou, J. A Quantitative Framework Reveals Ecological Drivers of Grassland Microbial Community Assembly in Response to Warming. Nat. Commun. 2020, 11, 4717. [Google Scholar] [CrossRef]
  58. Wen, T.; Xie, P.; Yang, S.; Niu, G.; Liu, X.; Ding, Z.; Xue, C.; Liu, Y.; Shen, Q.; Yuan, J. ggClusterNet: An R Package for Microbiome Network Analysis and Modularity-based Multiple Network Layouts. iMeta 2022, 1, e32. [Google Scholar] [CrossRef]
  59. Hu, M.; Sardans, J.; Sun, D.; Yan, R.; Wu, H.; Ni, R.; Peñuelas, J. Microbial Diversity and Keystone Species Drive Soil Nutrient Cycling and Multifunctionality Following Mangrove Restoration. Environ. Res. 2024, 251, 118715. [Google Scholar] [CrossRef] [PubMed]
  60. Bardgett, R.D.; Van Der Putten, W.H. Belowground Biodiversity and Ecosystem Functioning. Nature 2014, 515, 505–511. [Google Scholar] [CrossRef]
  61. Kuzyakov, Y. Priming Effects: Interactions between Living and Dead Organic Matter. Soil Biol. Biochem. 2010, 42, 1363–1371. [Google Scholar] [CrossRef]
  62. Zhou, J.; Wen, Y.; Shi, L.; Marshall, M.R.; Kuzyakov, Y.; Blagodatskaya, E.; Zang, H. Strong Priming of Soil Organic Matter Induced by Frequent Input of Labile Carbon. Soil Biol. Biochem. 2021, 152, 108069. [Google Scholar] [CrossRef]
  63. Shi, J.; Yang, L.; Liao, Y.; Li, J.; Jiao, S.; Shangguan, Z.; Deng, L. Soil Labile Organic Carbon Fractions Mediate Microbial Community Assembly Processes during Long-term Vegetation Succession in a Semiarid Region. iMeta 2023, 2, e142. [Google Scholar] [CrossRef]
  64. Schmidt, R.; Mitchell, J.; Scow, K. Cover Cropping and No-till Increase Diversity and Symbiotroph:Saprotroph Ratios of Soil Fungal Communities. Soil Biol. Biochem. 2019, 129, 99–109. [Google Scholar] [CrossRef]
  65. Winterfeldt, S.; Cruz-Paredes, C.; Rousk, J.; Leizeaga, A. Microbial Resistance and Resilience to Drought across a European Climate Gradient. Soil Biol. Biochem. 2024, 199, 109574. [Google Scholar] [CrossRef]
  66. Jing, C.; Xu, Z.; Zou, P.; Tang, Q.; Li, Y.; You, X.; Zhang, C. Coastal Halophytes Alter Properties and Microbial Community Structure of the Saline Soils in the Yellow River Delta, China. Appl. Soil Ecol. 2019, 134, 1–7. [Google Scholar] [CrossRef]
  67. Fierer, N. Embracing the Unknown: Disentangling the Complexities of the Soil Microbiome. Nat. Rev. Microbiol. 2017, 15, 579–590. [Google Scholar] [CrossRef] [PubMed]
  68. An, J.; Liu, C.; Wang, Q.; Yao, M.; Rui, J.; Zhang, S.; Li, X. Soil Bacterial Community Structure in Chinese Wetlands. Geoderma 2019, 337, 290–299. [Google Scholar] [CrossRef]
  69. Domeignoz-Horta, L.A.; Cappelli, S.L.; Shrestha, R.; Gerin, S.; Lohila, A.K.; Heinonsalo, J.; Nelson, D.B.; Kahmen, A.; Duan, P.; Sebag, D.; et al. Plant Diversity Drives Positive Microbial Associations in the Rhizosphere Enhancing Carbon Use Efficiency in Agricultural Soils. Nat. Commun. 2024, 15, 8065. [Google Scholar] [CrossRef]
  70. Zhou, T.; Liang, G.; Reich, P.B.; Delgado-Baquerizo, M.; Wang, C.; Zhou, Z. Promoting Effect of Plant Diversity on Soil Microbial Functionality Is Amplified over Time. One Earth 2024, 7, 2139–2148. [Google Scholar] [CrossRef]
  71. Zhu, L.; Luan, L.; Chen, Y.; Wang, X.; Zhou, S.; Zou, W.; Han, X.; Duan, Y.; Zhu, B.; Li, Y.; et al. Community Assembly of Organisms Regulates Soil Microbial Functional Potential through Dual Mechanisms. Glob. Change Biol. 2024, 30, e17160. [Google Scholar] [CrossRef]
  72. Romdhane, S.; Spor, A.; Aubert, J.; Bru, D.; Breuil, M.-C.; Hallin, S.; Mounier, A.; Ouadah, S.; Tsiknia, M.; Philippot, L. Unraveling Negative Biotic Interactions Determining Soil Microbial Community Assembly and Functioning. ISME J. 2022, 16, 296–306. [Google Scholar] [CrossRef] [PubMed]
  73. Trivedi, P.; Leach, J.E.; Tringe, S.G.; Sa, T.; Singh, B.K. Plant-Microbiome Interactions: From Community Assembly to Plant Health. Nat. Rev. Microbiol. 2020, 18, 607–621. [Google Scholar] [CrossRef]
  74. Liu, Z.-X.; Lyu, Y.-M.; Liu, Y.; Wang, Y.-Q.; Xiong, M.-M.; Tang, Y.; Li, X.-Y.; Sun, H.; Xu, J.-L. Differential Spatial Responses and Assembly Mechanisms of Soil Microbial Communities across Region-Scale Taiga Ecosystems. J. Environ. Manag. 2024, 370, 122653. [Google Scholar] [CrossRef]
  75. Sun, S.; Li, S.; Avera, B.N.; Strahm, B.D.; Badgley, B.D. Soil Bacterial and Fungal Communities Show Distinct Recovery Patterns during Forest Ecosystem Restoration. Appl. Environ. Microbiol. 2017, 83, e00966-17. [Google Scholar] [CrossRef]
  76. Yang, Y.; Dou, Y.; Wang, B.; Xue, Z.; Wang, Y.; An, S.; Chang, S.X. Deciphering Factors Driving Soil Microbial Life-history Strategies in Restored Grasslands. iMeta 2023, 2, e66. [Google Scholar] [CrossRef]
  77. Rodrigues, J.L.M.; Pellizari, V.H.; Mueller, R.; Baek, K.; Jesus, E.D.C.; Paula, F.S.; Mirza, B.; Hamaoui, G.S.; Tsai, S.M.; Feigl, B.; et al. Conversion of the Amazon Rainforest to Agriculture Results in Biotic Homogenization of Soil Bacterial Communities. Proc. Natl. Acad. Sci. USA 2013, 110, 988–993. [Google Scholar] [CrossRef] [PubMed]
  78. Jiao, S.; Chu, H.; Zhang, B.; Wei, X.; Chen, W.; Wei, G. Linking Soil Fungi to Bacterial Community Assembly in Arid Ecosystems. iMeta 2022, 1, e2. [Google Scholar] [CrossRef]
  79. Chaffron, S.; Delage, E.; Budinich, M.; Vintache, D.; Henry, N.; Nef, C.; Ardyna, M.; Zayed, A.A.; Junger, P.C.; Galand, P.E.; et al. Environmental Vulnerability of the Global Ocean Epipelagic Plankton Community Interactome. Sci. Adv. 2021, 7, eabg1921. [Google Scholar] [CrossRef]
  80. Bertolet, B.L.; Rodriguez, L.C.; Murúa, J.M.; Favela, A.; Allison, S.D. The Impact of Microbial Interactions on Ecosystem Function Intensifies Under Stress. Ecol. Lett. 2024, 27, e14528. [Google Scholar] [CrossRef] [PubMed]
  81. Chen, W.; Wang, J.; Chen, X.; Meng, Z.; Xu, R.; Duoji, D.; Zhang, J.; He, J.; Wang, Z.; Chen, J.; et al. Soil Microbial Network Complexity Predicts Ecosystem Function along Elevation Gradients on the Tibetan Plateau. Soil Biol. Biochem. 2022, 172, 108766. [Google Scholar] [CrossRef]
  82. Kuzyakov, Y.; Razavi, B.S. Rhizosphere Size and Shape: Temporal Dynamics and Spatial Stationarity. Soil Biol. Biochem. 2019, 135, 343–360. [Google Scholar] [CrossRef]
  83. Zhang, C.; Lei, S.; Wu, H.; Liao, L.; Wang, X.; Zhang, L.; Liu, G.; Wang, G.; Fang, L.; Song, Z. Simplified Microbial Network Reduced Microbial Structure Stability and Soil Functionality in Alpine Grassland along a Natural Aridity Gradient. Soil Biol. Biochem. 2024, 191, 109366. [Google Scholar] [CrossRef]
  84. Philippot, L.; Chenu, C.; Kappler, A.; Rillig, M.C.; Fierer, N. The Interplay between Microbial Communities and Soil Properties. Nat. Rev. Microbiol. 2023, 22, 226–239. [Google Scholar] [CrossRef]
  85. Crocker, K.; Lee, K.K.; Chakraverti-Wuerthwein, M.; Li, Z.; Tikhonov, M.; Mani, M.; Gowda, K.; Kuehn, S. Environmentally Dependent Interactions Shape Patterns in Gene Content across Natural Microbiomes. Nat. Microbiol. 2024, 9, 2022–2037. [Google Scholar] [CrossRef]
  86. Wang, G.; Van Der Putten, W.H.; Klironomos, J.; Zhang, F.; Zhang, J. Steering Plant-Soil Feedback for Sustainable Agriculture. Science 2025, 389, eads2506. [Google Scholar] [CrossRef]
  87. Rousk, J.; Bååth, E.; Brookes, P.C.; Lauber, C.L.; Lozupone, C.; Caporaso, J.G.; Knight, R.; Fierer, N. Soil Bacterial and Fungal Communities across a pH Gradient in an Arable Soil. ISME J. 2010, 4, 1340–1351. [Google Scholar] [CrossRef]
  88. Feng, K.; Deng, Y. Intertwined Relationship Between Soil pH and Microbes in Biogeography. Glob. Change Biol. 2025, 31, e70208. [Google Scholar] [CrossRef] [PubMed]
  89. Zhang, G.; Jia, J.; Zhao, Q.; Wang, W.; Wang, D.; Bai, J. Seasonality and Assembly of Soil Microbial Communities in Coastal Salt Marshes Invaded by a Perennial Grass. J. Environ. Manag. 2023, 331, 117247. [Google Scholar] [CrossRef]
  90. Li, Y.; Wei, Y.; He, L.; Fan, B.; Liu, K.; Ding, M.; Hu, Y.; Jing, X.; Zhu, B.; Wang, S.; et al. Responses of Subsoil Organic Carbon to Climate Warming and Cooling Is Determined by Microbial Community Rather Than Its Molecular Composition. Ecol. Lett. 2025, 28, e70162. [Google Scholar] [CrossRef]
  91. Deng, Z.; Dong, F.; Dai, Q.; Jiang, R.; Du, W.; Zhao, Y.; Liu, M.; Chen, Z. Karst Wetland Litter Alters Soil Microbial Community Structure and Metabolic Activity. Plant Soil 2025, 1–18. [Google Scholar] [CrossRef]
  92. Wang, G.; Gao, Q.; Yang, Y.; Hobbie, S.E.; Reich, P.B.; Zhou, J. Soil Enzymes as Indicators of Soil Function: A Step toward Greater Realism in Microbial Ecological Modeling. Glob. Change Biol. 2022, 28, 1935–1950. [Google Scholar] [CrossRef] [PubMed]
Figure 1. Soil bacterial and fungal community composition and structure in areas with and without plants. Bar plots showing the absolute copies and relative abundance of bacterial (a) and fungal (b) communities at the phylum level in areas with and without plants. PCoA with PERMANOVA showing bacterial (c) and fungal (d) community structure based on Bray-Curtis distance in areas with and without plants. R2 indicates the explanation of the differences between samples by different wetland states. Each of the areas with plants and without plants involves four wetlands (three natural successional wetlands and one artificially managed wetland). *** p < 0.001.
Water 17 03054 g001
Figure 2. Soil bacterial and fungal co-occurrence networks, topological parameters and stability test. Bacterial (a) and fungal (b) co-occurrence networks in areas without plants are more complex than areas with plants. Each node represents an ASV and nodes of the same color within a network belong to the same module. Topological parameters, including average degree, average path length, betweenness, modularity, and number of clusters, of bacterial (c) and fungal (d) co-occurrence networks in areas with and without plants. Stability of bacterial (e) and fungal (f) co-occurrence networks in areas without plants was higher than areas with plants. Each of the areas with plants and without plants involves four wetlands (three natural successional wetlands and one artificially managed wetland). *** p < 0.001.
Water 17 03054 g002
Figure 3. Relative contributions of ecological processes to bacterial (a) and fungal (b) community assembly. Each of the areas with plants and without plants involves four wetlands (three natural successional wetlands and one artificially managed wetland).
Water 17 03054 g003
Figure 4. Environmental factors driving bacterial and fungal communities. Linear regression models indicating the relationship between bacterial (a) and fungal (b) community similarity (1–Bray-Curtis distance) and environmental difference (Euclidean distance) in areas with and without plants. Mantel analysis indicating the influence of environmental factors on bacterial (c) and fungal (d) community in areas with and without plants. Each of the areas with plants and without plants involves four wetlands (three natural successional wetlands and one artificially managed wetland). * p < 0.05, ** p < 0.01, *** p < 0.001.
Water 17 03054 g004
Figure 5. Relative importance of environmental factors on microbial community and soil extracellular enzyme activities (EEAs). Redundancy analysis showing carbon as the most important factor in areas without plants and pH as the most important factor in areas with plants for bacterial (a) and fungal (b) communities. Structural equation models showing that different drivers (including wetland states, soil physicochemical properties, soil nutrient content and microbial diversity) have greater impact on soil extracellular enzyme activities in areas without plants (c) than areas with plants (d). In structural equation models, solid arrows represent significant influence, and the dashed arrows represent no significant influence. Each of the areas with plants and without plants involves four wetlands (three natural successional wetlands and one artificially managed wetland). * p < 0.05, ** p < 0.01, *** p < 0.001.
Water 17 03054 g005
Disclaimer/Publisher’s Note: The statements, opinions and data contained in all publications are solely those of the individual author(s) and contributor(s) and not of MDPI and/or the editor(s). MDPI and/or the editor(s) disclaim responsibility for any injury to people or property resulting from any ideas, methods, instructions or products referred to in the content.