Article

The Impact of China’s Targeted Poverty Alleviation Policy on Water Resource Utilization Pressure and Allocation in Arid Regions: A Case Study of Hotan Prefecture, Xinjiang

1
Xinjiang Institute of Ecology and Geography, Chinese Academy of Sciences, Urumqi 830011, China
2
University of Chinese Academy of Sciences, Beijing 101408, China
*
Author to whom correspondence should be addressed.
These authors contributed equally to this work.
Water 2025, 17(21), 3053; https://doi.org/10.3390/w17213053 (registering DOI)
Submission received: 2 September 2025 / Revised: 21 October 2025 / Accepted: 22 October 2025 / Published: 24 October 2025
(This article belongs to the Section Water Resources Management, Policy and Governance)

Abstract

Targeted poverty alleviation is a major national initiative in China. The Hotan region, located within the four prefectures of Southern Xinjiang, is one of the 14 contiguous poverty-stricken areas in China as well as a quintessential inland arid zone. Water scarcity is the primary constraint on development in the Hotan region and a major bottleneck for Northwest China as a whole. However, previous assessments of the effectiveness of poverty alleviation measures have primarily focused on industrial growth itself, lacking an analysis of the adaptability between key regional resource elements and industrial poverty alleviation measures. The core of promoting targeted poverty alleviation in arid regions is properly managing the relationships within the “industry–water resources” system and achieving a balance between resource use, environmental capacity, and economic development. Focusing on the coordinated development of industry and water resources, this study evaluates the spatio-temporal evolution of the industry–water resource relationships in the Hotan region after the implementation of the targeted poverty alleviation policy with the aim of measuring the sustainability of industrial poverty alleviation outcomes in this arid region. The results indicate the following: (1) The targeted poverty alleviation policy has reduced industrial water consumption. Following the policy’s implementation, industrial water consumption decreased by 541 million m3, driven by improvements in water use intensity and shifts in the industrial structure. The primary contributor to this reduction was enhanced water use efficiency within the primary sector. (2) The policy exacerbated the misallocation of water resources relative to industrial output across the region. The Gini coefficient for water resources versus GDP across Hotan’s eight counties and cities rose from 0.26 to 0.32, indicating a shift from a ‘relatively balanced’ to a ‘moderately imbalanced’ allocation. Therefore, achieving sustainable poverty alleviation in this arid region necessitates enhanced coordination between industrial development and water resources.

1. Introduction

Reducing and ultimately eradicating poverty are essential prerequisites for social advancement and the realization of common prosperity. Historically recognized as a developing country, China once had the world’s largest population living in poverty. Since the founding of the People’s Republic of China in 1949, the nation has undertaken substantial initiatives to eliminate poverty, including relief-, development- and, eventually, targeted poverty alleviation-oriented policy [1]. From 1978 to 2012, over 700 million Chinese citizens were lifted out of poverty [2,3], making China the first country to achieve a halving of its extreme-poverty population [4,5]. However, the remaining impoverished population primarily resides in arid, mountainous, and ecologically fragile regions characterized by limited natural resource endowments, vulnerable environments, inadequate transportation, and constrained resource mobility, posing significant challenges to achieving comprehensive poverty alleviation. In 2013, with the objective of building a moderately prosperous society by 2020, General Secretary Xi Jinping proposed the concept of targeted poverty alleviation. In 2015, the decision on winning the battle against poverty was promulgated, officially initiating the targeted poverty alleviation strategy. This strategy highlighted the development of specialized industries to alleviate poverty, seeking to expand the valued-added benefits provided to impoverished households along the full agricultural industry and value chains. The implementation of the targeted poverty alleviation strategy has further elevated industrial poverty alleviation efforts to an unprecedented level.
In order to promote the implementation of precise poverty alleviation policy, the Chinese Government has established a “top-down” model of precise poverty alleviation through industry, characterized by “government choice” and comprising: (i) the multiparty participation governance model of government + leading enterprises + cooperatives + poor households [6]; (ii) the resource industry poverty alleviation model [7]; (iii) the financial targeted poverty alleviation model [1]; and (iv) the characteristic tourism industry poverty alleviation model [8]. In particular, these models were developed with the aim of promoting resource development and enhancing the development momentum of impoverished areas through institutional arrangements. Although China announced the completion of its poverty alleviation mission in 2020, evaluations of the outcomes have identified issues such as low efficiency in poverty reduction [9] and difficulties in sustainably improving its performance [10]. To enhance the effectiveness of these efforts, numerous scholars have proposed pathways to improve the efficiency of poverty reduction measures, focusing on areas such as the volume of government fiscal subsidies [11], the roles of agriculture-related loans [12], and the impacts of agricultural insurance subsidies [13]. Industrial poverty alleviation models developed in other countries are also diverse. In the process of promoting the development of impoverished areas and increasing the income of the economically disadvantaged, countries and regions such as the United States, France, Brazil, and Africa have mainly relied on their natural resource advantages to establish multi-level guarantee systems that include subsidies, finance, and technology, as well as developing characteristic agricultural industries and rural tourism [14]. In terms of poverty reduction effects, the effectiveness of poverty reduction measures is closely related to the industrial sector composition. Studies in India, Indonesia, and Brazil have shown that the poverty reduction effects of primary and tertiary sectors are more significant, while that of the secondary sector is relatively weak [15,16,17].
However, the existing literature has predominantly focused on industrial poverty alleviation models and the efficiency of fund utilization, and often lacks systematic and long-term assessments of the underlying mechanisms. In particular, analyses regarding the compatibility between key regional resources and the poverty alleviation industries themselves remain scarce. China’s impoverished areas are typically located in ecologically fragile zones characterized by harsh natural environments, resource scarcity, and insufficient mobility of external factors of production. Consequently, the sustainability of industrial poverty alleviation measures can only be achieved by enhancing the adaptability between these industries and available resources. For arid regions in particular, water is the primary constraining resource [18] and a key factor for achieving regional sustainable development [19,20], being crucial for both human life and environmental conservation [21,22]. In the context of ecological civilization construction, one of the challenges in achieving stable poverty alleviation is resolving the inherent contradictions between water resources and the economy, society, and the ecological environment [23,24]. Some scholars, considering the comprehensive benefits of the economy, society, and ecology, have introduced ecological water demand into optimization models to explore optimal water resource allocation schemes under different water use scenarios. In this context, the goal is to maximize the benefits of water resource development and utilization under the constraints of ecological protection [20]. Other scholars have constructed quantitative models to balance the needs of the economy, society, and ecology by calculating the mathematical relationships between ecological protection, water consumption, and economic and social losses, aiming to achieve synergy between socio-economic and ecological indicators [25]. Through research, some scholars have proposed a 40% threshold for the water resource development and utilization rate [26]. However, the universality of this standard is controversial; especially in arid regions, where this threshold is not applicable [27,28].
The extent to which the economic and social scale of an arid region can be supported is determined by the carrying capacity of its water resources. As an essential input for productive activities, water inevitably exerts a significant impact on both overall economic activity and individual incomes [29]. Therefore, the core of advancing targeted poverty alleviation measures in arid regions lies in properly managing the relationships within the “industry–water resource” system to achieve a spatial equilibrium between environmental capacity and economic development. This study employs the Hotan Region of Xinjiang as a case, using 2015—the year in which the implementation of the targeted poverty alleviation strategy commenced—as a pivotal reference point to compare changes in industrial water consumption and their driving impacts across the periods 2010–2015 and 2015–2020. Additionally, we calculated the Gini coefficient to assess the degree of alignment between regional water resources and industrial development. We aimed to answer the following questions: Do targeted poverty alleviation measures amplify water resource pressures in arid zones, thereby exacerbating conflicts within the “industry–water resources” nexus? Do targeted poverty alleviation measures intensify spatial competition for water, leading to imbalances in regional water allocation? This study analyzes the impacts of the targeted poverty alleviation policy on regional water resource pressure and allocation from a spatio-temporal perspective. For this purpose, the sustainability of effective industrial poverty alleviation measures in arid regions of China is systematically evaluated from the viewpoint of the coordinated development of water resources and industrial structure.

2. Materials and Methods

2.1. Overview of the Study Area

The Hotan area is located at the southern margin of the Taklimakan Desert at the northern foot of the Kunlun Mountains (Figure 1). The Gobi Desert accounts for 63% of the total administrative area, while the oasis areas account for only 3.7%. The area has a warm temperate continental desert climate, with an average annual precipitation of 36.4 mm and an average evaporation of 2618 mm, with drought and sandstorms occurring throughout the year. In the Hotan area, 36 large and small rivers originate from the Kunlun and Karakoram Mountains. The total amount of available water resources is 6.349 billion m3, including 4.724 billion m3 of surface water and 1.625 billion m3 of groundwater; additionally, the availability of water resources varies significantly with time and space. This area is the driest and most water-scarce area in China. Seven counties and one city fall under the jurisdiction of the Hotan area. Economic development is based on traditional oasis agriculture, and the industrial base is weak. Influenced by the traditional regional culture, the population is growing rapidly and is large, land availability is limited, and much of the labor force lives in rural areas. During the study period, nearly 600,000 people were unemployed and without land. The Hotan area includes a wide range of impoverished areas characterized by a deep degree of poverty. The four prefectures in Southern Xinjiang to which this area belongs are among the 14 contiguous areas of extreme poverty in China.

2.2. Settings for the Factor Decomposition Model

Decomposition analysis is a method that can be used to systematically identify, quantify, and parse the contributions of different driving factors to changes in water consumption, which has been widely applied for water use efficiency analyses. In this study, referring to Ang [30,31], Zhang et al. [32], and Long et al. [33], the additive model in LMDI was chosen, and industrial water consumption was divided into that associated with primary, secondary, and tertiary industries. Structural indicators, including water use intensity, industrial structure, income level, and population size (Table 1), were used to analyze the changes in industrial water consumption and the driving effects underlying the differences before and after the implementation of the targeted poverty alleviation strategy.
For this purpose, a driving effect model for the difference in water consumption was determined. The total water consumption W in a certain area can be expressed by the following equation:
W = i W i = i W i G i × G i G × G P × P
where Wi and Gi are the water consumption and value added for the i-th sector, respectively; and G and P are the gross regional product and population, respectively, with the former defined as G = i G i .
Equation (1) can be further rewritten as Equation (2):
W = i I i × S i × I n c × P
where Ii = Wi/Gi is the water use intensity of the i-th sector; Si = Gi/G is the proportion of the i-th sector’s added value in the gross regional product; and Inc = G/P is the per capita gross regional product value.
Assuming that time changes from 0 to t, the change in total water consumption, ΔW = WtW0, can be decomposed into four driving effects:
Δ W = Δ W I + Δ W S + Δ W I n c + Δ W P
Δ W = i W i t W i 0 ln W i t ln W i 0 ln I i t I i 0
Δ W s = i W i t W i 0 ln W i t ln W i 0 ln S i t S i 0
Δ W ln c = i W i t W i 0 ln W i t ln W i 0 ln ln c t ln c 0
Δ W p = i W i t W i 0 ln W i t ln W i 0 ln P t P 0
where ΔWI is the intensity effect, reflecting the impact of a change in industrial water use intensity on the change in total water consumption; ΔWS is the structural effect, reflecting the impact of industrial structure adjustment on the change in total water consumption; ΔWInc is the income effect, reflecting the effect of economic growth on total water consumption; and ΔWP is the population effect, reflecting the impact of population size change on the change in industrial water consumption.

2.3. Calculation Methods for the Gini Coefficient of Water Resources

The Gini coefficient is a critical tool for measuring the equity of a resource’s distribution. By analyzing the relationship between water resources and industrial output, the degree of balance can be quantified into a value between 0 and 1. Incorporating a time-series analysis allows the evolution of this balance to be tracked, thereby revealing the quantitative differences in spatial inequality under different policy frameworks. In economics, the Gini coefficient serves as a measure of overall inequality [34]. Drawing on established algorithms and empirical applications of the Gini coefficient [35,36], this study employs industrial water consumption as the fundamental matching variable and GDP as the matching and grading context, thereby facilitating the estimation of county-level GDP tied to water resources in each county and city in the Hotan region. Hence, the objective was to evaluate the alignment between water resources and industrial development in the Hotan region. Through comparison across various policy stages, the impacts of policy implementation on the coordinated development of regional water resources and industry were analyzed. The formula for obtaining the Gini coefficient via the trapezoidal area method is:
G = 1 n = 1 8 X n X n 1 Y n + Y n 1
where Xn is the cumulative percentage of economic indicators (e.g., GDP) and Yn is the cumulative percentage of water resources; in particular, when n = 1, (Xn−1, Yn−1) is regarded as (0, 0).
The degree of fairness in residents’ income was evaluated by referring to the Gini coefficient [37]. The specific classification is shown in Table 2.

2.4. Data Sources

The cultivated land data were obtained from the land cover dataset [38] released by Wuhan University, which is the first annual China land cover dataset (CLCD) based on the Google Earth Engine (GEE) platform. The dataset contains nine land cover classification systems—namely, farmland, forest, shrub, grassland, water, snow, barren, impervious, and wetland—with a product pixel size of 30 m. The cultivated land data in the present study included only farmland. The water resource utilization data were obtained from the 2010–2020 Hotan Regional Water Resources Bulletin; while the socioeconomic data were obtained from the Statistical Yearbook of Xinjiang Uygur Autonomous Region (2010–2021), the Statistical Yearbook of Hotan Region (2010–2018), and the 2018–2020 Statistical Yearbook of National Economic and Social Development of Hotan Region.

3. Results and Discussion

3.1. Analysis of the Industrial Poverty Alleviation Measures in the Hotan Area

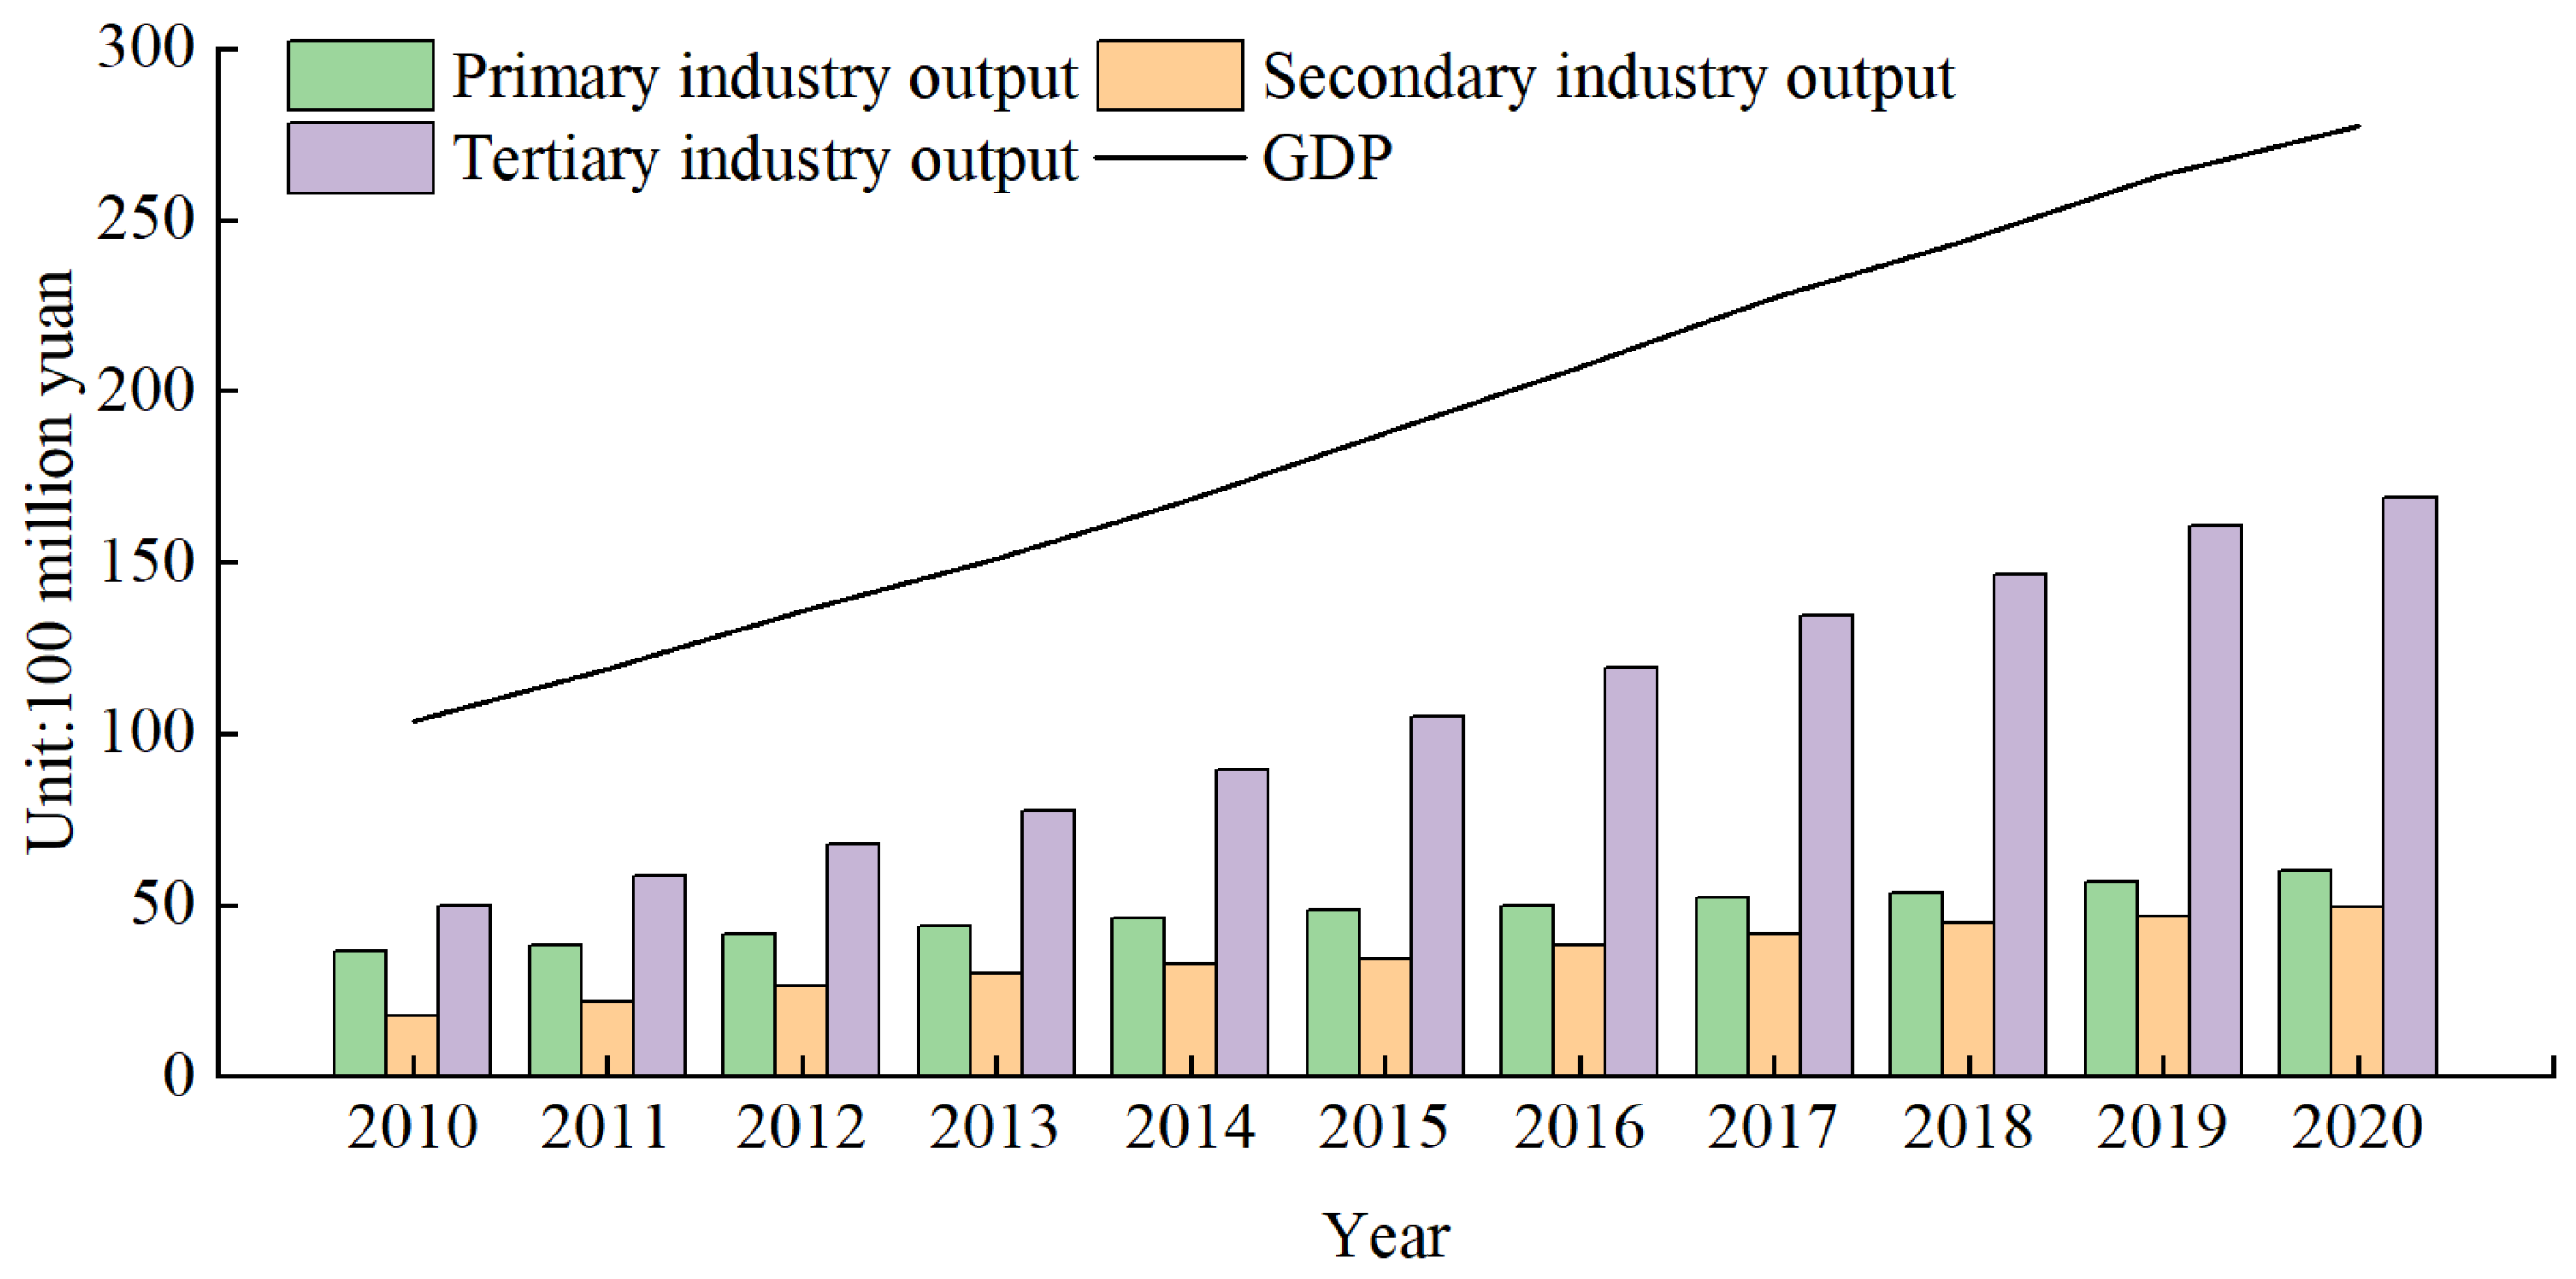
Industrial development is an important factor for promoting poverty alleviation [39]. The industrial base in the Hotan area is weak, and the scale of unemployment is large. To fully alleviate poverty, the local government has focused on promoting industrial development. For the primary sector, wasteland reclamation and arable land expansion increased from 5,038,200 mu in 2010 to 5,422,900 mu in 2020. For the secondary sector, a focus on labor-intensive industries has led to stronger preferential policies regarding taxation, transportation, and factory leasing for manufacturing categories such as textiles, agricultural product processing, and electronic product assembly. Furthermore, for tertiary industries, the focus was on growing the urban economy and vigorously developing the lifestyle service industry. Driven by industrial poverty alleviation efforts, the GDP increased from CNY 10.35 billion in 2010 to CNY 27.75 billion in 2020 (Figure 2), with an average annual growth rate of 10.37%. The average annual growth rate in 2010–2015 was 12.67%, while that during 2015–2020 was 8.11%. The per capita GDP increased from CNY 5181 in 2010 to CNY 10,900 in 2020, with an average annual growth rate of 7.78%; the average annual growth rate in 2010–2015 was 9.62%, while that in 2015–2020 was 5.97%. However, from a growth perspective, economic growth slowed after the implementation of the targeted poverty alleviation policy; in particular, the average annual growth rate of China’s economy from 2015 to 2020 was only 5.75%. Therefore, in the context of China’s broader economic deceleration, the growth rate of over 8% observed in the Hotan region is particularly notable. Measures implemented under the Targeted Poverty Alleviation policy, such as increasing fiscal transfers from the central government and enhancing financial investments from developed provinces into impoverished regions, have played a significant role in promoting the economic development of the Hotan region.
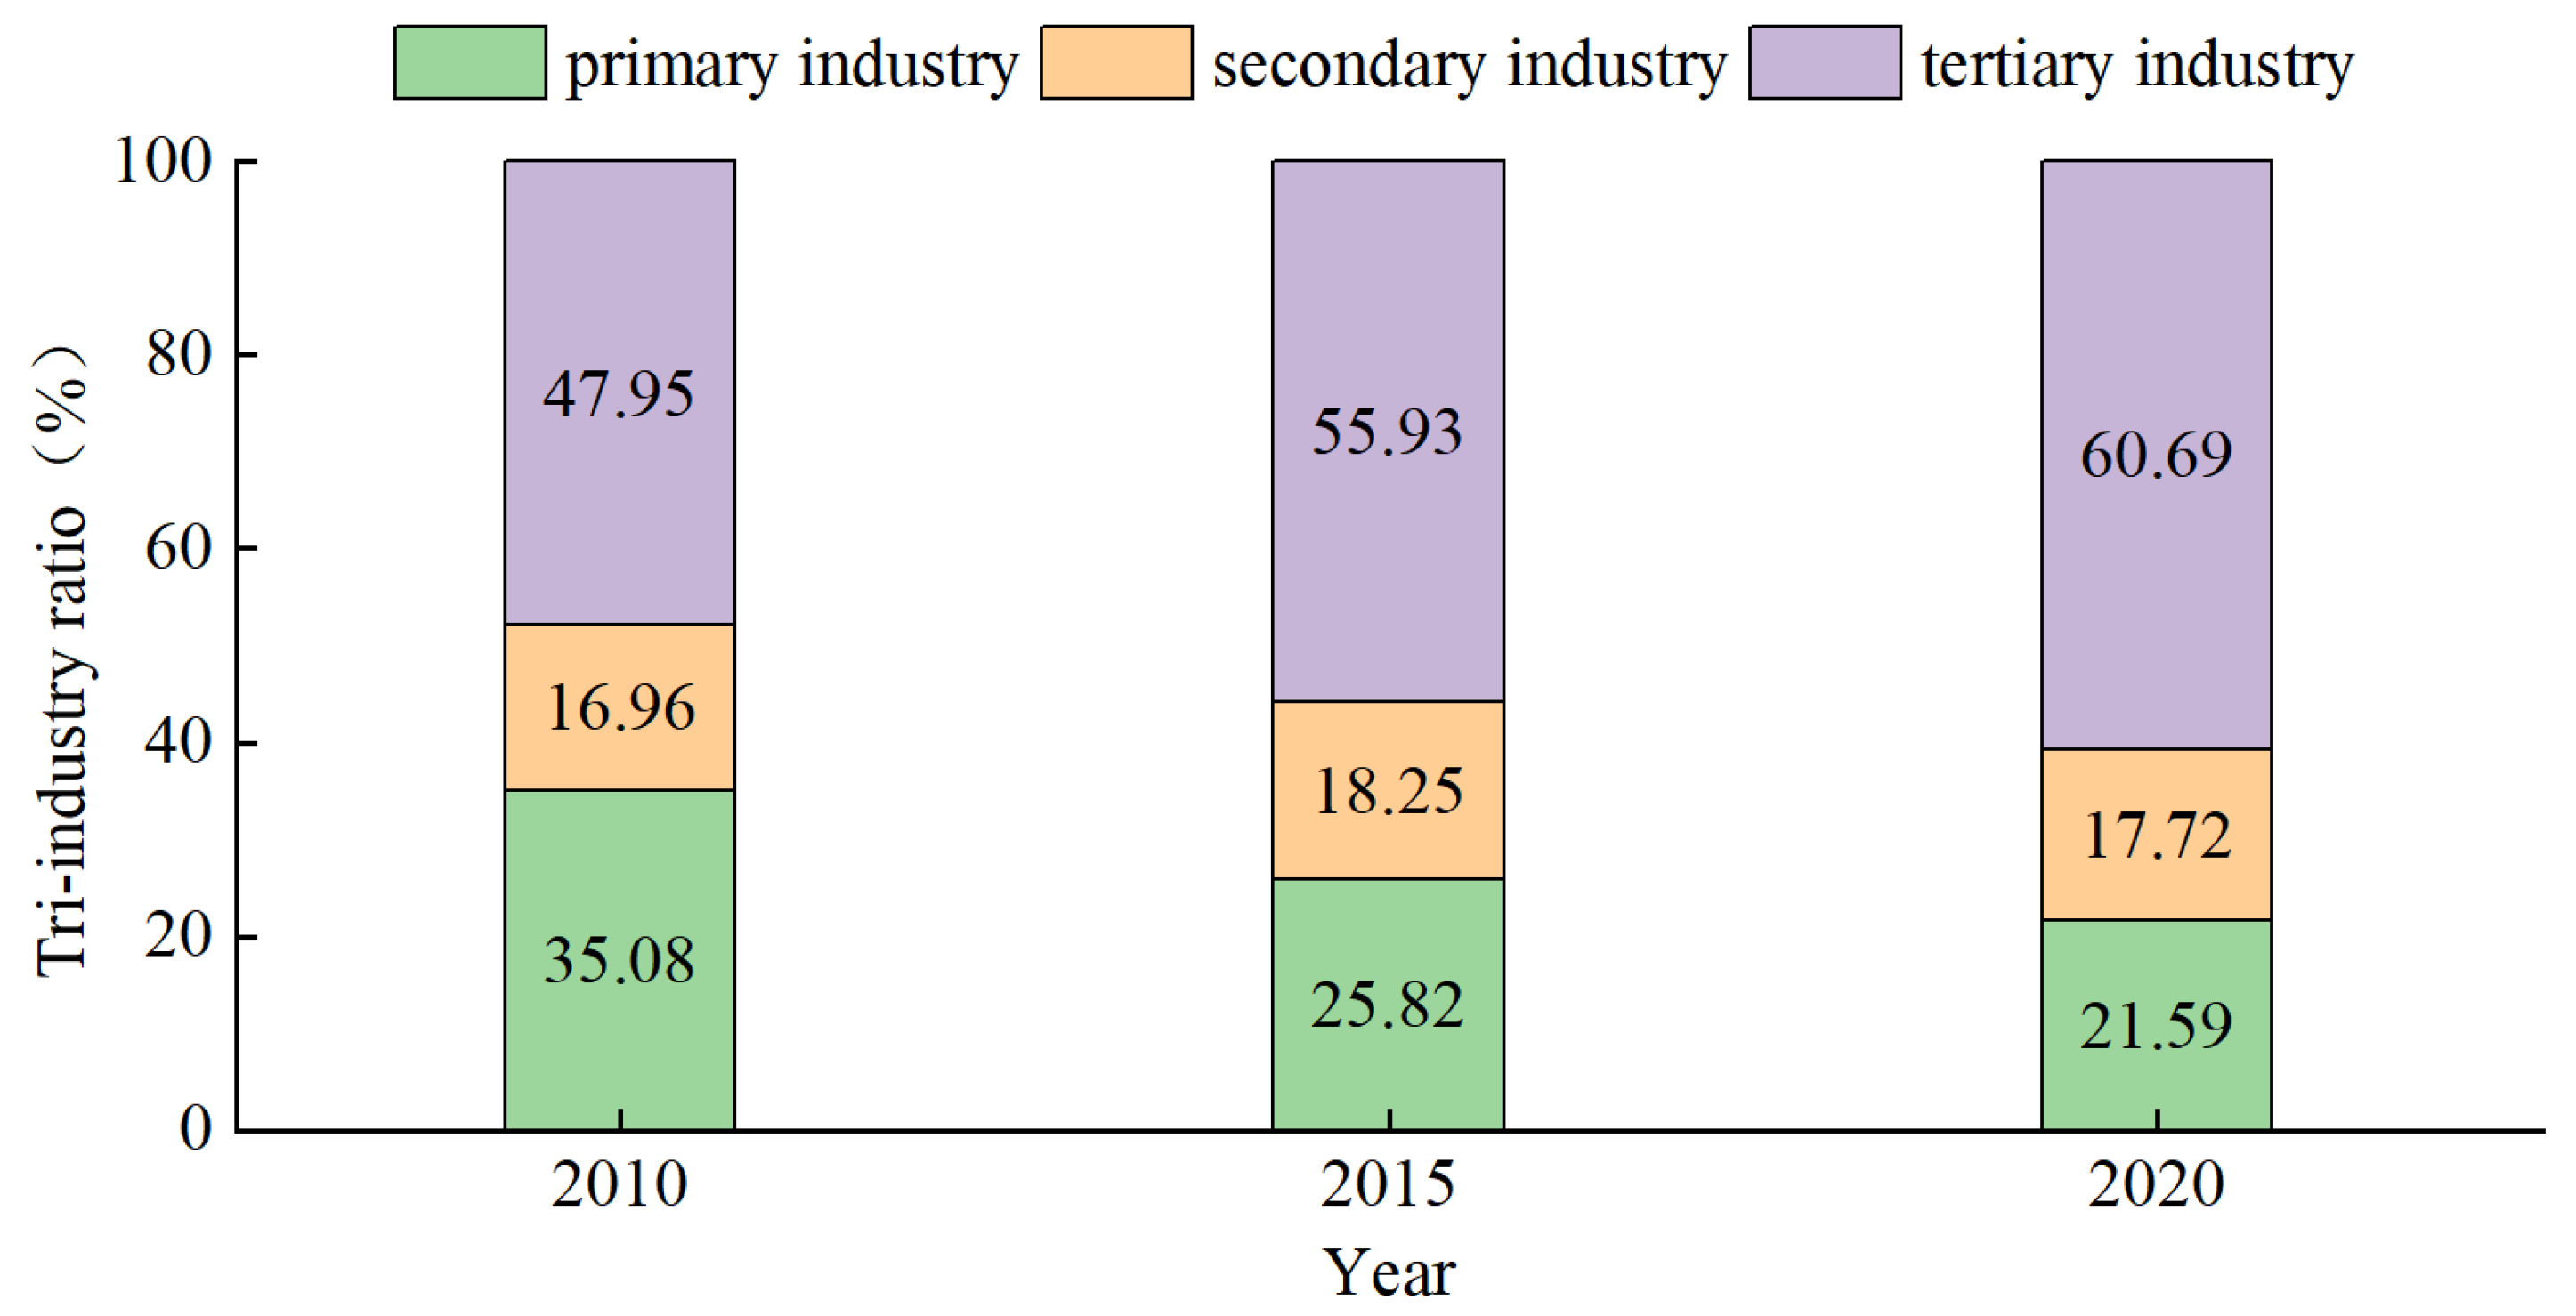
From the perspective of industrial structure, non-agricultural industries have developed rapidly. During the ten-year study period, the average annual growth rates for the secondary and tertiary sectors were 10.88% and 13.02%, respectively, while the average annual growth rate of the primary sector was only 5.16%. The industrial structure changed from 35.08:16.96:47.95 in 2010 to 25.82:18.25:55.92 in 2015, then to 21.64:17.76:60.83 in 2020 (Figure 3). The rapid growth of non-agricultural industries has improved the regional industrial structure. In terms of industry selection, the government played a primary role: to address unemployment, the government focused on the introduction of labor-intensive industries such as textiles and electronic product assemblers; however, local areas lack the resources and supporting industries required for this type of development. Due to their remote geographic location, the market competitiveness of the related products was weak and the enterprises had to rely on government subsidies to survive; thus, later development was sluggish, causing the output of the secondary sector to decline slightly.
In terms of water use intensity, all sectors showed a decreasing trend, with the total industrial water use intensity decreasing from 4136.35 m3/CNY 10,000 in 2010 to 1347 m3/CNY 10,000 in 2020. The water use efficiency of the tertiary sector improved the fastest, with the water use efficiency increasing by 11-fold over the past 10 years; in comparison, water use efficiency in secondary and primary sectors increased by 2.14- and 1.89-times, respectively, over the same period. From the perspective of water use structure, the proportion of the primary sector reached 96.39%; however, through technical measures such as water-saving irrigation, the water use intensity in this sector decreased from 11,710.27 m3/CNY 10,000 in 2010 to 6183.18 m3/CNY 10,000 in 2020. During the same period, however, the scale of arable land increased by 384,700 mu and the decrease in water use intensity was offset by the expansion of arable land.

3.2. Analysis of the Driving Effects of Water Use Changes

Using 2015 as a reference point, the study period was divided into 2010–2015 and 2015–2020 to compare the driving effects underlying the changes in water use before and after the implementation of the targeted poverty alleviation policy. In accordance with Equations (1)–(7), and integrating industrial water use and socioeconomic data, water resource consumption was deconstructed into intensity, structural, income, and population effects.

3.2.1. Analysis of the Driving Effect of Water Use Change from 2010 to 2020

Between 2010 and 2020, industrial water use in the Hotan region initially rose and subsequently declined, with the rate of decline surpassing its previous growth. Relative to 2010, industrial water use in 2020 decreased by 543 million m3. Water use in the primary and tertiary sectors declined by 539 million m3 and 9 million m3, respectively, whereas that in the secondary sector rose by 5 million m3. Per capita GDP exhibited a stable upward trend, while the population expanded rapidly up to 2017 and then stabilized. Analysis of the driving effects indicated that the intensity and structural effects were −2.572 billion m3 and −1.919 billion m3, respectively, accounting for 473.63% and 353.35% of the total effect. This finding suggests that enhancements in industrial water use efficiency and adjustments in industrial structure jointly reduced water consumption, with the efficiency factor playing the more prominent role. The income and population effects were 3.082 billion m3 and 865 million m3, respectively, representing −567.61% and −159.37% of the total impact (Table 3), implying that economic expansion and population growth offset the reduction in industrial water use. As population growth lost momentum, its suppressive influence on water use decline intensified, amplifying the role of economic expansion in limiting further reductions in industrial water consumption.
From the perspective of industrial classifications, the intensity effect exhibited negative values across all three sectors, implying that heightened water use intensity in each sector significantly contributed to the overall decline in water consumption. The structural effect was negative exclusively in the primary sector, suggesting that reductions in water consumption due to structural reconfigurations primarily originated therein. This change derives from a 13.44% decrease in the primary sector’s share in the entire industrial configuration. Both the income and population effects were positive across all three sectors, with the primary sector presenting the highest contribution rate (Table 4). As a traditional agricultural region, the Hotan area’s urbanization rate remains at approximately 20% while agriculture continues to serve as both the chief employment avenue and principal income source for the local workforce, reinforcing the essential role of the primary sector in poverty alleviation.

3.2.2. Comparison of the Driving Effects Before and After Targeted Poverty Alleviation

From 2010 to 2015, the annual fluctuations in industrial water use in the Hotan region were relatively minor, and overall water use remained stable; relative to 2010, water consumption in 2015 decreased by 1.9 million m3. In terms of driving effects, enhanced industrial water use intensity and refined industrial structure produced negative intensity and structural effects, lowering water consumption by 1.256 billion m3 and 1.298 billion m3, respectively, with the structural impact marginally surpassing the intensity counterpart. Conversely, the income and population effects were positive, raising water consumption by 1.992 billion m3 and 559 million m3, respectively. By sector, the intensity effect was negative across all sectors, with the primary sector exhibiting the largest contribution, followed by the secondary and tertiary sectors. The structural effect was negative, attributable to the shrinking share of the primary sector, whereas the secondary and tertiary sectors demonstrated positive values. Regarding the income and population effects, all three sectors presented positive values.
From 2015 to 2020, given ongoing agricultural water-conservation efforts, industrial water consumption in the Hotan region declined substantially, falling by 541 million m3 over five years. The intensity and structural effects were negative, reducing water consumption by 1.399 billion m3 and 702 million m3, respectively. The intensity effect surpassed the structural effect substantially, which is attributable to intensified agricultural water-saving measures. The income and population effects were positive, adding 1.218 billion m3 and 342 million m3 in water use, respectively. By sector, the intensity effect was negative, signifying that per-CNY 10,000 GDP water consumption continued to decline across all industries. The structural effect in the primary and secondary sectors was negative, concurrent with a declining share in GDP. In contrast, the income and population effects remained positive for all sectors.
A comparative assessment of changes pre- and post-implementation of the targeted poverty alleviation policy revealed that reductions in industrial water consumption mainly materialized after the policy’s enactment, with the intensity effect exhibiting the more pronounced impact post-implementation. Although the structural effect remained negative, its overall contribution to water conservation was distinctly diminished relative to the pre-policy period. When examined by sector, the intensity effect across all industries remained negative. The intensity effect in non-secondary sectors presented greater improvements after the targeted poverty alleviation policy took effect. Regarding the structural effect, the primary sector yielded a weaker outcome vis-à-vis the pre-policy period, reflecting the expansion of cultivated land. Local field investigations indicated that advancing agricultural water conservation and broadening cultivated land constitute pivotal elements of the targeted poverty alleviation strategy. From 2018 onward, the Hotan region stepped up its water conservation initiatives, completing high-efficiency irrigation measures over 1.6925 million mu of farmland through 2020. The average irrigation volume per mu fell from 780 m3/mu in 2015 to 684.69 m3/mu in 2020, serving as the largest driver of water consumption reductions. Industrial structural upgrades yielded marked outcomes prior to 2015. However, amid a nationwide economic slowdown, mismatches between poverty alleviation enterprises and local resource endowments, together with expanded cultivated areas, impeded further industrial structural progress after 2015, curtailing its role in water conservation.
Expanding the scale of cultivated land to increase its per capita area was a key measure in Hotan’s targeted poverty alleviation efforts. Driven by water-saving agricultural practices, this expansion did not initially increase water pressure. However, the government has set higher development goals with the implementation of the Rural Revitalization strategy, with land expansion continuing to be a primary measure to achieve these goals; in this context, the Hotan region has already designated 1.1735 million mu as reserve cultivated land, which is currently under development. As the scale of cultivation continues to expand, the water savings generated by agricultural efficiency will eventually be insufficient to offset the increased consumption from this expansion, creating a risk of falling into the “irrigation efficiency paradox” [40,41]. This situation not only jeopardizes the sustainability of poverty alleviation outcomes, but also threatens the stability of the regional ecosystem.

3.3. Matching Analysis of Water Resources and Economic Growth in the Hotan Area

Increases in intensity and structure effects reduce industrial water consumption, thus relieving pressure on regional water resources. However, water resource allocation in the Hotan area is uneven, with a maximum difference in available water resources among counties and cities of more than fivefold. To assess whether enhancement of the intensity and structure effects improves the balance of regional water resource utilization, Gini coefficient values were compared between the 2010–2015 and 2015–2020 periods and the differences in water resource utilization were analyzed by industrial sector; in this way, the balance of water resource utilization between different industries was revealed. We further analyzed the impacts of targeted poverty alleviation measures on the regional balance of water resource allocation.

3.3.1. Analysis of the Water Resources–GDP Gini Coefficient (2010–2020)

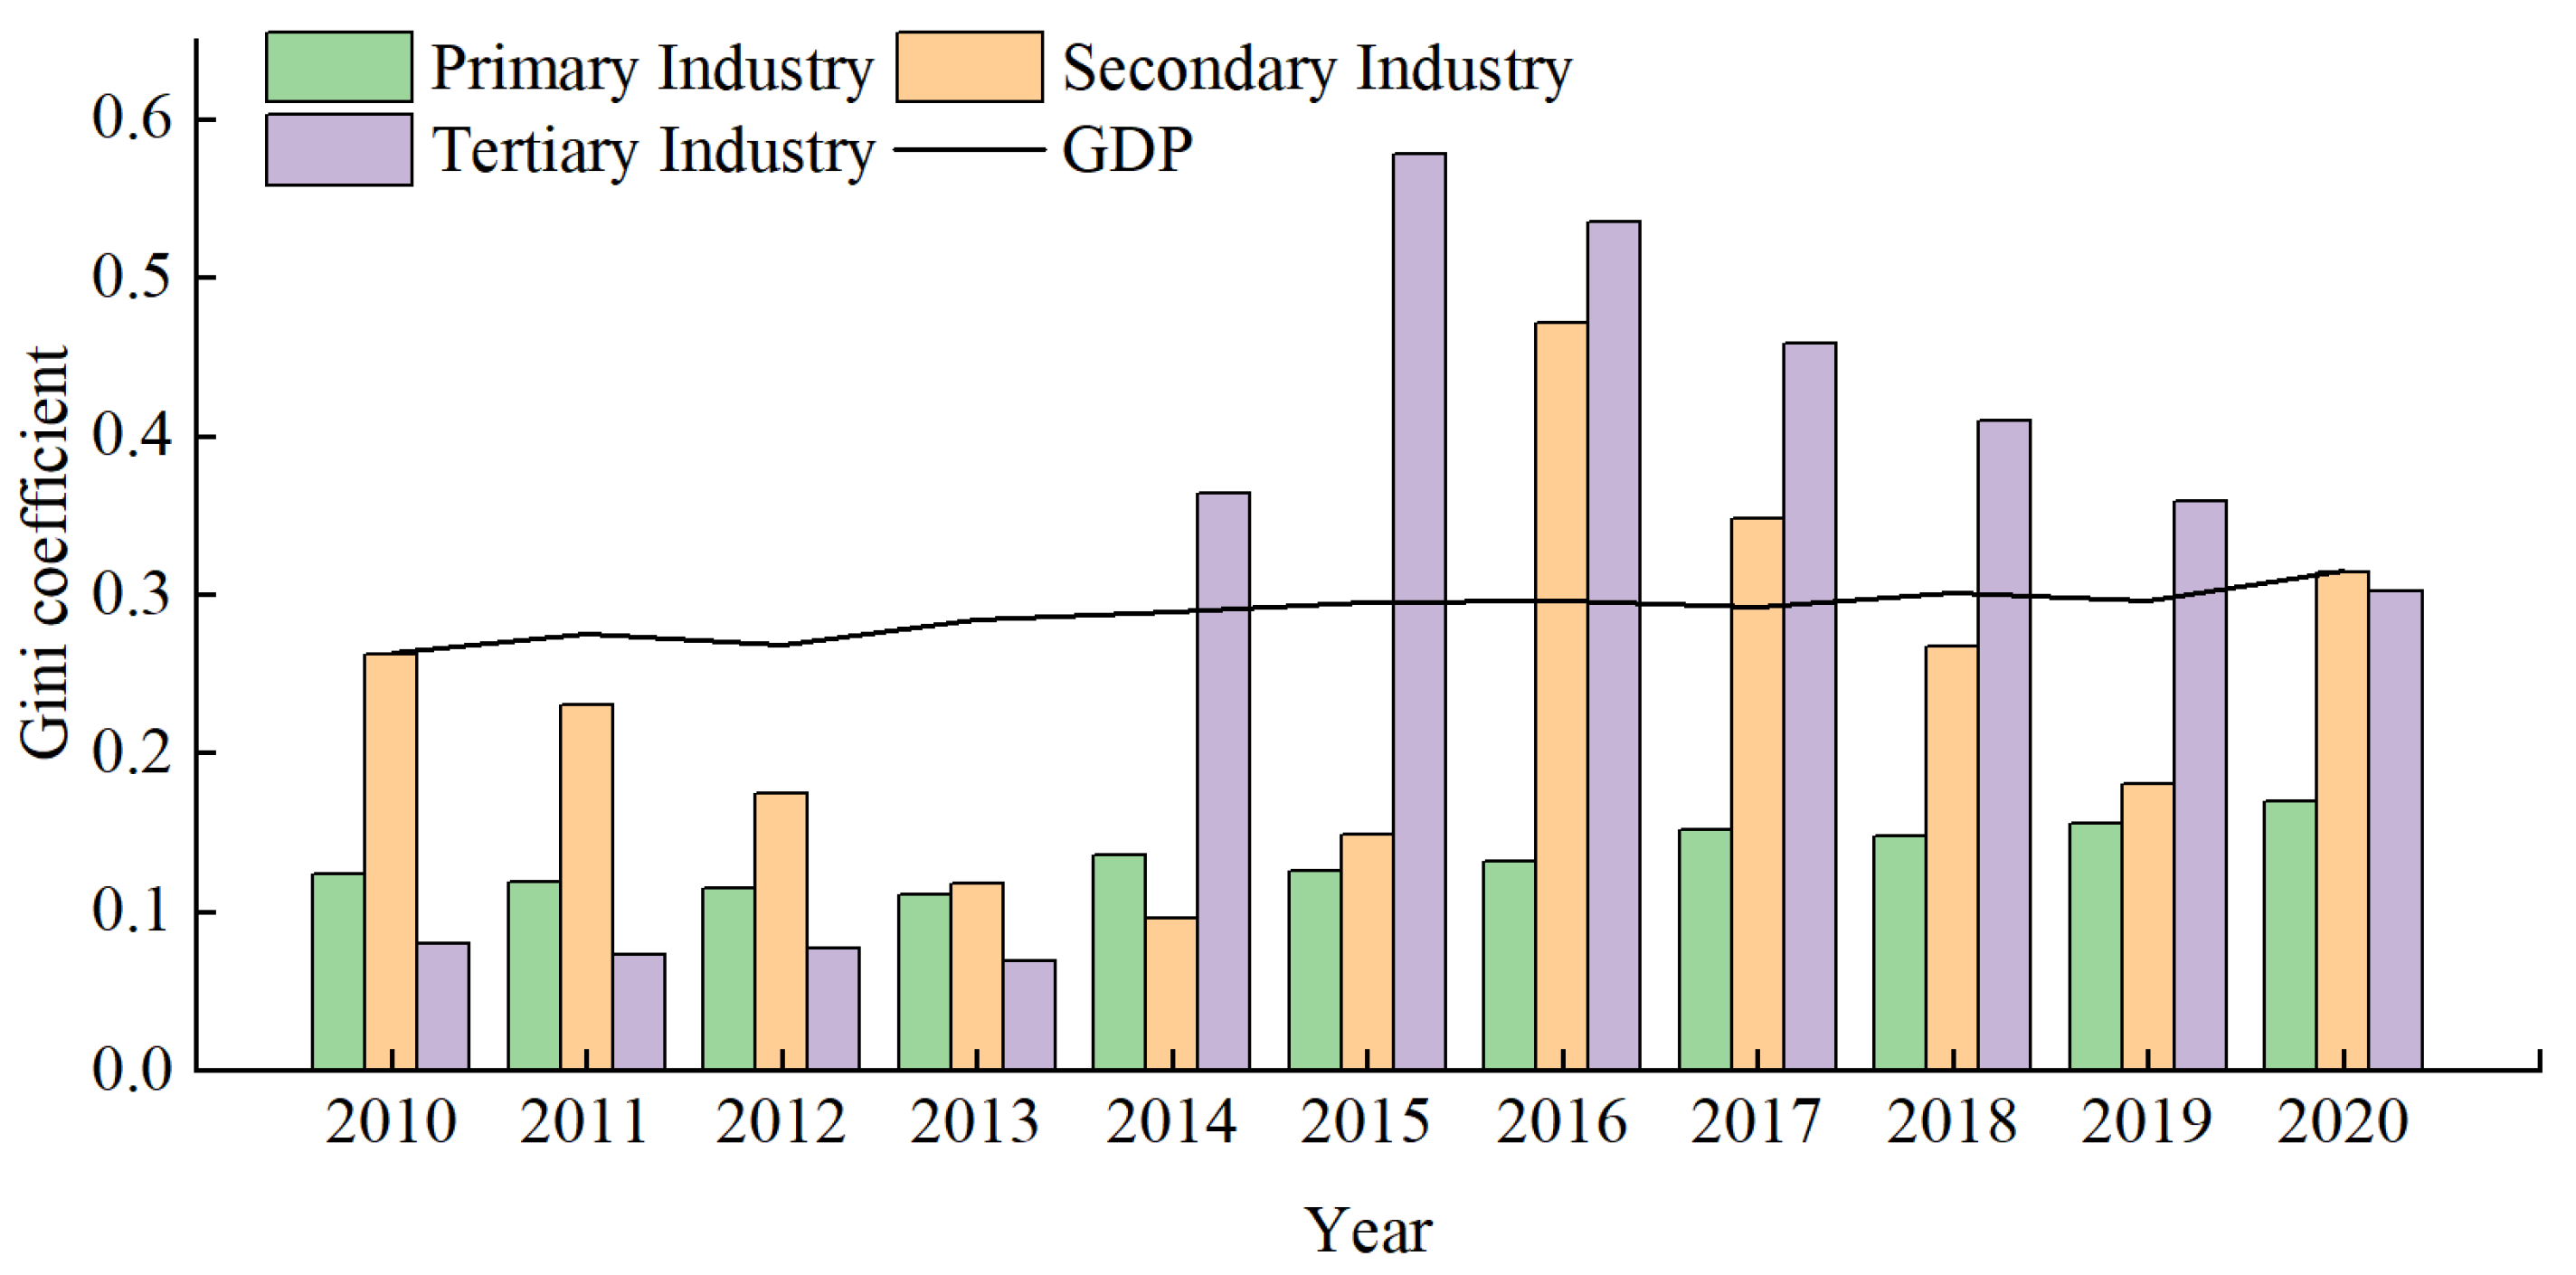
According to the calculations, the Gini coefficient relating water resources to GDP in the Hotan region presented a gradual upward trajectory, rising from 0.26 in 2010 to 0.32 in 2020, thus transitioning from “relatively matched” to “reasonably matched.” The key factor determining the matching degree stems from increases in the Gini coefficient for the secondary and tertiary sectors across multiple counties; the secondary sector’s coefficient climbed from 0.26 in 2010 to 0.31 in 2020, whereas the tertiary sector exhibited a more marked fluctuation—escalating initially and then tapering (from 0.08 in 2010 to 0.30 in 2020). The Gini coefficients for the secondary and tertiary sectors both ultimately dropped to a reasonably matched level, while the primary sector’s coefficient remained relatively stable, varying from 0.11 to 0.16 in a highly matched range (Figure 4).

3.3.2. Comparison of Water Resources—GDP Gini Coefficient Before and After Implementation of Targeted Poverty Alleviation Policy

From 2010 to 2015, the Gini coefficient linking water resources and the GDP of counties and cities in the Hotan region rose from 0.26 to 0.295—an increment of 0.035—indicating that the coefficient remained in the “relatively matched” range. The coefficient for the primary sector fluctuated between 0.124 and 0.126, while that for the secondary sector declined from 0.26 to 0.15, both indicating a “highly matched” status; however, that of the tertiary sector rose precipitously, from 0.08 to 0.58, resulting in a “highly mismatched” condition. From 2015 to 2020, the Gini coefficient relating water resources and GDP inched upward from 0.295 to 0.315, with the overall level of matching declining from “relatively matched” to “reasonably matched.” The primary sector ascended from 0.126 to 0.169, maintaining a “highly matched” level; the secondary sector grew from 0.15 to 0.31, lowering its matching status from “highly matched” to “reasonably matched”; in contrast, the tertiary sector declined from 0.58 to 0.30, elevating its status from “highly mismatched” to “reasonably matched” (Table 5).
After the implementation of the targeted poverty alleviation policy, although industrial water consumption in the Hotan region has declined, the equilibrium in water resource distribution has not improved; as evidenced by the rising trend in the Gini coefficient for water resources and industrial structure of the Hotan region. The targeted poverty alleviation policy sought to eradicate absolute poverty by 2020, with industrial development serving as the principal measure to realize this objective. In arid contexts, water resources are synonymous with productivity, and industrial development remains contingent upon reliable water supplies. The runoff volume of the 36 rivers in the Hotan area varies greatly, and the geographical location of each county and city determines its discursive power in terms of water resource utilization. Counties and cities with better locations are more inclined to increase water use, while counties and cities in worse locations can only improve their water use efficiency. The time limit for eliminating absolute poverty by 2020 exacerbated this trend, with the maximum difference in the proportion of water use among counties and cities increased from 8.6 times in 2010 to 9.6 times in 2020 (Table 6).

4. Conclusions

This study focused on the coordinated relationship between industrial structure and water resources, employing factor decomposition and the Gini coefficient to compare the spatio-temporal evolution of the industry–water resource relationships in the Hotan region before and after the implementation of the targeted poverty alleviation policy. This study analyzed the impacts of targeted poverty alleviation policy on regional water resource pressure and allocation, and evaluated the sustainability of poverty alleviation outcomes from the perspective of coordinated water resource and industrial development. The results informed the following conclusions:
(1)
Targeted poverty alleviation measures have reduced industrial water consumption. A comparison of water consumption before and after the implementation of the targeted poverty alleviation policy revealed a 543 million m3 decrease in industrial water consumption. This reduction can be attributed to technological advancements and shifts in industrial structure, with the intensity and structural effects being the primary drivers of the decline; however, the contribution of the structural effect is significantly lower than that of the intensity effect. An analysis by industrial sector indicated that the decrease in water consumption was mainly due to the enhanced intensity effect in the primary sector. Through the promotion of agricultural water-saving measures, water consumption decreased by 539 million m3 despite a 384,700-mu increase in cultivated land. This is consistent with the findings of Houyin Long et al. [33] regarding the spatio-temporal drivers of water consumption in China, who reported that the agricultural sector has accelerated the modernization of irrigation equipment to minimize unnecessary waste during irrigation. Nevertheless, the potential for water conservation in agriculture is limited, and the associated economic output is relatively low. As such, an over-reliance on agriculture will affect the sustainability of poverty alleviation measures. Although the development of non-agricultural industries in the Hotan region is currently weak, it is necessary to accelerate their development based on their comparative advantages to reduce over-reliance on agriculture, taking into account the associated economic output.
(2)
Targeted poverty alleviation measures have exacerbated the imbalance in the allocation of industrial and water resources between regions. There are significant spatial disparities in water resource allocation in the Hotan region, with counties and cities in advantageous locations having a greater ability to expand their water use; in contrast, counties and cities in worse locations can only seek to improve their water use efficiency. The Gini coefficient for water resources and GDP in the Hotan region was found to rise from 0.26 to 0.32 between 2010 and 2020, indicating a shift from a relatively matched to a reasonably matched state. The pressure imposed by the poverty alleviation policy has worsened the spatial imbalance of water resource utilization—a problem also identified in the analysis of water resource use efficiency in Xinjiang by Zhang Liming et al. [42]. The imbalanced allocation of water resources is a widespread problem in China [43,44]. To ensure balanced regional water allocation, the Chinese government has previously adopted measures such as inter-regional water transfers [43] and strengthened water use controls. Although the Hotan region has 36 rivers, their discharge rates vary significantly. Therefore, achieving an equitable distribution of water resources necessitates the strengthening of water network infrastructure and the implementation of unified management. At the same time, the poverty alleviation indicator assessment system should be further refined. At present, poverty alleviation policies in China focus solely on economic indicators and lack consideration of the stability of the “economy–resource–ecology” system. This has led some regions to over-exploit key resources under the pressure of poverty alleviation. Therefore, it is advisable to include restrictive indicators for resource development in the assessment criteria to ensure the sustainability of development outcomes.

Author Contributions

J.-W.H.: conceptualization, writing—original draft; F.-Q.X.: data curation, writing—original draft; R.-Q.L.: investigation, methodology; D.-N.L.: investigation, methodology; D.-G.Y.: writing—review and editing; Y.C.: visualization. All authors have read and agreed to the published version of the manuscript.

Funding

This work was supported by the Young Scholars of the West (Grant No. 2020-XBQNXZ-011). The Third Xinjiang Comprehensive Scientific Expedition “Investigation of Agricultural Resources and Optimization of Production Structure Layout in the Ili River Basin” project (Grant No. 2022xjkk050102).

Data Availability Statement

The original contributions presented in this study are included in the article. Further inquiries can be directed to the corresponding author.

Conflicts of Interest

The authors declare no conflicts of interest.

References

  1. Guo, Y.Z.; Zhou, Y.; Liu, Y.S. Targeted poverty alleviation and its practices in rural China: A case study of Fuping county, Hebei Province. J. Rural Stud. 2022, 93, 430–440. [Google Scholar] [CrossRef]
  2. United Nations (UN). The Millennium Development Goals Report 2015; United Nations: New York, NY, USA, 2015. [Google Scholar]
  3. Liu, Y.; Liu, J.; Zhou, Y. Spatio-temporal patterns of rural poverty in China and targeted poverty alleviation strategies. J. Rural Stud. 2017, 52, 66–75. [Google Scholar] [CrossRef]
  4. Guo, Y.; Zhou, Y.; Cao, Z. Geographical patterns and anti-poverty targeting post-2020 in China. J. Geogr. Sci. 2018, 28, 1810–1824. [Google Scholar]
  5. Zhou, Y.; Guo, Y.; Liu, Y. Comprehensive measurement of county poverty and anti-poverty targeting after 2020 in China. Acta Geogr. Sin. 2018, 73, 1478–1493. [Google Scholar]
  6. Liu, Y.X. Study on farmers cooperative poverty alleviation model in underdeveloped. Issues Agric. Econ. 2015, 7, 110–111. [Google Scholar]
  7. Liu, Y.S.; Wang, Y.S. Rural land engineering and poverty alleviation: Lessons from typical regions in China. J. Geogr. Sci. 2019, 29, 643–657. [Google Scholar] [CrossRef]
  8. Yin, D.; Zhu, H. The mechanism and comprehensive effect of poverty alleviation with characteristic agriculture in typical mountainous rural areas of Yunnan Province: A case study on the production of special cash crops. Acta Geogr. Sin. 2022, 77, 888–899. [Google Scholar]
  9. Xie, S.Y.; Yin, J.J.; Qiao, H.F.; Lu, J.; Li, L.; Wang, A.Q. Research on rural tourism poverty-alleviation modes and the difference of their effects in Enshi prefectur. Hum. Geogr. 2021, 181, 184–192. [Google Scholar]
  10. Liang, S.F.; Zheng, H.X.; Xu, S.S. The scale characteristics and economic efficiency evaluation of poverty alleviation industry development concentrated and contiguous destitute areas—A case study of WuLing mountain district Enshi autonomous prefecture. Chin. J. Agric. Resour. Reg. Plan. 2020, 41, 1–8. [Google Scholar]
  11. Zheng, J.; Zhu, T.T. Economic and social efficiency: Overall evaluation about the fiscal subsidy for agricultural insurance. J. Financ. Econ. 2014, 29, 88–97. [Google Scholar]
  12. Deng, K. Evaluation of the efficiency of financial poverty alleviation and agricultural support measures: A case study of Bazhong city in the Qinba mountain region. Rural Econ. 2015, 5, 86–91. [Google Scholar]
  13. Huang, Y.J.; Wang, R.; Liu, Y. Analysis of factors influencing the poverty alleviation efficiency of agricultural insurance subsidies based on the DEA-Tobit panel model: A case study of hunan province. Rural Econ. 2018, 5, 69–74. [Google Scholar]
  14. Cashley, J. Tourism and Poverty Reduction: Pathways to Prosperity; The Cromwell Press Group: Trowbridge, UK, 2010. [Google Scholar]
  15. Ravallion, M.; Datt, G. Why has economic growth been more pro-poor in some states of India than others? J. Dev. Econ. 2002, 68, 381–400. [Google Scholar] [CrossRef]
  16. Suryahad, A.; Suryadarma, D.; Sumarto, S. The effects of location and sectoral components of economic growth on poverty: Evidence from Indonesia. J. Dev. Econ. 2009, 89, 109–117. [Google Scholar] [CrossRef]
  17. Ferreira, H.G.; Leite, P.G.; Ravallion, M. Poverty reduction without economic growth? Explaining Brazil’s poverty dynamics, 1985–2004. J. Dev. Econ. 2010, 93, 20–36. [Google Scholar] [CrossRef]
  18. Fu, B.J.; Liu, Y.X.; Wang, S.; Song, J.; Li, Z. Scientifically improving human-nature relationship in desertification areas. Bull. Chin. Acad. Sci. 2024, 39, 2027–2036. [Google Scholar]
  19. Ma, W.J.; Zhang, W.S.; Li, C.Y.; Kou, J.W.; Wang, M.M.; Xue, B. Spatiotemporal characteristics and driving factors of allotropic growth of economic scale and marginal benefits of water resources in the Yellow River Basin. J. Nat. Resour. 2023, 35, 3116–3134. [Google Scholar] [CrossRef]
  20. Metha, P.; Siebert, S.; Kummu, M.; Deng, Q.; Ali, T.; Marston, L.; Xie, W.; Davis, K.F. Half of twenty-first century global irrigation expansion has been in water-stressed regions. Nat. Water 2024, 2, 254–261. [Google Scholar]
  21. Nourl, H.; Stokvis, B.; Galindo, A.; Blatchford, M.; Hoekstra, A. Water scarcity alleviation through water footprint reduction in agriculture: The effect of soil mulching and drip irrigation. Sci. Total Environ. 2019, 653, 241–252. [Google Scholar]
  22. van Vliet, M.T.H.; Jones, E.R.; Flörke, M.; Franssen, W.H.P.; Hanasaki, N.; Wada, Y.; Yearsley, J.R. Global water scarcity including surface water quality and expansions of clean water technologies. Environ. Res. Lett. 2021, 16, 024020. [Google Scholar] [CrossRef]
  23. Maraseni, T.; Mushtaq, S. Carbon smart agriculture: An integrated regional approach offers significant potential to increase profit and resource use efficiency, and reduce emissions. J. Clean. Prod. 2020, 282, 124555. [Google Scholar] [CrossRef]
  24. Ravar, Z.; Zahraie, B.; Sharifinejad, A.; Gozini, H.; Jafari, S. System dynamics modeling for assessment of water-food-energy resources security and nexus in Gavkhuni Basin in Iran. Ecol. Indic. 2020, 108, 105682. [Google Scholar] [CrossRef]
  25. Zhang, Y.L.; Lu, Y.Y.; Zhou, Q.; Wu, F. Optimal water allocation scheme based on trade-offs between economic and ecological water demands in the Heihe River Basin of Northwest China. Sci. Total Environ. 2020, 703, 134958. [Google Scholar] [CrossRef]
  26. Jia, S.F.; Liu, W.H. Tracing and thinking about 40% threshold value of water resources development and utilization ratio. Water Resour. Prot. 2021, 37, 87–89. [Google Scholar]
  27. Wang, X.Q.; Zhang, Y. The allow able exploitation rate of rivers water resources of the seven major rivers in China. J. Nat. Resour. 2008, 23, 500–506. [Google Scholar]
  28. Li, B.; Chen, W.; Xu, X.Y.; Wang, H.R.; Han, D.M. Research on the utilization ratio of the third class water resources regions based on ecological function. J. Nat. Resour. 2016, 31, 1918–1925. [Google Scholar]
  29. Li, Y.J.; Zhang, Z.Y.; Shi, M.J. What should be the future industrial structure of the Beijing-Tianjin-Hebei city region under water resource constraint? An inter-city input-output analysis. J. Clean. Prod. 2019, 239, 118117. [Google Scholar] [CrossRef]
  30. Ang, B.W. Decomposition analysis for policymaking in energy: Which is the preferred method? Energy Policy 2004, 32, 1131–1139. [Google Scholar] [CrossRef]
  31. Ang, B.W. The LMDI approach to decomposition analysis: A practical guide. Energy Policy 2005, 33, 867–871. [Google Scholar] [CrossRef]
  32. Zhang, C.J.; Zhao, C.X.; Lin, L.; Yu, X.Y. Driving effect of spatial-temporal differences in water consumption in the Yangtze River Delta. Resour. Sci. 2018, 40, 89–103. [Google Scholar]
  33. Long, H.Y.; Lin, B.Q.; Ou, Y.T.; Chen, Q. Spatio-temporal analysis of driving factors of water resources consumption in China. Sci. Total Environ. 2019, 690, 1321–1330. [Google Scholar] [CrossRef]
  34. Liu, C.L.; Liu, W.D.; Lu, D.D.; Chen, M.X.; Xu, M. A study of provincial differences in China’s eco-compensation Framework. Acta Geogr. Sci. 2017, 27, 240–256. [Google Scholar] [CrossRef]
  35. Ali, H.E.; Sami, S.M. Inequality, Economic Growth and Natural Resources Rent: Evidence from the Middle East and North Africa; Palgrave Macmillan: Basingstoke, UK, 2016. [Google Scholar]
  36. Peng, L.; Deng, W.; Tan, J.; Lin, L. Restriction of economic development in the Hengduan Mountains Area by land and water resources. Acta Geogr. Sin. 2020, 75, 1996–2008. [Google Scholar]
  37. Jantzen, R.T.; Volpert, K. On the mathematics of income inequality: Splitting the Gini index in two. Am. Math. Mon. 2012, 119, 824–837. [Google Scholar] [CrossRef]
  38. Yang, J.; Huang, X. The 30 m annual land cover datasets and its dynamics in China from 1985 to 2022. Earth Syst. Sci. Data 2023, 13, 3907–3925. [Google Scholar] [CrossRef]
  39. Christiaensen, L.; Demery, L.; Kuhl, J. The (evolving) role of agriculture in poverty reduction-An empirical perspective. J. Dev. Econ. 2011, 96, 239–254. [Google Scholar] [CrossRef]
  40. Lai, J.; Li, Y.; Chen, J.; Niu, G.-Y.; Lin, P.; Li, Q.; Wang, L.; Han, J.; Luo, Z.; Sun, Y. Massive crop expansion threatens agriculture and water sustainability in northwestern China. Environ. Res. Lett. 2022, 17, 034003. [Google Scholar] [CrossRef]
  41. Zhao, N.; Zheng, X.J.; Zhan, B.; Tian, S.; Du, L.; Li, Y. Does water-saving irrigation truly conserve water? Yes and No. Agric. Water Manag. 2025, 311, 109399. [Google Scholar] [CrossRef]
  42. Zhang, L.M.; Wang, H.R.; Pan, C.Z.; He, J. Empirical analysis on the influence of industrial structure adjustment on water resource utilization efficiency in resource-based regions: Empirical evidence from 10 resource—Based provinces in China. J. Beijing Norm. Univ. (Nat. Sci.) 2021, 57, 353–360. [Google Scholar]
  43. Lu, P. Impacts of Water Resources Economic Policies on China’s Regional Economy. Ph.D. Dissertation, University of Science and Technology, Beijing, China, 2015. [Google Scholar]
  44. Sun, Z.J.; Gu, W.; Li, H.M.; Tian, Y.; Sun, J.Y. Evaluation and analysis of spatial equilibrium of water resources in Anhui Province. Express Water Resour. Hydropower Inf. 2025, 1–13. Available online: https://link.cnki.net/urlid/42.1142.TV.20250408.1406.007 (accessed on 2 September 2025).
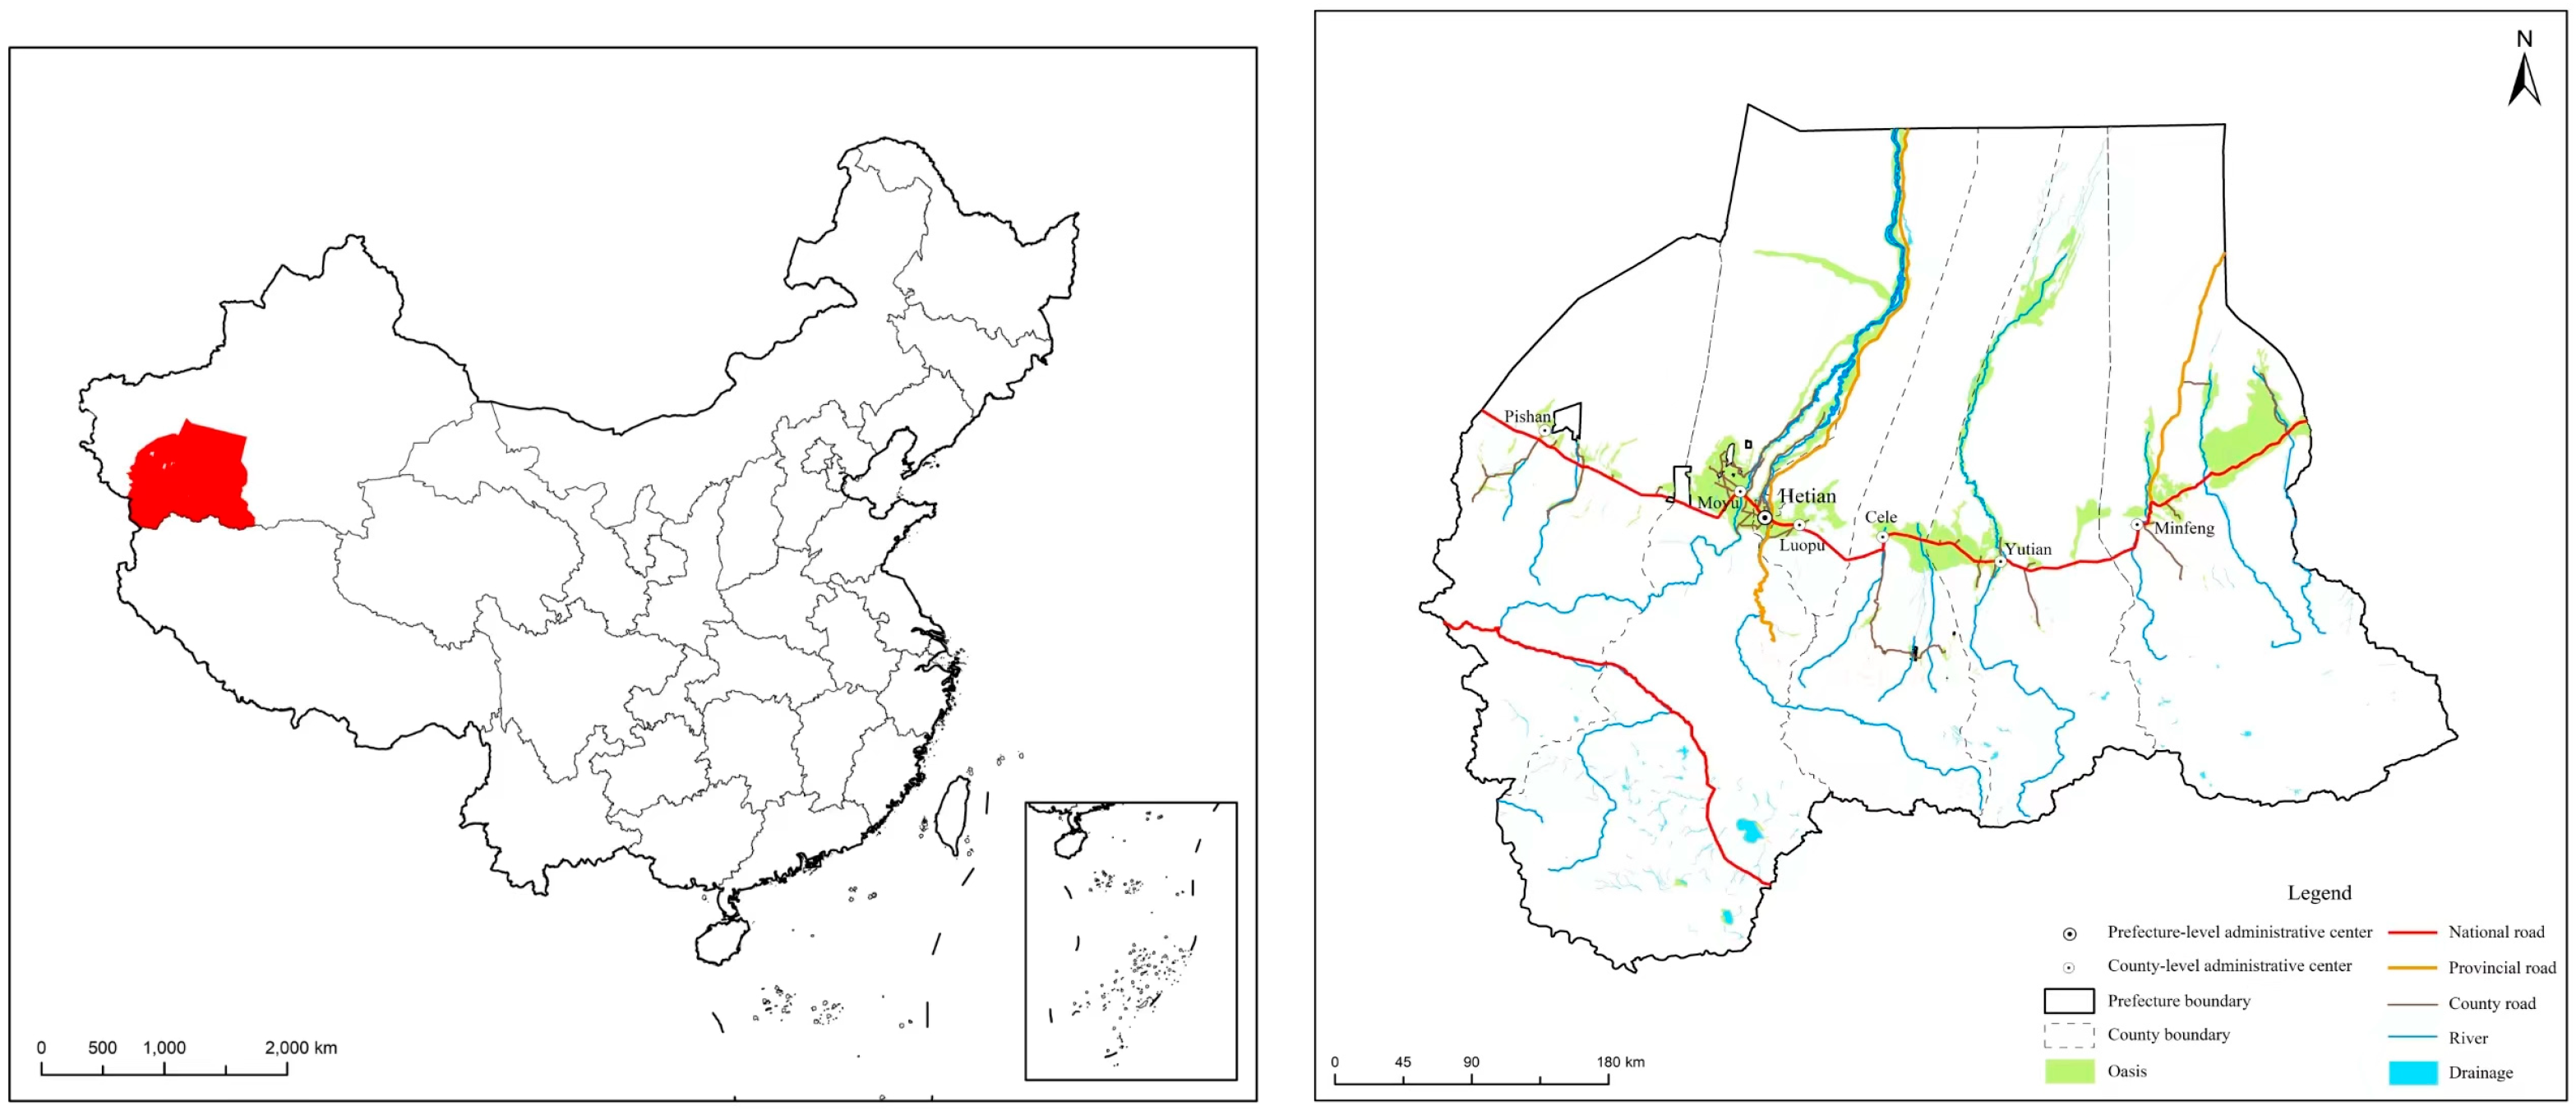
Figure 1. Location map of the Hotan area (approval number: GS(2019) No. 1698).
Water 17 03053 g001
Figure 2. Annual changes in the GDP in the Hotan region.
Water 17 03053 g002
Figure 3. Changes in the industrial structure in the Hotan area.
Water 17 03053 g003
Figure 4. Changes in the water resources—GDP Gini coefficient in the Hotan area.
Water 17 03053 g004
Table 1. Structural analysis of the driving effects underlying the difference in total water consumption over time.
Industrial Water ConsumptionIndustrial Water Use IntensityIndustrial StructureIncome
Level
Population
Size
Decomposition
Effect
W1I1 = W1/G1S1 = G1/GlmwPI1 × S1 × lnC × P
W2I2 = W2/G2S2 = G2/GlmwPI2 × S2 × lnC × P
W3I3 = W3/G3S3 = G3/GlmwPI3 × S3 × lnC × P
i = 1 3 W i = W - i = 1 3 S i = 1 -- i = 1 3 I i × S i × I n c × P = W
Table 2. Criteria for dividing the matching degree of water resources and GDP.
Gini Coefficient Interval(0, 0.2)(0.2, 0.3)(0.3, 0.4)(0.4, 0.5)(0.5, 1)
Matching DegreeHighly matchedRelatively matchedReasonably matchedRelatively mismatchedHighly mismatched
Table 3. Contribution rates of driving effects to change in industrial water consumption in the Hotan area.
YearIntensity EffectStructural EffectIncome EffectDemographic EffectTotal Effect
2010–2020−25.71−19.1930.828.65−5.43
(473.48%)(353.41%)(−567.59%)(−159.3%)(100)
2010–2015−12.56−12.9819.935.59−0.02
(628%)(649%)(−996.5%)(−279.5%)(100)
2015–2020−13.99−7.0212.123.422−5.41
(258.6%)(129.76%)(−224.03%)(−63.37%)(100)
Table 4. Industrial differences in the driving effects of industrial water use changes in the Hotan area.
YearsIntensity EffectStructural EffectIncome EffectPeople Effect
P1S2T3P1S2T3P1S2T3P1S2T3
2010–2020−25.39−0.14−0.18−19.210.010.0230.620.140.068.600.040.02
2010–2015−12.40−0.11−0.05−13.010.010.0319.780.070.085.550.020.02
2015–2020−13.77−0.01−0.21−7.020.000.0112.090.050.033.400.020.01
Note: P1 = primary sector; S2 = secondary sector; T3 = tertiary sector.
Table 5. Changes in the Gini coefficient of water resources and industrial structure for the period 2010–2020.
Year Industrial
Sector
Gini Coefficient of
Primary Sector
Gini Coefficient of
Secondary Sector
Gini Coefficient of
Tertiary Sector
GDP
Gini Coefficient
20100.1240.260.080.26
Highly matchedRelatively matchedHighly matchedRelatively matched
20150.1260.150.580.295
Highly matchedHighly matchedHighly mismatchedRelatively matched
20200.1690.310.300.32
Highly matchedReasonably matchedReasonably matchedReasonably matched
Table 6. Water consumption and GDP proportions of each county and city in Hotan Prefecture.
201020152020
Water Use
Proportion%
% of
GDP
Water Use
Proportion%
% of
GDP
Water Use
Proportion%
% of
GDP
Yutian County16.8410.9216.5510.0618.289.89
Moyu County26.6717.5925.4216.6025.1416.46
Luopu County14.0610.9214.2110.3714.9210.66
Hotan County11.1210.1613.4211.1114.9012.53
Pishan County14.1813.2014.6112.4411.2410.87
Cele County7.367.637.397.146.637.05
Minfeng County3.103.992.343.782.623.96
Hotan City6.6525.586.0628.506.2628.59
Hotan Region100100100100100100
Disclaimer/Publisher’s Note: The statements, opinions and data contained in all publications are solely those of the individual author(s) and contributor(s) and not of MDPI and/or the editor(s). MDPI and/or the editor(s) disclaim responsibility for any injury to people or property resulting from any ideas, methods, instructions or products referred to in the content.