The Impact of China’s Targeted Poverty Alleviation Policy on Water Resource Utilization Pressure and Allocation in Arid Regions: A Case Study of Hotan Prefecture, Xinjiang
Abstract
1. Introduction
2. Materials and Methods
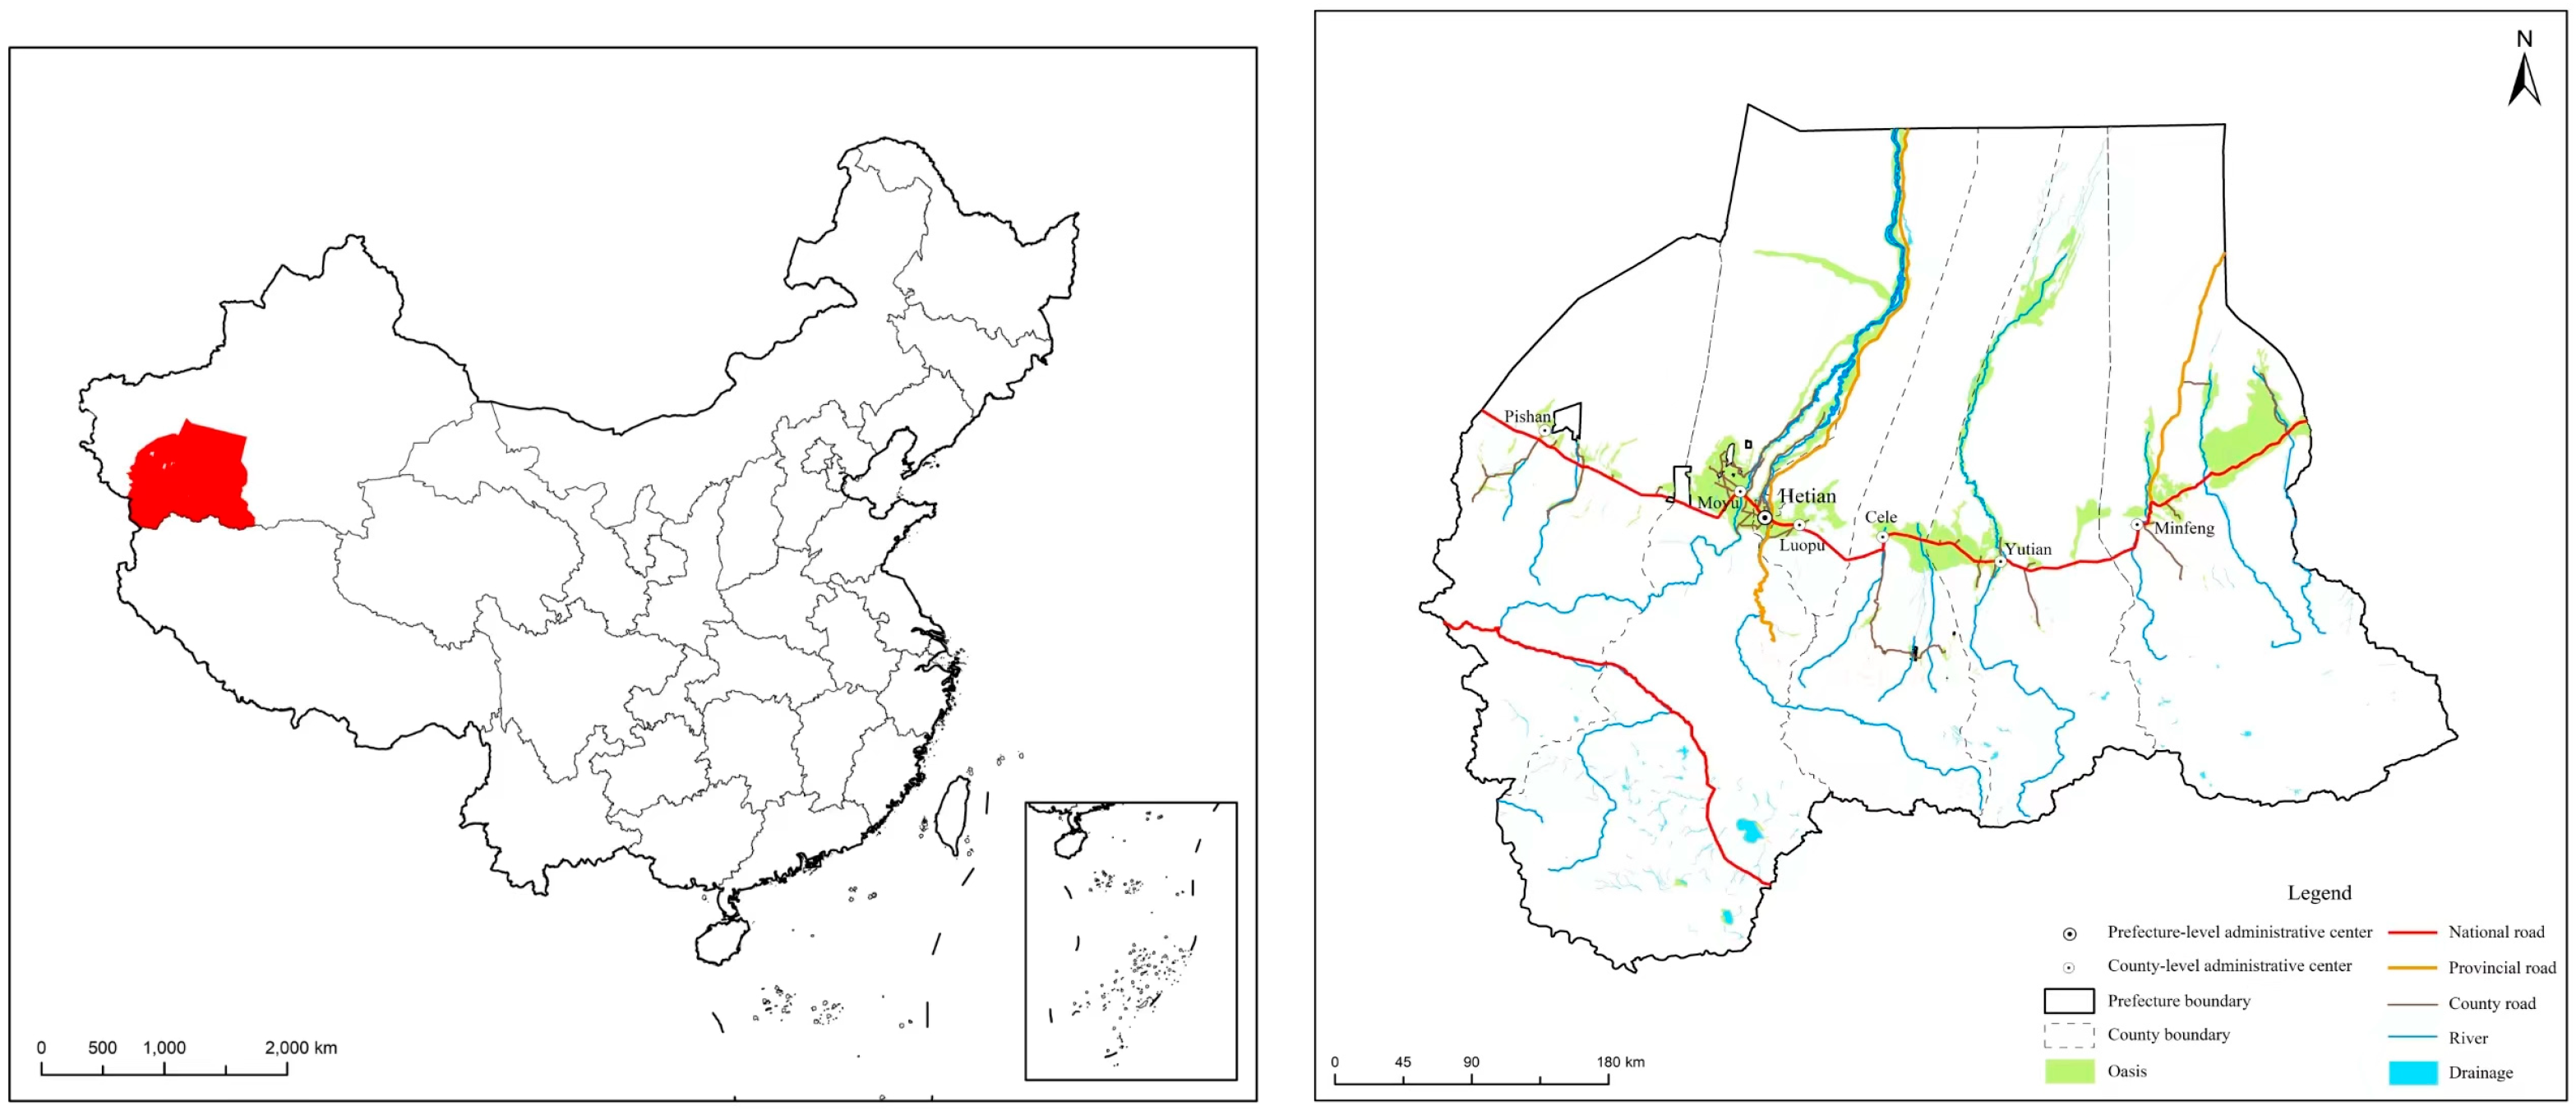
2.1. Overview of the Study Area
2.2. Settings for the Factor Decomposition Model
2.3. Calculation Methods for the Gini Coefficient of Water Resources
2.4. Data Sources
3. Results and Discussion
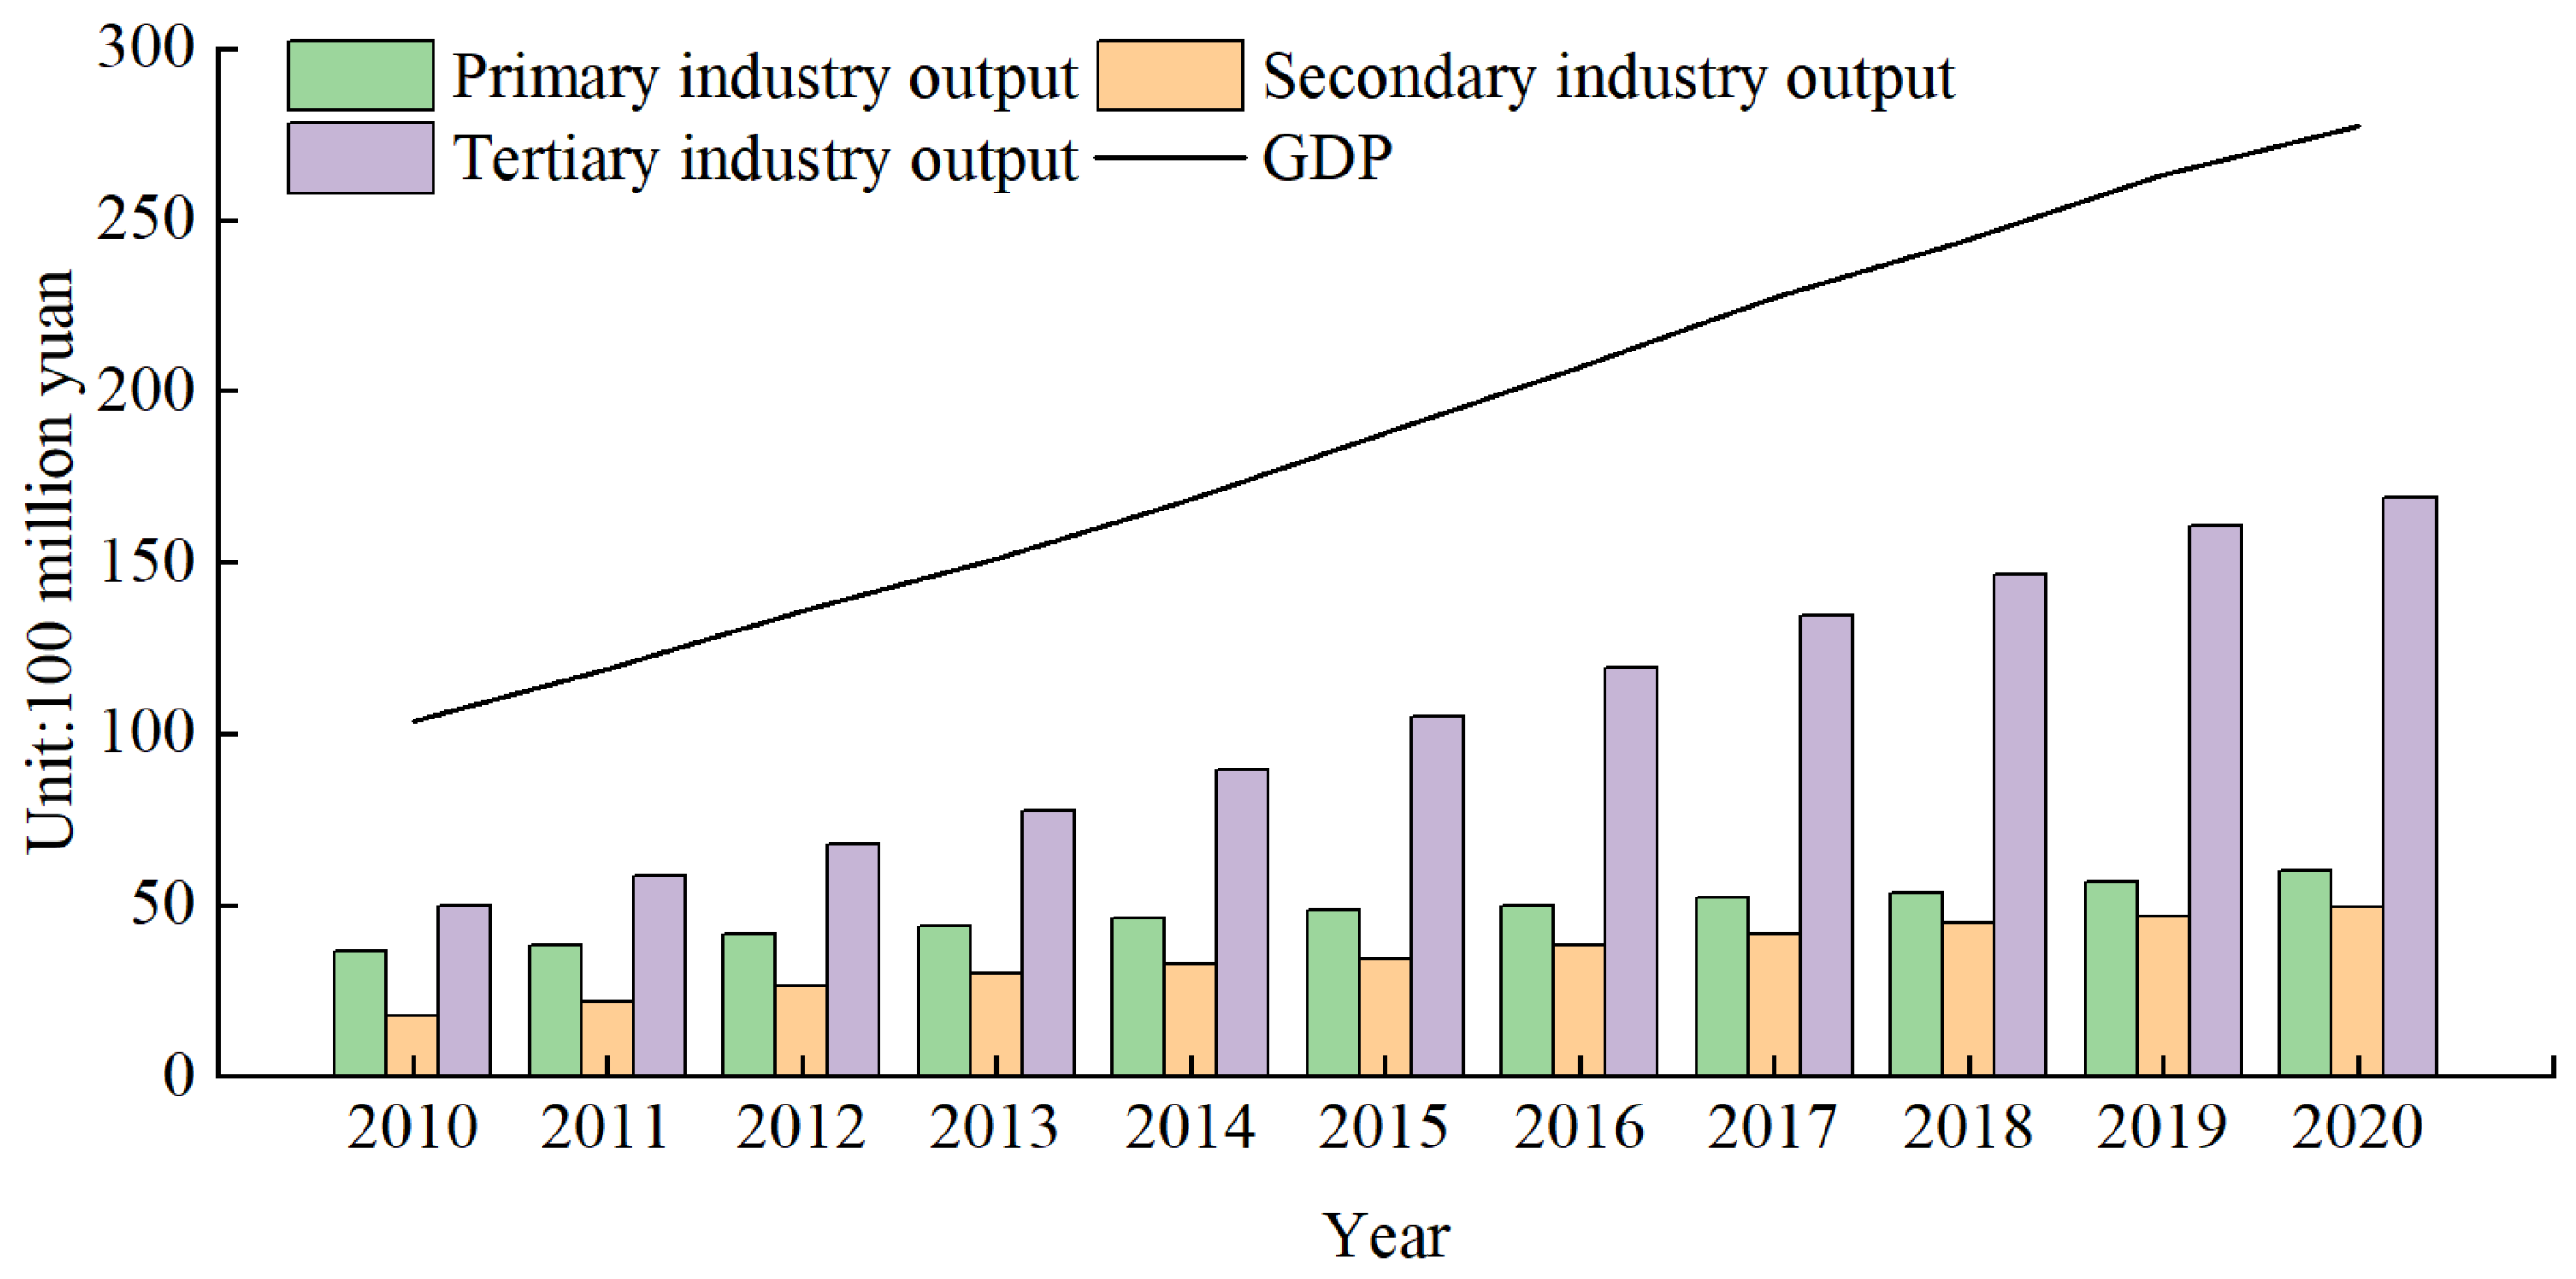
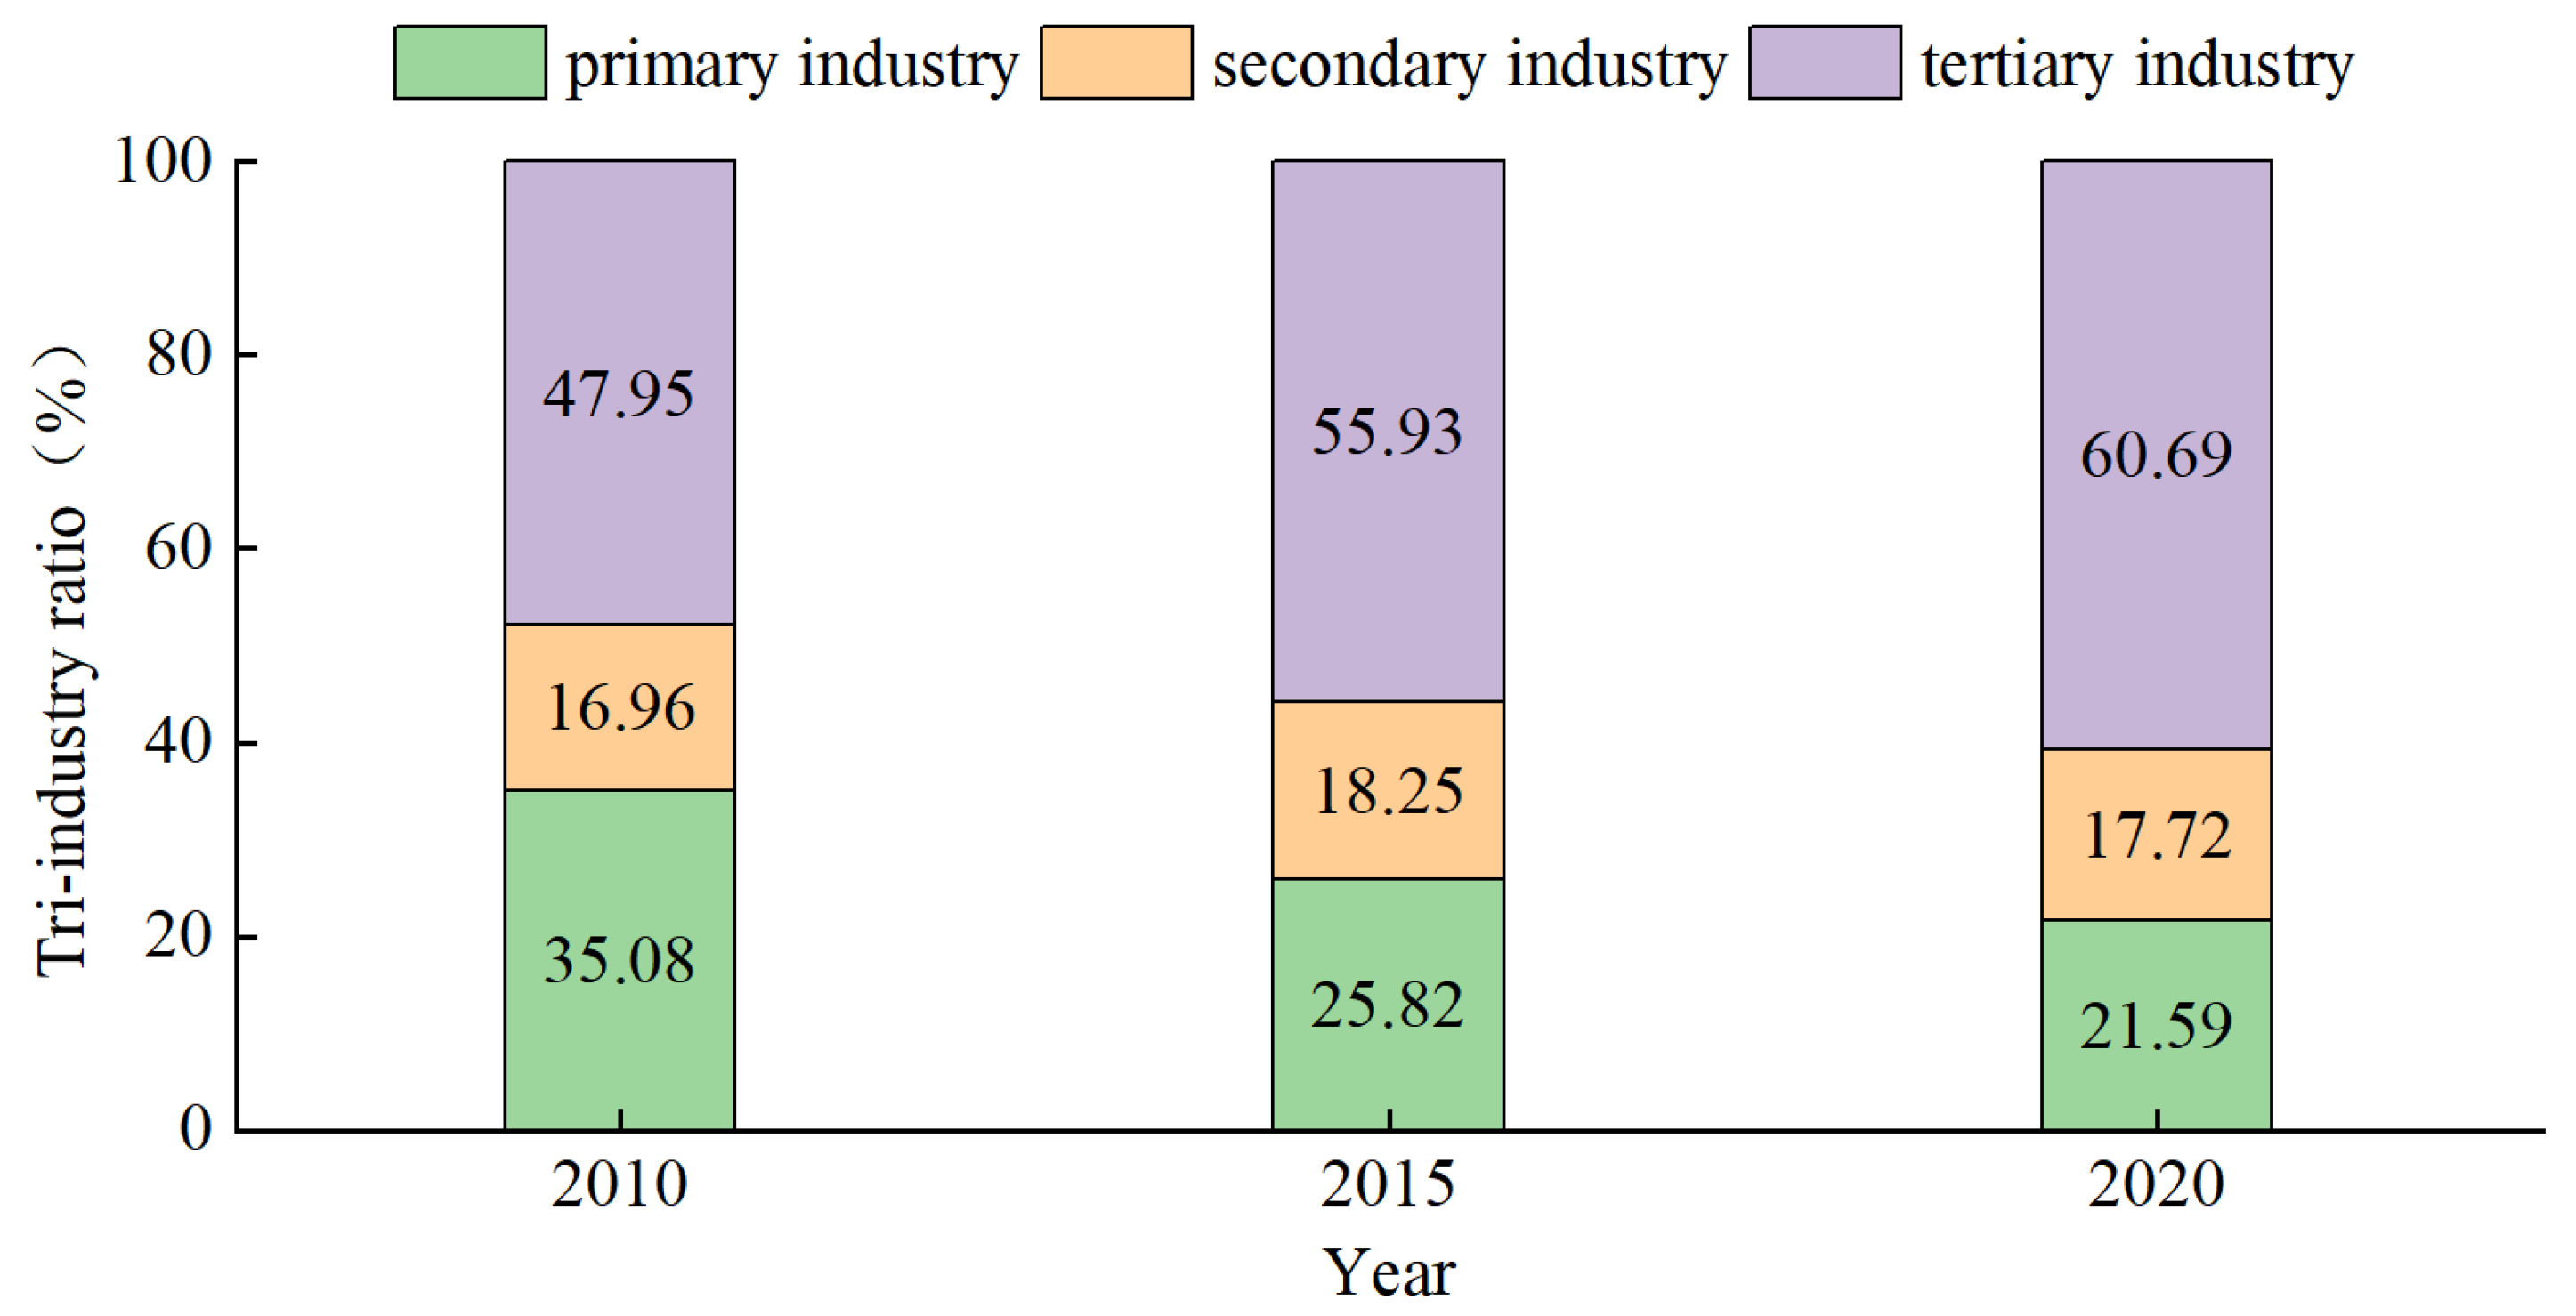
3.1. Analysis of the Industrial Poverty Alleviation Measures in the Hotan Area
3.2. Analysis of the Driving Effects of Water Use Changes
3.2.1. Analysis of the Driving Effect of Water Use Change from 2010 to 2020
3.2.2. Comparison of the Driving Effects Before and After Targeted Poverty Alleviation
3.3. Matching Analysis of Water Resources and Economic Growth in the Hotan Area
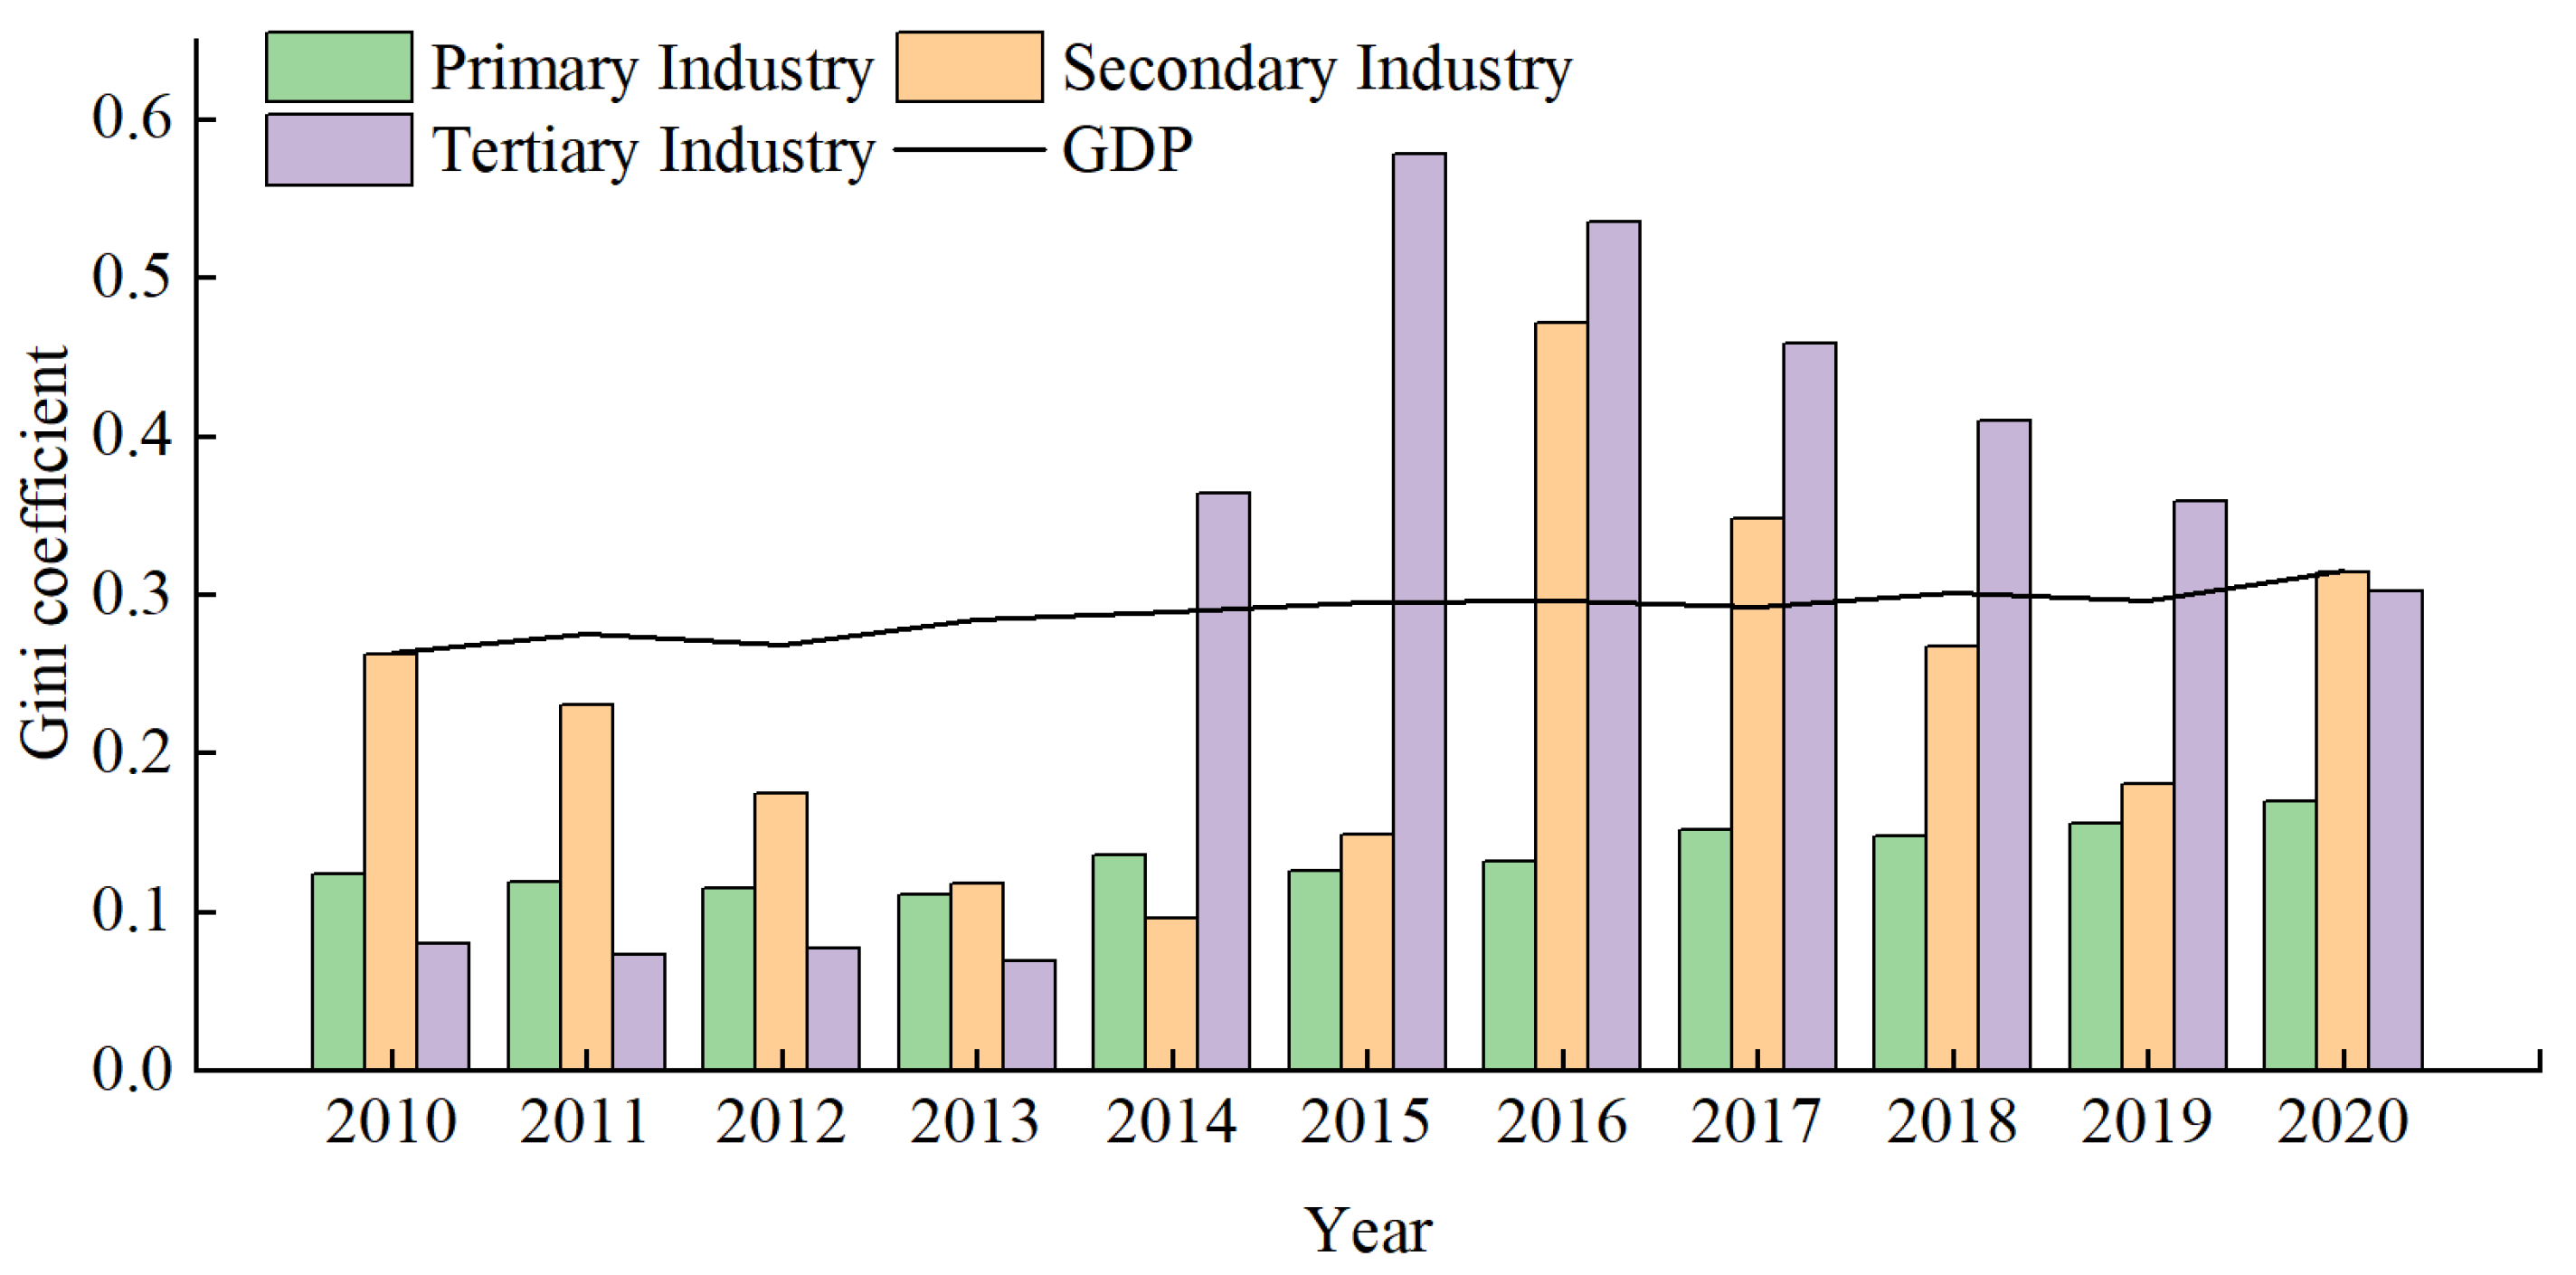
3.3.1. Analysis of the Water Resources–GDP Gini Coefficient (2010–2020)
3.3.2. Comparison of Water Resources—GDP Gini Coefficient Before and After Implementation of Targeted Poverty Alleviation Policy
4. Conclusions
- (1)
- Targeted poverty alleviation measures have reduced industrial water consumption. A comparison of water consumption before and after the implementation of the targeted poverty alleviation policy revealed a 543 million m3 decrease in industrial water consumption. This reduction can be attributed to technological advancements and shifts in industrial structure, with the intensity and structural effects being the primary drivers of the decline; however, the contribution of the structural effect is significantly lower than that of the intensity effect. An analysis by industrial sector indicated that the decrease in water consumption was mainly due to the enhanced intensity effect in the primary sector. Through the promotion of agricultural water-saving measures, water consumption decreased by 539 million m3 despite a 384,700-mu increase in cultivated land. This is consistent with the findings of Houyin Long et al. [33] regarding the spatio-temporal drivers of water consumption in China, who reported that the agricultural sector has accelerated the modernization of irrigation equipment to minimize unnecessary waste during irrigation. Nevertheless, the potential for water conservation in agriculture is limited, and the associated economic output is relatively low. As such, an over-reliance on agriculture will affect the sustainability of poverty alleviation measures. Although the development of non-agricultural industries in the Hotan region is currently weak, it is necessary to accelerate their development based on their comparative advantages to reduce over-reliance on agriculture, taking into account the associated economic output.
- (2)
- Targeted poverty alleviation measures have exacerbated the imbalance in the allocation of industrial and water resources between regions. There are significant spatial disparities in water resource allocation in the Hotan region, with counties and cities in advantageous locations having a greater ability to expand their water use; in contrast, counties and cities in worse locations can only seek to improve their water use efficiency. The Gini coefficient for water resources and GDP in the Hotan region was found to rise from 0.26 to 0.32 between 2010 and 2020, indicating a shift from a relatively matched to a reasonably matched state. The pressure imposed by the poverty alleviation policy has worsened the spatial imbalance of water resource utilization—a problem also identified in the analysis of water resource use efficiency in Xinjiang by Zhang Liming et al. [42]. The imbalanced allocation of water resources is a widespread problem in China [43,44]. To ensure balanced regional water allocation, the Chinese government has previously adopted measures such as inter-regional water transfers [43] and strengthened water use controls. Although the Hotan region has 36 rivers, their discharge rates vary significantly. Therefore, achieving an equitable distribution of water resources necessitates the strengthening of water network infrastructure and the implementation of unified management. At the same time, the poverty alleviation indicator assessment system should be further refined. At present, poverty alleviation policies in China focus solely on economic indicators and lack consideration of the stability of the “economy–resource–ecology” system. This has led some regions to over-exploit key resources under the pressure of poverty alleviation. Therefore, it is advisable to include restrictive indicators for resource development in the assessment criteria to ensure the sustainability of development outcomes.
Author Contributions
Funding
Data Availability Statement
Conflicts of Interest
References
- Guo, Y.Z.; Zhou, Y.; Liu, Y.S. Targeted poverty alleviation and its practices in rural China: A case study of Fuping county, Hebei Province. J. Rural Stud. 2022, 93, 430–440. [Google Scholar] [CrossRef]
- United Nations (UN). The Millennium Development Goals Report 2015; United Nations: New York, NY, USA, 2015. [Google Scholar]
- Liu, Y.; Liu, J.; Zhou, Y. Spatio-temporal patterns of rural poverty in China and targeted poverty alleviation strategies. J. Rural Stud. 2017, 52, 66–75. [Google Scholar] [CrossRef]
- Guo, Y.; Zhou, Y.; Cao, Z. Geographical patterns and anti-poverty targeting post-2020 in China. J. Geogr. Sci. 2018, 28, 1810–1824. [Google Scholar]
- Zhou, Y.; Guo, Y.; Liu, Y. Comprehensive measurement of county poverty and anti-poverty targeting after 2020 in China. Acta Geogr. Sin. 2018, 73, 1478–1493. [Google Scholar]
- Liu, Y.X. Study on farmers cooperative poverty alleviation model in underdeveloped. Issues Agric. Econ. 2015, 7, 110–111. [Google Scholar]
- Liu, Y.S.; Wang, Y.S. Rural land engineering and poverty alleviation: Lessons from typical regions in China. J. Geogr. Sci. 2019, 29, 643–657. [Google Scholar] [CrossRef]
- Yin, D.; Zhu, H. The mechanism and comprehensive effect of poverty alleviation with characteristic agriculture in typical mountainous rural areas of Yunnan Province: A case study on the production of special cash crops. Acta Geogr. Sin. 2022, 77, 888–899. [Google Scholar]
- Xie, S.Y.; Yin, J.J.; Qiao, H.F.; Lu, J.; Li, L.; Wang, A.Q. Research on rural tourism poverty-alleviation modes and the difference of their effects in Enshi prefectur. Hum. Geogr. 2021, 181, 184–192. [Google Scholar]
- Liang, S.F.; Zheng, H.X.; Xu, S.S. The scale characteristics and economic efficiency evaluation of poverty alleviation industry development concentrated and contiguous destitute areas—A case study of WuLing mountain district Enshi autonomous prefecture. Chin. J. Agric. Resour. Reg. Plan. 2020, 41, 1–8. [Google Scholar]
- Zheng, J.; Zhu, T.T. Economic and social efficiency: Overall evaluation about the fiscal subsidy for agricultural insurance. J. Financ. Econ. 2014, 29, 88–97. [Google Scholar]
- Deng, K. Evaluation of the efficiency of financial poverty alleviation and agricultural support measures: A case study of Bazhong city in the Qinba mountain region. Rural Econ. 2015, 5, 86–91. [Google Scholar]
- Huang, Y.J.; Wang, R.; Liu, Y. Analysis of factors influencing the poverty alleviation efficiency of agricultural insurance subsidies based on the DEA-Tobit panel model: A case study of hunan province. Rural Econ. 2018, 5, 69–74. [Google Scholar]
- Cashley, J. Tourism and Poverty Reduction: Pathways to Prosperity; The Cromwell Press Group: Trowbridge, UK, 2010. [Google Scholar]
- Ravallion, M.; Datt, G. Why has economic growth been more pro-poor in some states of India than others? J. Dev. Econ. 2002, 68, 381–400. [Google Scholar] [CrossRef]
- Suryahad, A.; Suryadarma, D.; Sumarto, S. The effects of location and sectoral components of economic growth on poverty: Evidence from Indonesia. J. Dev. Econ. 2009, 89, 109–117. [Google Scholar] [CrossRef]
- Ferreira, H.G.; Leite, P.G.; Ravallion, M. Poverty reduction without economic growth? Explaining Brazil’s poverty dynamics, 1985–2004. J. Dev. Econ. 2010, 93, 20–36. [Google Scholar] [CrossRef]
- Fu, B.J.; Liu, Y.X.; Wang, S.; Song, J.; Li, Z. Scientifically improving human-nature relationship in desertification areas. Bull. Chin. Acad. Sci. 2024, 39, 2027–2036. [Google Scholar]
- Ma, W.J.; Zhang, W.S.; Li, C.Y.; Kou, J.W.; Wang, M.M.; Xue, B. Spatiotemporal characteristics and driving factors of allotropic growth of economic scale and marginal benefits of water resources in the Yellow River Basin. J. Nat. Resour. 2023, 35, 3116–3134. [Google Scholar] [CrossRef]
- Metha, P.; Siebert, S.; Kummu, M.; Deng, Q.; Ali, T.; Marston, L.; Xie, W.; Davis, K.F. Half of twenty-first century global irrigation expansion has been in water-stressed regions. Nat. Water 2024, 2, 254–261. [Google Scholar]
- Nourl, H.; Stokvis, B.; Galindo, A.; Blatchford, M.; Hoekstra, A. Water scarcity alleviation through water footprint reduction in agriculture: The effect of soil mulching and drip irrigation. Sci. Total Environ. 2019, 653, 241–252. [Google Scholar]
- van Vliet, M.T.H.; Jones, E.R.; Flörke, M.; Franssen, W.H.P.; Hanasaki, N.; Wada, Y.; Yearsley, J.R. Global water scarcity including surface water quality and expansions of clean water technologies. Environ. Res. Lett. 2021, 16, 024020. [Google Scholar] [CrossRef]
- Maraseni, T.; Mushtaq, S. Carbon smart agriculture: An integrated regional approach offers significant potential to increase profit and resource use efficiency, and reduce emissions. J. Clean. Prod. 2020, 282, 124555. [Google Scholar] [CrossRef]
- Ravar, Z.; Zahraie, B.; Sharifinejad, A.; Gozini, H.; Jafari, S. System dynamics modeling for assessment of water-food-energy resources security and nexus in Gavkhuni Basin in Iran. Ecol. Indic. 2020, 108, 105682. [Google Scholar] [CrossRef]
- Zhang, Y.L.; Lu, Y.Y.; Zhou, Q.; Wu, F. Optimal water allocation scheme based on trade-offs between economic and ecological water demands in the Heihe River Basin of Northwest China. Sci. Total Environ. 2020, 703, 134958. [Google Scholar] [CrossRef]
- Jia, S.F.; Liu, W.H. Tracing and thinking about 40% threshold value of water resources development and utilization ratio. Water Resour. Prot. 2021, 37, 87–89. [Google Scholar]
- Wang, X.Q.; Zhang, Y. The allow able exploitation rate of rivers water resources of the seven major rivers in China. J. Nat. Resour. 2008, 23, 500–506. [Google Scholar]
- Li, B.; Chen, W.; Xu, X.Y.; Wang, H.R.; Han, D.M. Research on the utilization ratio of the third class water resources regions based on ecological function. J. Nat. Resour. 2016, 31, 1918–1925. [Google Scholar]
- Li, Y.J.; Zhang, Z.Y.; Shi, M.J. What should be the future industrial structure of the Beijing-Tianjin-Hebei city region under water resource constraint? An inter-city input-output analysis. J. Clean. Prod. 2019, 239, 118117. [Google Scholar] [CrossRef]
- Ang, B.W. Decomposition analysis for policymaking in energy: Which is the preferred method? Energy Policy 2004, 32, 1131–1139. [Google Scholar] [CrossRef]
- Ang, B.W. The LMDI approach to decomposition analysis: A practical guide. Energy Policy 2005, 33, 867–871. [Google Scholar] [CrossRef]
- Zhang, C.J.; Zhao, C.X.; Lin, L.; Yu, X.Y. Driving effect of spatial-temporal differences in water consumption in the Yangtze River Delta. Resour. Sci. 2018, 40, 89–103. [Google Scholar]
- Long, H.Y.; Lin, B.Q.; Ou, Y.T.; Chen, Q. Spatio-temporal analysis of driving factors of water resources consumption in China. Sci. Total Environ. 2019, 690, 1321–1330. [Google Scholar] [CrossRef]
- Liu, C.L.; Liu, W.D.; Lu, D.D.; Chen, M.X.; Xu, M. A study of provincial differences in China’s eco-compensation Framework. Acta Geogr. Sci. 2017, 27, 240–256. [Google Scholar] [CrossRef]
- Ali, H.E.; Sami, S.M. Inequality, Economic Growth and Natural Resources Rent: Evidence from the Middle East and North Africa; Palgrave Macmillan: Basingstoke, UK, 2016. [Google Scholar]
- Peng, L.; Deng, W.; Tan, J.; Lin, L. Restriction of economic development in the Hengduan Mountains Area by land and water resources. Acta Geogr. Sin. 2020, 75, 1996–2008. [Google Scholar]
- Jantzen, R.T.; Volpert, K. On the mathematics of income inequality: Splitting the Gini index in two. Am. Math. Mon. 2012, 119, 824–837. [Google Scholar] [CrossRef]
- Yang, J.; Huang, X. The 30 m annual land cover datasets and its dynamics in China from 1985 to 2022. Earth Syst. Sci. Data 2023, 13, 3907–3925. [Google Scholar] [CrossRef]
- Christiaensen, L.; Demery, L.; Kuhl, J. The (evolving) role of agriculture in poverty reduction-An empirical perspective. J. Dev. Econ. 2011, 96, 239–254. [Google Scholar] [CrossRef]
- Lai, J.; Li, Y.; Chen, J.; Niu, G.-Y.; Lin, P.; Li, Q.; Wang, L.; Han, J.; Luo, Z.; Sun, Y. Massive crop expansion threatens agriculture and water sustainability in northwestern China. Environ. Res. Lett. 2022, 17, 034003. [Google Scholar] [CrossRef]
- Zhao, N.; Zheng, X.J.; Zhan, B.; Tian, S.; Du, L.; Li, Y. Does water-saving irrigation truly conserve water? Yes and No. Agric. Water Manag. 2025, 311, 109399. [Google Scholar] [CrossRef]
- Zhang, L.M.; Wang, H.R.; Pan, C.Z.; He, J. Empirical analysis on the influence of industrial structure adjustment on water resource utilization efficiency in resource-based regions: Empirical evidence from 10 resource—Based provinces in China. J. Beijing Norm. Univ. (Nat. Sci.) 2021, 57, 353–360. [Google Scholar]
- Lu, P. Impacts of Water Resources Economic Policies on China’s Regional Economy. Ph.D. Dissertation, University of Science and Technology, Beijing, China, 2015. [Google Scholar]
- Sun, Z.J.; Gu, W.; Li, H.M.; Tian, Y.; Sun, J.Y. Evaluation and analysis of spatial equilibrium of water resources in Anhui Province. Express Water Resour. Hydropower Inf. 2025, 1–13. Available online: https://link.cnki.net/urlid/42.1142.TV.20250408.1406.007 (accessed on 2 September 2025).


| Industrial Water Consumption | Industrial Water Use Intensity | Industrial Structure | Income Level | Population Size | Decomposition Effect |
|---|---|---|---|---|---|
| W1 | I1 = W1/G1 | S1 = G1/G | lmw | P | I1 × S1 × lnC × P |
| W2 | I2 = W2/G2 | S2 = G2/G | lmw | P | I2 × S2 × lnC × P |
| W3 | I3 = W3/G3 | S3 = G3/G | lmw | P | I3 × S3 × lnC × P |
| - | - | - |
| Gini Coefficient Interval | (0, 0.2) | (0.2, 0.3) | (0.3, 0.4) | (0.4, 0.5) | (0.5, 1) |
| Matching Degree | Highly matched | Relatively matched | Reasonably matched | Relatively mismatched | Highly mismatched |
| Year | Intensity Effect | Structural Effect | Income Effect | Demographic Effect | Total Effect |
|---|---|---|---|---|---|
| 2010–2020 | −25.71 | −19.19 | 30.82 | 8.65 | −5.43 |
| (473.48%) | (353.41%) | (−567.59%) | (−159.3%) | (100) | |
| 2010–2015 | −12.56 | −12.98 | 19.93 | 5.59 | −0.02 |
| (628%) | (649%) | (−996.5%) | (−279.5%) | (100) | |
| 2015–2020 | −13.99 | −7.02 | 12.12 | 3.422 | −5.41 |
| (258.6%) | (129.76%) | (−224.03%) | (−63.37%) | (100) |
| Years | Intensity Effect | Structural Effect | Income Effect | People Effect | ||||||||
|---|---|---|---|---|---|---|---|---|---|---|---|---|
| P1 | S2 | T3 | P1 | S2 | T3 | P1 | S2 | T3 | P1 | S2 | T3 | |
| 2010–2020 | −25.39 | −0.14 | −0.18 | −19.21 | 0.01 | 0.02 | 30.62 | 0.14 | 0.06 | 8.60 | 0.04 | 0.02 |
| 2010–2015 | −12.40 | −0.11 | −0.05 | −13.01 | 0.01 | 0.03 | 19.78 | 0.07 | 0.08 | 5.55 | 0.02 | 0.02 |
| 2015–2020 | −13.77 | −0.01 | −0.21 | −7.02 | 0.00 | 0.01 | 12.09 | 0.05 | 0.03 | 3.40 | 0.02 | 0.01 |
| Year Industrial Sector | Gini Coefficient of Primary Sector | Gini Coefficient of Secondary Sector | Gini Coefficient of Tertiary Sector | GDP Gini Coefficient |
|---|---|---|---|---|
| 2010 | 0.124 | 0.26 | 0.08 | 0.26 |
| Highly matched | Relatively matched | Highly matched | Relatively matched | |
| 2015 | 0.126 | 0.15 | 0.58 | 0.295 |
| Highly matched | Highly matched | Highly mismatched | Relatively matched | |
| 2020 | 0.169 | 0.31 | 0.30 | 0.32 |
| Highly matched | Reasonably matched | Reasonably matched | Reasonably matched |
| 2010 | 2015 | 2020 | ||||
|---|---|---|---|---|---|---|
| Water Use Proportion% | % of GDP | Water Use Proportion% | % of GDP | Water Use Proportion% | % of GDP | |
| Yutian County | 16.84 | 10.92 | 16.55 | 10.06 | 18.28 | 9.89 |
| Moyu County | 26.67 | 17.59 | 25.42 | 16.60 | 25.14 | 16.46 |
| Luopu County | 14.06 | 10.92 | 14.21 | 10.37 | 14.92 | 10.66 |
| Hotan County | 11.12 | 10.16 | 13.42 | 11.11 | 14.90 | 12.53 |
| Pishan County | 14.18 | 13.20 | 14.61 | 12.44 | 11.24 | 10.87 |
| Cele County | 7.36 | 7.63 | 7.39 | 7.14 | 6.63 | 7.05 |
| Minfeng County | 3.10 | 3.99 | 2.34 | 3.78 | 2.62 | 3.96 |
| Hotan City | 6.65 | 25.58 | 6.06 | 28.50 | 6.26 | 28.59 |
| Hotan Region | 100 | 100 | 100 | 100 | 100 | 100 |
Disclaimer/Publisher’s Note: The statements, opinions and data contained in all publications are solely those of the individual author(s) and contributor(s) and not of MDPI and/or the editor(s). MDPI and/or the editor(s) disclaim responsibility for any injury to people or property resulting from any ideas, methods, instructions or products referred to in the content. |
© 2025 by the authors. Licensee MDPI, Basel, Switzerland. This article is an open access article distributed under the terms and conditions of the Creative Commons Attribution (CC BY) license (https://creativecommons.org/licenses/by/4.0/).
Share and Cite
Huo, J.-W.; Xia, F.-Q.; Lu, R.-Q.; Lu, D.-N.; Yang, D.-G.; Chen, Y. The Impact of China’s Targeted Poverty Alleviation Policy on Water Resource Utilization Pressure and Allocation in Arid Regions: A Case Study of Hotan Prefecture, Xinjiang. Water 2025, 17, 3053. https://doi.org/10.3390/w17213053
Huo J-W, Xia F-Q, Lu R-Q, Lu D-N, Yang D-G, Chen Y. The Impact of China’s Targeted Poverty Alleviation Policy on Water Resource Utilization Pressure and Allocation in Arid Regions: A Case Study of Hotan Prefecture, Xinjiang. Water. 2025; 17(21):3053. https://doi.org/10.3390/w17213053
Chicago/Turabian StyleHuo, Jin-Wei, Fu-Qiang Xia, Rong-Qian Lu, Dan-Ni Lu, De-Gang Yang, and Yang Chen. 2025. "The Impact of China’s Targeted Poverty Alleviation Policy on Water Resource Utilization Pressure and Allocation in Arid Regions: A Case Study of Hotan Prefecture, Xinjiang" Water 17, no. 21: 3053. https://doi.org/10.3390/w17213053
APA StyleHuo, J.-W., Xia, F.-Q., Lu, R.-Q., Lu, D.-N., Yang, D.-G., & Chen, Y. (2025). The Impact of China’s Targeted Poverty Alleviation Policy on Water Resource Utilization Pressure and Allocation in Arid Regions: A Case Study of Hotan Prefecture, Xinjiang. Water, 17(21), 3053. https://doi.org/10.3390/w17213053


