Abstract
Water inrush and mud burst disasters pose severe challenges to the safe and efficient construction of underground engineering. Water inflow prediction is closely related to drainage design, disaster prevention and control, and the safety of the surrounding ecological environment. Thus, assessing the water inflow accurately is of importance. This study proposes a Bayesian Optimization-Long Short-Term Memory (BOA-LSTM) recurrent neural network for predicting tunnel water inflow. The model is based on four input parameters, namely tunnel depth (H), groundwater level (h), rock quality designation (RQD), and water-richness (W), with water inflow (WI) as the single-output variable. The model first processes and analyzes the data, quantitatively characterizing the correlations between input parameters. The tunnel water inflow is predicted using the long short-term memory (LSTM) recurrent neural network, and the Bayesian optimization algorithm (BOA) is employed to select the hyperparameters of the LSTM, primarily including the number of hidden layer units, initial learning rate, and L2 regularization coefficient. The modeling process incorporates a five-fold cross-validation strategy for dataset partitioning, which effectively mitigates overfitting risks and enhances the model’s generalization capability. After a comprehensive comparison among a series of machine learning models, including a long short-term memory recurrent neural network (LSTM), random forest (RF), back propagation neural network (BP), extreme learning machine (ELM), radial basis function neural network (RBFNN), least squares support vector machine (LIBSVM), and convolutional neural network (CNN), BOA-LSTM performed excellently. The proposed BOA-LSTM model substantially surpasses the standard LSTM and other comparative models in tunnel water inflow prediction, demonstrating superior performance in both accuracy and generalization. Hence, it provides a reference basis for tunnel engineering water inflow prediction.
1. Introduction
Water and mud inrush disasters incidents are a principal cause of catastrophic failures during tunnel construction. China remains one of the most affected nations grappling with these disasters, which have caused huge casualties and economic losses [1]. Tunnel water and mud inrush represent a leading cause of casualties and economic losses in construction disasters [2]. Evidence shows that a predominant proportion (approximately 80%) of major safety accidents in tunneling are attributable to water inrush and mud burst disasters, coupled with inadequate mitigation measures [3]. By the 1980s, China had constructed 26 long karst tunnels, which represented nearly 40% of its total tunnel inventory at the time. During the construction of these tunnels, every tunnel suffered varying degrees of water inrush and mud burst disasters [4]. After entering the 21st century, the number and scale of tunnels constructed in China have increased sharply, with China facing some of the most significant tunneling challenges globally [5]. The construction of long tunnels of more than 10 km is increasing [6]. Moreover, major water inrush and mud burst disasters seriously affect the advancement of safety in tunneling projects [7,8]. For example, in July 2021, the tunnel water inrush disaster at the Shijingshan site in Zhuhai resulted in 14 fatalities. In November 2019, the Anshi Tunnel in Yunnan experienced a compound disaster involving simultaneous water inrush and mud burst, causing 12 fatalities and 10 injuries. The Dazhushan Tunnel, which is known as the “most difficult tunnel to excavate,” encountered approximately 200 million cubic meters of water inflow and took 12 years to complete. During this period, the construction team spent more than 90% of their time combating water inrush and mud burst inflows. Therefore, scientifically and accurately estimating the tunnel water inflow rate based on engineering geological and hydrogeological conditions is an important prerequisite for the design of drainage schemes, reduction in potential engineering risks [9,10], protection of the ecological environment, and to ensure the safe construction of tunnels and other engineering projects.
1.1. Traditional Approach
Currently, the prediction of tunnel water inflow mostly adopts methods including engineering analogy, empirical analysis calculation, and numerical simulation. For example, Liu [11] used the Joubert formula, Sato Kuniaki formula, and related empirical formulas to predict the normal water inflow of the Yanshan Tunnel while comparing them with numerical simulation methods based on groundwater seepage models, suggesting that the combination of numerical simulation methods with traditional methods can improve prediction accuracy. Zhou [12] employed a combination of theoretical calculations and numerical simulations to forecast the water inflow for the Guanshan Tunnel, proposing a method to use numerical simulation for the inverse correction of calculation formulas. Wang et al. [13] used the finite element method to predict the seepage volume in underground chambers. Wang et al. [14] proposed that a systematic approach to predicting tunnel water inflow should involve both distinguishing and integrating forward and inverse methods. Despite significant achievements in water inflow prediction by researchers, several limitations persist. The substantial differences in engineering geological and hydrogeological conditions across projects result in highly site-specific data acquisition and limited dataset sizes, which challenges the generalizability of existing methods. Consequently, there is currently no universally accepted method for tunnel water inflow prediction that demonstrates robust applicability across diverse project conditions.
1.2. Machine Learning
Machine learning has gained traction as a solution to these complex, nonlinear multi-factor coupling problems. This branch of artificial intelligence is dedicated to developing systems that learn from data and autonomously enhance their computational performance. Machine learning enables computer systems to identify patterns in data through statistical learning algorithms, thereby generating predictions or data-driven decisions [15,16]. From an academic perspective, machine learning can be seen as a computational approach to learning experiences from data and enhancing model performance through training. Given a dataset, machine learning aims to minimize prediction errors or achieve specific objective functions by optimizing model parameters. It has significant advantages in learning complex factor coupling, nonlinear modeling requirements, large-scale data processing, automatic feature extraction, and generalization ability [17]. In recent years, an increasing number of experts and scholars have applied machine learning methods extensively in coal seam floor water inrush risk assessment [18], tunnel crack and defect identification [19], rock mass physical mechanics parameter prediction [20], and other areas. Concerning the problem of predicting water inflow in tunnels, Li et al. [21] established a nonlinear regression method model that meets the requirements of Gaussian process regression (GPR) and applied it to predict the water inflow of a certain highway tunnel. Zhao et al. [22] developed a random forest-based model for predicting tunnel water inflow. Mahmoodzadeh et al. [23] conducted a comparative study on tunnel water inflow prediction, employing multiple algorithms such as the long short-term memory (LSTM), deep neural network (DNN), K-nearest neighbor algorithm (KNN), Gaussian process regression (GPR), support vector regression (SVR), and decision tree (DT) to predict tunnel water inflow, and they compared the performance indicators of different algorithms in tunnel water inflow prediction problems.
1.3. Purpose of the Work
Bayesian Optimization Algorithm (BOA) offers a highly efficient framework for optimizing expensive black-box functions. By constructing a probabilistic surrogate model and employing an acquisition function to guide the search process, BOA achieves exceptional sample efficiency—even in high-dimensional spaces. This approach is particularly advantageous for hyperparameter tuning in contexts where objective function evaluations are computationally intensive and gradient information is unavailable. As a result, BOA enables convergence to near-optimal configurations with significantly fewer evaluations than traditional optimization methods [24,25]. This efficiency is especially critical when training and validating deep learning models such as LSTM networks, which involve substantial computational overhead. While grid search becomes intractable in high-dimensional hyperparameter spaces due to the curse of dimensionality, random search—though more efficient than grid search—still operates in a non-adaptive manner and does not leverage information from prior evaluations. In contrast, BOA iteratively refines its surrogate model to selectively propose the most promising hyperparameters for each subsequent evaluation. This active learning mechanism allows it to rapidly identify high-performance configurations with a minimal number of iterations. To address this challenge, this study proposes a Bayesian Optimization-based Long Short-Term Memory (BOA-LSTM) model for tunnel water inflow prediction, building on prior research [23]. The model utilizes the Bayesian Optimization algorithm to automatically identify suitable hyperparameter combinations for the LSTM network based on different tunnel engineering datasets, thereby enhancing prediction accuracy. The predictive capability and generalization performance of the BOA-LSTM model were systematically evaluated against multiple machine learning benchmarks, including standard LSTM, Least Squares Support Vector Machine (LIBSVM), Random Forest (RF), Backpropagation Neural Network (BP), Extreme Learning Machine (ELM), and Radial Basis Function Neural Network (RBFNN). The results demonstrate its superior effectiveness, providing a valuable reference for future tunnel water inflow prediction.
2. Materials and Methods
2.1. LSTM
In the field of neural networks (NN), there are generally two types: feedforward neural networks (FNNs) and recurrent neural networks (RNNs) [26]. Architecturally, a neural network is defined by its layered structure of input, hidden, and output units, where activation functions modulate neuron outputs and weighted connections interlink these layers. FNNs are the most basic type of neural network, where information propagates in a unidirectional manner without forming cycles. An FNN can be realized as a multi-layer perceptron with fully connected structures between layers. Typically, the input layer is responsible for receiving raw data, the intermediate hidden layer performs a series of nonlinear mappings and feature extraction on the data, and the output layer generates the neural network’s output result without any memory effect. RNNs introduce recurrent connections. Hence, they are able to handle sequential data, and these networks are particularly adept at modeling complex, nonlinear sequential dependencies. Compared with simple neural networks, RNNs utilize a recursive hidden unit that acts as a self-looping cycle responsible for transforming information from previous hidden units to the next hidden unit, thus serving as a memory unit and enabling the model to possess memory capability. However, when dealing with long-distance dependency problems, RNNs are prone to encountering the issues of vanishing gradients and exploding gradients [27]. The error gradient determines the direction and magnitude of parameter updates during neural network training, thereby guiding the optimization process. The vanishing gradient phenomenon refers to a situation in which the gradient approaches zero during neural network training and causes the network weights to either be unable to update or update little, leading to the inability of the network to achieve results, even after a long training period. Meanwhile, the exploding gradient phenomenon refers to a situation in which the gradient exhibits exponential growth, becomes exceptionally large, and causes significant updates to the network weights, thereby making the network unstable and affecting network training. To address this phenomenon, Hochreiter and Schmidhuber proposed the long short-term memory (LSTM) recurrent neural network model [28]. Strictly speaking, LSTM is also a variant of an RNN, with Hochreiter and Schmidhuber introducing a new type of hidden state called the cell state, denoted Ct. The role of Ct is to track and record the historical context of information. The cell state’s integrity is governed by three specialized gates, an input gate, a forget gate, and an output gate, which are, respectively, responsible for selectively updating, erasing, and reading the contained information [29]. Therefore, the LSTM structure shown in Figure 1 can determine the inhibition and activation of the cell state based on the previous states, current memory, and real-time input. Thus, it is no longer helpless against long-distance dependency problems.

Figure 1.
Flowchart of LSTM.
The overall process of LSTM [23,30,31] is as follows.
Deciding which information to discard from the cell state Ct: In the first step, the forget gate controls the information in the previous cell state Ct−1, obtains the values of xt and ht−1, and determines whether to retain them through the sigmoid function.
Confirming which new information will be stored in the cell state Ct: In the second step, after the sigmoid layer determines which information to retain, the values of xt and ht−1 are transformed into values between −1 and 1 using the hyperbolic tangent (tanh) activation function. This state serves as the new candidate at time t.
Updating the cell state Ct−1 to Ct: In the third step, the cell state Ct−1 is multiplied by ft to forget the decided discarded information, and it is then multiplied by to obtain the new cell state Ct.
Determining the output information: In the final step, the output gate controls the amount of relevant information from the new cell state as the output of the current LSTM storage unit and the new hidden state passed to the next unit. First, the sigmoid layer determines the output under the cell state. Then, the cell state Ct is transformed by the hyperbolic tangent (tanh) function and multiplied by the output of the sigmoid gate.
In the aforementioned equations, Wf, Wi, Wc, and Wo denote weight matrices, whereas bf, bi, bc, and b0 represent bias vectors. The function σ( ) serves as the gate activation using the sigmoid function, whereas tanh( ) functions as the input and output activation using the hyperbolic tangent function. They are defined as follows.
2.2. Bayesian Optimization Algorithm
While the use of deep learning methods in predicting sudden water surge disasters is becoming increasingly popular, hyperparameter optimization is still an influential part of deep learning. The hyperparameter optimization problem is formulated as follows. Here, represents the optimal parameter set, and U represents the candidate set. This constitutes a black-box problem, wherein the model is evaluated solely by its output. This evaluation thereby serves as a measure of its predictive accuracy and generalization capability. Conventional trial-and-error methods can be used for optimizing model hyperparameters [32], but their optimization process is extremely slow and inefficient, and it is unable to quickly obtain optimized combinations. Moreover, this method does not consider the mixed effects of hyperparameters [33].
At the same time, as the complexity of algorithms and the cost of single function evaluations continue to increase, optimization algorithms become particularly important. The Bayesian optimization algorithm (BOA) has shown the ability to achieve the expected optimization results with fewer iterations among a series of optimization algorithms [31,34,35], and it has been widely used in the field of deep learning. The basic process of BOA is to first assume a prior distribution model for a parameter and then continuously optimize the predictive model with the information received subsequently to make the model more consistent with the actual distribution. The BOA operates as an iterative process that uses information from all prior evaluations to guide the search for parameters that maximize the global optimum, typically by constructing a probabilistic surrogate model.
(1) First, a probabilistic surrogate model based on a Gaussian process (GP) [36] is established. GP can be viewed as a prior function that extends the multivariate Gaussian distribution to random processes of infinite dimensions, where any finite linear combination of the dimensions has a joint Gaussian distribution [37]. A Gaussian process (GP) is defined by a mean vector and a covariance matrix, which are specified by a mean function (m) and a covariance kernel function (k), respectively. The GP can thus be formally expressed as:
Therefore, GP can be modified and applied to the prediction to obtain a prior distribution. After the establishment, two groups of real data, denoted [X0, f(X0)] and [X1, f(X1)], are input into the GP model to modify the model.
(2) A set Xi is selected from the modified GP. The criterion for selection is that the set Xi can maximize the collection function.
(3) The value of f(Xi) is calculated. If the number of iterations reaches the set value, output the result; otherwise, input [Xi, f(Xi)] back, modify the model again, and return to step (2).
In practice, BOA functions as a black box, guided solely by the mean and uncertainty estimates of its probability model. With accumulating data, it learns to allocate computational resources efficiently by focusing on promising regions of the parameter space, ultimately achieving a close approximation of the true optimum through successive iterations.
2.3. Setting Up the Database
2.3.1. Database Sources
In the field of tunnel water inflow prediction, several studies have suggested that incorporating an excessive number of influencing factors does not necessarily improve predictive accuracy and may even reduce it, while substantially increasing the difficulty and cost of data collection [21,23,38]. Therefore, this study focuses on four key factors: tunnel depth (H), groundwater level (h), rock quality designation (RQD), and water yield (W). These parameters are widely recognized in the literature as fundamental controls on groundwater flow and are routinely available during the preliminary investigation phase of tunnel projects. In prior research, model optimization has typically been conducted based on data from multiple actual projects. However, in practical tunnel construction environments, it is often challenging to acquire large volumes of high-quality data. Data collection and processing under such conditions are frequently constrained by operational difficulties and resource limitations. Parameters that are difficult to obtain often entail significant uncertainty, high time costs, and potential safety risks for field personnel. In contrast, the four parameters selected in this study—tunnel depth (H), groundwater level (h), rock quality designation (RQD), and water yield (W)—have been consistently demonstrated in both literature and practice to be safely measurable and readily obtainable during routine site investigations. The database comes from previously published articles [19], and the data major comes from 13 road tunnel projects in Iran that were excavated via a drilling and blasting method.
2.3.2. Data Description
The following is a detailed explanation of the selected parameters.
- 1.
- Tunnel depth
As tunnel depth increases, the confining pressure on the surrounding rock mass rises correspondingly. This elevated stress state leads to the closure and compression of existing fractures and microcracks within the rock, thereby altering its permeability structure. These hydro-mechanical changes directly influence the potential for and magnitude of tunnel water inflow.
- 2.
- Groundwater level
Groundwater significantly alters the properties of tunnel surrounding rock. Through prolonged erosion and seepage, it promotes the formation of internal flow channels within the rock mass. Due to this mechanism, groundwater level is considered a critical influencing factor in tunnel water inrush and plays a substantial role in determining inflow magnitude.
- 3.
- Rock quality designation
Rock Quality Designation (RQD) serves as a quantitative index for assessing the integrity and degree of fracturing in rock masses. The characteristics of joints and fractures—which directly influence the RQD value—play a critical role in controlling groundwater flow paths and potential inflow into tunnels. For this reason, RQD is adopted as one of the key influencing factors in this study.
- 4.
- Water yield property
Water yield characterizes the production capacity or potential output of water resources in groundwater systems. This property quantifies the volume of water generated within a specific geological unit over a given period and is intrinsically linked to hydrogeological hazards such as rock mass seepage and aquifer productivity. The development conditions of aquifers vary significantly across different surrounding rock types, resulting in distinct water yield capacities and solubilities. Aquifers with higher solubility exhibit a substantially greater probability of water inrush disasters compared to those with lower solubility. Due to its direct impact on groundwater influx, water yield is selected as an influential factor in this study.
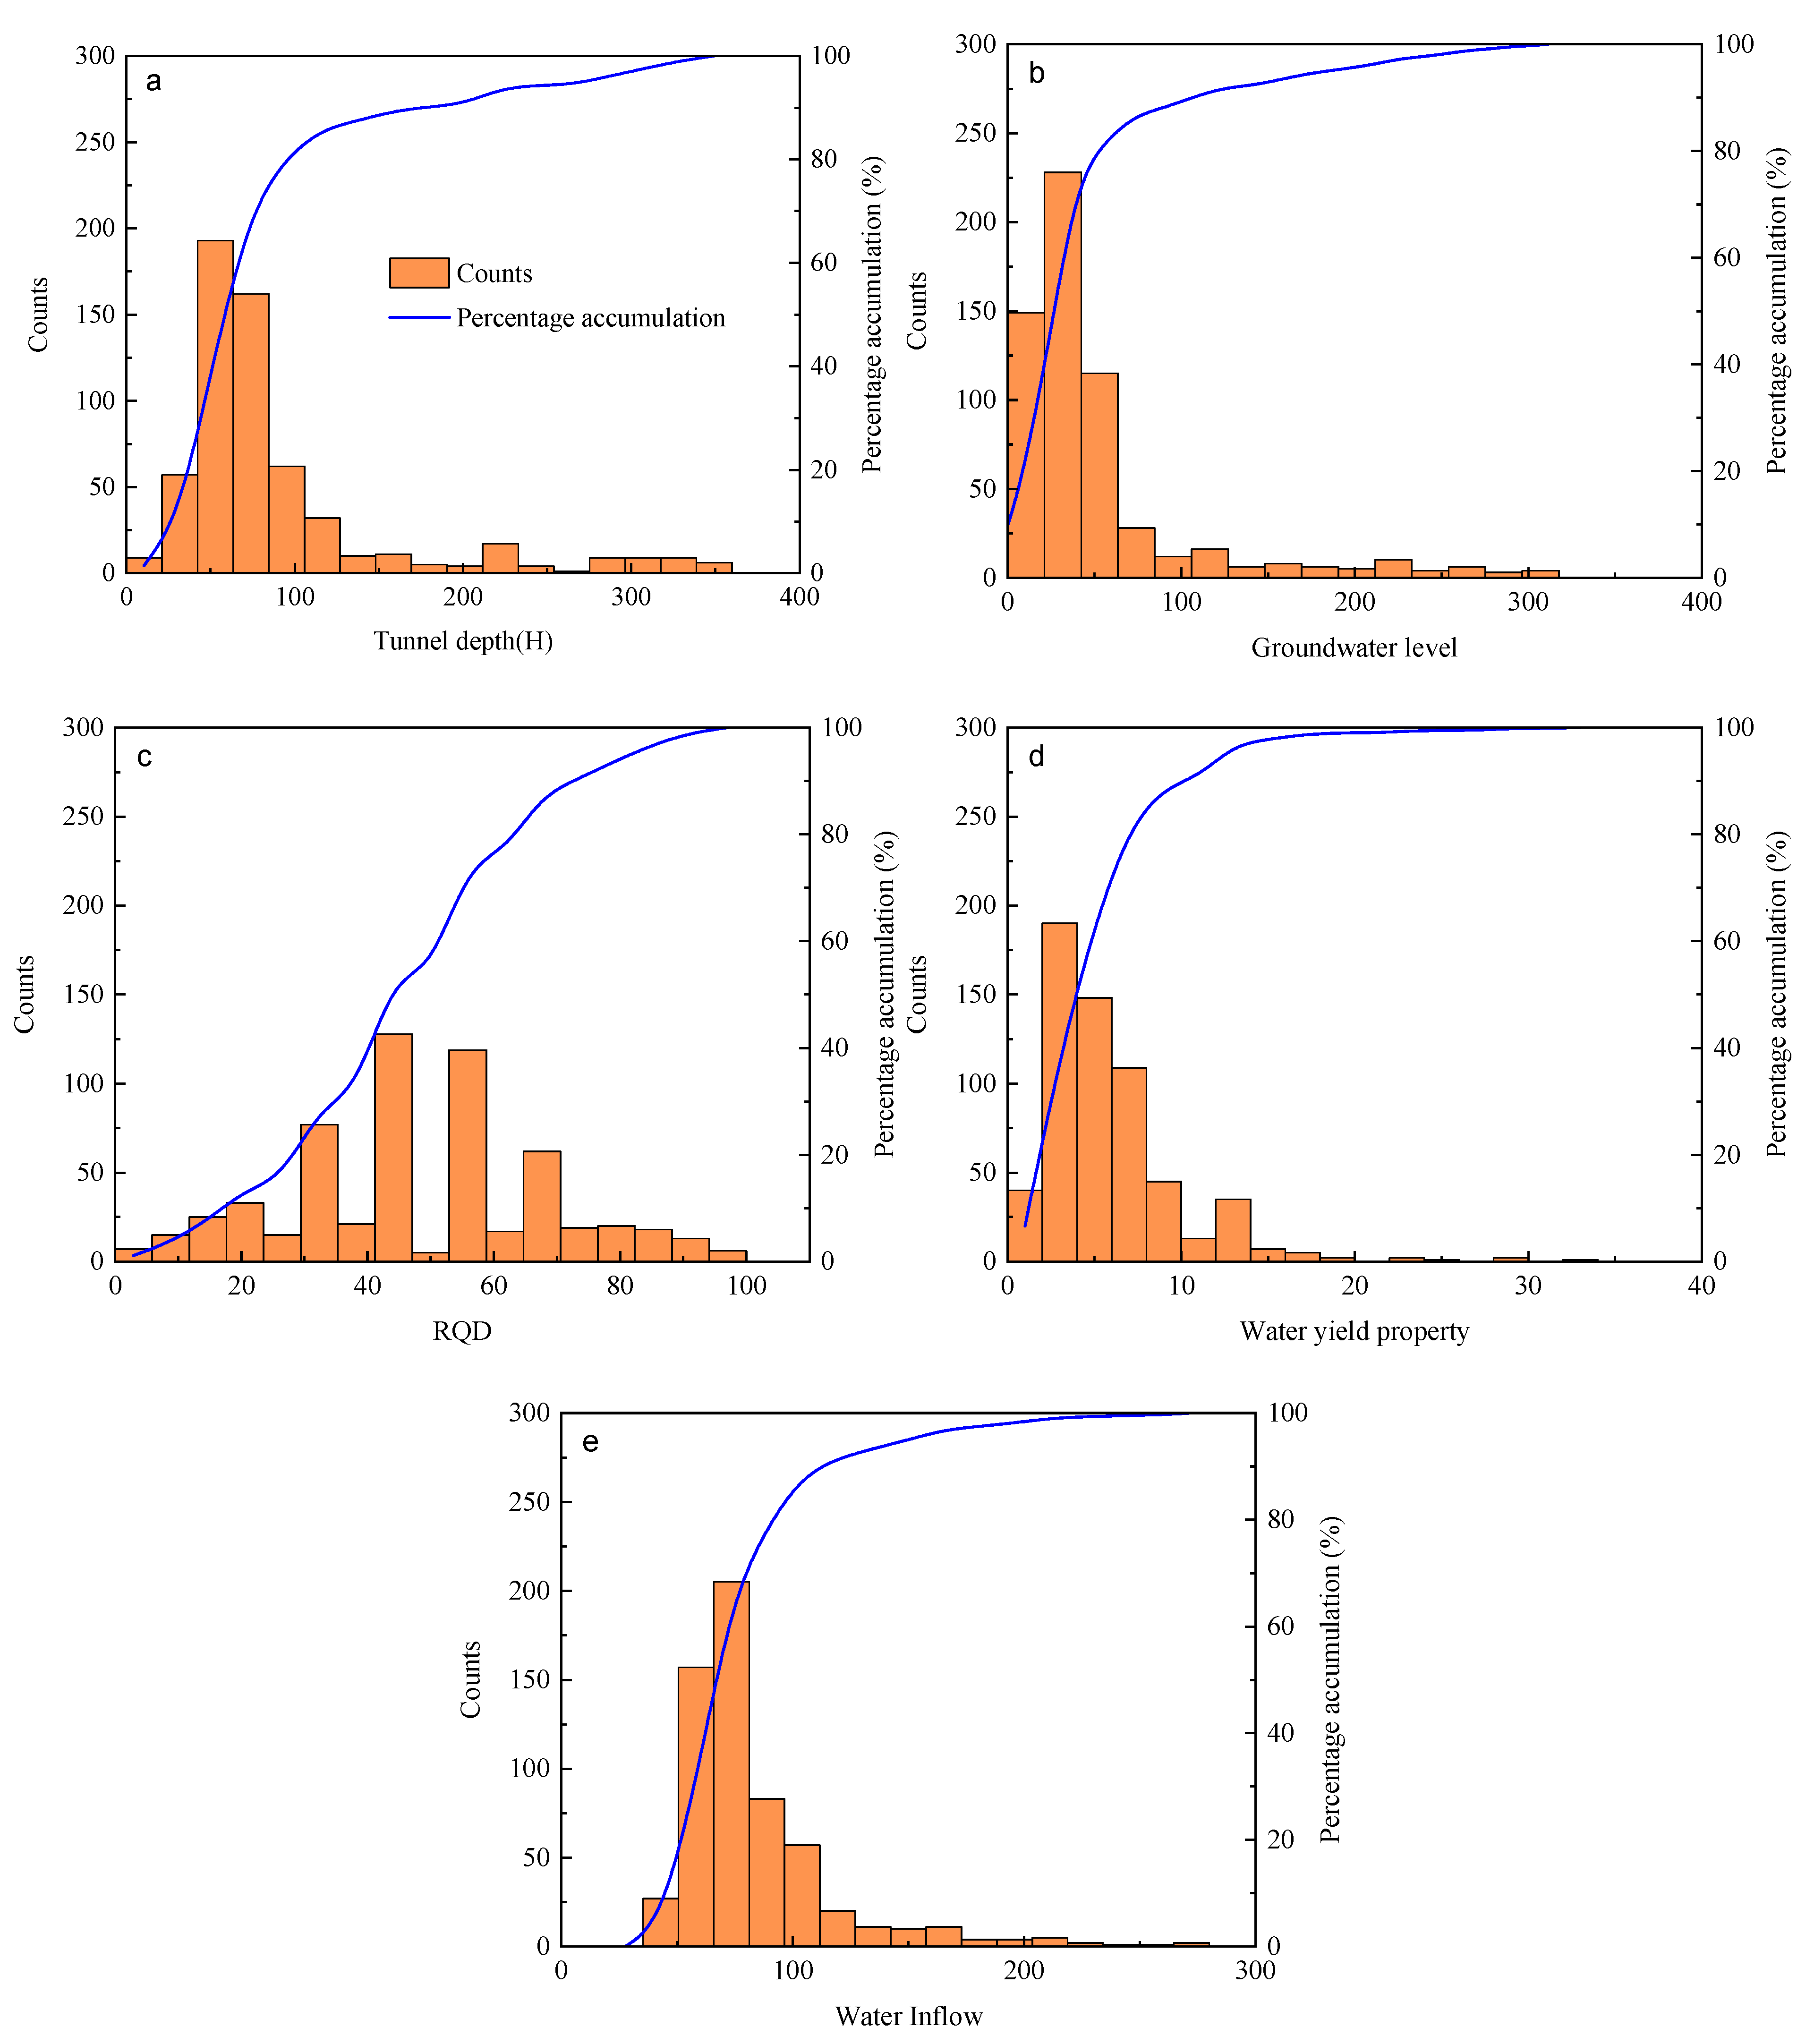
The predictive and generalization capabilities of the model could indeed be further enhanced by incorporating additional, readily available parameters with significant hydrogeological influence. An expanded dataset with broader parameter value ranges would improve the model’s adaptability to diverse geological and hydrological conditions, enabling predictions within acceptable error margins even in previously unencountered scenarios. More importantly, such enrichment would strengthen the model’s robustness, ensuring that its accuracy remains high and its performance does not degrade significantly when input values fall outside the original training distribution. While the current database already represents a substantial expansion over previous studies—significantly aiding model development and calibration—the inclusion of additional well-justified parameters in future work is expected to yield further improvements in generalization performance. The dataset analysis applied in this study is shown in Figure 2.
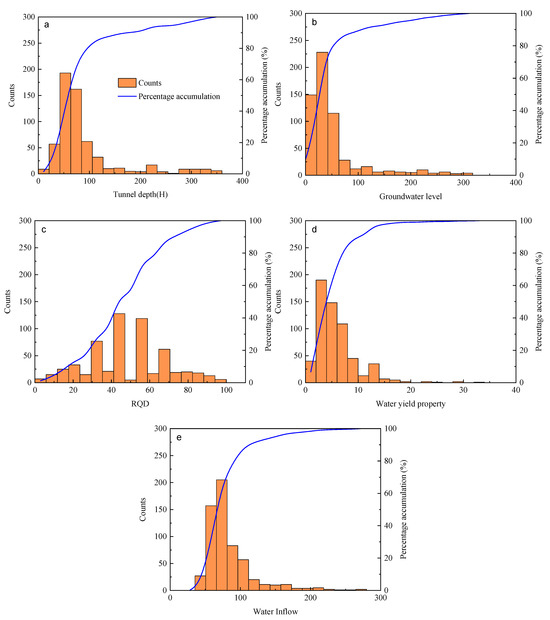
Figure 2.
Frequency histogram of the parameters of water inrush. (a) Tunnel depth, (b) Groundwater level, (c) RQD, (d) Water yield property, (e) Water inflow.
Statistics of the dataset are shown in Table 1.

Table 1.
Statistics of each parameter for predicting water inflow.
2.3.3. Correlation Analysis of the Parameters
To quantify the degree of linear association between parameters, correlation analysis was conducted using the Pearson correlation coefficient. This statistical measure evaluates the pairwise relationships among the four water inflow prediction parameters, with its mathematical expression given below:
Here, n is the number of samples, is the mean in X data, is similarly the mean in Y data, and the correlation coefficient r is between the interval [−1, 1], where positive values indicate positive correlation and negative values indicate negative correlation.
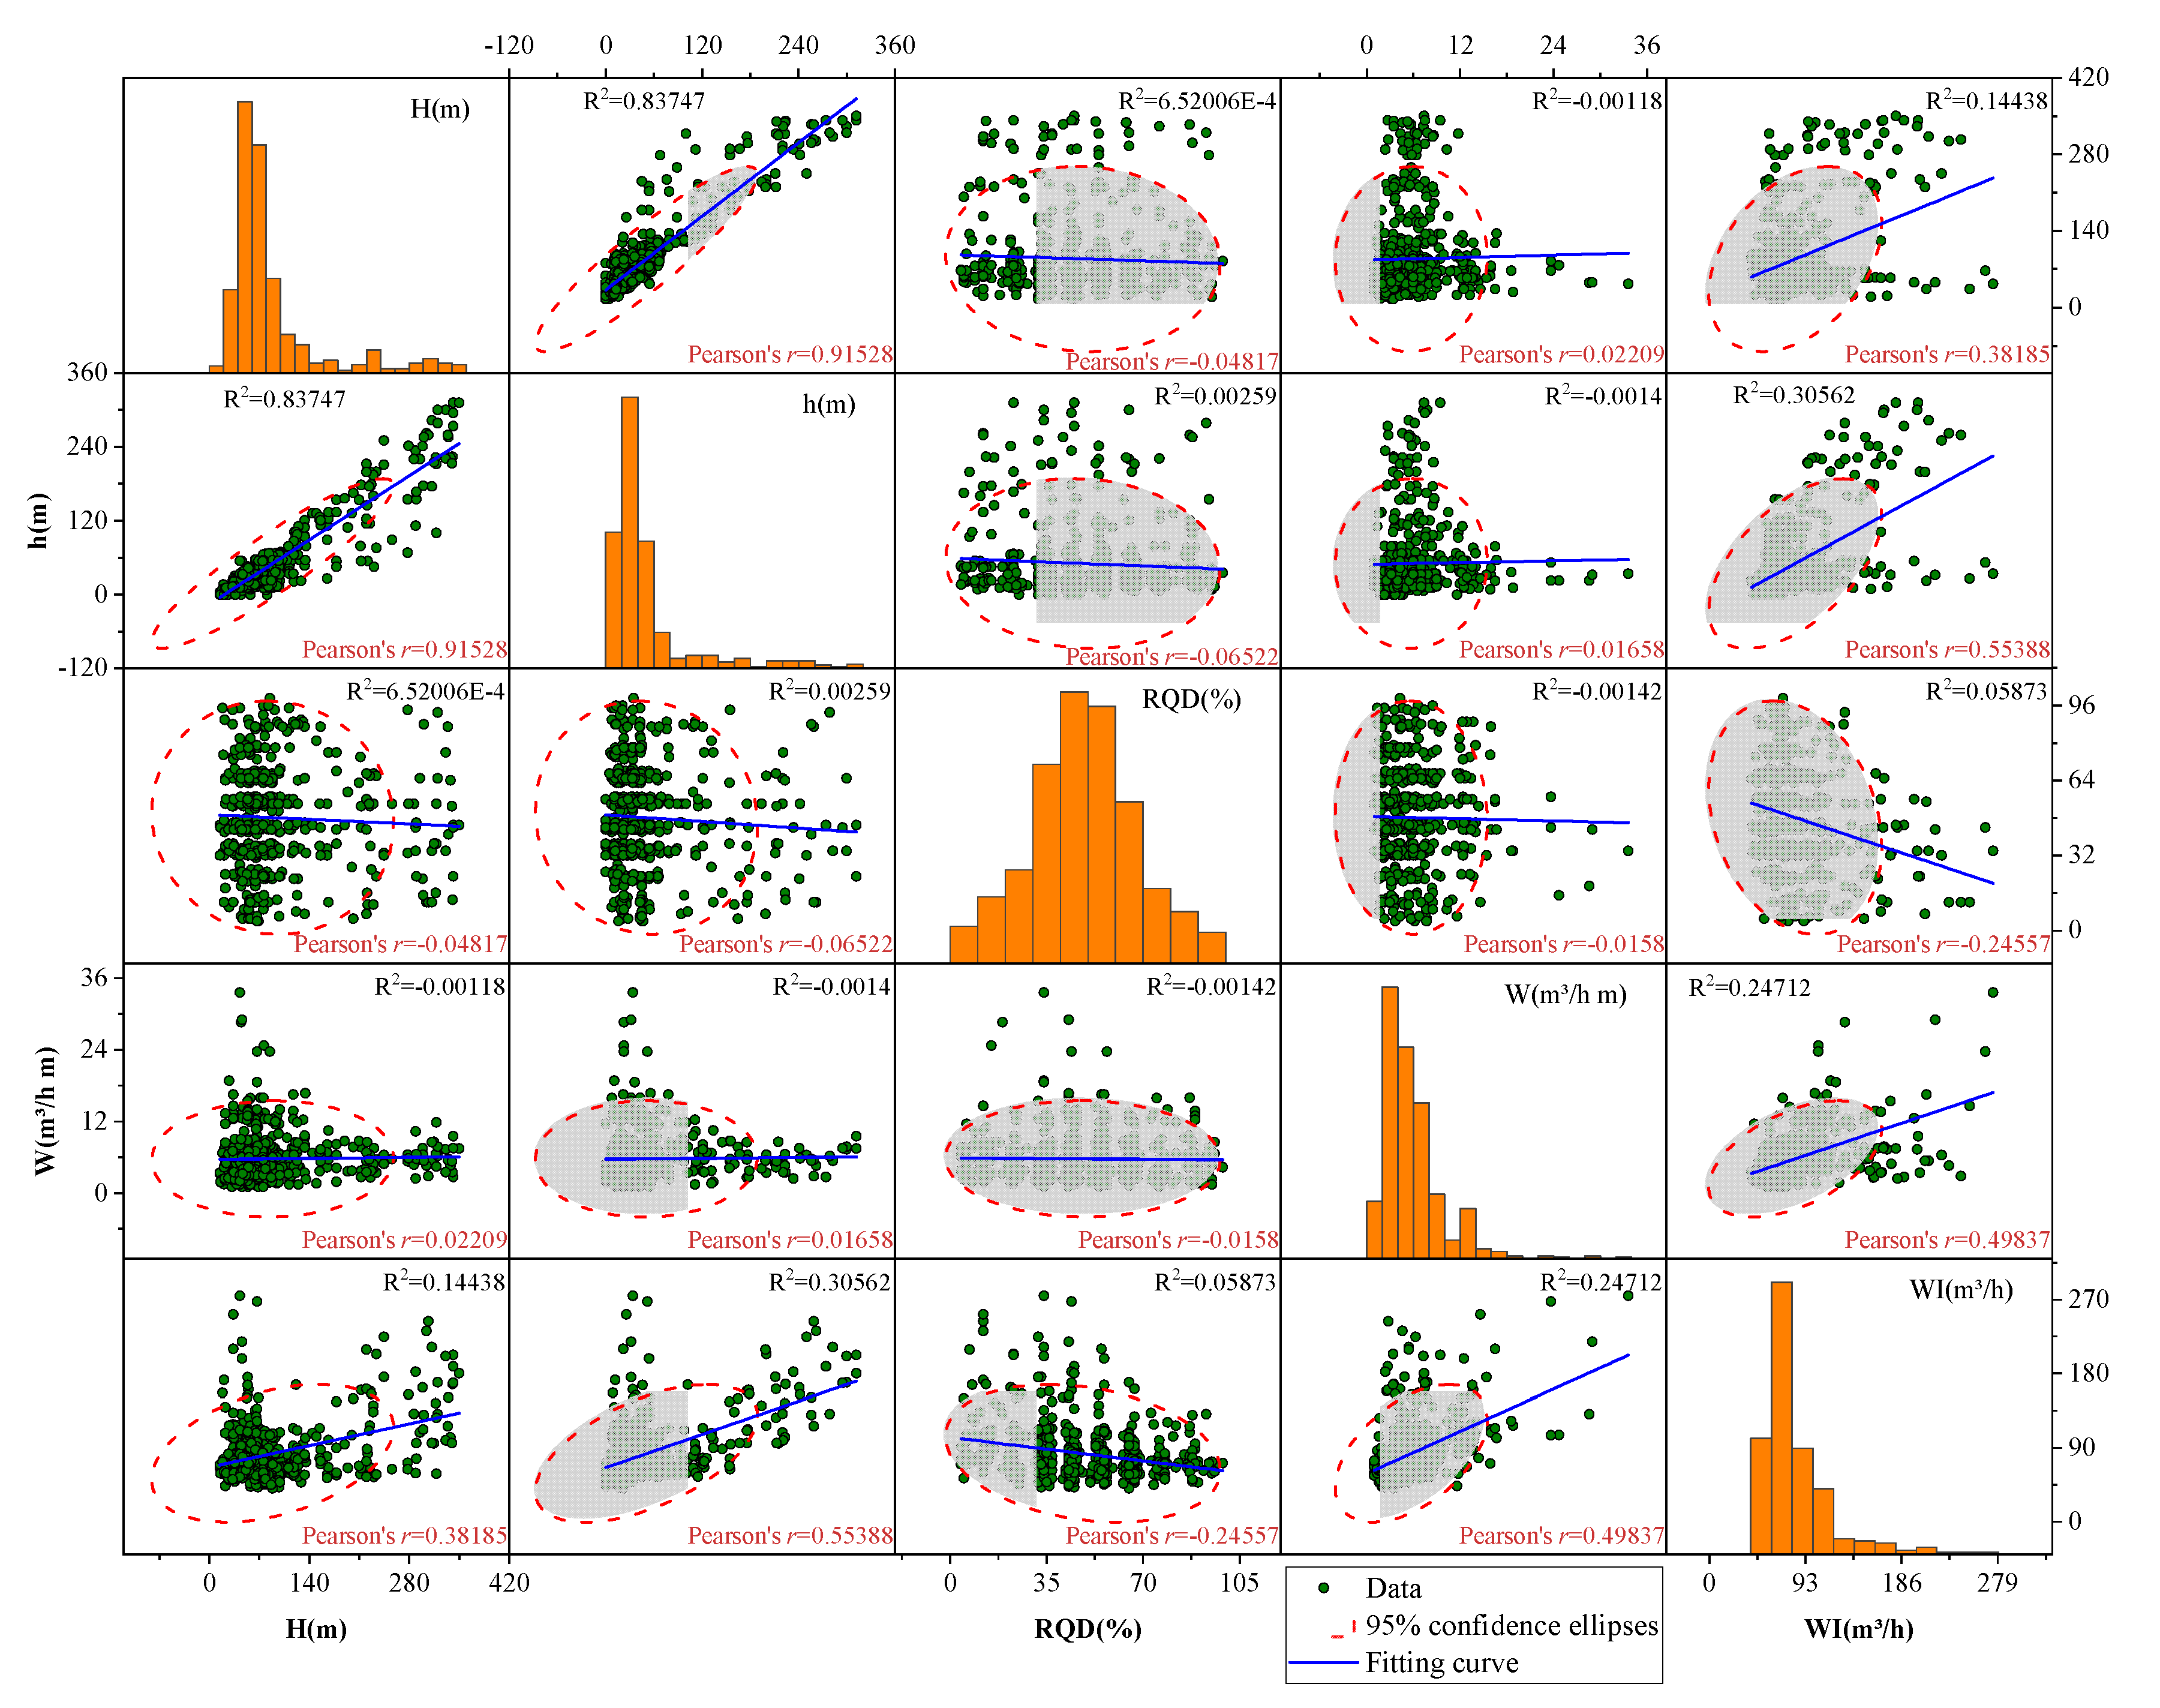
A larger correlation coefficient indicates a stronger relationship between two variables. The correlation analysis results for the four feature parameters are presented in Figure 3. The figure reveals a strong positive correlation between tunnel depth (H) and groundwater level (h), with a Pearson correlation coefficient of r = 0.91528. In contrast, the other parameters exhibit only weak correlations.
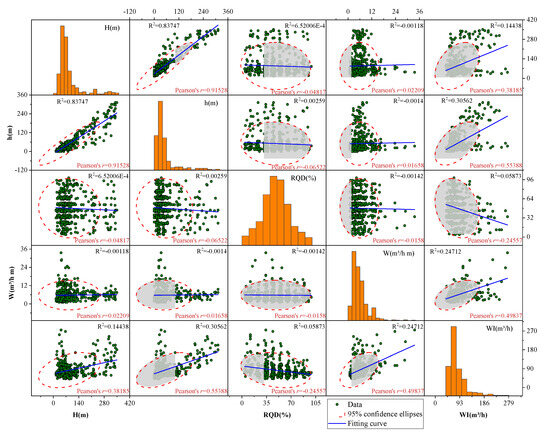
Figure 3.
Illustration of correlation coefficient matrix for water inrush database [23].
2.3.4. K-Fold Cross-Validation
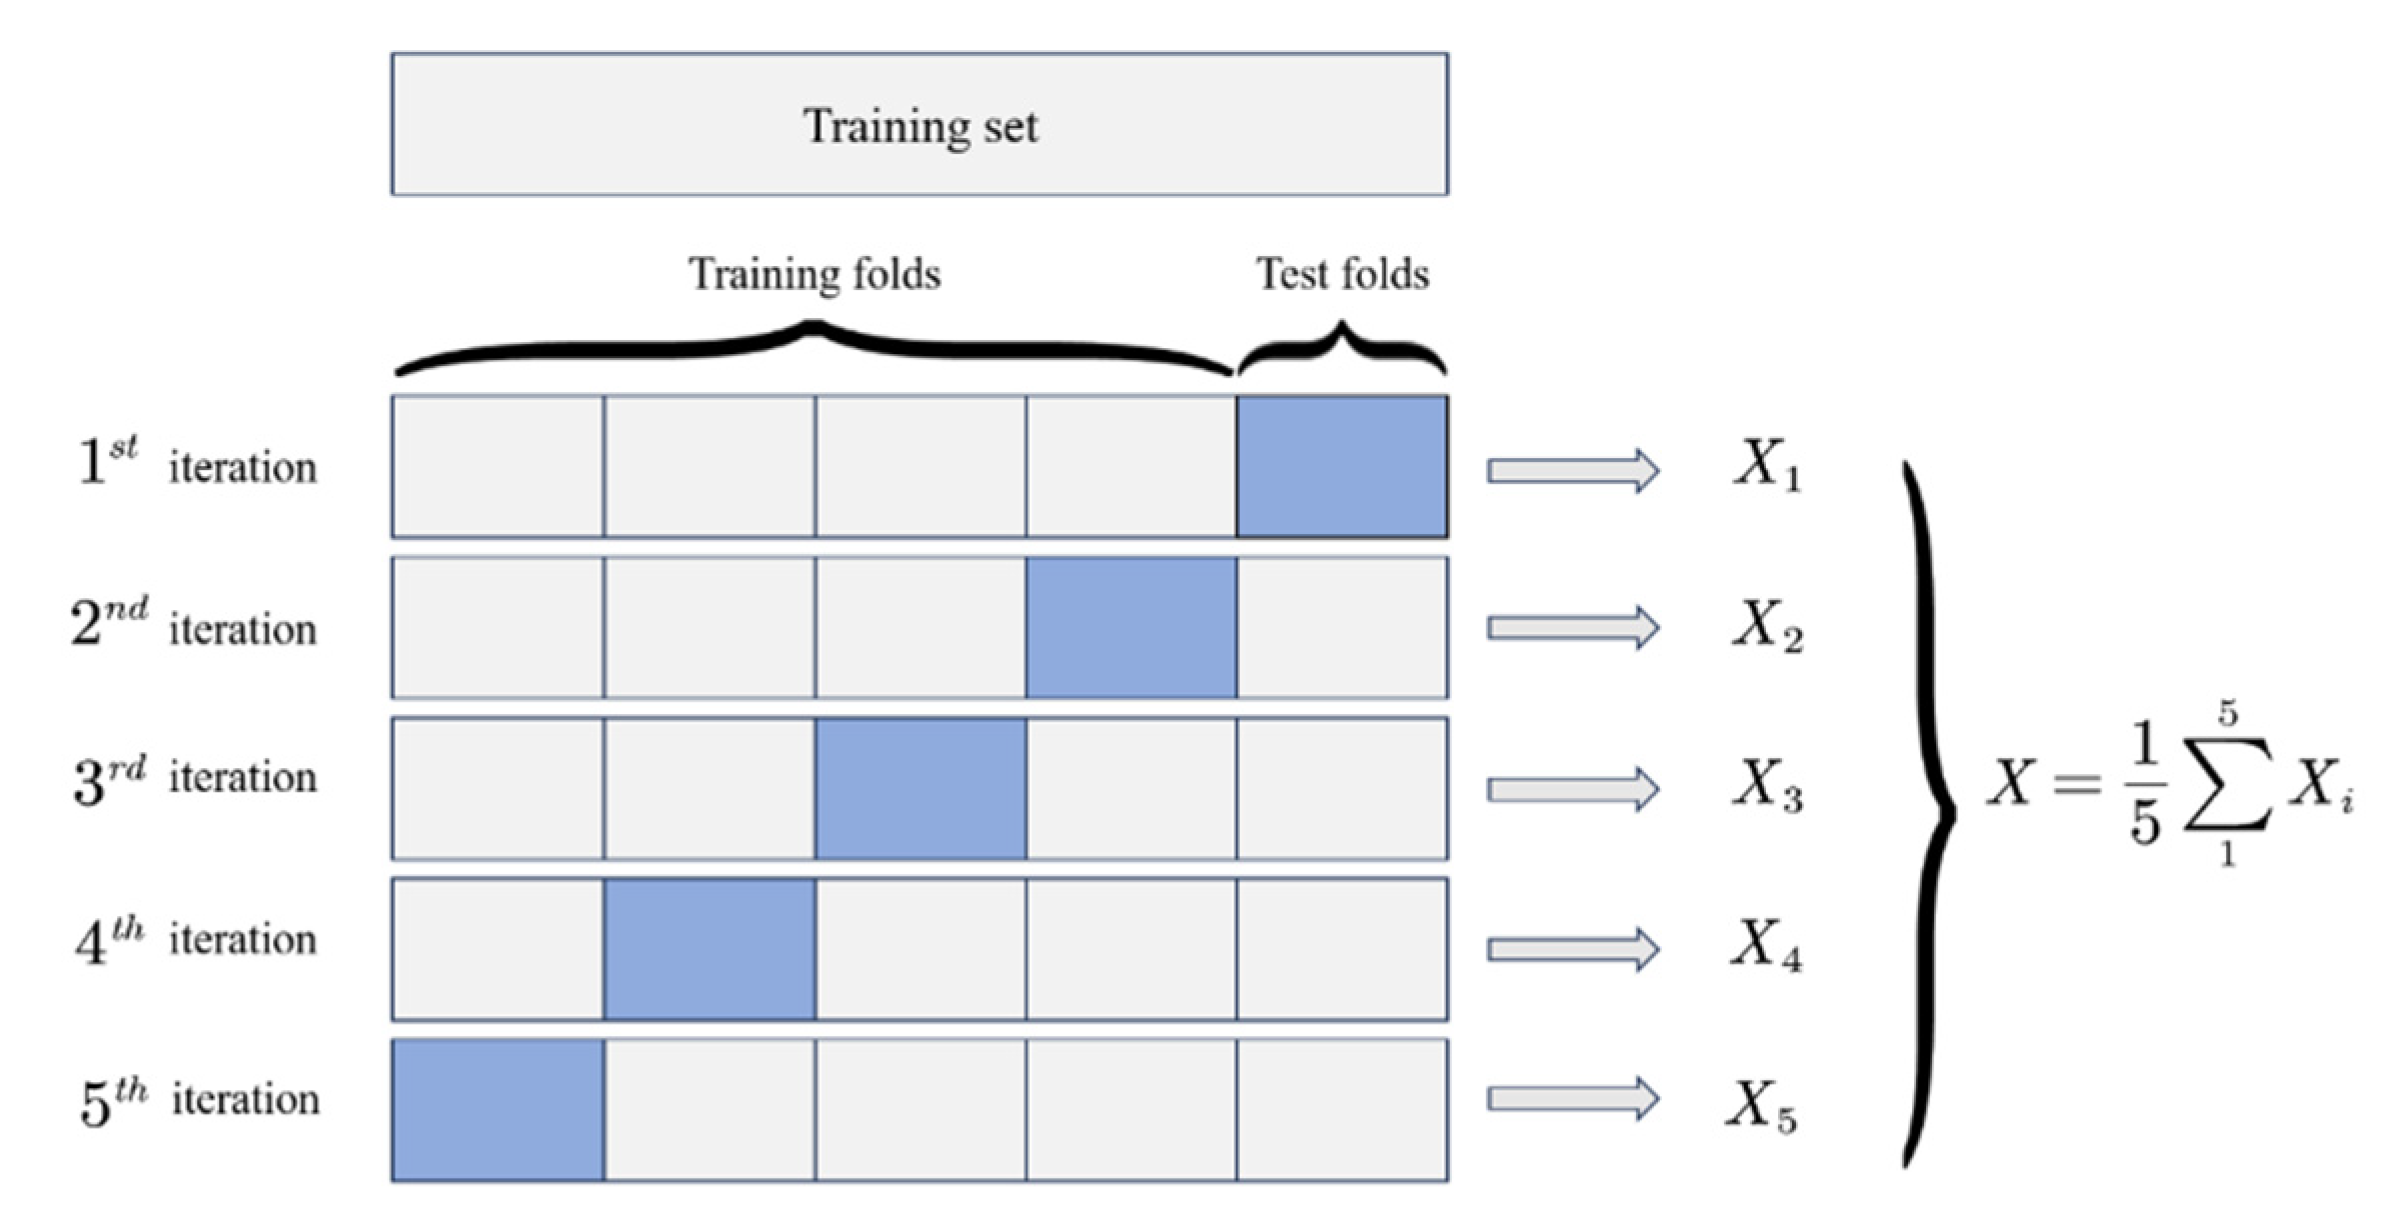
If the training accuracy of a machine learning model is high, then it is likely that some characteristics of the training sample are considered by the machine to be universal properties of the model. These results result in the phenomenon of the “overfitting” of the model on the training sample, which will greatly reduce the generalization performance of machine learning and greatly limit the range of the prediction input. In this method, the dataset containing N samples is divided into K copies, each of which contains N/K samples. The K-fold cross-validation method utilizes K iterations where, in each iteration, one of K subsets serves as the validation set and the remaining K-1 as the training set. Each round involves model training followed by validation, yielding K independent performance estimates. The final score is derived from the mean of these estimates or the peak performance observed. The five-fold validation scheme is depicted in Figure 4.
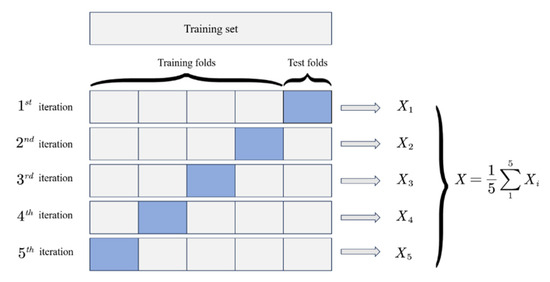
Figure 4.
Schematic diagram of five-fold cross-validation.
3. Development of the BOA-LSTM Water Inrush Prediction Model
3.1. The Whole Process of the Proposed Model
A Bayesian optimization-LSTM model is proposed for tunnel water inflow prediction, with the dataset being partitioned via the K-fold cross-validation method to ensure reliable generalization. Generally speaking, K-fold cross-validation should ensure sufficient sample numbers for machine learning algorithms. The dataset was allocated with 80% for training and the remaining 20% for testing. During Bayesian optimization, the root mean square error (RMSE) of the verification set was used as the iteration index to extract the best number of hidden layer units, initial learning rate, and L2 regularization coefficient from the set finite iteration times. Then, the data calculation and prediction were formally carried out, and the results were compared. The detailed steps are as follows.
Data preprocessing: A systematic preprocessing procedure was applied to the raw data prior to modeling. Stationarity was evaluated using box plot diagnostics, followed by differencing transformation when necessary. Normalization was then conducted to address scale variations inherent in multidimensional feature vectors. This standardization process mitigates dimensional effects and establishes a consistent basis for comparing cross-dimensional metrics in machine learning workflows. In this study, the data are standardized to the interval [0, 1] to avoid the aforementioned influence.
Format conversion: Convert the data into the format required by the model and prepare the input data.
Create a function to be optimized: First, assume an LSTM model function. Then, input the relevant setting information; create a Bayesian optimization function; set the number of hidden layer units, initial learning rate, and L2 regularization coefficient as optimization objectives; and define the optimization range.
Run the Bayesian optimization function: Through five-fold cross-validation, the data were divided into five equal subsets. The Bayesian optimization was conducted with preset iterative parameters, and the RMSE values from each validation set were compared. This process enabled the extraction of the optimal hyperparameters—specifically the number of hidden layer nodes, initial learning rate, and L2 regularization coefficient—within the predetermined range.
The predictions are reconstructed and subjected to inverse normalization using the parameters derived from the Bayesian optimization. The RMSE of the validation set is then computed to assess whether it meets the predefined convergence criteria. If satisfied, the final output is generated; otherwise, the algorithm returns to the optimization step.
Fill the optimized parameters into the LSTM model to form a complete BOA-LSTM model. Then, input the remaining 20% of the database into the model for prediction and subsequently perform simulation prediction and reverse normalization on the predicted data to obtain the output results.
3.2. Performance Evaluation Indexes
The model’s predictive accuracy and generalizability were assessed using root mean square error (RMSE), mean absolute error (MAE), mean bias error (MBE), and the coefficient of determination (R2). The R2 metric, defined as the squared correlation coefficient, quantifies the goodness-of-fit by measuring how well the regression predictions approximate the real data points. The statistical measures are defined as follows.
Here, N represents the quantity in the data, yi and represent the true and predicted values, respectively, and is the average of the true values.
3.3. Data Interpretation and Analysis Based on SHAP
The Shapley value proposed for the first time that in order to solve the cooperative game problem in game theory, it is allocated according to the contributions of different members in the whole sentence to ensure an equitable distribution of resources [39]. The core idea is to consider the marginal benefits brought by each member to the overall game, and the Shapley value is the average value of multiple simulations. With the development of machine learning field, the “black box” characteristics of machine learning model need to be explained through interpretability analysis, and the application of Shapley additive explaining theory is a method proposed based on cooperative game problem to explain the contribution degree of internal characteristic parameters and model performance of machine learning model [40,41], which is used to measure the contribution degree and importance of various parameters interaction to the prediction target.
where represents the SHAP value of the i feature; M is the set of all parameter variables; S is a subset of M; F is the set of all features, represents the marginal benefit of parameter i under S set, is the selected model, and is the number of input features in the feature subset. After SHAP analysis, the Shapley value and importance ranking of each input parameter can be determined.
In this paper, SHAP machine learning interpretable analysis is used to analyze the interpretability of tunnel water inflow prediction parameters. As for the SHAP analysis, different data preprocessing methods for the same dataset will lead to different results, and the calculation with different models will be slightly different, but the main influence trend of the same preprocessed dataset analyzed with different models is basically the same. Therefore, the prediction results of this chapter are calculated and analyzed by using the SHAP theory method on the parameter data in the dataset, and the quantitative indicators are used to find out which parameter characteristics in the tunnel water inflow dataset have the most significant impact on the model output, that is, the tunnel water inflow, and how these parameter characteristics affect the model output in the dataset. This chapter mainly uses the summary plot, feature importance plot, interaction summary plot and dependency plot to visualize the interpretability of the parameters of the water inflow database of the whole tunnel.
4. Results and Discussion
4.1. Water Inflow Prediction Results
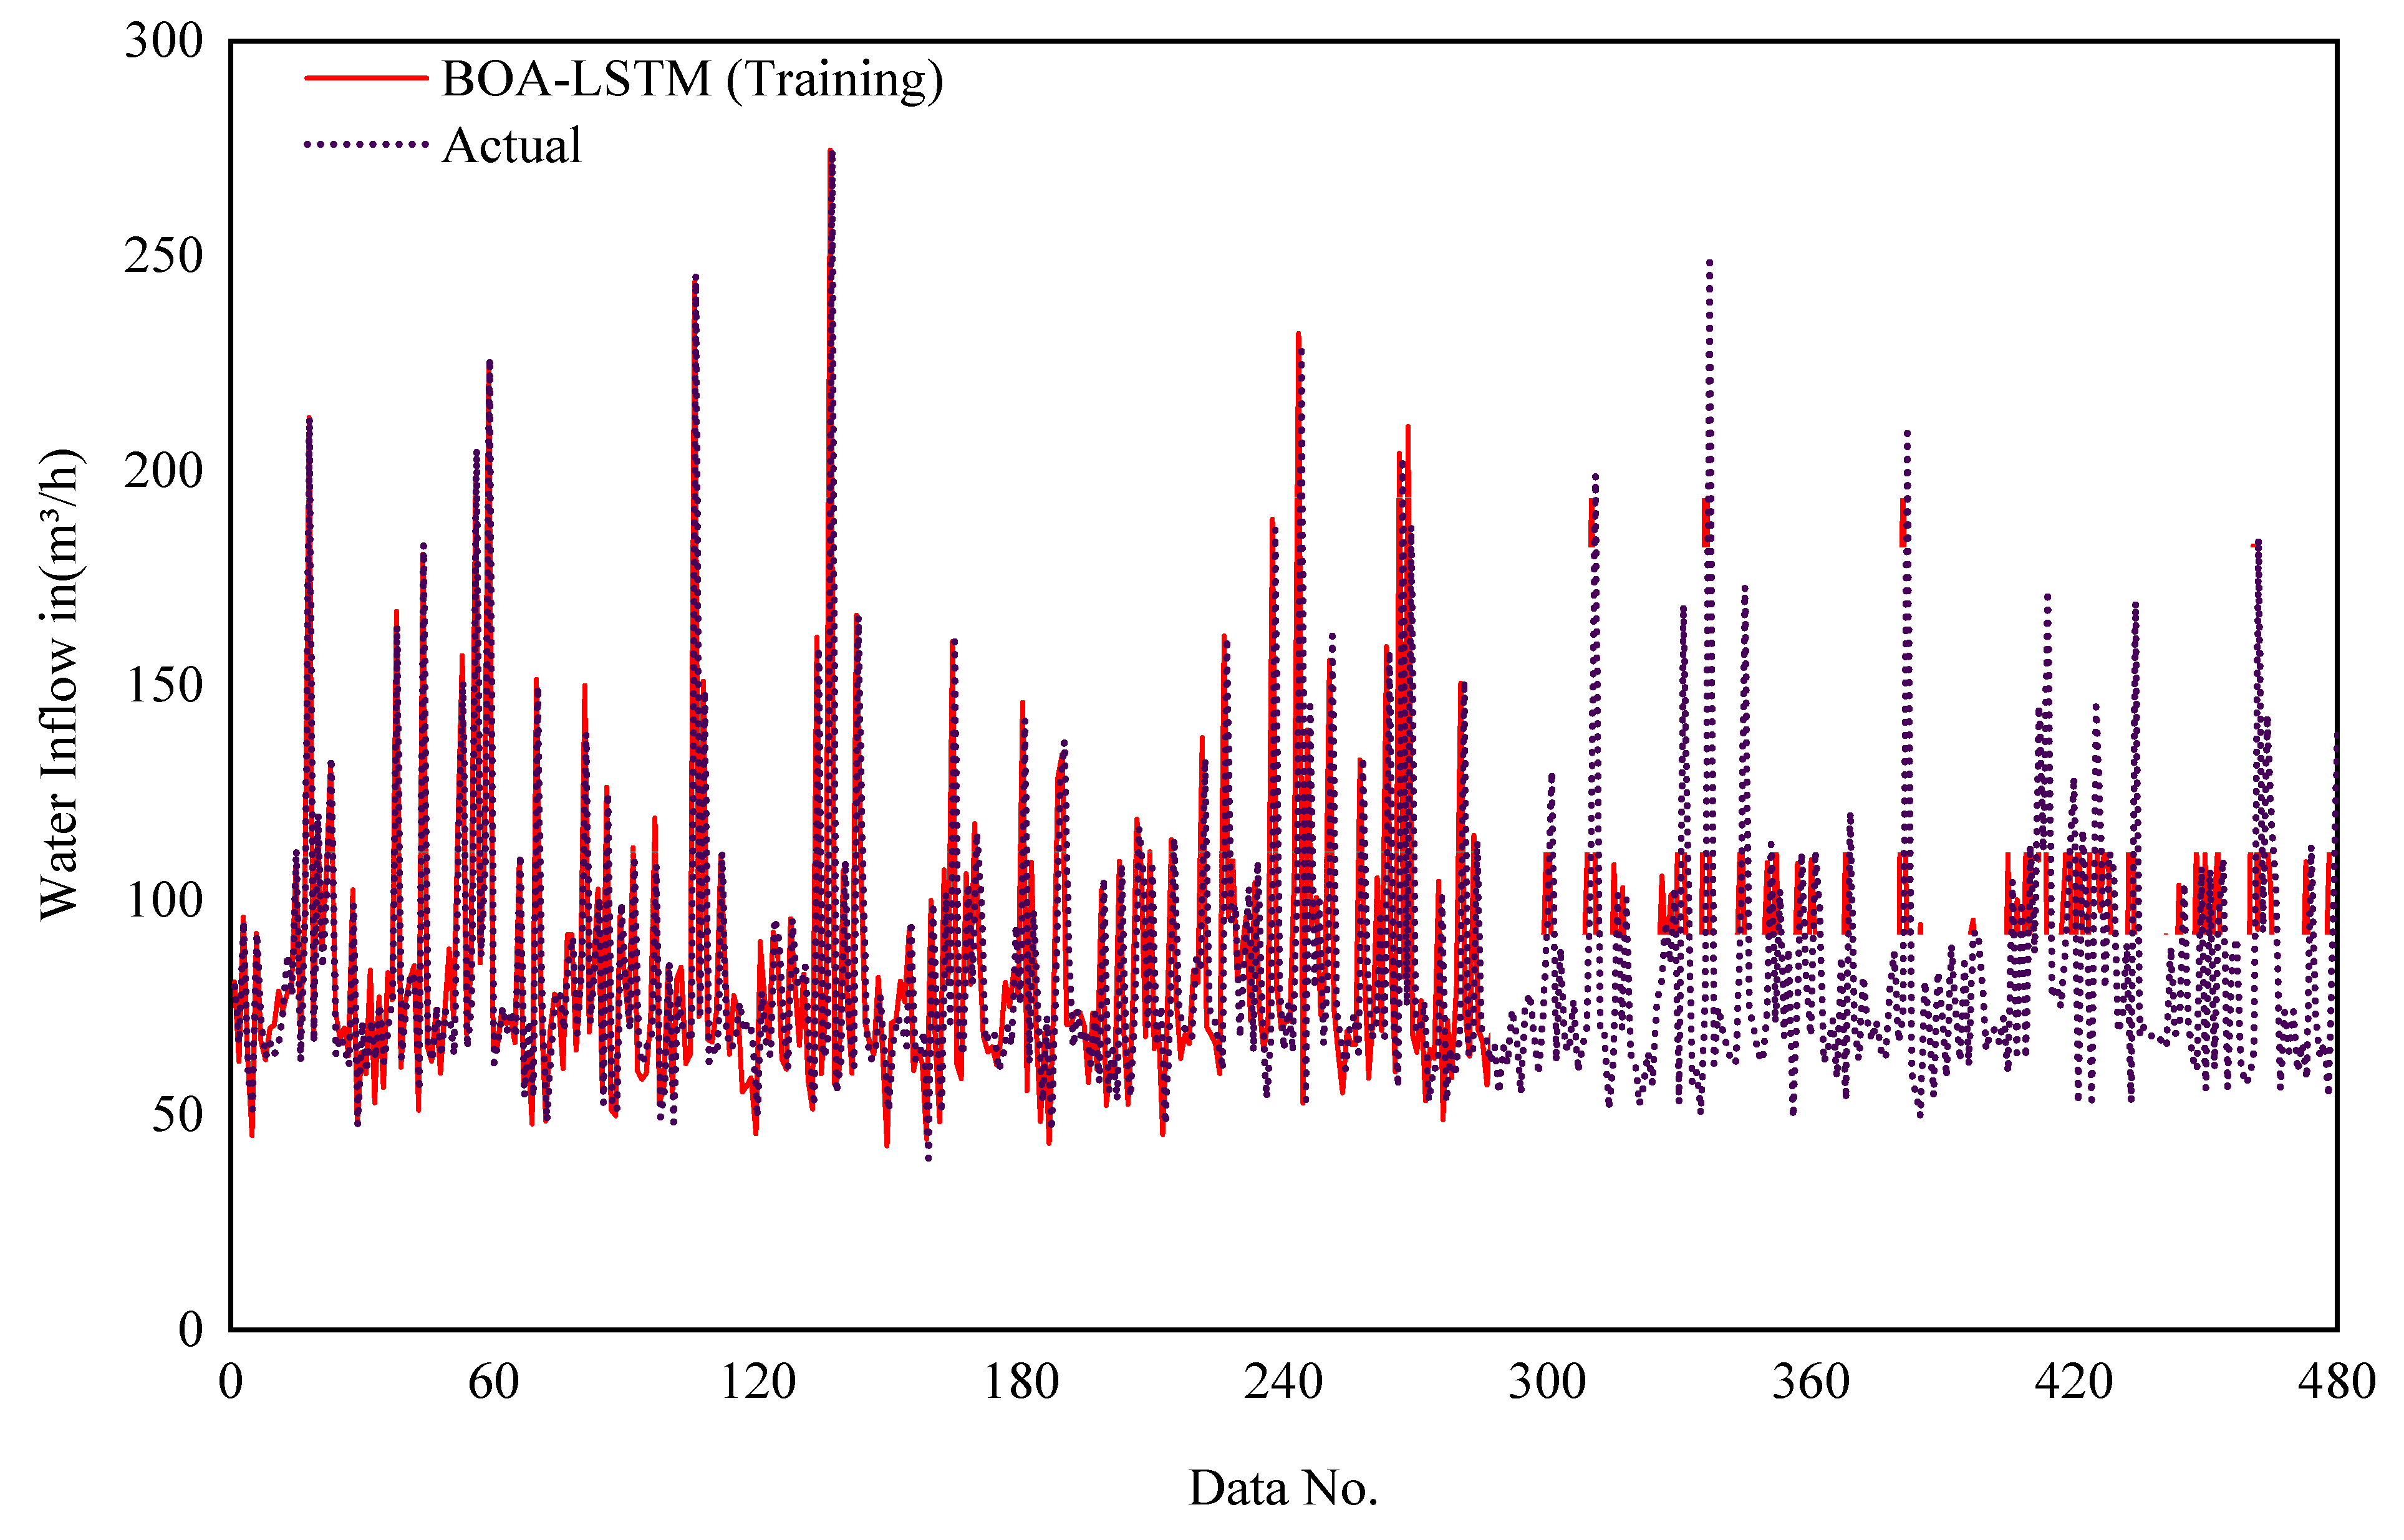
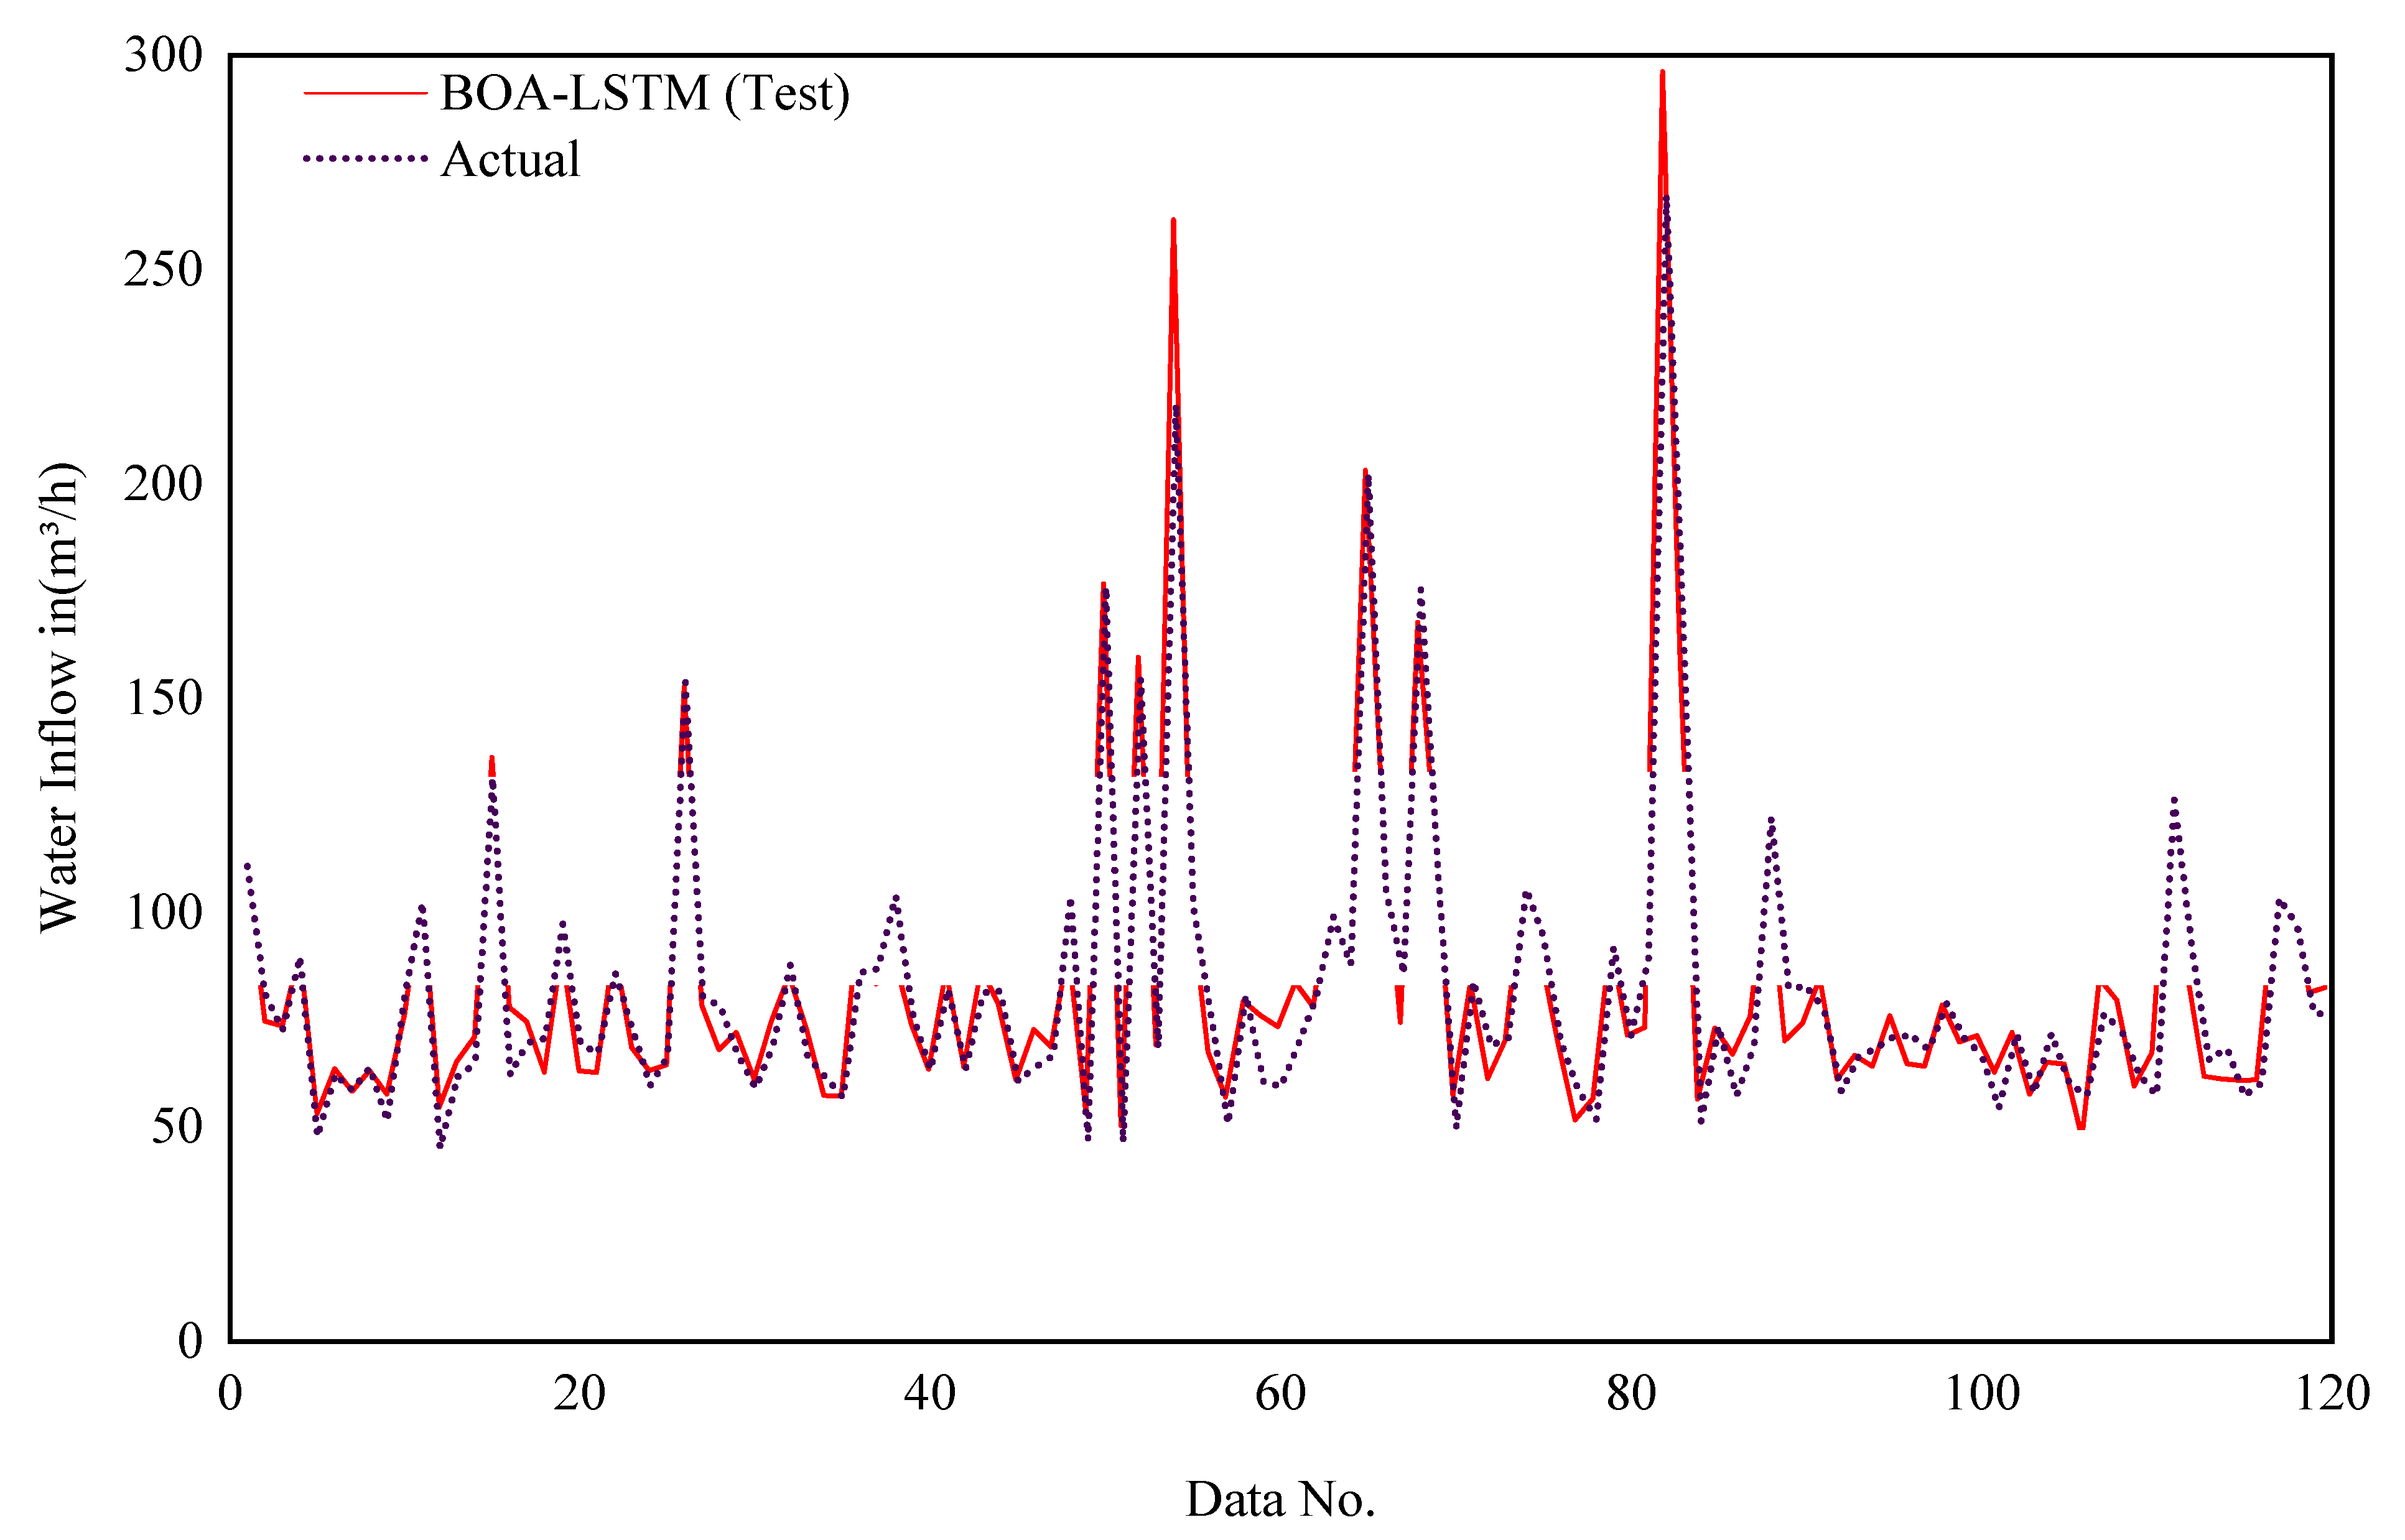
The selection of network parameters represents a critical determinant of LSTM performance, with the model’s generalization capacity being highly contingent upon their optimal configuration. Using the five-fold cross-validation method and BOA-LSTM model to predict water inflow is the solution we choose. These evaluation indicators serve to assess the accuracy of the forecasting outcomes. During training, the five-fold cross-validation process in the Bayesian optimization algorithm divides the data in the database into five equal groups. Each group is selected separately as the test set, and the other four groups are selected as the training set. The tunnel buried depth (H), groundwater level (h), rock mass quality index (RQD) and water yield property (W) in each subset are taken as inputs, and the number of hidden units, initial learning rate, and L2 regularization coefficient are designated as the output parameters. The optimal number of hidden layer units, initial learning rate, and L2 regularization coefficient are found in the set interval. The LSTM input parameters used in this study are shown in Table 2. The network parameter Max Epochs refers to the maximum number of training sessions, Gradient Threshold refers to the gradient threshold, Learn Rate Drop Period refers to the number of training sessions required to adjust the learning Rate, Learn Rate Drop Factor refers to the learning rate adjustment factor, Num Of Units is the best number of hidden layer units obtained after optimization, Initial Learn Rate is the best initial learning rate obtained after optimization, and L2Regularization is the L2 regularization coefficient obtained after optimization. The MATLAB R2022b platform was used to develop the BOA-LSTM water inflow prediction model, and the computer used has the following configuration: Intel(R) Core(TM) i7-9750H CPU @ 2.60 GHz and 16 GB RAM (Intel Corporation, Santa Clara, CA, USA), Windows 10 operating system. Figure 5 and Figure 6 show the training results of the BOS-LSTM model. Figure 5 shows the comparison between the real value and the training value of the training set water inflow in the model training process, and Figure 6 shows the comparison between the real value and the training value of the test set water inflow in the model training process. Figure 5 shows that the overall trends of the real value curve and the training value curve are the same, which proves that the training effect of the model training set is good, except for a few large differences, most of which are within the small deviation range. Moreover, the comparison data are within the acceptable error range.

Table 2.
BOA-LSTM model parameter settings.
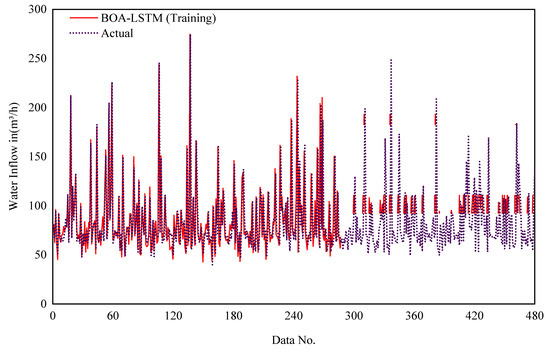
Figure 5.
Model training sets for the prediction results of the water inflow.
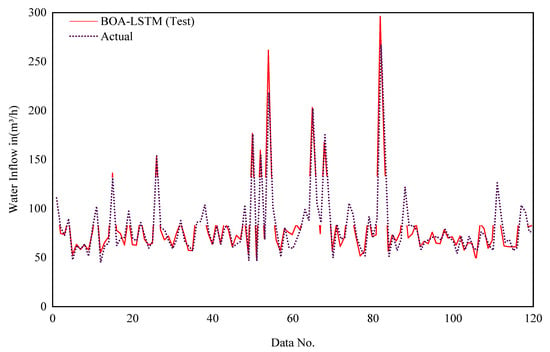
Figure 6.
Model test sets for the prediction results of the water inflow.
The same trend and high coincidence degree of the two curves in Figure 6 prove that BOA-LSTM has a high accuracy in the prediction of water inflow, which proves the potential of this model in engineering applications. This is of great significance for tunnel engineering design, construction risk reduction and local environment protection.
4.2. Comparative Analysis of Prediction Results from Different Models
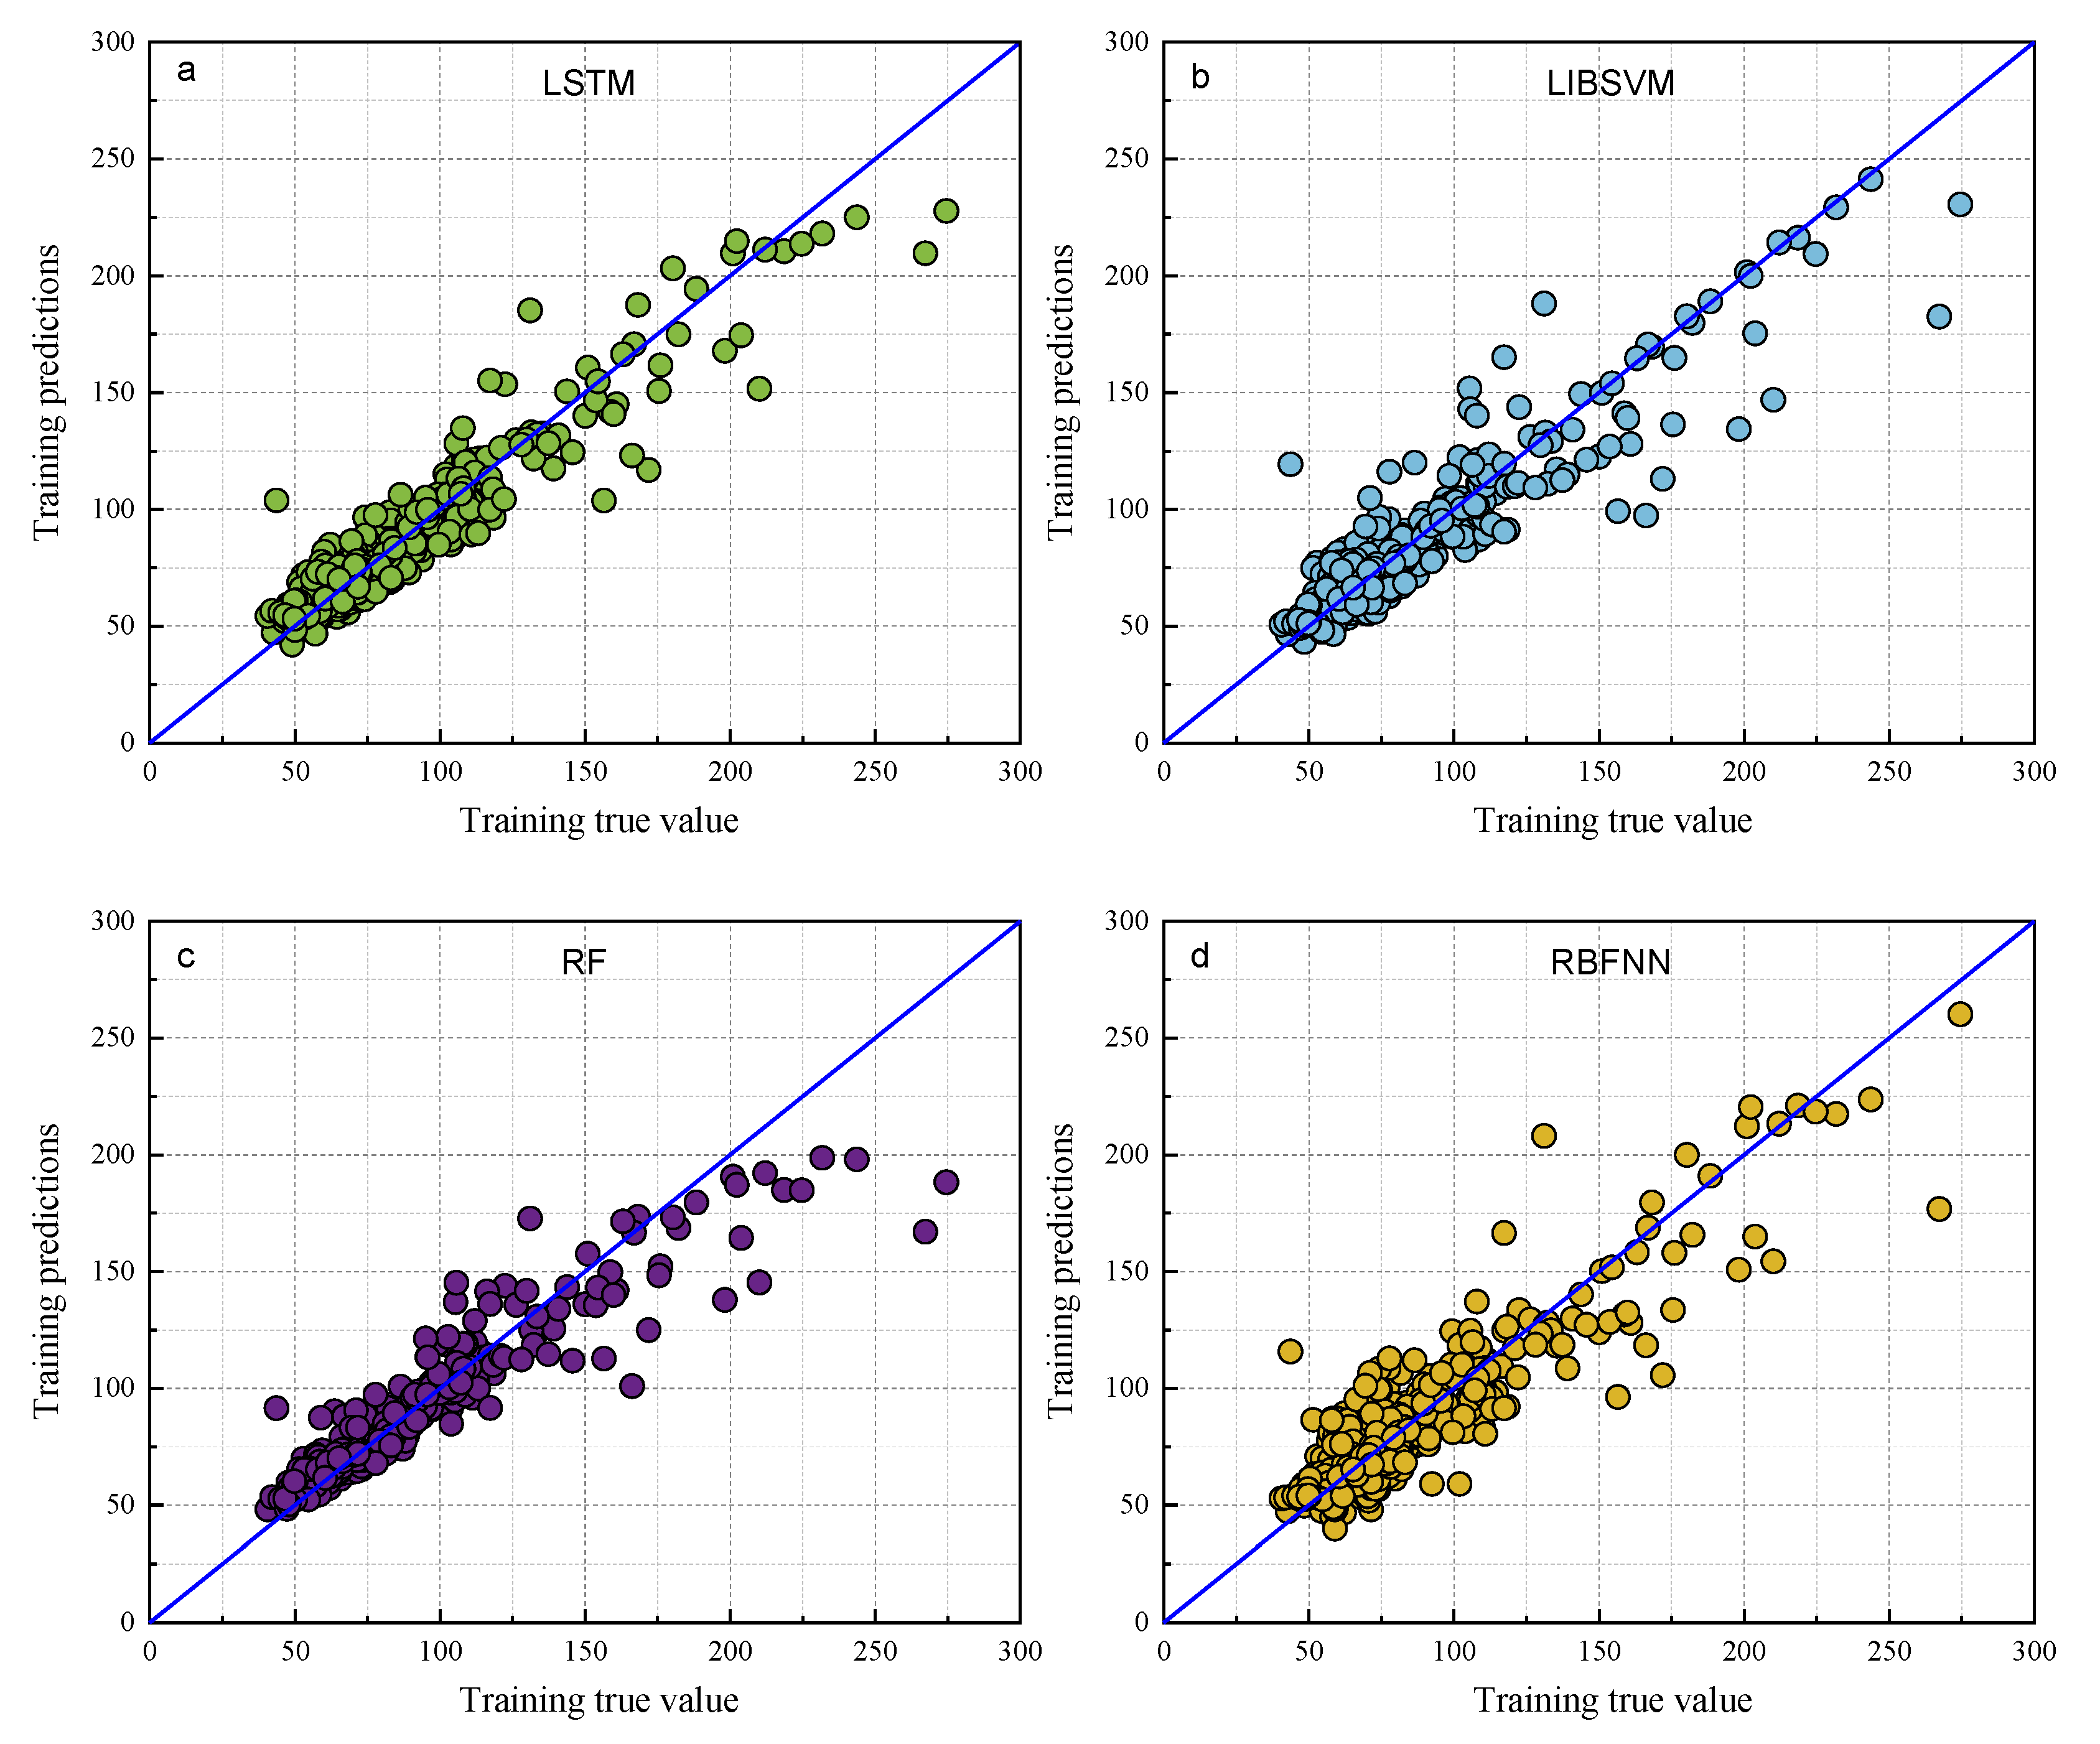
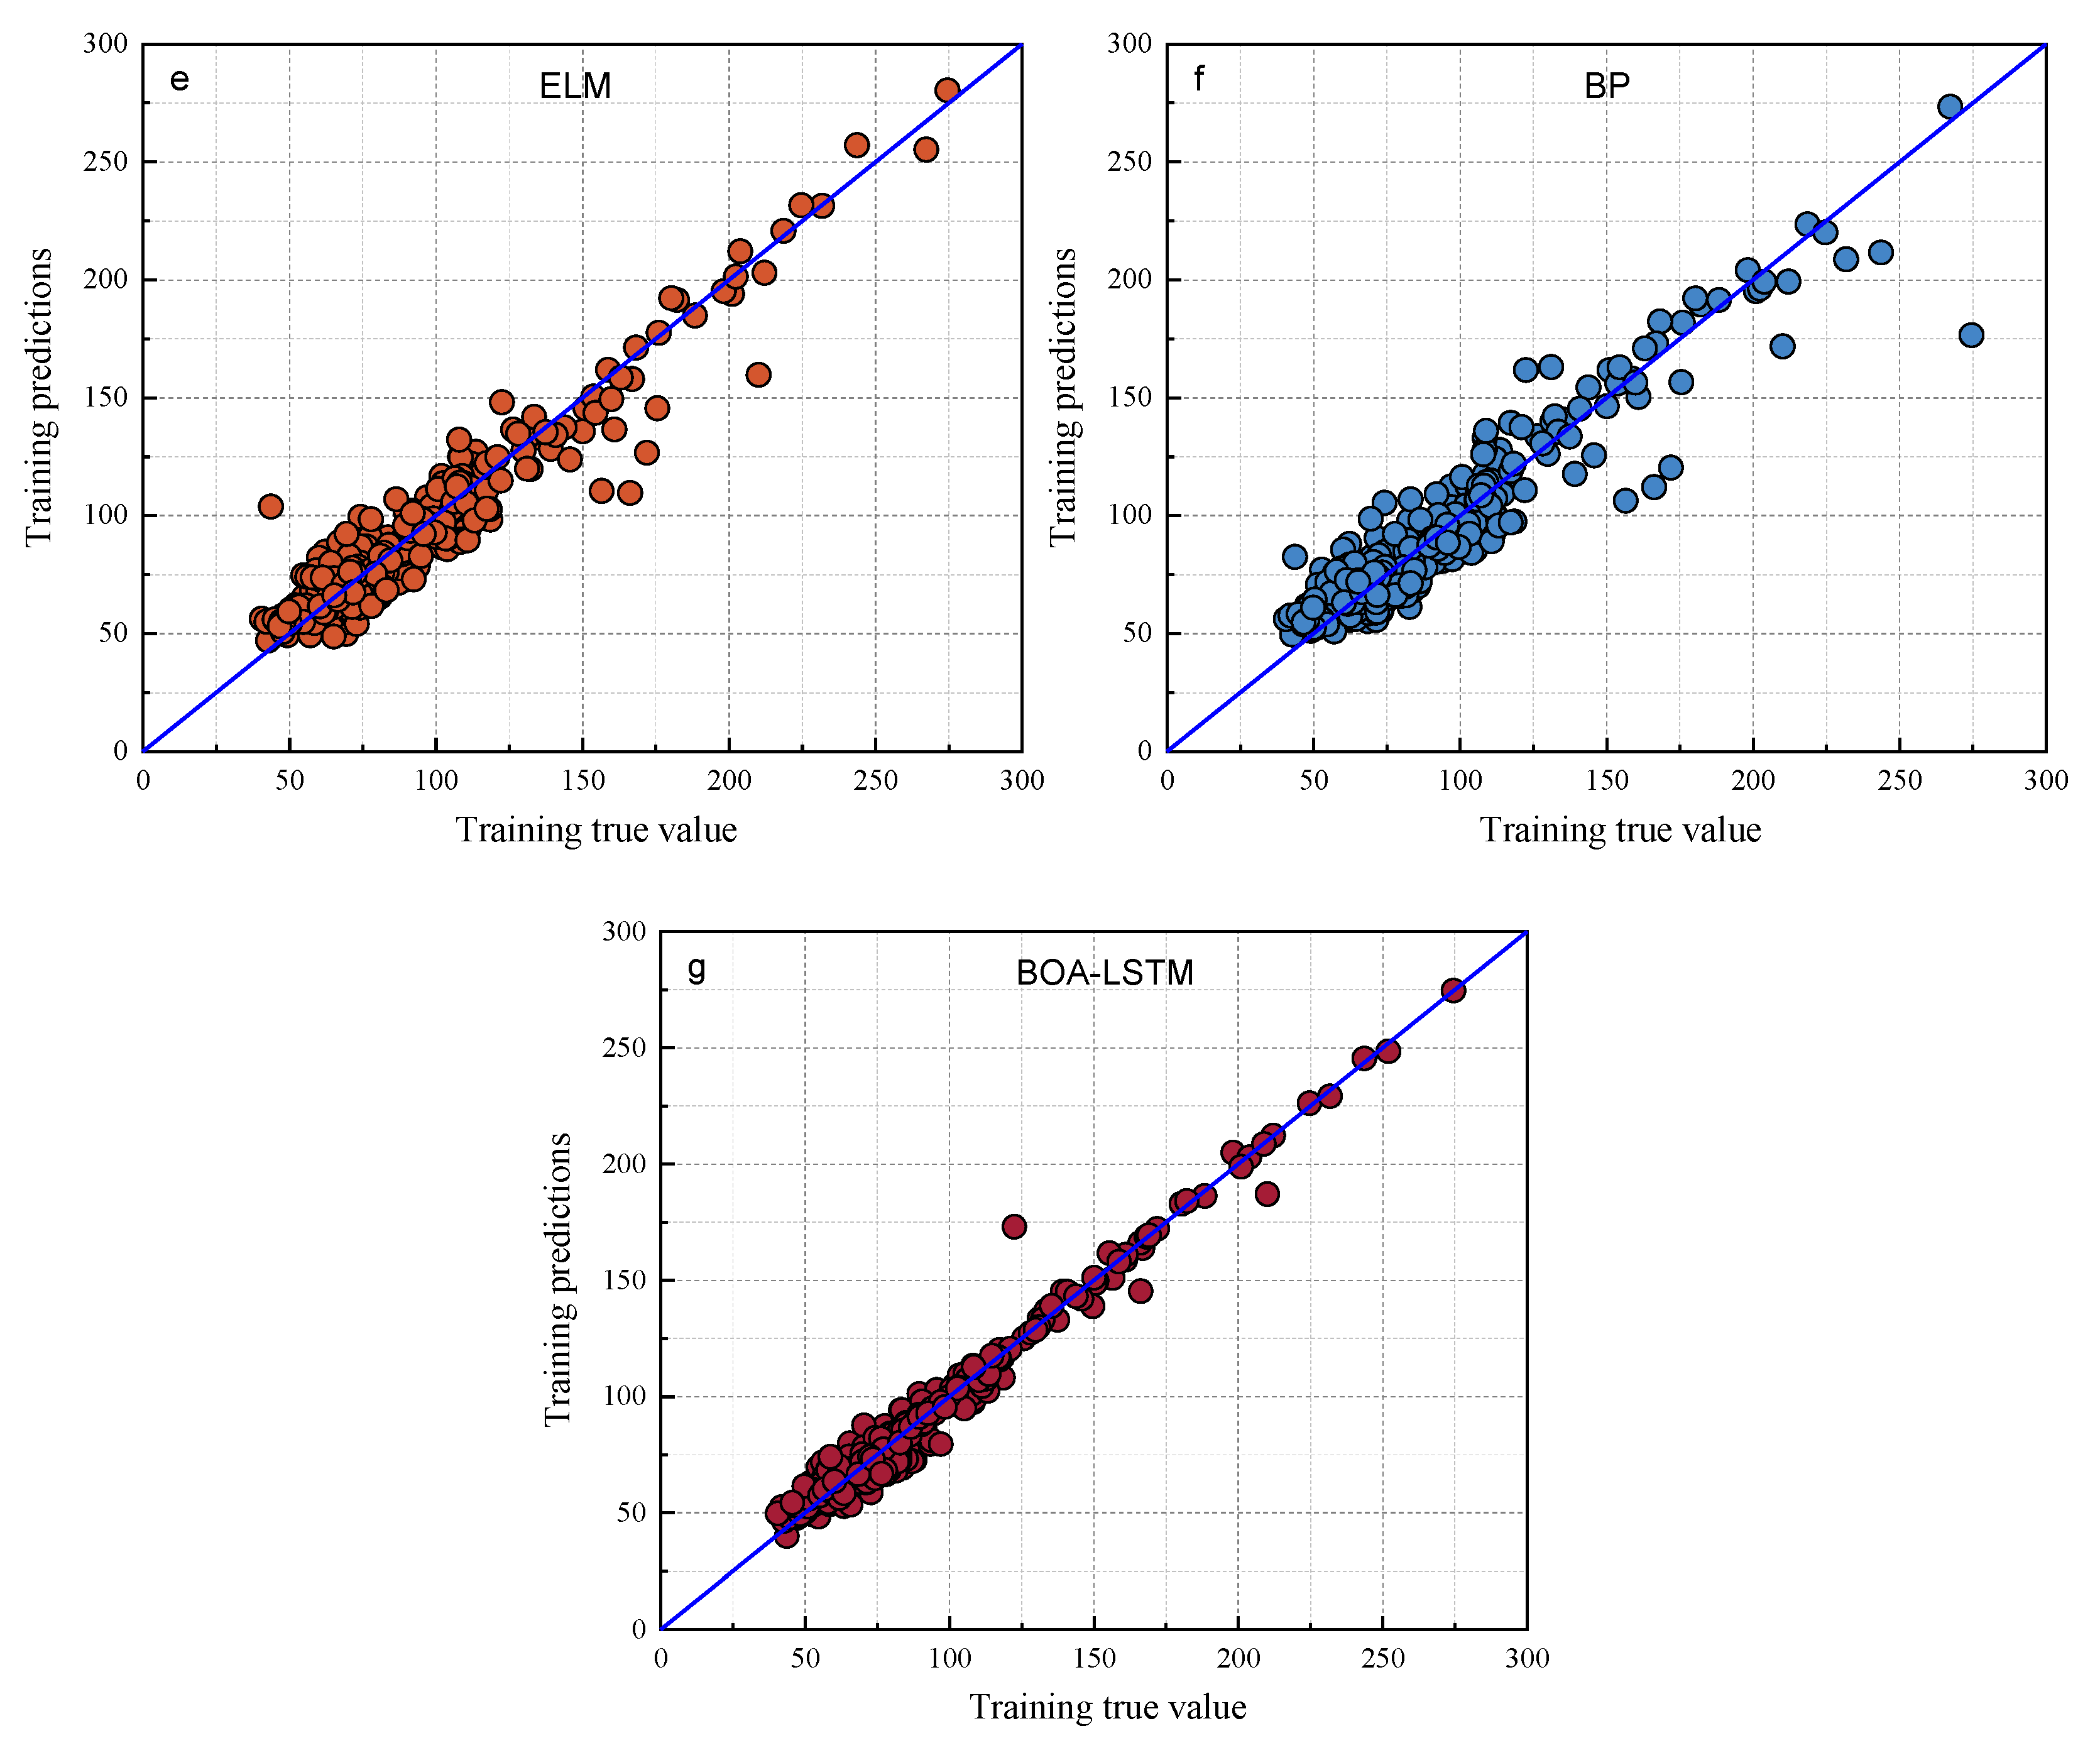
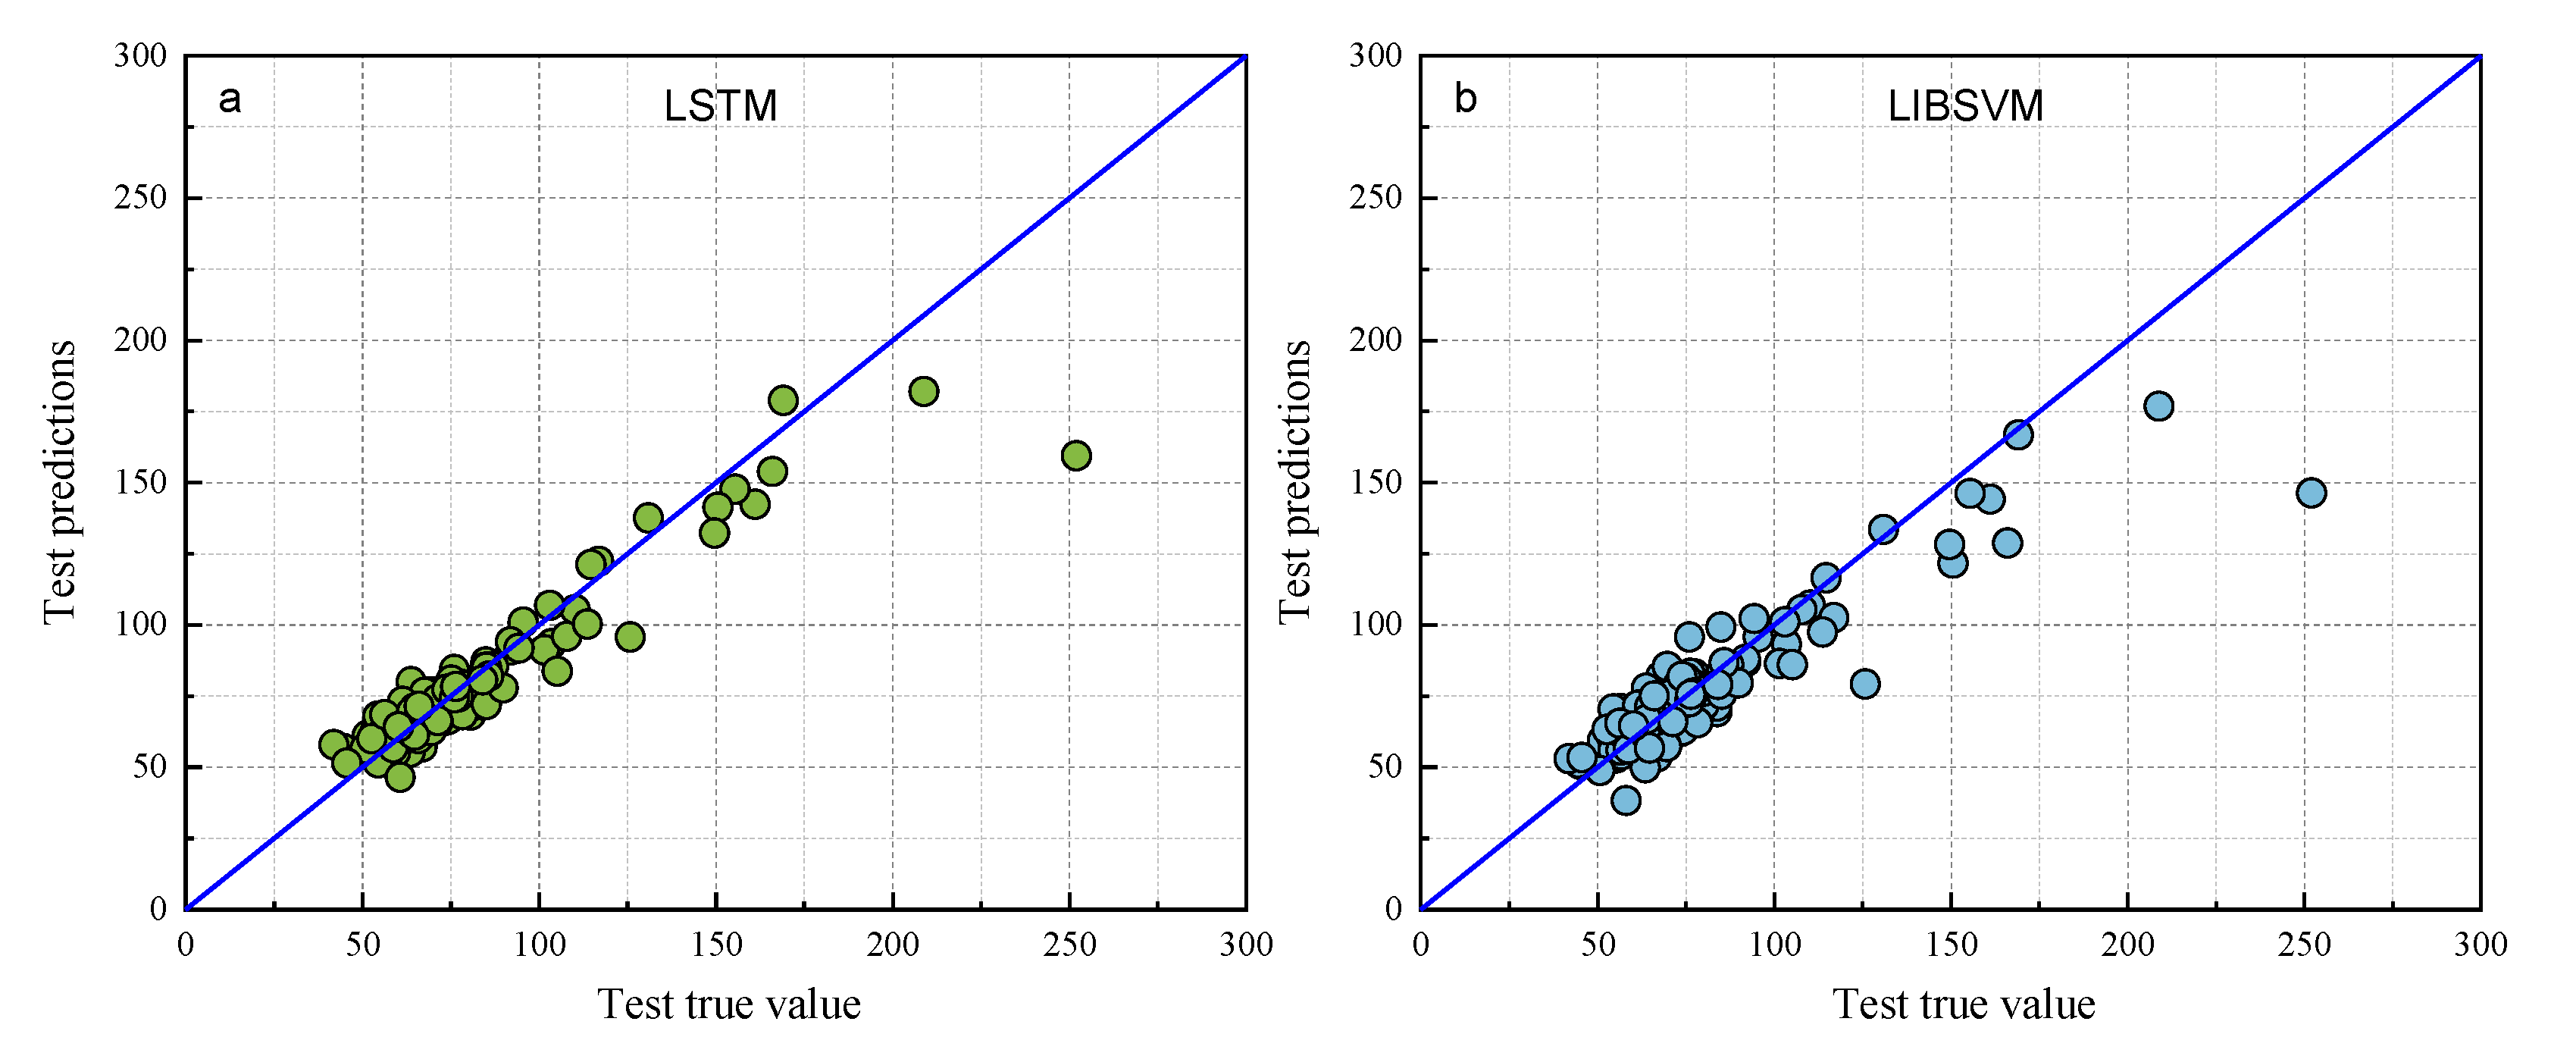
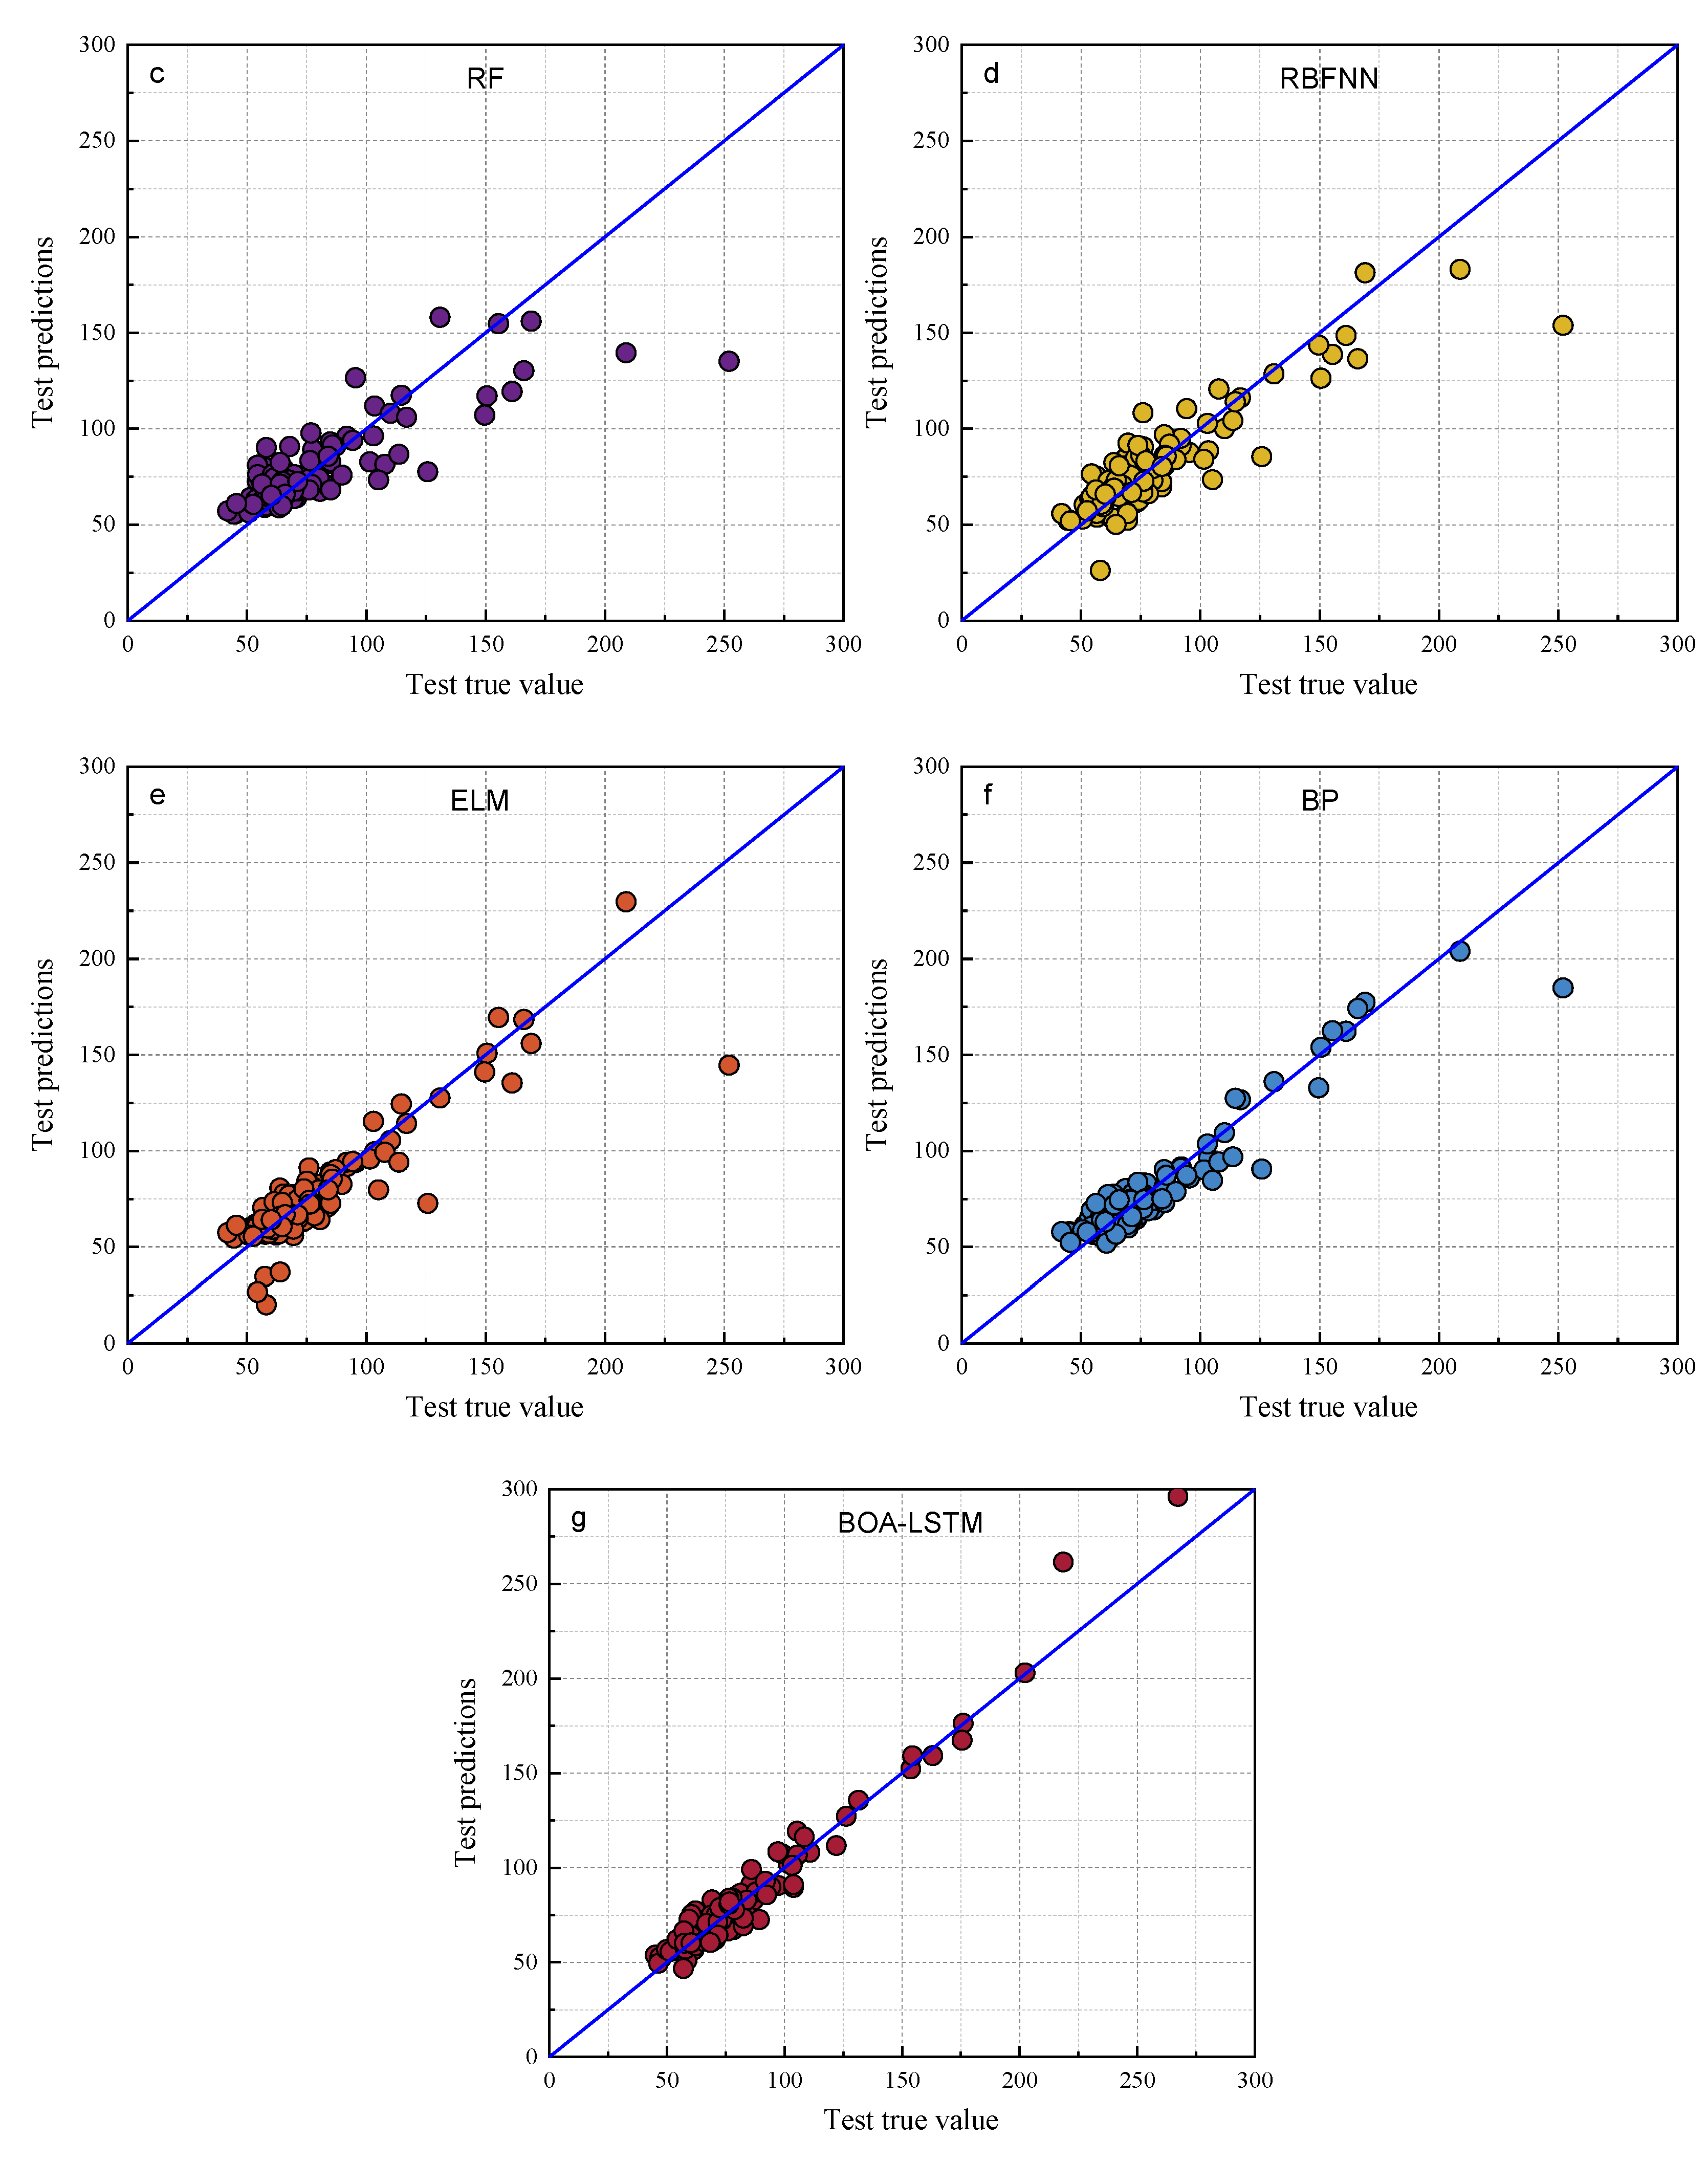
The predictive performance of the proposed BOA-LSTM model was benchmarked against several established approaches, including the Long Short-Term Memory Recurrent Neural Network (LSTM), Random Forest (RF), Backpropagation Neural Network (BP), Extreme Learning Machine (ELM), Radial Basis Function Neural Network (RBFNN), Least Squares Support Vector Machine (LIBSVM), and Convolutional Neural Network (CNN). The comparison results are shown in Table 3 and Table 4. Scatter plots of the models are shown in Figure 7 and Figure 8. Comparing the data in Table 3 and Table 4, the fit degree (R2) of each model in the training set, ordered from high to low, is BOA-LSTM, ELM, BP, RF, LIBSVM, RBFNN, and LSTM. The fit degree (R2) of each model in the test set from highest to lowest is BOA-LSTM, BP, LSTM, LIBSVM, ELM, RBFNN, and RF. From the performance of the fit degree, although LSTM has the lowest fit degree for the training set, the fit degree on the test set is not much different from that for the training set. On the contrary, methods other than LSTM and BOA-LSTM have large fit degree deviations between the training set and test set. For example, the RF training set R2 is 0.86786, but that for the test set is only 0.66443.

Table 3.
Comparison of the results of each model in the training set.

Table 4.
Comparison of the results of each model in the test set.
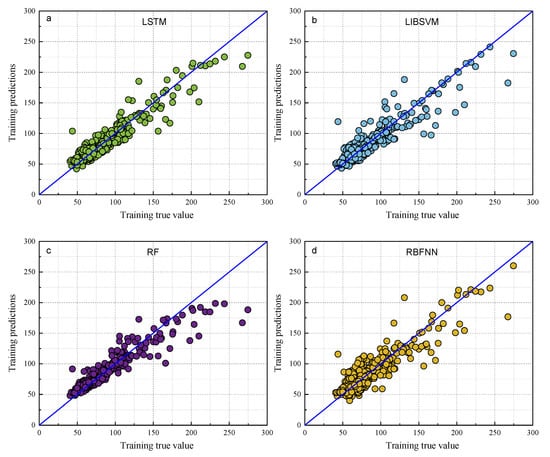
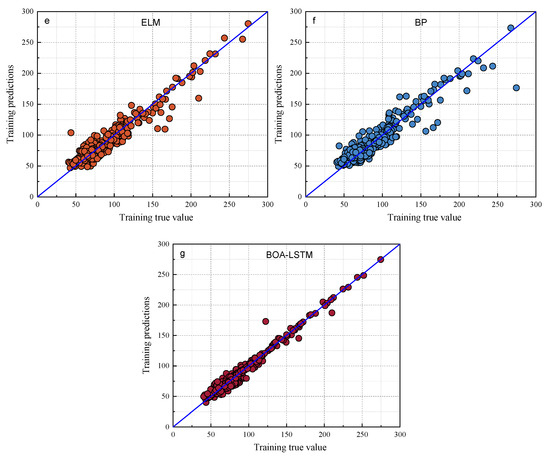
Figure 7.
Scatter plots of the true and predicted values of each model training set. (a) LSTM, (b) LIBSVM, (c) RF, (d) RBFNN, (e) ELM, (f) BP, (g) BOA-LSTM.
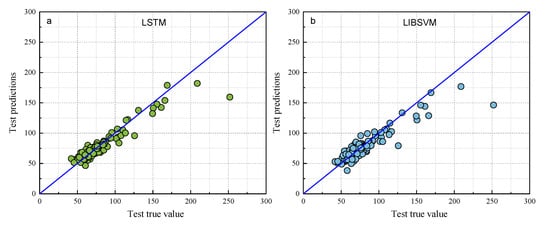
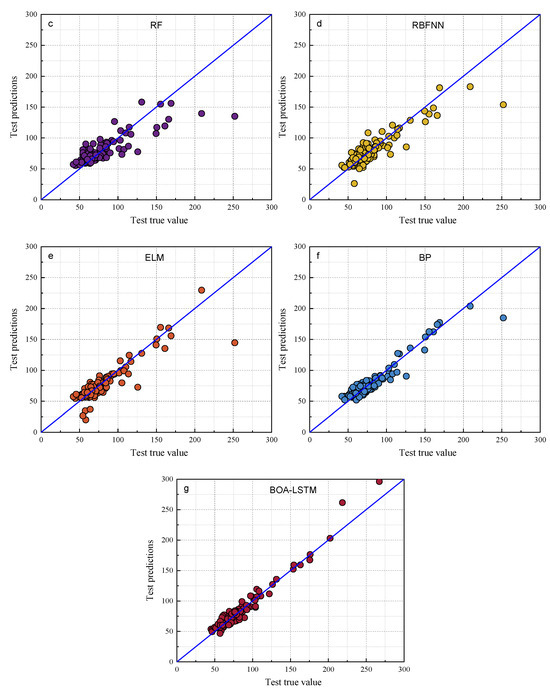
Figure 8.
Scatter plots of the true and predicted values of each model test set. (a) LSTM, (b) LIBSVM, (c) RF, (d) RBFNN, (e) ELM, (f) BP, (g) BOA-LSTM.
As shown in Figure 7 and Figure 8, the predictions of all models generally align along the regression line, with the BOA-LSTM model exhibiting the tightest clustering and fewest outliers. This visual comparison indicates that the LSTM model possesses greater stability than the BP, LIBSVM, ELM, RBFNN, and RF models. Furthermore, the BOA-LSTM model surpasses the standard LSTM across all metrics, with its lower RMSE confirming minimal deviation between predicted and measured values.
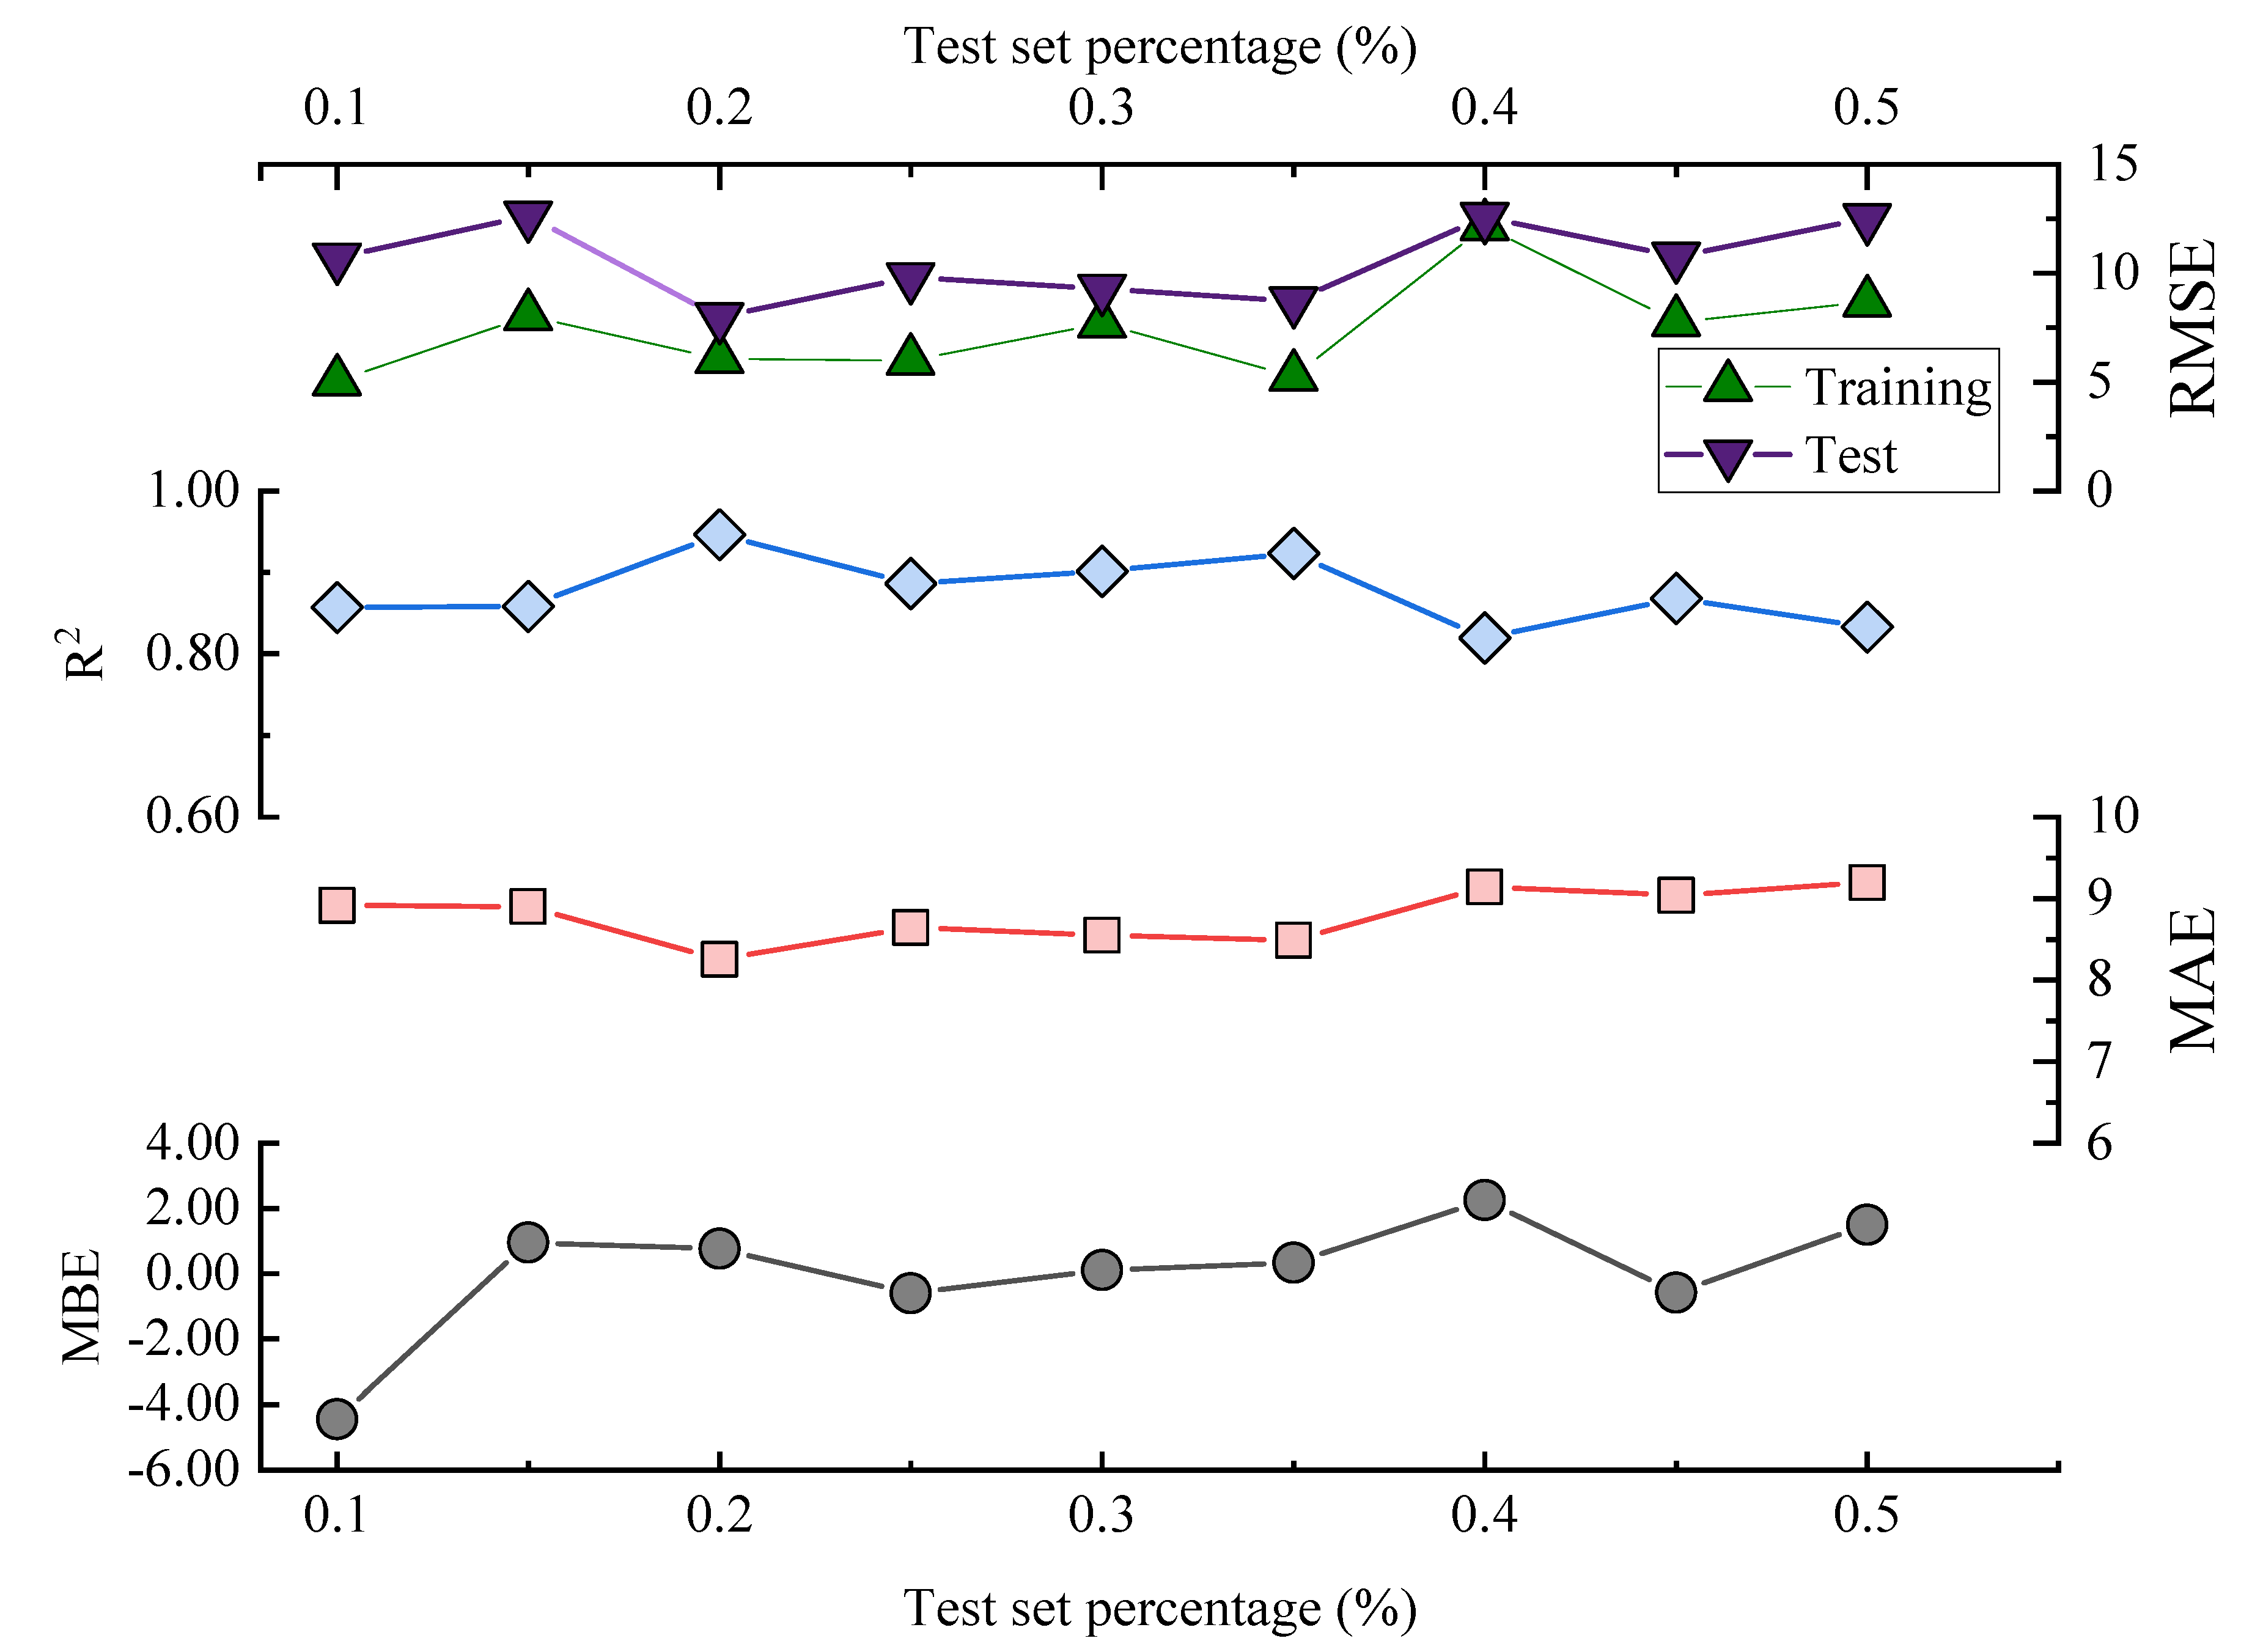
The data results show that all the above models have acceptable prediction results for this dataset, but the RF model exhibits larger fluctuations in both prediction and testing, and it displays the poorest predictive accuracy among them, whereas the BOA-LSTM model demonstrates the best predictive accuracy. To evaluate the stability of the BOA-LSTM model under stochastic initialization and assess the rationality of its manual data partitioning, we conducted a dedicated stability analysis. While test sets conventionally account for 20–40% of the total data—where larger sizes enhance validation reliability—we specifically compared predictions across different test set scales to verify the appropriateness of the adopted 80-20 division. The line chart of each evaluation index is shown in Figure 5. The test set size for stability validation starts at 10% and increases sequentially to 50% in increments of 5%. The data presented in Figure 9 show that R2, MAE, and MBE fluctuate in the ranges of 0.81959–0.94624, 5.6385–7.9864, and −4.4457–2.2527, respectively. The RMSE training set and test set fluctuated in the ranges of 5.027–12.1637 and 7.987–12.5771, respectively. When the proportion of the testing set is low and the proportion of the training set is high, the accuracy of internal validation in the training set is higher. However, with fewer samples in the testing set, it is difficult to accurately assess the generalization performance. When the proportion of the testing set is high and the proportion of the training set is low, the generalization performance exhibited by the testing set can be relied upon; however, owing to the smaller training set, the accuracy decreases. Considering multiple performance metrics, an 8:2 split of the training and testing sets for BOA-LSTM in this dataset is relatively reasonable, showing a high fitting accuracy while keeping validation errors small. Overall, the scale of changes in various model metrics is not too significant, and the sensitivity to reasonable testing set divisions is low. Hence, the BOA-LSTM model can adequately train and predict on this scale of dataset, indicating its applicability to this dataset. Although the BOA-LSTM water inflow prediction model has achieved satisfactory results on the database selected in this article, the model still has some limitations that can be further improved and optimized. In terms of improving the robustness and generalization performance of the model, increasing the amount of data is a good method. Compared with common machine learning tasks in other fields, the amount of data used in this study is relatively small. However, considering the difficulty of data acquisition in the aspect of tunnel water inflow, the amount of data in this study is at a moderate level. Hence, it is feasible to optimize the model by increasing the amount of data in the future. With the increase in the amount of data, the prediction ability of the water inflow prediction model will be improved.
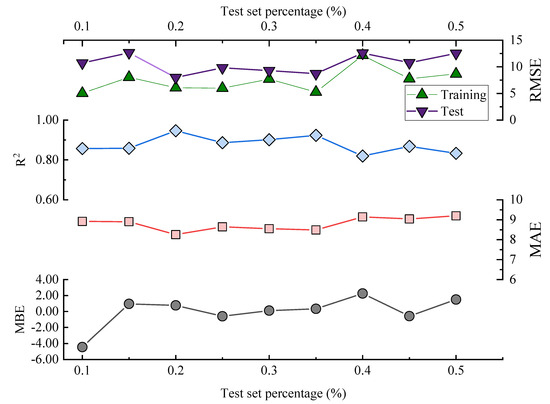
Figure 9.
Evaluation indicators of the BOA-LSTM model with different test set sizes.
4.3. SHAP Analysis and Discussion
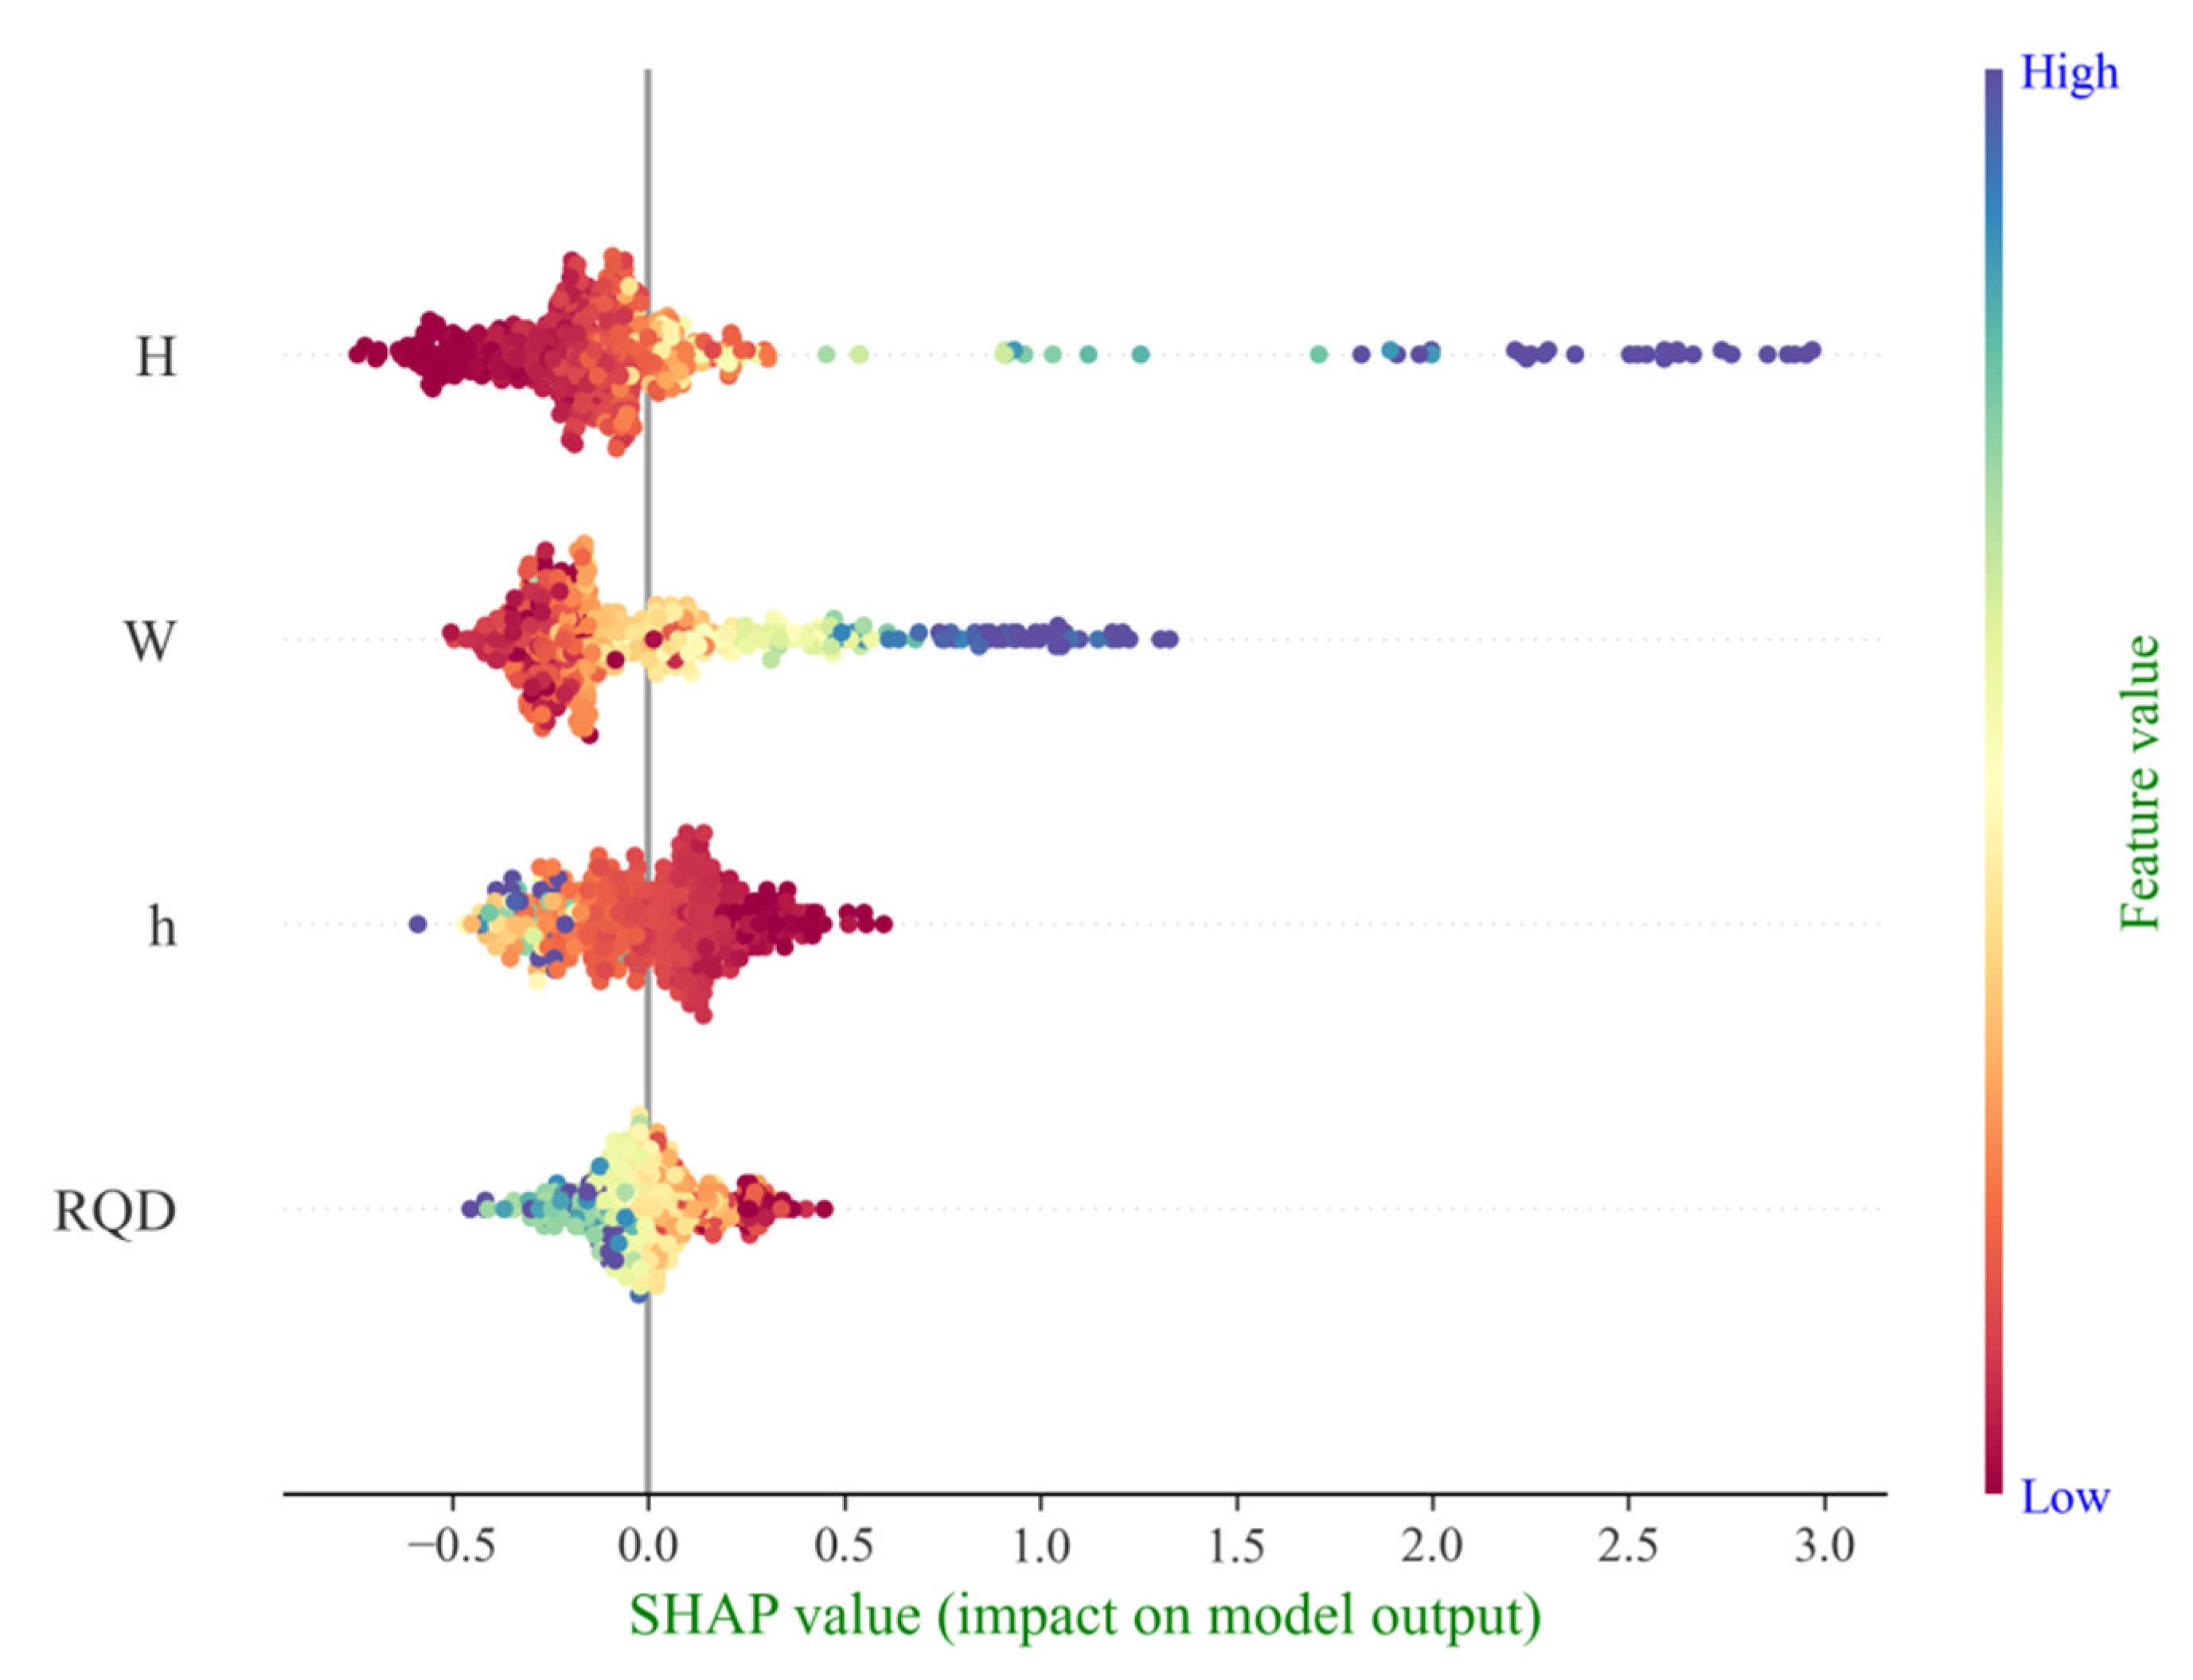
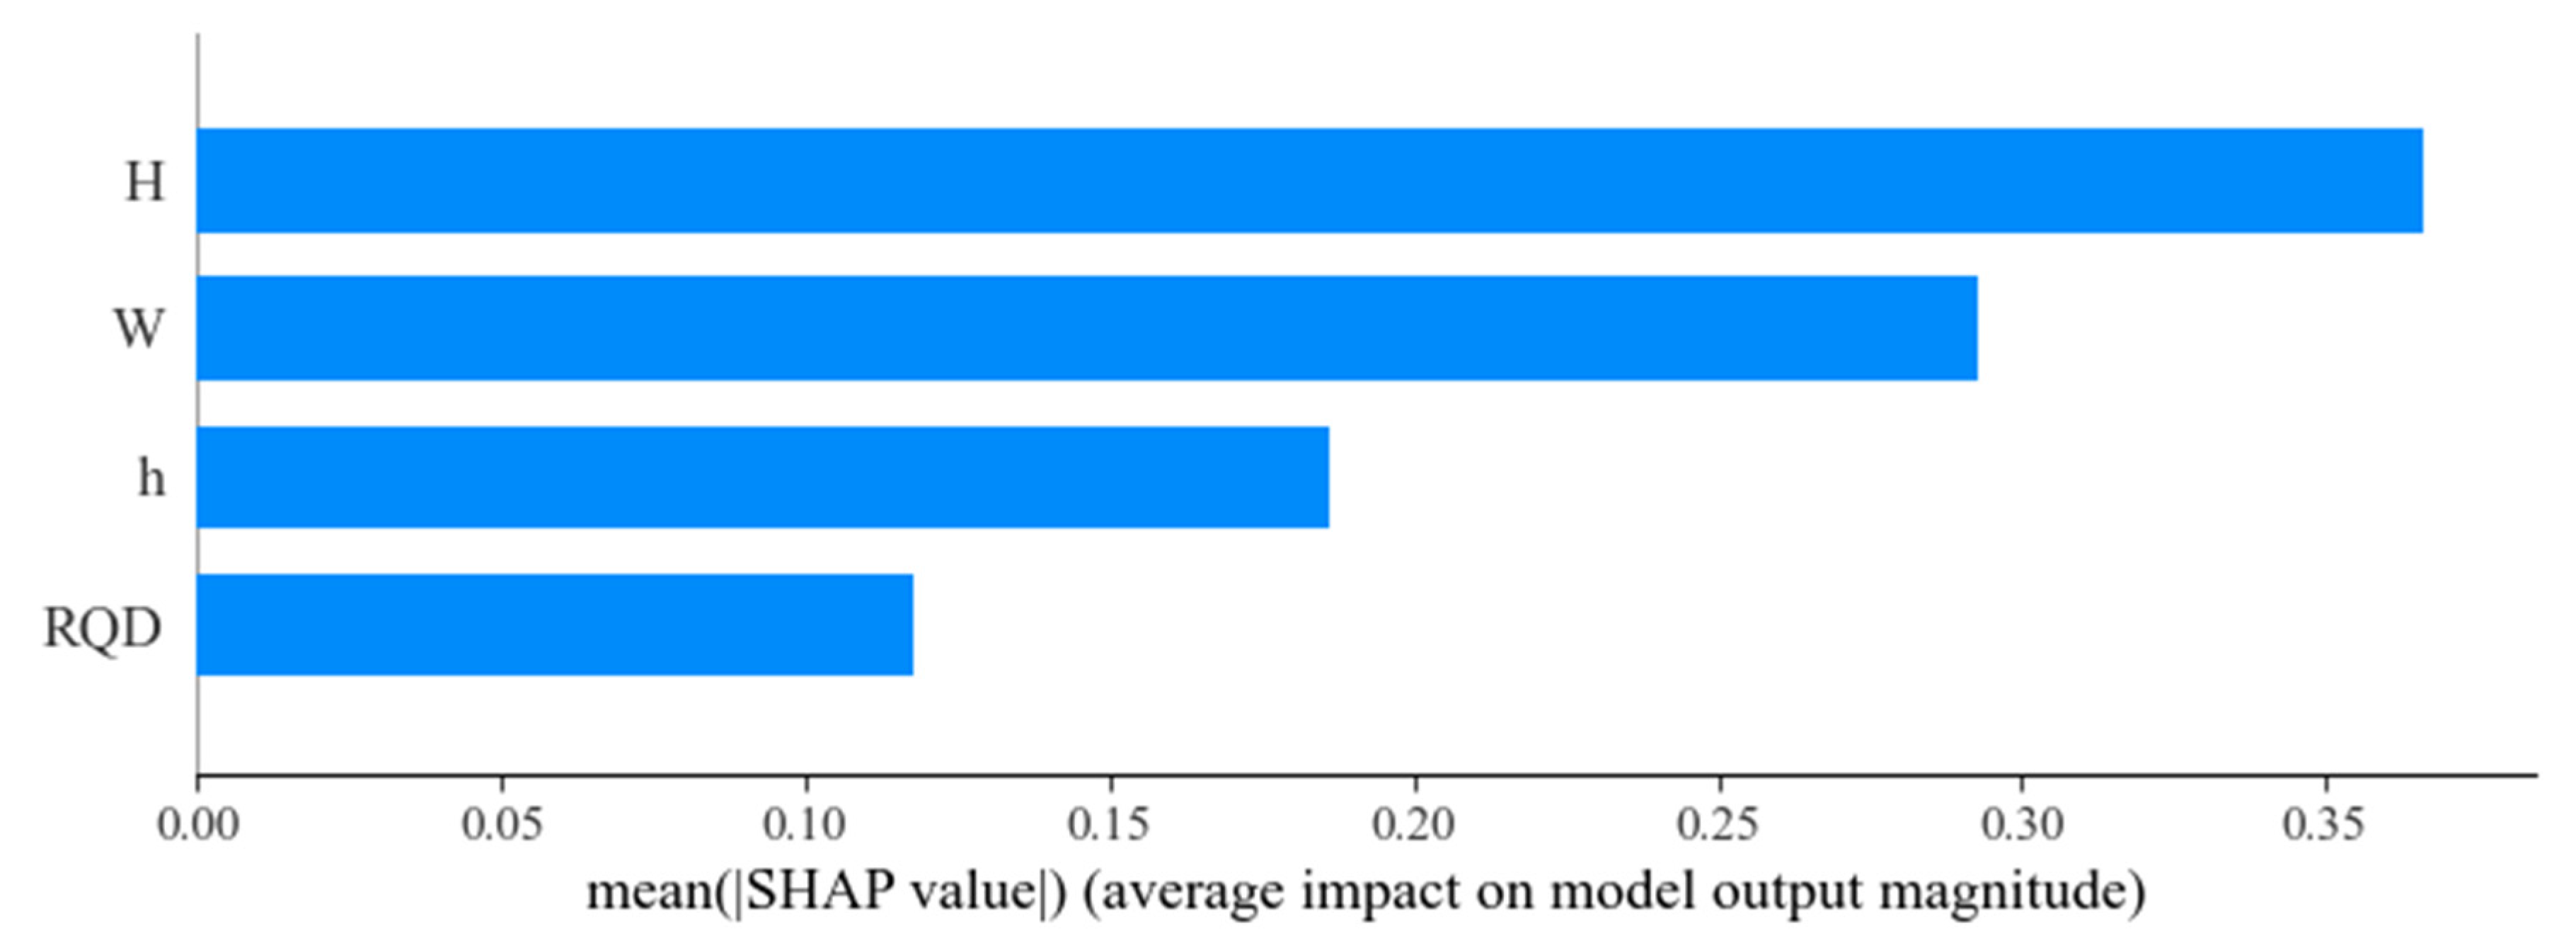
As illustrated in Figure 10, which summarizes the characteristic contributions of parameters influencing tunnel water inflow, a global interpretation of the key features within the dataset is presented. The abscissa represents the SHAP value, indicating the direction and magnitude of each feature’s effect on model predictions, while the ordinate lists the individual parameters. Each point corresponds to a test sample, with the color gradient from red to blue reflecting the increasing magnitude of influence. It can be observed that tunnel depth (H) exhibits the strongest influence on water inflow prediction, followed by water yield (W), which shows a greater contribution compared to groundwater level (GWL) and rock quality index (RQD). This observation is consistent with the feature importance rankings based on mean |SHAP value|, as shown in Figure 11, where tunnel depth and water yield are identified as the dominant factors affecting tunnel water inflow. By analyzing both the contribution values and the summary plot, it can be concluded that these two factors play the most significant roles in driving variations in tunnel water inflow.
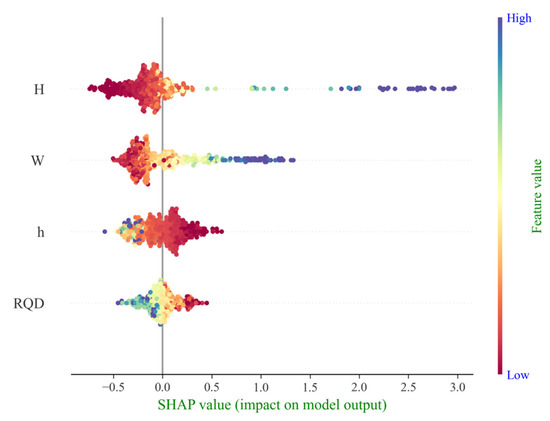
Figure 10.
Global interpretation of impact on tunnel water inflow (SHAP value).
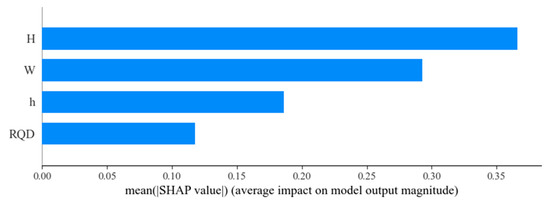
Figure 11.
Characteristic importance diagram of tunnel water inflow parameters.
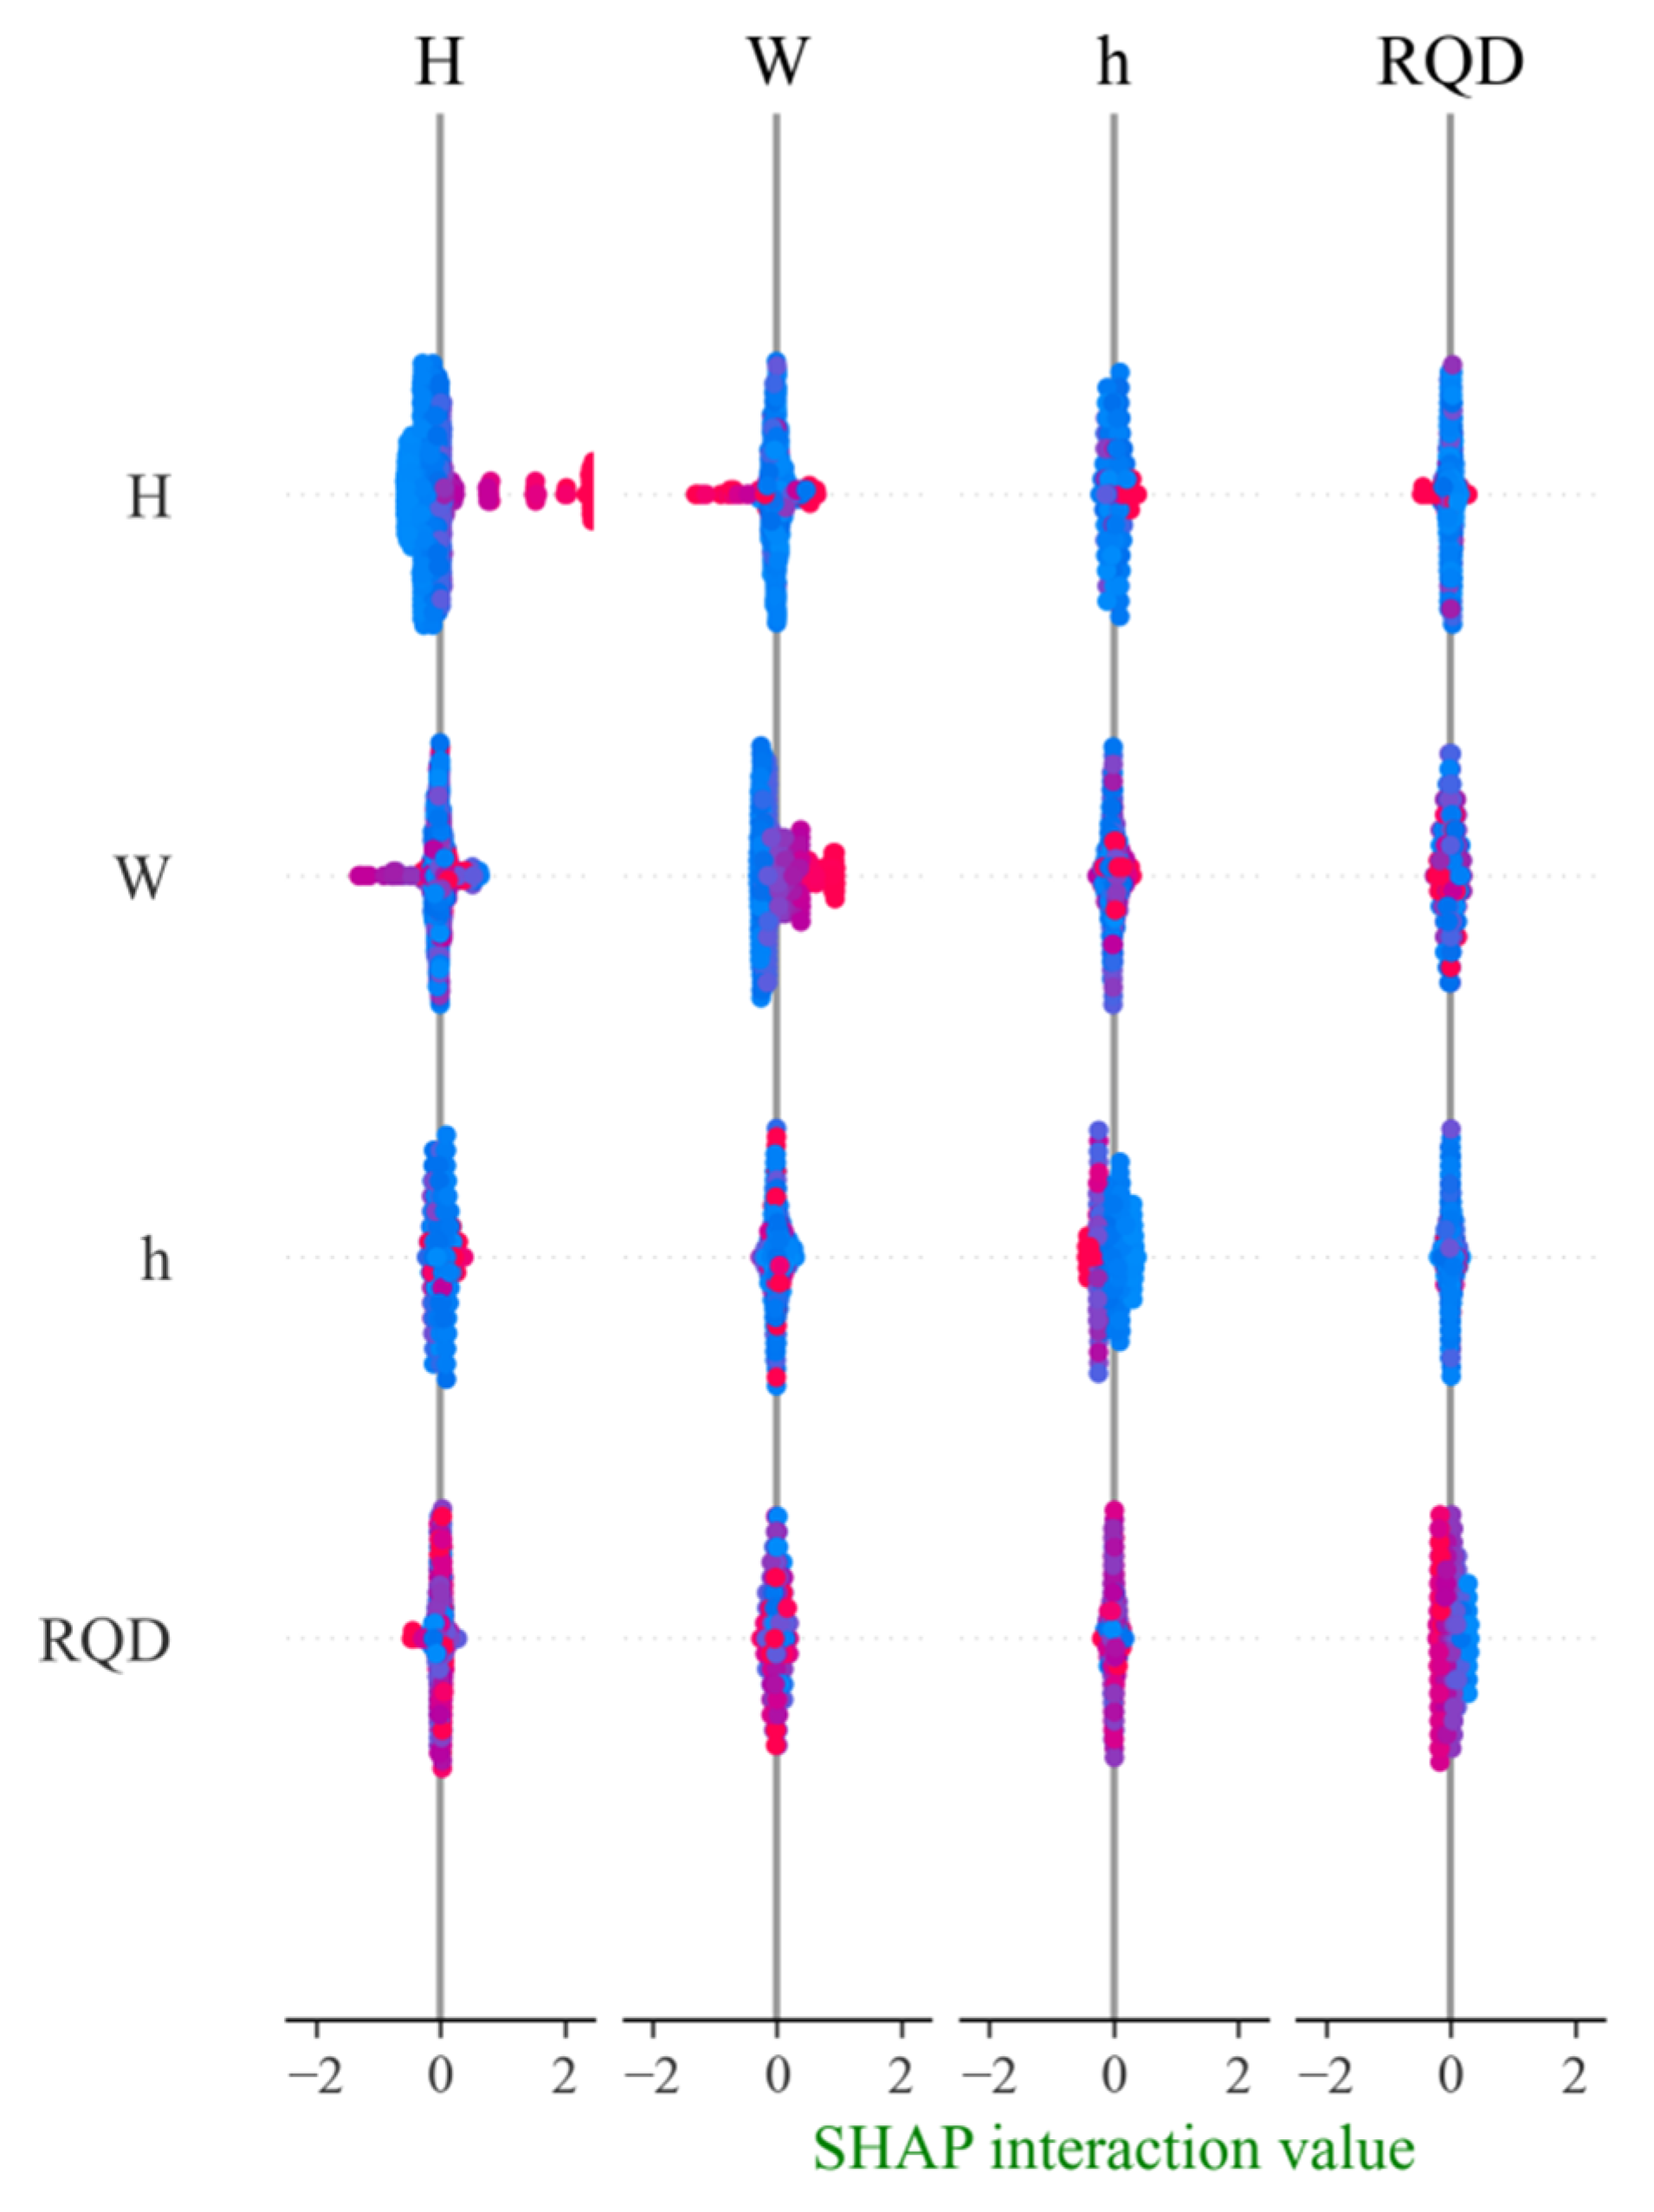
Figure 12 illustrates the interactions among the four parameter characteristics. The abscissa and ordinate represent different parameter features, while the lower axis indicates the strength of their interactive effects. It can be observed that, apart from a pronounced interaction between tunnel depth (H) and water yield (W), the other parameter pairs exhibit no significant interaction, indicating that most of the features contribute relatively independently to the tunnel water inflow model output. Notably, the interaction between tunnel depth and water yield appears particularly strong at certain characteristic values.
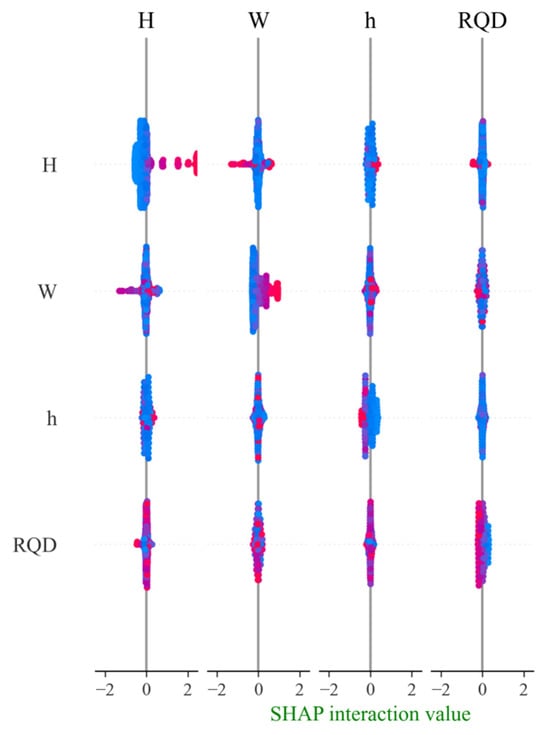
Figure 12.
Interaction diagram of model influencing factors.
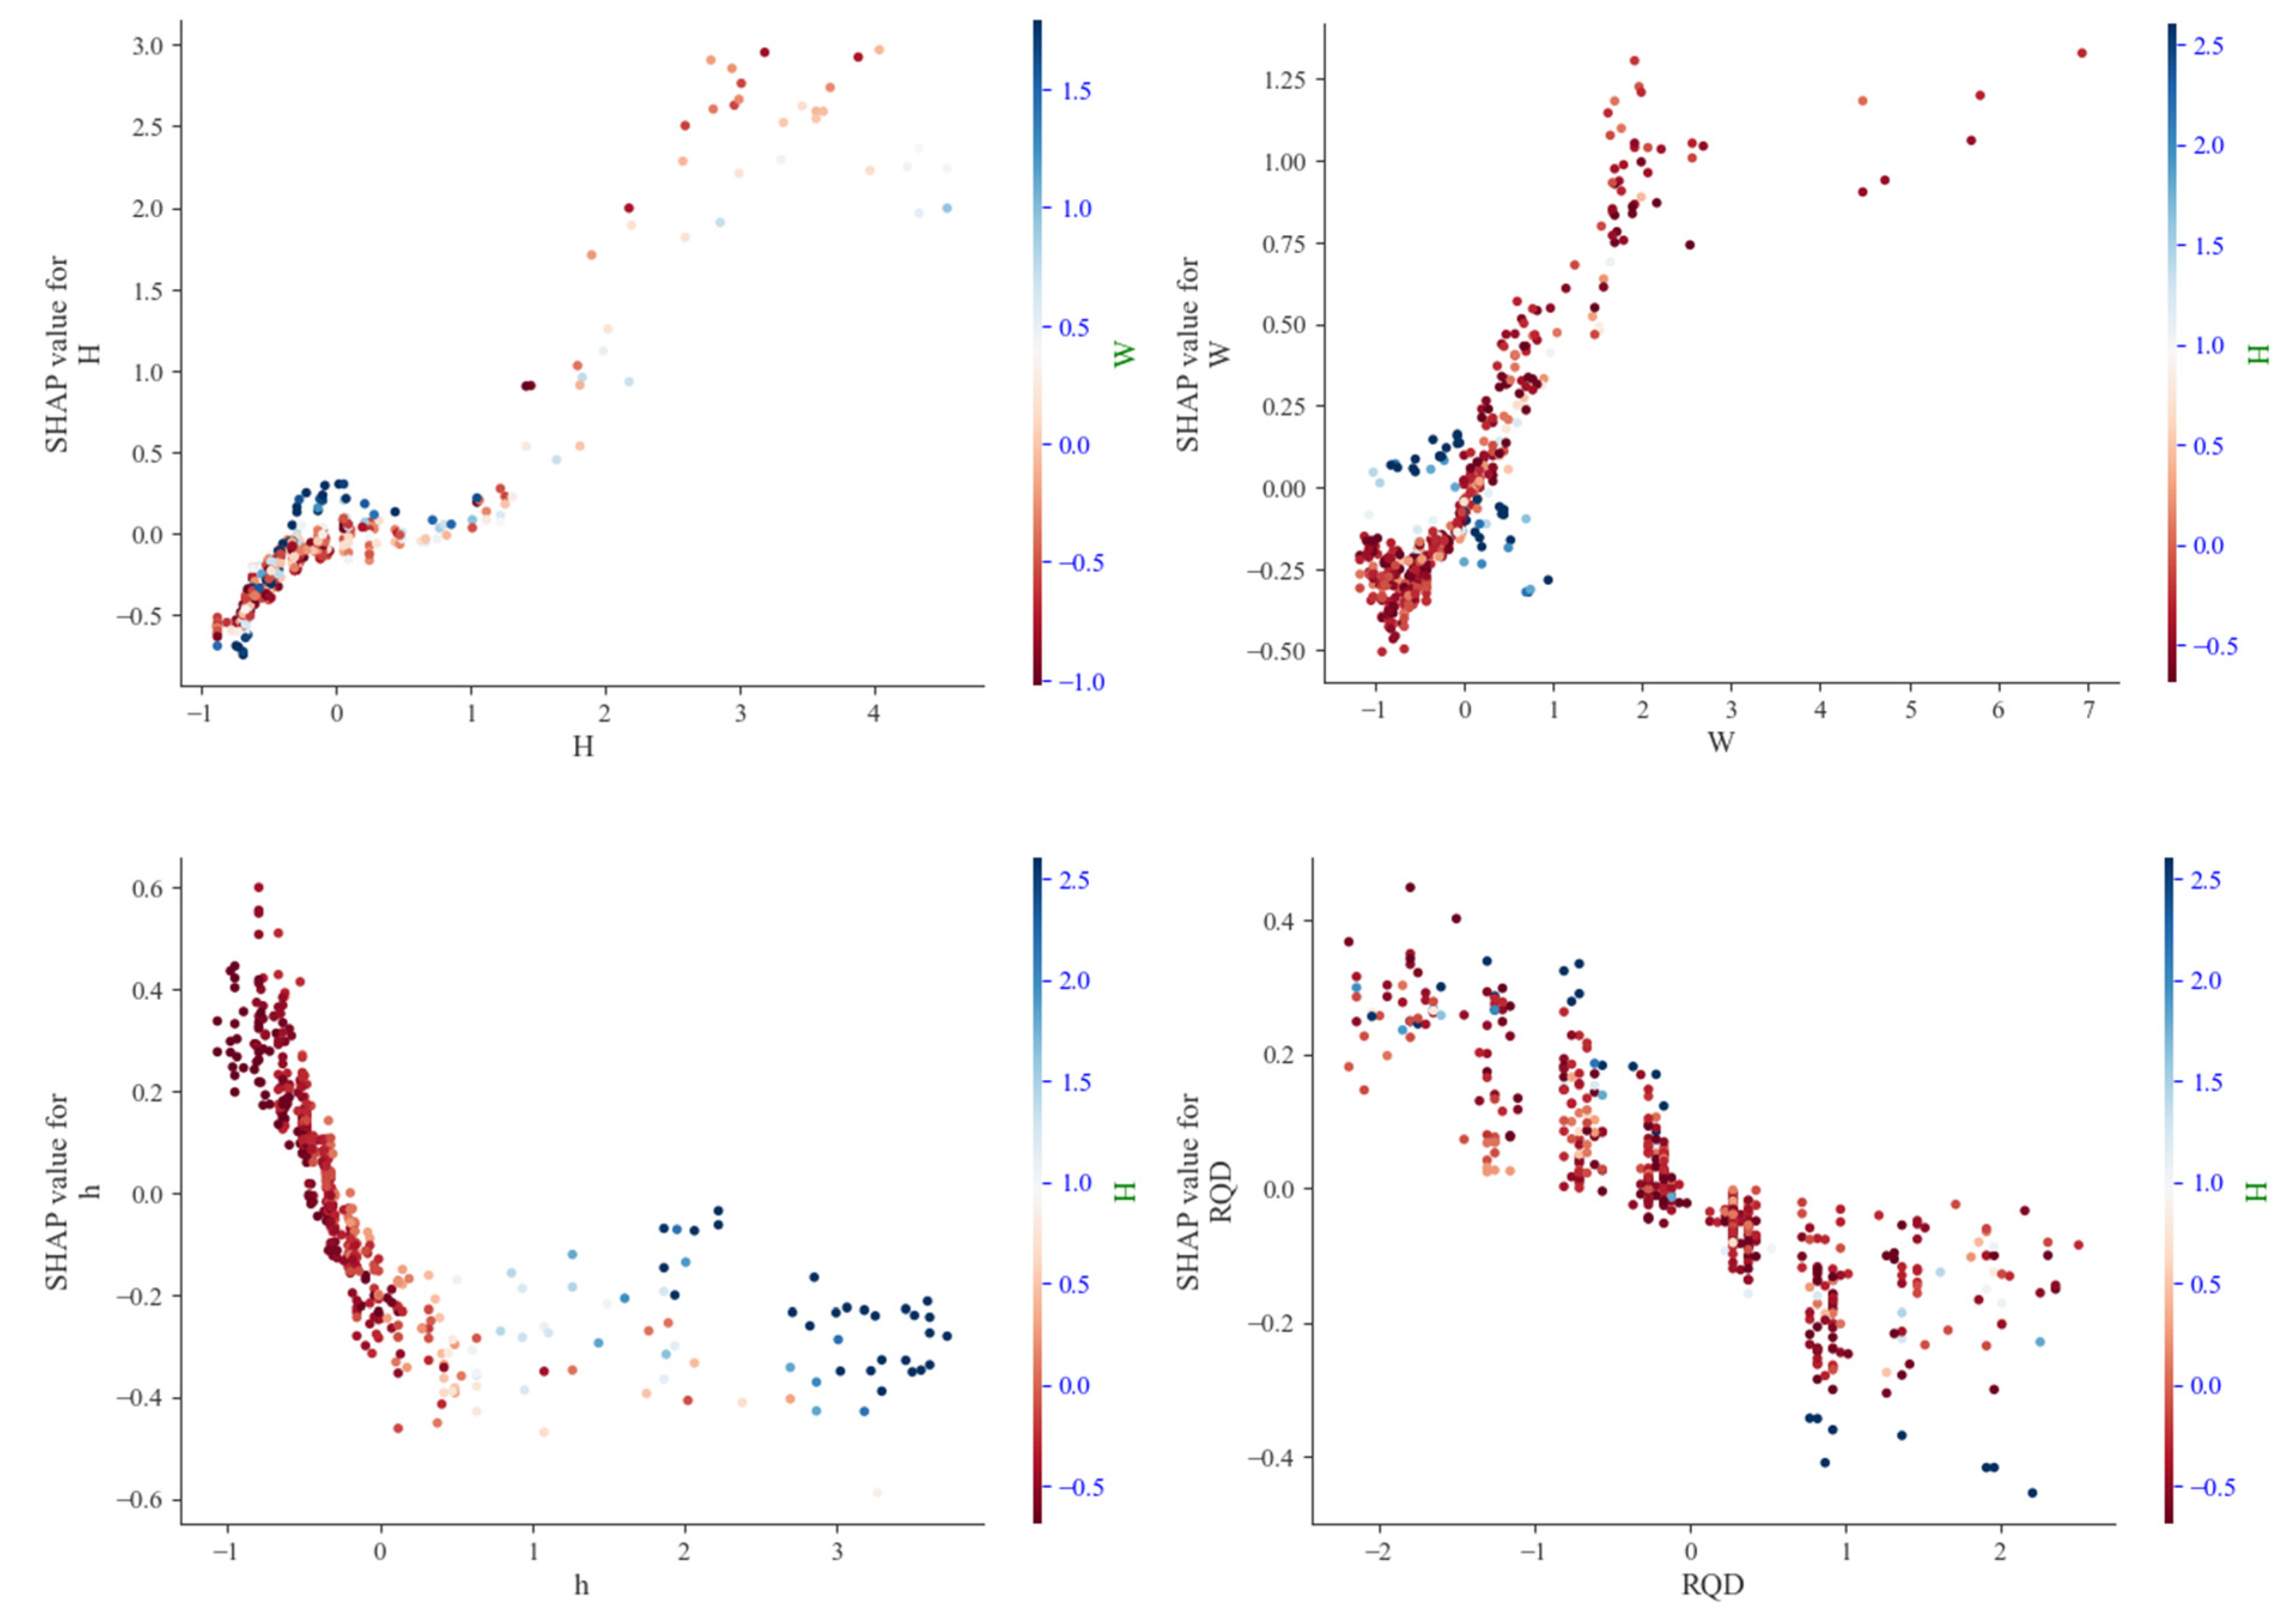
As shown in Figure 13, the feature dependency plots are used to visualize the relationship between SHAP values and individual parameter values. The dependency plot for tunnel depth reveals that samples with greater depth correspond to higher positive SHAP values, indicating a strong positive impact on water inflow. The region with high sample density also shows a substantial influence. In the dependency plot for water yield, a highly concentrated sample region exhibits both positive and negative impacts on water inflow, with the upper bound of positive influences being higher than that of negative ones—though still lower than the maximum positive impact attributed to tunnel depth.
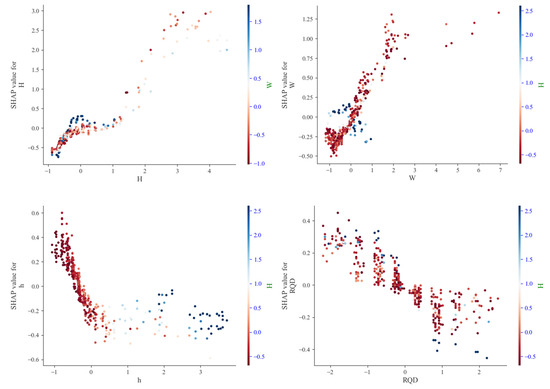
Figure 13.
Dependence diagram of model influencing factors.
The dependency plots for rock quality index (RQD) and groundwater level (GWL) show that most data points are associated with weakly negative impacts. Both positive and negative influences in these parameters are relatively limited and concentrated within a low-magnitude range. In summary, tunnel depth and water yield exert considerably stronger effects on tunnel water inflow compared to groundwater level and rock quality index. The SHAP analysis identified tunnel depth and water yield as the most influential predictors of water inflow. This outcome aligns well with established hydrogeological principles. Tunnel depth (H) acts as a proxy for both the hydrostatic driving force and in situ stress conditions, with increased depth generally corresponding to higher inflow potential. Meanwhile, water yield (W) directly reflects the hydrogeological characteristics of the rock mass, representing its inherent capacity to store and transmit groundwater. The combined dominance of these two factors captures the fundamental dynamics of the system: depth supplies the primary driving force for water inflow, while water yield defines both the source availability and the permeability of flow pathways. This mechanistic interpretation also clarifies why these factors prove more influential than others such as RQD, which serves more as an indicator of rock mass integrity than a direct measure of hydraulic conductivity.
5. Conclusions
This paper proposes different research schemes for tunnel water inflow prediction based on the schemes and methods proposed by many scholars in the field of water inflow prediction and combined with machine learning algorithms, aiming at accurate and convenient prediction under a complex and changeable engineering environment.
(1) A Long Short-Term Memory (LSTM) network was first evaluated for tunnel water inflow prediction and showed higher accuracy than traditional methods like BP Neural Networks, Support Vector Machines, and Random Forests. Subsequently, the Bayesian Optimization Algorithm (BOA) was introduced to automate the tuning of critical LSTM hyperparameters, such as the number of hidden units, initial learning rate, and L2 regularization factor. This optimization procedure resulted in the development of an advanced BOA-LSTM prediction model.
(2) The BOA-LSTM groundwater inflow prediction model takes the tunnel burial depth (H), groundwater level (h), rock mass quality index (RQD), and water yield property (W) as the inputs of the model and the water inflow (WI) as the output of the prediction model.
(3) The BOA-LSTM model was developed using water inflow data from 13 drill-and-blast highway tunnel sections. After thorough data preprocessing and correlation analysis, the model was trained with five-fold cross-validation integrated directly into the Bayesian optimization loop. This approach substantially reduces overfitting and results in a model with superior generalization performance.
(4) The proposed BOA-LSTM model demonstrated statistically significant superiority over several benchmark models (LSTM, LIBSVM, RF, RBFNN, ELM, and BP) in predicting tunnel water inflow. It achieved a superior coefficient of determination (R2 of 0.94624) and lower error rates (e.g., RMSE of 7.987), confirming its enhanced predictive accuracy and robust generalization capability. These results establish BOA-LSTM as a valuable reference for future tunnel water inflow forecasting.
(5) The SHAP method was employed to rank the four disaster-causing factors. The results identify tunnel depth and water abundance as the dominant influencers on water inflow, exhibiting a greater effect than groundwater level and rock quality designation (RQD). The implementation and validation of the proposed model in actual tunnel projects constitutes the primary focus of our future research.
Author Contributions
Conceptualization, Z.H., Z.Y. and Z.W.; methodology, Y.W., L.M. and T.S.; software, Z.W.; validation, X.Z.; formal analysis, Z.H., Z.Y. and Z.W.; investigation, H.L.; resources, K.Z.; data curation, Z.W.; writing—original draft preparation, Z.H., Z.Y. and Z.W.; writing—review and editing, Y.W., L.M. and T.S.; visualization, Z.W.; supervision, Y.Z.; project administration, Z.H.; funding acquisition, Z.H. All authors have read and agreed to the published version of the manuscript.
Funding
The authors gratefully acknowledge the financial support from the National Key Research and Development Program of China (No. 2023YFC3012200), the National Natural Science Foundation of China (No. 52274082), the Jiangxi Provincial Natural Science Foundation (20242BAB26047), the Program of Qingjiang Excellent Young Talents, Jiangxi University of Science and Technology (No. JXUSTQJBJ2020003), and the Fund of National Key Laboratory of Geological Disaster Prevention and Geological Environment Protection (SKLGP2024K022).
Data Availability Statement
The original contributions presented in this study are included in the article. Further inquiries can be directed to the corresponding authors.
Conflicts of Interest
Author Zhenpeng Wang was employed by the company Jiangxi Copper Group Yinshan Mine Co., Ltd. The remaining authors declare that the research was conducted in the absence of any commercial or financial relationships that could be construed as a potential conflict of interest.
References
- Li, S.; Zhang, Q.; Xue, Y.; Ding, W.; Zhong, S.; He, F.; Lin, Y. Forecast of karst-fractured groundwater and defective geological conditions. Chin. J. Rock Mech. Eng. 2007, 26, 217–225. [Google Scholar] [CrossRef]
- Zhang, X. Study on Mechanism of Slurry Diffusion and Sealing at the Process of Underground Engineering Moving Water Grouting and Its Application. Ph.D. Thesis, Shandong University, Ji’nan, China, 2001. [Google Scholar]
- Zhang, W. Mechanism of Grouting Reinforcement of Water-Rich Fault Fractured Zone and Its Application in Tunnel Engineering. Ph.D. Thesis, Shandong University, Ji’nan, China, 2014. [Google Scholar]
- Qian, Q. Challenges faced by underground projects construction safety and countermeasures. Chin. J. Rock Mech. Eng. 2012, 31, 1945–1956. [Google Scholar] [CrossRef]
- Li, S.; Li, X.; Jing, H.; Yang, X.; Rong, X.; Chen, W. Research development of catastrophe mechanism and forecast controlling theory of water inrush and mud gushing in deep long tunnel. China Basic Sci. 2017, 19, 27–43. [Google Scholar] [CrossRef]
- Tian, S.; Wang, W.; Gong, J. Development and prospect of railway tunnels in China (including statistics of railway tunnels in China by the end of 2020). Tunn. Constr. 2021, 41, 308–325. [Google Scholar] [CrossRef]
- Huang, Z.; Gu, Q.; Wu, Y. Effects of confining pressure on acoustic emission and failure characteristics of sandstone. Int. J. Min. Sci. Technol. 2021, 31, 963–974. [Google Scholar] [CrossRef]
- Huang, Z.; Zhao, K.; Li, X. Numerical characterization of groundwater flow and fracture-induced water inrush in tunnels. Tunn. Undergr. Space Technol. 2021, 116, 104119. [Google Scholar] [CrossRef]
- Wang, L.; Zhu, L.; Cao, Z.; Liu, J. Thermo-mechanical degradation and fracture evolution in low-permeability coal subjected to cyclic heating–cryogenic cooling. Phys. Fluids 2025, 37, 086617. [Google Scholar] [CrossRef]
- Teng, T.; Chen, Y.; Wang, Y. In Situ Nuclear Magnetic Resonance Observation of Pore Fractures and Permeability Evolution in Rock and Coal under Triaxial Compression. J. Energy Eng. 2025, 151, 04025036. [Google Scholar] [CrossRef]
- Liu, G. Analysis and Comparison of Water Inflow Prediction Methods for Yanshan Tunnel. Railr. Eng. 2021, 15, 10638. [Google Scholar] [CrossRef]
- Zhou, W. Study on Water Inflow Prediction Technology for Guanshan Tunnel on Tianshui-Pingliang Railway. Mod. Tunn. Technol. 2021, 58, 22–30. [Google Scholar] [CrossRef]
- Wang, Z.; Li, S.; Liang, J.; Qiao, L.; Xue, Y.; Zhou, Y. Prediction and measurement of groundwater flow rate of underground crude oil storage caverns. Chin. J. Geotech. Eng. 2014, 36, 1490–1497. [Google Scholar] [CrossRef]
- Wang, J.; Zhu, H.; Ye, W. Forward and inverse analyses of water flow into tunnels. Chin. J. Rock Mech. Eng. 2004, 23, 1150–1153. [Google Scholar] [CrossRef]
- Jordan, M.I.; Mitchell, T.M. Machine learning: Trends, perspectives, and prospects. Science 2015, 349, 255–260. [Google Scholar] [CrossRef] [PubMed]
- Liu, Y.; Sun, T.; Wu, K.; Zhang, J.; Zhang, H.; Pu, W.; Liao, B. Tungsten prospectivity mapping using multi-source geo-information and deep forest algorithm. Ore Geol. Geol. Reviews 2025, 177, 106452. [Google Scholar] [CrossRef]
- Bishop, C.M. Pattern Recognition and Machine Learning; Springer: New York, NY, USA, 2006; Volume 2, pp. 645–678. [Google Scholar]
- Zhang, G.; Xue, Y.; Bai, C.; Su, M.; Zhang, K.; Tao, Y. Risk assessment of floor water inrush in coal mines based on MFIM-TOPSIS variable weight model. J. Cent. South Univ. 2021, 28, 2360–2374. [Google Scholar] [CrossRef]
- Huang, H.; Li, Q.; Zhang, D. Deep learning based image recognition for crack and leakage defects of metro shield tunnel. Tunn. Undergr. Space Technol. 2018, 77, 166–176. [Google Scholar] [CrossRef]
- Liu, B.; Wang, R.; Zhao, G.; Guo, X.; Wang, Y.; Li, J.; Wang, S. Prediction of rock mass parameters in the TBM tunnel based on BP neural network integrated simulated annealing algorithm. Tunn. Undergr. Space Technol. 2020, 95, 103103. [Google Scholar] [CrossRef]
- Li, S.; He, P.; Li, L.; Shi, S.; Zhang, Q.; Zhang, J.; Hu, J. Gaussian process model of water inflow prediction in tunnel construction and its engineering applications. Tunn. Undergr. Space Technol. 2017, 69, 155–161. [Google Scholar] [CrossRef]
- Zhao, D.; Wu, Q.; Cui, F.; Xu, H.; Zeng, Y.; Cao, Y.; Du, Y. Using random forest for the risk assessment of coal-floor water inrush in Panjiayao Coal Mine, northern China. Hydrogeol. J. 2018, 26, 2327–2340. [Google Scholar] [CrossRef]
- Mahmoodzadeh, A.; Mohammadi, M.; Noori, K.M.G.; Khishe, M.; Ibrahim, H.H.; Ali, H.F.H.; Abdulhamid, S.N. Presenting the best prediction model of water inflow into drill and blast tunnels among several machine learning techniques. Autom. Constr. 2021, 127, 103719. [Google Scholar] [CrossRef]
- He, F.; Zhang, H.; Wan, Q.; Chen, S.; Yang, Y. Medium Term Streamflow Prediction Based on Bayesian Model Averaging Using Multiple Machine Learning Models. Water 2023, 15, 1548. [Google Scholar] [CrossRef]
- Bai, Y.; Jia, W.; Jin, X.; Su, T.; Kong, J.; Shi, Z. Nonstationary Time Series Prediction Based on Deep Echo State Network Tuned by Bayesian Optimization. Mathematics 2023, 11, 1503. [Google Scholar] [CrossRef]
- Williams, R.J.; Zipser, D.A. A learning algorithm for continually running fully recurrent neural networks. Neural Comput. 1989, 1, 270–280. [Google Scholar] [CrossRef]
- Wochreiter, S.; Bengio, Y.; Frasconi, P.; Schmidhuber, J. Gradient Flow in Recurrent Nets: The Difficulty of Learning Long-Term Dependencies; IEEE: New York, NY, USA, 2001; pp. 237–243. [Google Scholar] [CrossRef]
- Hochreiter, S.; Schmidhuber, J. Long short-term memory. Neural Comput. 1997, 9, 1735–1780. [Google Scholar] [CrossRef] [PubMed]
- Olah, C. Understanding Lstm Networks. 2015. Available online: http://colah.github.io/posts/2015-08-Understanding-LSTMs (accessed on 15 February 2024).
- Alizadeh, B.; Bafti, A.G.; Kamangir, H.; Zhang, Y.; Wright, D.B.; Franz, K.J. A novel attention-based LSTM cell post-processor coupled with bayesian optimization for streamflow prediction. J. Hydrol. 2021, 601, 126526. [Google Scholar] [CrossRef]
- He, F.; Zhou, J.; Feng, Z.; Liu, G.; Yang, Y. A hybrid short-term load forecasting model based on variational mode decomposition and long short-term memory networks considering relevant factors with Bayesian optimization algorithm. Appl. Energy 2019, 237, 103–116. [Google Scholar] [CrossRef]
- Gao, S.; Huang, Y.; Zhang, S.; Han, J.; Wang, G.; Zhang, M.; Lin, Q. Short-term runoff prediction with GRU and LSTM networks without requiring time step optimization during sample generation. J. Hydrol. 2020, 589, 125188. [Google Scholar] [CrossRef]
- Sameen, M.I.; Pradhan, B.; Lee, S. Application of convolutional neural networks featuring Bayesian optimization for landslide susceptibility assessment. Catena 2020, 186, 104249. [Google Scholar] [CrossRef]
- Pelikan, M.; Goldberg, D.E.; Cantú-Paz, E. BOA: The Bayesian optimization algorithm. In Proceedings of the 1st Annual Conference on Genetic and Evolutionary Computation-Volume, San Francisco, CA, USA, 13–17 July 1999; pp. 525–532. [Google Scholar]
- Snoek, J.; Larochelle, H.; Adams, R.P. Practical bayesian optimization of machine learning algorithms. arXiv 2012, arXiv:1206.2944. [Google Scholar] [CrossRef]
- Seeger, M. Gaussian processes for machine learning. Int. J. Neural Syst. 2004, 14, 69–106. [Google Scholar] [CrossRef]
- Brochu, E.; Cora, V.M.; De Freitas, N. A tutorial on Bayesian optimization of expensive cost functions, with application to active user modeling and hierarchical reinforcement learning. arXiv 2010, arXiv:1012.2599. [Google Scholar] [CrossRef]
- Yang, Z. Risk prediction of water inrush of karst tunnels based on bp neural network. In Proceedings of the 2016 4th International Conference on Mechanical Materials and Manufacturing Engineering, Wuhan, China, 15–16 October 2016; Atlantis Press: Dordrecht, The Netherlands, 2016; pp. 327–330. [Google Scholar] [CrossRef][Green Version]
- Shapley, L.S. A Value for n-Person Games. In Contributions to the Theory of Games; RAND Corporation: Santa Monica, CA, USA, 1953; pp. 307–317. [Google Scholar] [CrossRef]
- Lundberg, S.; Lee, S.I. A unified approach to interpreting model predictions. In Proceedings of the 31st International Conference on Neural Information Processing Systems, Red Hook, NY, USA, 4–9 December 2017; pp. 4768–4777. [Google Scholar]
- Strumbelj, E.; Kononenko, I. An efficient explanation of individual classifications using game theory. J. Mach. Learn. Res. 2010, 11, 1–18. [Google Scholar]
Disclaimer/Publisher’s Note: The statements, opinions and data contained in all publications are solely those of the individual author(s) and contributor(s) and not of MDPI and/or the editor(s). MDPI and/or the editor(s) disclaim responsibility for any injury to people or property resulting from any ideas, methods, instructions or products referred to in the content. |
© 2025 by the authors. Licensee MDPI, Basel, Switzerland. This article is an open access article distributed under the terms and conditions of the Creative Commons Attribution (CC BY) license (https://creativecommons.org/licenses/by/4.0/).


