Abstract
The sustainable use and management of groundwater resources is a challenging issue due to population growth and climate change. Accurate quantification of groundwater recharge is a basic requirement for effective groundwater resource management, yet it is still lacking in many areas around the world. The study was designed to estimate recharge to groundwater from natural rainfall in the Gilgel Gibe and Dhidhessa catchments in southwestern Ethiopia, employing the water table fluctuation (WTF) and chloride mass balance (CMB) techniques. These methods are being applied for the first time in the study area and have not previously been used in these catchments. Given the region’s data scarcity, a community-based data collection program was implemented and supplemented with additional field measurements and secondary data sources. Groundwater level, spring discharge, and rainfall were monitored over the 2022/2023 hydrological year. Groundwater level fluctuations were found to be influenced by topography and rainfall patterns, reaching 8.2 m in amplitude in the upstream part of the catchments. Chloride concentrations were determined in groundwater samples collected from hand-dug wells and springs, and rainwater was also collected. Rainwater exhibited a mean chloride concentration of 2.46 mg/L, while groundwater chloride concentrations ranged from 3 mg/L to 36.99 mg/L. The estimated recharge rates varied spatially, ranging from 170 to 850 mm/year using the CMB method (11% to 55% of annual rainfall, mean recharge rate of 454 mm/year) and from 76 to 796 mm/year using the WTF method (4% to 43% of annual rainfall, mean recharge rate of 439 mm/year). Notably, recharge estimates were lowest downstream in the lowland areas and highest upstream in the highland regions. Rainfall amount, local lithology, and topography were identified as major influences on groundwater recharge across the study area. Both CMB and WTF methods were deemed applicable in the volcanic aquifers, provided that all the respective assumptions are followed. This study significantly contributes to the groundwater dataset for the region, in addition to recharge estimation and the research conclusions, emphasizing the importance of long-term monitoring and time series analysis of chloride data to reduce uncertainties. The work serves as a valuable reference for researchers, policymakers, and regional water resource managers.
1. Introduction
Groundwater is a vital source of water and is mainly used for drinking, industrial, and agricultural purposes. Globally, over two billion people depend directly upon groundwater for drinking water supply [1] and large areas of irrigated fields depend on it around the world [2]. In most African countries groundwater is the most reliable source of drinking water [3]. Most developing countries including Ethiopia use this pivotal resource for their daily activities, agricultural and industrial purposes. Groundwater provides approximately 90% of the water used for domestic and industrial purposes in Ethiopia with minimal irrigation use, since most of the large-scale irrigation relies on surface water [4].
The overextraction of groundwater is an issue in Ethiopia; however, its management and sustainability are in question. The occurrence and dynamics of groundwater in Ethiopia depend on different controlling variables. Groundwater management and monitoring can be effectively achieved through hydrogeologic dynamic studies [5]. In particular, the dynamics of the recharge–discharge system are important for the sustainable use of water resources [6], as it allows the identification of aquifer vulnerability to contamination or drought and helps quantify the contribution of groundwater to surface water and wetlands [7,8]. Estimating groundwater recharge is essential for hydrogeological studies, assessing groundwater potential in aquifer systems, and determining groundwater levels and anticipating groundwater decline during dry periods [9]. To accurately estimate the groundwater budget, aquifer-based groundwater recharge studies need to be established.
Groundwater recharge is generally described as the infiltration of water from the ground surface to the groundwater table in an aquifer system [9,10], whereas groundwater discharge is the removal of groundwater from the saturated zone across the water table surface [11]. Various methods exist for estimating recharge under diverse conditions, making the selection of an appropriate technique challenging for groundwater recharge discharge systems [12].
Groundwater table fluctuation [1,11,13], chloride mass balance [14,15], soil moisture water balance [6,11], and baseflow separation technique [1,16,17] are commonly used methods based on the availability of data. A numerical modeling approach can also be used in recharge estimation. A simplified land surface model suitable for data-limited, water-scarce regions has been introduced as a research application in an Ethiopian catchment [18]. Scholars applied spatially distributed models in estimating recharge, using GIS tools [19,20], SWAT and WetSpass modelling [21,22] at the spatial and temporal scales of interest. These scales, together with the purpose of conducting the recharge assessment and data availability, are the keys to deciding which recharge estimation methodology to use [12]. However, most of the existing techniques are empirical and complex. Site-specific comparison of multiple methods is often recommended to provide complementary insights [13,23].
The present study is conducted in the Gilgel Gibe and Upper Dhidhessa catchments of southwestern Ethiopia, where groundwater serves as the primary source of water for urban and rural communities, as well as industries in the region. Communities access groundwater through springs, dug wells, and tube wells from shallow and deep aquifers for their daily activities. Despite the promising availability of groundwater in the catchments, factors such as population growth and climate change pose significant challenges to the sustainability of these resources for future generations. The area is a data-scarce region for groundwater resource. Understanding the mechanisms and quantifying the groundwater recharge is essential for better management and long-term sustainability of the resources through the application of accurate methodologies in the catchments. Groundwater that is recharged from rainfall becomes part of the main source of water supply for domestic and irrigation purposes in this tropical climate region.
Water table fluctuation (WTF) and chloride mass balance (CMB) methods have been selected for estimating recharge in these volcanic aquifers. These two methods are simple to apply through generating own groundwater data in the estimation of recharge in such data-scarce regions. The water table fluctuation (WTF) method is the most widely used technique for estimating recharge where time series data of shallow groundwater levels are available [24]. This method relies on understanding annual water table fluctuations, which are determined through regular monitoring of groundwater levels, along with knowledge of the aquifer’s specific yield to estimate the annual recharge potential of a given area. The WTF method advantages are its simplicity and its independence from the specific mechanisms governing water movement through the unsaturated zone [13]. However, several challenges are associated with its application. A key difficulty is in selecting a representative value of specific yield (Sy) and ensuring that observed water level changes are only attributed to rainfall recharge [12]. Another limitation of the method is its inability to account for steady or continuous recharge. For instance, if the recharge rate equals the rate of groundwater drainage from the water table, no measurable fluctuation would occur, leading the WTF method to yield a recharge estimate of zero [13]. The WTF method provides a localized recharge Estimate specific to the vicinity of the monitoring well. Since water level variations can also reflect lateral groundwater flow, monitoring wells distributed across different parts of a catchment are required to derive a representative, catchment-scale recharge estimate.
CMB method is favored for recharge estimation because of its conservative nature, the common presence of chloride in precipitation, and the simplicity of its application [25]. According to Ait El Mekki et al. [26], the CMB method, is suitable for humid climates, which align with the characteristics of the Gilgel Gibe and Upper Dhidhessa catchments. The advantages of CMB approach are its simplicity and cost-effectiveness, as it requires only data on annual precipitation and its chloride concentration, along with the chloride concentration of groundwater within the aquifer of interest. Chloride serves as a natural tracer; it reflects the cumulative effects of recharge over extended periods rather than short-term fluctuations [14]. The CMB method also has several limitations and sources of uncertainty. The method does not provide detailed temporal resolution of recharge variability. The accuracy of the CMB approach can be affected by analytical uncertainties in chloride measurement and by variations in atmospheric chloride input. Temporal variability in recharge or chloride concentration can violate the assumption of steady-state conditions, introducing uncertainty into the results [15]. To minimize potential errors, the present study implemented a data quality assurance framework that included rigorous data validation. Despite the limitations, when combined with the WTF method, the CMB method provides valuable cross-validation and helps to constrain recharge estimates, particularly in complex volcanic terrains.
Complexity arises from the extensive heterogeneity in geology, geomorphology, topography, and hydro-climatic conditions within the Gilgel Gibe and Upper Dhidhessa catchments. In such heterogeneous aquifers, sampling representativeness plays a crucial role in ensuring accurate estimates when applying this method [13]. Besides all the key factors in method selection, many studies on shallow groundwater recharge focus on long-term data availability. However, in sub-Saharan Africa, groundwater level monitoring networks are largely absent, despite shallow groundwater being the primary water source for poor rural communities [27]. Citizen-based data monitoring can be a feasible solution to address data gaps by ensuring spatially representative monitoring points [28].
The purpose of this study is to generate the necessary primary data on groundwater level fluctuation, the chloride concentrations of groundwater, and rainfall to estimate and show variation in groundwater recharge using the two methods of WTF and CMB. Groundwater level was monitored using both automatic and conventional manual monitoring techniques. Manual water level monitoring can be conducted by dip meter or rope and rope meter manually by both researchers and selected people from the local community. The community was involved in the data recording of monitored wells close to their residence and their water source. Community has a valuable awareness and knowledge of their water schemes, where their water points (hand-dug wells) begin rising and declining following seasonal changes. They can estimate the saturation level in the heavy rainy season and the lowest water level in the dry season based on their experiences from previous decades. Alternatively, water levels can be measured using automatic data loggers (Diver), with high precision. Divers are used in groundwater monitoring for continuously measuring the water pressure and temperature for long-term recordings. Community recorded data were integrated with other datasets to serve as inputs for both methods. Groundwater levels, and rainfall were monitored daily over a two-year period. This study is the first comprehensive application of the CMB and WTF techniques in the volcanic aquifers of Gilgel Gibe and Upper Dhidhessa catchments. Prior studies in the area have mostly focused on qualitative hydrogeological assessment, this work integrates complementary field based and analytical methods to produce quantitative recharge estimates. The study’s coupling of hydrochemical and hydraulic methodologies inside a cross-validation framework is a significant breakthrough that improves the resilience and dependability of recharge estimation in contexts with limited data. Additionally, the study uses a citizen science methodology, including nearby communities in groundwater monitoring using easy-to-use, inexpensive techniques. The integration of these community generated data with automatic logger measurements produced a high temporal resolution dataset, rarely available in Ethiopian volcanic terrains. Overall, this work contributes advances understanding of the spatiotemporal variability of groundwater recharge in tropical volcanic systems and offers regional ground-water datasets that are essential for model calibration and sustainable groundwater management in the Basin under study and other comparable environments. The findings also serve as a key resource for groundwater research and management and can be useful for guiding future recharge estimations in the data-scarce region. The objectives of the study are summarized as follows: (1) to monitor groundwater and generate data through inclusive local community science, assessing the spatiotemporal variability of shallow groundwater resources and (2) to estimate recharge using the WTF and CMB methods.
2. Description of the Study Area
2.1. Location and Climate of the Study Area
The study area is located in southwestern Ethiopia, within the Jimma zone of Oromiya National Regional State. Based on the projections from the 2007 population census, the Jimma Zone had an estimated population of 3,261,371 in 2017. The zone comprises 20 rural districts, two special town administrations, 46 small urban centers, and 512 rural kebeles, the smallest formal administrative units [29]. The majority of the area lies in the Gilgel Gibe catchment of the Omo-Gibe Basin to the east (yellow in Figure 1), while smaller portions fall within the Dhidhessa catchment of the Abay Basin to the northwest (green in Figure 1). The Gilgel Gibe and Dhidhessa catchments share a common boundary, separated by the Sentema Highlands and north–south trending volcanic ridges. The Gibe and Dhidhessa Rivers originate from this common surface water divide and flow into their respective basins in opposite direction. Geographically, the study area is located between 36°54′56″ and 37°26′4″ E longitude, and 7°20′7″ and 8°63′7″ N latitude, with a total aerial coverage of about 5128 km2 (Figure 1).
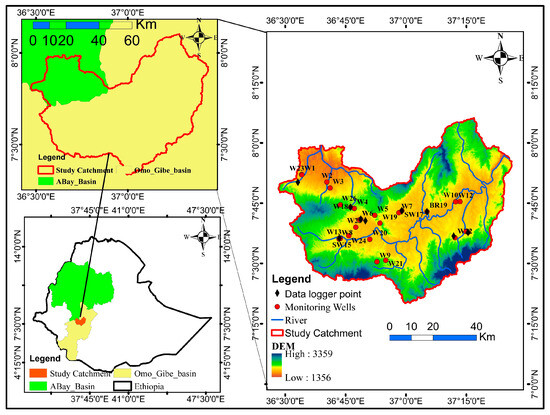
Figure 1.
Study area location including Ethiopian boundary, Omo Gibe basin (yellow) and Abay basin (Green) and distribution of groundwater level monitoring points and Digital Elevation Model (DEM) of the study catchment.
The area’s topographic features range from rugged, hilly terrains to flat plains, with elevations spanning 1356 to 3359 m. The geomorphology of the area is highly variable due to repeated volcanic and tectonic events, as well as exogenic processes such as weathering, erosion, and deposition. The region lies within a subtropical climate zone, characterized by warm temperatures and moderate to high rainfall. The area experiences unimodal rainfall lasting seven to nine months, from March to September or November, with annual totals ranging from 1200 to 2000 mm, the main from June to September with a marked increase in July and August [30]. In recent years, the maximum rainfall has occurred in August and September. Rainfall in Ethiopia is primarily influenced by monsoon winds originating from either the Atlantic or Indian Oceans, depending on the season. Ethiopia’s climate is primarily influenced by its complex topography and the seasonal movement of the Intertropical Convergence Zone (ITCZ) and is typically characterized in relation to temperature [31]. The climate and forest cover of a watershed are closely linked to the amount of precipitation. In these tropical catchments, precipitation decreases with decreasing altitude, from the plateau to the lowlands. The mean annual temperature is 20 to 25 °C.
Vegetation and land use significantly influence recharge processes. Vegetation cover plays a crucial role in flood mitigation and groundwater-surface water interactions [32]. The land use/land cover (LULC) map of the Gilgel Gibe and Upper Dhidhessa catchments is presented in (Figure 2a). Agricultural land is the dominant land use type in the study area. According to the 2018 LULC maps derived from ESA Sentinel-2 imagery at a 10 m resolution [33], cropland accounts for 67% of the area, followed by tree forests (13%), built-up areas (11%), grasslands (8%), and the remaining 1% consisting of water bodies, bare land, and regularly flooded vegetation. Coffee is the primary cash crop cultivated in the region, reinforcing Jimma’s historical significance as a global coffee source [34]. Additionally, cereal crops such as maize and wheat are widely grown in the study area.
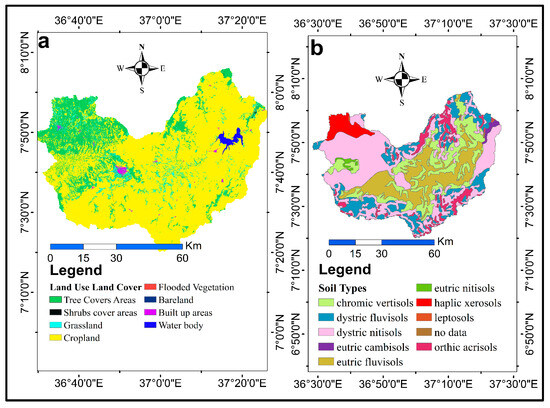
Figure 2.
(a) LULC type and (b) Soil type of Gilgel Gibe and Upper Dhidhessa catchments.
The study catchment exhibits diverse soil characteristics. Based on the Ministry of Water and Energy (MoWE) soil map, nine distinct soil types have been identified. Nitisols are the most prevalent, followed by Fluvisols, Vertisols, and Xerosols (Figure 2b). Nitisols are predominantly distributed across the northwestern, central, and eastern regions, while Fluvisols and Vertisols are mainly found in the central and northern parts. Xerosols are primarily concentrated in the northwestern areas, including Agaro and its surrounding districts. Soil texture plays a crucial role in regulating water holding capacity, infiltration rates, and groundwater recharge [5]. The study area is largely dominated by clay-textured soil. Sandy clay and sandy clay loam comprise the second-largest coverage, while clay loam and loam soil collectively form the third largest coverage, mainly occurring in lower elevation areas along the main river valley.
2.2. Geology and Hydrogeology of the Area
The regional geology of the area consists of a Precambrian crystalline basement overlain by Oligocene, Miocene, and Pliocene volcanic rocks, alluvial sediments, and Quaternary volcanic flows [35]. The underlying volcanic rock covers large areas in the east of the study catchment [36]. These are further classified into pre-rift (basalt and rhyolite flows) and post-rift (Mid-Miocene flood basalts) succession [35]. Younger lava flows overlie the oldest volcanic sequences or rest directly on the crystalline basement [35,37,38]. According to [36], felsic volcanic rocks dominate the volcanic succession in the eastern part of the study area. The upper part of the pre-rift volcanic succession is dominated by a thick sequence of felsic volcanic flows, pyroclastic rocks, and intercalated basalt flows, while rhyolitic and trachytic flows and associated ignimbrites are the dominant post-rift succession in the study area. These volcanic and crystalline basement rocks are significantly influencing groundwater storage and movement. The felsic volcanic rocks, with their low permeability, limit recharge in some regions, while weathered and fractured basalt flows, intercalated basalt flow and alluvial deposits provide pathways for groundwater infiltration.
Volcanic activity, geological structures, and lithological variations in the area influence the hydrogeology and drainage density. Structural features such as faults, including graben-horst and joints, and other lineaments, serve as preferential pathways for groundwater flow. These structures align with river channels, contributing to localized recharge and drainage density variability. River channels often follow young lineaments and grabens, while north–south and east–west trending perennial and intermittent streams align with the master drainage systems of the Gibe and Dhidhessa Rivers. Figure 3 provides an overview of regional geology and cross-sectional views, showing the stratigraphic relationships and structural variations that influence groundwater recharge and discharge dynamics in the study area. Cross sections from A to B (northwest to south) and C to D (west to east) have been constructed using geological maps obtained from the Ethiopian Geological Survey.
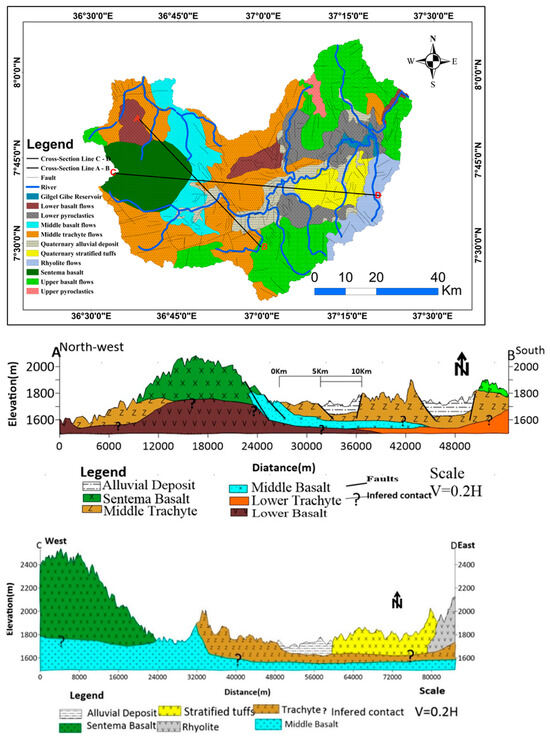
Figure 3.
Study area geology and its cross section, modified from the Ethiopian Geological Survey [37].
The aquifers in the study area are mainly linked to basalt flows, rhyolites, pyroclastic deposits, ignimbrite, volcanic and alluvial deposit sequences [39,40,41]. Their recharge potential is influenced by porosity variations and structural features, including volcanic fractures and weathered zones. Based on a review of previous studies, well logs, and pumping test analyses, three primary aquifer systems have been identified in the study area. These are as follows: (1) Fractured and weathered volcanic rock aquifer. (2) Quaternary alluvial aquifer-composed of clay to gravel-sized deposits in the lowland regions. (3) Mixed aquifer formed by sediments accumulated between lava flows and pyroclastic deposits. The fractured and weathered volcanic aquifer is composed of volcanic rocks dating from the Pre-Oligocene, Oligocene, Miocene, and Pliocene periods (Figure 4). This aquifer type covers the largest portion of the study area and is connected to deeper groundwater systems. In contrast, the Quaternary alluvial aquifers, primarily formed from alluvial deposits in lowland and depression areas, are occasionally influenced by pyroclastic and unwelded tuff materials, which predominantly characterize the shallow aquifers. These aquifer systems collectively influence groundwater availability, flow dynamics, and productivity in the regions. Figure 4 shows the hydrogeological profile, aquifer structure, and groundwater flow system.
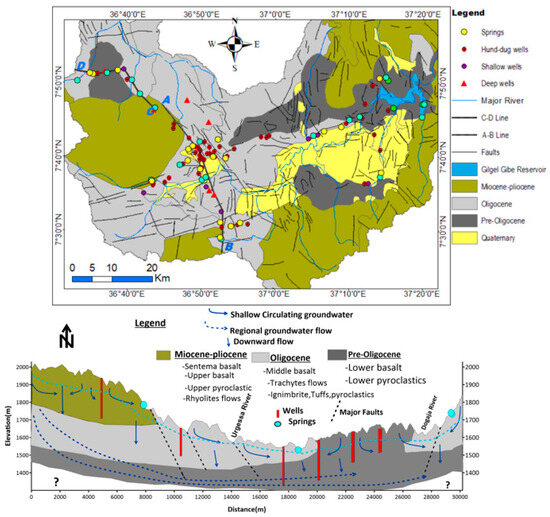
Figure 4.
Hydrogeological conditions of the study area. The undifferentiated volcanic rocks are represented by (?).
Groundwater flow in the study area varies considerably, controlled mainly by geological and geomorphological settings. The hydraulic head gradient follows the natural topography (Figure 5), while boreholes, springs, and streams serve as key water sources.
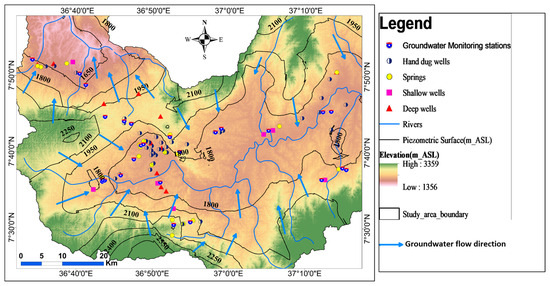
Figure 5.
Piezometric map and groundwater flow patterns in the study catchments.
3. Materials and Methods
The study used primary data with the application of two principal methods for the estimation of groundwater recharge in the adjacent catchment of the Gilgel Gibe and Upper Dhidhessa Rivers. Hydrogeological settings, topography, land use, and landcover were considered for primary data collection: choosing-water level monitoring sites and sampling water points. The establishment of rain gauge stations and water level monitoring points for shallow groundwater was distributed considering local conditions.
3.1. Groundwater and Rainfall Data Collection
Groundwater level was monitored using both automatic devices (data loggers) and manually in shallow groundwater wells. A total of 22 manually monitored hand-dug wells, with depths ranging from 6 to 23 m, were spatially distributed across the study area. The hand-dug wells were constructed prior to the start of the monitoring period, whereas the selected wells were more recently excavated and designated for monitoring. Daily water-level data were collected during 2022–2023 hydrological year through a community-based manual monitoring program. Data recorders were selected based on their literacy, sense of responsibility, and willingness to participate in manual groundwater monitoring. Local community members, primarily well owners, and in cases where owners were illiterate, their neighbors, were trained to carry out the measurements. Participants included students, teachers, water supply professionals, farmers, and agricultural experts. Some monitored hand-dug wells are actively used by the community for domestic water supply; however, the volume of water abstracted is minimal and does not significantly affect groundwater levels. In most cases, wells were not used for water abstraction during the monitoring period after discussions with the local administration and well owners, who agreed to use alternative sources and wells not included in the monitoring program. To avoid the influence of groundwater extraction, the water level was recorded early in the morning at 6:00 AM before the well was used by the community or households. We trained those people and supplied them with measuring tape and rope tied with plate-weighted metal of 40 to 50 cm at the end. Every morning, prior to fetching water, they lower a rope attached to a steel rod into the well until it reaches a certain depth beneath the water’s surface. A steel rod was inserted until it reaches some depth below the water level to identify the wetted portion of the rod which allowed us to measure the distance between the head of the well to the tip uppermost point of the wetted surface on the metal using metering tape. They then promptly withdraw it and measure the distance from the ground surface of the well to the damp surface of the metal plate.
Data loggers were installed in five monitoring wells located across different topographical variations (Figure 6). In this case, there is no direct abstraction of water from the wells where the data loggers were placed. The automatic data loggers record water levels at 30 min intervals. The data loggers, TD-Diver from Royal Eijkelkamp company, have a memory capacity of approximately 72,000 data points. It has a measuring range of up to 20 m of water height above the probe, with an accuracy of ±0.01 m (±1 cm water column) and a resolution (precision) of 0.4 mm. A barometric pressure recorder (Baro-Diver® from Van Essen Instruments, Delft, Netherlands) was programmed and placed in an open environment to compensate for the atmospheric pressure effect. Extra shallow wells were measured three to five times a month using a portable dip meter.
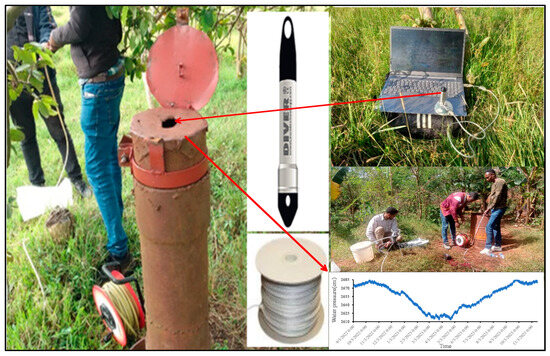
Figure 6.
Groundwater monitoring setup and water sampling procedures (programming the data logger, installing the monitoring well, and collecting groundwater samples).
Spring discharges were measured from 11 monitoring points using the bucket and stopwatch method several times a month. Rainfall is the principal source of recharge, and hence for the groundwater level fluctuation. Simple rain gauges were bought from the Ethiopian Meteorological Agency and distributed at 7 gauging stations, hung at a 2 m height above the ground surface, close to monitoring wells. The rain gauges used were simple plastic type, consisting of a transparent conical body with a printed scale graduated in millimeters up to 150 mm. Daily rainfall was collected and recorded in the morning at 8:30 A.M. Rainfall data from the new rain gauges were integrated with data from the existing meteorological station in the study area.
Field campaigns were conducted in the neighborhood of monitoring wells, and relevant data on land features and physical characteristics were collected. During field work, data from automatic data loggers were downloaded, data collectors were consulted for data quality handling, and recorded rainfall and groundwater levels data were also collected for data entry and deposition. The physical characteristics of the study area, assessment of water resources, local geology, geomorphology set-ups, and inventory of water points were also noted during field work. Interviews were carried out with chosen households and experts to assess user satisfaction levels and people’s perceptions regarding their water sources and associated factors. The data collected from monitoring wells and rainfall gauges, proceeded by groundwater and rainwater sampling and subsequent recharge estimation methods.
3.2. Groundwater and Rainwater Sampling and Analysis
Groundwater and rainwater samples were collected for major ion analysis. Groundwater samples were collected from shallow wells, hand dugs, and spring water, considering topography and land use. Groundwater samples were collected from 45 water wells and spring sources evenly distributed across the 5128 km2 study area (Figure 7). Samples were taken after pumping for 10 min using flow through cells for shallow wells. Physical parameters (pH, conductivity, and temperature) were recorded onsite using a pH meter (WTW pH 320) and EC meter (WTW Cond 3110). The manufacturer is WTW GmbH (Xylem Analytics Germany Sales GmbH, Germany). Samples were taken to the laboratory for chemical analysis. Samples of rainfall were gathered during corresponding time frames at different elevations within the basin, ensuring that potential topographical effects on rainfall water chemistry were accounted for. Samples were collected in the period of 2022–2023 (transition season: April 2022; wet season: June–August 2023; dry season: December 2023). Groundwater and rainwater samples were taken to the laboratory with all the protocols of laboratory standards and procedures. Samples were reserved in the refrigerator until their analysis. Chloride (Cl−) and nitrate (NO3−) concentrations were measured using a UV–VIS spectrophotometer (Shimadzu UV Mini-1240, Kyoto, Japan). The correlation between chloride and nitrate was examined before incorporating chloride into the recharge calculation.
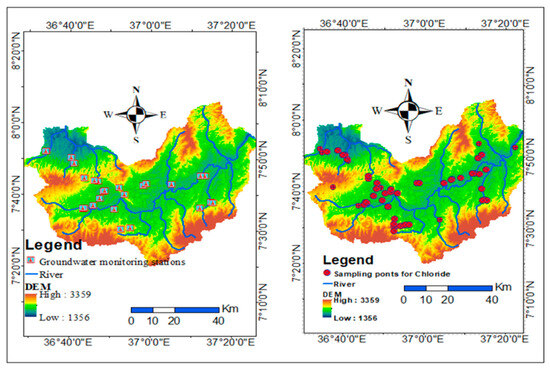
Figure 7.
Distribution of groundwater monitoring and sampling wells in the catchment.
The collected data (both water level and chemistry) were analyzed using two established recharge estimation methods: Water Table Fluctuations (WTF) and Chloride Mass Balance (CMB). The combination of WTF and CMB methods provides a comprehensive approach to recharge estimation, leveraging both hydrological data and chemical tracers.
3.3. Recharge by Water Table Fluctuations (WTF)
The water table fluctuation (WTF) method is among the most commonly applied approaches for estimating groundwater recharge under diverse climatic conditions [42]. The knowledge of recharge estimation by WTF from regularly monitored groundwater level and known aquifer-specific yield is the most attractive technique [9,11,13,43]. It is also called water level fluctuation and depends on the cumulative rise in groundwater level in the monitoring well and specific yield of an aquifer. Many scholars have used the method of WTF in recharge estimation, especially for shallow groundwater [44,45,46]. The basic assumption of the WTF method is that the rise in the groundwater table in an unconfined, shallow aquifer is due to the recharge from precipitation reaching the water table [9], and the aquifer shows sharp water level rises right after precipitation events and declines in absence of precipitation. Equation (1) was used to estimate groundwater recharge from the WTF method as was applied by different researchers [9,11,13,44]. The WTF method is well suited for estimating recharge in shallow unconfined aquifers with pronounced water-level fluctuations. It provides actual rather than potential recharge estimates, but its application requires reliable values of specific yield and continuous groundwater-level records [47]. The quantity of water in wells from a body of saturated rock or soil depends upon the specific yield (Sy) of the rock or soil [46]. Sy is not commonly measured, and most studies rely on typical values based on aquifer material [11]. Groundwater recharge is calculated by
where R is the groundwater recharge ∆h = the head change through the recharging period; Sy = is the specific yield (Storage) of unconfined aquifer, and ∆t = is the recharging period.
The rise in water level (∆h) within a monitoring well is determined as the difference between the peak water level and the projected value of the antecedent recession curve at the time of that peak. The recession curve represents the trajectory that the hydrograph would have followed in the absence of recharge. Several approaches are available for estimating water level rise, including the Master Recession Curve (MRC), RISE software, and graphical extrapolation methods [42]. Among these, the graphical extrapolation approach, while more subjective, is the simplest and least time-consuming. In this study, the graphical method was employed to estimate groundwater level rise in each monitoring well. This involved visually analyzing the complete water level record for each well and manually extrapolating the antecedent recession curves. The rise in groundwater level during recharge events was then quantified as the difference between the peak of the rise and the projected value of the extrapolated recession curve at the same time. Graphical extrapolation of groundwater levels can follow different trends depending on the hydrogeological setting and the time series behavior. In rainfall-recharged monitoring wells, levels typically exhibit rapid post-rainfall rises followed by slower declines as recharge diminishes and aquifer storage dominates, approximating exponential or logarithmic curves. For extrapolation, the recession segments were selected from the pre-rainfall period, focusing on the lowest data points and the steepest slopes to represent antecedent conditions. The recession period data were plotted separately to determine whether the graph follows an exponential or logarithmic model. After identifying the model that best fits the re-cession period data, we carefully performed the extrapolation starting from the lowest observed during the no-recharge period.
Estimating the reliable specific yield value is a major constraint, especially in volcanic rock aquifers. The challenges in estimating the specific yield (Sy) value in the WTF method are outlined by [11,48]. Specific yields are compiled for various materials by Johnson [49]. Most studies rely on typical values based on aquifer materials [11,49,50]. For each monitoring point, the local lithology at the corresponding water level depth was correlated with these values. The specific yield for each monitoring point was then assumed and adapted from [49], based on the aquifer’s geologic material and guided by the reported range of values. The lithology of shallow, unconfined materials obtained from drilled boreholes near the monitoring wells was used as supporting information to assess the thickness of the aquifer materials.
3.4. Recharge by Chloride Mass Balance (CMB)
Chloride Mass Balance (CMB) was first developed by [51] and is a widely applied technique of recharge estimation. It relies on the assumption of conservation of mass between the input of atmospheric chloride and the chloride flux in the subsurface [15,52,53,54]. Chloride is added to the soil matrix from rainfall and dry deposition [52]. The CMB method is inexpensive and requires knowledge of annual precipitations, and their chloride concentration and the chloride concentration of groundwater. Assumptions commonly made in previous studies to apply the CMB are: (a) the source of chloride in the groundwater is only precipitation; (b) chloride is conservative in the system; (c) steady-state conditions are maintained with respect to long-term precipitation and chloride concentration in that precipitation; and d) no recycling of chloride occurs within the watershed. The study area satisfies these assumptions due to the absence of significant chloride pollution and other geogenic (e.g., rock salt) sources and the consistency of precipitation patterns. Mathematically, Equation (2) has been developed to relate the parameters in the application of CMB [51,52,53].
where R is the total Recharge in mm, Peff. is effective mean annual precipitation in mm (Annual rainfall–Surface Runoff), Clp is the mean chloride concentration in rainfall in mg/L, and Clgw represents the mean chloride concentration in groundwater, expressed in mg/L. The analyzed samples with high chloride and nitrate values were excluded from the calculation of recharge. This is done to prevent anticipated high chloride concentrations in the groundwater resulting from pollution sources, ensuring the applicability of the CMB method in this study. In applying both the WTF and CMB methods, identifying the main sources of uncertainty is essential for reliable recharge estimation. These sources have been highlighted in this study and recommended for future work
3.5. Data Processing and Analysis
The groundwater monitoring and sampling points were mapped, and their distribution was presented using ArcGIS 10.8 software (Figure 7). For groundwater level data, prior to analysis, the diver and barodiver records were first visualized using Diver-Office 2017 and then downloaded. Manually measured data were visualized in Microsoft Excel 2019 by plotting groundwater levels against time on arithmetic graphs. The graphical representation of the recorded data of groundwater level data, springs discharge, and precipitation was done by using Microsoft Excel 2019. Groundwater level data is visualized by plotting arithmetic time-groundwater level depth graphs to see the sharp increase and decline of water level in the well.
The barometric effect was corrected to filter out water level fluctuations due to atmospheric pressure and to remain with the useful component that is due to the aquifer response to precipitation changes. Then, the data were analyzed and used for graphical interpretation and calculations. We were interested in the height of the water level in relation to the vertical reference datum to see the fluctuations. Water quality data were analyzed and interpreted according to their importance in the recharge calculation.
4. Results and Discussion
4.1. Geology and Hydrogeology
The geological assessment relied on information obtained from drilling descriptions, literature reviews, and field observations. Well logs extending from the land surface to 373 m depth showed a top overburden formation of reddish-brown clay soil with variable thickness. Underlying volcanic rocks displayed different degrees of weathering and fracturing, with soil and regolith as weathering products (Figure 8). The volcanic rocks exhibited variability in rock groups, and their weathering and fracturing were evident from quarry sites and the recovery of hand-dug materials (Figure 8c,d). Basalt, ignimbrite, trachyte, tuffs, pyroclastics, and rhyolites were identified as the predominant Tertiary volcanic rocks. Alluvial deposits, covering rivers, valleys, and central lowlands with variable thickness, often comprise soft, boggy clayey soil (Figure 8f). Residual soils, derived from in situ weathering of volcanic rocks, covered a large area along gently sloping topography, exhibiting a reddish to brown color (Figure 8e). Geologically, the area is quite complex and heterogeneous, as indicated by well log descriptions, and observed by outcropped rocks (Figure 8a–h). Groundwater sources originate from shallow, intermediate, and deep aquifer systems, with springs manifesting across all lithological units in hilly, foot slopes, plateaus, valley floors, riverbanks, and gorges.
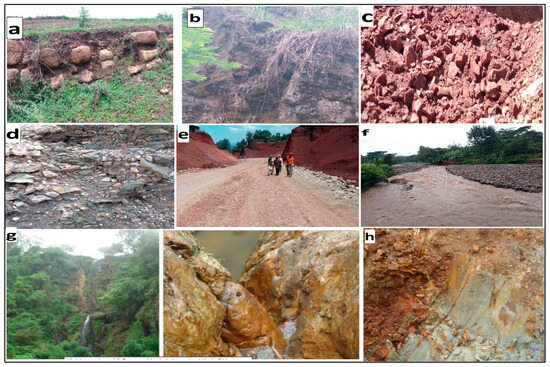
Figure 8.
Spheroidal Weathering on basalt rocks on a hillside in an agricultural field (a) and massive to slightly fractured basalt covered by grass, and vegetation outcropped upstream (b); weathered soil from the quarry site and a regolith of coarse to fine unconsolidated material from a 12 m deep dug well (c,d); residual soil at gentle topography on the side of the road (e); an alluvial deposit, boulders and pebbles in the river valley (f); highly weathered and fractured ignimbrite rock in the uplifted and sloping terrain with local fault structure (g); Altered tuff material near the ground surface (h).
The highly weathered top regolith of basalt and alluvial deposits serve as major water-bearing layers for hand-dug and shallow wells. The volcanic aquifers beneath the shallow aquifer system were categorized into intermediate and deep aquifer systems. In some parts of the study area, reports show drilling of very deep wells on volcanic aquifers, reaching depths beyond 350 m below ground level (bgl), with some functioning as artesian wells.
4.2. Observed and Total Rainfall
Figure 9 shows the mean monthly observed rainfall in the study area. The area receives a unimodal type of rainfall, with increasing mean monthly precipitation from April to September accounting for 78% of the total annual rainfall. There is some slight rainfall from October to November, and the lowest rainfall is observed from December to March, with only 10% of the total annual rainfall.
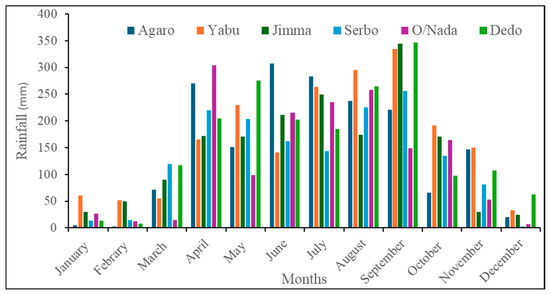
Figure 9.
Monthly observed rainfall.
The rainfall varied with space and time during the recording period. The variability resulted from regional climate fluctuations that disrupted the rainfall pattern during its typical season. The highest rainfall was received at the highest altitude in the northwest (Yabu) and south (Dedo) stations, but with some local variations that contradict to this general altitude-rainfall amount correlation. Local conditions such as the extent of forests and vegetation density positively affected rainfall amount at some stations. Rainfall was medium (Jimma) in the central area, and low (Omo-Nada) in the east of the study area. It decreases spatially from the higher-altitude areas toward the lower-elevation areas, with an average annual value between 1539 mm and 1972 mm.
We divided our study area into different clusters of sampling regions and calculated direct runoff and effective rainfall using the Soil Conservation Service-Curve Number (SCS-CN) model [55] from rainfall events, considering hydrological soil groups and vegetative cover conditions for the respective gauging stations. Typical hydrological soil groups were summarized by the Ethiopian road authority in the road design manual [56], and the soil and land use map of the study area was used. Antecedent moisture condition AMC II was assumed based on vegetation cover and hydrologic soil groups (HSG). For dry conditions AMC I or wet conditions AMC III, equivalent curve numbers have been computed using Equations (3) and (4). From the CN value, the potential maximum retention was calculated using an empirical formula. The direct runoff, which represents the initial rainfall absorbed by the soil, was determined. The effective rainfall was calculated by subtracting the direct runoff from the total rainfall (Table 1). This effective rainfall is the one that was used in recharge calculation by the chloride mass balance technique.

Table 1.
Runoff and effective rainfall calculated based on HSG and LULC using the curve number (SCS-CN) model.
4.3. Groundwater Monitoring and Fluctuations
For clarity in data interpretation and presentation, the monitoring wells were stratified into four geographic regions: northwest, central, south, and east. These wells were systematically distributed and monitored throughout the entire study area. The maximum groundwater depth in the dry month varies between 17.6 and 3 m in the northwest, 11.6 and 1.7 m in the central part, 11.5 and 3.2 m in the east, and 13.8 and 2.7 m in the south. Minimum groundwater depth in the wet month varies between 13.2 and 0.15 m in the northwest, 5.8 and 1.09 m in the central, 3.5 and 1.1 m in the east, and 7 and 1.8 m in the south of the study area. The seasonal and spatial variation in groundwater depth is quite high. The higher groundwater depth in the northwest and south regions might be due to hydraulic gradients to lowland and depression areas. The northwest region serves as a recharge area for the downstream section of the Dhidhessa River gorges, where a higher hydraulic gradient can influence the depth of the groundwater table. Evapotranspiration through plant leaves in tropical climates is expected to be higher where tree forests and vegetation dominate. Groundwater depth is shallower in monitoring wells in the central and eastern regions. The monitored wells in these regions exhibit relatively shallow groundwater tables, reflecting their location in areas that are more topographically stable than the northwest and southern parts of the study area, where greater topographic variability and steeper slopes occur. These regions are considered groundwater discharge or near-discharge zones. All monitored wells exhibited rising groundwater levels during periods of rainfall and declining levels during dry periods, demonstrating a clear response to rainfall events. Figure 10 shows the temporal evolution of groundwater level in different regions.
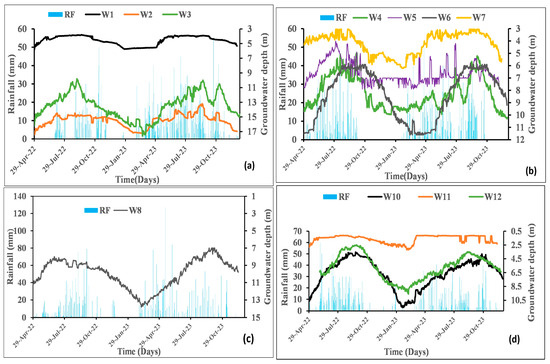
Figure 10.
Arithmetic time graph of groundwater level depth and response to rainfall in the northwest (a), central (b), south (c), and eastern (d) study regions.
The groundwater system exhibits a robust and favorable response to rainfall, with water levels increasing during rainy periods with a time lag for a few wells, (Figure 10). This positive groundwater response indicates a notable recharge capacity, highlighting the system’s ability to efficiently replenish and maintain elevated water levels in response to precipitation events. In our observation, rainfall starts after a long dry period in Spring, and the initial rainfall has little contribution to the rising of groundwater levels; it is rather consumed by soil moisture intake and sediments to increase the moisture content and reach field capacity. After the first rainfall is consumed for saturation of the soil profile, groundwater starts rising. The rainfall started around March or April, whereas the groundwater level rise was noted around May or June (W1, W4, W6, W7, W10) (Figure 10). The delay of 1 to 2 months between the onset of the rainy season and the initiation of groundwater recharge indicates a phase of soil replenishment due to moisture deficits carried over from the preceding dry season. This lag implies the presence of threshold effects and a non-linear correlation between daily rainfall events and recharge for some wells in the area under investigation. However, there are some wells that rapidly respond to precipitation events and start rising water levels immediately (W3, W4, W8, W12) (Figure 10). Such wells are locally sited in highly fractured and completely weathered volcanic soil with a sandy loam texture and topographically at the highest elevation points.
Wells located on the upstream and steepest slope display more groundwater level fluctuation than wells in the downstream part. However, the time of response of groundwater to rainfall is determined by the local characteristics of monitoring points. For instance, groundwater level in the deep monitoring well (W14), located in the floodplain of alluvial deposit, begins to decline from mid-October (dropping from 1.1 m water table to 1.76 m by the end of March). Although rainfall starts on February 28 and increases throughout March, the groundwater level does not begin to rise until early April (Figure 11). Wells located in compacted clay soils (e.g., W10 in the eastern region) exhibited slower responses to rainfall, as the low-permeability clay forms part of the vadose zone above the aquifer. This indicates that the aquifer response to rainfall infiltration depends on soil nature and the degree of fracturing, as seen after the anticipated soil moisture condition is attained.
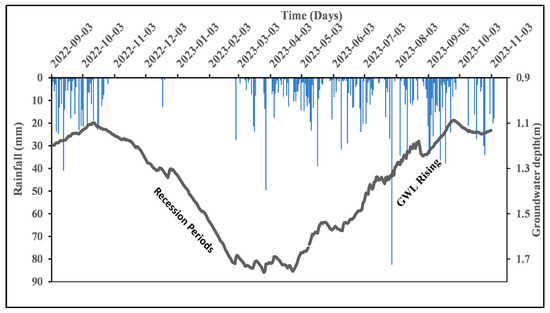
Figure 11.
Arithmetic time graph of groundwater level depth measured at 30 min time interval by a data logger in W14 and daily rainfall measured at Jimma gauging station.
Typically, the fluctuations of groundwater within a monitoring well are calculated by subtracting the value of the extrapolated antecedent recession curve at the time of the peak from the peak itself. The recession curve at the time of the peak is the trace that the well hydrograph would have followed had there not been any rainfall or recharge [57]. The extrapolations are represented by a broken line, and the procedure is indicated in (Figure 12) for the monitoring well (W14).
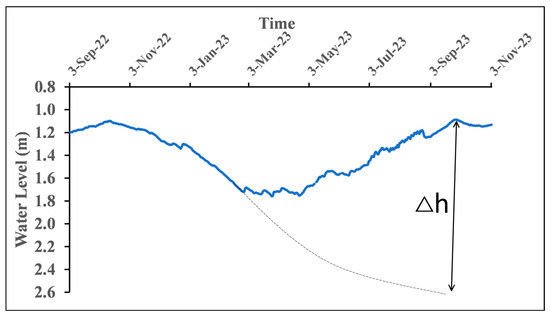
Figure 12.
Groundwater hydrograph of DW14 with extrapolated recession in the rainy, showing the resulting measured Δh using daily recorded water level data. Groundwater level recession is assumed to follow an exponential decay function.
Fluctuation of groundwater level in the observed period varied between 0.7 and 8.2 m for monitored wells in the entire study area Table 2. High fluctuations of groundwater level were observed in the monitored wells positioned at higher elevation points (upstream wells), and small groundwater fluctuations were observed in the wells positioned at lowlands and flood plain (downstream wells). The groundwater depths seem to be most profound beneath the land surface from approximately December to April. The wells promptly react to the onset of the rainy season, refilling and attaining their maximum levels in July, August, and September. This elevated state persists relatively steadily until October, after which the water levels gradually decline starting from the conclusion of the rainy period, as illustrated in Figure 11. The sharp decline of groundwater in the dry season indicates the effect of overuse of shallow groundwater on the surroundings of monitoring wells without replenishment of rainwater and with natural discharge towards rivers.
Table 2.
Characteristics of monitoring wells and annual estimated recharge in the north-west, central, south, and eastern regions using the WTF method.
Spring discharge measurements provide a general illustration of groundwater dynamics similar to wells observed in dry and wet seasons (Figure 13). Springs show higher discharge during the rainy season, indicating an aquifer response to recharge from rainfall. In general, the groundwater level in the study area conforms mostly to the topography, geology, and rainfall amount, but is not significantly affected by minor land use features. Interviews and observation conducted revealed that there are springs which are seasonal only during the rainy season at the foot of the hills.
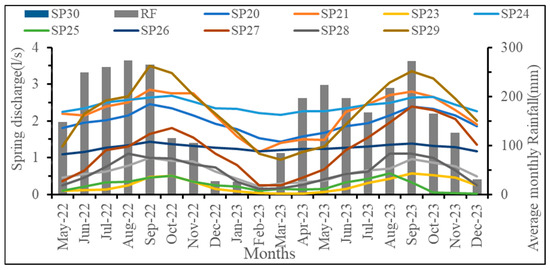
Figure 13.
Hydrograph of spring discharge with monthly rainfall (SP—Spring, RF—Rainfall).
4.4. Groundwater Recharge
4.4.1. Water Table Fluctuation (WTF)
Our investigations reveal that the geological profile transitions from fully developed soil to regolith, and then to bedrock. The degree of weathering and fracturing reduces from the surface downward. Shallow wells remain fully unconfined throughout their entire depth. We assumed and adapted the specific yield based on borehole lithology of these shallow, unconfined materials and data from nearby monitoring wells, referencing the range suggested by Johnson [49]. In applying the (WTF) method, representative values of specific yield (Sy) compiled by [49] for various water-bearing materials were used to estimate groundwater recharge in volcanic aquifers [10]. Specific yield values depend on the grain size, and degree of compaction of the soil and regolith. For this study, Sy values reported by Johnson were compared with local soil characteristics and lithological formations observed at the monitoring sites. Based on this comparison, site-specific Sy estimates were assigned to each recharge estimation point to improve the accuracy of the recharge calculation. Accordingly, the assumed specific yield ranges from 6.7 to 11.2%, which was utilized in the recharge estimation (Table 2). Specific yield estimated for volcanic rocks varies over large ranges: 3–28% [58], 22–26% [50], 2–30% [59] 22% [13], 5–10% [7]. The estimated Sy value used in this study is in the acceptable range of the previously estimated value in volcanic geology. The calculation of recharge (R) utilizing the water table fluctuation (WTF) method is then determined using Equation (1). Using the estimated specific yield range, calculated recharge values range between 76 and 796 mm (4 to 43% of the rainfall), with an average of 439 mm for the entire area (Table 2).
The estimated recharge rate obtained in this study is comparable to values reported for other volcanic aquifers in Ethiopia, such as the Upper Beles Basin, 191–803 mm/year [60], and the Lake Tana Basin, 125–778 mm/year [54]. The slight differences among these values are likely attributed to variations in catchment characteristics, including lithology, topography, and climatic conditions. Although the recharge value estimated for W14 is presented in the table, it is not incorporated into the current analysis. Its inclusion serves as a potential reference for future studies focusing on deeper aquifer systems. Accordingly, the average recharge calculations and the discussion presented in this paper are based solely on shallow wells, with W14 explicitly excluded. The estimated average recharge and number of observed wells clustered in the regions of the study area are presented in Table 2. Some monitored dug wells exhibited minimal water-level fluctuations in response to storm events, despite being located in upland positions within shallow aquifers, resulting in low estimated recharge. In some cases, this behavior is not attributable to localized hydraulic gradients, as higher elevation areas surround the wells, suggesting that they may be situated in perched aquifers. For example, well W9, located in the southern region, showed minimal fluctuation despite its high elevation, leading to a low recharge estimate.
The estimated recharge by WTF is quite variable over the entire study area. The considerable diversity in the topography, geology, soil composition, land use, and slope across this area has led to intricate spatial recharge variations. The average recharge rates are 462 mm, 427 mm, 466 mm, and 401 mm for the northwest, central, southern, and eastern regions of the study area, respectively. Higher recharge is estimated in the south regions, but higher recharge was also expected in the northwest of the highest rainfall area. The relatively low groundwater recharge in the northwest is attributed to high evapotranspiration associated with forested land use, combined with the influence of steep topography and local lithological conditions. The highest values of recharge are found at the highest elevation points of the catchments, that is, 705 mm at 2124 m, 796 mm at 1902 m, and 713 mm at 2196 m. In addition, the correlation between elevation and recharge rate for the similar amount of rainfall and geology is analyzed. In the highlands, the water table is deeper, but fluctuations in the water table have a larger amplitude for the same amount of rainfall. Despite the limited number of observations, a linear relationship to recharge is observed. The highest recharge was estimated in Miocene and Oligocene basalt flows at highland points (Figure 14), where the topmost lithology is regolith material underlain by weathered and fractured volcanic rocks in which strong water table fluctuations are observed. Here, focused recharge via the fractures is thought to be playing an important role for the higher recharge values. Estimated recharge in the alluvial deposits in the lowland is minimal as compared to the Oligocene and Miocene volcanic rocks. This finding is similar to a previous study undertaken on the variable topography of volcanic aquifers [54]. According to [11], recharge is dominant in upstream reaches in the Quaternary volcanic rocks.
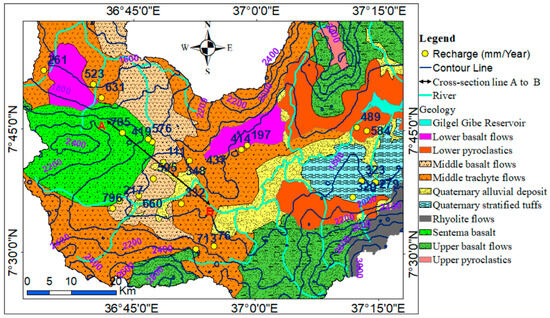
Figure 14.
Distribution of recharge in different volcanic rocks and topography. The labels on the wells are annual recharge in mm.
An average low recharge was calculated in the eastern study regions. This is mainly due to the low rainfall in the east compared to other regions. Amount of rainfall received usually determines recharge [11,16,54]. Soil type and land use significantly influence the spatial variability of groundwater recharge [54]. In the eastern region, the presence of compacted, sticky clay soils impedes rainfall infiltration, thereby reducing groundwater recharge. Clay soils, due to their fine particles and low permeability, restrict water movement, leading to increased surface runoff and diminished infiltration rates. Furthermore, land-use changes such as deforestation and urbanization can intensify soil compaction and disrupt natural infiltration processes, thereby affecting groundwater recharge.
In the study area, rainfall amount, elevation, and lithology play significant roles in controlling recharge rates. Recharge rates and elevation were locally correlated within clustered regions characterized by similar rainfall amounts and geologic properties. Figure 15 illustrates the relationship between groundwater recharge and elevation in volcanic rock terrains. Most recharge estimates obtained using the WTF method exhibit a linear relationship with the elevation of monitoring points across the northwest, central, southern, and eastern regions.
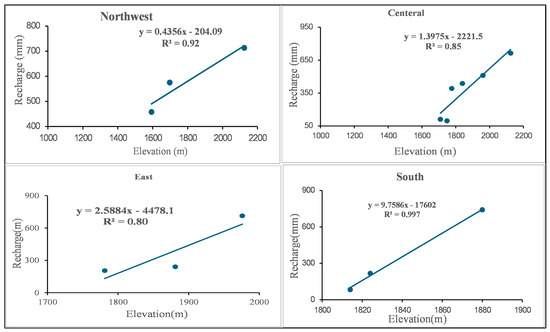
Figure 15.
Relationship between groundwater recharge and elevation in volcanic rocks.
Monthly Groundwater Recharge
Figure 15 presents the average groundwater level, rainfall and monthly recharge for representative wells in the study region. Groundwater recharge varies between 0 mm in December and January, when rainfall is minimal or insufficient to replenish the highly stressed soil during the dry months, and 185 mm in May for well W3 (Figure 16b) in the Northwest of study area.
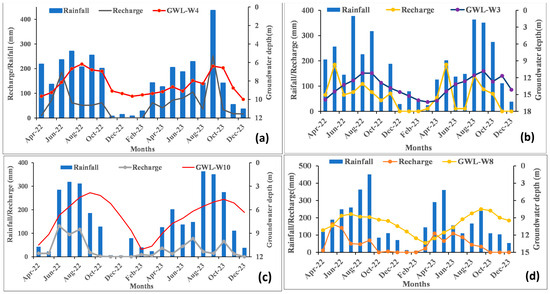
Figure 16.
Monthly recharge in the central (a), northwest (b), eastern (c), and south (d) study regions.
For well W4, located in the central region, the highest groundwater recharge was 185 mm in June 2022, and 252 mm in September 2023, (Figure 16a). The minimum recharge rates were recorded between November and February, with negligible recharge. However, in December 2023, the estimated monthly recharge was about 17 mm, accounting for the rainfall for that month. In the southern part of the study area, monthly recharge estimation was calculated at well W8 (Figure 16d). The maximum estimated recharge was 164 mm in May. The minimum recharge rates were recorded between December and February, with negligible recharge.
In the eastern region, well W10 recorded a maximum recharge of 131 mm in June. The lowest recharge rates were observed between November and January, with zero recharge (Figure 16c).
For all monitored wells in the study area, the estimated monthly groundwater recharge indicates high infiltration rates in May and June. This is attributed to the highly moisture-stressed condition of the soil following the dry season. During these months, a significant portion of rainfall infiltrates into the ground, replenishing soil moisture and filling pore spaces.
However, a lower percentage of recharge was observed in April, as the catchment remained relatively dry due to low rainfall in preceding months. In this period, rainfall is first absorbed to compensate for soil moisture deficits before contributing to groundwater recharge.
Similarly, July and August, which correspond to the peak rainy season in Ethiopia, exhibited a low recharge percentage. This is likely due to reduced infiltration rates resulting from high antecedent soil moisture, increased aquifer storage from preceding months, and greater surface runoff. Overall, the monthly recharge rate is not directly proportional to monthly rainfall, likely due to variations in infiltration rates, soil permeability, and antecedent moisture conditions. Although recharge patterns are consistent across the monitored wells, a lagged response to rainfall events indicates that groundwater replenishment occurs with a delay. The delayed groundwater level response indicates slow recharge processes in volcanic formations [61,62].
4.4.2. Chloride Mass Balance (CMB)
There were no long-term groundwater and rainwater chloride concentrations available at the national level to be used in the CMB method. Chloride concentrations were analyzed at the Laboratory for Applied Geology and Hydrogeology (LTGH) of Ghent University. The chloride in rainwater ranged from 0.99 mg/L to 3.7 mg/L, with a mean of 2.46 mg/L and a standard deviation of 0.923 mg/L. Rainwater chloride was estimated in different parts of Ethiopia and its surroundings: 0.3 mg/L to 1.42 mg/L in northern Ethiopia [63]; from 0.15 mg/L to 2.2 mg/L in the Akaki catchment of central Ethiopia [45]; from 0.1 mg/L to 4 mg/L at Bahir Dar [11], from 0.3 mg/L to 1.52 mg/L in southeast Botswana [64], and 4.6 mg/L at Abu Delaig, Sudan [65] which is greater than measured rainwater chloride in Ethiopia. This pattern may be explained by the proximity of the Red Sea as a moisture source and by fractionation of rainwater as it travels over high topographic landscapes before reaching Ethiopia. The chloride concentration at Sahel Senegal was 2.8 mg/L [66], which is comparable to the chloride estimated in our study area.
The groundwater samples exhibited pH values predominantly between 5.0 and 6.5 and temperatures ranging from 21.0 to 22.8 °C Table 3. These characteristics indicate that the sampled groundwater is relatively young, fresh, and shallow, making it representative for recharge estimation using the chloride mass balance (CMB) method. Average rainwater chloride (2.46 mg/L) was used in the calculation of recharge by CMB. Chloride concentration in groundwater varied from 3 mg/L to 36.99 mg/L, with an estimated mean and standard deviation value of 8.3 mg/L and 3.5 mg/L, respectively. The variability of chloride concentration over the study area is quite large. The variation is primarily due to topographical variation and evapoconcentration process. High chloride was found in lowland areas, tree covers, and vegetation land use. Low chloride concentrations were observed in groundwater samples from the highland areas, with levels increasing toward the plains and lowland regions. Figure 16 illustrates the scatter plot of chloride (Cl−) versus nitrate (NO3−) for groundwater samples distributed across the study area to see the correlation between them. Samples with elevated nitrate and chloride concentrations were excluded from the calculation of recharge (Figure 17, red circle). Before incorporating chloride in recharge estimation, its correlation with nitrate was assessed to determine whether chloride was influenced by anthropogenic pollution. The analysis revealed a weak correlation between chloride and nitrate concentrations in the groundwater samples, with a correlation coefficient of R = 0.365 (Figure 17).
Table 3.
Annual estimated groundwater recharge using the CMB method.
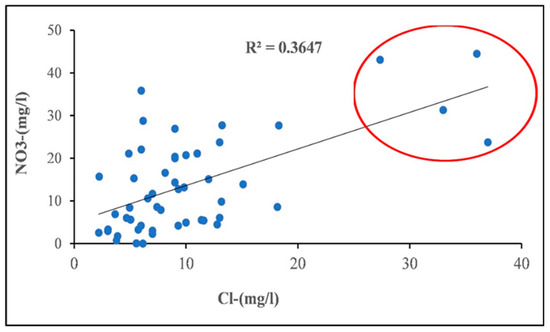
Figure 17.
Correlation of chloride and nitrate concentrations.
Effective rainfall from the nearest raingauge stations was used in the calculation of recharge estimation. The land use is predominantly cropland, tree cover, shrub type, grassland, and built-up areas with small parts of bare areas. Using Equation (2), the recharge rate is calculated (Table 3).
The average catchment groundwater recharged of the whole region by the CMB is 454 mm. The point estimated recharge rate were 170–850 mm/year, corresponding to 11–55% of total rainfall. The estimated mean recharge rate obtained in this study is comparable to values re-ported for other volcanic aquifers in Ethiopia, such as the Upper Blue Nile Basin, 436 mm/year [11], and the Upper Beles Basin, 308 mm/year [60]. The slightly higher recharge observed in this study is likely attributed to greater rainfall intensity, favorable topographic conditions, and geological units that enhance infiltration. The mean recharge was 466 mm (n = 6), 464 mm (n = 13), 477 mm (n = 14), and 409 mm (n = 12) in the northwest, central, south, and east, respectively. Similarly to WTF, the calculated recharge rate by CMB shows strong spatial variability over the entire study area (Table 3). Recharge at higher elevations (2119 m) is significantly higher than in lowland areas (1775 m), with recharge rates of 816 mm in the highlands and 229 mm in the lowlands, indicating a 3.5 times higher value in the highlands. The estimated chloride concentration resulted in large variability of the computed recharge. Upland areas serve as recharge zones for low-lying areas, where groundwater is continuously replenished by rainfall in high zones, leading to lower chloride concentrations. The average recharge rate decreases from recharge to discharge zones. Conversely, high chloride concentrations accumulate in the subsurface due to evapo-concentration, resulting in lower recharge rates in lowland areas. According to [26] the principle of chloride concentration in forested areas indicates that when rainwater passes through the canopy, it becomes enriched with certain elements due to evaporation from leaves, exudation of chemical compounds from leaves and stems, and the leaching of dry atmospheric deposits. Vegetation therefore disrupts the assumption that chloride behaves conservatively in recharge processes [67]. In other words, the CMB method is less effective in forested land use. The average estimated recharge in the south is slightly higher than in other regions, while average recharge in the east is lower than in other regions of the study area. This is primarily due to the amount of rainfall received in the area and the effect of soil profile on infiltration rates. Topography and rainfall quantity also seem to influence the recharge rate for the CMB, similar to that of the WTF. Spatial variability in the recharge rate is controlled by rainfall amount and intensity, lithology, rock fracturing, soil type, slope gradient, and land use [11,26]. These features characterize the study area, even varying at short distances.
Figure 18 shows the mean recharge rate estimated at different regions of the study area by the CMB and the WTF methods. The small variation between the average results obtained is due to the different assumptions followed for both methods. Both methods were previously effectively used in volcanic aquifers [7,11,39,45]. Considering the average value derived from the WTF method (439 mm) and the estimated surface area of the catchment (approximately 5128 km2), this yields a recharge of approximately 2251.2 × 106 m3 or roughly 71,385 L/s.
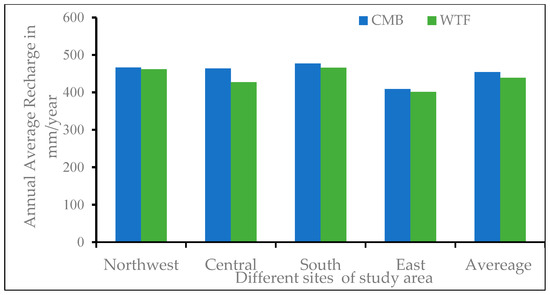
Figure 18.
Average groundwater recharge rate by WTF vs. CMB at different regions.
4.5. Comparison of Recharge Rate Obtained with Other Studies
Groundwater recharge was quantified elsewhere in Ethiopia and its surroundings. These recharge estimates vary widely across regions and methods. Recharge in the current study area was previously quantified at 23.07% (350 mm) and 25.62% (410 mm) of total annual rainfall in the Bulbul sub-catchment, and as mean annual recharge of 313 mm and 314 mm in the Gilgel Gibe catchment, using water balance and baseflow separation techniques [1,39]. These values are lower than the recharge estimates obtained in the present study using WTF and CMB methods. This discrepancy may be attributed to differences in hydrogeological and hydrological conditions at measurement locations, methodological assumptions, and the lack of direct groundwater-level fluctuation data in earlier studies, which relied primarily on weather and streamflow records. According to [68], recharge estimated was reported as 10% of annual rainfall using water balance and base flow separation techniques in southwestern Ethiopia, which is lower when compared to the amount of rainfall received over the area. Estimated recharge was 436 mm by CMB, 400–800 mm by WTF in north-eastern Ethiopia [11], 429 mm and 687 mm by CMB and WTF, respectively, in the volcanic aquifer of Jeju [48]. The highest value by WTF is due to the high permeability of rocks, storage capacity, and the area that comprises the main aquifer of the island. In the Lake Tana of northwest Ethiopia, 125–778 mm by WTF and 346 mm by CMB [54], 434 to 721 mm by WTF [69], 265 by CMB in central Ethiopia [14], 288 mm in northern Ethiopia using CMB [15], in areas of low rainfall, and 592 mm and 326 mm by WTF and CMB, respectively, in the Eshito watershed, southwestern Ethiopia [13] and 100–1600 mm and 280–430 mm by WTF and CMB in the Dangila woreda of northwest Ethiopia [23]. Recent work by Li et al. [18], estimated recharge of up to 22% of rainfall in the Rift Valley Basin, comparable to WTF and CMB estimates. The groundwater recharge estimates obtained in this study using the WTF and CMB methods are within a similar range and agree with the groundwater recharge estimates of previous studies conducted in Ethiopia and elsewhere with the similar characteristics of volcanic aquifers. The mean recharge estimated by both WTF and CMB techniques has a very slight variation when compared over the clustered regions (Figure 18), where the groundwater recharge is influenced by rainfall, topography, lithology and chloride concentration. According to Walraevens et al. [70], the spatial distribution of recharge in volcanic aquifers is influenced primarily by land use in lowland areas, while slope, soil characteristics, and rainfall are the dominant controlling factors in highland regions.
We found that the point estimates by WTF and CMB are effective and comparable in this area. However, there was a certain limitation that may lead to small errors or uncertainties, which will be considered in future work. In CMB, long term data series of chloride concentration and measuring dry deposition of chloride concentration were not considered. Measuring dry deposits of chloride concentration and increasing the sampling number of rainfall can reduce the error in the calculation of recharge estimation. Future work should include specific yield estimation using direct field measurements, geophysical methods, and pumping tests.
4.6. Uncertainties in Recharge Estimates
WTF and CMB methods used for groundwater recharge estimation are subject to various uncertainties and limitations. These uncertainties primarily arise from two aspects: parameter variability and methodological assumptions [71]. A major source of uncertainty in the WTF is from the estimation of specific yield (Sy), a parameter to which the method is highly sensitive [43,71,72,73]. In this study, Sy values were assumed within acceptable range based on local lithological conditions following [49]. Direct field determination of Sy is preferable when resources permit. Variations in specific yield with depth and associated estimation uncertainties may lead to over or underestimation of recharge using the WTF method. For example, sensitivity analysis was conducted for monitored wells W28, and W26, which are located in distinct aquifer materials, to evaluate the influence of Sy uncertainty on recharge estimation. The results indicate that for every 1% variation in Sy, the estimated recharge changes by ap-proximately 45 mm for W28 and 81 mm for W26, highlighting the strong dependence of WTF results on this parameter (Figure 19). WTF also assumes that water level fluctuations are caused only by infiltration of rainfall. However, bank infiltration or fluctuating river stages near the monitoring wells may also influence groundwater levels, potentially leading to overestimation of recharge [43]. Uncertainty may also arise from atmospheric pressure variations, air entrapment, noise in pressure transducer readings, and the computational methods used to determine water level changes [12]. In CMB method, parameters such as variation in rainfall, chloride concentration in rainfall Clp, and effective rainfall (Peff.) play critical roles in the accuracy of recharge estimates. Chloride concentrations may vary over time due to changes in rainfall or evapotranspiration. If evapotranspiration occurs at the water table, the CMB method may underestimate actual recharge, yielding lower net recharge values [74]. Long-term chloride monitoring is important to minimize the influence of stored chloride in the vadose zone prior to recharge [75]. However, in this study, groundwater sampling was conducted only once, which may have introduced such effects into the CMB results. According to [76], rainfall in Ethiopia originates from multiple sources primarily the Atlantic–Indian Ocean during the main rainy season and the Mediterranean Sea during dry seasons leading to temporal variability in rainwater chloride concentration. Although rainwater sampling in this study was limited, seasonal variations were observed, which may affect the estimated recharge values.
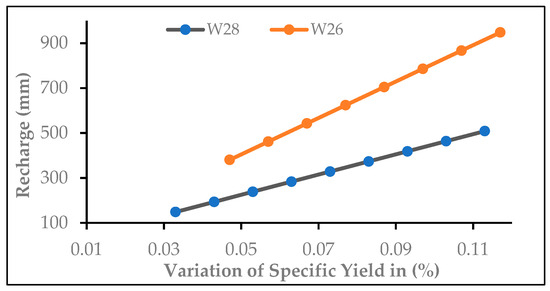
Figure 19.
The effect of specific yield (Sy) on annual recharge estimation.
4.7. Conceptual Model of Groundwater Flow System
The conceptual model provides a synthesized description of the mechanisms governing groundwater flow cycles, elucidating the dynamic and transient behavior of the aquifer system in response to changing boundary conditions. The study area exhibits complex interactions and processes involving various physical variables that regulate groundwater flow dynamics. The developed model integrates components such as the hydrologic cycle (including precipitation and evaporation), topography, geomorphology, geology, hydrogeochemistry, and surface water observations. The conceptual model incorporates thorough analyses of the geological framework, estimating various water budget components such as recharge rates, discharge, and subsurface inflow and outflow.
Groundwater infiltration mainly originates from precipitation with lateral flow towards local or regional drainage base levels, typically represented by rivers in valleys, or vertical recharge into deeper aquifers. Groundwater levels near recharge areas exhibit greater variability compared to those in floodplains and lowland areas. Significant differences in water level fluctuations were observed, with greater fluctuations upstream (8.1 m in W26 and 1.5 m in the W14), while topography and geology affected flow patterns. There is rapid rise in the water table in the wet season and decline in the dry season, particularly in the northern part of the Sentema plateau, indicating potential seepage flow out of the aquifer. Variable topography and geomorphological features govern the direction and velocity of water movement [11].
Groundwater discharge predominantly occurs through seepage and spring discharge, and evapotranspiration (ET) by vegetation (highland), shrub cover, and grassland (lowlands) is also expected. Aquifer discharge primarily happens through diffuse outflow when the water table intersects the surface and drainage along fracture zones. Plenty of springs are found in the highlands, mountain fronts, and valley floors, with discharge ranging from seasonal trickles to continuous high flows surrounding the discharging area (Jimma district). In highland areas, springs are part of local groundwater systems, characterized by relatively modest discharge and low levels of dissolved solids compared to those in mountain-front and valley-floor settings. Springs are distributed in all types of lithological units: fractured (fault), depression, and contact spring types exist in the delimited study area. Highland springs emerge at points where impermeable layers obstruct downward flow (local water table), known as contact springs, or along fault lines where permeable rock or sediment meets less permeable formations downstream, referred to as fault springs. In the geology of the area discussed in Section 3.1, volcanic rock at specific sites of water sources is present in the form of weathered and fractured basalts. Less permeable rock, along with local changes in topographic slope, causes groundwater to accumulate, leading to the formation of contact springs [11].
We selected the Gilgel Gibe (Sentema—Jimma) sub-catchment which contains all characteristic features of the study area to make a cross-section of the hydrogeologic system. This conceptual model integrates the highest elevation of the Sentema highlands with the lowest elevation of the Jimma lowlands, illustrating how groundwater is utilized for various purposes across the region. The selected area of cross-section is a typical example representing recharge and discharge areas to illustrate different lithological compositions that are important in groundwater circulation. Sentema is a potential recharging area for the downstream areas (Jimma and other towns and villages). Utilizing data from monitoring points and drilling logs and considering the interaction of physical features such as topography, geology, and landscape, a cross-section was created from north to south (A to B line, Figure 14). The cross section started from Sentema highland which acts as a surface water divide for both Gilgel Gibe and Dhidhessa catchments and comprises upper Tertiary volcanic rock. This cross-section illustrates potential groundwater flow lines (Figure 20). Based on the results discussed in this study, local and regional groundwater flow lines are outlined according to their feeding and receiving water points as indicated in (Figure 20). The local flow line (short blue arrow) discharge is influenced by precipitation and declines in the dry season, whereas the regional flow line (long pink arrow) is less affected by short-term precipitation and represents the water source of perennial rivers and spring s as well as wetlands and swampy areas (Figure 20).
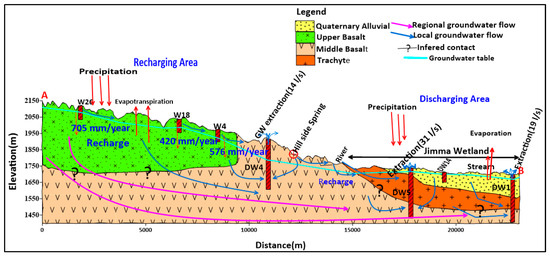
Figure 20.
Schematic and conceptual model of groundwater flow systems and circulation.
In the downstream part, groundwater is the main source of water supply for communities, industries, and institutions, making groundwater exploitation significant. Plenty of wells were drilled in this area, ranging from 6 m (hand-dug) to 360 m deep. These wells are drilled in different geological formations with variable water-bearing materials. Geologically, the highest (recharging) area is located in fractured and permeable volcanic rocks, whereas the lowest (discharging) area has a slightly compacted top clay soil mixed with alluvial deposit. The deep wells in the downstream area are artesian, due to the presence of multiple semi-permeable layers.
5. Conclusions
The study utilizes primary data recorded by researchers through inclusive participation of the local community in scientific endeavors over a two-year period spanning both dry and wet seasons. Seasonal rainfall was found to be the primary contributor to groundwater recharge in the study area, as water level increases were observed only during periods of rainfall. Water level fluctuations show a strong correlation with rainfall amount and season, but their variability is significantly influenced by the topography. Fluctuation of groundwater level in the observed period varied between 0.7 and 8.2 m for monitored wells in the entire study area. Estimating specific yields in volcanic aquifers is highly challenging due to the heterogeneity resulting from geological variation. Chloride concentrations in groundwater and rainfall samples were analyzed, with results indicating that chloride levels are influenced by both topography and evapotranspiration.
Groundwater recharge in the Gilgel Gibe and Upper Dhidhessa catchments was assessed using water table fluctuation and chloride mass balance techniques. The estimated recharge rates ranged from 170 to 850 mm/year with an average of 454 mm/year, accounting for 11–55% of the annual rainfall using the CMB method, and from 76 to 796 mm/year with an average of 439 mm/year, constituting 4 to 43% of annual rainfall using WTF across the entire area. The point estimated recharge rate by the CMB and WTF methods exhibit strong spatial variability across the study area; however, the mean estimated recharge rates show only slight variations. Recharge estimation is strongly controlled by climatic and physiographic factors such as rainfall, topography, lithology, and land use.
The groundwater recharge estimates obtained in this study using the WTF and CMB methods are within a similar range and agree with the groundwater recharge estimates of previous studies conducted in Ethiopia and other areas with similar characteristics of volcanic aquifers. This study demonstrates that estimating groundwater recharge rates using chloride mass balance and water table fluctuation methods is feasible under appropriate devotion to the required assumptions. The attempt to assess groundwater recharge using the hybrid methods of CMB and WTF provides comparable results with very slight variation in mean estimated recharge. However, reducing uncertainty and errors in future work can be achieved by measuring dry deposits of chloride concentration, increasing the number of sampling and monitoring points, and directly estimating the specific yield.
A conceptual model incorporating physical characteristics and collected data has been developed. Further prediction of the potential of groundwater development in the delimited catchment requires knowledge of the current groundwater levels, chemistry, and geologic controls on groundwater storage and flow in the study area. This study significantly enhances the groundwater dataset for the study area, providing critical insights to guide future groundwater development and sustainable water resource management efforts.
Author Contributions
Conceptualization, A.B.K., F.F.F., T.H. and K.W.; Methodology, A.B.K., A.Y., F.F.F., T.H. and K.W.; Software, A.B.K., W.M.K., F.G.T., S.K.D. and F.F.F.; Validation, A.B.K., F.G.T., F.F.F., T.H. and K.W.; Formal analysis, A.B.K., F.F.F., T.H. and K.W.; Investigation, A.B.K., F.F.F., T.H. and K.W.; Resources, A.B.K., W.M.K., B.G.G., T.H. and K.W.; Data curation, A.B.K., F.G.T., W.M.K., B.G.G., S.K.D., T.H. and K.W.; Writing—original draft, A.B.K.; Writing—review and editing, A.B.K., A.Y., F.F.F., T.H. and K.W.; Visualization, A.B.K., T.H. and K.W.; Supervision, F.F.F., T.H. and K.W.; project administration, K.W. and T.H.; Funding acquisition, A.B.K. and K.W. All authors have read and agreed to the published version of the manuscript.
Funding
A.B.K. received funding from the Special Research Fund (BOF) for Developing Countries, Ghent University (BOFDCV2021001102–DOS060-21 BOF), through a sandwich PhD program in collaboration with Jimma University, Ethiopia. F.G.T., W.M.K., B.G.G., and S.K.D. received funding from the NASCERE project to support their research stays at Ghent University.
Data Availability Statement
The original contributions presented in this study are included in the article. Further inquiries can be directed to the corresponding author.
Acknowledgments
The authors would like to thank the Special Research Fund (BOF) for Developing Countries, Ghent University, for providing financial support during this study. The authors gratefully acknowledge the support of Ghent University and Jimma University in facilitating this research through the sandwich PhD program. Special thanks are extended to colleagues at Jimma University for their collaboration during fieldwork and data collection. The authors also appreciate the cooperation and support of local communities, particularly their involvement in data collection, throughout the course of this study.
Conflicts of Interest
The authors declare no conflicts of interest.
References
- Shimelis, A.; Megerssa, O.; Fantahun, A. Estimation of Groundwater Recharge Using Water Balance Model Coupled with Base flow Separation in Bulbul River Catchment of Gilgel-Gibe River Basin, Ethiopia. Asian J. Appl. Sci. Eng. 2014, 3, 41–49. [Google Scholar] [CrossRef]
- Kovalevsky, V.S.; Kruseman, G.P.; Rushton, K.R. Groundwater Studies: An International Guide for Hydrogeological Investigations; UNESCO Digital Library: Paris, France, 2004. [Google Scholar]
- MacDonald, A.M.; Davies, J.A. Brief Review of Groundwater for Rural Water Supply in Sub-Saharan Africa; British Geological Survey Technical Report WC/00/33; BGSKEY: Worth, UK, 2000. [Google Scholar]
- BGS. Hydrogeology of Ethiopia. 2022. Available online: https://earthwise.bgs.ac.uk/index.php/Hydrogeology_of_Ethiopia (accessed on 17 March 2025).
- Melati, M.D.; Fan, F.M.; Athayde, G.B. Groundwater recharge study based on hydrological data and hydrological modelling in a South American volcanic aquifer. Comptes Rendus Geosci. 2019, 351, 441–450. [Google Scholar] [CrossRef]
- Walraevens, K.; Vandecasteele, I.; Martens, K.; Nyssen, J.; Moeyersons, J.; Gebreyohannes, T.; De Smedt, F.; Poesen, J.; Deckers, J.; Van Camp, M. Groundwater recharge and flow in a small mountain catchment in northern Ethiopia. Hydrol. Sci. J. 2009, 54, 739–4753. [Google Scholar] [CrossRef]
- Misstear, B.; Daly, D.; Brown, L. Groundwater Recharge and Its Relationship to River Flow in Ireland. In Proceedings of the Irish National Hydrology Conference 2009, Tullamore, Ireland, 21–22 April 2009; pp. 13–23. [Google Scholar]
- De Vries, J.J.; Simmers, I. Groundwater recharge: An overview of process and challenges. Hydrogeol. J. 2002, 10, 5–17. [Google Scholar] [CrossRef]
- Celalettin, Ş.; Demirkesen, A.C.; Baba, A.; Kumanl, A.; Durukan, S.; Aksoy, N. Estimation groundwater total recharge and discharge using GIS-integrated water level fluctuation method: A case study from the Alaşehir alluvial aquifer Western Anatolia, Turkey. Arab. J. Geosci. 2020, 13, 2–14. [Google Scholar] [CrossRef]
- Saghravani, S.R.; Yusoff, I.; Wan Md Tahir, W.Z.; Othman, Z. Comparison of water table fluctuation and chloride mass balance methods for recharge estimation in a tropical rainforest climate: A case study from Kelantan River catchment, Malaysia. Environ. Earth Sci. 2015, 73, 4419–4428. [Google Scholar] [CrossRef]
- Nigate, F.; Camp, M.V.; Yenehun, A.; Belay, A.S.; Walraevens, K. Recharge–Discharge Relations of Groundwater in Volcanic Terrain of Semi-Humid Tropical Highlands of Ethiopia: The Case of Infranz Springs, in the Upper. Water 2020, 12, 853. [Google Scholar] [CrossRef]
- Scanlon, B.R.; Healy, R.W.; Cook, P.G. Choosing appropriate techniques for quantifying groundwater recharge. Hydrogeol. J. 2002, 10, 18–39. [Google Scholar] [CrossRef]
- Ferede, M.; Haile, A.T.; Walker, D.; Gowing, J.; Parkin, G. Multi-method groundwater recharge estimation at Eshito micro-watershed, Rift Valley Basin in Ethiopia. Hydrol. Sci. J. 2020, 65, 1596–15605. [Google Scholar] [CrossRef]
- Demlie, M.; Wohnlich, S.; Gizaw, B.; Stichler, W. Groundwater recharge in the Akaki catchment, central Ethiopia: Evidence from environmental isotopes (δ18O, δ2H and 3H) and chloride mass balance. Hydrol. Process. 2007, 21, 807–818. [Google Scholar] [CrossRef]
- Gebru, T.A.; Tesfahunegn, G.B. Chloride mass balance for estimation of groundwater recharge in a semi-arid catchment of northern Ethiopia. Hydrogeol. J. 2018, 27, 363–378. [Google Scholar] [CrossRef]
- Bennett, G.; Shemsanga, C.; Kervyn, M.; Walraevens, K. Estimation of groundwater recharge from groundwater level fluctuations and baseflow rates around Mount Meru, Tanzania. Groundw. Sustain. Dev. 2024, 25, 101133. [Google Scholar] [CrossRef]
- Mengistu, T.D.; Chang, S.W.; Kim, I.; Kim, M.; Chung, I. Determination of Potential Aquifer Recharge Zones Using Geospatial Techniques for Proxy Data of Gilgel Gibe. Water 2022, 14, 1362. [Google Scholar] [CrossRef]
- Li, W.; Finsa, M.M.; Houser, P.; Laskeya, K.B.; Bate, R.D. Groundwater recharge estimation in data-limited water-scarce regions. Hydrol. Res. 2025, 56, 439–458. [Google Scholar] [CrossRef]
- Tleane, S.J.; Ndambuki, J.M. Estimation of Groundwater Recharge Using GIS Method: A Case Study of Makotopong Village-Polokwane, South Africa. J. Water Resour. Prot. 2020, 12, 985–1000. [Google Scholar] [CrossRef]
- Ware, H.H.; Mengistu, T.D.; Yifru, B.A.; Chang, S.W.; Chung, I.M. Assessment of Spatiotemporal Groundwater Recharge Distribution Using SWAT-MODFLOW Model and Transient Water Table Fluctuation Method. Water 2023, 15, 2112. [Google Scholar] [CrossRef]
- Dereje, B.; Nedaw, D. Groundwater Recharge Estimation Using WetSpass Modeling in Upper Bilate Catchment, Southern Ethiopia. Momona Ethiop. J. Sci. 2019, 11, 37–51. [Google Scholar] [CrossRef]
- Ashaolu, E.D.; Olorunfemi, J.F.; PaulIfabiy, I.; Abdollahi, K.; Batelaan, O. Spatial and temporal recharge estimation of the basement complex in Nigeria, West Africa. J. Hydrol. Reg. Stud. 2020, 27, 100658. [Google Scholar] [CrossRef]
- Walker, D.; Parkin, G.; Schmitter, P.; Gowing, J.; Tilahun, S.A.; Haile, A.T.; Yimam, A.Y. Insights from a Multi-Method Recharge Estimation Comparison Study. Groundwater 2019, 57, 245–258. [Google Scholar] [CrossRef]
- Thomas, B.F.; Behrangi, A.; Famiglietti, J.S. Precipitation intensity effects on groundwater recharge in the southwestern United States. Water 2016, 8, 90. [Google Scholar] [CrossRef]
- Allison, G.B.; Hughes, M.W. The use of environmental chloride and tritium to estimate total recharge to an unconfined aquifer. Soil Res. 1978, 16, 181–2195. [Google Scholar] [CrossRef]
- Ait El Mekki, O.; Laftouhi, N.E.; Hanich, L. Estimate of regional groundwater recharge rate in the Central Haouz Plain, Morocco, using the chloride mass balance method and a geographical information system. Appl. Water Sci. 2015, 7, 1679–1688. [Google Scholar] [CrossRef][Green Version]
- Walker, D.; Forsythe, N.; Parkin, G.; Gowing, J. Filling the observational void: Scientific value and quantitative validation of hydrometeorological data from a community-based monitoring programme. J. Hydrol. 2016, 538, 713–725. [Google Scholar] [CrossRef]
- Nigussie, L.; Haile, A.T.; Gowing, J.; Walker, D.; Parkin, G. Citizen Science in Community-Based Watershed Management: An Institutional Analysis in Ethiopia; IWMI Working Papers; International Water Management Institute (IWMI): Colombo, Sri Lanka, 2020; 25p. [Google Scholar]
- Dadi, L.S.; Berhane, M.; Ahmed, Y.; Gudina, E.K.; Berhanu, T.; Kim, K.H. Maternal and newborn health services utilization in Jimma Zone, Southwest Ethiopia: A community based cross-sectional study. BMC Pregnancy Childbirth 2019, 19, 178. [Google Scholar] [CrossRef]
- Woodroofe, R. Omo-gibe River basin integrated development master plan study final Report Vol. In VI Water Resources Surveys and Inventories; Ministry of Water Resources: Addis Ababa, Ethiopia, 1996. [Google Scholar]
- Alemayehu, T. Groundwater Occurrence in Ethiopia; Addis Ababa University: Addis Ababa, Ethiopia, 2006. [Google Scholar]
- Bayou, W.T.; Mohammed, M.; Ayenew, T.; Mebrahtu, T.K.; Wohnlich, S. Hydrochemistry and isotope hydrology of groundwater and surface water in the Sor and Gebba watershed, southwestern Ethiopia. Environ. Earth Sci. 2024, 83, 316. [Google Scholar] [CrossRef]
- Karra, K.; Kontgis, C.; Statman-Weil, Z.; Mazzariello, J.C.; Mathis, M.; Brumby, S.P. Global land use/land cover with Sentinel 2 and deep learning. In Proceedings of the 2021 IEEE International Geoscience and Remote Sensing Symposium IGARSS, Brussels, Belgium, 11–16 July 2021; pp. 4704–4707. [Google Scholar]
- Gemeda, D.O.; Feyssa, D.H.; Garedew, W. Meteorological data trend analysis and local community perception towards climate change: A case study of Jimma City, Southwestern Ethiopia. Environ. Dev. Sustain. 2021, 23, 5885–5903. [Google Scholar] [CrossRef]
- Davidson, A. The Omo River Project: Reconnaissance Geology and Geochemistry of Parts of Ilubabor, Kefa, Gemu Gofa and Sidamo, Ethiopia; Institute of Geological Surveys, Ministry of Mines and Energy: Addis Ababa, Ethiopia; Ethiopian Institute of Geological Surveys: Addis Ababa, Ethiopia, 1983.
- Regassa, A.; Van Daele, K.; De Paepe, P.; Dumona, M.; Deckers, J.; Asrat, A.; Van Ranst, E. Characterizing weathering intensity and trends of geological materials in the Gilgel Gibe catchment, southwestern Ethiopia. J. Afr. Earth Sci. 2014, 99, 568–580. [Google Scholar] [CrossRef]
- Haro, W.; Asamnew, B.; Daba, B.; Fekadu, B.; Edris, M. Geology, Geochemistry, and Gravity Survey of Jima Area; Geological Survey of Ethiopia: Addis Ababa, Ethiopia, 2012.
- Mohr, P.A. Regional Significance of Volcanic Geochemistry in the Afar Triple Junction, Ethiopia; NASA: Washington, DC, USA, 1971; Volume 27.
- Tufa, F.G.; Feyissa, F.F.; Kebede, A.B.; Gudeta, B.G.; Kitessa, W.M.; Debela, S.K.; Tumsa, B.C.; Yenehun, A.; Van Camp, M.; Walraevens, K. Estimation of Groundwater Recharge in a Volcanic Aquifer System Using Soil Moisture Balance and Baseflow Separation Methods: The Case of Gilgel Gibe Catchment, Ethiopia. Hydrology 2024, 11, 109. [Google Scholar] [CrossRef]
- Tadesse, N. Hydrogeology of Jimma Area; Addis Ababa University: Addis Ababa, Ethiopia, 1994. [Google Scholar]
- Kebede, S. Groundwater in Ethiopia: Features, Numbers and Opportunities. Groundwater in Ethiopia: Features, Numbers and Opportunities; Springer Science & Business Media: Berlin/Heidelberg, Germany, 2013; 285p. [Google Scholar]
- John, R.; Nimmo, J.R.; Horowitz, C.; Mitchell, L. Discrete-Storm Water-Table Fluctuation Method to Estimate Episodic Recharge. Groundwater 2015, 53, 282–292. [Google Scholar]
- Healy, R.W.; Cook, P.G. Using groundwater levels to estimate recharge. Hydrogeol. J. 2002, 10, 91–109. [Google Scholar] [CrossRef]
- Takounjou, A.F.; Ngoupayou, J.R.N.; Riotte, J.; Takem, G.E.; Mafany, G.; Maréchal, J.C.; Ekodeck, G.E. Estimation of groundwater recharge of shallow aquifer on humid environment in Yaounde, Cameroon using hybrid water-fluctuation and hydrochemistry methods. Environ. Earth Sci. 2011, 64, 107–118. [Google Scholar] [CrossRef]
- Demlie, M. Assessment and estimation of groundwater recharge for a catchment located in highland tropical climate in central Ethiopia using catchment soil–water balance (SWB) and chloride mass balance (CMB) techniques. Environ. Earth Sci. 2015, 74, 1137–1150. [Google Scholar] [CrossRef]
- Barua, S.; Cartwright, I.; Dresel, P.E.; Daly, E. Using multiple methods to understand groundwater recharge in a semi-arid area. Hydrol. Earth Syst. Sci. 2020, 143, 1–40. [Google Scholar]
- Obuobie, E.; Diekkrueger, B.; Agyekum, W.; Agodzo, S. Groundwater level monitoring and recharge estimates in the White Volta River basin of Ghana. J. Afr. Earth Sci. 2012, 71–72, 80–86. [Google Scholar] [CrossRef]
- Hagedorn, B.; El-Kadi, A.I.; Mair, A.; Whittier, R.B.; Ha, K. Estimating recharge in fractured aquifers of a temperate humid to semiarid volcanic island (Jeju, Korea) from water table fluctuations, and Cl, CFC-12 and 3H chemistry. J. Hydrol. 2011, 409, 650–662. [Google Scholar] [CrossRef]
- Johnson, A.I. Compilation of Specific Yields for Various Materials-Hydrologic Properties of Earth Materials; Geological Survey Water-Supply Paper 1662-D; California; United States Government Printing Office: Washington, DC, USA, 1967.
- Adji, T.N. Application of Water Table Fluctuation Method to Quantify Spatial Groundwater Recharge Within the Southern Slope of Merapi Volcano, Indonesia. Indones. J. Geogr. 2007, 39, 157–171. [Google Scholar]
- Eriksson, E.; Khunakasem, V. Chloride concentration in groundwater, recharge rate and rate of deposition of chloride in the Israel Coastal Plain. J. Hydrol. 1969, 7, 178–197. [Google Scholar] [CrossRef]
- Warren, W.; Wood, W.E.S. Chemical and Isotopic Methods for Quantifying Ground-Water Recharge in a Regional, Semiarid Environment. Ground Water 1995, 33, 458–486. [Google Scholar]
- Somaratne, N.; Smettem, K.R.J. Theory of the generalized chloride mass balance method for recharge estimation in groundwater basins characterised by point and diffuse recharge. Hydrol. Earth Syst. Sci. 2014, 11, 307–332. [Google Scholar]
- Yenehun, A.; Dessie, M.; Nigate, F.; Belay, A.S.; Azeze, M.; Camp, M.V.; Taye, D.F.; Kidane, D.; Adgo, E.; Nyssen, J.; et al. Spatial and temporal simulation of groundwater recharge and cross-validation with point estimations in volcanic aquifers with variable topography. J. Hydrol. Reg. Stud. 2022, 42, 101142. [Google Scholar] [CrossRef]
- Singh, S.K.M.; Singh, V.P. Soil Conservation Service Curve Number (SCS-CN) Methodology; Water Science & Technology Library; Springer Science & Business Media: Berlin/Heidelberg, Germany, 2013. [Google Scholar]
- Ethiopian Roads Authority (ERA). Drainage Design Manual-2013; ERA: Addis Ababa, Ethiopia, 2013.
- Delin, G.N.; Healy, R.W.; Lorenz, D.L.; Nimmo, J.R. Comparison of local- to regional-scale estimates of ground-water recharge in Minnesota, USA. J. Hydrol. 2007, 334, 231–249. [Google Scholar] [CrossRef]
- AI-Turbak, A.S.; AI-Hassoun, S.A.; AI-Othman, A.A. Determination of Unconfined Aquifer Parameters Using Boulton, Neuman and Streltsova Methods. J. King Saud. Univ.-Eng. Sci. 1993, 5, 155–169. [Google Scholar] [CrossRef]
- Lutz, A.; Minyila, S.; Saga, B.; Diarra, S.; Apambire, B.; Thomas, J. Fluctuation of groundwater levels and recharge patterns in Northern Ghana. Climate 2015, 3, 1–15. [Google Scholar] [CrossRef]
- Belay, A.S.; Yenehun, A.; Nigate, F.; Tilahun, S.A.; Dessie, M.; Moges, M.M.; Chen, M.; Derbew Fentie, D.; Adgo, E.; Nyssen, J.; et al. Estimation of spatially distributed groundwater recharge in data-scarce regions. J. Hydrol. Reg. Stud. 2024, 56, 102072. [Google Scholar] [CrossRef]
- Allocca, V.; Manna, F.; De Vita, P. Estimating annual groundwater recharge coefficient for karst aquifers of the southern Apennines (Italy). Hydrol. Earth Syst. Sci. 2014, 18, 803–817. [Google Scholar] [CrossRef]
- Park, E.; Jeong, J.; Choung, S. A Method for Integrating Delayed Recharge Flux Through Unsaturated Zones into Analytical and Numerical Groundwater Flow Modeling Water Resources Research. Water Resour. Res. 2020, 57, e2020WR027655. [Google Scholar] [CrossRef]
- Vanum, G.; Hailu, G. Identification of Groundwater Type and Recharge Estimation Through Hydrochemical Analyis: A Case Study in Ayanalem Well Field, Northern Ethiopia. Int. J. Phys. Soc. Sci. 2012, 2, 578–595. [Google Scholar]
- Segobaetso, T.K.; Tafesse, N.T.; Mapeo, R.B.M.; Laletsang, K. Groundwater recharge using the chloride mass balance method in the Kanye area, in southeast Botswana. J. Afr. Earth Sci. 2022, 193, 104534. [Google Scholar] [CrossRef]
- Edmunds, W.M.; Darling, W.G.; Kinniburgh, D.G.; Kotoub, S.; Mahgoub, S. Sources of recharge at Abu Delaig, Sudan. J. Hydrol. 1992, 131, 1–24. [Google Scholar] [CrossRef]
- Edmunds, W.M.; Gaye, C.B. Estimating the spatial variability of groundwater recharge in the Sahel using chloride. J. Hydrol. 1994, 156, 47–59. [Google Scholar] [CrossRef]
- Kopáček, J.; Hejzlar, J.; Porcal, P.; Posch, M. A mass-balance study on chloride fluxes in a large central European catchment during 1900–2010. Biogeochemistry 2014, 120, 319–335. [Google Scholar] [CrossRef]
- Agezew, T.; Wegu, M.; Alemnew, K. Hydrogeological and Hydrochemical Mapping of Jimma; Geological Survey of Ethiopia: Addis Ababa, Ethiopia, 2015.
- Mutoti, M.I. Estimating Groundwater Recharge Using Chloride Mass Balance in the Upper Berg River Catchment, South Africa; University of the Western Cape: Cape Town, South Africa, 2015. [Google Scholar]
- Walraevens, K.; Bennett, G.; Alfarrah, N.; Gebreyohannes, T.; Berhane, G.; Hagos, M.; Hussien, A.; Nigate, F.; Belay, A.S.; Birhanu, A.; et al. Assessing the Potential of Volcanic and Sedimentary Rock Aquifers in Africa: Emphasizing Transmissivity, Water Quality, and Recharge as Key Evaluation Metrics. Water 2025, 17, 109. [Google Scholar] [CrossRef]
- Wang, W.; Xia, Y.; Sun, J.; Liu, Y.; Li, P.; Han, F.; Li, Z. Uncertainties in physical and tracer methods in actual groundwater recharge estimation in the thick loess deposits of China. J. Hydrol. 2024, 634, 131127. [Google Scholar] [CrossRef]
- Penner, G.C.; Araujo Martins, R.T.A.; Rodrigues, S.; Wendland, E. Uncertainty in groundwater recharge estimation using groundwater level fluctuation and aquifer test. Braz. J. Water Resour. 2023, 28, 2318–2331. [Google Scholar] [CrossRef]
- Yenehun, A.; Nigate, F.; Belay, A.S.; Desta, M.T.; Camp, M.V.; Walraevens, K. Groundwater recharge and water table response to changing conditions for aquifers at different physiography: The case of a semi-humid river catchment, northwestern highlands of Ethiopia. Sci. Total Environ. 2020, 748, 142243. [Google Scholar] [CrossRef]
- Ian Cartwrighta, I.; Morgensternb, U.; Hofmannc, H.; Gilfedder, B. Comparisons and uncertainties of recharge estimates in a temperate alpine catchment. J. Hydrol. 2020, 590, 125558. [Google Scholar] [CrossRef]
- Aishlin, P.; Mcnamara, J.P. Bedrock infiltration and mountain block recharge accounting using chloride mass balance. Hydrol. Process. 2011, 25, 1934–1948. [Google Scholar] [CrossRef]
- Tekleab, S.; Wenninger, J.; Uhlenbrook, S. Characterization of stable isotopes to identify residence times and runoff components in two meso-scale catchments in the Abay/Upper Blue Nile basin, Ethiopia. Hydrol. Earth Syst. Sci. 2014, 18, 2415–2431. [Google Scholar] [CrossRef]


Disclaimer/Publisher’s Note: The statements, opinions and data contained in all publications are solely those of the individual author(s) and contributor(s) and not of MDPI and/or the editor(s). MDPI and/or the editor(s) disclaim responsibility for any injury to people or property resulting from any ideas, methods, instructions or products referred to in the content. |
© 2025 by the authors. Licensee MDPI, Basel, Switzerland. This article is an open access article distributed under the terms and conditions of the Creative Commons Attribution (CC BY) license (https://creativecommons.org/licenses/by/4.0/).