Article

Optimization of Synergistic Water Resources, Water Environment, and Water Ecology Remediation and Restoration Project: Application in the Jinshan Lake Basin

1
Guizhou Wujiang Science and Technology of Laboratory Co., Ltd., Guiyang 550000, China
2
School of Resource and Environmental Sciences, Wuhan University, Wuhan 430079, China
3
Central-Southern Safety & Environment Technology Institute Co., Ltd., Wuhan 430061, China
4
China Institute of Development Strategy and Planning, Wuhan University, Wuhan 430079, China
5
State Key Laboratory of Water Resources and Hydropower Engineering Science, Wuhan University, Wuhan 430072, China
*
Author to whom correspondence should be addressed.
Water 2025, 17(20), 2986; https://doi.org/10.3390/w17202986
Submission received: 21 August 2025 / Revised: 18 September 2025 / Accepted: 1 October 2025 / Published: 16 October 2025
(This article belongs to the Section Water Resources Management, Policy and Governance)

Abstract

The concept of synergistic water resources, water environment, water ecology remediation, and restoration (3WRR) is essential for addressing the interlinked challenges of water scarcity, pollution, and ecological degradation. An intelligent platform of remediation and restoration project optimization was developed, integrating multi-source data fusion, a coupled air–land–water model, and dynamic decision optimization to support 3WRR in river basins. Applied to the Jinshan Lake Basin (JLB) in China’s Greater Bay Area, the platform assessed 894 scenarios encompassing diverse remediation and restoration plans, including point/non-point source reduction, sediment dredging, recycled water reuse, ecological water replenishment, and sluice gate control, accounting for inter-annual meteorological variability. The results reveal that source control alone (95% reduction in point and non-point loads) leads to limited improvement, achieving less than 2% compliance with Class IV water quality standards in tributaries. Integrated engineering–ecological interventions, combining sediment dredging with high-flow replenishment from the Xizhijiang River (26.1 m3/s), increases compliance days of Class IV water quality standards by 10–51 days. Concerning the lake plans, including sluice regulation and large-volume water exchange, the lake area met the Class IV standard for COD, NH3-N, and TP by over 90%. The platform’s multi-objective optimization framework highlights that coordinated, multi-scale interventions substantially outperform isolated strategies in both effectiveness and sustainability. These findings provide a replicable and data-driven paradigm for 3WRR implementation in complex river–lake systems. The platform’s application and promotion in other watersheds worldwide will serve to enable the low-cost and high-efficiency management of watershed water environments.

1. Introduction

The concept of synergistic water resources, water environment, and water ecology remediation and restoration (3WRR) is emerging as a critical paradigm for addressing the interconnected challenges of water security, pollution control, and ecosystem sustainability [1,2]. In river basins worldwide, climate variability, intensive human activities, and fragmented management approaches have exacerbated water scarcity and degraded aquatic ecosystems [3,4,5,6]. Traditional single strategies focusing on isolated aspects such as wastewater treatment or flood control often fail to resolve imbalances across the water quantity–quality–ecology nexus [7]. Consequently, achieving effective 3WRR necessitates innovative frameworks capable of synergizing natural–socioeconomic dynamics and engineering interventions through data-driven, model-supported decision-making to reconcile competing demands [8,9].
From the perspective of synergistic water resources, water environment, and water ecology, various plans, such as water conservation and capacity increase, pollution control, and ecological restoration, are combined to formulate a coordinated, multi-objective remediation and restoration project [2]. However, there are still many issues to address, such as large amounts of data integration and matching, large simulation calculation workloads, low efficiency, and difficulty in decision-making due to the diversity of projects [10,11,12]. With the rapid development of monitoring technologies in the big data era, ecological and environmental datasets have expanded dramatically, ranging from terabytes to petabytes, which encompass raw data such as digital elevation models (DEM), flow rate, water level, pollutant discharge, precipitation, wind speed, and solar radiation, along with derived or processed data such as regulation measures and simulation results [13,14]. However, the inconsistent spatial–temporal resolutions and diverse formats of these multi-source datasets pose significant challenges for 3WRR, which typically require harmonized timescales and structured inputs for effective data fusion and utilization [15,16,17]. Much of the existing research in the environmental field focuses on data assimilation and fusion within isolated domains, such as land surface, hydrological, or groundwater models, and is often limited to weak coupling architectures [18,19,20,21,22]. For example, real-time hourly data assimilation tools were designed to make an operational flood-forecasting system [23]. Chen et al. [10] designed a multi-level, multi-center, and comprehensively distributed database and a General Database Engine (GDBE) that offers a unified structure and consistent interface for direct data access and integration to address heterogeneous data formats and integration challenges such as for Excel, Oracle, SQL Server, and MongoDB. Model coupling technologies have evolved to address the increasing demands of simulating interlinked water processes. Water environmental and ecological changes involve complex, nonlinear interactions across the entire water cycle, from the atmosphere to land surfaces, surface water, and groundwater, requiring multi-process coupling models for accurate simulation [24,25,26,27]. Currently, various models adopt a subprocess coupling approach, such as coupled meteorological–hydrological models, hydrology–hydrodynamics models, or hydrodynamics–water quality models [28,29], where the mismatch of spatial and temporal scales among different submodels has become a key technical limiting model integration and simulation accuracy [30,31]. To address the problems of insufficient coupling and scale incompatibility, Zhang et al. [1] developed a coupled “air–land–water” model, which incorporates processes such as hydrology, hydrodynamics, hydrochemistry, atmospheric dynamics, and land cover change, as well as pollutant transport and transformation, aquatic organism migration and disappearance, and energy exchange. In addition, it supports parallel computing technologies, significantly improving simulation efficiency and reducing computational time.
Despite advances in data integration and model coupling, effective decision-making for 3WRR still faces considerable challenges due to the complexity, diversity, and uncertainty of remediation and restoration projects and their impacts. These projects often involve multiple objectives, such as optimizing water resource allocation, improving water quality level, and enhancing ecological resilience, which must be tailored to specific spatiotemporal conditions and environmental constraints. Multi-objective decision-making methods and optimization algorithms, such as genetic algorithms and Pareto-based strategies, have been widely applied with hydrological and water quality models to identify optimal project combinations and analyze trade-offs among competing objectives [32,33,34]. However, most optimization studies focus on individual model domains or simplified planning schemes, often constrained by high computational costs, static model structures, and limited feedback from real-time or scenario-based simulations [35]. Integrated decision support platforms have been proposed to allow for dynamic scenario analysis, real-time feedback, and visualized decision guidance, supporting both strategic planning and adaptive management. Zhang et al. [1] proposed a multi-center cloud platform architecture and developed the Intelligent Management Cloud Platform for Precise Control of the Water Environment in River Basins, which has the advantages of integrating large-scale data fusion management and efficient multi-process calculation, as well as personalized services with characteristics such as data sharing and load balancing of computing resources [1,10]. It is widely applied in the Three Gorges Reservoir [36,37], the Middle-Low Hanjiang River [38,39], and Taihu Lake [40] to study and address water environmental and ecological issues in river basins. Therefore, further expanding and improving the platform’s capabilities in scheme optimization will enable effective application of remediation and restoration projects and guide actual cases.
The Jinshan Lake Basin (JLB), located in Huizhou City of Guangdong Province, lies in the middle and lower reaches of the Dongjiang River and features a complex river–lake network, the upper reaches of which are dominated by agriculture, and the lower reaches are highly urbanized. Extensive unregulated domestic wastewater discharge and serious non-point source pollution have led to long-term pollutant accumulation and the formation of contaminated sediments, which has significantly weakened the self-purification capacity and caused degradation of the aquatic ecosystem [41,42]. In order to explore the ecological environment of the region, a coupled air–land–water model system was previously developed for the basin, and the simulation results showed its capability to simulate pollution loads and water quality dynamics under multiple driving factors, with relative errors of runoff (<5%), chemical oxygen demand (COD), and total phosphorus (TP) within 15% [43,44]. The model provided a solid foundation for 3WRR in the basin. This study focuses on the JLB to achieve the goal of coordinated and efficient utilization of 3WRR. It develops (1) an intelligent platform for remediation and restoration project optimization and (2) sets out the full-chain application of multiple remediation and restoration projects’ assessment and optimization.

2. Methodology: Intelligent Platform of Remediation and Restoration Project Optimization

2.1. Platform Architecture

The platform adopts a hierarchical cloud–edge–terminal layer (3L) architecture integrated with a data center, a model center, a control center, and a service center (i.e., four functional centers (4C)), the design of which ensures efficient data flow, high-fidelity simulation, and multi-objective decision optimization. The terminal layer deploys Internet of Things sensors for real-time collection of meteorological, hydrological, and water quality data; the edge layer preprocesses raw data, corrects anomalies, and standardizes spatial–temporal formats; and the cloud layer uses distributed computing clusters for large-scale model simulations, utilizing parallel algorithms to accelerate calculations. The four centers operate synergistically, with the data center managing multiple sources of information, the model center performing coupled simulations, the control center orchestrating workflows and resource allocation, and the service center providing users with scenario visualization and decision-making outputs (the platform is currently at version 1.0) [10,43].

2.2. Multi-Source Data Fusion

The data integration framework solves the technical difficulties caused by the spatial–temporal variability of natural process data and the challenges posed by fragmented socioeconomic data structure conflicts through linear interpolation, aggregation technology, and automatic matrix conversion algorithms. Petabyte-scale datasets volume scalability is achieved through Gluster 11.2 distributed storage, which partitions data to edge-cloud nodes to reduce transmission load and network overhead [42,43]. The data integration framework provides powerful computing and data management capabilities, enabling the integration of massive datasets required for large-scale watershed water remediation and restoration projects, including hydrological monitoring, ecological monitoring, water quality monitoring, land use change, and socioeconomic data. It supports the entire data lifecycle in environmental remediation and engineering applications, providing a solid foundation for tasks, such as water ecological restoration and pollution control effectiveness assessment, scientific justification for restoration measures, and the optimization of restoration strategies. The architecture offers sufficient performance and adaptability to meet the complex data demands of 3WRR projects.

2.3. Model Coupling

The 3WRR decision-making model system consists of integrated numerical models for meteorology, hydrology, hydrodynamics–water quality, and water ecology processes, which includes meteorological models, land non-point source models, hydrodynamics–water quality–water ecology coupled models, water environment quality assessment models, and comprehensive decision support models [1,2,10]. The meteorological model provides meteorological conditions for the land non-point source model, the hydrodynamic–water quality–water ecology coupled model, and the water environment quality assessment model. The simulation results of the land non-point source model serve as the lateral flow conditions for the hydrodynamic–water quality–water ecology model, enabling coupled calculations between the land non-point source model and the hydrodynamic–water quality–water ecology coupled model. The hydrodynamic–water quality–water ecology coupled model consists of the Saint-Venant equation system, pollutant transport and transformation model, algal growth dynamics model, phosphorus cycle model, nitrogen cycle model, and dissolved oxygen balance model [39]. Based on the hydrological and water quality processes simulated by the hydrodynamic–water quality–water ecology coupled model, the water environment quality assessment model evaluates the current water environment status of water in the watershed, as changes in water quantity, water quality, and water ecology processes before and after engineering implementation and under planning schemes. This system can simulate the entire water cycle process in a watershed, enabling systematic simulation and the coordinated regulation of multiple elements, processes, and objectives within the watershed. It provides a robust foundation for the scientific formulation of comprehensive watershed management and ecological restoration strategies.

2.4. Dynamic Decision Optimization

The decision-making optimization model, based on real-time monitoring and satellite remote sensing data, simulates results to determine whether water quantity, water quality, and water ecology meet environmental quality standards. For water bodies that do not meet standards, the model considers the spatiotemporal distribution characteristics, the actual conditions of the watershed, and the feasibility of decision-making schemes. It develops different 3WRR projects from hydraulic improvement, the enhancement of water environment carrying capacity, and the reduction in eutrophication levels (Figure 1). The model simulates and analyzes the improvement effects of different 3WRR projects after implementation, uses the expected variance ranking method for comprehensive ranking, and selects the optimal comprehensive control plan.

3. Results and Discussion

3.1. Study Area

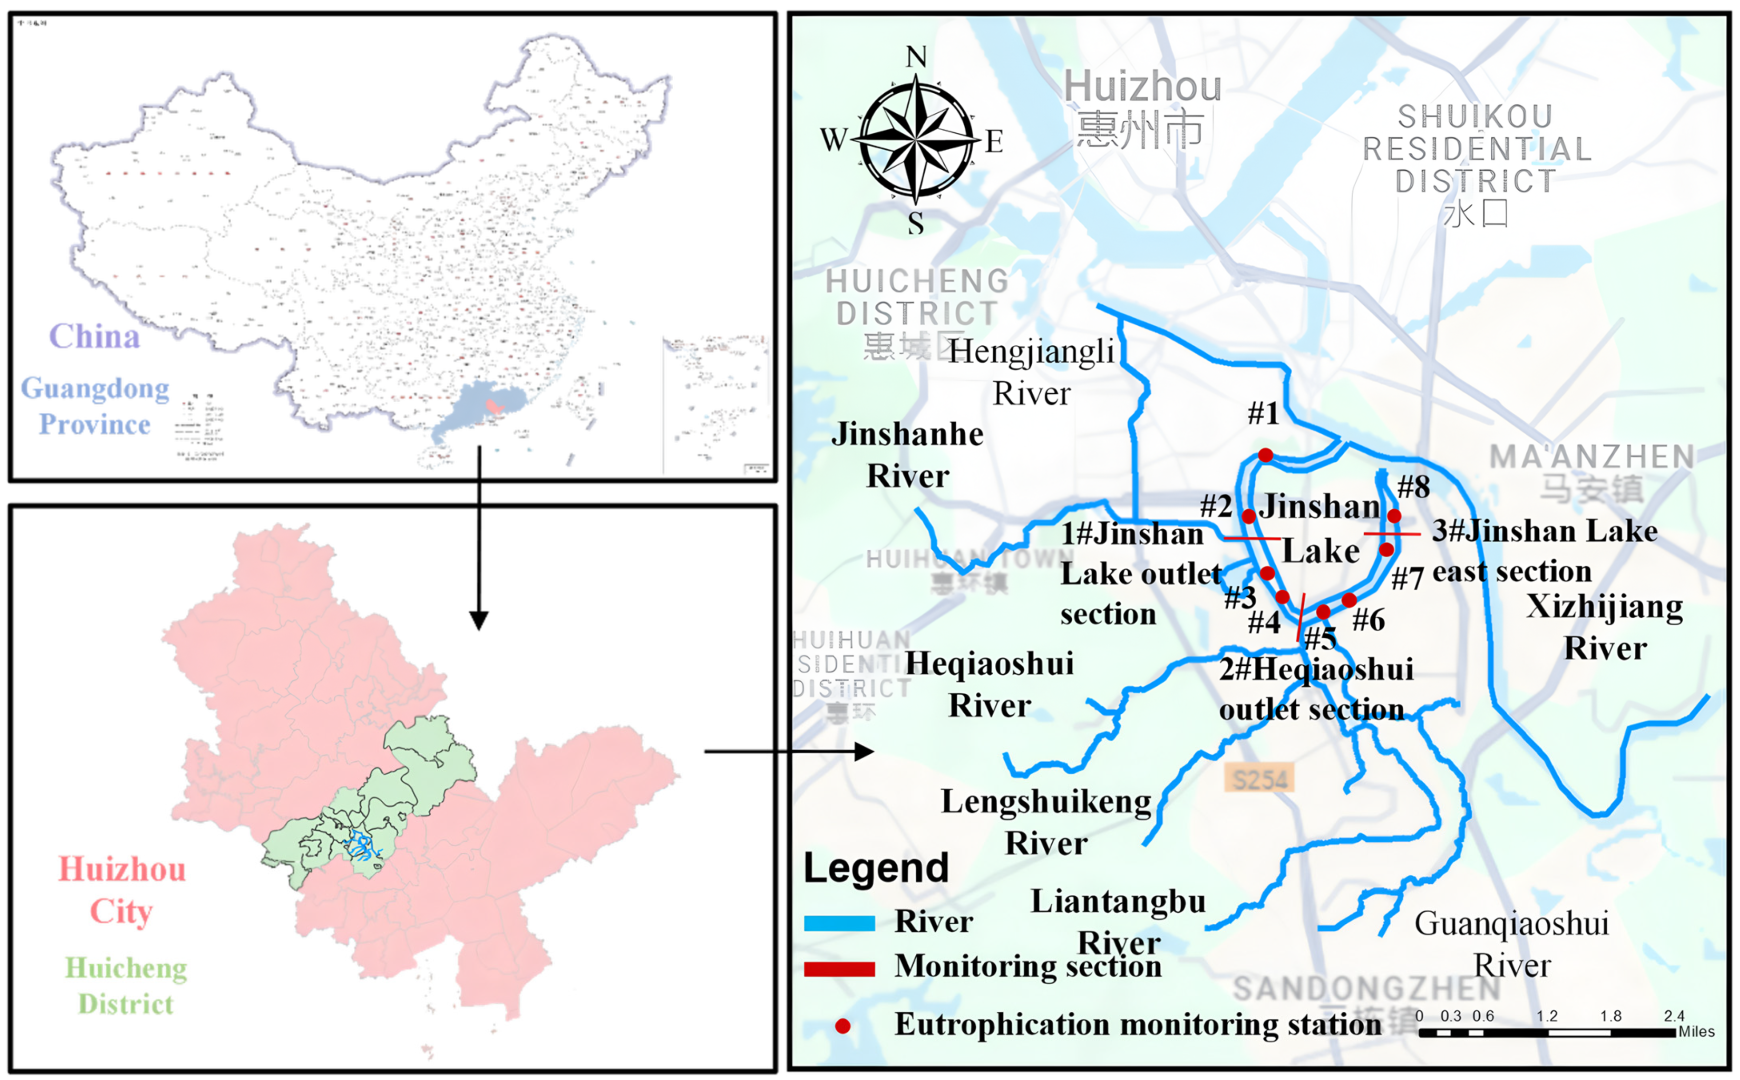
The Jinshan Lake Basin, situated within the Guangdong–Hong Kong–Macao Greater Bay Area, exhibits a complex river–lake hydrological system with four major tributaries: Jinshan River (JSR), Liantangbu (LTB), Heqiaoshui (HQS), and Lengshuikeng (LSK) (Figure 2). The basin features distinct upstream agricultural zones and downstream urbanized areas. This spatial heterogeneity intensifies anthropogenic pressures, including high-density residential settlements, industrial activities, and agricultural operations, which collectively drive significant water quality challenges. The basin topography, characterized by gentle slopes in lacustrine zones and steeper gradients in tributary headwaters, creates varied hydrodynamic conditions that influence pollutant transport and retention dynamics [43]. The Jinshan Lake watershed originates in the mountainous areas, with the middle and lower reaches being urbanized regions. The proportion of impermeable surface in the urbanized areas is high, and the river channels belong to ancient river courses, exhibiting prominent canalization. The exchange between surface water and groundwater is primarily concentrated in the upstream mountainous areas. In contrast, the exchange between surface water and groundwater in the middle and lower reaches has a minimal impact on surface water quality. Studies indicate that groundwater in the Jinshan Lake basin exists in two forms: karst fissure water from carbonate rocks and bedrock fissure water. The presence of these two types of fissure water further slows down the exchange between surface water and groundwater [45]. The basin implements Class IV water quality standards. The Class IV water standard, as defined by China’s Surface Water Environmental Quality Standards, primarily applies to areas designated for general industrial use and recreational waters where direct human contact is not expected. The water quality parameters include, for example, COD ≤ 20 mg/L and ammonia nitrogen (NH3-N) ≤ 1.5 mg/L.
The basin experiences pronounced hydrological seasonality, with wet-season (April–September) runoff accounting for 75–80% of annual flow. This seasonality creates dual challenges: low-flow periods (October–March) exacerbate water stagnation and eutrophication risks, while high-intensity rainfall events trigger combined sewer overflows and pollutant flushing. Historical monitoring data (2015–2020) indicate chronic non-compliance with Class IV water quality standards, particularly for TP (exceeding 0.3 mg/L at 90% of monitoring stations) and ammonia nitrogen (NH3-N, exceeding 1.5 mg/L at 70% of stations). These conditions have precipitated frequent algal blooms, with chlorophyll-a concentrations peaking at 80 μg/L in lacustrine zones during thermal stratification periods. The treatment of black and odorous water bodies is a priority in Jinshan Lake Basin.

3.2. Jinshan Lake Basin Platform

The Jinshan Lake Basin Platform was developed based on the 3L4C platform architecture. The database, integrating DEM, land use, soil, meteorological, hydrological, water quality, ecological, socioeconomic, and 3WRR projects data (e.g., pollution source control and interception, and ecological water replenishment) with data sources, is detailed in Table 1. A 30 m resolution DEM was used to delineate the basin into 153 subcatchments. The four main tributaries flowing into the lake were configured, with a total of 75 topographic sections. For the lake area, a two-dimensional orthogonal grid system was established, consisting of 46,624 computational cells with a horizontal resolution of 20 m × 20 m, as illustrated in Figure 3.
Model parameters were calibrated using remotely sensed water quality inversion results from August 2017 and December 2018. Validation was conducted against measured discharge data at hydrometric cross-sections and water quality monitoring data from January 2019, yielding relative errors of less than 5% for water quantity and within 15% for COD and TP, demonstrating satisfactory model accuracy [43,44]. The data collected during the sampling period is categorized into three types: wet (P10), normal (P50), and dry (P90).
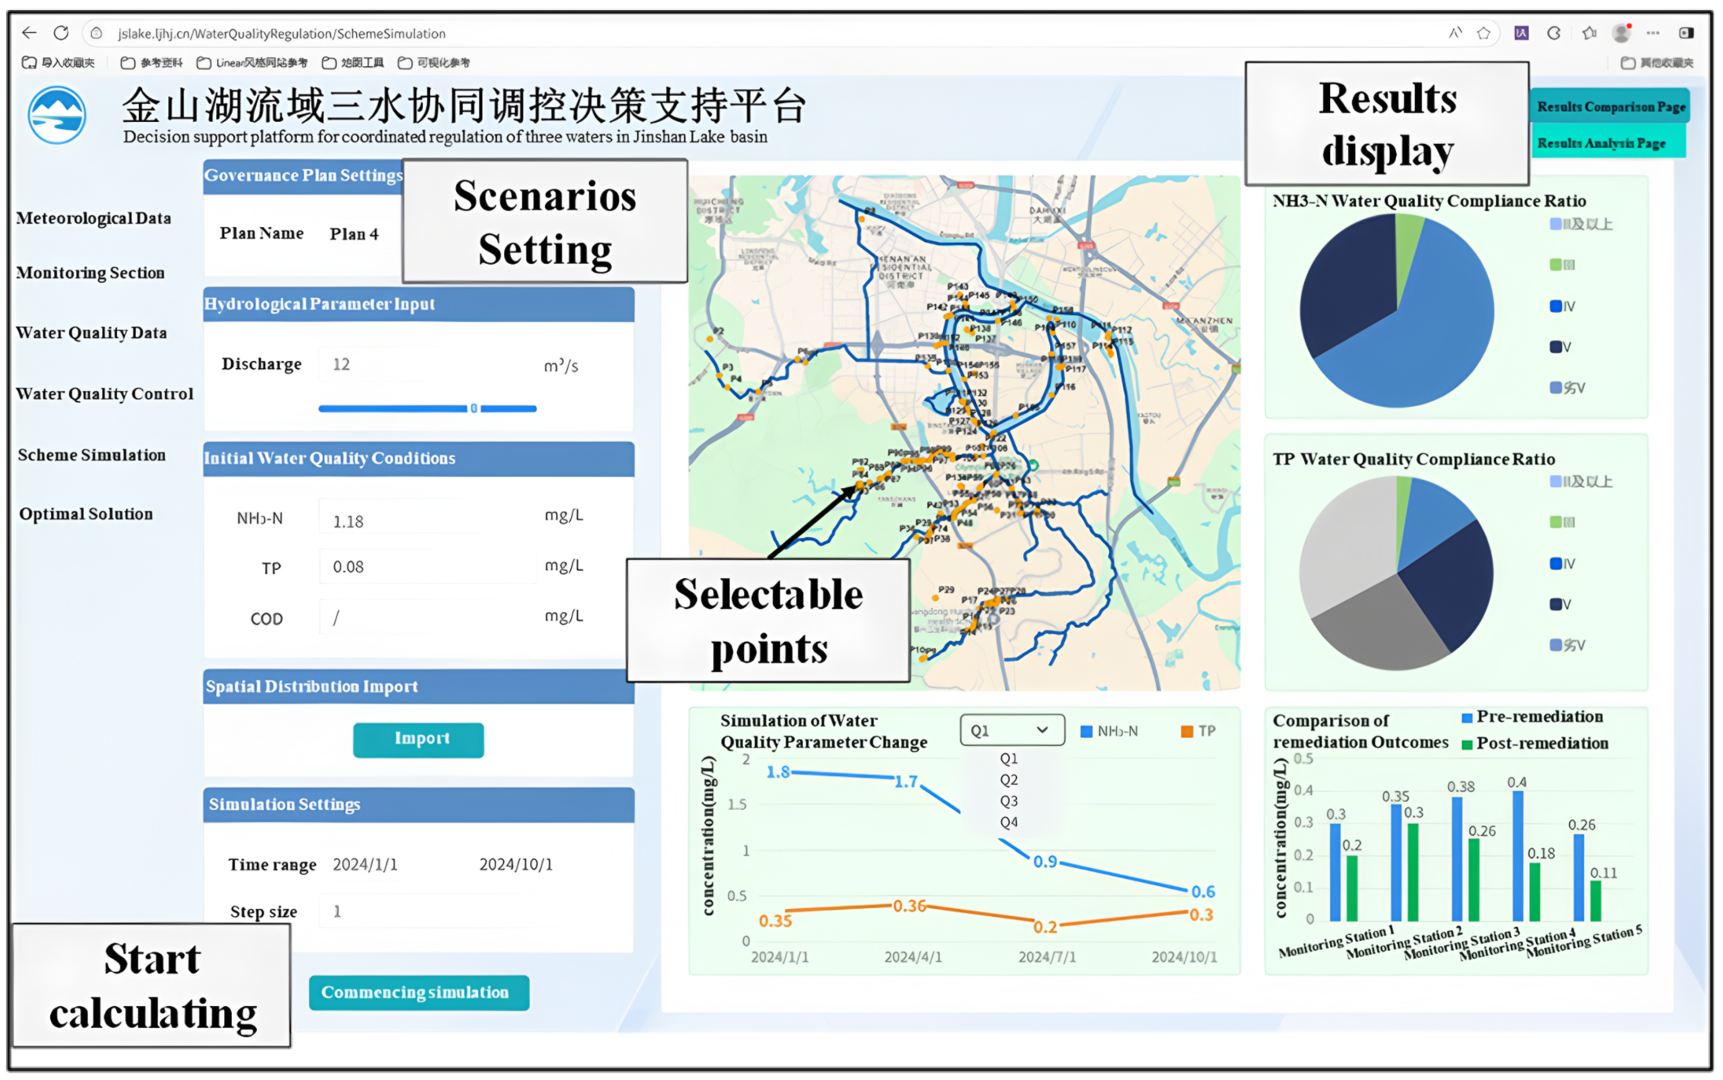
In the Jinshan Lake Basin Platform, tiered access permissions and customizable visualization interfaces are designed for different user levels. Once a user submits a request, the control center interprets it, retrieves the relevant data, and activates appropriate models to perform scenario-specific decision calculations. The selection of models, simulation extent, and time horizon are dynamically determined based on user inputs and situational requirements. Upon authorization and validation by authorized personnel, the platform delivers application results (simulation outputs and optimization suggestions) directly to the client. The decision support platform for 3WRR in the Jinshan Lake Basin is shown in Figure 4.
To promote the coordinated and efficient management of water resources, water quality, and water ecology in the Jinshan Lake Basin, the platform focuses on remediation and restoration efforts centered on the main tributaries and the lake, aiming to simultaneously improve water quantity, quality, and ecological efficiency. For the main tributaries, single and combined projects, including three hydrological characteristics (wet, normal, and dry), point source reduction, non-point source reduction, sediment dredging, recycled water reuse, and ecological water replenishment, were set up, totaling 789 scenarios; for the lake area, single and combined plans, including different hydrological years, sluice gate control, ecological water exchange, water quality improvement, point source reduction, non-point source reduction, and control of tributary water volume and quality, were set up, totaling 105 scenarios. Only when the water meets the Class IV water standard can normal aquatic biological activities, human activities, and industrial operations be carried out. This study evaluates the effectiveness of various restoration strategies based on the number of days the water quality in the Jinshan Lake watershed meets Class IV standards. The Jinshan Lake Basin Platform automatically evaluates and quantifies the status of the water ecological environmental quality and the improvement effects after the implementation of different 3WRR projects and selects the best project.

3.3. Multi-Project Simulation and Optimization

3.3.1. Tributary

Thirteen representative scenarios were selected to show their effectiveness in improving water quality in three tributaries of the Jinshan Lake Basin: HQS, LSK, and LTB. These cases were divided into two groups based on the category (Table 2): Group A (Scenarios 1–9) involved point/non-point source pollution reduction and sediment dredging, evaluated under three hydrological conditions characterized by the following assurance rates: wet (P10), normal (P50), and dry (P90). Group B (Scenarios 10–13) built upon the source control plans in Group A by incorporating additional engineering and ecological interventions, including recycled water reuse and water replenishment from local sources or the Xizhijiang River, all simulated under P50 conditions.
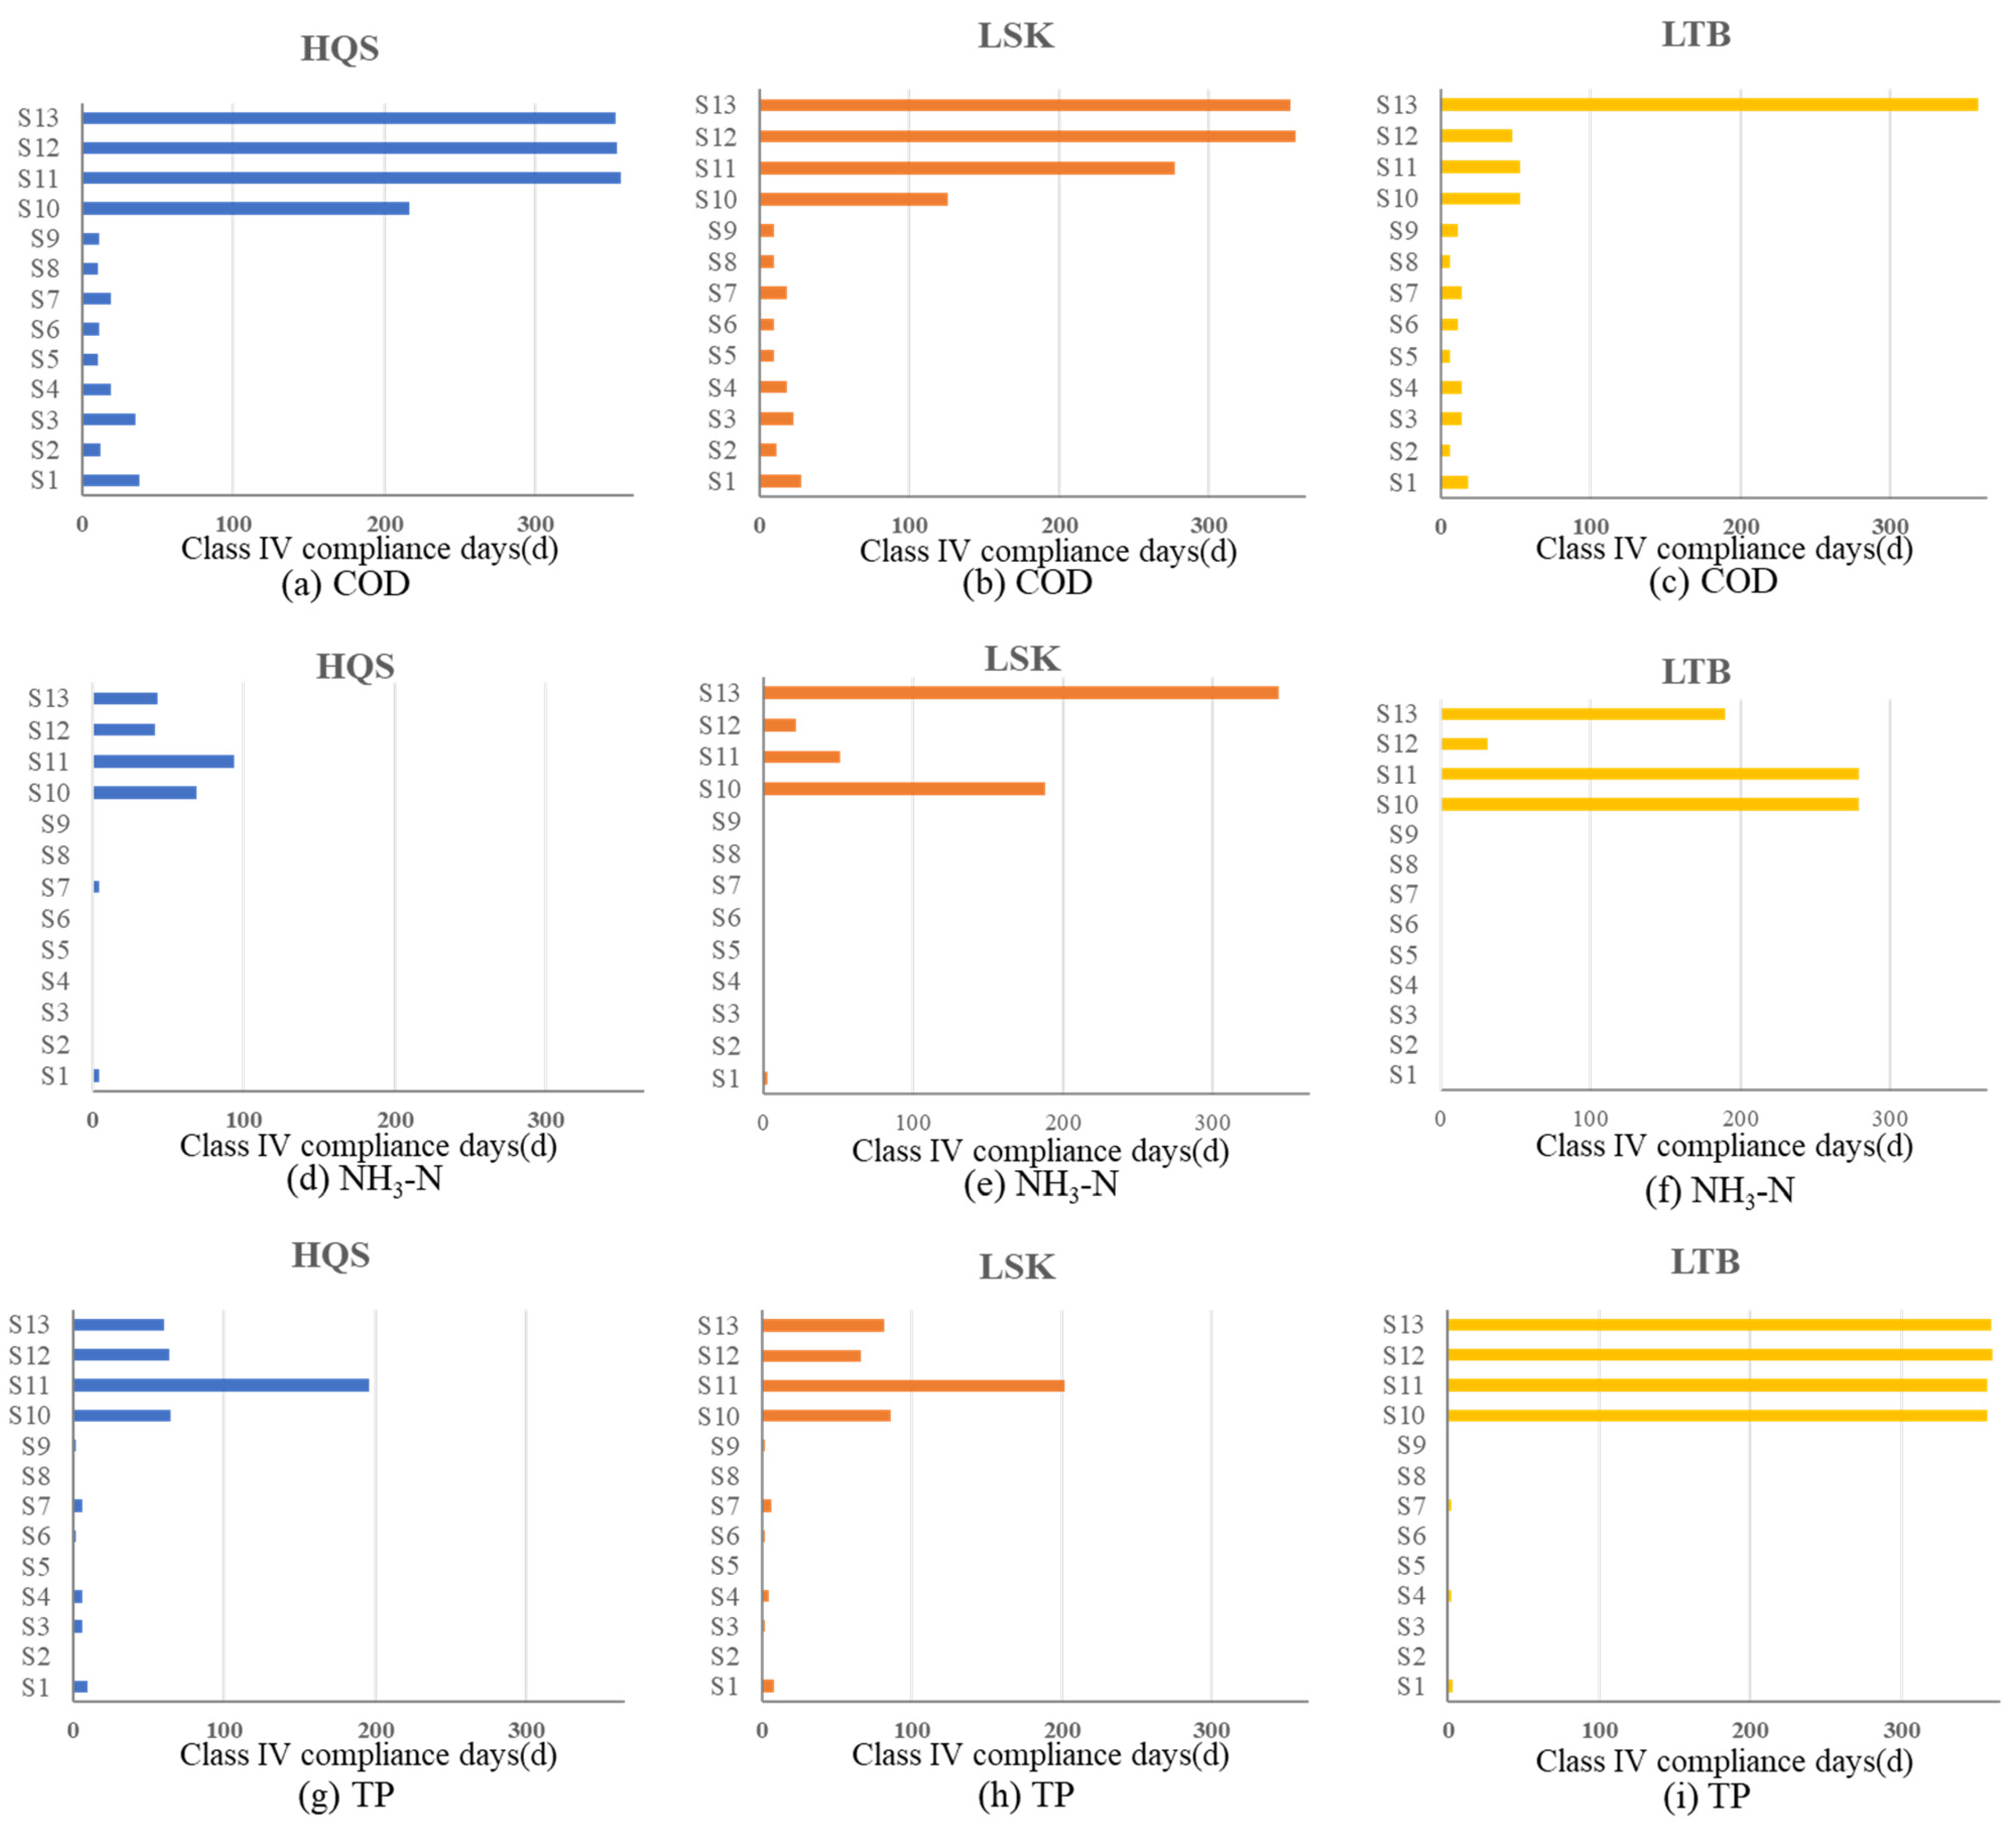
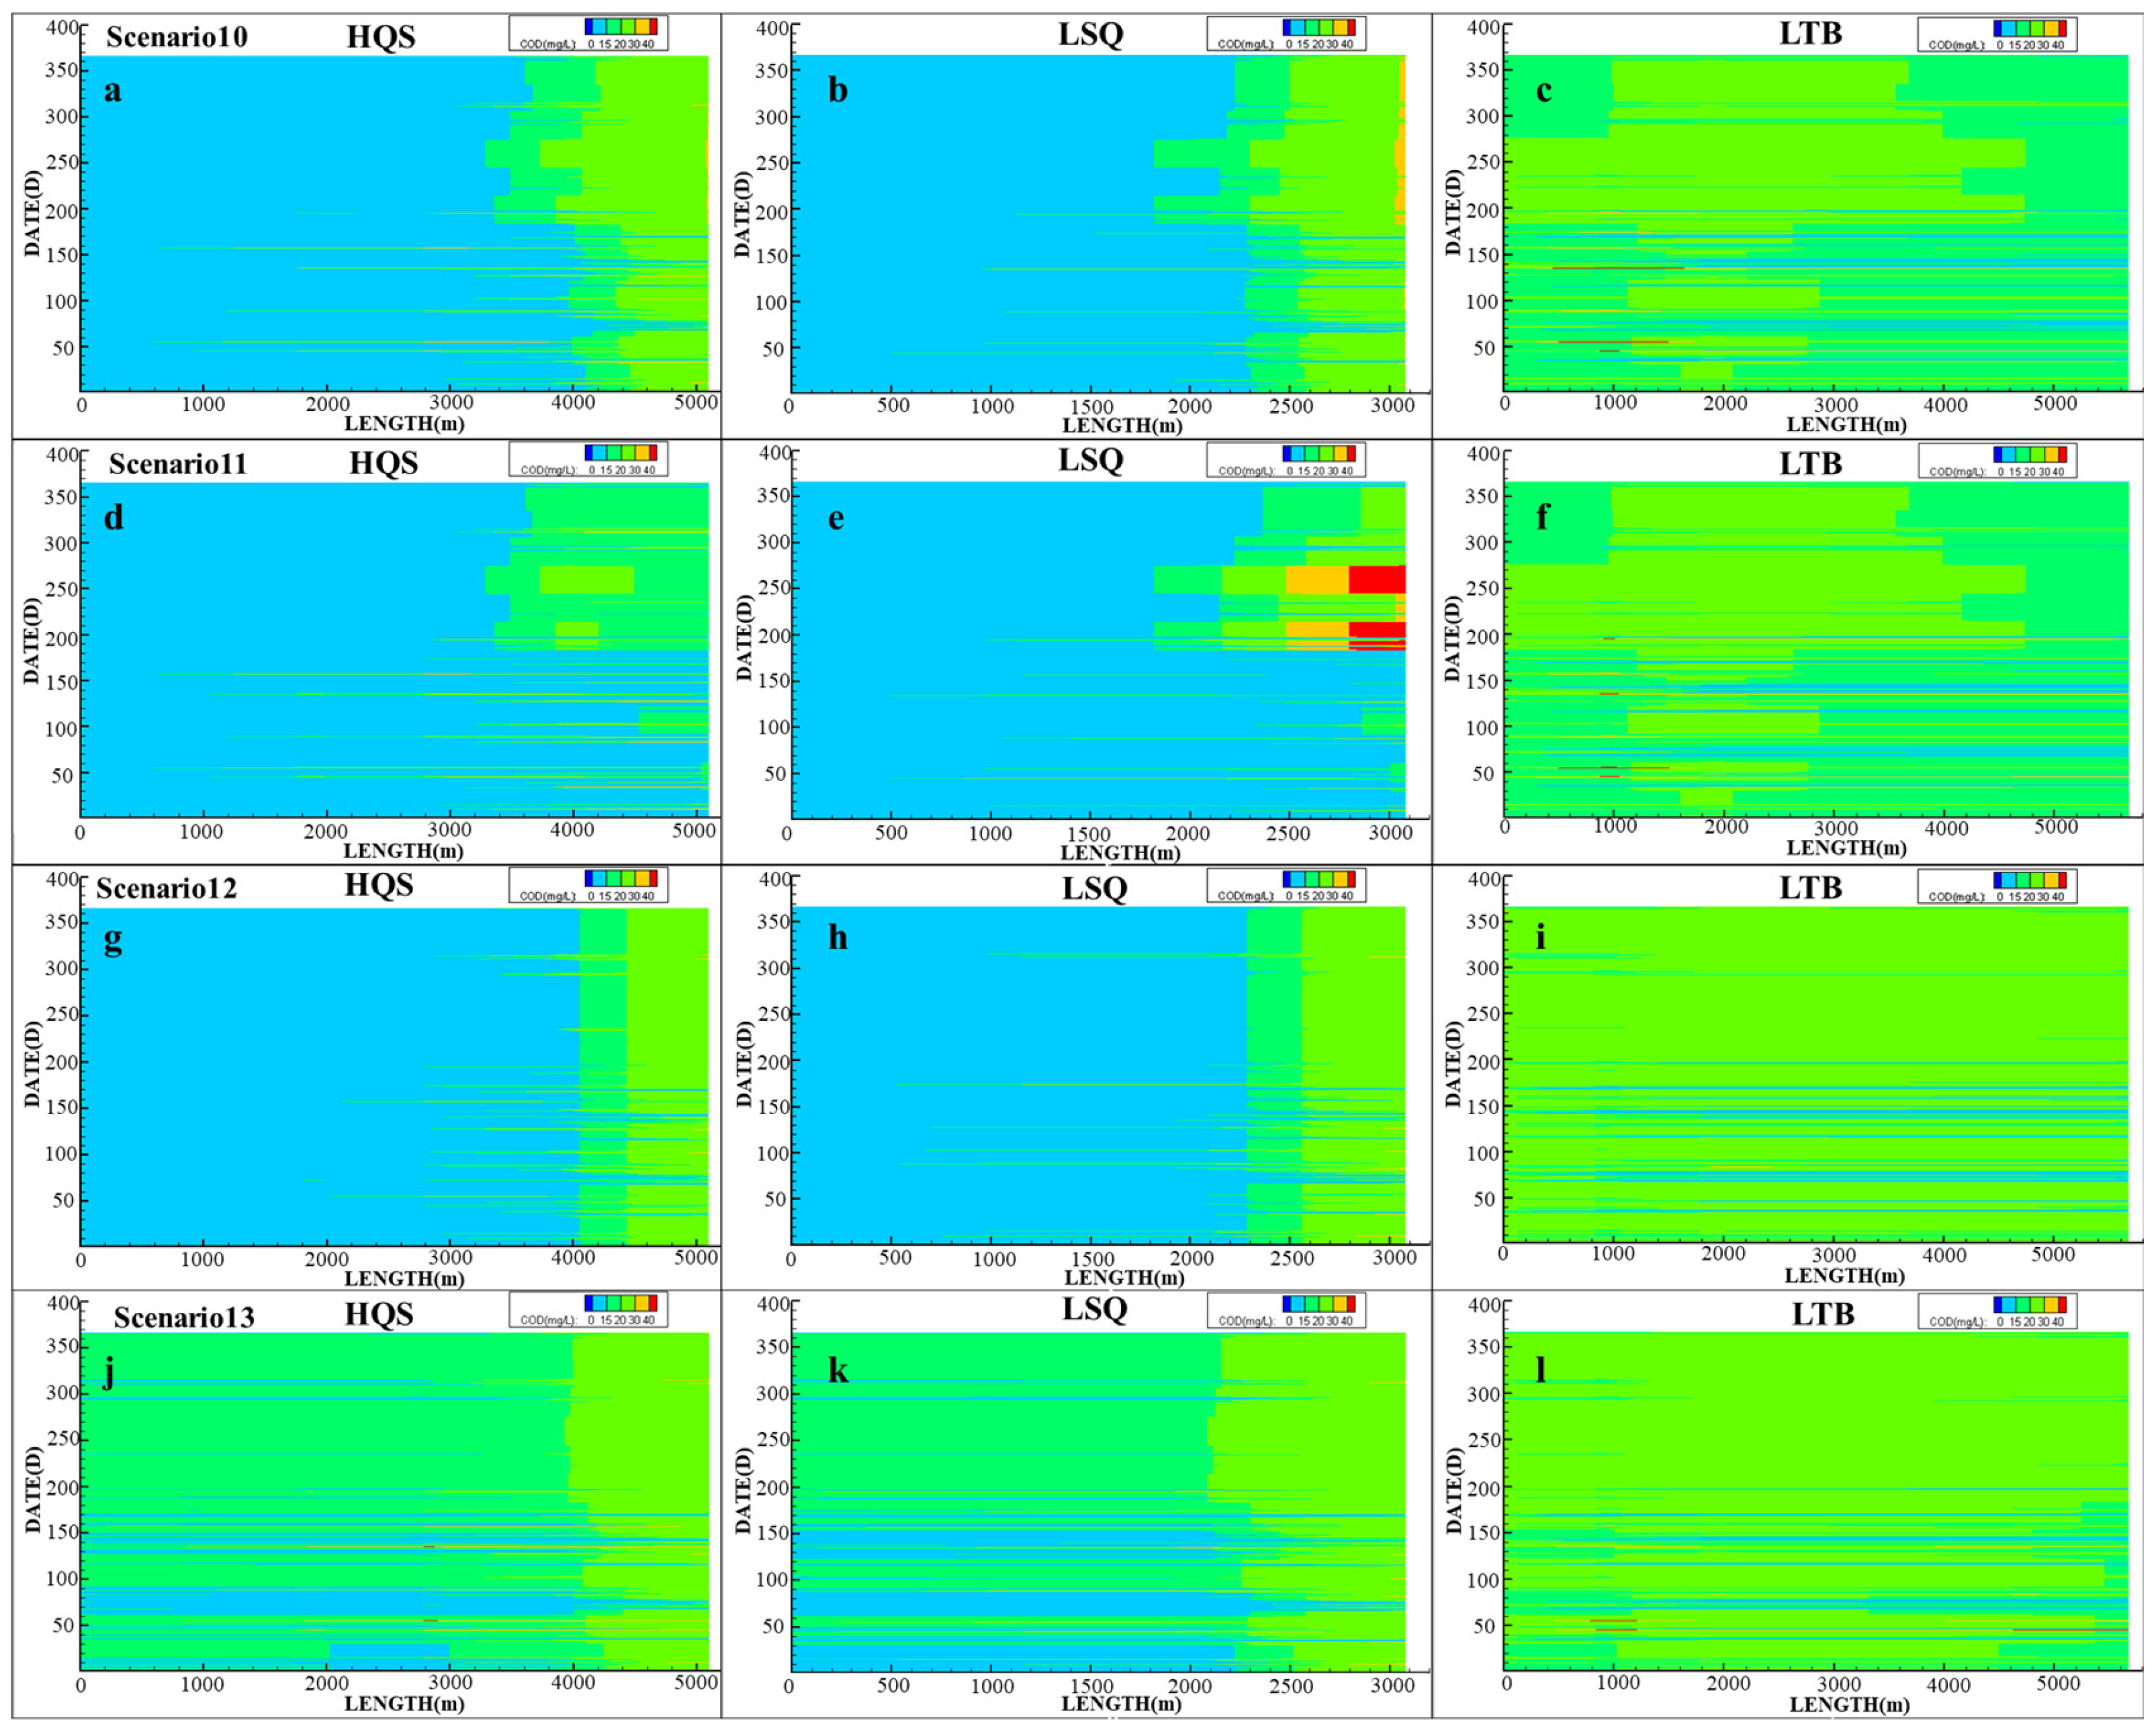
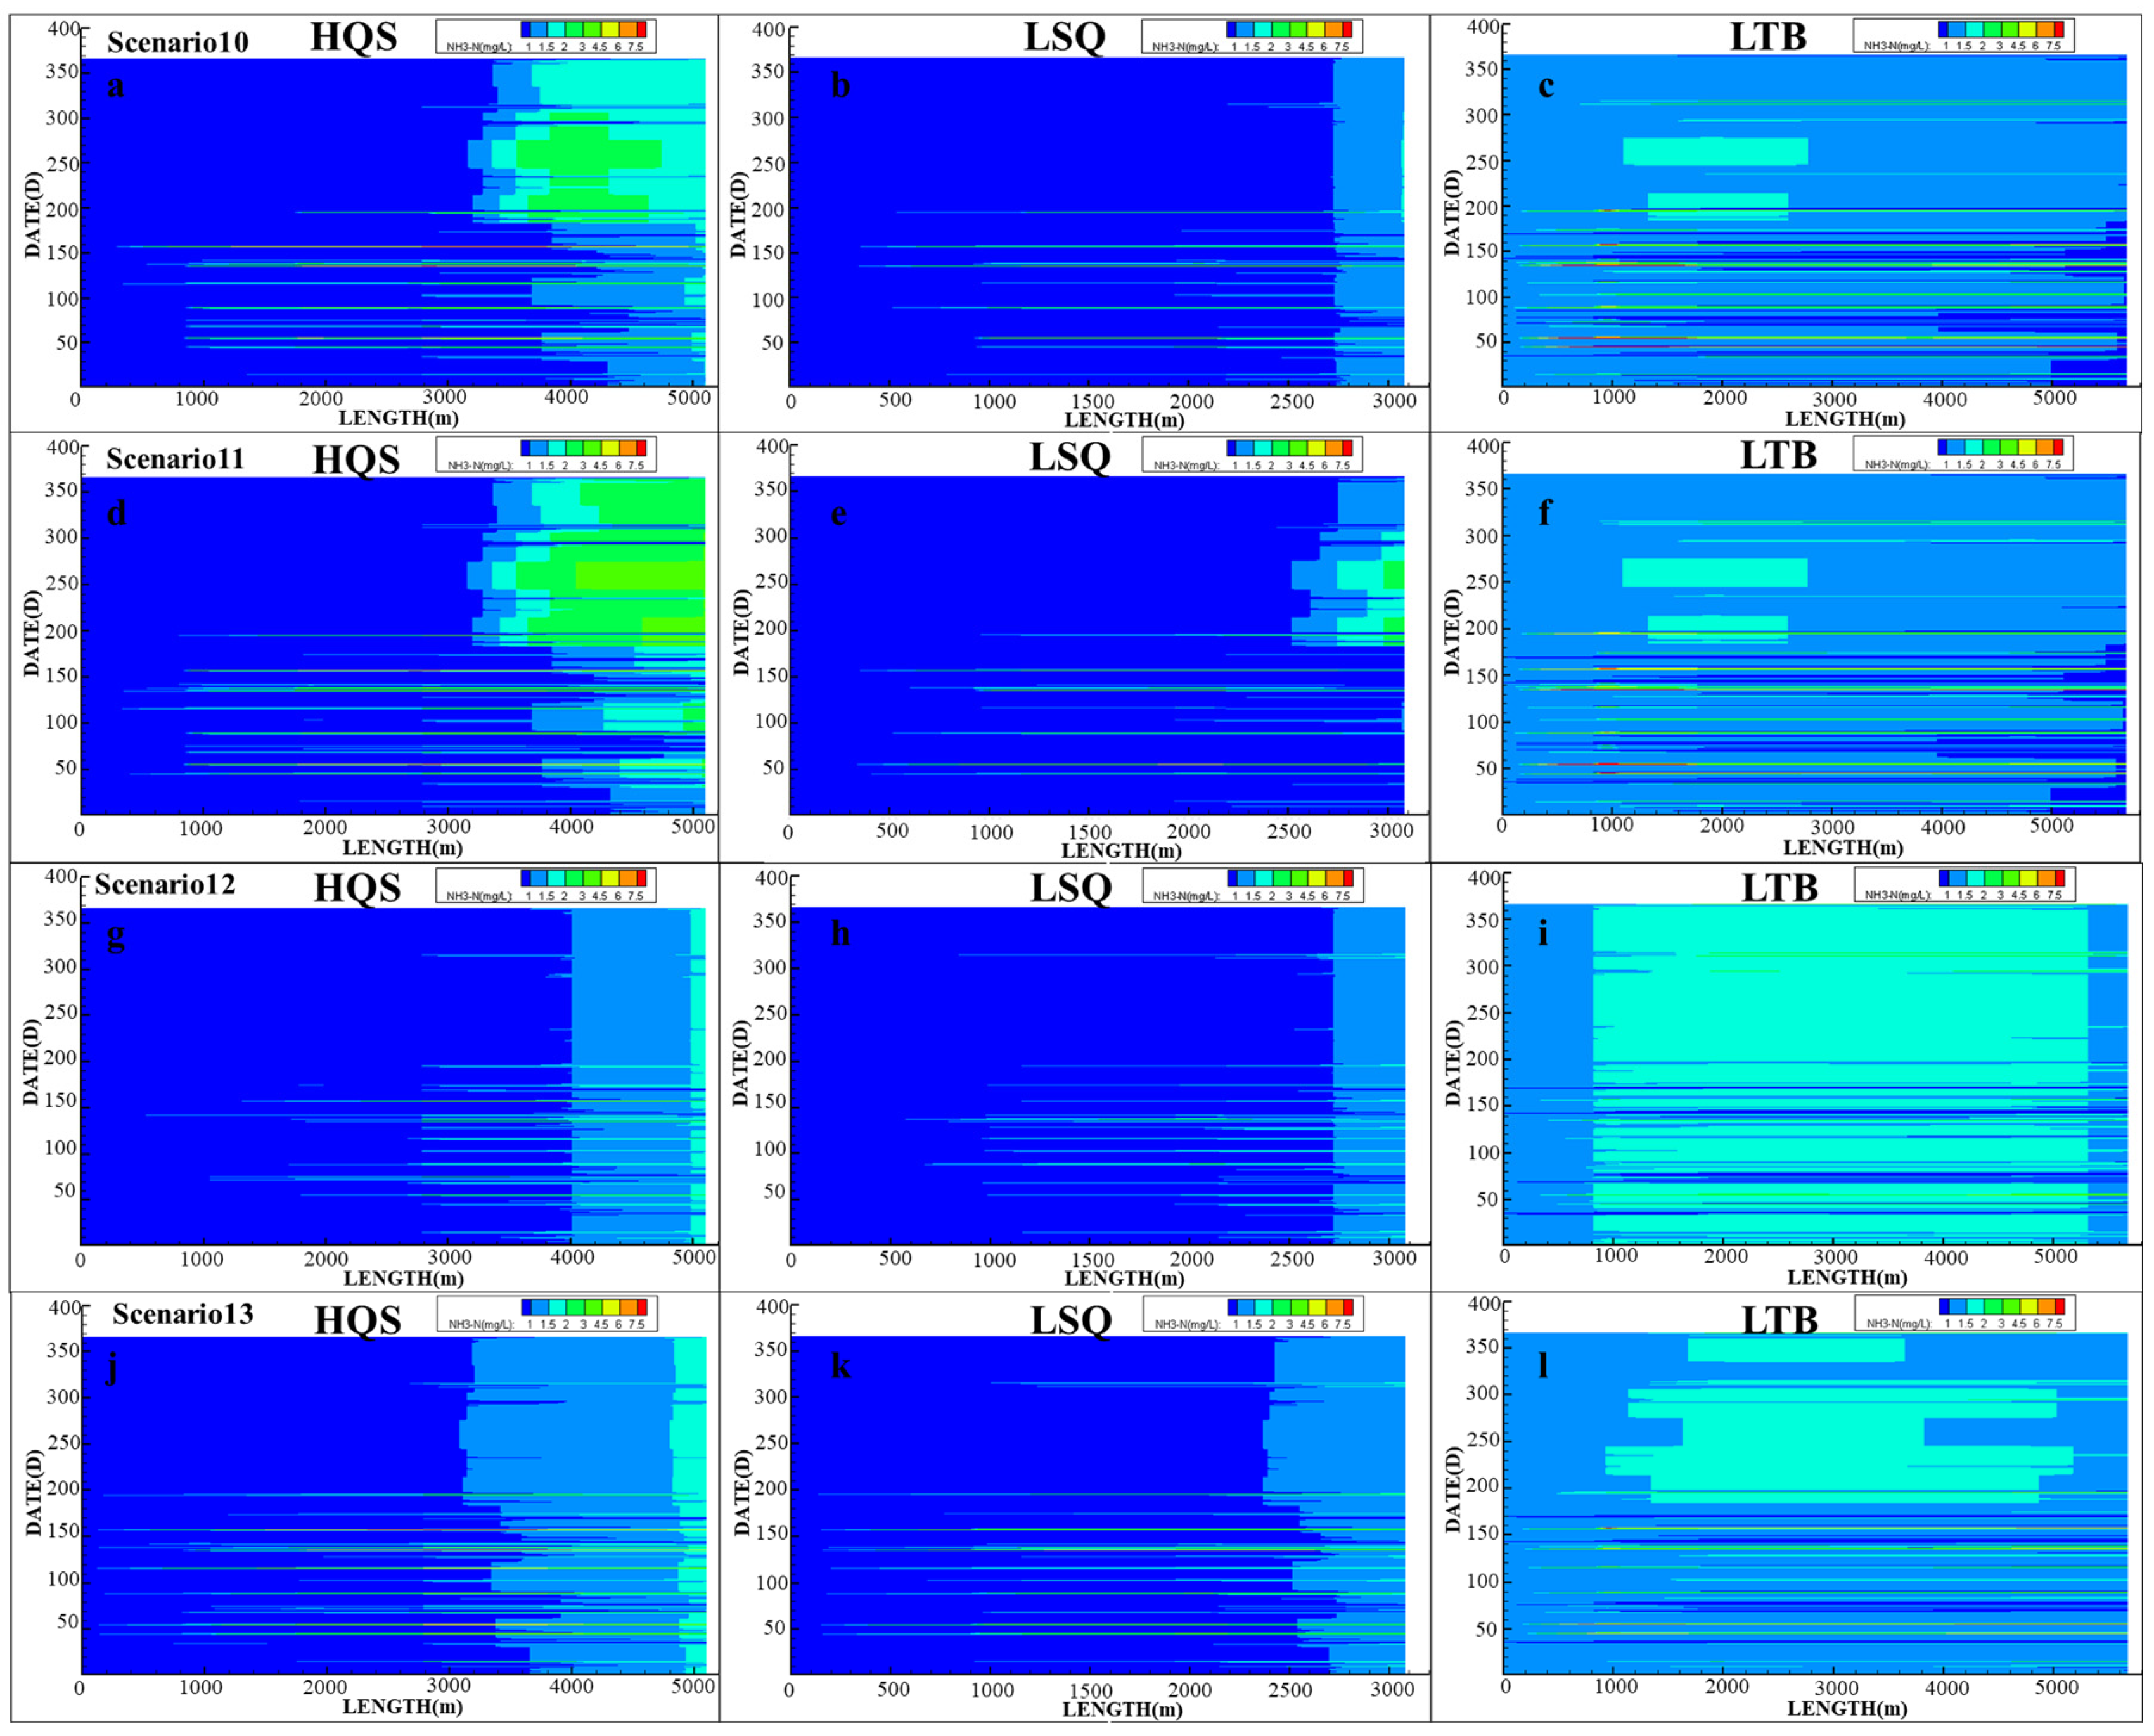
The primary assessment metric was the number of days that water quality indicators (COD, NH3-N, and TP) met the Class IV surface water standard in each tributary. To visualize the performance across all scenarios, Figure 5 presents the Class IV compliance days for COD, NH3-N, and TP in HQS, LSK, and LTB, with locations shown in Figure 2. The temporal and spatial concentration variation in water quality indicators under Scenarios 10–13 are illustrated in Figure 6 to examine the spatial distribution of pollution under engineering and ecological interventions. Summaries of compliance days under Group A and Group B scenarios are provided in Table 3 and Table 4 respectively.
Figure 5 shows that Group A scenarios yielded limited improvements. For instance, HQS achieved a maximum of four COD-compliant days in Scenario 1, while most Group A scenarios resulted in only 0–1 day of compliance for any indicator in LSK and LTB. The aggregated results (Table 3) indicate that Class IV compliance rates under Group A remained below 2% across all tributaries, emphasizing the inadequacy of source reduction alone in highly polluted and low-flow systems. Research on the Taihu River Basin has shown that relying solely on agricultural non-point source reduction has not significantly improved water quality. Even with a 40% reduction in non-point source load, the concentration of total phosphorus in the lake only decreased by 5–10%, as internal phosphorus release counteracted the external reduction efforts [46].
In contrast, Group B scenarios achieved substantially higher compliance rates. Scenario 13 resulted in 190 compliant days in LTB, the best performance among all cases. Scenario 12 enabled up to 22 compliant days in LSK and 21 days in LTB. These improvements are attributable to enhanced flow conditions and pollutant dilution following sediment dredging and water diversion. The spatial pollutant attenuation along river courses is clearly illustrated in the longitudinal concentration profiles (Figure 6, Figure 7 and Figure 8), especially in the midstream and downstream segments.
In summary, while source reduction plays a role, it is insufficient in isolation. Only integrated engineering and ecological approaches, as applied in Group B scenarios, can achieve meaningful improvements in tributary water quality.

3.3.2. Lake

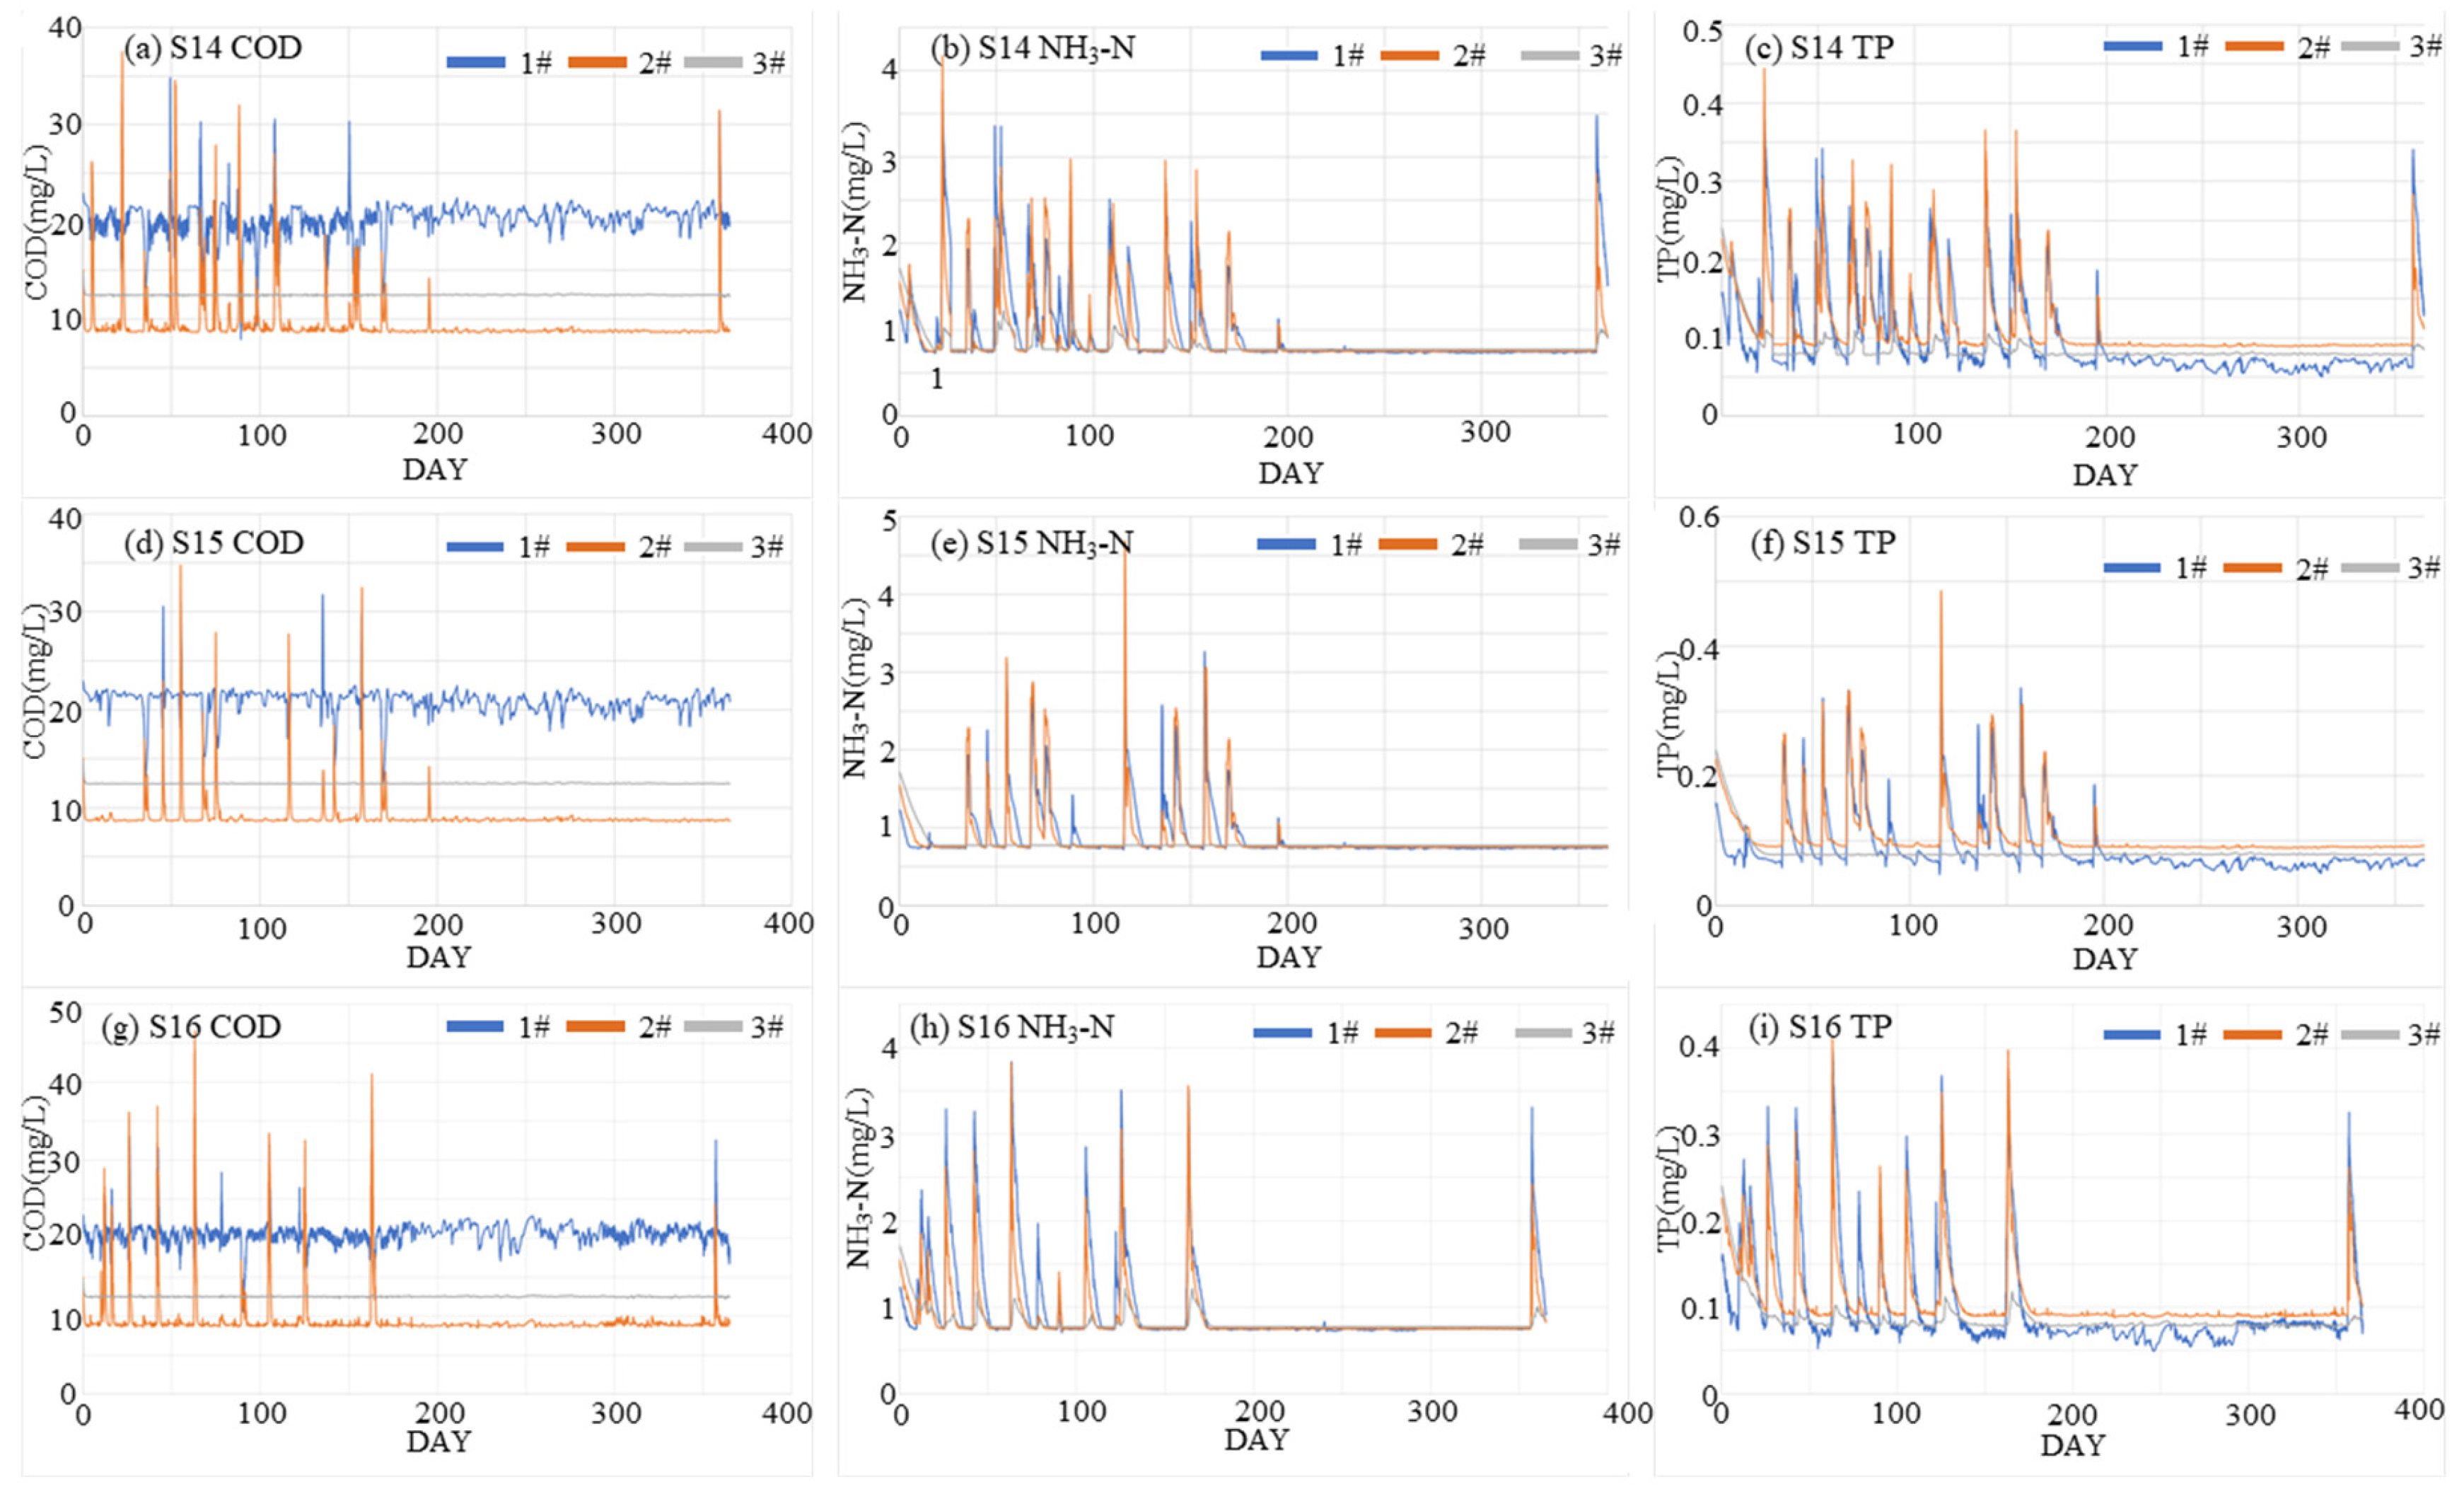
The representative scenarios for the lake are listed in Table 5 To assess the impact of integrated source control and in-lake remediation measures under varying hydrological conditions, three simulation conditions (Group C: Scenarios 14–16) were designed to represent typical wet (P10), normal (P50), and dry (P90) hydrological characteristics. All scenarios assumed a 95% reduction in point source pollution and comprehensive sediment dredging in the lake. As this area is characterized by urban land surface types, with a large proportion of impermeable surfaces, the exchange between surface water and groundwater is weak. Therefore, the impact of groundwater on surface water quality is not considered in this context. The results are shown in Figure 9 and Figure 10. Under the P10 condition (Scenario 14), abundant precipitation intensified pollutant transport, resulting in the most severe non-compliance of Class IV standards between April and June, particularly for TP, with non-compliance areas > 5% persisting for 76 days and areas >30% for 38 days. NH3-N and TN (non-compliance areas > 5%) durations were 28 and 40 days, respectively. Although TP remained problematic during July–September (54 days >5%), NH3-N and TN were somewhat alleviated. Water quality improved markedly in autumn and winter, with non-compliance limited to short durations and smaller areas. Under the P50 condition (Scenario 15), pollution levels slightly decreased compared to P10, with spring and summer still being critical periods: TP demonstrated non-compliance of Class IV standards for 69 days (non-compliance area > 5%), while NH3-N and TN demonstrated non-compliance for 25 and 35 days, respectively. From July to September, TP non-compliance persisted for 61 days (non-compliance area > 5%), while NH3-N and TN remained above the appropriate standards for 21 and 30 days. Improvements were again observed in autumn and winter, with minimal non-compliance events. In contrast, under the P90 condition (Scenario 16), the overall water quality pressure was further reduced. TP remained the dominant pollutant during April–June, exceeding standards for 64 days (>5%), lower than in P10 and P50, while NH3-N and TN exhibited comparable non-compliance durations (30 and 41 days, respectively). Notably, NH3-N showed increased non-compliance severity during July–September, with 6 days exceeding the 30% area threshold. Winter and spring exhibited only minor non-compliance events for all indicators. These results demonstrate that the combined application of point source pollution reduction and sediment dredging significantly improves lake water quality, while hydrological conditions modulate the timing and severity of pollution non-compliance, highlighting the importance of adaptive management under different flow regimes.
The eutrophication index is commonly used to assess the nutrient levels in water bodies. In this study, the evaluation factors include three water quality indicators: COD, NH3-N, and TP [39]. The eutrophication index is used as one of the indicators for the ecological risk assessment of the Jinshan Lake basin. The effectiveness of different management strategies provided by the platform is evaluated in order to identify the most suitable management plan for the Jinshan Lake basin.
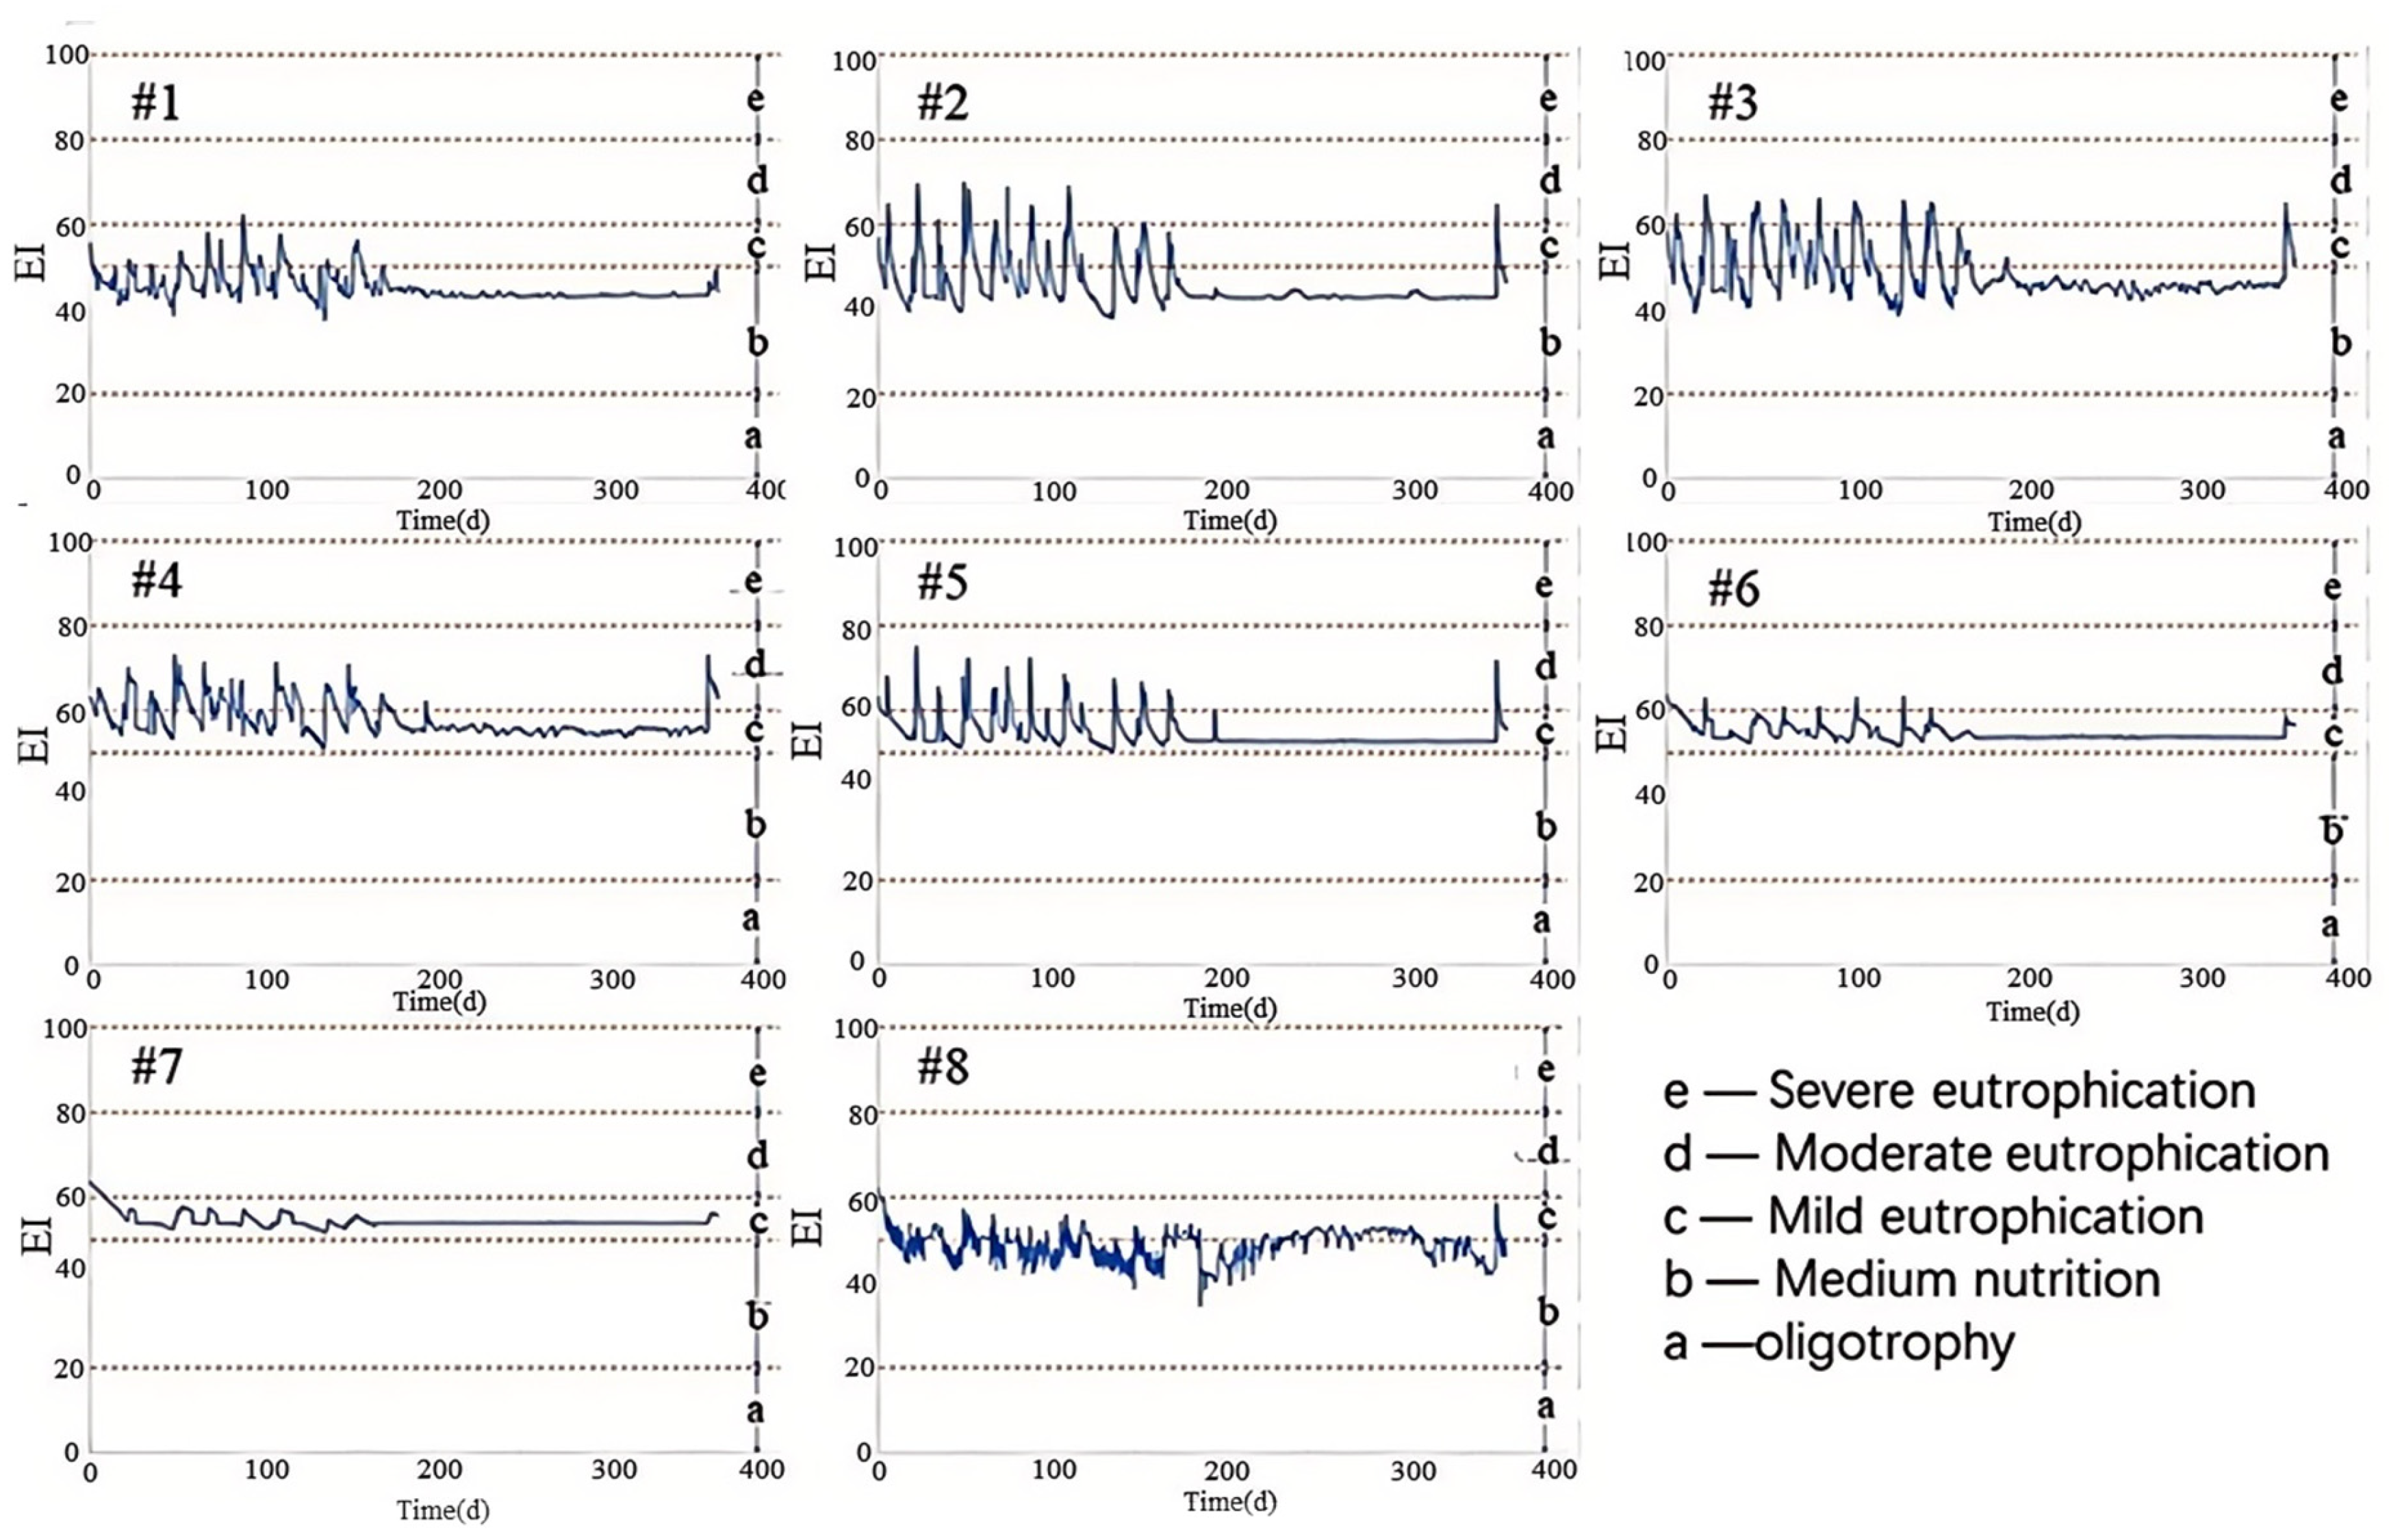
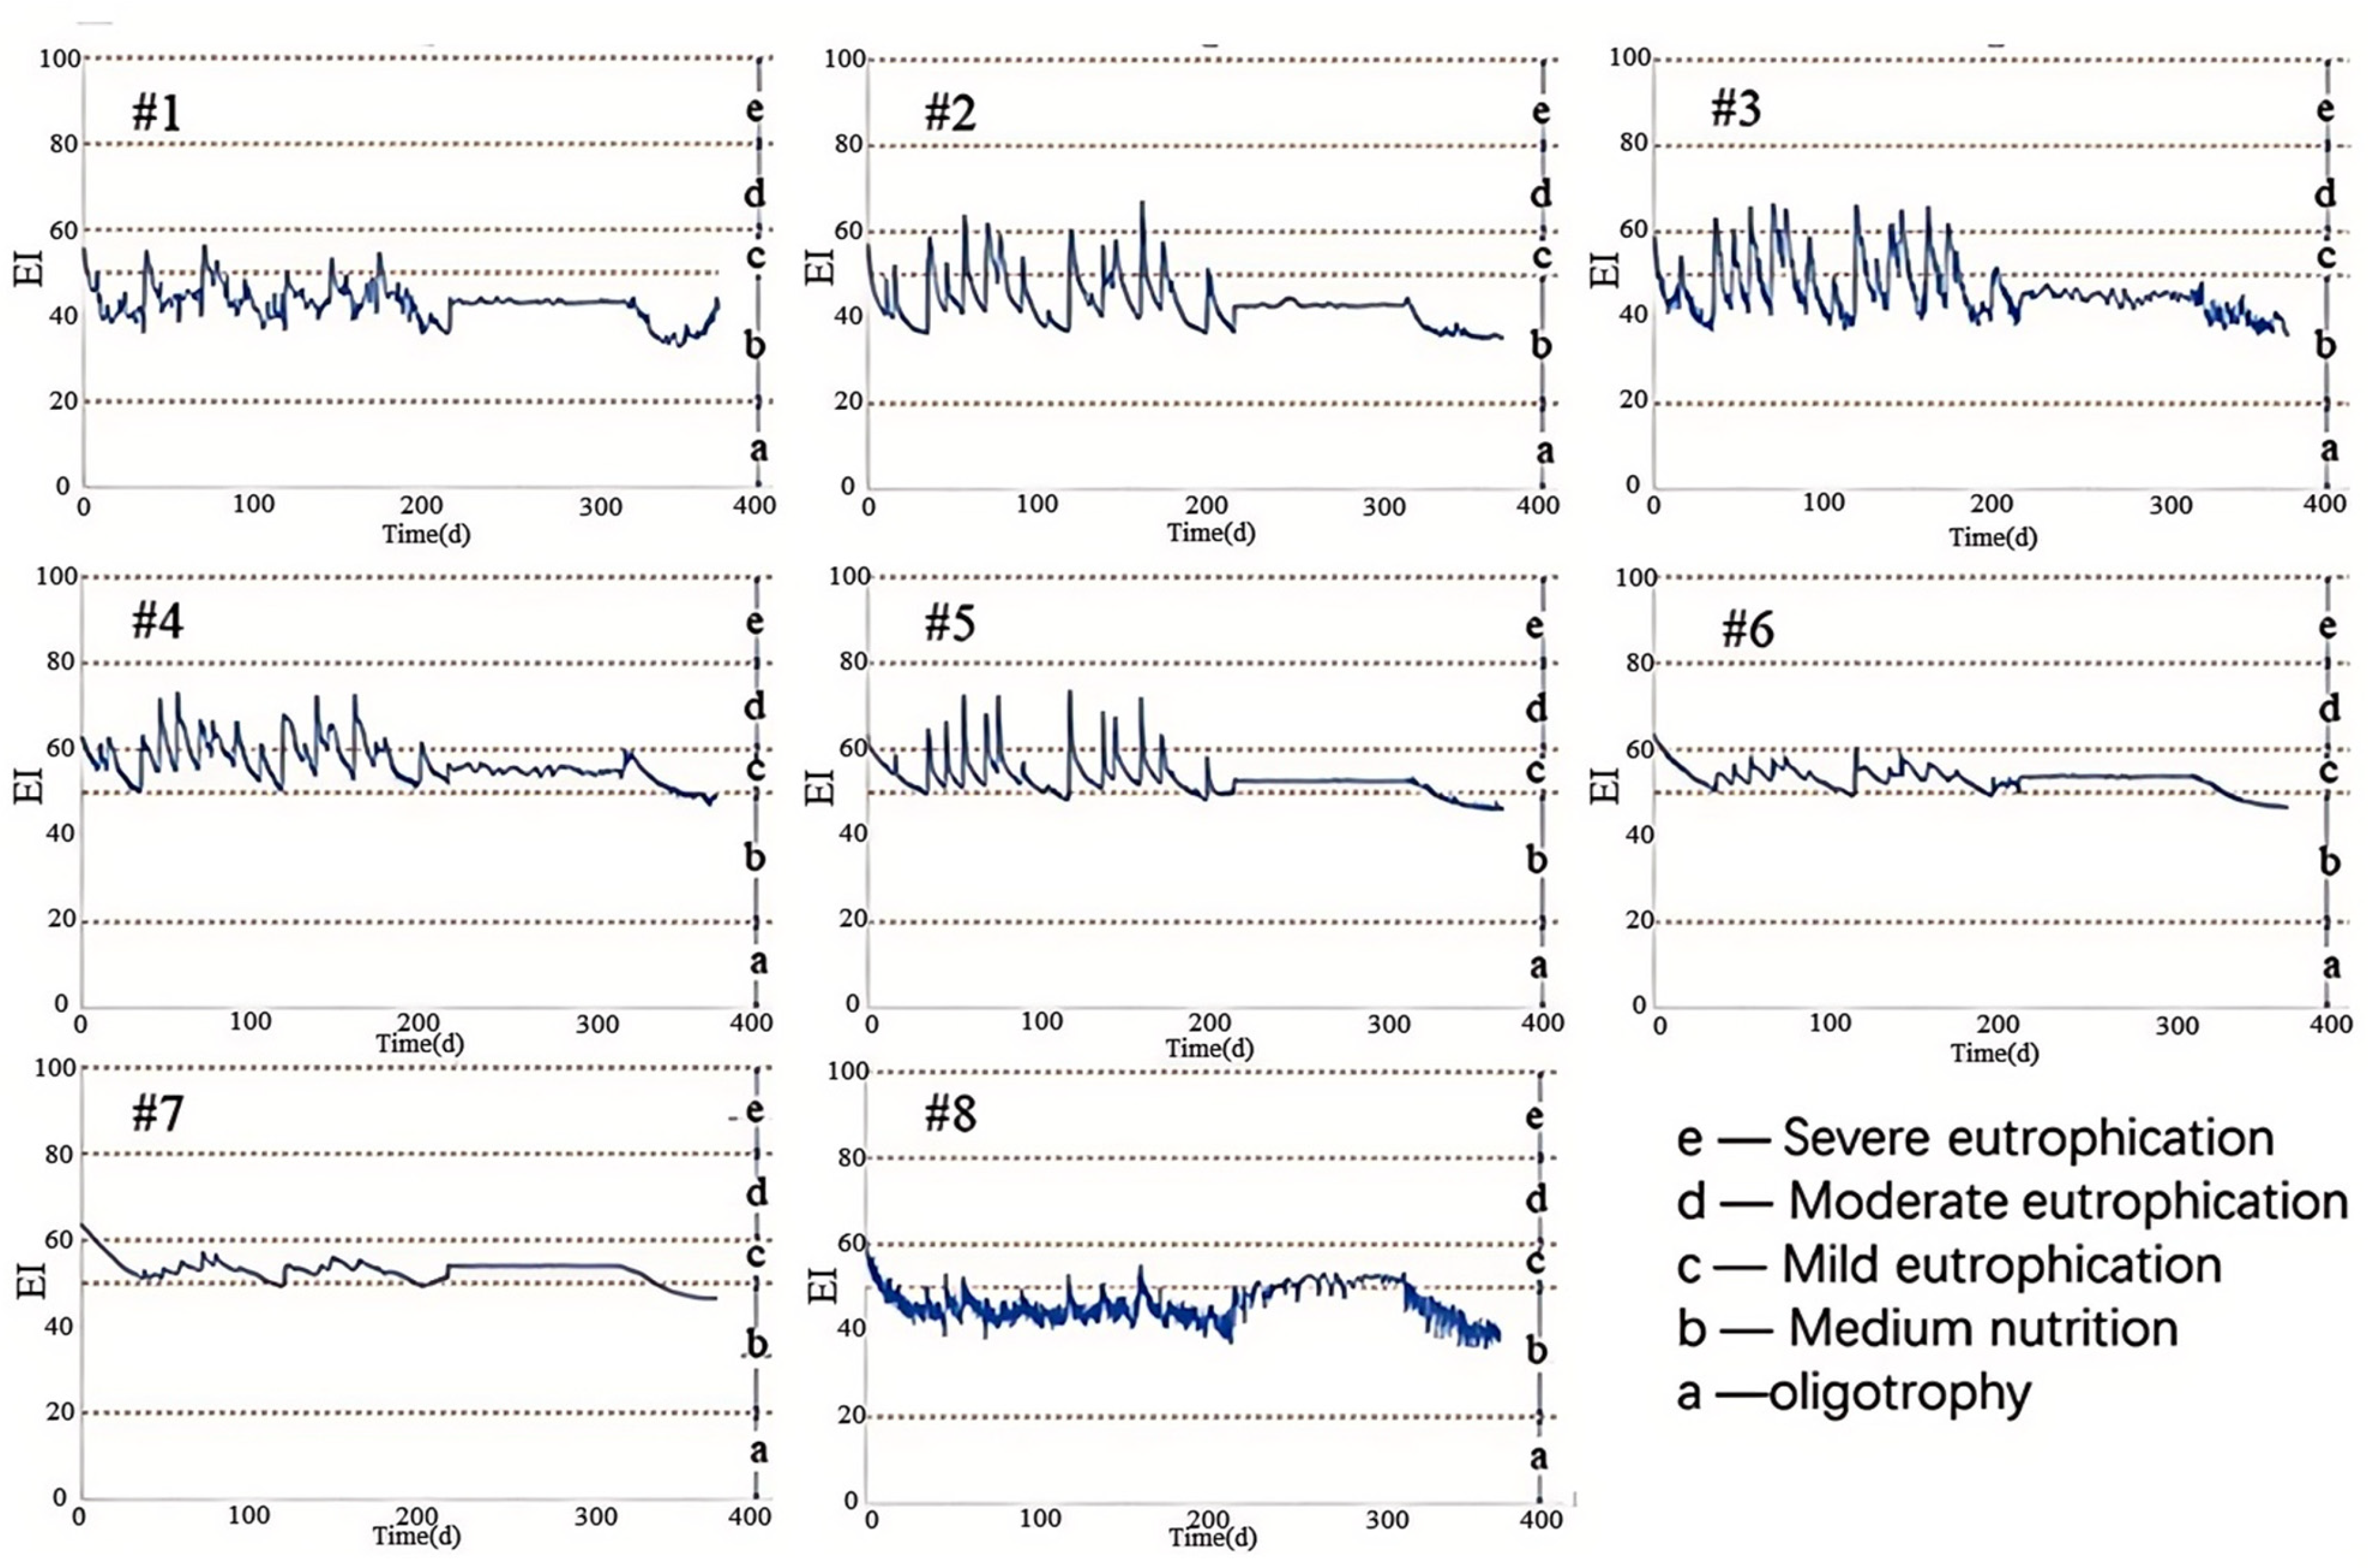
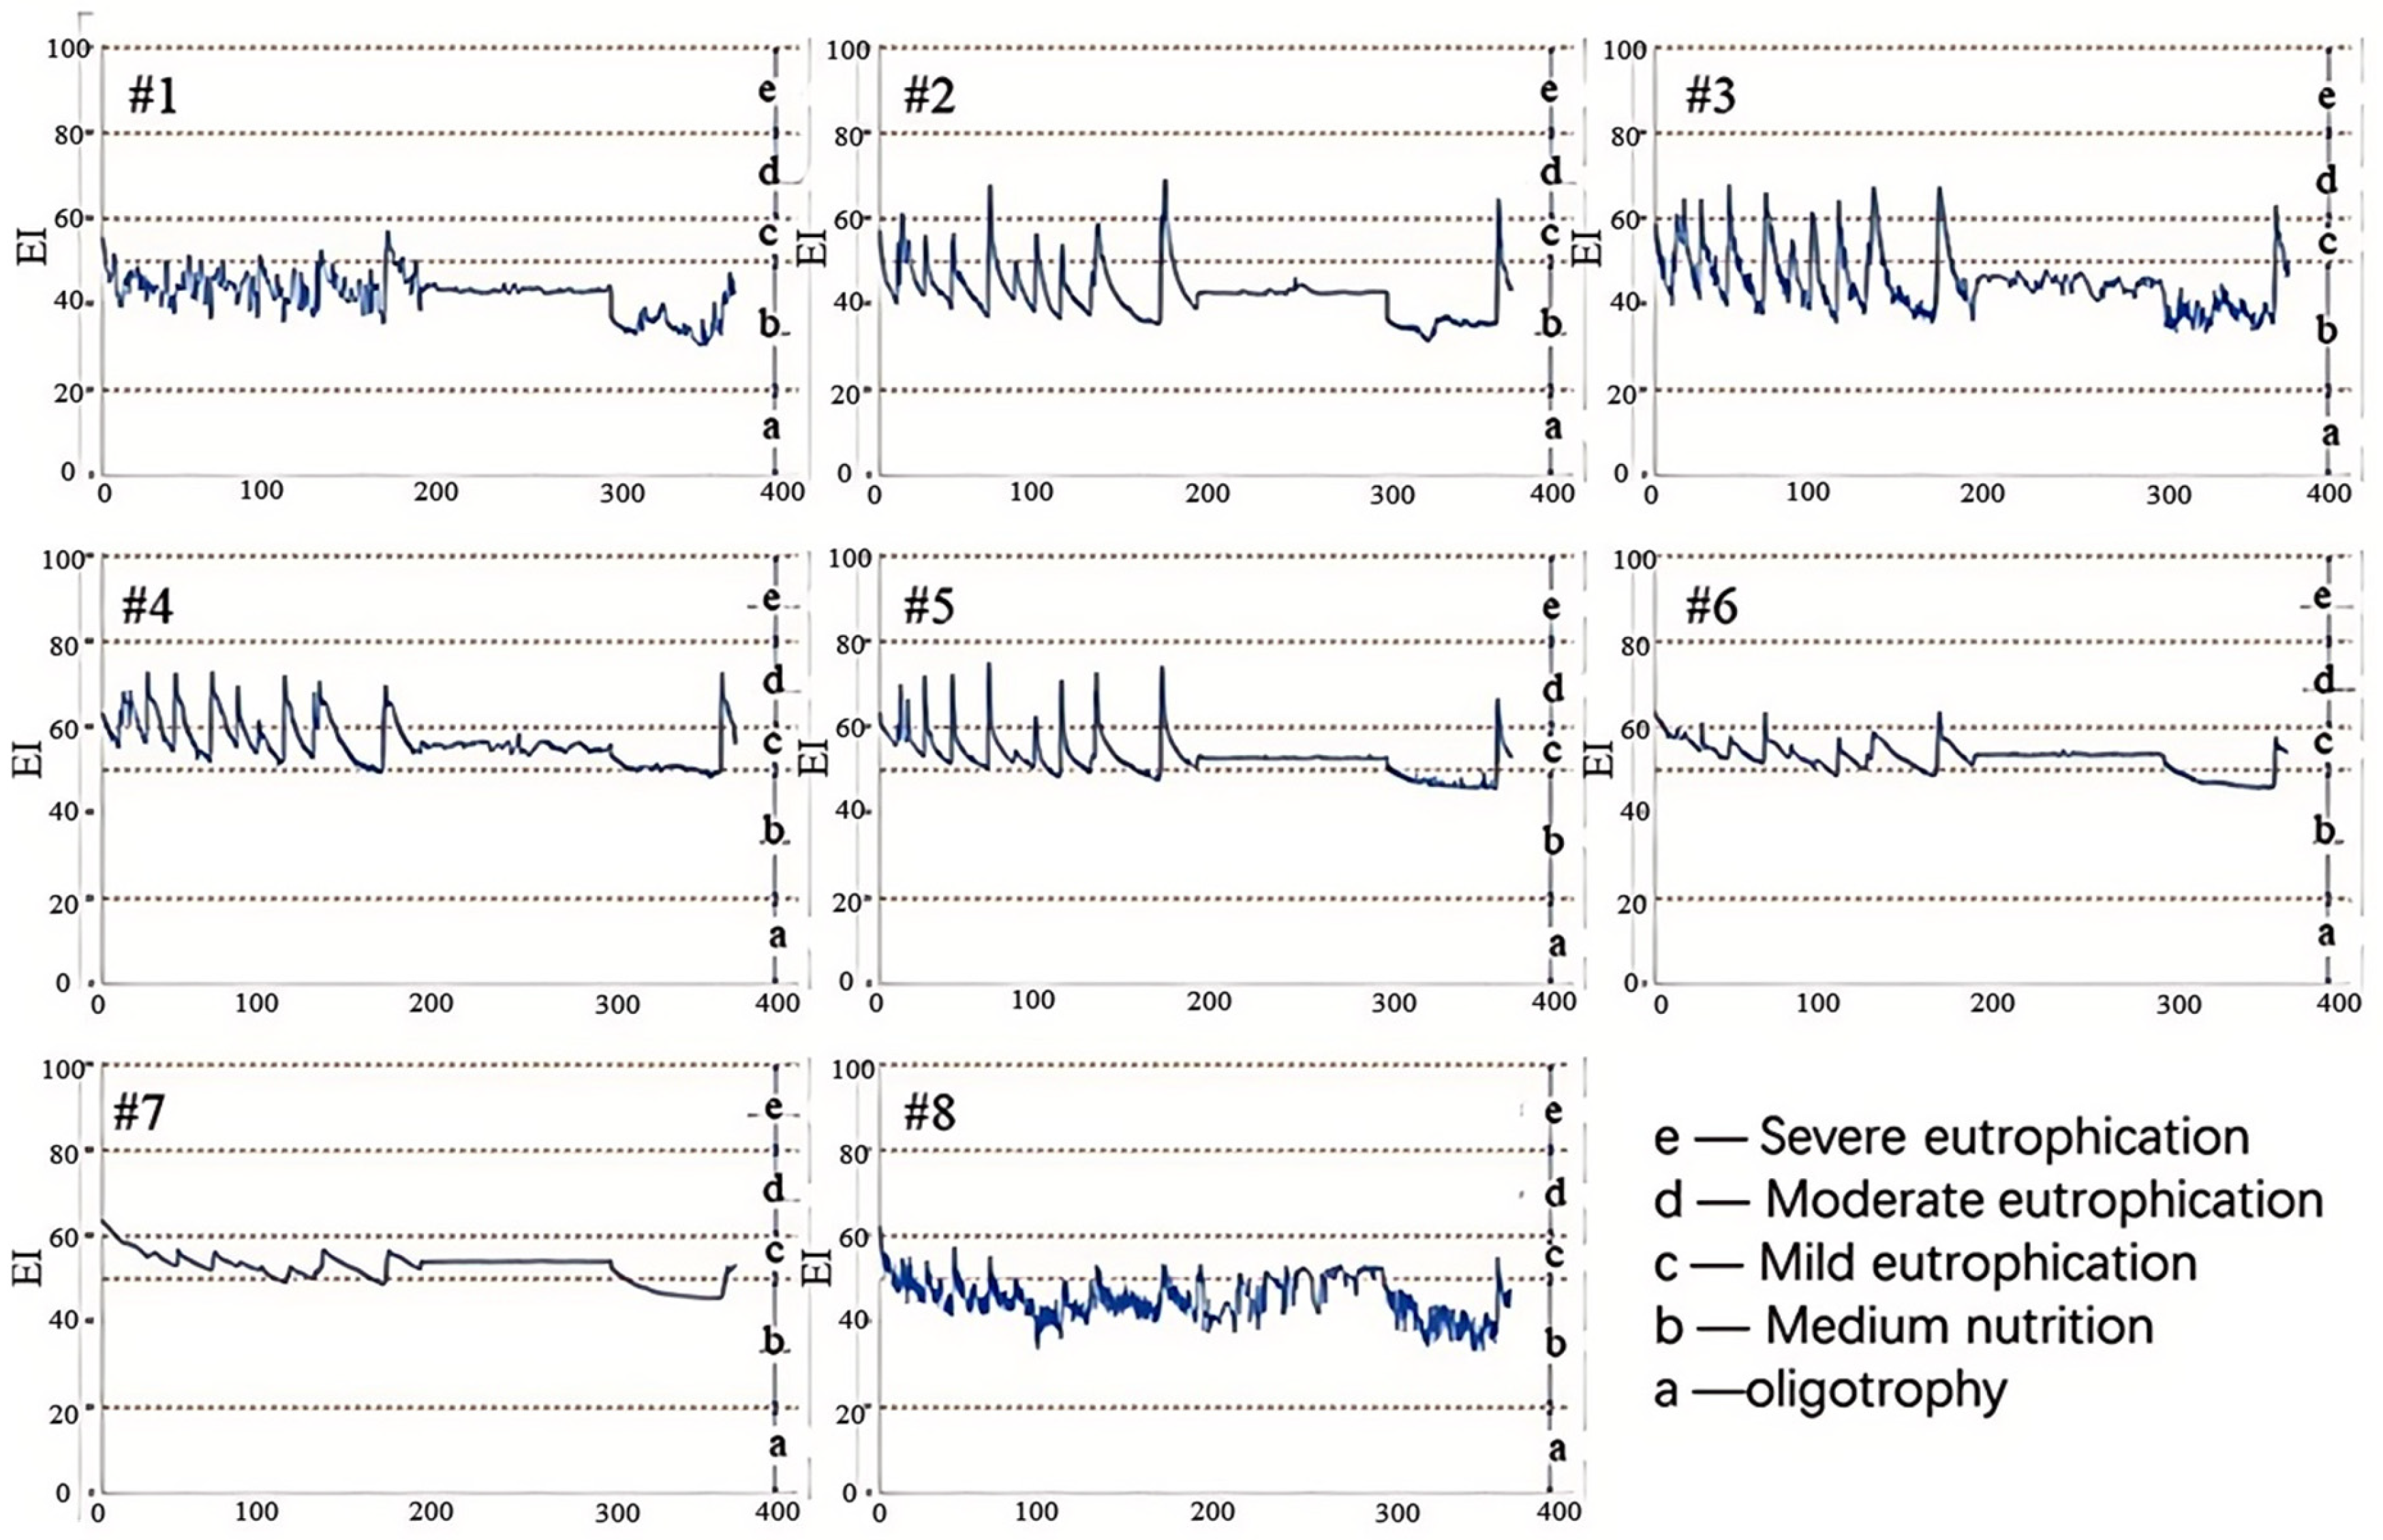
The trophic status of Jinshan Lake under these three scenarios was further evaluated using the comprehensive eutrophication index (EI) [47], as illustrated in Figure 11, Figure 12 and Figure 13. The locations of the designated assessment sites (Sites 1–8) are shown in Figure 2. Under Scenario 14, most sites were classified as exhibiting moderate or mild eutrophication throughout the year. Specifically, Sites 1, 2, 3, and 8 generally remained in a moderate trophic state, with Sites 2 and 3 temporarily rising to light-to-moderate eutrophication during rainfall events, and Site 8 occasionally shifting to mild eutrophication. Site 4 displayed a predominantly light-to-moderate eutrophic state, while Sites 5, 6, and 7 were mostly mildly eutrophic, with Site 5 periodically reaching moderate levels during localized rainfall. Under Scenario 15, similar spatial patterns persisted, with slight overall improvements. Sites 4, 5, and 7 were mainly characterized by mild-to-moderate eutrophication, while Site 6 remained predominantly mildly eutrophic, increasing temporarily under rainfall influence. Under Scenario 16, representing dry hydrological conditions, further reductions in trophic levels were observed. Most sites, particularly Sites 4–7, remained in a mildly eutrophic state, with less frequent and less intense nutrient surges during rainfall events. These results indicate that the lake’s trophic condition is highly responsive to hydrological variability, with wet conditions intensifying nutrient loading and transport, while dry conditions support more stable and improved trophic states. The spatial heterogeneity among sites highlights the need for site-specific management strategies, particularly under high-flow scenarios where external inputs may counteract in-lake remediation efforts.
To evaluate the effectiveness of ecological restoration during the dry season, three scenarios (Scenarios 17–19, Group D) were designed under P50 hydrological conditions, incorporating the construction of a water-retaining sluice, a 95% reduction in point source pollution, and a 60% reduction in non-point source pollution, with varying water exchange flows (0.5, 1, and 26.1 m3/s) implemented via sluice-controlled flushing (Figure 14). The results show that even low-flow water exchange significantly improved hydrodynamic conditions and pollutant dispersion in the lake. When the flow rate was 26.1 m3/s, 99.77% of the lake area met the Class IV standard for COD, 97.22% for NH3-N, and 90.98% for TP. Under the 0.5 m3/s scenario, the compliance rates remained high for COD (98.76%) and NH3-N (91.21%), but TP compliance decreased substantially to 58.87%. Similarly, the 1 m3/s flow scenario yielded 97.80% compliance for COD, 81.30% for NH3-N, and only 55.30% for TP. These results indicate that, while even minimal water exchange effectively improves COD and NH3-N concentrations across most of the lake area, phosphorus remains more persistent and spatially extensive under lower exchange volumes.
Studies have shown that in Lake Erie, the spring snowmelt entering the wet season causes a sharp rise in TP concentration, triggering algal blooms. During the winter low-water period, a combination of artificial wetlands and sediment capping achieved a 70% reduction in TP. This approach is similar in effectiveness to the JLB strategy of sediment dredging and source control during dry years, but Lake Erie relies on physical capping rather than water supplementation [48]. The comparison across scenarios highlights the critical role of sufficient flushing flow in enhancing phosphorus dilution and transport during the dry season, suggesting that optimizing water diversion schemes is essential for achieving comprehensive water quality improvements under flow-limited conditions.

3.3.3. Decision for Optimal 3WRR Projects

Based on the tributary water quality simulation and optimization results, Scenario 13 performed best in the LTB tributary, achieving 190 compliance days, the highest of all scenarios. This can be attributed to a combination of sediment dredging, which reduces internal nutrient release, and water replenishment from the Xizhijiang River, which enhances hydrodynamic flushing and dilution capacity. These measures collectively reduce pollutant concentration and transport time, particularly benefiting tributaries with originally low flow velocity and long hydraulic retention periods. In contrast, scenarios relying solely on source reduction (Group A) showed limited efficacy, especially in the LSK and LTB tributaries, where hydrodynamics restrict the dispersion of pollutants even under reduced external loading. This underscores the importance of combining pollution control with hydraulic interventions to achieve measurable water quality improvements.
In the lake region, Scenario 17 proved most effective under P50 conditions, integrating sluice gate operation, a high-volume water exchange at 26.1 m3/s, comprehensive source control (95%point source reduction and 60% non-point source reduction), and sediment dredging, which addresses multiple stressors simultaneously. The high-volume water exchange disrupts thermal stratification and reduces eutrophication risk by flushing out algae and limiting nutrient accumulation, while dredging further curtails internal nutrient loads. This approach significantly reduced the exceedance events of key pollutants (TP, TN, NH3-N) and stabilized eutrophication dynamics within the lake system, outperforming scenarios with limited water exchange or source control alone.
The divergence in outcomes across scenarios reinforces that effective 3WRR requires context-specific, integrated strategies rather than isolated interventions. Although Scenario 13 and Scenario 17 involve higher initial investment and operational complexity compared to source reduction alone, they provide synergistic benefits that lead to faster, more reliable, and sustainable hydraulic enhancement, water quality improvement, and aquatic ecosystem restoration. Thus, these 3WRR projects are justified not only by their compliance performance but also by their ability to holistically restore aquatic ecosystem functions in both tributary and lake environments.

4. Conclusions

This study presents an intelligent platform of remediation and restoration project optimization based on 3L4C platform architecture, aimed at addressing the longstanding and complex issues in 3WRR. By integrating multi-source data fusion, coupled multi-process modeling, and dynamic decision optimization, the platform overcomes critical barriers in the traditional single-strategy management approaches. Applied to the Jinshan Lake Basin, the platform demonstrated its efficacy in evaluating 894 remediation and restoration scenarios. The results highlight that isolated pollution source control plans, such as a 95% reduction in point and non-point sources, yield <2% compliance with Class IV standards. In contrast, coordinated engineering–ecological strategies, combining sediment dredging, high-volume water replenishment from the Xizhijiang River, sluice gate regulation, and water exchange, significantly enhanced water quality outcomes and stabilized trophic status at moderate levels. The platform’s ability to reveal complex trade-offs and optimize tailored interventions offers a transferable solution for sustainable water remediation and restoration in diverse river–lake systems. Additionally, consideration can be given to incorporating a surface water–groundwater exchange module, which was not accounted for in the Jinshan Lake watershed, to provide a more accurate solution for the restoration and rehabilitation of the water environment. Future applications will extend this framework to more river basins, leveraging AI-driven real-time control to support adaptive 3WRR in the face of intensifying global change. With the widespread adoption of cloud computing and AI technologies across various industries, the application costs of intelligent platforms in water environment remediation and restoration will be significantly reduced. Both computational accuracy and speed will experience substantial advancements, leading to the broader implementation of the integrated three-water model.

Author Contributions

W.J.: data curation, formal analysis, investigation, software, writing—review and editing; X.L.: software, writing—review and editing. Y.W.: formal analysis, investigation; Y.Z.: data curation, formal analysis; X.C.: resources, supervision; Y.S.: data curation, software; J.C.: resources, formal analysis, supervision, writing—review and editing; W.Z.: conceptualization, funding acquisition, methodology, project administration, supervision, writing—review and editing. All authors have read and agreed to the published version of the manuscript.

Funding

This study was supported by National Key R&D Program of China (Grant No. 2023YFC3209104) and by the Research and Demonstration of Water Environment Risk Assessment and Early Warning Technology in the Three Gorges Reservoir Area and Its Upstream Basins (Grant No. 2013ZX07503-001).

Data Availability Statement

Data will be made available on request.

Acknowledgments

The authors are thankful to Huizhou Water Quality Testing Services Ltd., for offering water quality monitoring.

Conflicts of Interest

Author Wenyang Jiang was employed by the company Guizhou Wujiang Science and Technology of Laboratory Co., Ltd. Author Jun Chen was employed by the company Central-Southern Safety & Environment Technology Institute Co., Ltd. The remaining authors declare that the research was conducted in the absence of any commercial or financial relationships that could be construed as a potential conflict of interest.

References

  1. Zhang, W.S.; Zhang, Z.Q.; Peng, H.; Li, L.; Zhang, X.; Xia, H.; Zhang, L. Water quality variations of Jinshan Lake Basin in Guangdong, Hong Kong and Macao Great Bay Area. Water Resour. Prot. 2021, 37, 1–8. [Google Scholar]
  2. Zhang, W.S.; Wang, H.; Zhou, F. Application prospects of key technologies for synergistic management of water resource-water environment-water ecology in Yangtze River Basin incontext of building ecological civilization. Yangtze River 2023, 54, 8–13. [Google Scholar]
  3. Cao, J.X.; Sun, Q.; Zhao, D.H.; Xu, M.Y.; Shen, Q.S.; Wang, D.; Wang, Y.; Ding, S.M. A critical review of the appearance of black-odorous waterbodies in China and treatment methods. J. Hazard. Mater. 2020, 385, 121511. [Google Scholar] [CrossRef]
  4. Ding, X.W.; Dong, X.S.; Hou, B.D.; Fan, G.H.; Zhang, X.Y. Visual platform for water quality prediction and pre-warning of drinking water source area in the Three Gorges Reservoir Area. J. Clean. Prod. 2021, 309, 127398. [Google Scholar] [CrossRef]
  5. Zhang, S.Q.; Song, Y.C.; Zhang, P.Y.; Zou, Y. Distribution dynamics of waterbirds in Dongting Lake and surrounding lakes. Anim. Biol. 2025, 75, 75–94. [Google Scholar] [CrossRef]
  6. Yang, H.; Xu, H.; Huntingford, C.; Ciais, P.; Piao, S.L. Strong direct and indirect influences of climate change on water yield confirmed by the Budyko framework. Geogr. Sustain. 2021, 2, 281–287. [Google Scholar] [CrossRef]
  7. Slaymaker, O. Research developments in the hydrological sciences in Canada (1995–1998): Surface water—Quantity, quality and ecology. Hydrol. Process. 2020, 14, 1539–1550. [Google Scholar] [CrossRef]
  8. Wan, Z.H.; Wan, R.R.; Ahmad, S.; Eyvaz, M. Editorial: Sustainable development on water resources management, policy and governance in a changing world. Front. Environ. Sci. 2023, 11, 1297585. [Google Scholar] [CrossRef]
  9. Zekri, S.; Jabeur, N.; Gharrad, H. Smart water management using intelligent digital twins. Comput. Inf. 2022, 41, 135–153. [Google Scholar] [CrossRef]
  10. Chen, G.; Zhang, W.S.; Liu, X.; Peng, H.; Zhou, F.; Wang, H.; Ke, Q.; Xiao, B.Y. Development and application of a multi-centre cloud platform architecture for water environment management. J. Environ. Manage. 2023, 344, 118670. [Google Scholar] [CrossRef]
  11. Ge, X.F.; Hou, D.B.; Zhang, G.X.; Huang, P.J. Cloud simulation platform for water environment assessment. Appl. Mech. Mater. 2013, 316–317, 670–673. [Google Scholar] [CrossRef]
  12. Wang, T.; Duan, J.J.; Zhai, J.; Zhao, J.; Gao, Y.L.; Gao, F.; Zhang, L.L.; Zhao, Y.F. Research on a cloud model intelligent computing platform for water resource management. J. Hydroinf 2024, 26, 2902–2927. [Google Scholar] [CrossRef]
  13. Dwevedi, R.; Krishna, V.; Kumar, A. Environment and big data: Role in smart cities of India. Resources 2018, 7, 64. [Google Scholar] [CrossRef]
  14. Gohil, J.; Patel, J.; Chopra, J.; Chhaya, K.; Taravia, J.; Shah, M. Advent of Big Data technology in environment and water management sector. Environ. Sci. Pollut. Control Ser. 2021, 28, 64084–64102. [Google Scholar] [CrossRef]
  15. Liu, X.; Pan, Y.; Li, N. Big data platform of provincial key basin’s ecological environment information. IOP Conf. Series. Earth Environ. Sci. 2019, 295, 12073. [Google Scholar] [CrossRef]
  16. Loos, S.; Shin, C.M.; Sumihar, J.; Kim, K.; Cho, J.; Weerts, A.H. Ensemble data assimilation methods for improving river water quality forecasting accuracy. Water Res. 2020, 171, 115343. [Google Scholar] [CrossRef]
  17. Guan, G.; Wang, Y.; Yang, L.; Yue, J.; Li, Q.; Lin, J.; Liu, Q. Water-quality assessment and pollution-risk early-warning system based on web crawler technology and LSTM. Int. J. Environ. Res. Public Health 2022, 19, 11818. [Google Scholar] [CrossRef]
  18. Arsenault, K.R.; Kumar, S.V.; Geiger, J.V.; Wang, S.; Kemp, E.; Mocko, D.M.; Beaudoing, H.K.; Getirana, A.; Navari, M.; Li, B.; et al. The Land surface Data Toolkit (LDT v7.2)—A data fusion environment for land data assimilation systems. Geosci. Model. Dev. 2018, 11, 3605–3621. [Google Scholar] [CrossRef]
  19. Tangdamrongsub, N.; Han, S.; Tian, S.; Müller, S.H.; Sutanudjaja, E.H.; Ran, J.; Feng, W. Evaluation of Groundwater Storage Variations Estimated from GRACE Data Assimilation and State-of-the-Art Land Surface Models in Australia and the North China Plain. Rem. Sens. 2018, 10, 483. [Google Scholar] [CrossRef]
  20. Wang, X.; Zhang, J.; Babovic, V.; Gin, K.Y. A comprehensive integrated catchment-scale monitoring and modelling approach for facilitating management of water quality. Environ. Model. Softw. 2019, 120, 104489. [Google Scholar] [CrossRef]
  21. Chen, C.; Wang, X.Y.; Liu, Z.W.; Zhao, Z.Y.; Wang, X.K. Intelligent Information System Design on Water Quality Monitoring, Water Bloom Prediction and Emergency Treatment Decision-Making. Appl. Mech. Mater. 2011, 128–129, 172–176. [Google Scholar] [CrossRef]
  22. Park, D.S.; You, H. A digital twin dam and watershed management platform. Water 2023, 15, 2106. [Google Scholar] [CrossRef]
  23. Mure-Ravaud, M.; Binet, G.; Bracq, M.; Perarnaud, J.J.; Fradin, A.; Litrico, X. A web based tool for operational real-time flood forecasting using data assimilation to update hydraulic states. Environ. Model. Softw. 2016, 84, 35–49. [Google Scholar] [CrossRef]
  24. Anagnostou, E.; Gianni, A.; Zacharias, I. Ecological Modeling and Eutrophication—A Review. Nat. Resour. Model. 2017, 30, e12130. [Google Scholar] [CrossRef]
  25. Li, J.; Yang, W.; Li, W.; Mu, L.; Jin, Z. Coupled Hydrodynamic and Water Quality Simulation of Algal Bloom in the Three Gorges Reservoir, China. Ecol. Eng. 2018, 119, 97–108. [Google Scholar] [CrossRef]
  26. Garuba, O.A.; Rasch, P.J. A partial coupling method to isolate the roles of the atmosphere and ocean in coupled climate simulations. J. Adv. Model. Earth Syst. 2020, 12, e2019MS002. [Google Scholar] [CrossRef]
  27. Duquesne, F.; Vallaeys, V.; Vidaurre, P.J.; Hanert, E. A Coupled Ecohydrodynamic Model to Predict Algal Blooms in Lake Titicaca. Ecol. Model. 2021, 440, e109418. [Google Scholar] [CrossRef]
  28. Larabi, S.; Schnorbus, M.A.; Zwiers, F. A coupled streamflow and water temperature (VIC-RBM-CE-QUAL-W2) model for the Nechako Reservoir. J. Hydrol. Reg. Stud. 2022, 44, 101237. [Google Scholar] [CrossRef]
  29. Jiang, J. Study on financial cost evaluation of urban water environment management and pollution prevention and control. AQUA-Water Infrastruct. Ecosyst. Soc. 2024, 73, 662–673. [Google Scholar] [CrossRef]
  30. Brandmeyer, J.E.; Karimi, H.A. Coupling Methodologies for Environmental Models. Environ. Model. Softw. 2000, 15, 479–488. [Google Scholar] [CrossRef]
  31. Hallouin, T.; Bruen, M.; Christie, M.; Bullock, C.; Kelly-Quinn, M. Challenges in Using Hydrology and Water Quality Models for Assessing Freshwater Ecosystem Services: A Review. Geosciences 2018, 8, e45. [Google Scholar] [CrossRef]
  32. Janga, R.M.; Nagesh, K.D. Evolutionary algorithms, swarm intelligence methods, and their applications in water resources engineering: A state-of-the-art review. H2Open J. 2020, 3, 135–188. [Google Scholar] [CrossRef]
  33. Suwal, N.; Huang, X.; Kuriqi, A.; Chen, Y.; Pandey, K.P.; Bhattarai, K.P. Optimisation of cascade reservoir operation considering environmental flows for different environmental management classes. Renew. Energy 2020, 158, 453–464. [Google Scholar] [CrossRef]
  34. Farahi, M.M.; Ahmadi, M.; Dabir, B. Model-based water-flooding optimization using multi-objective approach for efficient reservoir management. J. Pet. Sci. Eng. 2021, 196, 107988. [Google Scholar] [CrossRef]
  35. Huang, G.Q.; Guo, S.X.; Xiong, W. Model Design of Self-service Intelligent Resource Management System Based on Cloud Platform. Adv. Mat. Res. 2014, 846, 1491–1495. [Google Scholar] [CrossRef]
  36. Dai, L.Q.; Mao, J.Q.; Wang, Y.; Dai, H.C.; Zhang, P.P.; Guo, J.L. Optimal operation of the Three Gorges Reservoir subject to the ecological water level of Dongting Lake. Environ. Earth Sci. 2016, 75, 1111. [Google Scholar] [CrossRef]
  37. Zhang, J.Q.; Liu, S.Q.; Luo, Q.Q.; Zhang, M.; Song, C.S. Analysis of spatial and temporal differences and influencing factors of urban land use efficiency based on DEA: Taking Guizhou Province as an example. Value Eng. 2025, 44, 62–64. [Google Scholar] [CrossRef]
  38. Niu, P.T.; Wang, Z.; Wang, J.; Cao, Y.; Peng, H. Estimation and prediction of water conservation in the upper reaches of the Hanjiang River Basin based on InVESTPLUS model. PeerJ 2024, 12, e18441. [Google Scholar] [CrossRef]
  39. Liu, X.; Zhang, W.S.; Wang, Y.; Peng, H.; Jiang, A.N.; Li, A.; Zhang, X.; Wang, H. An Improved Coupled Water Quantity-Quality-ecology Model Incorporating Diurnal Cycle As a Key Factor Affecting Algal Blooms and Application in Large Rivers. J. Environ. Manag. 2025, 376, 124497. [Google Scholar] [CrossRef]
  40. Lin, C.; Hu, W.P.; Xu, J.D.; Ma, R.H. Development of a visualization platform oriented to Lake water quality targets management—A case study of Lake Taihu. Ecol. Inf. 2017, 41, 40–53. [Google Scholar] [CrossRef]
  41. Tu, H.W.; Wang, L.; Zhang, X.; Liang, Y.; Shen, S.J.; Wen, D.; Peng, H. Research on the Restoration of Urban Lake Water Environment under the Impact of River Network. China Rural. Water Hydropower 2020, 12, 101–105. [Google Scholar]
  42. Yang, L.; Zhang, W.S.; Zhou, F.; Peng, H.; Lin, Y.N.; Chen, G.; Li, A. Decision support platform for coordinated regulation of three waters in Jinshan Lake Basin. Water Sav. Irrig. 2024, 11, 46–53. [Google Scholar]
  43. Zhang, W.S.; Wang, H. Cloud platform and application of watershed water environment and aquatic ecology intelligent management. J. Hydraul. Eng. 2021, 52, 142–149. [Google Scholar] [CrossRef]
  44. Zhang, W.S.; Li, L.; Peng, H.; Zhang, X.; Xia, H.; Zhang, Z.Q. Dynamic water environment capacity of urban river network for water environment improvement. Water Resour. Prot. 2022, 38, 167–175. [Google Scholar]
  45. Zheng, G.D. Analysis on Hydrogeological Characteristics of Jinshan New Town Planning Area in Huizhou City. China Resour. Compr. Util. 2022, 40, 10. [Google Scholar]
  46. Qin, B.; Paerl, H.W.; Brookes, J.D.; Liu, J.; Jeppesen, E.; Zhu, G.; Zhang, Y.; Xu, H.; Shi, K.; Deng, J. Why Lake Taihu continues to be plagued with cyanobacterial blooms through 10 years (2007–2017) efforts? Sci. Total Environ. 2020, 745, 140834. [Google Scholar] [CrossRef]
  47. Ma, T.F.; Shi, L.; Li, Z.M.; Wu, C.Q.; Huang, Y.B.; Lu, X.Z. Eutrophication Trend Analysis and Forewarning Model Construction of Water Source Reservoirs: Gaozhou Reservoir, China. Ecohydrology 2021, 15, e2371. [Google Scholar] [CrossRef]
  48. Prater, C.; Frost, P.C.; Howell, E.T.; Watson, S.B. Variation in particulate C: N: P stoichiometry across the Lake Erie watershed from tributaries to its outflow. Limnol. Ocean. 2017, 62, S194–S206. [Google Scholar] [CrossRef]
Figure 1. Process of 3WRR project optimization.
Water 17 02986 g001
Figure 2. The location of Jinshan Lake Basin.
Water 17 02986 g002
Figure 3. (ac) The subcatchments, topographic sections, and grids setting of Jinshan Lake Basin.
Water 17 02986 g003
Figure 4. Decision support platform for coordinated regulation of three waters in Jinshan Lake basin.
Water 17 02986 g004
Figure 5. Annual Class IV compliance days for COD, NH3-N, and TP in HQS, LSK, and LTB under all 13 scenarios. (ac) represent annual Class IV compliance days that Heqiaoshui, Lengshuikeng, and Liantangbu under 13 different scenarios, with COD as the indicator; (df) represent annual Class IV compliance days that Heqiaoshui, Lengshuikeng, and Liantangbu under 13 different scenarios, with NH3-N as the indicator; (gi) represent annual Class IV compliance days that Heqiaoshui, Lengshuikeng, and Liantangbu under 13 different scenarios, with TP as the indicator).
Water 17 02986 g005
Figure 6. Spatial–temporal variations in COD concentrations in HQS, LSK, and LTB under Group B. (ac) represent the COD distribution of Heqiaoshui, Lengshuikeng, and Liantangbu under no replenishment; (df) represent the COD distribution of Heqiaoshui, Lengshuikeng, and Lian-tangbu under recycled water reuse; (gi) represent the COD distribution of Heqiaoshui, Lengshuikeng, and Lian-tangbu under recycled water reuse + local Water Source (0.5 m3/s); (jl) represent the COD distribution of Heqiaoshui, Lengshuikeng, and Lian-tangbu under recycled water reuse + Xizhijiang replenishment (26.1 m3/s × 4 days).
Water 17 02986 g006
Figure 7. Spatial–temporal variations in NH3-N concentrations in HQS, LSK, and LTB under Group B. (ac) represent the NH3-N distribution of Heqiaoshui, Lengshuikeng, and Liantangbu under no replenishment; (df) represent the NH3-N distribution of Heqiaoshui, Lengshuikeng, and Lian-tangbu under recycled water reuse; (gi) represent the NH3-N distribution of Heqiaoshui, Lengshuikeng, and Lian-tangbu under recycled water reuse + local Water Source (0.5 m3/s); (jl) represent the NH3-N distribution of Heqiaoshui, Lengshuikeng, and Lian-tangbu under recycled water reuse + Xizhijiang replenishment (26.1 m3/s × 4 days).
Water 17 02986 g007
Figure 8. Spatial–temporal variations in TP concentrations in HQS, LSK, and LTB under Group B. (ac) represent the TP distribution of Heqiaoshui, Lengshuikeng, and Lian-tangbu under no replenishment; (df) represent the TP distribution of Heqiaoshui, Lengshuikeng, and Lian-tangbu under recycled water reuse; (gi) rep-resent the TP distribution of Heqiaoshui, Lengshuikeng, and Lian-tangbu under recycled water reuse + local Water Source (0.5 m3/s); (jl) represent the TP distribution of Heqiaoshui, Lengshuikeng, and Lian-tangbu under recycled water reuse + Xizhijiang replenishment (26.1 m3/s × 4 days).
Water 17 02986 g008
Figure 9. Area proportion of different water quality indicators exceeding the standard (Class IV water quality standard) under P10, P50, and P90. (NLAP represents Class IV non-compliance lake area proportion, which using COD, NH3-N, and TP as indicators). (ac) represent area proportion of COD, NH3-N, and TP indicators exceeding the standard under the Scenario 14; (df) represent area proportion of COD, NH3-N, and TP indicators exceeding the standard under the Scenario 15; (gi) represent area proportion of COD, NH3-N, and TP indicators exceeding the standard under the Scenario 16).
Water 17 02986 g009
Figure 10. Annual process changes in different water quality concentrations under P10, P50, and P90. (ac) represent the fluctuation of each indicator (COD, NH3-N, TP) throughout the year under the Scenario 14; (df) represent the fluctuation of each indicator (COD, NH3-N, TP) throughout the year under the Scenario 15; (gi) represent the fluctuation of each indicator (COD, NH3-N, TP) throughout the year under the Scenario 16).
Water 17 02986 g010
Figure 11. Annual process of trophic status index at different monitoring points under P10 hydrological conditions. EI represents eutrophication index.
Water 17 02986 g011
Figure 12. Annual process of trophic status index at different monitoring points under P50 hydrological conditions.
Water 17 02986 g012
Figure 13. Annual process of trophic status index at different monitoring points under P90 hydrological conditions.
Water 17 02986 g013
Figure 14. Class IV compliance lake area proportion for COD, NH3-N, and TP in under scenarios 17–19. (ac) represent the proportion of days meeting the four water quality classes under different water exchange scenarios, using COD, NH3-N, and TP as indicators in the P50 scenario.
Water 17 02986 g014
Table 1. Database and sources of the Jinshan Lake Basin Platform.
Data TypeData Sources
DEMChinese Academy of Sciences Geospatial Data Cloud
LanduseResource and Environmental Science and Data Centre
SoilInstitute of Soil Science, Chinese Academy of Sciences
MeteorologyChina Meteorological Science Data Sharing Center
River network systemGoogle Earth High-Definition Satellite Map
Hydrology and water qualityHuizhou Water Quality Testing Services Ltd.
Water quality and aquatic ecologyRemote sensing monitoring
Socioeconomic dataStatistical yearbook of counties and cities in the study area
3WRR projectsField investigation and assessment of local water environmental and ecological conditions
Table 2. Representative scenarios for the major tributaries of the Jinshan Lake Basin. (× indicates that the corresponding measure has not been taken, √ indicates that the corresponding measure has been implemented.)
ScenariosHydrological YearsPoint Source Pollution ReductionNon-Point Source Pollution ReductionSediment DredgingRecycled Water ReuseEcological Water Replenishment
Group A1P1095%×××-
2P50
3P90
4P10×95%×××
5P50
6P90
7P10××××
8P50
9P90
Group B10P5095%60%××
11P5095%60%×
12P5090%40%Local Water Source (0.5 m3/s)
13P5090%40%Xizhijiang River water diversion (26.1 m3/s × 4 days)
Table 3. Proportion of Class IV compliance days per year in HQS, LSK, and LTB under Group A scenarios.
Group A ScenariosP10P50P90
HQSLSKLTBHQSLSKLTBHQSLSKLTB
Proportion of Class IV Compliance Days Per Year (%)
Point source reduction alone 95%1.100.820.000.000.000.000.270.270.27
Non-point source reduction alone 95%0.270.270.000.000.000.000.270.000.00
Sediment dredging alone1.100.270.000.000.000.000.270.000.27
Table 4. Proportion of Class IV compliance days per year in HQS, LSK, and LTB under Group B scenarios.
Group B ScenariosProportion of Class IV Compliance Days Per Year (%)
HQSLSKLTB
Scenarios 10No Replenishment12.5719.959.29
Scenarios 11Recycled water reuse24.3213.939.29
Scenarios 12Recycled water reuse + Local Water Source (0.5 m3/s)8.476.014.64
Scenarios 13Recycled water reuse + Xizhijiang Replenishment (26.1 m3/s × 4 days)10.1116.9451.91
Table 5. Representative scenarios for the lake of the Jinshan Lake Basin. (× indicates that the corresponding measure has not been taken, √ indicates that the corresponding measure has been implemented).
ScenariosHydrological YearsPeriodSluice Gate ControlEcological Water ExchangePoint Source Pollution ReductionNon-Point Source Pollution ReductionSediment Dredging
Group C14P10annual××95×
15P50
16P90
Group D17P50dry seasonwater exchange flows at 26.1 m3/s9560
18water exchange flows at 0.5 m3/s
19water exchange flows at 1 m3/s
Disclaimer/Publisher’s Note: The statements, opinions and data contained in all publications are solely those of the individual author(s) and contributor(s) and not of MDPI and/or the editor(s). MDPI and/or the editor(s) disclaim responsibility for any injury to people or property resulting from any ideas, methods, instructions or products referred to in the content.