Article

Heavy Metal Contamination and Bioaccumulation Patterns from a Ramsar Wetland Tributary, Northern Algeria: A Baseline Assessment

by
Selma Salhi
1,
Mohammed Khalil Mellal
2,*,
Abdelmadjid Chelli
3 and
Rassim Khelifa
4,*
1
Faculty of Natural and Life Sciences, Department of Ecology and Environment, University of Batna 2, Batna 05000, Algeria
2
Centre de Recherche en Technologies Agro-Alimentaires, Route de Targa Ouzemmour, Campus Universitaire, Bejaia 06000, Algeria
3
Université de Bejaia, Faculté des Sciences de la Nature et de la Vie, Laboratoire de Zoologie Appliquée et d’Écophysiologie Animale, Bejaia 06000, Algeria
4
Biology Department, Concordia University, 7141 Sherbrooke St. W., Montreal, QC H4B 1R6, Canada
*
Authors to whom correspondence should be addressed.
Water 2025, 17(20), 2975; https://doi.org/10.3390/w17202975
Submission received: 4 August 2025 / Revised: 29 September 2025 / Accepted: 9 October 2025 / Published: 15 October 2025
(This article belongs to the Special Issue Water Treatment Technology for Emerging Contaminants, 2nd Edition)

Abstract

Freshwater ecosystems face increasing contamination by heavy metals, yet their transfer patterns remain poorly understood. This study aimed to assess the extent of pollution by ten potential toxic elements (As, Ni, Zn, Pb, Cd, Cr, Fe, Cu, Mn and Se) in water, sediment, Spirogyra sp., and two endemic fish species (Tropidophoxinellus callensis and Luciobarbus callensis) in the El Mellah River. The element concentrations were measured in four matrices using inductively coupled plasma optical emission spectrometry. Bioaccumulation Factor and Trophic Transfer Factor were used to depict bioaccumulation patterns across the ecological strata and two levels of the food web. The results showed that all sediment samples demonstrated very high ecological risk, consistently exceeding critical thresholds (PLI > 1, RI > 600). Contamination factor and geoaccumulation index revealed moderate to extreme contamination by As and Cd throughout all samples. Both fish species exhibited a bio-accumulation affinity for Cr, Cd, Mn, and Zn from water, while concurrently accumulating As from Spirogyra sp. Muscle tissue concentrations of As, Pb, Cr, and Cd in both species exceeded international guideline values. Health risk assessment indicated that children face elevated exposure risks, with Cd intake exceeding safe limits and total hazard quotient surpassing safety thresholds by 2.6-fold, while carcinogenic risks from Cd and Cr exceeded acceptable levels for both adults and children. These findings provide baseline contamination data for this tributary system and highlight elevated risks to both human health (through fish consumption) and ecosystem integrity, indicating the need for targeted monitoring and risk management measures.

Graphical Abstract

1. Introduction

Freshwater ecosystems represent some of Earth’s most vulnerable yet ecologically critical habitats, supporting disproportionately high biodiversity while facing unprecedented contamination pressures from anthropogenic activities [1]. The accelerating pace of industrialization and urbanization has fundamentally altered the chemical composition of aquatic environments, with potentially toxic elements (PTEs) recognized as persistent contaminants of particular concern due to their non-biodegradable nature and propensity for bioaccumulation [2,3]. Understanding the fate and transport of these contaminants in freshwater environments is therefore crucial for developing effective management strategies to protect aquatic biodiversity and human health [3].
The biogeochemical cycling of potentially toxic elements in freshwater systems involves complex interactions between abiotic and biotic components, with sediments serving as both sinks and sources of contamination [4]. Unlike many biodegradable organic pollutants that may degrade over time, PTEs (e.g., As, Pb, Cd, and Cr) persist indefinitely in aquatic systems, cycling between water, sediment, and biotic compartments while accumulating to toxic concentrations in organisms across multiple trophic levels. Primary producers such as algae and aquatic plants play crucial roles as initial bioaccumulation vectors, transferring contaminants from the physical environment into food webs through processes of bioconcentration and bioaccumulation [5]. Subsequently, trophic transfer mechanisms facilitate the movement of these contaminants up food chains, often resulting in biomagnification where apex predators exhibit the highest tissue concentrations [6]. This phenomenon poses significant risks not only to aquatic biodiversity but also to human populations that depend on freshwater resources for consumption and livelihood activities [7].
Mediterranean and North African freshwater systems face particularly acute contamination challenges due to the convergence of intensive agricultural practices, industrial development, and limited water resources [8,9]. These pressures have contributed to the eroded natural habitat: one-third (~32%) of Mediterranean freshwater fish are now classified as threatened. Algeria’s freshwater wetlands amplify these concerns; According to MedWet [10], Algeria hosts 2375 wetlands including 50 (~2%) Ramsar-designated sites of international importance, reflecting both high biodiversity and conservation value. However, intensive agriculture, mining, and rapid urbanization have led to widespread contamination across these sensitive ecosystems. Riverine heavy metal pollution has emerged as a particularly critical environmental issue, with multiple waterways exhibiting elevated concentrations of lead, cadmium, chromium, zinc, and other toxic elements from diverse anthropogenic sources, including mining operations, industrial effluents, agricultural runoff, and inadequately treated domestic waste [11,12,13]. These contamination patterns pose heightened risks in systems harboring endemic species, where localized pollution events can threaten unique evolutionary lineages with restricted geographic distributions and limited adaptive capacity to environmental stressors.
In North African freshwater systems, multi-compartment studies of heavy metal bioaccumulation in endemic species of conservation concern are notably absent. The El Mellah River in Northern Algeria represents a clear case of this research gap— a habitat for endemic fish and a tributary of the Ramsar-designated Chott el Hodna wetland, home to threatened waterbirds, yet lacking comprehensive contamination assessment. Previous studies within the region revealed that algal species in the El Mellah basin already contain heavy metal concentrations well above guideline values [14], implying that contamination is entering the food web.
In this study, we present the first integrated, multi-compartment assessment of heavy-metal contamination and bioaccumulation in the El Mellah River system. We (1) quantified potentially toxic elements in four distinct environmental matrices, (2) evaluated bioaccumulation and biomagnification across these compartments, and (3) estimated associated ecological and human-health risks. Our findings offer baseline data to help inform contamination management strategies for the river’s endemic fauna and the broader Ramsar-designated wetland ecosystem, as well as human health risk assessment for local communities.

2. Materials and Methods

2.1. Study Area

El Mellah is a permanent river located in northeastern Algeria in M’sila province (Figure 1). It permeates the Shatt al-Hudna (a large endorheic salt lake) and drains the arid Atlas Mountains. The water depth therein varies depending on the percentage of seasonal rainfall and temperature (the high summer temperatures cause the water to evaporate, which reduces the water volume in the ravine). M’sila province is characterized by a semi-arid bioclimatic stage with moderate fluctuation; based on Köppen’s climate classification, the region exhibits a Bsk climate, characterized by a steppe arid climate with cold winters [15]. The riparian vegetation therein was mainly represented by shrubs of Nerium oleander L., Juncus maritimus Lam, Argania spinosa, Astragalus armatus, Atriplex halimus, and Peganum harmala. The waters of the El Mellah River are home to two notable fish species from the Cyprinidae family—the Algerian barb Luciobarbus callensis (Valenciennes, 1842) and the Maghreb bleak Tropidophoxinellus callensis (Guichenot, 1850). These species are endemic to the Maghreb region in North Africa. While the Algerian barb is listed as a species of least concern in the IUCN Red List, the Maghreb Bleak is currently listed as data deficient.

2.2. Collection of Water, Fish, Algae, and Sediment Samples

Sampling was conducted in June 2021 to avoid both the late summer’s extremely low water levels and winter’s elevated water levels. The selection of the sampling locations was based on anthropogenic pressure, with sites chosen near pollution sources, such as a small bridge passage where car oils are often spilled into the river, places with agricultural activities occurring along the riverbanks, and areas of urban activity where local wastewater is discharged into the river. To ensure representative environmental conditions rather than point-source effluent, sites were not positioned directly at discharge outlets. Additionally, accessibility was considered, favoring sites easily reached by foot or vehicle. The presence of target fish species was also prioritized, using preliminary surveys and historical data to select areas with high fish abundance while also considering the popularity of these sites for local fishing activities to assess the potential human health risks from consuming the selected fish species.
Our sampling was conducted at three sites along the El Mellah River (as shown in Figure 1). Water samples (1 L) were collected in polyethylene water bottles from the sampling sites. Prior to field use, the polyethylene water bottles and their lids were soaked overnight in 1% ultrapure nitric acid, then triple-rinsed with ultrapure (bi-distilled) water and air-dried in a clean area of the laboratory. At these same locations, fish, algae (Spirogyra sp.), and sediment were also collected. A total of six fish specimens were obtained, representing three L. callensis and three T. callensis, captured using a 10 mm mesh size fyke net suitable for shallow water bodies and streams. The algae samples were thoroughly washed, rinsed with ultrapure water, and stored in zipped laboratory-grade polyethylene bags. Three sediment samples were collected from each sampling point at a depth of 5 cm. All samples—including acid-treated water bottles with lids, fish specimens, algae bags, and sediment bags—were kept on ice in a single insulated cooler and transported promptly to the laboratory for analysis and dissection of fish muscle tissue.

2.3. Physical and Chemical Parameter Measurement

The assessment of water quality in the El Mellah River included measurements of temperature, pH, turbidity, electrical conductivity (EC), total hardness (TH), total dissolved solids (TDS), salinity, and dissolved oxygen (DO). Additionally, major cations (Ca2+, K+, Na+, Mg2+) and anions (Cl, SO42−, Fe2+, PO43−, NO2, NO3, NH4+) were analyzed. The methods for these measurements followed the guidelines provided by the American Public Health Association (APHA) and the International Organization for Standardization [16]. Detailed methods and standards used for each parameter are provided in Supplementary Table S1. All measurements were conducted in triplicate, with mean values calculated for each analysis.

2.4. Digestion Methods for PTEs Concentration in Different Strata

The sediment samples, with a particle size ˂ 250 µm, were mineralized following the European international standard NF X 31-147 (soil quality; loss on ignition method). A 0.250 g test sample was placed in a high-quality quartz or platinum capsule and heated in an oven at 450 °C for 3 h for complete mineralization. After cooling, 5 mL of hydrofluoric acid and 1.5 mL of perchloric acid were added, and the capsule was evaporated at 160 °C. The residue was dissolved with 1 mL of hydrochloric acid and deionized water on a hotplate. The resulting solution was transferred to a 50 mL polypropylene volumetric flask and brought to volume with distilled water. To remove any remaining particulate matter and impurities, the solution was filtered using a suitable filtration apparatus.
Water sample digestion was conducted following the European international standard ISO 15587-1:2002 (aqua regia). A precisely measured 25 ± 0.1 mL test sample was extracted from a well-stirred water sample. Sample handling was conducted under fume hoods for safety and ventilation. To the test sample, 6.0 ± 0.1 mL of hydrochloric acid and 2.0 ± 0.1 mL of nitric acid were added in a digestion vessel, which was then placed on a hotplate. Acid digestion was carried out at 103 °C for 120 to 480 min for complete dissolution. After cooling, the reflux condenser was rinsed with distilled water, and the rinse water was collected in the digestion vessel. The sample was transferred to an acid-rinsed volumetric flask, the digestion vessel was washed with distilled water, and the filtrate was collected in the same volumetric flask. The volumetric flask was then filled to the mark, and the required reagents were added for further processing and analysis.
For the analysis of algae and fish species muscle tissues, a precisely measured amount of 0.250 g of the wet tissue was weighed to the nearest 0.5 mg and transferred to a high-quality quartz or platinum capsule. The capsule was placed in an oven and heated gradually to 450 °C for 3 h to ensure complete mineralization. After cooling to room temperature, 6.0 ± 0.1 mL of hydrochloric acid, 2.0 ± 0.1 mL of nitric acid, and 1.0 ± 0.1 mL of perchloric acid were added to the mineralized tissue in the capsule. The mixture was then acid-digested for 4–6 h at 103 °C under fume hoods. After cooling, the digested samples were filtered through Whatman No. 42 filter paper and diluted with distilled water to a final volume of 50 mL.

2.5. Elemental Analysis, Quality Assurance and Quality Control

All prepared sample solutions were analyzed using inductively coupled plasma optical emission spectrometry (ICP-OES Optima 8000 DV, Perkin Elmer, Toronto, ON, Canada), to measure the concentrations of elements, including chromium (Cr), manganese (Mn), nickel (Ni), zinc (Zn), copper (Cu), iron (Fe), arsenic (As), cadmium (Cd), lead (Pb), and selenium (Se). The detailed operating conditions are provided in Supplementary Materials (Table S2). Analytical blanks were processed in parallel with samples, following identical digestion procedures using the same reagents but without sample matrices to monitor and correct for potential environmental or reagent contamination. Calibration was performed with certified mono-element standards (ICP Standard VIII, AccuStandard, New Haven, CT, USA) at 1 g/L concentration, from which multi-element working standards (10, 50, and 100 µg/L) were prepared in 1% HNO3 and preserved at 4 °C. These were used to construct calibration curves spanning 0–100 µg/L, exhibiting excellent linearity (R2 ≥ 0.99) for all elements.
Each sample matrix was analyzed in triplicate alongside procedural blanks, with background contamination remaining negligible as confirmed by blank measurements (Supplementary Table S3). Method validation included determination of detection limits (LoDs) and quantification limits (LoQs) for each element, along with precision assessments (<5% RSD across replicates) and accuracy verification through matrix spike recoveries (89–105%, n = 5). Additional details regarding method validation, limits of detection (LoDs), quantification (LoQs), accuracy, and precision are available in Supplementary Materials (Tables S3 and S4). All biological tissue concentrations (algae and fish muscle) are reported on a wet weight basis for consistency with food safety standards and risk assessment protocols.

2.6. Bioaccumulation and Trophic Transfer Factors Measurement

The bioaccumulation factor (BAF) was employed to quantify the equilibrium partitioning of PTEs between biota and ambient water in the El Mellah River strata. BAF is defined as the ratio of the element concentration in the organism (at or near steady state) to that in the surrounding water [17], and is calculated as:
BAF = CM organism/CM Water
where CM organism is the concentration in an organism (mg/kg) and CM Water is the concentration in water (µg/L). BAF can be categorized according to the following ranges: BAF < 1 means low probability of accumulation, 1 < BAF < 5 is moderate, and BAF > 5 indicates high bioaccumulative probability [17].
The trophic transfer factor (TTF) is a metric used to quantify the transfer of a specific element from one trophic level to the next in a food web [18]. It is typically calculated as the ratio of the concentration of the substance in the predator species (higher trophic level) to the concentration in its prey species (lower trophic level), as per the given equation:
TTF = CM organism tissue/CM organism prey
where TTF represents the trophic transfer factor from producer level (algae) and the consumer level (fish), and CM organism tissue and CM organism prey refer to the concentrations of the element in extracts of an organism’s tissue and prey on a dry weight basis in fish and algae, respectively. This investigation is informed by the work of Salhi et al. [19], who previously studied the diet of Cyprinids in the same river and identified Spirogyra sp. as a primary food source for these species.

2.7. Contamination and Ecological Risk Measurement

2.7.1. Geoaccumulation Index

The geoaccumulation index [20] is a quantitative measure of the contamination degree by elements in sediments in an aquatic environment. It has been applied widely to the evaluation of soil contamination. According to Taylor and Mclennan [21], Igeo is expressed by the following equation:
I g e o = l o g 2 B n 1.5 C n
where Cn represents the concentration of an element in the sediment sample, and Bn denotes the background value of that element in the upper continental crust, which is used to evaluate the natural levels of elements in the environment [22]. The value “1.5” is the background matrix correction factor introduced to minimize variations in trace metals due to lithogenic effects. Igeo values range from 0 to >5 and are grouped into seven classes, with 0 indicating uncontaminated soil, 0–1 indicating uncontaminated to moderately contaminated soil, 1–2 indicating moderately contaminated soil, 2–3 indicating moderately to strongly contaminated soil, 3–4 indicating strongly contaminated soil, 4–5 indicating strongly to extremely strongly contaminated soil, and > 5 indicating extremely contaminated soil.

2.7.2. Pollution Load Index and Contamination Factor

In conjunction with the preceding Igeo index measurement, the pollution load index (PLI) was employed to provide a comprehensive assessment of pollution levels within sediment samples. PLI is calculated by determining the contamination factor (CF) of each pollutant and then taking the geometric mean of all the CF values [23]:
P L I = C F 1 × C F 2 × C F 3 × × C F n n
where n is the number of pollutants being assessed, and CF is the contamination factor for each pollutant. The CF is calculated by dividing the concentration of a PTE in a sample by its background concentration Bn (Supplementary Materials Table S4). CF values are classified into four grades to monitor pollution levels over time: low degree (CF < 1), moderate degree (1 ≤ CF < 3), considerable degree (3 ≤ CF < 6), and very high degree (CF ≥ 6). A PLI value >1 signifies the presence of pollution, while a value >1 indicates that there is no contamination.

2.7.3. Ecological Risk Index

Potential ecological risk index (RI) is used to assess the impact of PTE contamination on environmental and ecological processes [24]. RI is calculated using the following formula:
R I = i = 1 n E r i = i = 1 n T r i C f i
E r i represents the potential ecological risk factor of the element being assessed, C f i is the contamination factor, and T r i represents the toxic response factor of the same element (Supplementary Materials Table S4). The potential ecological risk index can be classified as “low risk” for RI < 150; “moderate risk” for 150 ≤ RI < 300; “considerable risk” for 300 ≤ RI < 600; and “very high risk” for RI ≥ 600.

2.8. Health Risk Assessment

To evaluate the human-health implications of heavy-metal exposure through fish consumption, we calculated three key metrics using the mean metal concentrations measured in each species:

2.8.1. Estimated Daily Intake (EDI)

Health risk was estimated considering the average concentrations of all fish muscles and daily heavy metal intake. The specific formula is as follows [25]:
E D I = E F   ×   E D × F I R × C   B W   × A T × 10 3
where C is the concentration of heavy metals in fish muscle (mg kg−1 wet weight), FIR is the fish ingestion rate of 10.7 g person−1 day−1 [26], EF is the exposure frequency of 365 days year−1 [27], ED is the exposure duration of 30 years for adults and 6 years for children [27], BW is the average body weight of 70 kg for adults [28] and 15 kg for children [29], and AT is the averaging time expressed as AT_nc = EF × ED for non-carcinogens (days) and AT_car = 70 years × 365 days year−1 for carcinogens [27]. The EDI values were converted to estimated weekly intake (EWI) by multiplying by 7 (EWI = EDI × 7) to enable direct comparison with Provisional Tolerable Weekly Intake (PTWI) values.

2.8.2. The Carcinogenic Risk (TR)

As well as non-carcinogenic risks, there are also carcinogenic risks in human health risk assessment. All trace metals do not have carcinogenic effects. However, As, Pb, Cd and Cr among the studied heavy metals are considered carcinogens. For carcinogens, the individual risk assessment increases the probability of developing cancer due to exposure to potential carcinogens. The acceptable risk levels of TR for carcinogens ranged from 10−6 to 10−4. The model formula is as follows:
T R = E F   ×   E D × F I R × C   × C F o B W   × A T c a r × 10 3
The oral carcinogenic slope factors (CSFo) values (mg/kg/day) used in this study were: As (1.5), Pb (0.0085), Cd (6.3), Cr (0.5), and Ni (0.91) [25,30]. Other parameters were as previously described. Based on literature recommendations [25], 10% of the total arsenic was assumed to be in the inorganic form for this assessment.

2.8.3. Non-Carcinogenic Health Risk

The target hazard quotient (THQ) and hazard index (HI) represent standardized methodologies developed by the U.S. Environmental Protection Agency (USEPA) for evaluating human health risks associated with heavy metal exposure through dietary intake [27]. These indices provide a quantitative framework for risk characterization, where values below 1 indicate negligible health risks to the exposed population. The calculations are performed using the following equations:
T H Q = E F   ×   E D × F I R × C   R F D × B W   × A T × 10 3 H I =   T H Q
RFDs values (mg kg−1 day−1) for the different heavy metals As, Cr, Ni, Mn, Zn, Cu, Fe, Cd, Pb, and Se are 0.0003, 0.003, 0.02, 0.14, 0.30, 0.04, 0.70, 0.001, 0.0035, and 0.005, respectively [27]. A THQ < 1 indicates no significant non-carcinogenic risk.

2.9. Statistical Analysis

The statistical analysis was carried out using R software 4.3.3. The normality of the data distribution was assessed by the Shapiro–Wilk test. Since the data did not meet the normality assumption, the Kruskal–Wallis test was used to assess the significance of differences in PTE concentrations between the selected strata, including sediment, Spirogyra sp., T. callensis, and L. callensis, followed by pairwise multiple comparisons to identify which specific strata differed, using Dunn’s test package [31]. To control for the family-wise error rate, the Holm–Sidak correction was applied, with a significance threshold of p < 0.025 for the multiple comparisons. Monte Carlo simulations were performed for different age groups (adults and children) using 10,000 iterations in the study area. The results are presented as mean ± standard deviation (SD).

3. Results and Discussion

3.1. River Water Physical and Chemical Parameters

Table 1 summarizes the measured water parameters of the El Mellah River. The pH values in the sampled locations ranged from 7.68 to 8.56, indicating that the water was slightly alkaline. DO helps to evaluate the quality and natural contamination in the surface water. For this study, the average DO concentration was 12.73 ± 3.04 mg/L, which not only falls within the recommended range for sustaining diverse aquatic life but also exceeds the most stringent guideline (G) value of 7 mg/L set by the EU for both salmonid and cyprinid waters (use class I and II) [32]. Notably, total hardness (TH) displayed a mean concentration of 2149 ± 501.26 mg/L, exceeding the local threshold by more than fourfold. Similarly, EC and TDS showed deviations from local regulatory standards with mean recorded concentration of 5971 ± 465.18 µs/cm and 2770.67 ± 455.13 mg/L, respectively.
In terms of water nutrient content, average concentrations of nitrate, nitrite, and ammonium—different forms of nitrogen contributing to eutrophication—were recorded at 21.10 ± 3.47 mg/L, 0.31 ± 0.47 mg/L, and 0.95 ± 0.96 mg/L, respectively. These levels surpassed both local and international guidelines, indicating a notable concern regarding nitrogen pollution, likely originating from sources like agricultural runoff or wastewater. Markedly, the ammonium concentrations not only exceeded both local and international guidelines but also surpassed the imperative values outlined for fish life protection in the EU Directive 78/659/EEC. This discrepancy suggests that current ammonium levels could pose a potential threat to aquatic life within the water body. Chloride concentrations (907.28 ± 25.83 mg/L) significantly exceeded both limits, indicating a high level of salinity in the river. Additionally, sulfate concentrations averaged 486.73 ± 38.67 mg/L, exceeding the local and international guidelines, suggesting potential sulfate pollution sources in the area. Contrastingly, phosphate, sodium, and iron showed average concentrations of 0.08 ± 0.05 mg/L, 24.93 ± 7.09 mg/L, and 0.06 ± 0.04 mg/L, respectively, falling below both the local and international limits.

3.2. Element Concentration Variation and Distribution Patterns

Figure 2 displays the mean concentrations of PTEs measured in the strata of the El Mellah River. The order of the elements’ mean concentrations in water, sediment, Spirogyra sp., L. callensis, and T. callensis samples was Fe > Zn > Mn > As > Ni > Cu > Pb > Cr > Cd > Se, Zn > Mn > Fe > Ni > Cr > Pb > As > Cu > Cd > Se, Zn > Mn > Fe > Ni > Pb > Cr > Cu > Cd > As > Se, Zn > Mn > Cr > Ni > As > Pb > Cu > Fe > Cd > Se, and Zn > Mn > Cr > As > Ni > Pb > Cd > Fe > Cu > Se, respectively. In the water samples, the primary vector for PTE dispersal, Fe, exhibited the highest mean concentration at 82.04 ± 9.53 µg/L, followed by Zn at 57.66 ± 6.39 µg/L and Mn at 31.39 ± 3.71 µg/L. The remaining elements showed considerably lower concentrations: As (12.97 ± 1.85 µg/L), Ni (10.42 ± 2.02 µg/L), Cu (4.31 ± 0.89 µg/L), Pb (4.22 ± 0.90 µg/L), Cr (3.56 ± 0.87 µg/L), and Cd (1.26 ± 0.58 µg/L), while Se remained below detection limits. Comparatively, in the other strata, algae and sediment consistently displayed the highest concentrations for most of elements; for example, the mean concentration of Ni in sediment was 25.02 ± 2.08 mg/kg and in Spirogyra sp. was 12.33 ± 2.34 mg/kg, both notably higher than in other strata. Contrastingly, the muscle tissues of T. callensis and L. callensis typically exhibited the lowest concentrations. This was particularly notable for Cu and Cd, with mean concentrations of 0.85 ± 0.17 mg/kg and 1.36 ± 0.26 mg/kg in T. callensis and L. callensis, respectively. Se concentrations were not detected in any of the samples, indicating that its concentrations, if present, were below the detection limit of the ICP-OES used in this study.
The assessment of PTE concentrations across the studied river strata revealed statistically significant variations (p < 0.05, = 0.006–0.02, Table A1). Interestingly, when comparing element concentrations in both T. callensis and sediment strata, we observed significant differences for all elements, except for As and Cd; the mean concentrations of these elements were significantly higher in the sediment (p < 0.025, = 0.006–0.02). Additionally, As concentrations were significantly higher in sediment compared to Spirogyra sp. (p = 0.01). In contrast, no significant difference was observed in the concentrations of Cd across the studied strata (p > 0.025). Dehbi et al. [14] assessed PTEs concentrations in Spirogyra sp. tissues upstream of the same studied river (Table 2) and found considerably higher concentrations of Cu, Fe, and Pb with 32.66 mg/kg (approximately 8.5 times higher), 1514.17 mg/kg (approximately 30.7 times higher), and 19.98 mg/kg (approximately 4.3 times higher), respectively. However, Zn showed a lower concentration of 40.83 mg/kg (0.48 times) than what was found in the current study. These marked differences strongly suggest an increased level of pollution in the upstream segment of the river. The distribution of PTE concentrations in the biotic strata was predominantly higher in Spirogyra sp., followed by L. callensis and T. callensis. This pattern suggests that algae, being primary producers, tend to accumulate higher concentrations of PTEs, likely due to direct uptake from the water [34]. In general, most of the investigated sediments showed lower PTE levels compared to the literature values for North African river sediments contaminated with PTEs [35]. Nevertheless, Cd, Pb, and As appear to be mildly elevated. The high Cd, Pb, and As sediment content could be a consequence of the agricultural activities carried out in the studied area. Phosphatic fertilizers are generally rich in Cd, Pb, and As and are extensively used and produced in North Africa, including Algeria [36]. The presence of a national road traversing the river can also be associated with these elevated concentrations; various anthropogenic activities associated with road traffic, including tire abrasion, lubricating oil, vehicular exhaust emissions, and brake pad wear, are potential sources of these pollutants [37].

3.3. Bioaccumulation and Biomagnification of Elements

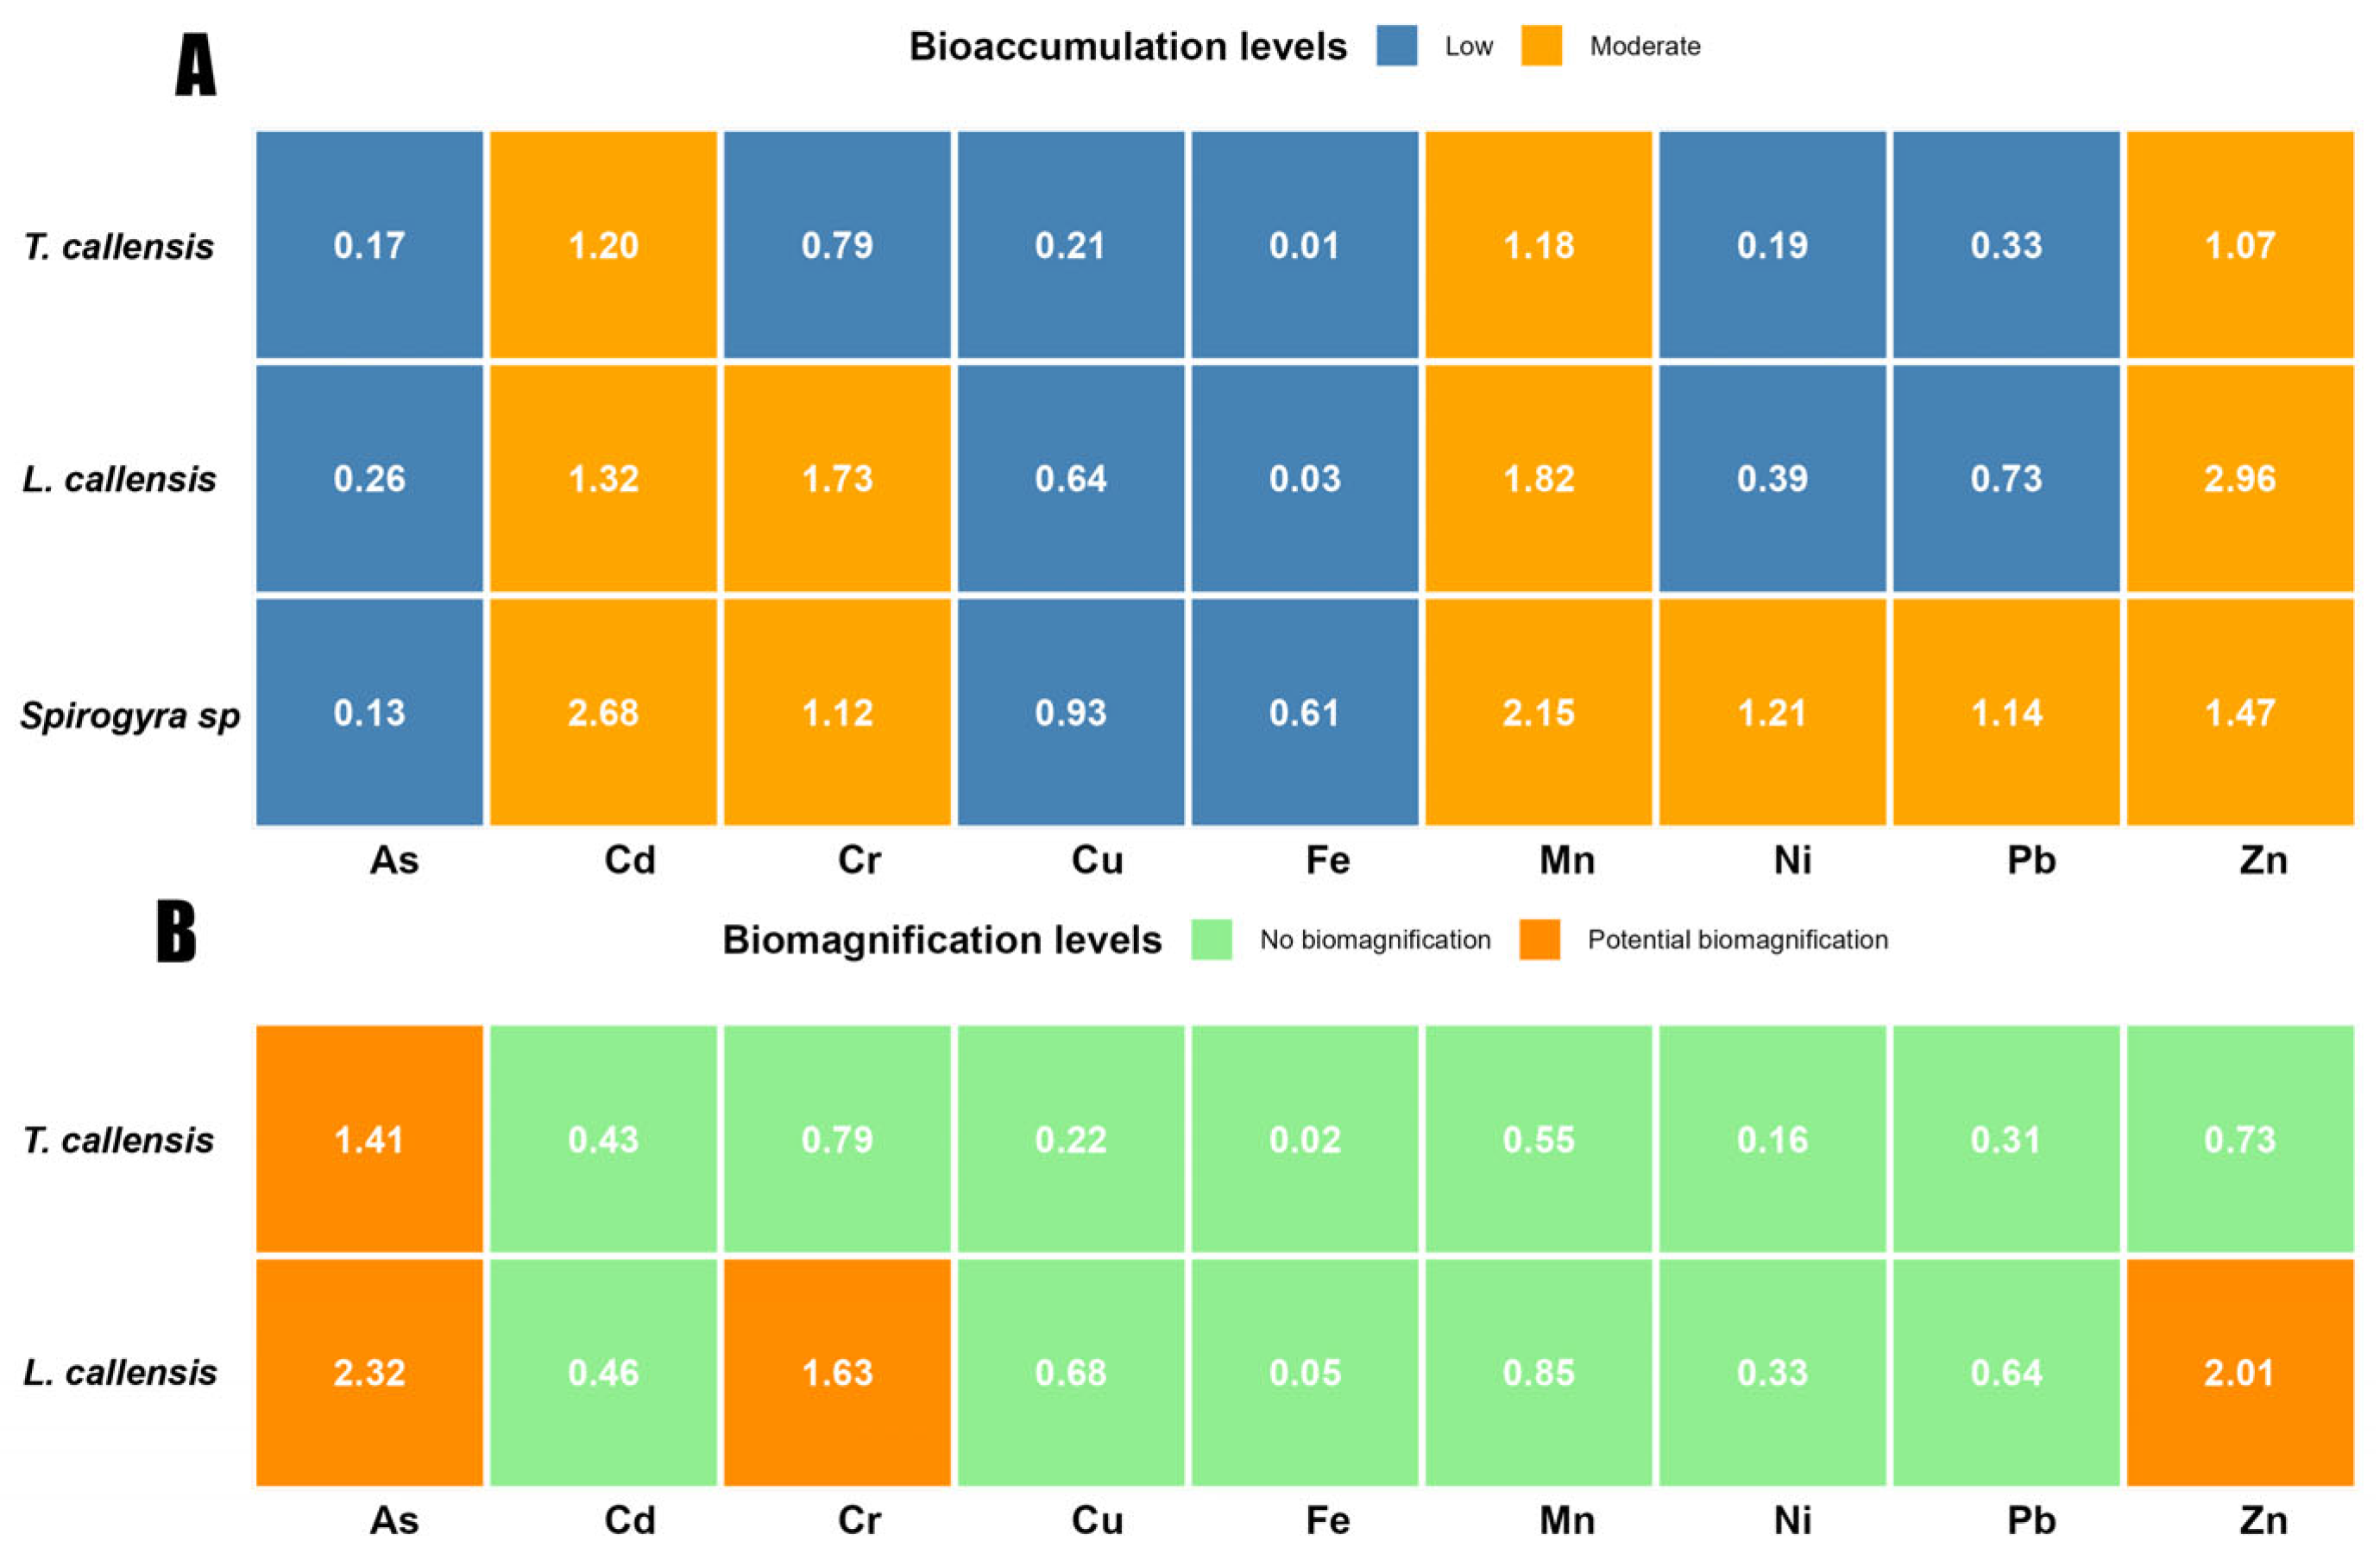
Bioaccumulation factors (BAFs) of PTEs in the aquatic organisms within the river were depicted in Figure 3A. Aquatic organisms have a distinct ability to bioaccumulate different chemicals [38]. In this study, Cd, Mn, and Zn showed a moderate accumulation probability (1 > BAFs > 5) for the three studied organisms. Conversely, As, Cu, and Fe displayed a low accumulative probability (BAF < 1) in those strata. Notably, Ni and Pb exhibited a moderate effect in Spirogyra sp., whereas Cr had the same effect in both Spirogyra sp. and L. callensis. Consequently, considering the bioaccumulative affinity of the investigated PTEs to the selected strata, they can be ranked in the following order: Zn > Mn > Cd > Cr > Ni > Pb > Cu > Fe > As. This variation could potentially be attributed to the high salinity of the river, as it is well documented that high salinity often increases the uptake of hazardous PTEs, such as Cd and Pb, in plants rooted in soil or sediment [39]; freshwater high salinity can affect the speciation of those PTEs, influencing their mobility, reactivity, and bioavailability. Specifically, the speciation of these PTEs in freshwater ecosystems is influenced by the ionic strength of the water, which is directly related to its salinity [39]. Moreover, the presence of chloride ions in saline environments can affect metal speciation and, thus, metal bioavailability and toxic effects [38,40]. Given the high chloride concentration in the El Mellah River, it is plausible that this could influence the bioavailability and uptake of PTEs in all strata.
To investigate the biomagnification of the studied PTEs between Spirogyra sp. and the two selected endemic fish species, L. callensis and T. callensis, the trophic transfer factor (TTF) was utilized (Figure 3B). The TTF values observed for L. callensis were 2.32, 2.01, and 1.63 for As, Zn, and Cr, respectively, indicating that this species may be more susceptible to accumulating these metals from its diet. In contrast, for T. callensis, the TTF value was observed to be 1.4 for As only, suggesting a comparatively lower degree of biomagnification. The difference in biomagnification among different species could be due to differences in bioaccumulation levels, sensitivity to heavy metals, and the specific heavy metals involved [41]. However, these complex processes are influenced by many factors, and further research is needed to clearly explain these disparities.

3.4. Ecological Impact and Health Concerns

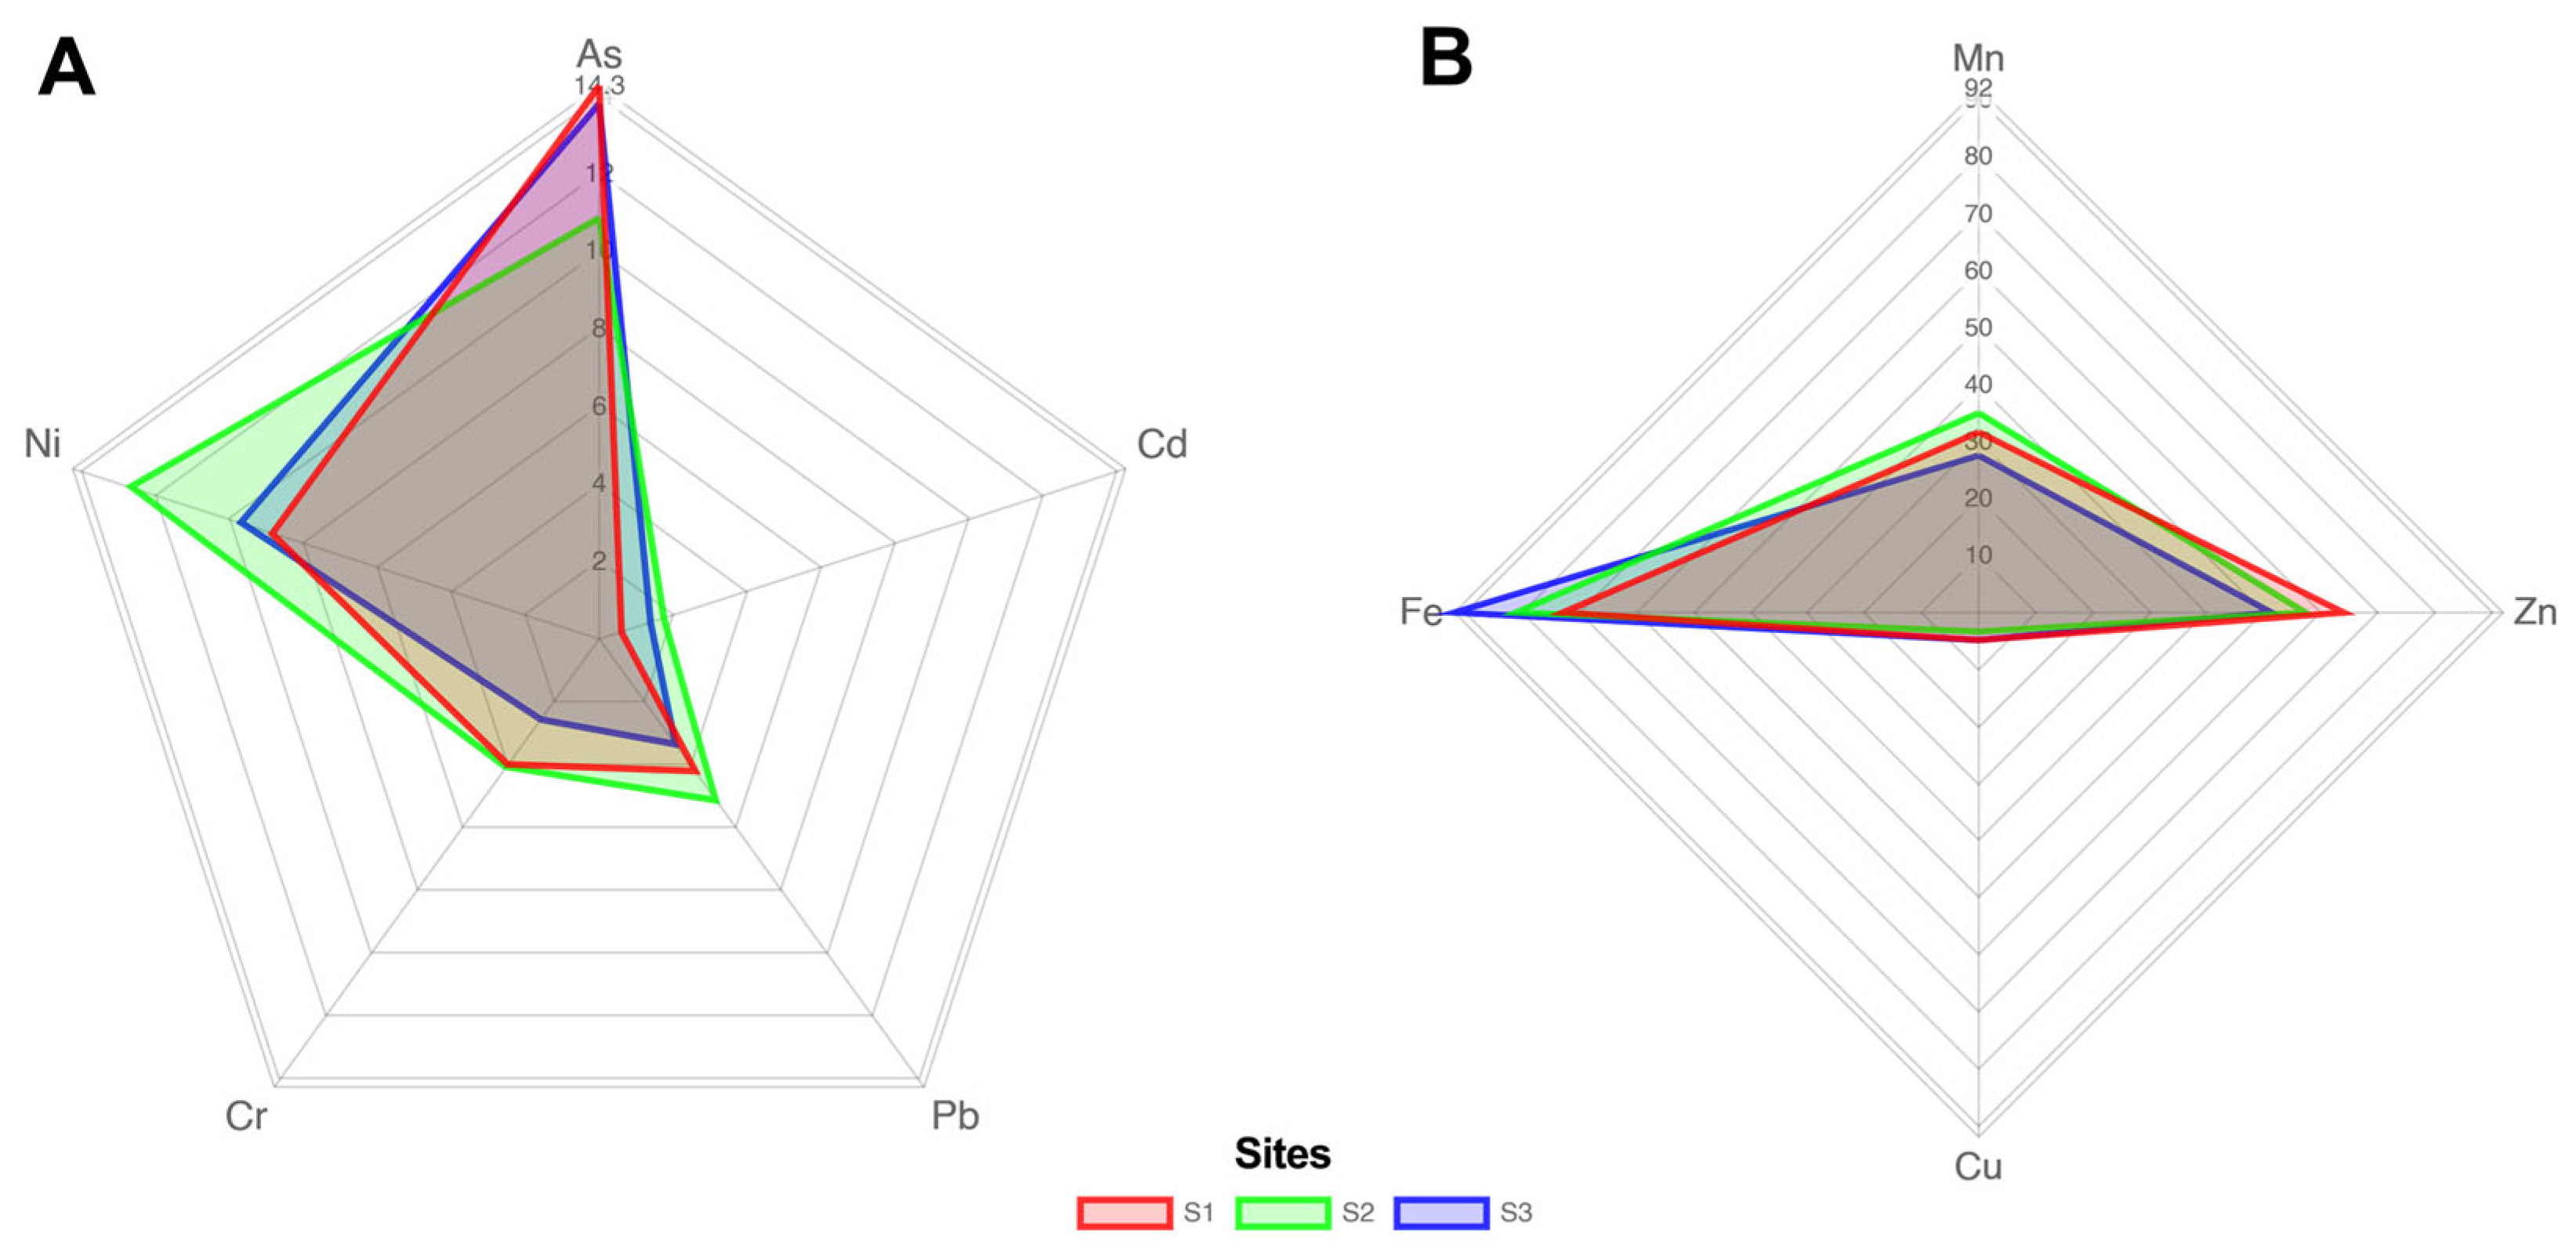
Upon comparing with established safety thresholds, the concentrations of all elements in the water samples adhered to both local and international guidelines for surface freshwater, except for As (Figure 4). The As concentrations exceeded the limits set by the World Health Organization [42]. Continuous exposure to low concentrations of As in freshwater environments can lead to its bioaccumulation in organisms such as T. callensis and L. callensis, particularly in the liver and kidney [43].
The study findings revealed alarmingly high levels of As, Cd, Cr, and Pb in the muscle tissues of both T. callensis and L. callensis. Specifically, T. callensis exhibited concentrations of As (2.10 ± 0.69 mg/kg), Cd (1.29 ± 0.33 mg/kg), Cr (2.69 ± 0.32 mg/kg), and Pb (1.42 ± 0.60 mg/kg), all surpassing the FAO/WHO safety thresholds [44,45]. For L. callensis, the concentrations were even higher: As (3.28 ± 0.35 mg/kg), Cd (1.36 ± 0.26 mg/kg), Cr (5.98 ± 1.21 mg/kg), and Pb (2.94 ± 0.55 mg/kg). Additionally, L. callensis exhibited a remarkably high Zn concentration (168.83 ± 15.40 mg/kg), exceeding FAO/WHO safety limits. The presence of PTEs such as Cd, Cr, As, and Pb raises alarming public health concerns. These metals, even at low exposure levels, can cause extensive organ damage and are classified as known or probable human carcinogens by leading health organizations [46,47]. The high concentrations of As found in the muscle tissues of both fish species suggest even higher accumulations in the liver and kidney, organs that play crucial roles in detoxification and excretion [43]. Acute As toxicity disrupts normal metabolic processes in fish, causing enzymatic, genetic, and immune system failures, which can adversely affect their growth, reproduction, and survival rates [43]. Exposure to Cd, Cr, and Pb is equally detrimental to fish, causing oxidative stress and immunotoxicity, thereby increasing their susceptibility to diseases [48,49]. These metals bioaccumulate in tissues and induce oxidative stress by generating reactive oxygen species. Furthermore, the consumption of fish contaminated with these PTEs poses health risks to humans, including hypertension, anemia, cognitive deficits, infertility, skin, bladder, and lung cancers, cardiovascular disease, diabetes, and immune imbalances [50,51]. While Zn is essential for normal physiological functions in fish, excessive concentrations can lead to toxicity and adverse health effects [7].
Threshold effect level (TEL) and probable effect level (PEL) were used as key indicators to gain insights into the sediment contamination levels by PTEs. These values provide an understanding of the potential effects of such contaminations on aquatic life [52]. The results showed high levels of Cd concentrations in sediment samples that exceeded both PEL and TEL values, which suggests a high potential for adverse biological effects and indicates an urgent need for remediation efforts. Additionally, Ni, Zn, and As concentrations were found to exceed the PEL values [52]. Although these elements did not surpass TEL values [52], the surpassing of PEL values raises considerable concerns, suggesting that they could be contributing to the overall toxicity of the sediment and may pose a risk to the health of the benthic organisms. However, when compared to the PTE concentrations in other studied river sediments in Northern Algeria [35], the levels of Cd, Ni, Zn, and As in this study area, despite exceeding the PEL or TEL values, remain remarkably lower (Table 2).

3.5. Sediment Contamination Level and Potential Environmental Risks

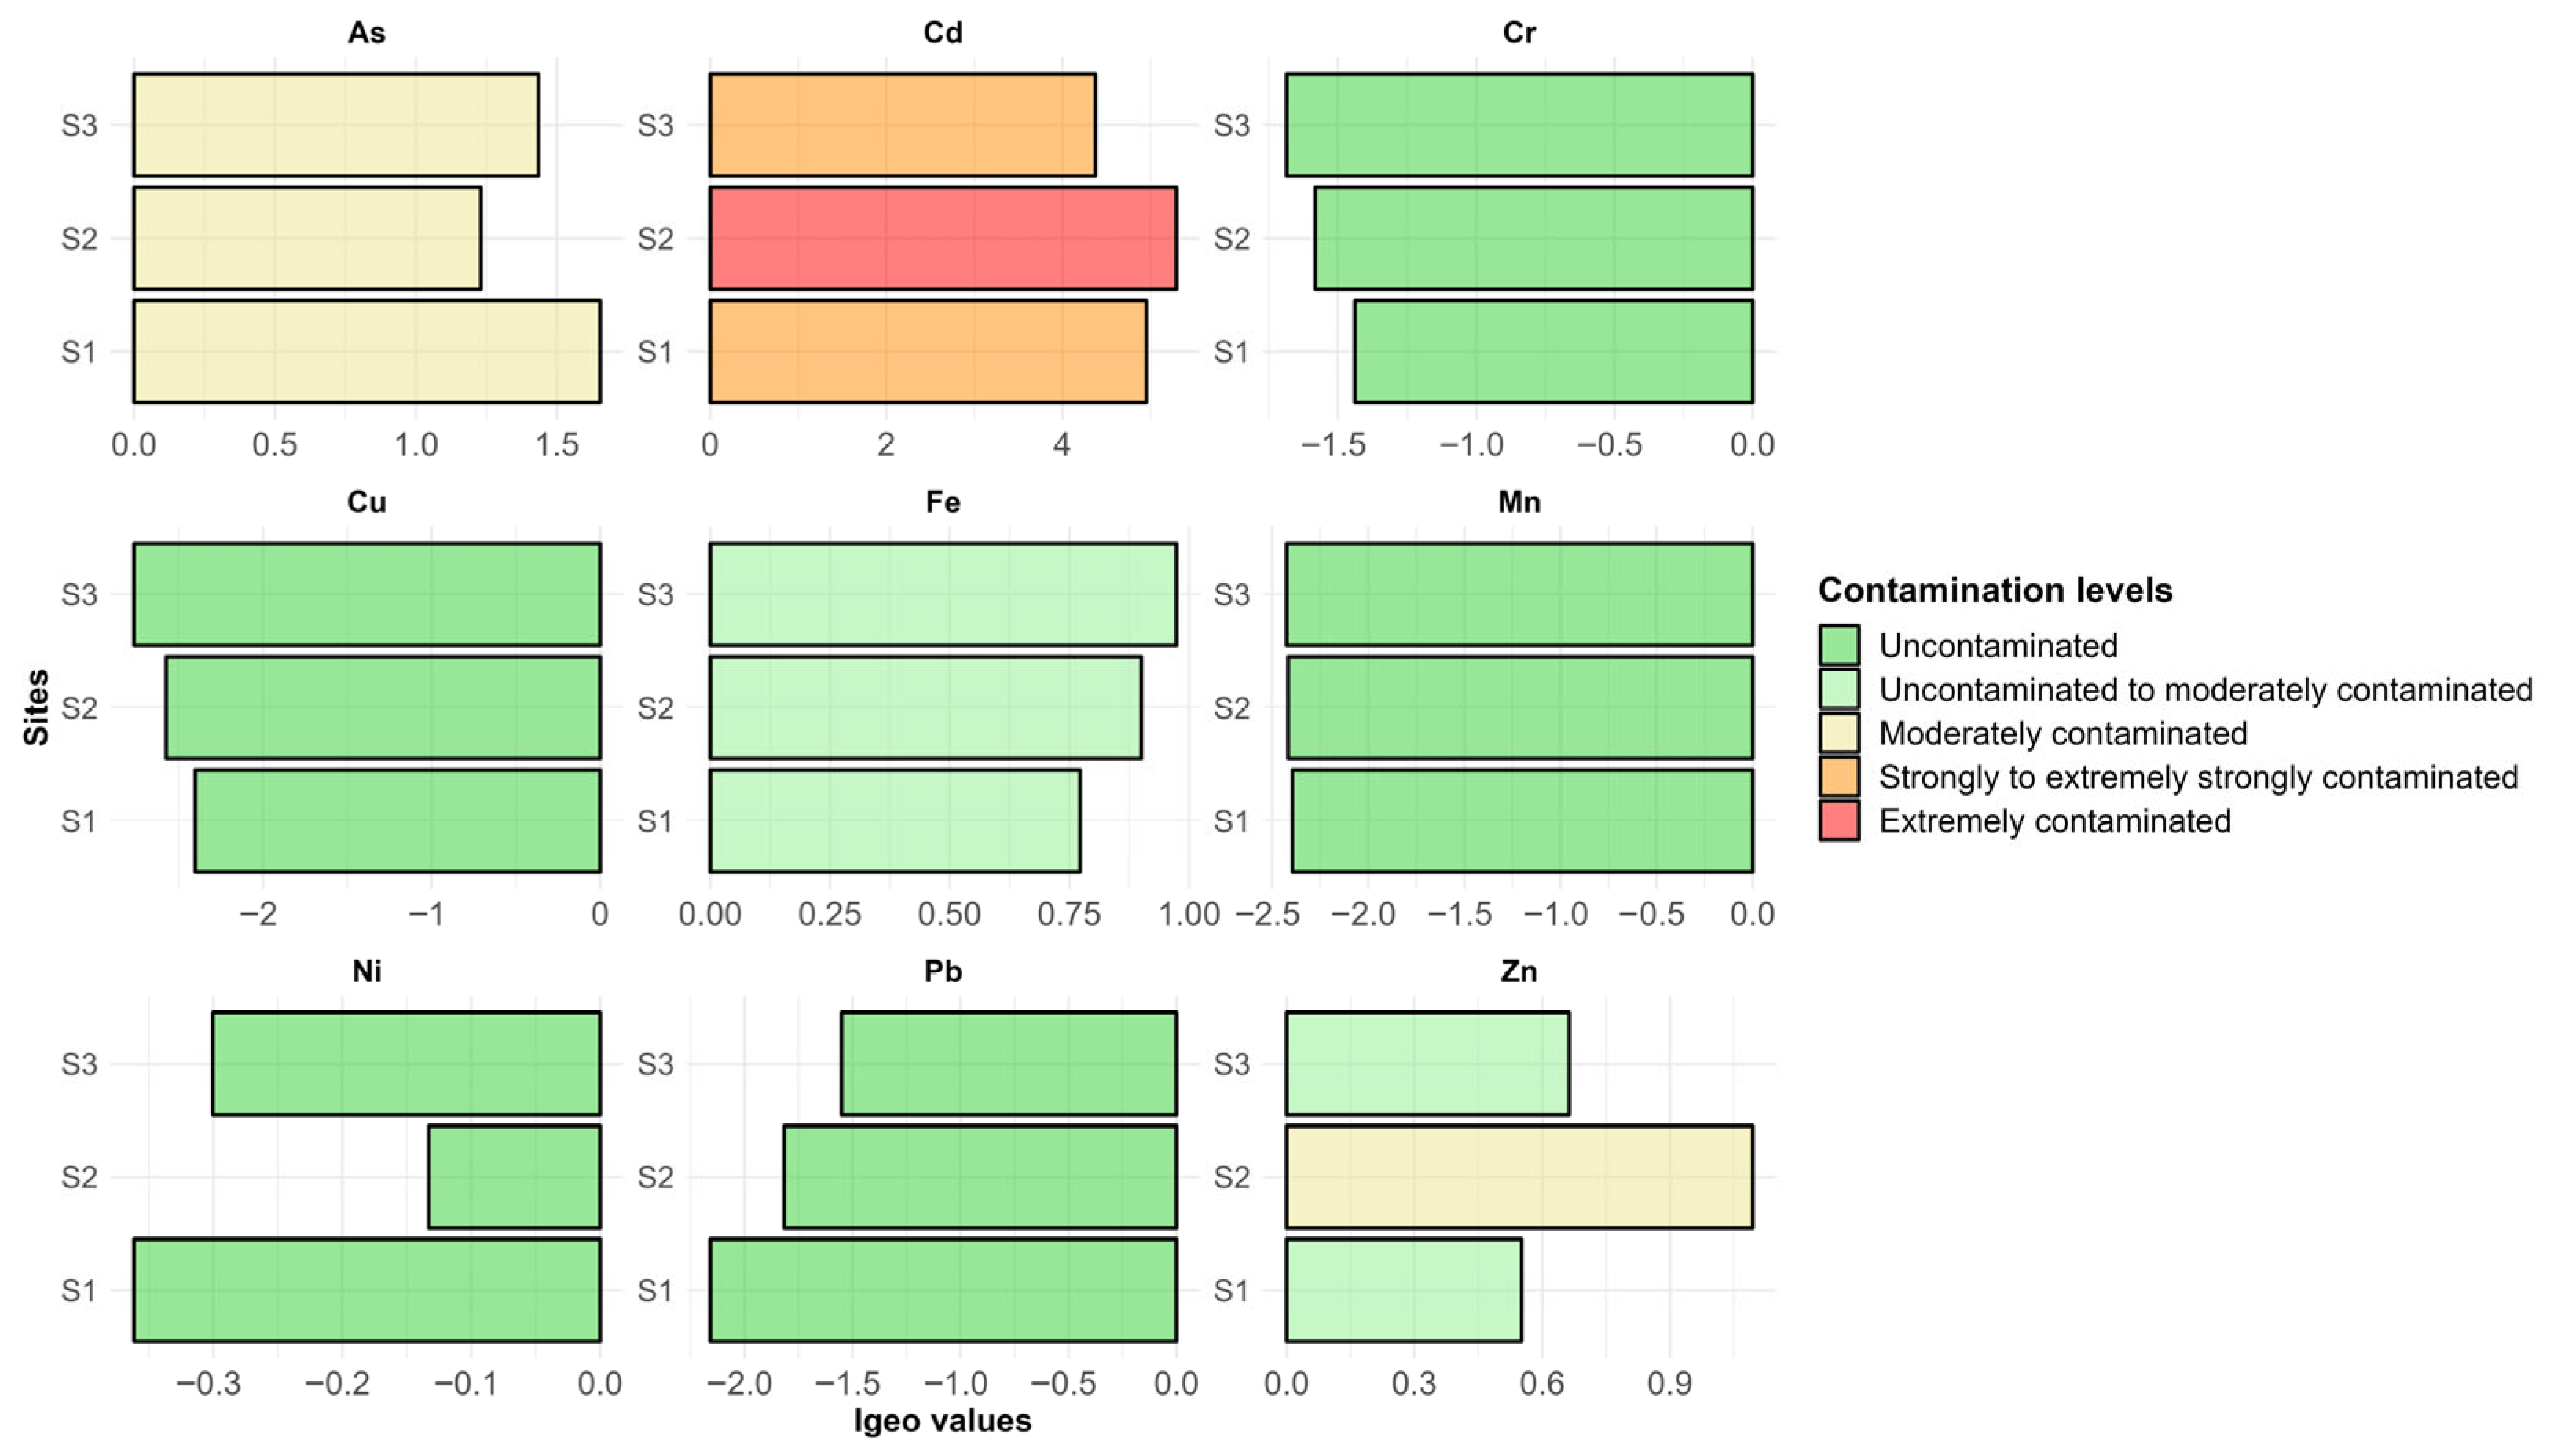
The Igeo index, based on the average concentrations of PTEs in the upper continental crust, was used to evaluate sedimentary PTE contamination of the El Mellah River (Figure 5). Cd showed the highest levels of contamination, with two samples indicating strong to extremely strong contamination (4 > Igeo > 3) and one sample indicating extreme contamination (Igeo > 5). As also exhibited moderate contamination across all samples. Zn showed moderate contamination in one out of three samples (2 > Igeo > 1). In contrast, the Igeo values for Cr, Cu, Fe, Mn, Ni, and Pb did not exceed 1, indicating no contamination by these elements in the sampled locations. The significant contamination of Cd, As, and Zn in the river sediment is consistent with previous studies on North African rivers, which have also reported similar contamination patterns [35]. This suggests that anthropogenic inputs of PTEs in the studied river are primarily due to Cd, As, and Zn.
Upon analyzing the contamination factor (CF) values (Figure 6), contamination levels varied according to the PTE and sample, ranging from low to very high contamination. Consistent with the Igeo values, Cd showed the highest degree of contamination across all samples (CF > 6). Conversely, Cr, Cu, Mn, and Pb had the lowest degree of contamination in the studied samples (CF > 1). Notably, As revealed a considerable degree of contamination (3 ≥ CF > 6), whereas Ni, Fe, and Zn showed a moderate contamination level (1 ≥ CF >3). Thus, similarly to the Igeo values, the primary anthropogenic inputs of PTEs in the investigated river were Cd, As, Fe, Ni, and Zn (CF > 1).
The study’s findings strongly imply the presence of severe pollution in the sampled locations, highlighted by the calculated pollution load index. The calculated PLI values in the sampled locations suggest a deterioration in the quality of all sediment samples (PLI > 1). The Algerian literature regarding past pollution assessments of PTEs contamination in El Mellah River sediments is lacking. The potential ecological risk index (RI) was employed along with the Cd, mCd, and PLI to assess the potential ecological effects of the PTEs under study. The RI provides insights into the potential impact of PTE contamination on environmental and ecological processes; in fact, the calculated RI showed alarming values (RI > 600) across the sampled sites, indicating that the El Mellah River is at very high ecological risk. The highest ecological risk was found to be in the sampling location S2 (RI = 1816.71). The severity of element contamination in the El Mellah River based on the RI had overall the same pattern, with the following order: Cd (94–97%) > As (1–4%) > Ni (0.3–0.6%) > Fe (0.1–0.3%) > Zn (0.2%) > Pb (0.1%) > Cu (0.06–0.1%) > Cr (0.05–0.09%) > Mn (0.01–0.1%).

3.6. Health Risk Assessment

3.6.1. Dietary Exposure Assessment

The PTE concentrations from fish muscle tissue samples were compared with acceptable standard limits established by the EU Commission and JECFA. For risk assessment purposes, estimated daily intake (EDI) values were calculated and converted to estimated weekly intake (EWI) to enable direct comparison with provisional tolerable weekly intake (PTWI) values. The ratio between the EWI of particular elements to their respective PTWI serves as a key metric for risk evaluation. However, it would not be prudent to categorically determine ‘acceptable’ or ‘non-acceptable’ limits based solely on individual element comparisons, as the cumulative effects of multiple trace elements must be considered in comprehensive risk assessment.
The mean EWI values for trace elements in the studied fish species are presented in Table 3. The findings revealed that most individual elements remained within acceptable limits relative to their respective PTWI values. For adults, As, Pb, and Cd exhibited EWI values of 0.0003, 0.0023, and 0.0014 mg/kg body weight per week, representing 2.0%, 9.2%, and 24.1% of their corresponding PTWI values, respectively. For children, these elements showed EWI values of 0.0013, 0.0109, and 0.0066 mg/kg body weight per week, representing 8.7%, 43.6%, and 113.8% of the recommended PTWI values, respectively. Notably, cadmium intake in children slightly exceeded the PTWI threshold, warranting particular attention in dietary recommendations.

3.6.2. Target Hazard Quotient

The evaluated THQ values for both age groups across all trace elements are presented in Table 3. Results indicated that mean THQ values for individual trace elements remained below 1, suggesting that non-carcinogenic health risks are unlikely from exposure to these elements through fish consumption. Among individual elements, Pb exhibited the highest THQ values, reaching 0.084 for adults and 0.390 for children.
The total THQ (TTHQ) values, representing cumulative exposure to all trace elements, were 0.555 for adults and 2.592 for children. While the TTHQ for adults remained below the acceptable threshold of 1, the value for children exceeded this limit by approximately 2.6-fold, indicating potential chronic non-carcinogenic health effects from cumulative exposure. Children demonstrated consistently higher THQ values than adults due to their greater food consumption rates relative to body weight and higher susceptibility to contaminant effects. The elevated TTHQ in children warrants particular concern, as humans are simultaneously exposed to multiple pollutants that may act synergistically over extended periods. This elevated vulnerability is especially significant given that fish and aquatic product consumption represents the major pathway for human exposure to toxic metals, including arsenic, cadmium, and lead, with children being particularly susceptible to these persistent environmental contaminants [53].

3.6.3. Carcinogenic Risk

CR was evaluated for As, Pb, Cd, and Cr based on their established carcinogenic potency factors. The estimated mean CR values for these elements are presented in Table 3. The CR values of As, Pb, Cd, and Cr 2.65 × 10⁻⁵ ± 8.01 × 10⁻⁶, 1.22 × 10⁻⁶ ± 5.45 × 10⁻⁷, 5.48 × 10⁻⁴ ± 1.12 × 10⁻⁴, and 1.42 × 10⁻⁴ ± 6.45 × 10⁻⁵ for adults, respectively, whereas 2.47 × 10⁻⁵ ± 7.47 × 10⁻⁶, 1.14 × 10⁻⁶ ± 5.09 × 10⁻⁷, 5.11 × 10⁻⁴ ± 1.05 × 10⁻⁴, and 1.33 × 10⁻⁴ ± 6.02 × 10⁻⁵ were observed for children, respectively.
The results indicated that children showed slightly higher CR values than adults for arsenic and lead, while adults exhibited marginally higher values for cadmium and chromium. Notably, both cadmium and chromium exceeded the acceptable cancer risk threshold for both age groups, with cadmium showing approximately 5-fold exceedance and chromium showing 1.3–1.4-fold exceedance of the safe limit. In contrast, arsenic and lead remained within the acceptable range. Cancer risk assessment assumes lifetime exposure (70 years), meaning that current consumption patterns, if maintained, could result in significant cancer burden. The CR values represent incremental lifetime cancer risk, emphasizing the importance of immediate dietary interventions, particularly for populations with high fish consumption rates. These probabilistic findings align with recent evidence that the ingestion of contaminated fish can lead to severe health consequences, including carcinogenic risks, due to the presence of metals such as arsenic, cadmium, and lead [53]. The 100% probability of exceeding acceptable cancer risk thresholds for cadmium is particularly concerning, as it may trigger increased production of reactive oxygen species (ROS), crucial metabolites that lead to oxidative stress and contribute to the onset of numerous diseases [54].

3.6.4. Monte Carlo Simulation for Health Risk Uncertainty Assessment

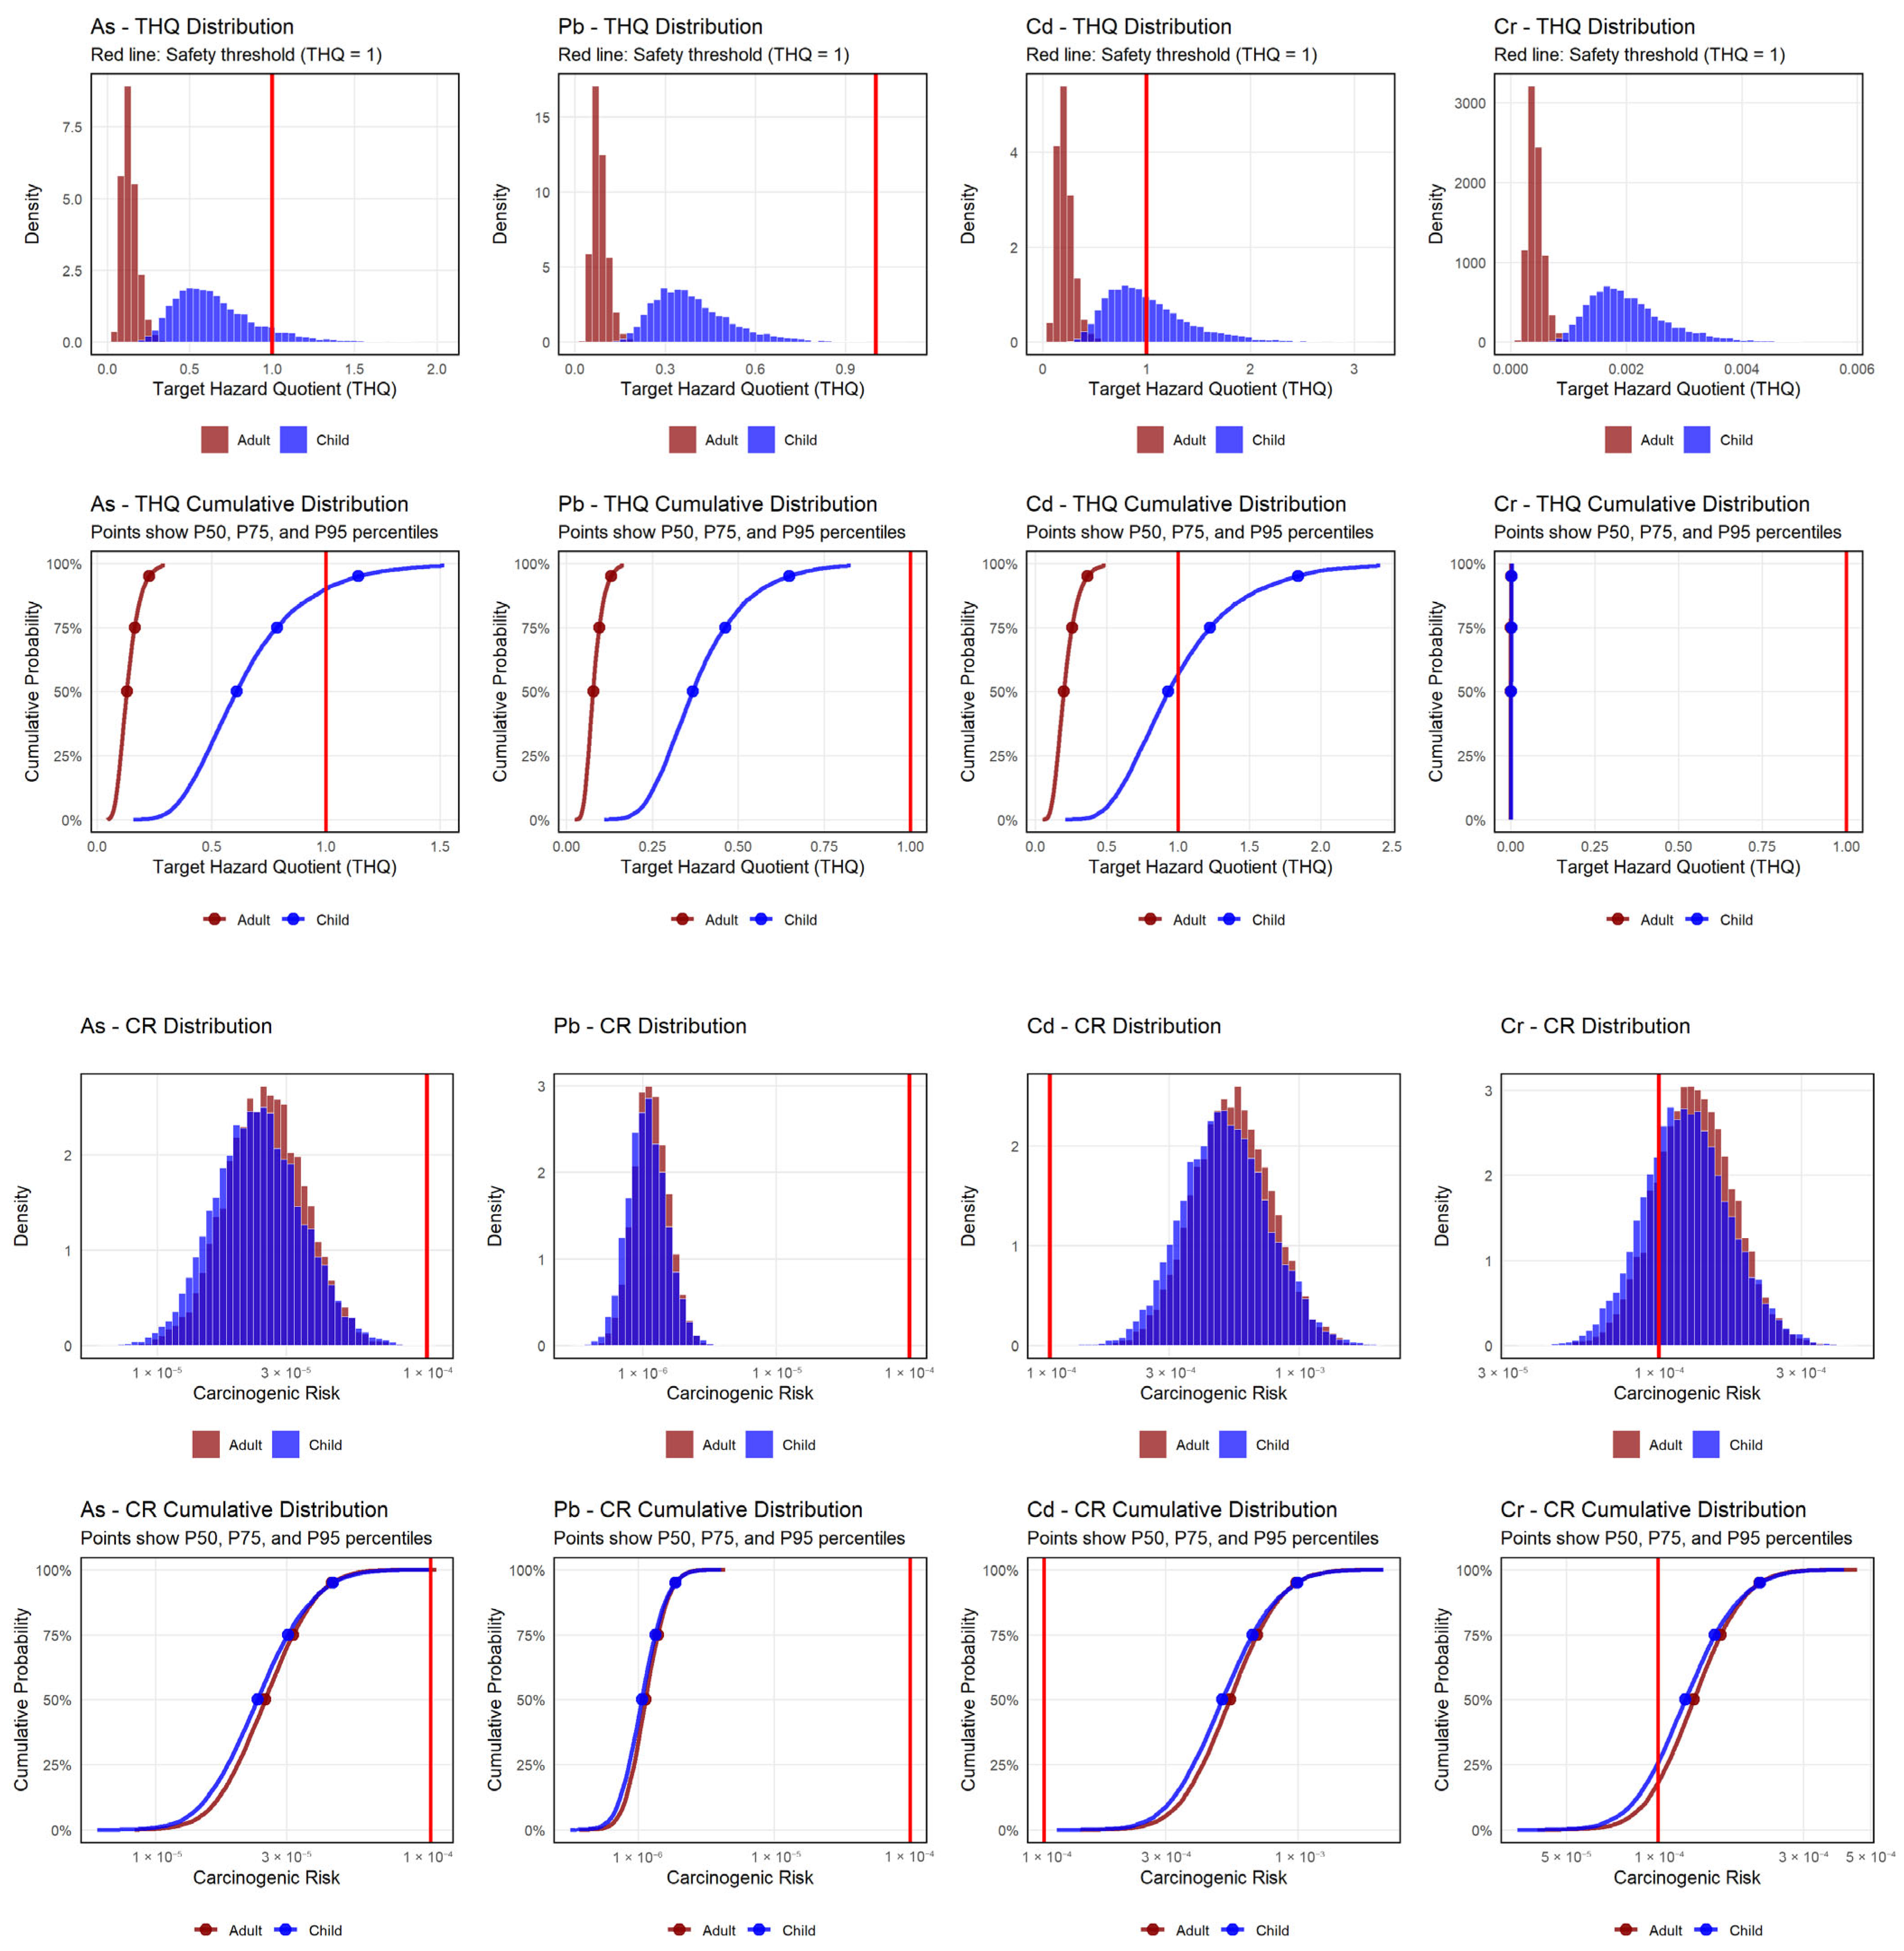
The Monte Carlo simulation was employed to assess the probabilistic distribution of both non-carcinogenic (THQ) and carcinogenic risk (CR) for the trace elements As, Pb, Cd, and Cr, considering the uncertainty in risk assessment parameters including exposure frequency and duration (Figure A1). The simulation results revealed distinct patterns of risk distribution between adults and children across different heavy metals.
For non-carcinogenic risk assessment, adults consistently exhibited lower probabilities of exceeding the safety threshold (THQ > 1) compared to children, reflecting children’s higher vulnerability due to increased consumption rates per unit body weight and developing physiological systems. As showed no probability for adults and 9.97% probability for children to surpass the threshold limit. Pb exposure resulted in minimal risk for both populations (0% for adults, 0.23% for children). Contrastingly, Cd presented the most concerning scenario, with children showing 43.2% probability of surpassing the safe THQ limit while adults maintained 0% probability. Cr demonstrated negligible non-carcinogenic risk for both age groups. For carcinogenic risk, Cd posed the highest concern, with both adults and children showing 100% probability of exceeding the acceptable carcinogenic risk threshold (CR > 10−6), indicating virtually all exposed individuals face elevated cancer risk. Cr also demonstrated significant carcinogenic risk potential, with adults showing 82.1% probability and children 74.3% probability of surpassing the threshold. Interestingly, adults appeared slightly more vulnerable to carcinogenic effects than children for Cr. As and Pb showed minimal carcinogenic risk probabilities.
The bimodal distribution patterns observed in the THQ histograms suggest distinct exposure scenarios or population subgroups with varying risk profiles. Overall, the probabilistic assessment revealed that Cd consistently presented the highest risk levels across both endpoints, followed by Cr for carcinogenic effects, emphasizing the need for targeted risk management strategies prioritizing these elements.

3.6.5. Study Limitations

This study had some limitations that should be acknowledged. The spatial and temporal representation of our samples was limited, which may affect the generalizability of our findings. Additionally, the digestion method we employed focused on sediment samples with a particle size of less than 250 µm. Since anthropogenic pollution is often associated with finer particles (less than 65 µm), our results may not fully capture the extent of anthropogenic contamination. Another limitation is our study did not provide insights into the potential impact of the recorded sediment contamination on the benthic community of the studied river. Although we used the trophic transfer factor combined with the bioaccumulation factor to investigate the transfer of the potential toxic elements between water, algae, and fish species, this approach may not fully capture the complexities of biomagnification. Including correlations between fish body size and element concentrations could provide more comprehensive insights into this process.

4. Conclusions

This baseline assessment of the El Mellah River reveals notable environmental contamination with potential implications to both aquatic ecosystems and human health. Water quality parameters exceeded local and international standards, while potential toxic elements concentrations in water, sediment, and fish tissues surpassed safety thresholds, indicating widespread pollution likely from agricultural and wastewater sources.
The study documented bioaccumulation of PTEs including arsenic, cadmium, chromium, and lead in the aquatic food web, with primary producers and sediments serving as major contamination reservoirs. Importantly, the exceedance of TEL/PEL values in sediments suggests risks to benthic invertebrates, while the high concentrations of PTEs in fish tissues point to potential impacts on fish health and population sustainability. In addition, fish consumption may represent a concern for local communities, particularly children, for whom TTHQ values were higher than recommended thresholds. Elevated carcinogenic risk indices for cadmium and chromium further highlight the need for ongoing monitoring and risk management.
From an ecological perspective, the river’s hydrological connection to Chott el Hodna—a Ramsar-designated wetland—raises the possibility of downstream transfer of contaminants to an ecosystem of international importance. These findings emphasize the importance of source control and targeted management strategies to mitigate risks to both biodiversity and human health in this critical watershed.

Supplementary Materials

The following supporting information can be downloaded at: https://www.mdpi.com/article/10.3390/w17202975/s1, Table S1: Standard Methods used for Water Quality Parameters Measurement. Table S2: ICP-OES Optima 8000 DV operating conditions. Table S3: Method Detection Limits (MDLs) and Blank Results by Matrix. Table S4: Certification Details of Single-Element ICP Calibration Standards Used (AccuStandard, New Haven, CT, USA). Table S5: Heavy Metal Element Background (Bn) and Toxic Response Values (Ti). Table S6: Estimated Daily Intake, Target Hazard Quotient and Carcinogenic Risk for Zn, Mn, As, Cd, Pb, Ni and Cr in Muscle Tissues of Luciobarbus callensis and Tropidophoxinellus callensis (Adults vs. Children).

Author Contributions

Conceptualization, S.S. and M.K.M.; methodology, S.S.; software, M.K.M.; validation, R.K.; formal analysis, M.K.M. and A.C.; investigation, S.S.; resources, S.S.; data curation, M.K.M.; writing—original draft preparation, M.K.M. and S.S.; writing—review and editing, all authors; visualization, M.K.M.; supervision, R.K. All authors have read and agreed to the published version of the manuscript.

Funding

This research received no external funding.

Institutional Review Board Statement

All procedures involving fish were conducted in compliance with the national guidelines for the care and use of animals for scientific purposes. In accordance with local regulations in Algeria, no ethical approval was required for the collection and analysis of fish samples in this study.

Data Availability Statement

The raw data supporting the conclusions of this article will be made available by the authors on request.

Acknowledgments

The authors would like to express their gratitude to the technicians at the Laboratory of Central Research and Development/Central Laboratories & Core Repository, Hassi Messaoud, for their valuable assistance and support during this research. We extend our appreciation to the director for generously granting us access to their excellent laboratory facilities for conducting our analyses. We are also grateful to Mohamed Gana for updating the map included in the current study.

Conflicts of Interest

The authors declare no conflicts of interest.

Abbreviations

The following abbreviations are used in this manuscript:
ANAHRAlgerian National Agency of Hydraulic Resources
APHAAmerican Public Health Association
AsArsenic
AT_carAveraging Time for carcinogens
AT_ncAveraging Time for non-carcinogens
BAFBioaccumulation Factor
BDLBelow Detection Limit
BnBackground value of element in upper continental crust
BWBody Weight
CConcentration of heavy metals in fish muscle
CdCadmium
CFContamination Factor
CFoConversion Factor
CMConcentration in Medium
CnConcentration of element in sediment sample
CrChromium
CSFoOral Carcinogenic Slope Factor
CuCopper
DODissolved Oxygen
DVDual View
ECElectrical Conductivity
EDExposure Duration
EDI
EWI
Estimated Daily Intake
Estimated Weekly Intake
EFExposure Frequency
ErPotential Ecological Risk Factor
FAOFood and Agriculture Organization
FeIron
FIRFish Ingestion Rate
HIHazard Index
ICP-OESInductively Coupled Plasma Optical Emission Spectrometry
IgeoThe geoaccumulation Index
LoDLimits of Detection
LoQLimits of Quantification
mCdModified Degree of Contamination
MnManganese
NiNickel
PbLead
PELProbable effect level
PLIPollution Load Index
PTEsPotentially toxic elements
RFDReference Dose
RIRisk Index
SeSelenium
PTWIProvisional Tolerable Weekly Intake
TDSTotal Dissolved Solids
TELThreshold effect level
THTotal Hardness
THQTarget Hazard Quotient
TRCarcinogenic Risk
TrToxic Response Factor
TTFTrophic Transfer Factor
USAUnited States of America
USEPAUnited States Environmental Protection Agency
WHOWorld Health Organization
ZnZinc

Appendix A

Table A1. Concentrations of PTEs in different strata of El Mellah River: mean and range, compared to multiple global guidelines and national standards. Data presented as mean ± standard deviation. Sample sizes: water (n = 3), sediment (n = 9), Spirogyra sp. (n = 3), T. callensis (n = 3), L. callensis (n = 3). Fish specimens analyzed in analytical triplicate.
ElementsStrataMean ± SDRangeLocal and International Guidelinesp Value
AsSpirogyra sp. (mg/kg)1.59 ± 0.630.86–2.000.01 *
L. callensis (mg/kg)3.28 ± 0.352.95–3.661.4 a
T. callensis (mg/kg)2.10 ± 0.691.51–2.86
Sediment (mg/kg)8.19 ± 1.207.04–9.445.9 b, 17c
Water (µg/L)12.97 ± 1.8510.85–14.2610 d, 10 e
CdSpirogyra sp. (mg/kg)3.12 ± 0.852.14–3.670.03 *
L. callensis (mg/kg)1.36 ± 0.261.10–1.630.2 a
T. callensis (mg/kg)1.29 ± 0.331.06–1.67
Sediment (mg/kg)4.54 ± 1.383.11–5.880.596 b, 3.53 c
Water (µg/L)1.26 ± 0.580.63–1.7710 d, 5 e
CrSpirogyra sp. (mg/kg)4.02 ± 2.042.66–6.380.03 *
L. callensis (mg/kg)5.98 ± 1.215.24–7.382.3 a
T. callensis (mg/kg)2.69 ± 0.322.38–3.03
Sediment (mg/kg)17.74 ± 1.5216.32–19.3637.3 b, 90 c
Water (µg/L)3.55 ± 0.872.55–4.0950 d, 100 e
CuSpirogyra sp. (mg/kg)3.85 ± 0.173.67–4.020.01 *
L. callensis (mg/kg)2.61 ± 0.382.24–3.0173.3 a
T. callensis (mg/kg)0.85 ± 0.170.67–1.02
Sediment (mg/kg)6.30 ± 0.795.52–7.1035.7 b, 197 c
Water (µg/L)4.31 ± 0.883.29–4.9050 d, 9 e
FeSpirogyra sp. (mg/kg)49.41 ± 2.4347.22–52.030.01 *
L. callensis (mg/kg)2.47 ± 0.671.88–3.20425.5 a
T. callensis (mg/kg)1.02 ± 0.170.86–1.20
Sediment (mg/kg)96.92 ± 6.7889.67–103.11NS b, NS c
Water (µg/L)82.04 ± 9.5373.00–92.001000 d, NS e
MnSpirogyra sp. (mg/kg)67.40 ± 9.0657.72–75.700.01 *
L. callensis (mg/kg)55.88 ± 8.3749.62–65.39500 a
T. callensis (mg/kg)36.73 ± 2.6833.70–38.79
Sediment (mg/kg)169.20 ± 1.87167.70–171.30NS b, NS c
Water (µg/L)31.38 ± 3.7027.59–35.00300 d, NS e
NiSpirogyra sp. (mg/kg)12.33 ± 2.3410.33–14.910.01 *
L. callensis (mg/kg)3.91 ± 0.923.02–4.8767 a
T. callensis (mg/kg)1.89 ± 0.281.57–2.11
Sediment (mg/kg)25.02 ± 2.0823.35–27.3618 b, 36 c
Water (µg/L)10.42 ± 2.018.87–12.70NS d, 52 e
PbSpirogyra sp. (mg/kg)4.63 ± 0.534.06–5.110.01 *
L. callensis (mg/kg)2.94 ± 0.552.40–3.500.3 a
T. callensis (mg/kg)1.42 ± 0.600.74–1.86
Sediment (mg/kg)8.49 ± 1.766.72–10.2435 b, 91.3 c
Water (µg/L)4.21 ± 0.893.32–5.1150 d, 10 e
SeSpirogyra sp. (mg/kg)BDLBDL
L. callensis (mg/kg)BDLBDLNS
T. callensis (mg/kg)BDLBDLNS
Sediment (mg/kg)BDLBDLNS
Water (µg/L) BDLBDLNS d, 50 e
ZnSpirogyra sp. (mg/kg)84.40 ± 5.8078.50–90.100.01 *
L. callensis (mg/kg)168.83 ± 15.40152.20–182.6099.4 a
T. callensis (mg/kg)61.40 ± 7.2954.60–69.10
Sediment (mg/kg)184.07 ± 38.05156.10–227.40123 b, 315 c
Water (µg/L)57.66 ± 6.3851.41–64.18500 d, 118 e
Notes: Bold values in the table exceed the recommended environmental guidelines. BDL—below detectable limit; NS—not specified. a The Food and Agriculture Organization, with the World Health Organization [44,45]. b Threshold effect level (TEL) [52]. c Probable effect level (PEL) [52]. d Algerian National Agency of Hydraulic Resources, [33]. e The World Health Organization, [42]. * Indicates a significant difference at p ≤ 0.05.
Figure A1. Probabilistic Health Risk Assessment (Monte Carlo Analysis): Non-carcinogenic (THQ) and Carcinogenic Risk Distributions from Heavy Metal-Contaminated Fish Consumption in El Mellah River, Northern Algeria.
Water 17 02975 g0a1

References

  1. Yadav, D.; Rangabhashiyam, S.; Verma, P.; Singh, P.; Devi, P.; Kumar, P.; Hussain, C.M.; Gaurav, G.K.; Kumar, K.S. Environmental and Health Impacts of Contaminants of Emerging Concerns: Recent Treatment Challenges and Approaches. Chemosphere 2021, 272, 129492. [Google Scholar] [CrossRef] [PubMed]
  2. Chakraborty, S.K. River Pollution and Perturbation: Perspectives and Processes. In Riverine Ecology, 1st ed.; Springer: Cham, Switzerland, 2021; Volume 2, pp. 443–530. [Google Scholar] [CrossRef]
  3. Li, Y.; Zhou, Q.; Ren, B.; Luo, J.; Yuan, J.; Ding, X.; Bian, H.; Yao, X. Trends and Health Risks of Dissolved Heavy Metal Pollution in Global River and Lake Water from 1970 to 2017. Rev. Environ. Contam. Toxicol. 2020, 251, 1–24. [Google Scholar] [CrossRef] [PubMed]
  4. Singh, J.; Yadav, P.; Pal, A.K.; Mishra, V. Water Pollutants: Origin and Status. In Sensors in Water Pollutants Monitoring: Role of Material; Pooja, D., Kumar, P., Singh, P., Patil, S., Eds.; Springer: Singapore, 2020; pp. 5–20. [Google Scholar] [CrossRef]
  5. Williams-Subiza, E.A.; Epele, L.B. Drivers of Biodiversity Loss in Freshwater Environments: A Bibliometric Analysis of the Recent Literature. Aquat. Conserv. Mar. Freshw. Ecosyst. 2021, 31, 2469–2480. [Google Scholar] [CrossRef]
  6. Palmer, M.; Ruhi, A. Linkages between Flow Regime, Biota, and Ecosystem Processes: Implications for River Restoration. Science 2019, 365, eaaw2087. [Google Scholar] [CrossRef]
  7. Bagheri, S.; Gholamhosseini, A.; Banaee, M. Investigation of Different Nutritional Effects of Dietary Chromium in Fish: A Literature Review. Biol. Trace Elem. Res. 2023, 201, 2546–2554. [Google Scholar] [CrossRef]
  8. Arab, L.H.; Boutaleb, A.; Berdous, D. Environmental assessment of heavy metal pollution in the polymetallic district of Kef Oum Teboul (El Kala, Northeast Algeria). Environ. Earth Sci. 2021, 80, 277. [Google Scholar] [CrossRef]
  9. Vinci, G.; Maddaloni, L.; Mancini, L.; Prencipe, S.A.; Ruggeri, M.; Tiradritti, M. The Health of the Water Planet: Challenges and Opportunities in the Mediterranean Area. An Overview. Earth 2021, 2, 894–919. [Google Scholar] [CrossRef]
  10. MedWet Secretariat. Stratégie Nationale de Gestion Écosystémique des Zones Humides d’Algérie. République Algérienne Démocratique et Populaire, Ministère de l’Agriculture, du Développement Rural et de la Pêche, Direction Générale des Forêts; 2017. Available online: https://medwet.org/wp-content/uploads/2017/04/Strategie-Nationale-des-Zones-Humides_Algerie.pdf (accessed on 25 June 2025).
  11. Talbi, H.; Kachi, S. Evaluation of Heavy Metal Contamination in Sediments of the Seybouse River, Guelma–Annaba, Algeria. J. Water Land Dev. 2019, 40, 81–86. [Google Scholar] [CrossRef]
  12. Napoletano, P.; Guezgouz, N.; Di Iorio, E.; Colombo, C.; Guerriero, G.; De Marco, A. Anthropic Impact on Soil Heavy Metal Contamination in Riparian Ecosystems of Northern Algeria. Chemosphere 2022, 313, 137522. [Google Scholar] [CrossRef]
  13. Adesiyan, I.M.; Bisi-Johnson, M.; Aladesanmi, O.T.; Okoh, A.I.; Ogunfowokan, A.O. Concentrations and human health risk of heavy metals in rivers in Southwest Nigeria. J. Health Pollut. 2018, 8, 180907. [Google Scholar] [CrossRef]
  14. Dehbi, M.; Kanjal, M.I.; Tahraoui, H.; Zamouche, M.; Amrane, A.; Assadi, A.A.; Hadadi, A.; Mouni, L. Analysis of Heavy Metal Contamination in Macroalgae from Surface Waters in Djelfa, Algeria. Water 2023, 15, 974. [Google Scholar] [CrossRef]
  15. Lohmann, U.; Sausen, R.; Bengtsson, L.; Cubasch, U.; Perlwitz, J.; Roeckner, E. The Köppen Climate Classification as a Diagnostic Tool for General Circulation Models. Clim. Res. 1993, 3, 177–193. [Google Scholar] [CrossRef]
  16. American Public Health Association. Standard Methods for the Examination of Water and Wastewater, 6th ed.; American Public Health Association: Washington, DC, USA, 1926. [Google Scholar]
  17. Arnot, J.A.; Gobas, F.A. A review of bioconcentration factor (BCF) and bioaccumulation factor (BAF) assessments for organic chemicals in aquatic organisms. Environ. Rev. 2006, 14, 257–297. [Google Scholar] [CrossRef]
  18. Kim, S.-K. Trophic Transfer of Organochlorine Pesticides through Food-Chain in Coastal Marine Ecosystem. Environ. Eng. Res. 2020, 25, 43–51. [Google Scholar] [CrossRef]
  19. Salhi, S.; Chaibi, R.; Badache, H.; Hamidouche, M.; Laouar, R. Seasonal Variation in the Diet and the Morphometric Parameters of the Genus Pseudophoxinus sp. (Cyprinidae) in Eastern Algeria. Biosyst. Divers. 2021, 29, 326–333. [Google Scholar] [CrossRef]
  20. Müller, G. Index of Geoaccumulation in Sediments of the Rhine River. GeoJournal 1969, 2, 108–118. [Google Scholar]
  21. Taylor, S.R.; McLennan, S.M. The Geochemical Evolution of the Continental Crust. Rev. Geophys. 1995, 33, 241–265. [Google Scholar] [CrossRef]
  22. Reimann, C.; De Caritat, P. Chemical Elements in the Environment: Factsheets for the Geochemist and Environmental Scientist; Springer Science & Business Media: Berlin/Heidelberg, Germany, 2012; Volume 398. [Google Scholar]
  23. Tomlinson, D.L.; Wilson, J.G.; Harris, C.R.; Jeffrey, D.W. Problems in the Assessment of Heavy-Metal Levels in Estuaries and the Formation of a Pollution Index. Helgol. Mar. Res. 1980, 33, 566–575. [Google Scholar] [CrossRef]
  24. Hoang, H.-G.; Lin, C.; Chiang, C.F.; Bui, X.T.; Lukkhasorn, W.; Bui, T.P.T.; Tran, H.T.; Vo, T.-D.H.; Le, V.G.; Nghiem, L.D. The Individual and Synergistic Indexes for Assessments of Heavy Metal Contamination in Global Rivers and Risk: A Review. Curr. Pollut. Rep. 2021, 7, 247–262. [Google Scholar] [CrossRef]
  25. Huang, H.; Li, Y.; Zheng, X.; Wang, Z.; Cheng, X. Nutritional Value and Bioaccumulation of Heavy Metals in Nine Commercial Fish Species from Dachen Fishing Ground, East China Sea. Sci. Rep. 2022, 12, 6927. [Google Scholar] [CrossRef]
  26. FAO. Algeria–Fishery and Aquaculture Country Profile; Food and Agriculture Organization of the United Nations: Rome, Italy, 2018; Available online: https://www.fao.org/fishery/facp/DZA (accessed on 9 July 2025).
  27. U.S. Environmental Protection Agency (USEPA). Exposure and Human Health Reassessment of 2,3,7,8-Tetrachlorodibenzo-p-dioxin (TCDD) and Related Compounds. Draft Final; Exposure Assessment and Risk Characterization Group; National Center for Environmental Assessment-Washington Office; Office of Research and Development, EPA/600/P-00/00/A-c; U.S. EPA: Washington, DC, USA, 2000.
  28. World Health Organization. STEPS Survey for Noncommunicable Disease Risk Factors, Algeria 2016–2017; World Health Organization: Geneva, Switzerland, 2018; Available online: https://www.who.int/teams/noncommunicable-diseases/surveillance/systems-tools/steps (accessed on 9 July 2025).
  29. UNICEF. Multiple Indicator Cluster Survey (MICS) 2018, Algeria Final Report; United Nations Children’s Fund: New York, NY, USA, 2019; Available online: https://mics.unicef.org/surveys (accessed on 9 July 2025).
  30. U.S. Environmental Protection Agency. Risk Based Concentration Table; U.S. EPA: Washington, DC, USA, 2009.
  31. Dinno, A.; Dinno, M.A. Package ‘dunn.test’. CRAN Repos. 2017, 10, 1–7. [Google Scholar]
  32. Buijs, P.; Toader, C. Proposed System of Surface Water Quality Standards for Moldova; Technical Report; OECD: Paris, France, 2007. [Google Scholar]
  33. Agence Nationale des Ressources Hydrauliques. Qualité des Eaux Superficielles Dans les Bassins du Kebir-Rhumel, de la Seybouse et de la Medjerda-Mellegue, Algérie (2004–2007); Agence Nationale des Ressources Hydrauliques: El Mouradia, Algérie, 2009. [Google Scholar]
  34. Ordóñez, J.I.; Cortés, S.; Maluenda, P.; Soto, I. Biosorption of Heavy Metals with Algae: Critical Review of Its Application in Real Effluents. Sustainability 2023, 15, 552. [Google Scholar] [CrossRef]
  35. Benabdelkader, A.; Taleb, A.; Probst, J.-L.; Belaidi, N.; Probst, A. Anthropogenic contribution and influencing factors on metal features in fluvial sediments from a semi-arid Mediterranean river basin (Tafna River, Algeria): A multi-indices approach. Sci. Total Environ. 2018, 626, 899–914. [Google Scholar] [CrossRef]
  36. Alloway, B.J. Trace Metals and Metalloids in Soils and Their Bioavailability. In Heavy Metals in Soils: Trace Metals and Metalloids in Soils and their Bioavailability, 3rd ed.; Alloway, B.J., Ed.; Springer: Dordrecht, The Netherlands, 2013; pp. 3–9. [Google Scholar]
  37. Jeong, H.; Ra, K. Source Apportionment and Health Risk Assessment for Potentially Toxic Elements in Size-Fractionated Road Dust in Busan Metropolitan City, Korea. Environ. Monit. Assess. 2022, 194, 350. [Google Scholar] [CrossRef] [PubMed]
  38. De Paiva Magalhães, D.; da Costa Marques, M.R.; Baptista, D.F.; Buss, D.F. Metal bioavailability and toxicity in freshwaters. Environ. Chem. Lett. 2015, 13, 69–87. [Google Scholar] [CrossRef]
  39. Liu, X.; Zhang, J.; Huang, X.; Zhang, L.; Yang, C.; Li, E.; Wang, Z. Heavy Metal Distribution and Bioaccumulation Combined with Ecological and Human Health Risk Evaluation in a Typical Urban Plateau Lake, Southwest China. Front. Environ. Sci. 2022, 10, 814678. [Google Scholar] [CrossRef]
  40. Nowicka, B. Heavy Metal–Induced Stress in Eukaryotic Algae—Mechanisms of Heavy Metal Toxicity and Tolerance with Particular Emphasis on Oxidative Stress in Exposed Cells and the Role of Antioxidant Response. Environ. Sci. Pollut. Res. 2022, 29, 16860–16911. [Google Scholar] [CrossRef]
  41. Cervantes-Ramírez, L.T.; Ramírez-López, M.; Mussali-Galante, P.; Ortiz-Hernández, M.L.; Sánchez-Salinas, E.; Tovar-Sánchez, E. Heavy metal biomagnification and genotoxic damage in two trophic levels exposed to mine tailings: A network theory approach. Rev. Chil. Hist. Nat. 2018, 91, 6. [Google Scholar] [CrossRef]
  42. World Health Organization. Guidelines for Drinking-Water Quality: Incorporating the First and Second Addenda; World Health Organization: Geneva, Switzerland, 2022. [Google Scholar]
  43. Kumari, B.; Kumar, V.; Sinha, A.K.; Ahsan, J.; Ghosh, A.K.; Wang, H.; DeBoeck, G. Toxicology of Arsenic in Fish and Aquatic Systems. Environ. Chem. Lett. 2016, 15, 43–64. [Google Scholar] [CrossRef]
  44. Food Additives and Contaminants. Joint FAO/WHO Food Standards Programme, ALINORM; Food and Agricultural Organization: Rome, Italy, 2001; Volume 1, pp. 1–289. [Google Scholar]
  45. Joint FAO/WHO Expert Committee on Food Additives; World Health Organization. Safety Evaluation of Certain Food Additives and Contaminants. In Proceedings of the Seventy-Third Meeting of the Joint FAO/WHO Expert Committee on Food Additives (JECFA), Geneva, Switzerland, 8–17 June 2010; World Health Organization: Geneva, Switzerland, 2011. [Google Scholar]
  46. Tchounwou, P.B.; Yedjou, C.G.; Patlolla, A.K.; Sutton, D.J. Heavy metal toxicity and the environment. Exp. Suppl. 2012, 101, 133–164. [Google Scholar] [CrossRef]
  47. Rahman, Z.; Singh, V.P. The relative impact of toxic heavy metals (THMs) (arsenic (As), cadmium (Cd), chromium (Cr)(VI), mercury (Hg), and lead (Pb)) on the total environment: An overview. Environ. Monit. Assess. 2019, 191, 419. [Google Scholar] [CrossRef] [PubMed]
  48. Lee, J.W.; Choi, H.; Hwang, U.K.; Kang, J.C.; Kang, Y.J.; Kim, K.I.; Kim, J.H. Toxic Effects of Lead Exposure on Bioaccumulation, Oxidative Stress, Neurotoxicity, and Immune Responses in Fish: A Review. Environ. Toxicol. Pharmacol. 2019, 68, 101–108. [Google Scholar] [CrossRef]
  49. Lee, J.W.; Jo, A.H.; Lee, D.C.; Choi, C.Y.; Kang, J.C.; Kim, J.H. Review of Cadmium Toxicity Effects on Fish: Oxidative Stress and Immune Responses. Environ. Res. 2023, 236, 116600. [Google Scholar] [CrossRef] [PubMed]
  50. Das, S.; Kar, I.; Patra, A.K. Cadmium induced bioaccumulation, histopathology, gene regulation in fish and its amelioration–a review. J. Trace Elem. Med. Biol. 2023, 79, 127202. [Google Scholar] [CrossRef]
  51. EFSA Panel on Contaminants in the Food Chain (CONTAM); Schrenk, D.; Bignami, M.; Bodin, L.; Chipman, J.K.; del Mazo, J.; Grasl-Kraupp, B.; Hogstrand, C.; Hoogenboom, L.; Leblanc, J.C.; et al. Update of the Risk Assessment of Inorganic Arsenic in Food. EFSA J. 2024, 22, e8488. [Google Scholar] [CrossRef]
  52. Smith, S.L.; MacDonald, D.D.; Keenleyside, K.A.; Ingersoll, C.G.; Field, L.J. A Preliminary Evaluation of Sediment Quality Assessment Values for Freshwater Ecosystems. J. Great Lakes Res. 1996, 22, 624–638. [Google Scholar] [CrossRef]
  53. Cobbinah, R.T.; Boadi, N.O.; Saah, S.A.; Agorku, E.S.; Badu, M.; Kortei, N.K. Cancer risk from heavy metal contamination in fish and implications for public health. Sci. Rep. 2025, 15, 24162. [Google Scholar] [CrossRef] [PubMed]
  54. Wang, Y.; Noman, A.; Zhang, C.; Al-Bukhaiti, W.Q.; Abed, S.M. Effect of fish-heavy metals contamination on the generation of reactive oxygen species and its implications on human health: A review. Front. Mar. Sci. 2024, 11, 1500870. [Google Scholar] [CrossRef]
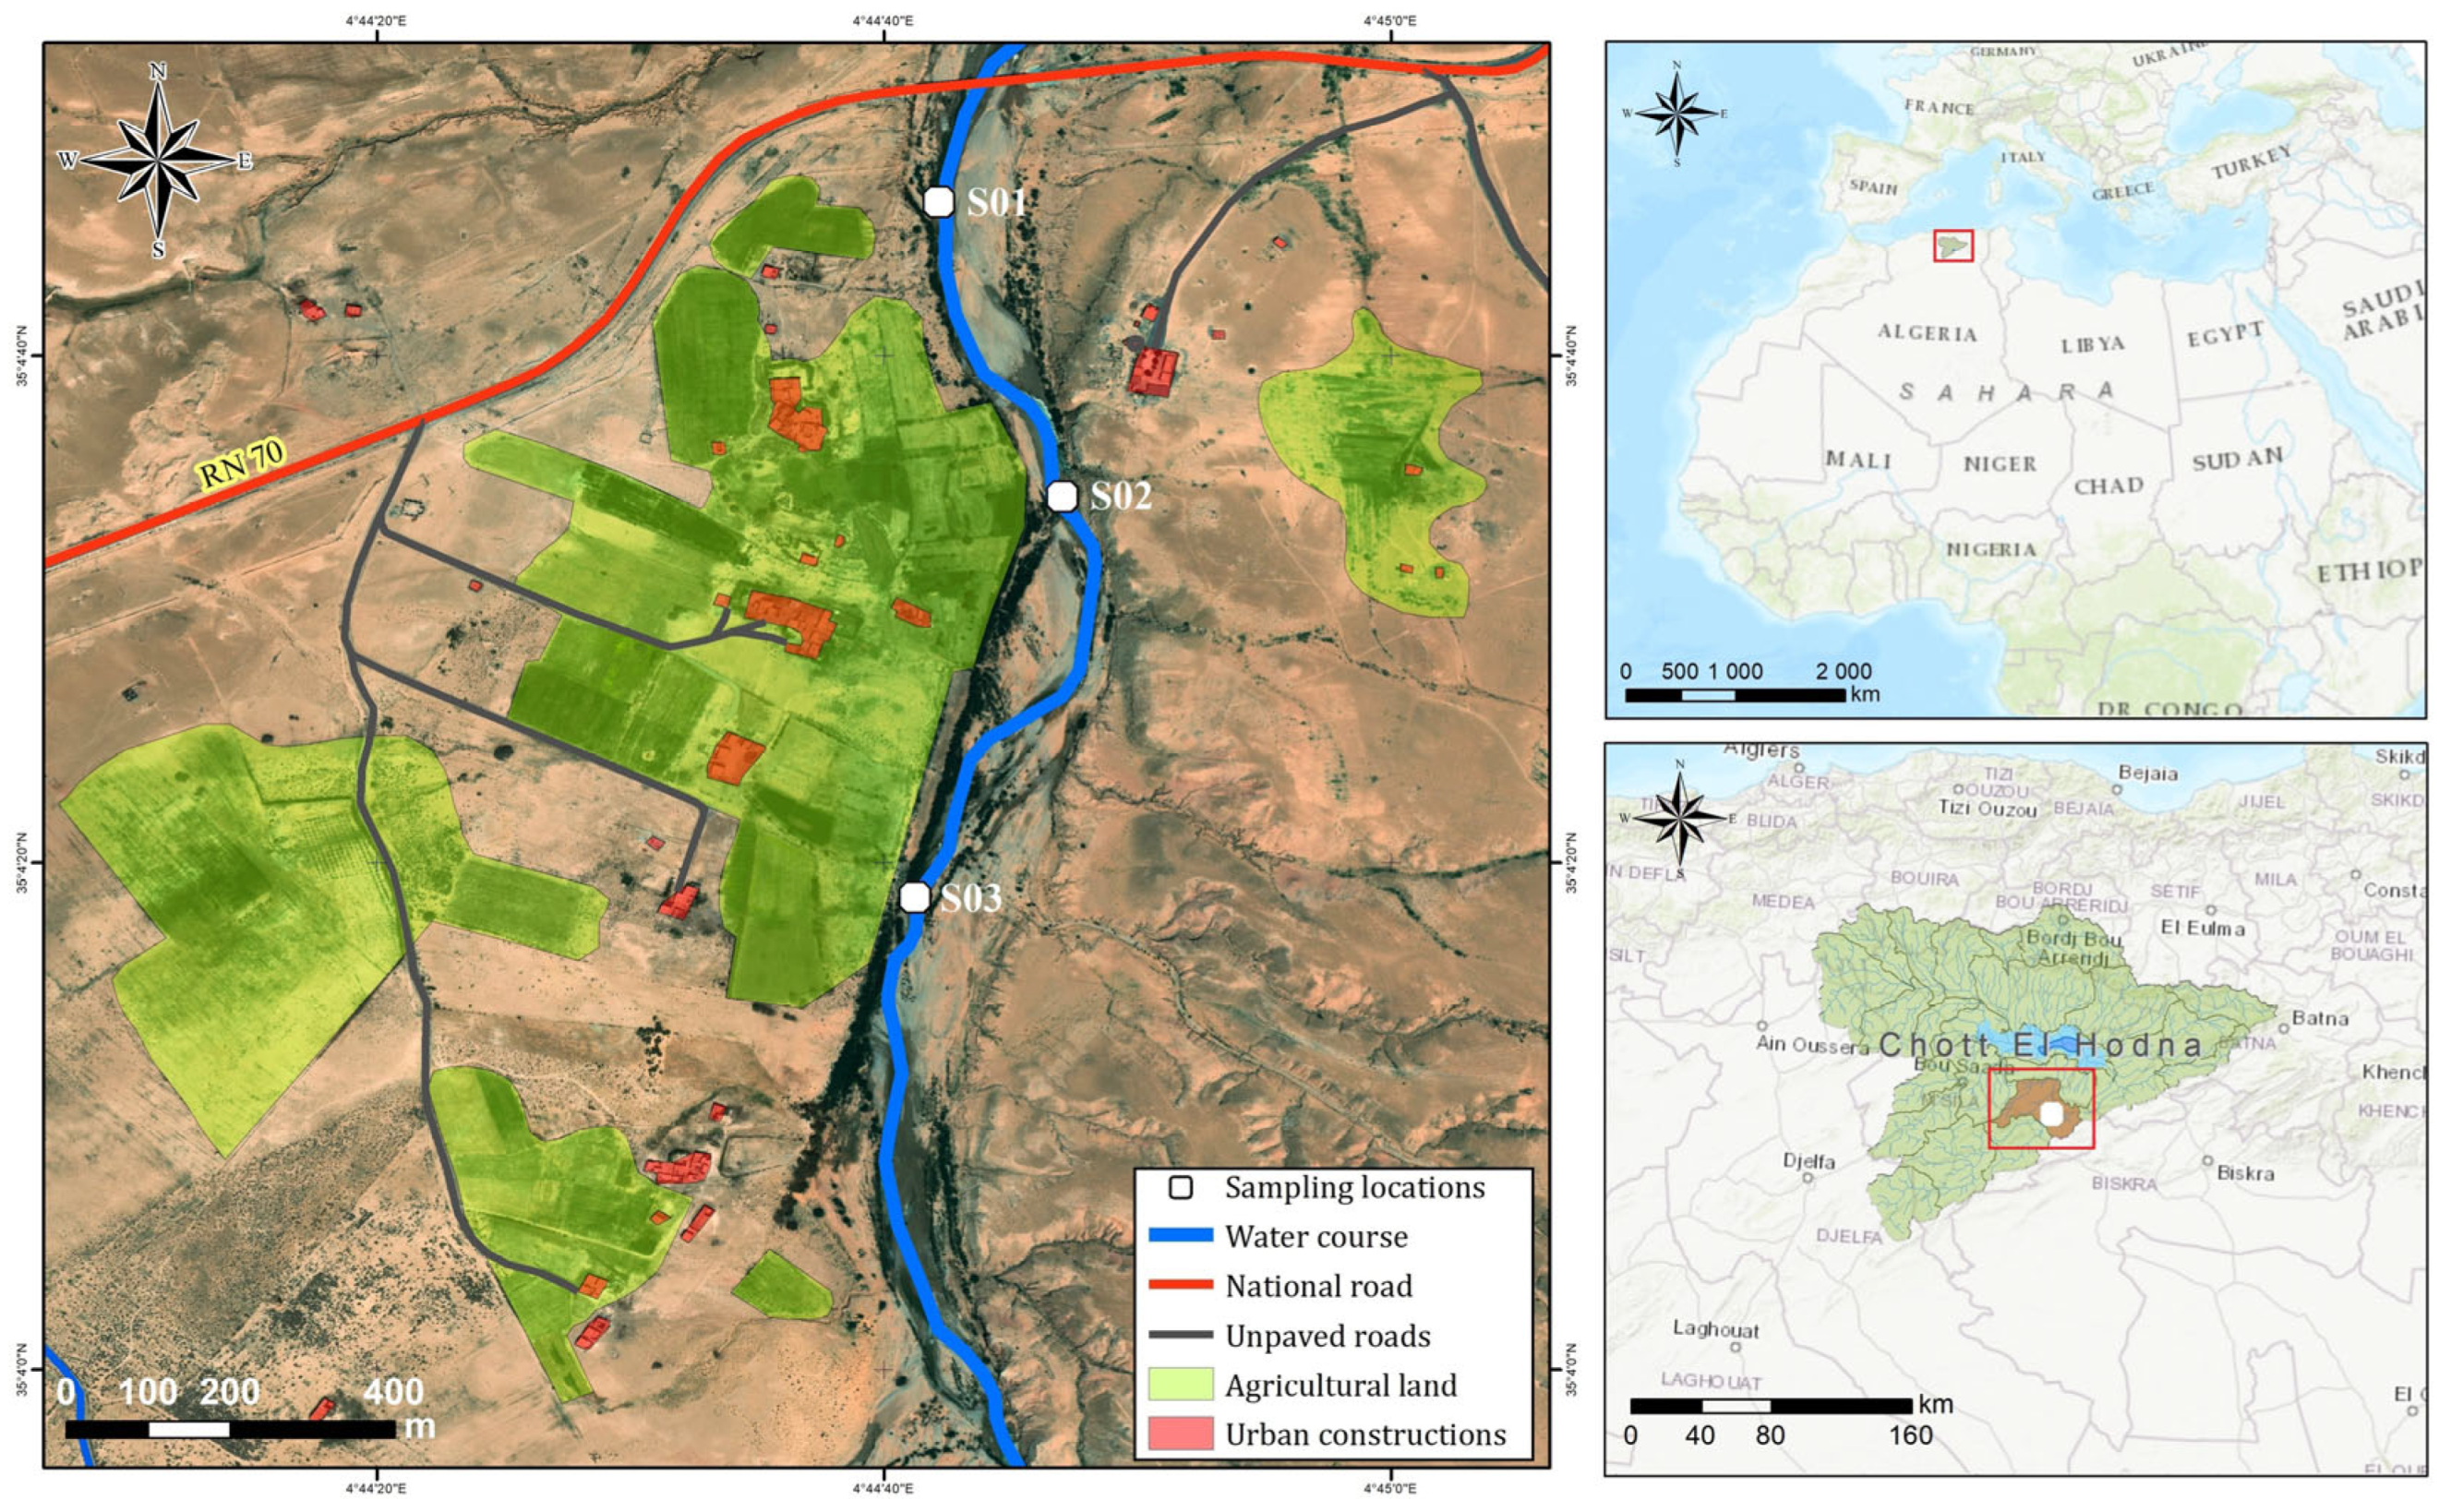
Figure 1. Map showing sampling locations along El Mellah River, Northern Algeria. Inset maps show the regional context within Algeria and North Africa with the red box indicating the location of the study area.
Water 17 02975 g001
Figure 2. Overview of mean PTE concentration distributions over El Mellah River studied strata. p values indicate statistical significance from Dunn’s pairwise comparisons with Holm–Sidak correction following Kruskal–Wallis test. Sample sizes: sediment (n = 9), Spirogyra sp. (n = 3), T. callensis (n = 3), L. callensis (n = 3).
Water 17 02975 g002
Figure 3. PTE bioaccumulation and biomagnification in the targeted trophic levels: (A) bioaccumulation levels using BAFs; (B) biomagnification levels using TTFs.
Water 17 02975 g003
Figure 4. Radar charts displaying concentrations (µg/L) of potentially toxic elements in water from sampling sites: (A) heavy metals (As, Ni, Cr, Pb, Cd) and (B) other trace elements (Mn, Zn, Cu, Fe).
Water 17 02975 g004
Figure 5. PTE contamination levels in sediment samples through Igeo Index.
Water 17 02975 g005
Figure 6. PTEs contamination levels in sediment samples through Contamination factor.
Water 17 02975 g006
Table 1. Physical and chemical characteristics of El Mellah River water with local and international environmental guidelines.
ParametersMean Concentration (SD)Local GuidelinesInternational Guidelines
pH8.15 (0.44)6.5–8.56.5–9
Electrical Conductivity (µs/cm)5971 (465.18)28002500
Dissolved Oxygen (mg/L)12.73(3.04)3–54–7
Total Hardness (mg/L)2149 (501.26)500
Total Dissolved Solids (mg/L)2770.67 (455.13)16001300
Sulfate SO42− (mg/L)486.73 (38.67)200–300300
Phosphate PO43− (mg /L)0.08 (0.05)0.01–0.10.1
Nitrate NO3 (mg/L)21.10 (3.47)10–209.1
Nitrite NO2 (mg/L)0.31 (0.47)0.01–0.10.02
Ammonium NH4+ (mg/L)0.95 (0.96)0.01–0.10.4–0.8
Sodium Na+2 (mg/L)24.93 (7.09)100–200
Iron Fe2+ (mg/L)0.06 (0.04)0.3
Chloride Cl (mg/L)907.28 (25.83)150–300300
Notes: Bold values in the table exceed the recommended environmental guidelines. The local and global guidelines values in the table are based on the Algerian National Agency of Hydraulic Resources (NAHR) [33], the maximum allowable concentrations (MACs) of the Moldova Rules (MD) for Protection of Surface Water (1991), and the imperative values from the EU Directive 78/659/EEC [32,33].
Table 2. Literature Review: Comparative Analysis of PTEs in Algerian River Ecosystems.
RiversTrophic LevelsElementsCurrent Study
Concentrations
mg/kg
Reference Concentrations
mg/kg
References
El Mellah RiverSpirogyra sp.Zn84.40 40.83[14]
Cu3.85 32.66
Fe49.41 1514.17
Pb4.63 19.98
Tafna RiverSedimentCu6.30 17.51[35]
Fe96.92 17.63
As8.195.13
Cd4.54 0.19
Pb8.4943.37
Table 3. EWI (mg/kg) of PTEs compared with PTWI in the selected species.
EWI (mg/kg)THQTTHQCR
Trace
Elements
PTWI
(mg/kg)
AdChAdChAdChAdCh
As0.0150.0003± 0.00010.0013 ± 0.00040.137 ± 0.0420.640 ± 0.194 2.65 × 10⁻⁵ ± 8.01 × 10−62.47 × 10−5 ± 7.47 × 10⁻⁶
Pb0.0250.0023 ± 0.00100.0109 ± 0.00490.084 ± 0.0370.390 ± 0.1751.22 × 10−6 ± 5.45 × 10−71.14 × 10−6 ± 5.09 × 10⁻⁷
Cd0.0070.0014 ± 0.00030.0066 ± 0.00140.203 ± 0.0410.946 ± 0.1940.555 ± 0.1282.592 ± 0.5965.48 × 10−4 ± 1.12 × 10−45.11 × 10−4 ± 1.05 × 10⁻⁴
Cr0.0150.0046 ± 0.00210.0216 ± 0.00980.000 ± 0.0000.002 ± 0.001 1.42 × 10⁻⁴ ± 6.45 × 10−51.33 × 10−4 ± 6.02 × 10⁻⁵
Ni0.0350.0031 ± 0.00140.0145 ± 0.00630.022 ± 0.0100.104 ± 0.045--
Mn0.20.0496 ± 0.01270.2312 ± 0.05930.051 ± 0.0130.236 ± 0.060--
Zn70.1232 ± 0.06400.5748 ± 0.29870.059 ± 0.0300.274 ± 0.142--
Disclaimer/Publisher’s Note: The statements, opinions and data contained in all publications are solely those of the individual author(s) and contributor(s) and not of MDPI and/or the editor(s). MDPI and/or the editor(s) disclaim responsibility for any injury to people or property resulting from any ideas, methods, instructions or products referred to in the content.