Article

Research on the Influence Mechanism of Regulating Capacity and Flow Recession Process in the Karst Vadose Zone

1
School of Earth Science and Engineering, Hohai University, Nanjing 210098, China
2
School of Resources and Civil Engineering, Suzhou University, Suzhou 234000, China
3
Guangdong-Hong Kong-Macau Laboratory of Soil Pollution Fate and Risk Management in Earth’s Critical Zone, Guangdong Provincial Academy of Environmental Science, Guangzhou 510045, China
4
Nanjing Research Institute of Hydrology and Water Conservation Automation, Ministry of Water Resources, Nanjing 210012, China
*
Authors to whom correspondence should be addressed.
Water 2025, 17(20), 2976; https://doi.org/10.3390/w17202976
Submission received: 13 September 2025 / Revised: 2 October 2025 / Accepted: 14 October 2025 / Published: 15 October 2025
(This article belongs to the Special Issue Hydrogeological and Hydrochemical Investigations of Aquifer Systems)

Abstract

Understanding the groundwater movement patterns and regulating functions of the karst vadose zone is essential in addressing water scarcity and protecting the ecological environment in the karst area of southwest China. A laboratory-scale experimental model of a typical karst vadose zone was constructed and used to simulate the water flow process under the influence of four factors: transfer zone thickness, surface slope, karstification degree, and rainfall intensity. A corresponding distributed model was subsequently developed to simulate the laboratory experiments. The discharge recession process, the regulating capacity, and the division of fast and slow flow were quantitatively analyzed by the recession coefficient, the regulating coefficient, and the percentage of fast flow and that of sinkhole flow. As the transfer zone thickness increases from 40 cm to 120 cm, the vadose zone regulating coefficient rises from 0.49 to 0.53, while fast flow decreases from 87.7% to 78.1%, indicating that the enhanced regulating capacity is mainly governed by the slow flow system. The evident difference in growth rates between the percentage of fast flow (an increase of 9.1%) and that of sinkhole flow (an increase of 48.7%) indicates that the decrease in regulating capacity resulting from an increase in surface slope is primarily due to enhanced water loss through sinkholes. When the structure of the karst vadose zone remains constant, the regulating coefficient decreases exponentially with increasing rainfall intensity and gradually approaches a constant value, which represents the maximum regulating capacity of the karst vadose zone under its current structural conditions.

1. Introduction

Karst regions cover 7–12% of the Earth’s continental area and supply groundwater to approximately 20–25% of the global population [1]. Southwest China’s karst region possesses abundant groundwater resources, accounting for approximately 25% of China’s total groundwater reserves. These resources serve as a major source of water for local people’s production and daily life. Despite the abundant water resources, the region suffers from seasonal drought and water scarcity. These constraints severely impact living standards and farm productivity, while also adversely affecting ecological processes such as vegetation growth and soil erosion [2]. Research over the past two decades has demonstrated that the karst vadose zone plays a crucial role in groundwater retention and regulation, with its water storage assumed to be a primary contributor to karst aquifer discharge in certain cases [3,4]. Understanding groundwater dynamics and the regulating capacity of the karst vadose zone is essential for mitigating water scarcity and protecting ecosystems.
The regulating function of an aquifer medium refers to its ability to control and balance the movement of water through a series of processes, including the infiltration of rainfall, the generation and transmission of runoff when infiltration is exceeded, the storage of groundwater within pores, fractures, or cavities, and the gradual discharge of this stored water to springs, rivers, or pumping wells, thereby maintaining the stability of groundwater systems and supporting water supply over time [5,6,7]. Previous studies on the regulating capacity of karst systems have predominantly focused on the epikarst zone, since epikarst has enhanced permeability, porosity, and storage capacity compared with the underlying bedrock [8,9,10]. For example, Bonacci O studied the storm rainfall effect and concluded that the epikarst plays a significant regulating role, with a preliminary discussion on the influence of soil on this function [11]. Lee et al. analyzed spring composition during storm events using isotope tracing methods, finding that soil water contributed 3.1%, precipitation 10.6%, baseflow 34%, and pre-event water stored in the epikarst accounted for 52.3% [12]. Research by Yang et al. demonstrated that the DK-XAJ-EW model, which incorporates the regulating capacity of the epikarst zone, significantly enhances the accuracy of flood forecasting in complex environments [13]. Research by Sheffer et al. on cave drip monitoring for epikarst recharge revealed that the transition between dry and rainy seasons influences both the lag time between rainfall and cave drip response and the regulating function of the karst vadose zone [14]. However, some researchers have pointed out that not only the epikarst but also the transfer zone has a certain water regulating capacity. Emblanch et al. demonstrated that the water storage capacity of the vadose zone is non-negligible through a study of 13C in the vadose zone of France’s Fontaine de Vaucluse karst system [15]. Mazzilli et al. used magnetic resonance sounding (MRS) to measure moisture content in the unsaturated zone of the Durzon karst system, France, and concluded that the vadose zone constitutes a major water storage unit in this region [16]. Liu et al. found that the distributed model that considered the regulating capacity of the transfer zone improved the simulation results significantly [17]. The above studies indicate that when investigating the regulating capacity of karst systems, particularly in mountainous karst regions with a thick vadose zone, the entire vadose karst zone (including the soil layer, epikarst, and transfer zone) should be taken into account.
Due to the high heterogeneity of karst aquifer systems, data obtained through hydrogeological drilling are often spatially limited since conventional field hydrogeological experiments can only provide hydrogeological parameters within a certain range [18,19]. Since aquifer discharge is influenced by the internal structure and properties of the aquifer system, the shape of the discharge hydrograph can reflect the influence of various aquifer storages and flow processes on discharge behavior [20,21,22]. Under rainfall conditions, the discharge hydrograph consists of a rising curve and a recession curve, with the recession curve often analyzed to reveal the drainage dynamics, storage characteristics, and structural organization of the karst system [22,23]. Tang et al. investigated how karst conduit diameter and saturated thickness influence the behavior of the recession curve through a series of laboratory experiments [24]. Dewandel et al. evaluated the aquifer thickness by analyzing recession hydrographs [25]. Methods currently employed for analyzing karst discharge hydrograph recession curves can be broadly categorized into three groups: exponential method, which relates to linear reservoir [26]; non-exponential method, which relates to non-linear reservoir [27,28]; and integrated method [29,30,31,32,33]. The exponential method is widely used in the study of karst hydrograph recession curves due to its simplicity and ease of application. The analytical solution employed in the exponential method is primarily derived by Boussinesq [26] and Maillet [34]. The single exponential function method is only suitable for analyzing simple recession curves, whereas many karst discharge hydrograph recession curves often consist of multiple exponential function segments [35]. To interpret the complex karst hydrograph recession process, Forkasiewicz and Paloc employed several parallel linear reservoirs, each representing a distinct component within the karst aquifer [36]. Liu et al. analyzed the influence of rainfall intensity, karstification degree, epikarst development, surface slope, and transfer zone thickness on the recession coefficient, thereby further investigating their effects on hydrological processes within the unsaturated karst zone [37].
Laboratory-scale experimental models are widely used to simulate various hydraulic conditions, providing significant new insights into water flow processes within aquifers [38,39,40,41]. Numerical simulation is another economical and practical method in karst hydrogeological research [42,43,44]. To investigate the mechanisms influencing regulating capacity and flow recession processes in the karst vadose zone, this study constructed a laboratory-scale experimental model to quantitatively evaluate and rank the effects of factors such as rainfall intensity, karstification degree, transfer zone thickness, and surface slope on flow recession processes and regulating capacity. Combined with numerical simulations, the percentages of fast flow and sinkhole flow were quantitatively analyzed, further explaining the mechanisms through which these factors affect flow recession processes and regulating capacity in the karst vadose zone.

2. Laboratory Experiments

2.1. Experimental Model Setup

As shown in Figure 1b, the experimental model of the karst vadose zone was constructed in a tank made of plastic and acrylic glass, supported by a stainless-steel frame. The main body of the tank measures 1 m in length, 1 m in width, and 1.5 m in height. The top of the experimental tank is open to receive simulated precipitation from the rainfall recharge system, while the bottom is designed as a water collection system consisting of plastic plates and a stainless-steel frame. Water flowing from the tank falls freely onto the plastic plate and discharges together through the outlet (Figure 1a).
The experimental model is divided into the soil layer, epikarst, and transfer zone from top to bottom according to the classic conceptual model of the karst vadose zone [45]. The soil layer is constructed with silty clay loam (Figure 1c) and has a dry density of 1.15~1.20 g cm−3 and an initial gravimetric moisture content of 0.17. The epikarst and transfer zone are built using Ordovician limestone blocks. The epikarst is constructed with rock blocks measuring 10 cm × 10 cm × 5 cm (Figure 1e). Due to the presence of shallow karst fissures [46], frustum-shaped rock blocks (Figure 1d) are employed to replace the surface block of the epikarst, forming a network of fissures measuring 1 cm in width and 5 cm in depth. The transfer zone consists of 20 cm × 20 cm × 20 cm rock blocks (Figure 1f). The spacing between the blocks constitutes a series of fissures that vary in width from 0.01 mm to 5 mm. To create fractures throughout the transfer zone as shown in Figure 2a–e, glue was used to seal the fissure near the reserved fractures. A channel with a cross-sectional area of 5 cm × 5 cm was left in one corner of the model to simulate the sinkhole. More details about the experimental model can be found in the research of Liu et al. [37]. According to previous studies, the flow in the karst system can be roughly categorized into two types: (1) fast flow, which is controlled by enlarged fractures and sinkholes; and (2) slow flow, which is controlled by tight fissures and the rock matrix [47,48,49,50,51]. The classification between the fast flow and slow flow systems is based on fracture width d: fissures with d < 1 mm were assigned to the slow flow system, while fissures with d > 1 mm and sinkholes were assigned to the fast flow system. The classification of fast and slow flow systems in the transfer zone is shown in Figure 2f–j.

2.2. Experimental Design

To investigate the mechanisms influencing flow recession process and regulating capacity in the karst vadose zone, four factors were considered as simulation variables. Details are provided in Table 1 of the experimental design.
1
Transfer zone thickness (Experiments: A1–A5). The vadose zone thickness results from the relative rates of movement of its upper boundary (surface) and lower boundary and it exhibits a wide range of variation, spanning orders of magnitude from meters to kilometers: up to 2000 m below the surface in the Caucasus Mountains [1]; 400–1000 m in the Xianglushan karst system of Yunnan Province, China [17]; around 400 m on the Javorniki–Snežnik Plateau in Slovenia [52]; and less than 10 m in the Chenqi karst system of Guizhou Province, China [53]. In this study, to investigate the influence of the thickness of the karst vadose zone, the thickness of the vadose zone was varied while the thicknesses of the soil layer and the epikarst zone were held constant. The experimental transfer zone thickness was categorized into 40, 60, 80, 100, and 120 cm. Other variables were held constant, with the surface slope set to 0°, the karstification degree set to two fractures, and the rainfall intensity set to 20 mm/h.
2
Surface slope (Experiments: B1–B5). Slopes were set to 0°, 5°, 10°, 15°, and 20° in this experiment. The surface slope was adjusted by increasing the thickness of the transfer zone, thereby elevating the soil layer and epikarst around the sinkhole (Figure 1a). Under the influence of the surface slope, in addition to vertical infiltration, rainfall also generates horizontal runoff such as surface runoff, through flow and subcutaneous flow [54]. Relevant studies indicate that a critical rainfall intensity exists for generating surface runoff on karst slopes [55,56,57,58]. This value varies among experiments due to differences in experimental conditions. To ensure runoff generation during the investigation of surface slope effects, a pre-experiment was conducted, which determined a rainfall intensity of 60 mm/h. The transfer zone thickness was set to 80 cm and the karstification degree was set to one fracture.
3
Karstification degree (Experiments: C1–C5). The karstification degree reflects the intrinsic development of karst systems, influenced by factors such as rock solubility, permeability, and hydrochemical conditions [1]. A higher degree generally corresponds to a more fragmented medium, resulting in a greater permeability [59,60]. In this study, karstification was quantified based on fracture count. Five scenarios were established: one, two, three, and four fractures, along with fully fissured conditions (unsealed). The spatial distribution of fractures used to represent each degree is illustrated in Figure 2a–e. Other variables were held constant, with the transfer zone thickness set to 80 cm, the surface slope set to 0°, and the rainfall intensity set to 20 mm/h.
4
Rainfall intensity (Experiments: D1–D5). The experimental rainfall intensities were set to 5, 10, 20, 30, and 50 mm h−1 (equivalent to 1.39 × 10⁻³, 2.78 × 10⁻³, 5.56 × 10⁻³, 8.33 × 10⁻³, and 1.39 × 10⁻² expressed in mm s−1, respectively). During rainfall intensity experiments, other variables remained constant: a transfer zone thickness of 80 cm, a surface slope of 15°, and a karstification degree of two fractures.

2.3. Data Analysis Methods

In this research, we focus on the recession curves when analyzing the experimental results of discharge. A sum of two exponential functions, which corresponds to fast flow and slow flow, respectively, was used for the recession analyses [36,61]:
Q t = Q 1 e α 1 t + Q 2 e α 2 t
where Q1 and Q2 are initial flow rates [L3T−1] for the fast flow system and slow flow system, Qt is the flow rate at time t [L3T−1], and α1 and α2 are recession coefficients [T−1] for the fast flow system and slow flow system, and they can reflect the properties of the aquifer with the following equation:
α = π 2 K H 4 φ L 2
where K is the hydraulic conductivity [L T−1], H is the depth of the aquifer under the outlet level [L], φ is the effective porosity, which can reflect the storage capacity, and L is the width of the aquifer [L].
The regulating coefficient (I) quantitatively describes the regulating capacity of a karst aquifer system and reflects the proportion of infiltrated water retained within the system. It can be calculated by the following equation:
I = Q Q 0 = Q 0 Q Q 0 = 1 Q P × T
where Q0 is the rainfall recharge volume [L3T−1], ΔQ is the water volume stagnated in the karst vadose zone, Q is the water volume flow from the karst vadose zone, P is rainfall intensity, and T is the time when discharge reaches its peak.
Sensitivity analysis can help clarify the extent to which transfer zone thickness, surface slope, karstification degree, and rainfall intensity affect the recession coefficient and regulating coefficient of fast flow. The unit variation rate (Sr) of each factor is adopted as the evaluation criterion, which can be calculated by the following equation:
S r = I F = I m a x I m i n I m i n / F m a x F m i n F m i n
where Fmax and Fmin are the upper and lower limits of the independent variable (transfer zone thickness, surface slope, karstification degree, and rainfall intensity), respectively, and Imax and Imin are the corresponding values of the dependent variable (recession coefficient and regulating coefficient) at those limits. A positive value of Sr indicates a positive proportional influence of the independent variable on the dependent variable, while a negative value suggests an inverse influence. Moreover, a larger absolute value of Sr corresponds to a more pronounced degree of influence.

3. Numerical Simulation

This study utilized the Porous Media and Subsurface Flow Module in COMSOL Multiphysics software 6.0 to simulate the groundwater flow within the experimental model. Since the hydraulic conductivity of the rock blocks used in the experiment was much lower than that of the fracture network inside the experimental model, the water flow within rock blocks was neglected, and only the groundwater flow within the soil and fracture network was considered in the numerical model.

3.1. Numerical Model

In 1931, Richards proposed that Darcy’s law could be extended to describe water movement in the unsaturated zone [62], where the hydraulic conductivity is no longer constant but varies with soil water content. The Richards equation was subsequently developed and has been widely applied in modeling unsaturated flow:
C h h t = K h h + z
where h is the water pressure head [L], K(h) is the unsaturated hydraulic conductivity [LT−1], C(h) is the specific moisture capacity [L−1], C h = θ h , and t is time [T]. According to the VG model, the relationship between the volumetric water content and the water pressure head can be described by the following equations [63]:
θ h = θ r + θ s θ r 1 + α h n m n = 1 1 m α = 1 h b 2 1 m 1 1 m
where θ is the volumetric water content [L L−1], θr is the volumetric residual water content [L L−1], θs is the volumetric saturated water content [L L−1], and α [L−1], n [-], and m [-] are empirical shape parameters.
The upper boundary of the model was defined as a rainfall infiltration boundary, which can be regarded as a dynamic transition between a Dirichlet boundary, where the hydraulic head is specified, and a Neumann boundary, where the water flux across the boundary is prescribed [64,65]. To simultaneously simulate the switching of this infiltration boundary and surface runoff, this study refers to the method proposed by Hou et al. [66], which involves placing a thin (0.5 cm), highly permeable “air unit” layer at the top of the soil zone. This approach, combined with the pervious layer boundary feature and the probe tool in COMSOL, enables switching between the two boundary conditions. The governing equation for the pervious layer boundary is
r = R b h b h
where hb is the external head [L]; h is the water pressure head [L]; and Rb is a conduction coefficient [T−1]. A probe was placed at the bottom of the “air unit” to monitor the boundary pressure pl in real time. When pl < 0, hb = M (where M is a sufficiently large value) and Rb = v0/M, with v0 being the rainfall intensity, under which case Equation (3) approximates a Neumann boundary condition. When pl 0, hb = 0 and Rb = M, in which case Equation (3) approximates a Dirichlet boundary condition.
The bottom boundary of the model is in contact with the atmosphere directly, allowing water to flow out freely under gravity. It was therefore treated as a free drainage boundary, governed by the following equation:
q x , y , z , t = K θ , x , y , z S o u t f l o w
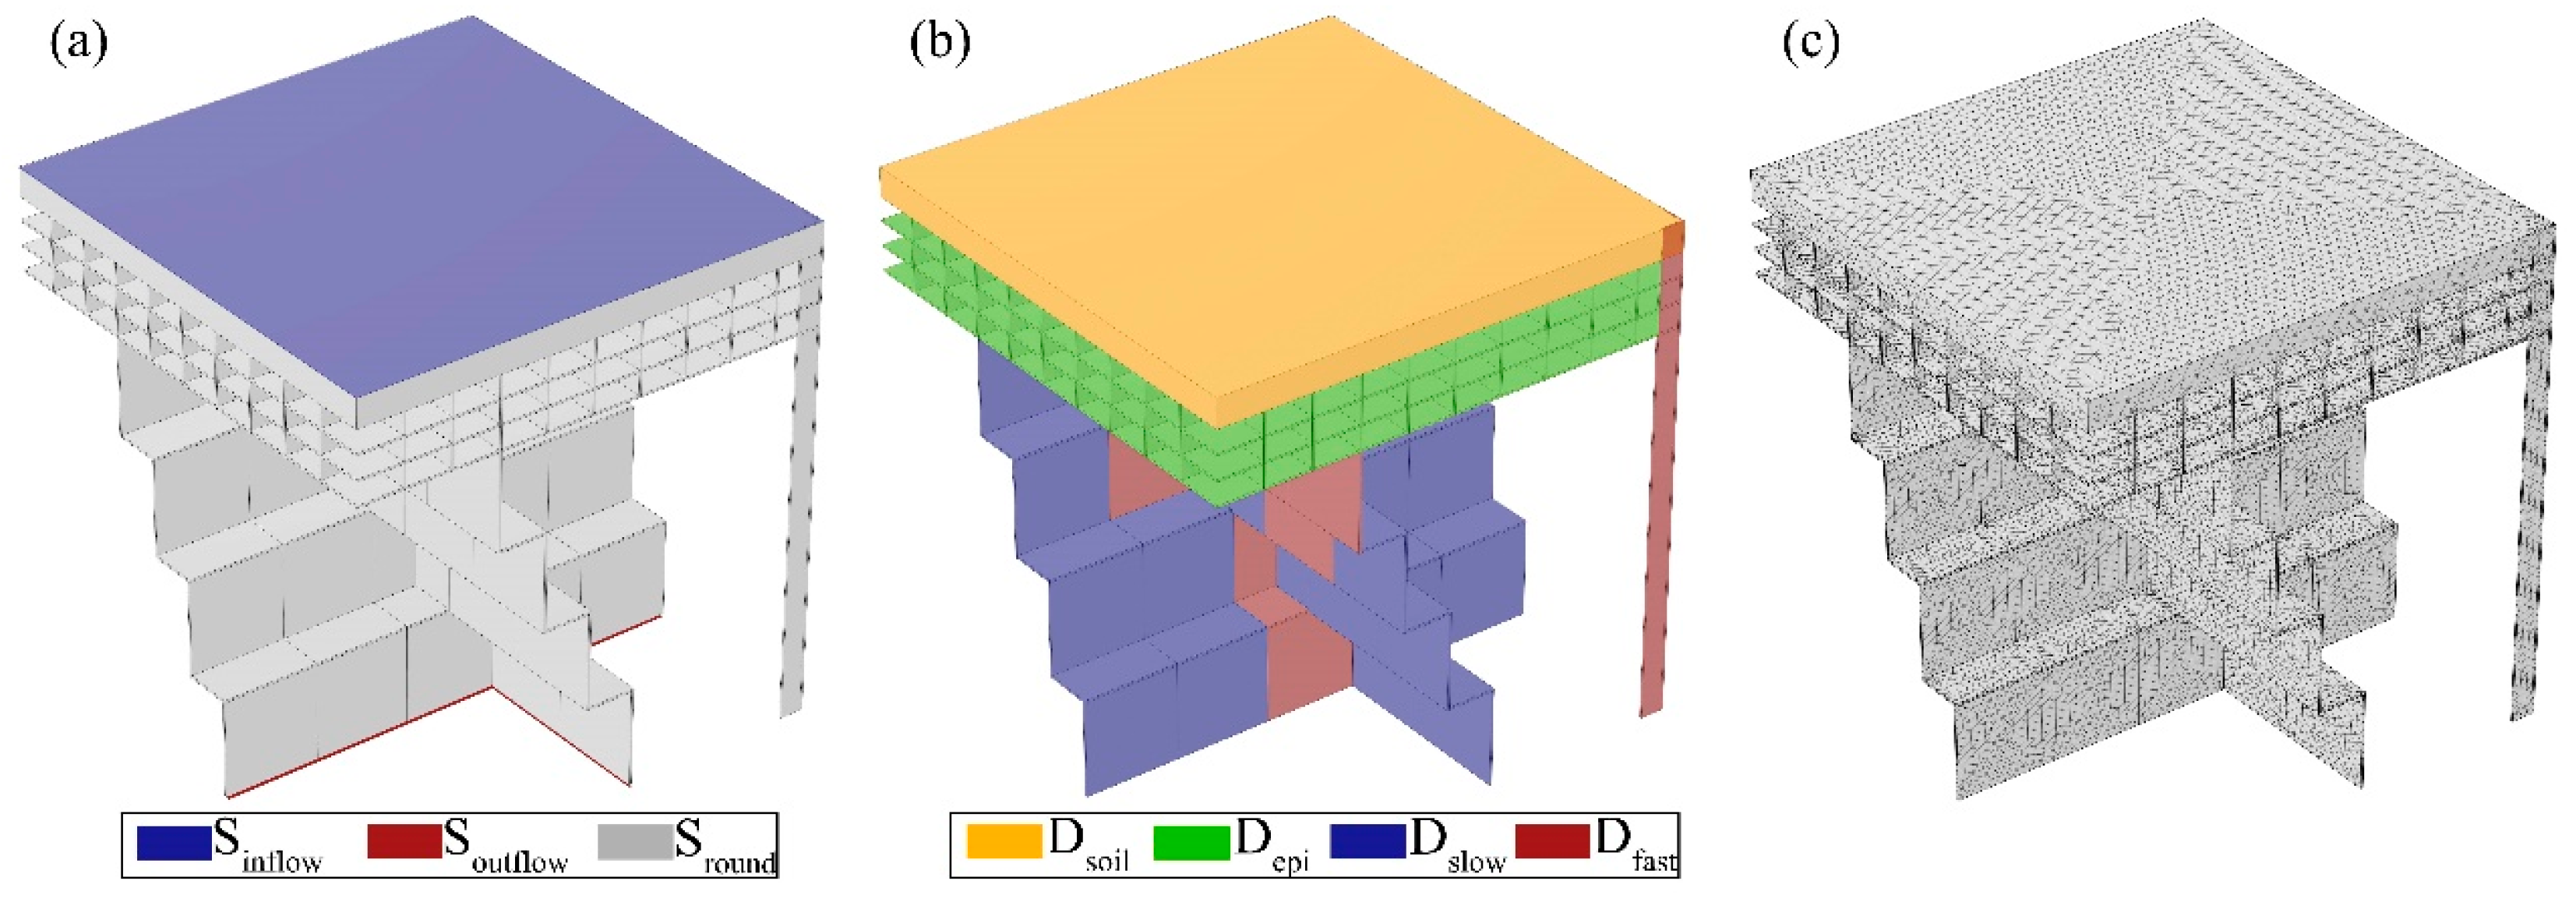
where Soutflow is the area of the model’s bottom boundary, as shown in Figure 3.

3.2. Model Construction

The numerical model dimensions are consistent with those of the experimental model. Figure 3 illustrates a schematic diagram of the numerical model, using the experiment with two fractures, 80 cm thickness, and 0° surface slope as an example. As shown in Figure 3b, the model is divided into four regions: the soil zone (Dsoil), the epikarst zone (Depi), the fast flow system (Dfast), and the slow flow system (Dslow). As shown in Table 2, parameters were assigned to each region. As stated in Section 2.1, the classification of fast and slow flow systems in the transfer zone under different karstification degrees is shown in Figure 2f–j. The saturated hydraulic conductivities for slow flow and fast flow systems were determined using the cubic law after calculating the average fissure width within each system. For finite element computation, the entire model was discretized using tetrahedral elements. The maximum element size was set to 3 cm, the minimum element size to 0.5 cm, the maximum element growth rate to 1.5, and the curvature factor to 0.6. Figure 3c demonstrates the final mesh.

3.3. Model Evaluation Strategy

Model performance was measured using the square root transformed Nash–Sutcliffe efficiency (NSE). The expression of the criteria used in this multi-objective optimization is as follows:
N S E = 1 i = 1 n X m i X s i 2 i = 1 n X m i X m ¯ 2
where Xmi is the measured value for sample i, Xsi is the simulated value for sample i, and X i ¯ is the mean of all square roots of measured values. According to the definition, a higher NSE (closer to 1) corresponds to better model performance, while a lower NSE (closer to 0) corresponds to worse performance.

4. Results and Discussion

4.1. Factors Affecting Recession Process

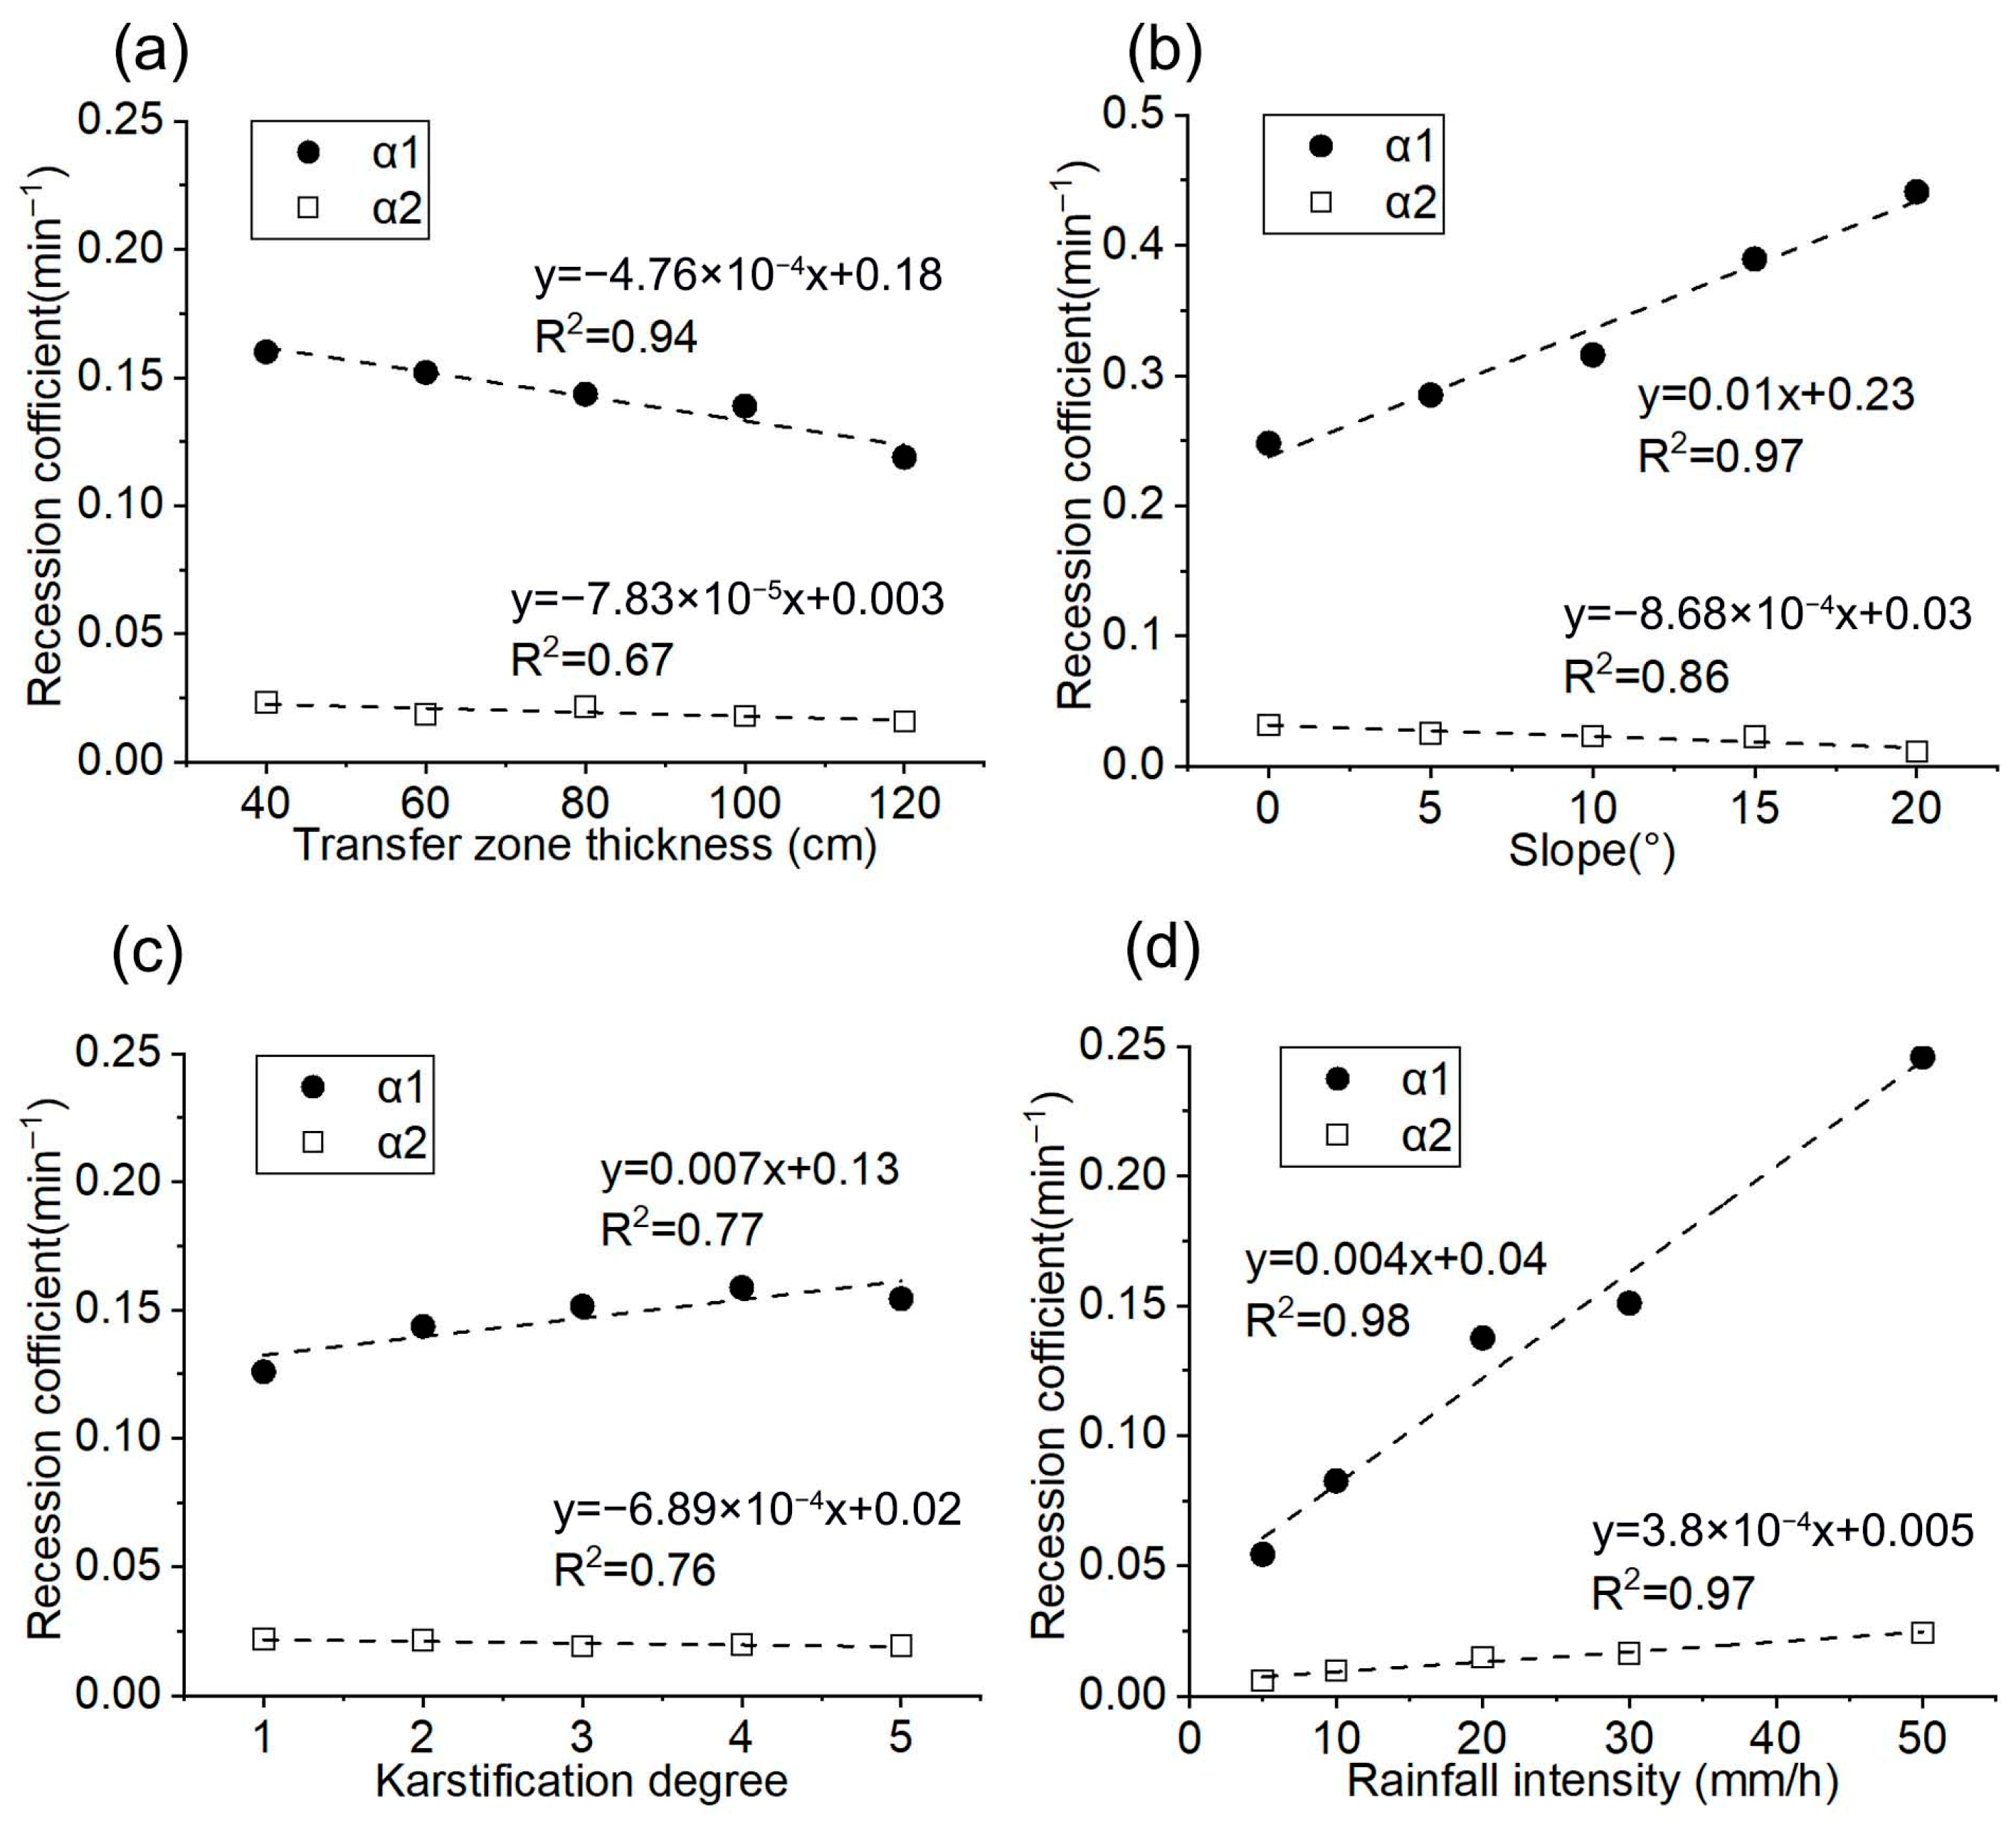
According to the definition, recession coefficient α represents the slope of the discharge recession. A higher value indicates a steeper slope of the curve and corresponds to a faster drainage rate of the system [22]. An increase in the thickness of the transfer zone indicates an elongation of the water infiltration pathway, resulting in an extension of the drainage period of the system. This accounts for the inverse linear relationship observed between transfer zone thickness and the recession coefficients (α1 and α2), as shown in Figure 4a. As shown in Figure 4b, the recession coefficient for fast flow (α1) exhibits an increasing trend, while that for slow flow (α2) shows a decreasing trend when the surface slope increases. This indicates that steeper slopes accelerate the recession process in the fast flow system while delaying the recession process in the slow flow system. This occurs because, under identical initial conditions, a steeper surface slope will promote greater surface runoff toward sinkholes with higher velocities, thereby accelerating the recession process of the fast flow system. The reduction in α2 may be attributed to the elongation of vertical percolation pathways caused by steeper slopes under the conditions of the laboratory experiment, coupled with a decrease in vertical infiltration volume, collectively leading to a slower recession of slow flow. As illustrated in Figure 4c, α1 shows an increasing trend, while α2 exhibits a decreasing trend when the number of fractures in the transfer zone increases. This pattern indicates that enhanced karstification degree accelerates the recession of fast flow while decelerating the recession of slow flow. The increase in fractures expands the network of preferential flow paths, resulting in more rainfall being diverted into fast flow channels. Concurrently, the greater fracture density increases subsurface storage capacity, promoting water retention and subsequent slow release, which attenuates the recession process of slow flow. As shown in Figure 4d, both α1 and α2 increase with rainfall intensity, indicating that higher rainfall intensity enhances the recession rate of flow in the karst vadose zone. This occurs because, under identical initial conditions, greater rainfall intensity leads to higher volumetric water content in the unsaturated zone, which enhances the unsaturated hydraulic conductivity. As shown in Equation (2), there is a positive correlation between hydraulic conductivity and the recession coefficient, that resulted in increased rainfall intensity finally leads to an increase in the recession coefficient. Furthermore, Figure 4d shows that α1 increases from 0.054 to 0.246, with a rise of about 350%, while α2 increases from 0.006 to 0.024, with a rise of about 300%. The more pronounced increase in α1 suggests that rainfall intensity exerts a stronger influence on α1 than on α2.
The unit variation rates of each influencing factor on the recession coefficients α1 and α2 were calculated, as shown in Figure 5. For the fast flow recession coefficient (α1), rainfall intensity is the most influential factor, followed by surface slope. The thickness of the transfer zone shows the next highest sensitivity, while the karstification degree is the least influential. For the slow flow recession coefficient (α2), rainfall intensity also has the most significant effect, with surface slope being slightly less influential. The thickness of the transfer zone has a weaker impact, and the karstification degree shows the weakest influence.

4.2. Factors Affecting Regulating Capacity

As shown in Figure 6a, the regulating coefficient of the karst vadose zone exhibits a linearly increasing trend with the transfer zone thickness. This behavior can be attributed to the additional storage capacity provided by the increased thickness, which enhances water retention within the vadose zone. According to Equation (3), this results in an increase in the regulating coefficient. As shown in Figure 6b, the regulating coefficient of the karst vadose zone decreases with increasing surface slope. This occurs because the slope provides a hydraulic gradient that drives flow, promoting the generation of surface runoff on the soil layer and rapid water loss through sinkholes. Under identical rainfall intensity conditions, less water is retained in storage spaces, such as limestone pores and microfractures, thereby reducing the proportion of rainfall infiltration retained in the unsaturated karst zone and resulting in a decrease in the regulating coefficient. It can also be observed from Figure 6b that the regulating coefficient at the surface slope of 0° (I = 0.647) is significantly higher than those of the other four experimental groups (I = 0.558~0.469). This is because ponding occurs and enhances water infiltration under horizontal surface conditions, while in the sloped setups, surface runoff is rapidly diverted into sinkholes. Consequently, the regulating capacity of the karst vadose zone is significantly stronger with 0° terrain than with sloped conditions. As shown in Figure 6c, the regulating coefficient of the karst vadose zone decreases linearly with an increasing number of fractures in the transfer zone. William pointed out that the epikarst can function as a storage unit only when its hydraulic conductivity contrasts significantly with that of the underlying bedrock [69]. As the fracture density of the transfer zone increases, additional drainage pathways develop within the epikarst, leading to a decrease in the storage capacity of the epikarst. This explains why, despite enhanced storage space due to higher karstification in the transfer zone, the overall regulating capacity of the karst vadose zone is reduced. As shown in Figure 6d, the regulating coefficient of the karst vadose zone decreases in an exponential manner with the increase in rainfall intensity. At the rainfall intensity of 5 mm/h, the regulating coefficient reaches its maximum value (close to 1). This is attributed to the exceptionally low rainfall intensity, which allows nearly all infiltration water to be retained within the karst vadose zone. When the rainfall intensity increases to 10 mm/h and 20 mm/h, the outflow increases, and the proportion of infiltrated water retained decreases, resulting in a decreasing trend in the regulating coefficient. As rainfall intensity increases to 30 mm/h and 50 mm/h, the regulating coefficient continues to decrease but gradually approaches 0.52. This indicates that the influence of rainfall intensity on the regulating coefficient is limited when the structure of the unsaturated karst zone is fixed. Once the regulating capacity reaches its threshold, the coefficient stabilizes and does not decrease further with increasing rainfall intensity.
The unit variation rates of each influencing factor on the regulating coefficients are shown in Figure 7. It can be found that for the regulating coefficient of the karst vadose zone, rainfall intensity shows the most significant influence, followed by surface slope. The transfer zone karstification degree ranks next, while the transfer zone thickness is the least influential.

4.3. Factors Affecting Division of Water Flow

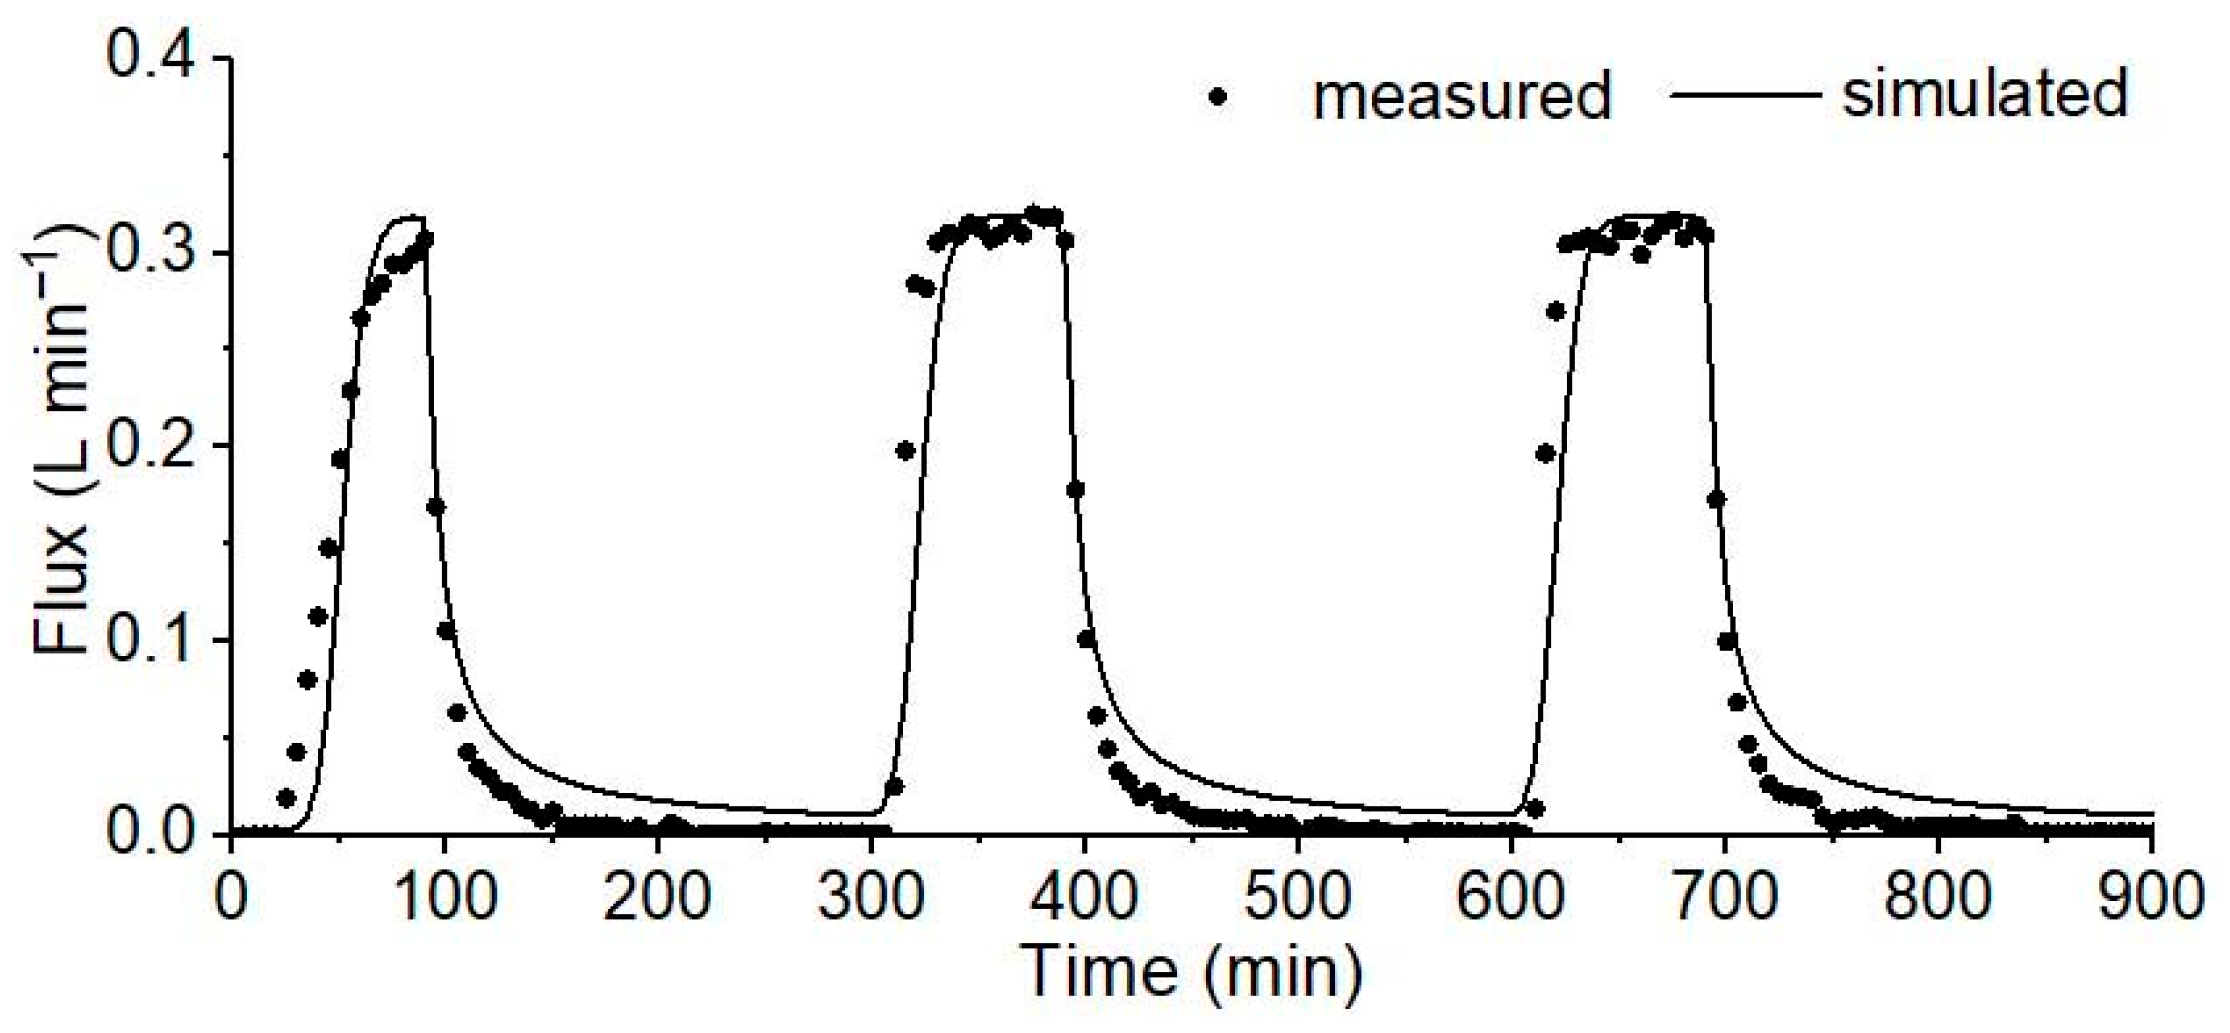
To further elucidate the influence mechanisms of various factors on flow recession processes and regulating capacity in the karst vadose zone, numerical simulations were employed. Figure 8 illustrates a comparison between experimentally measured and numerically simulated flow rates, using Experiment C1 as a representative case. The simulated flow curve exhibits a relatively smooth profile compared with measured data, resulting from the simplification in the numerical model, where fractures of varying widths in the unsaturated zone are just conceptualized as a dual-medium system comprising fast flow and slow flow pathways. Table 3 summarizes the performance of the flow simulations evaluated using NSE across different experimental conditions. As shown in the table, all NSE values exceed 0.75, except for Tests D1 and D2. Overall, the simulation results obtained using the numerical model agree well with the measured results, allowing for further analysis of the influence of different factors on water flow within the karst vadose zone based on the computational outcomes of this numerical model.
The flow dynamics of both the fast and slow flow systems were analyzed. As described in Section 2.1, the slow flow system consists of tight fissures, whereas the fast flow system includes enlarged fractures and sinkholes. The sinkhole flow is a part of fast flow and is analyzed separately. Additionally, the percentages of fast flow and sinkhole flow were examined.
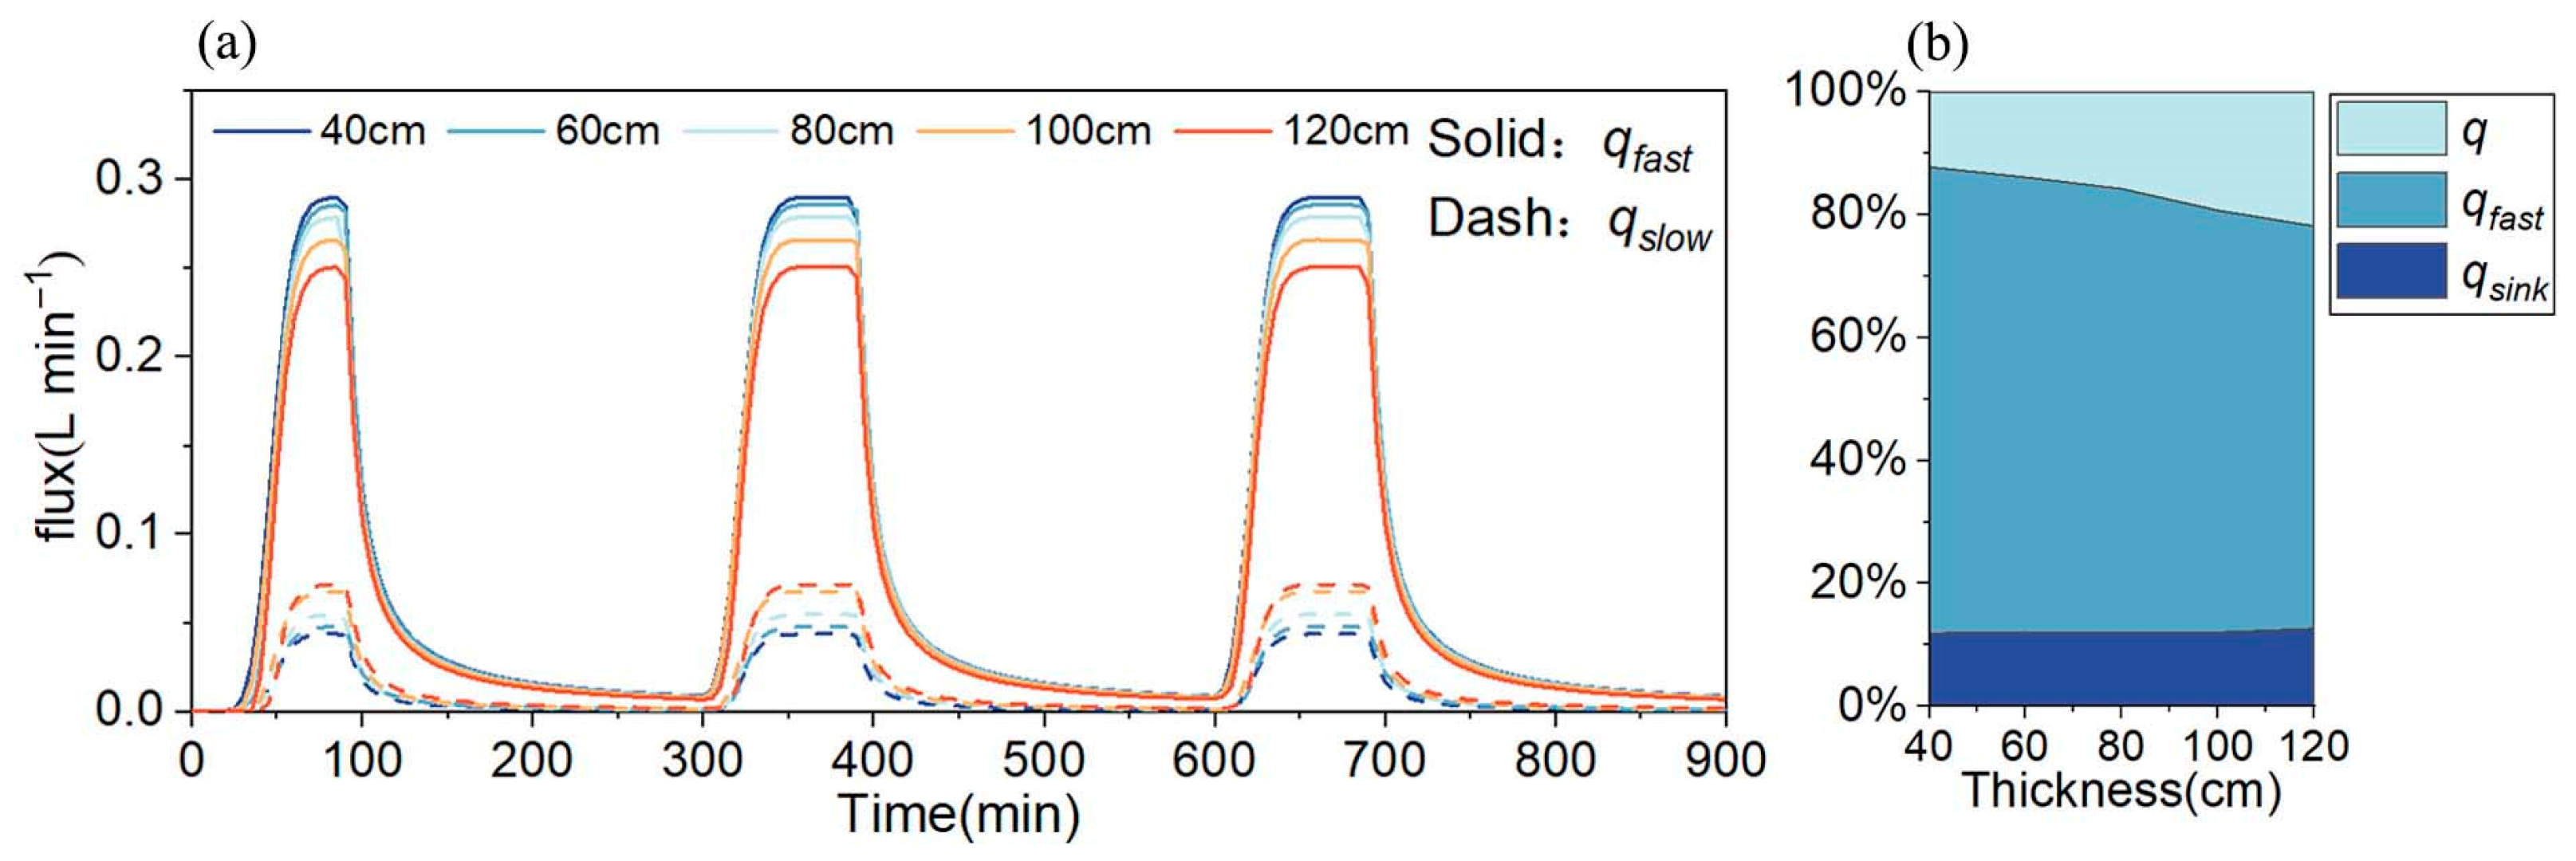
Figure 9 demonstrates the effect of transfer zone thickness on the distribution of flow between fast and slow flow systems. As shown in Figure 9a, the fast flow hydrograph exhibits an overall increasing trend with greater vadose zone thickness, while the slow flow hydrograph shows a general decrease. Figure 9b provides quantitative results indicating that the proportion of fast flow declines from 87.7% to 78.1% as transfer zone thickness increases from 40 cm to 120 cm. Combined with the conclusion from Section 4.2 that greater transfer zone thickness enhances the regulating capacity of the karst vadose zone, it can be inferred that the enhancement of regulating capacity is primarily controlled by the slow flow system. Additionally, Figure 9b shows that variation in transfer zone thickness has little influence on the percentage of sinkhole flow. Across all five thickness scenarios, sinkhole flow remains consistently around 12%, since increased thickness does not substantially alter the amount of water converging into the sinkhole from the soil and epikarst zones.
Figure 10 presents the effect of transfer zone thickness on the distribution of flow between fast and slow flow systems. Figure 10a reveals an overall increasing trend in the fast flow hydrograph and a general decrease in the slow flow hydrograph as the thickness of the vadose zone increases. As shown in Figure 10b, the proportion of fast flow increases from 83.6% to 92.7% (a rise of 9.1%) as surface slope increases from 0° to 20°, while the proportion of sinkhole flow increases from 18.1% to 66.8% (an increase of 48.7%). The growth rate of the proportion of sinkhole flow is significantly higher than that of the proportion of fast flow, indicating that the change in surface slope primarily influences the flow into the sinkhole. Combining the conclusion from Section 4.2 that an increase in surface slope reduces the regulating capacity, this phenomenon can be further attributed to greater flow convergence into the sinkhole under a steeper slope.
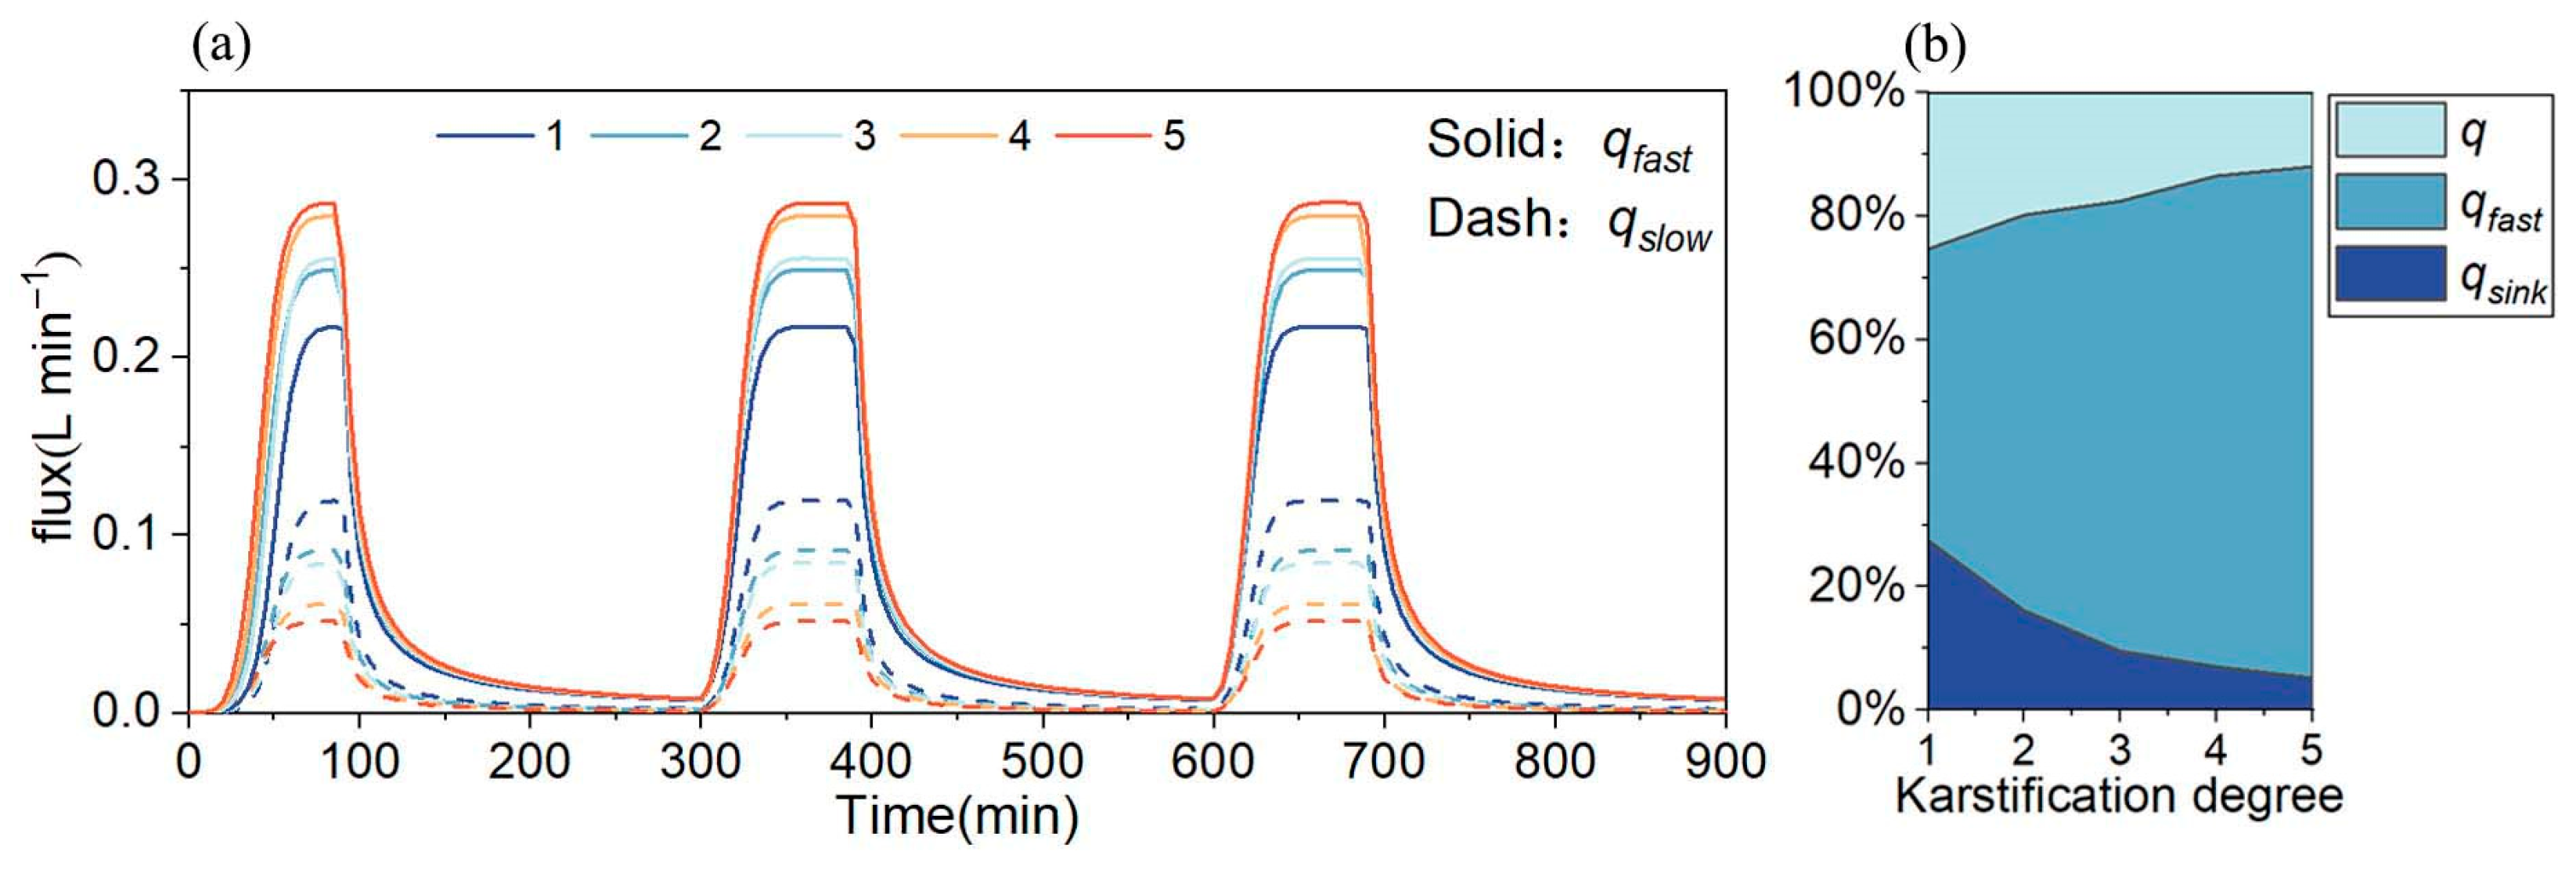
Figure 11 demonstrates the effect of the karstification degree on the distribution of flow between fast and slow flow systems. As shown in Figure 11a, the fast flow hydrograph shows an increasing trend with higher karstification degree, while the slow flow hydrograph exhibits a decreasing trend. Figure 11b indicates that the proportion of fast flow exhibits a positive correlation with the karstification degree. As the karstification degree increases from one fracture to fully fissured conditions, the proportion of fast flow rises from 74.6% to 88.1%. In contrast, the proportion of sinkhole flow shows a negative correlation with karstification degree, decreasing from 27.6% to 5.2%. Given that the fast flow system consists of wide fractures and sinkholes, the opposite responses of the proportion of sinkhole flow and the proportion of fast flow to changes in karstification degree suggest that the increase in the proportion of fast flow is primarily controlled by the wide fractures.
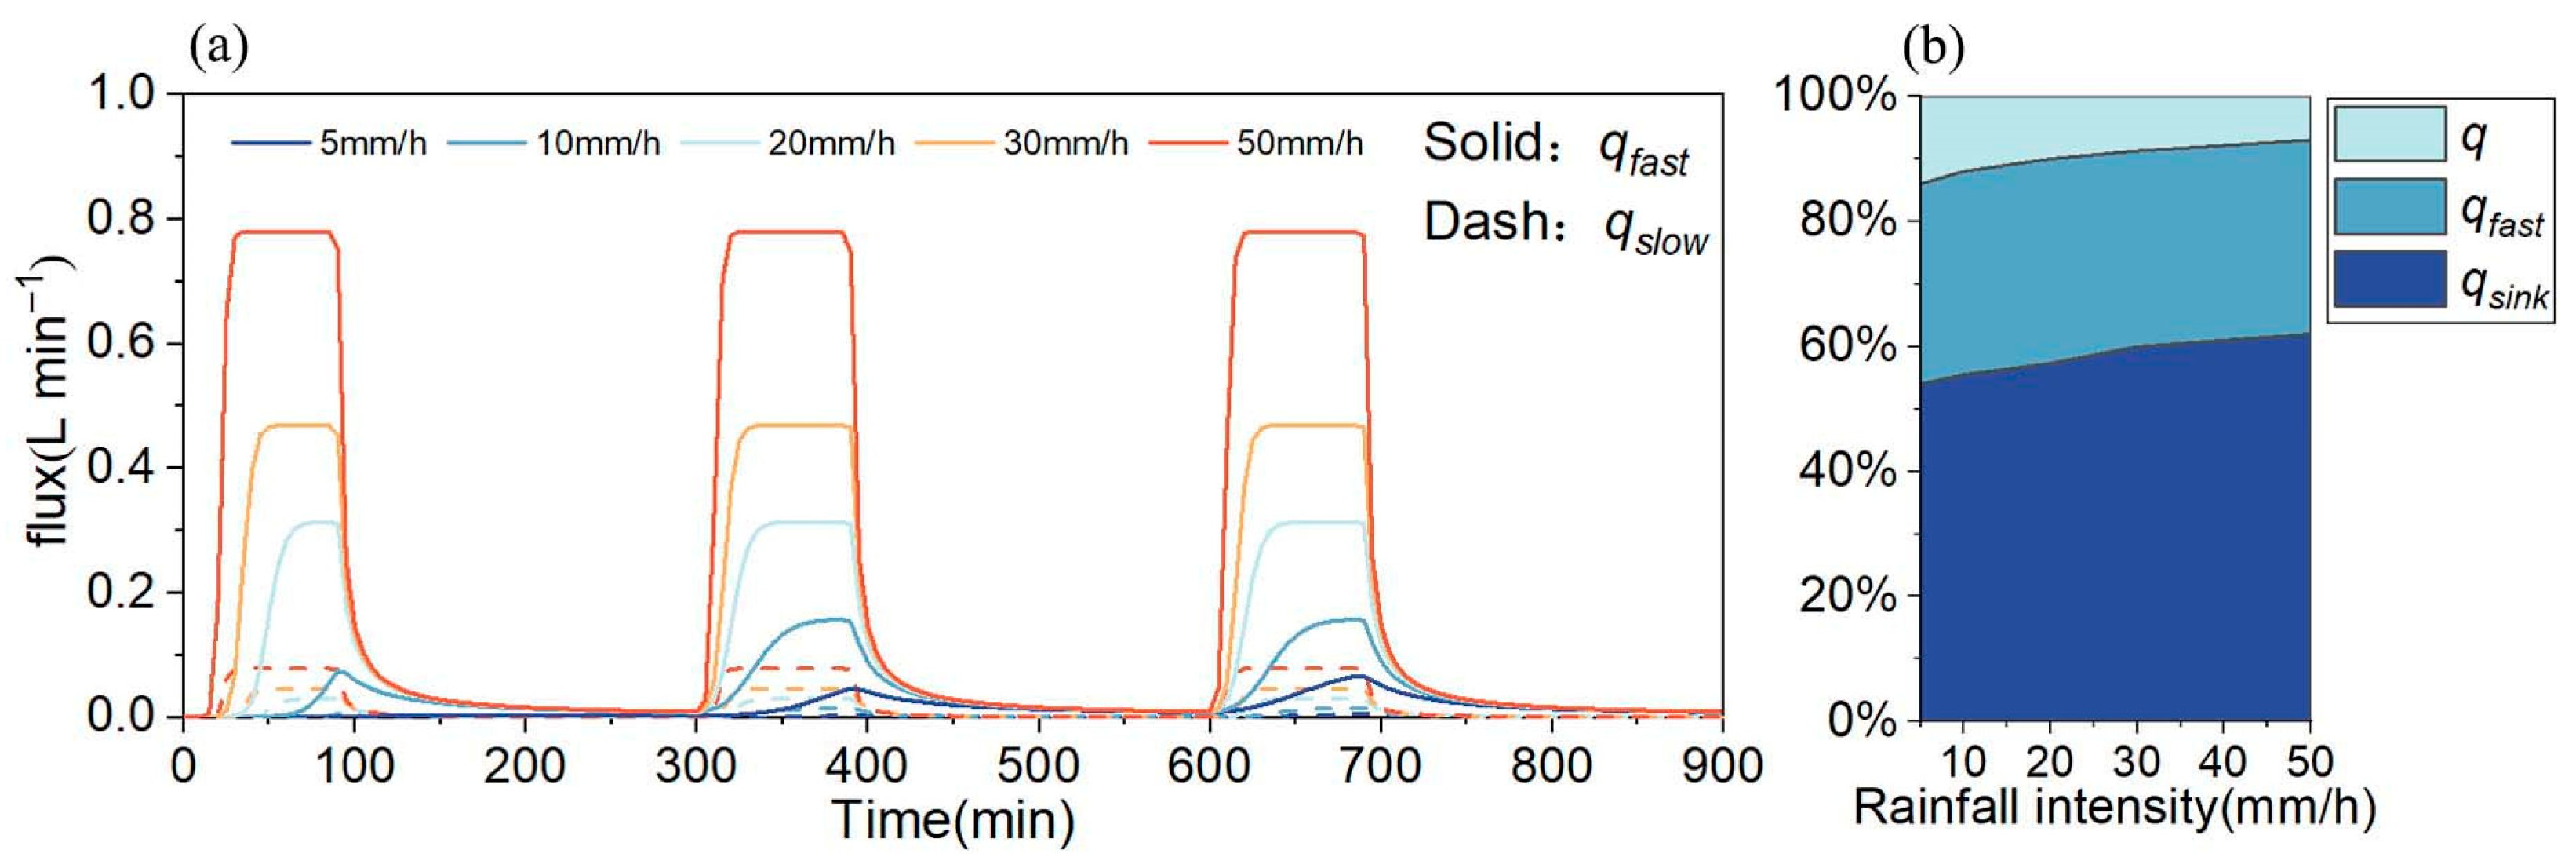
Figure 12 presents the effect of rainfall intensity on the distribution of flow between fast and slow flow systems. As shown in Figure 12b, when rainfall intensity increases from 5 mm/h to 50 mm/h, the proportion of fast flow rises from 86.1% to 93.9%, representing an increase of 7.8%, while the proportion of sinkhole flow increases from 54.2% to 62.4%, a growth of 8.2%. The similar magnitude of these increments suggests that the increase in fast flow resulting from higher rainfall intensity is mainly attributable to the rise in sinkhole flow.

4.4. Future Work

The study improves our understanding of the influence mechanism of the regulating capacity and flow recession process in the karst vadose zone. As part of broader research on the karst vadose zone, our study represents an initial investigation that has identified numerous questions for future work. It should be noted that each experiment in this study was conducted only once, thereby not accounting for the uncertainty arising from the random placement of rocks. Future research should incorporate replicate experiments using a stochastic rock placement model to better quantify and mitigate this source of variability. The application of color tracers in experiments enables more intuitive data acquisition and facilitates rapid assessment of water flow within the experimental model [70,71]. Incorporating color tracers in future experiments may yield further valuable insights. The laboratory-scale experimental model in this study was not intended to replicate a specific karst system, as natural systems are far more complex. This limitation does not compromise the primary objective of the study. Constructed on the basis of a typical conceptual model of the karst vadose zone, the laboratory model provides findings that are broadly applicable and serve as a valuable reference for future research. However, the scale effects inherent in laboratory experiments must be acknowledged. A key direction for future work is the integration of controlled indoor experiments with field-based investigations.

5. Conclusions

In this research, a laboratory-scale experimental model of a typical karst vadose zone was constructed and used to simulate water flow process under the influence of different factors, including transfer zone thickness, surface slope, karstification degree, and rainfall intensity. A corresponding distributed model was subsequently developed to simulate the laboratory experiments. By analyzing the recession coefficients (a1 and a2), the regulating coefficient (I), and the division of fast and slow flow, the influence of the factors on the regulating capacity and flow recession process of the karst vadose zone was evaluated. The primary conclusions are as follows.
As the transfer zone thickness increases from 40 cm to 120 cm, the regulating coefficient of the vadose zone increases from 0.49 to 0.53, while the percentage of fast flow decreases from 87.7% to 78.1%. It can be inferred that the enhancement of regulating capacity is primarily controlled by the slow flow system.
With the increase in surface slope, the regulating coefficient of the vadose zone decreases from 0.647 to 0.469, while the percentages of fast flow and sinkhole flow increase, and the growth rate of the proportion of sinkhole flow (an increase of 48.7%) is significantly higher than that of the proportion of fast flow (an increase of 9.1%). It can be inferred that the decrease in regulating capacity resulting from an increase in surface slope is primarily attributable to enhanced water loss through sinkholes.
An increase in karstification degree enhances the network of fast flow pathways composed of wide fractures, leading to a rise in the fast flow recession coefficient (α1). Simultaneously, it expands the water storage capacity within microfissures, resulting in a decrease in the slow flow recession coefficient (α2). Meanwhile, the increase in fracture density reduces the water storage capacity of the epikarst, leading to an overall decrease in the regulating coefficient of the karst vadose zone.
When the structure of the karst vadose zone remains constant, the regulating coefficient decreases exponentially with increasing rainfall intensity and gradually approaches a constant value. This value represents the maximum regulating capacity of the karst vadose zone under its current structural conditions.
Based on the analysis of the unit variation rates of each influencing factor, the sensitivity ranking of influencing factors on α1 and slow flow α2 is rainfall intensity > surface slope > transfer zone thickness > karstification degree. The sensitivity ranking for the regulating capacity of the karst vadose zone is rainfall intensity > surface slope > karstification degree > transfer zone thickness. These indicate that rainfall intensity is the most dominant factor influencing both flow recession processes and regulating capacity of the karst vadose zone.

Author Contributions

Conceptualization, R.L. and J.W.; methodology, R.L. and S.Z. (Shumei Zhu); software, R.L.; validation, D.Y.; formal analysis, R.L.; investigation, Y.Z. (Yongsheng Zhao) and F.Q.; data curation, S.Z. (Shiyu Zheng); writing—original draft preparation, R.L.; writing—review and editing, S.Z. (Shumei Zhu) and Y.Z. (Yuting Zhang); supervision, J.W. All authors have read and agreed to the published version of the manuscript.

Funding

This work was funded by the Suzhou University Doctoral Scientific Research Start-up Fund Project [Grant No. 2025BSK001], and the National Natural Science Foundation of China [Grant No. 42477181].

Data Availability Statement

Secondary data are available upon request to the corresponding author. Primary data are not available due to ethics restrictions to ensure anonymity of all respondents.

Acknowledgments

We thank the Associate Editor and anonymous reviewers for their critical and constructive comments which helped us improve the quality of the paper greatly.

Conflicts of Interest

The authors declare no conflicts of interest in the context of this publication.

References

  1. Ford, D.; Williams, P. Karst Hydrogeology and Geomorphology; John Wiley & Sons: Hoboken, NJ, USA, 2007. [Google Scholar]
  2. Wang, S.J.; Liu, Q.M.; Zhang, D.F. Karst Rocky Desertification in Southwestern China: Geomorphology, Landuse, Impact and Rehabilitation. Land Degrad. Dev. 2004, 15, 115–121. [Google Scholar] [CrossRef]
  3. Mudarra, M.; Andreo, B. Relative Importance of the Saturated and the Unsaturated Zones in the Hydrogeological Functioning of Karst Aquifers: The Case of Alta Cadena (Southern Spain). J. Hydrol. 2011, 397, 263–280. [Google Scholar] [CrossRef]
  4. Aquilina, L.; Ladouche, B.; Dörfliger, N. Recharge Processes in Karstic Systems Investigated through the Correlation of Chemical and Isotopic Composition of Rain and Spring-Waters. Appl. Geochem. 2005, 20, 2189–2206. [Google Scholar] [CrossRef]
  5. Bouwer, H. Artificial Recharge of Groundwater: Hydrogeology and Engineering. Hydrogeol. J. 2002, 10, 121–142. [Google Scholar] [CrossRef]
  6. El-hakim, M.; Bakalowicz, M. Significance and Origin of Very Large Regulating Power of Some Karst Aquifers in the Middle East. J. Hydrol. 2007, 333, 329–339. [Google Scholar] [CrossRef]
  7. Jiao, Y.; Liu, J.; Li, C.; Qiu, Q.; Yu, X.; Wang, W.; Zhang, G. Regulation Storage Calculation and Capacity Evaluation of the Underground Reservoir in the Groundwater Overdraft Area of Northern China. Environ. Earth Sci. 2020, 79, 18. [Google Scholar] [CrossRef]
  8. Baker, A.; Brunsdon, C. Non-Linearities in Drip Water Hydrology: An Example from Stump Cross Caverns, Yorkshire. J. Hydrol. 2003, 277, 151–163. [Google Scholar] [CrossRef]
  9. Aquilina, L.; Ladouche, B.; Dörfliger, N. Water Storage and Transfer in the Epikarst of Karstic Systems during High Flow Periods. J. Hydrol. 2006, 327, 472–485. [Google Scholar] [CrossRef]
  10. Berthelin, R.; Hartmann, A. The Shallow Subsurface of Karst Systems: Review and Directions. In Eurokarst 2018, Besançon. Advances in Karst Science; Bertrand, C., Denimal, S., Steinmann, M., Renard, P., Eds.; Springer: Cham, Switzerland, 2020; pp. 61–68. ISBN 9783030140151. [Google Scholar]
  11. Bonacci, O. Karst Hydrology; Spring: Berlin/Heidelberg, Germany, 1987. [Google Scholar]
  12. Lee, E.S.; Krothe, N.C. Delineating the Karstic Flow System in the Upper Lost River Drainage Basin, South Central Indiana: Using Sulphate and Δ34SSO4 as Tracers. Appl. Geochem. 2003, 18, 145–153. [Google Scholar] [CrossRef]
  13. Yang, W.; Chen, L.; Huang, W.; Qian, Y.; Zhang, W. Enhancing Hourly Streamflow Simulation in Karst Basins: Development of the Modified DK-XAJ-EW Hydrological Model Integrating Epikarst Water Storage Function Dynamics. J. Hydrol. 2025, 658, 133170. [Google Scholar] [CrossRef]
  14. Sheffer, N.A.; Cohen, M.; Morin, E.; Grodek, T.; Gimburg, A.; Magal, E.; Gvirtzman, H.; Nied, M.; Isele, D.; Frumkin, A. Integrated Cave Drip Monitoring for Epikarst Recharge Estimation in a Dry Mediterranean Area, Sif Cave, Israel. Hydrol. Process. 2011, 25, 2837–2845. [Google Scholar] [CrossRef]
  15. Emblanch, C.; Zuppi, G.; Mudry, J.; Blavoux, B.; Batiot, C. Carbon 13 of TDIC to Quantify the Role of the Unsaturated Zone: The Example of the Vaucluse Karst Systems (Southeastern France). J. Hydrol. 2003, 279, 262–274. [Google Scholar] [CrossRef]
  16. Mazzilli, N.; Boucher, M.; Chalikakis, K.; Legchenko, A.; Jourde, H.; Champollion, C. Contribution of Magnetic Resonance Soundings for Characterizing Water Storage in the Unsaturated Zone of Karst Aquifers. Geophysics 2016, 81, 49–61. [Google Scholar] [CrossRef]
  17. Liu, R.; Wang, J.; Zhan, H.; Chen, Z.; Li, W.; Yang, D.; Zheng, S. Influence of Thick Karst Vadose Zone on Aquifer Recharge in Karst Formations. J. Hydrol. 2021, 592, 125791. [Google Scholar] [CrossRef]
  18. Xin, Y.; Zhou, Z.; Dou, Z.; Li, M.; Ma, J. Constant-Head and Variable-Head Injection Tests for Determining the Hydraulic Parameters of an Aquitard. Hydrogeol. J. 2020, 28, 2359–2372. [Google Scholar] [CrossRef]
  19. Xin, Y.; Zhou, Z.; Yu, F. Slug Tests for Determining the Hydraulic Parameters of an Unconfined Aquifer Considering Delayed Drainage Effect. J. Hydrol. 2025, 659, 133132. [Google Scholar] [CrossRef]
  20. Fiorillo, F. Tank-Reservoir Drainage as a Simulation of the Recession Limb of Karst Spring Hydrographs. Hydrogeol. J. 2011, 19, 1009–1019. [Google Scholar] [CrossRef]
  21. Fiorillo, F.; Pagnozzi, M.; Ventafridda, G. A Model to Simulate Recharge Processes of Karst Massifs. Hydrol. Process. 2014, 29, 2301–2314. [Google Scholar] [CrossRef]
  22. Olarinoye, T.; Gleeson, T.; Hartmann, A. Karst Spring Recession and Classification: Efficient, Automated Methods for Both Fast- and Slow-Flow Components. Hydrol. Earth Syst. Sci. 2022, 26, 5431–5447. [Google Scholar] [CrossRef]
  23. Bakshevskaia, V.A.; Pozdniakov, S.P.; Chiganov, I.A. Analysis of the Genetic Components of Groundwater (Spring) Discharge in a Fracture–Karst Massif. Water Resour. 2024, 51, S163–S172. [Google Scholar] [CrossRef]
  24. Tang, R.; Shu, L.; Lu, C.; Zhang, C.; Fan, J.; Appiah-Adjei, E.K. Laboratory Analog Analysis of Spring Recession Curve in a Karst Aquifer with Fracture and Conduit Domains. J. Hydrol. Eng. 2016, 21, 06015013. [Google Scholar] [CrossRef]
  25. Dewandel, B.; Lachassagne, P.; Bakalowicz, M.; Weng, P.; Al-malki, A. Evaluation of Aquifer Thickness by Analysing Recession Hydrographs. J. Hydrol. 2003, 274, 248–269. [Google Scholar] [CrossRef]
  26. Boussinesq, J. Essai Sur La Théorie Des Eaux Courantes Do Mouvement Non Permanent Des Eaux Souterraines. Acad. Sci. Inst. Fr. 1877, 23, 252–260. [Google Scholar]
  27. Bonacci, O. Karst Springs Hydrographs as Indicators of Karst Aquifers. Hydrol. Sci. J. 1993, 38, 51–62. [Google Scholar] [CrossRef]
  28. Griffiths, G.A.; Clausen, B. Streamflow Recession in Basins with Multiple Water Storages. J. Hydrol. 1997, 190, 60–74. [Google Scholar] [CrossRef]
  29. Vashisht, A.K.; Bam, B. Formulating the Spring Discharge-Function for the Recession Period by Analyzing Its Recession Curve: A Case Study of the Ranichauri Spring (India). J. Earth Syst. Sci. 2013, 122, 1313–1323. [Google Scholar] [CrossRef]
  30. Tallaksen, L. A Review of Baseflow Recession Analysis. J. Hydrol. 1995, 165, 349–370. [Google Scholar] [CrossRef]
  31. Chang, W.; Wan, J.; Tan, J.; Wang, Z.; Jiang, C.; Huang, K. Responses of Spring Discharge to Different Rainfall Events for Single-Conduit Karst Aquifers in Western Hunan Province, China. Int. J. Environ. Res. Public Health 2021, 18, 5775. [Google Scholar] [CrossRef]
  32. Kumar, V.; Sen, S. Evaluation of Spring Discharge Dynamics Using Recession Curve Analysis: A Case Study in Data-Scarce Region, Lesser Himalayas, India. Sustain. Water Resour. Manag. 2018, 4, 539–557. [Google Scholar] [CrossRef]
  33. Mohammadi, Z.; Shoja, A. Effect of Annual Rainfall Amount on Characteristics of Karst Spring Hydrograph. Carbonates Evaporites 2014, 29, 279–289. [Google Scholar] [CrossRef]
  34. Maillet, E.T. Essais d’hydraulique Souterraine et Fluviale; Hermann: Paris, France, 1905. [Google Scholar]
  35. Luo, L.; Liang, X.; Luo, M.; Zhou, H. Applied Geochemistry Characterizing the Hierarchical Groundwater Flow Systems in Karstic. Appl. Geochem. 2022, 143, 105371. [Google Scholar] [CrossRef]
  36. Forkasiewicz, M.J.; Paloc, H. Régime de Tarissement de La Foux-de-La-Vis (Gard) Étude Préliminaire. Houille Blanche 1967, 53, 29–36. [Google Scholar] [CrossRef]
  37. Liu, R.; Wang, J.; Zhang, Y.; Reimann, T.; Hartmann, A. Laboratory and Numerical Simulations of Infiltration Process and Solute Transport in Karst Vadose Zone. J. Hydrol. 2024, 636, 131242. [Google Scholar] [CrossRef]
  38. Mohammadi, Z.; Illman, W.A.; Field, M. Review of Laboratory Scale Models of Karst Aquifers: Approaches, Similitude, and Requirements. Groundwater 2020, 59, 163–174. [Google Scholar] [CrossRef]
  39. Li, Z.; Wang, Z. Experimental Study on the Relation between the Fractal Characteristics and Solute Transport Parameters of Sandy Soil. J. Soils Sediments 2020, 20, 3181–3191. [Google Scholar] [CrossRef]
  40. Li, Y.; Shu, L.; Wu, P.; Zou, Z.; Lu, C.; Liu, B.; Niu, S.; Yin, X. Influence of the Karst Matrix Hydraulic Conductivity and Specific Yield on the Estimation Accuracy of Karstic Water Storage Variation. J. Hydrol. 2023, 626, 130186. [Google Scholar] [CrossRef]
  41. Luo, M.; Zhou, Z.; Chen, J.; Peng, X.; Zhao, Z.; Zhao, W. Identifying Solute Loss from Karst Conduit to Fissures under Concentrated Recharge Conditions. J. Hydrol. 2025, 647, 132370. [Google Scholar] [CrossRef]
  42. Gouy, A.; Collon, P.; Bailly-Comte, V.; Galin, E.; Antoine, C.; Thebault, B.; Landrein, P. KarstNSim: A Graph-Based Method for 3D Geologically-Driven Simulation of Karst Networks. J. Hydrol. 2024, 632, 130878. [Google Scholar] [CrossRef]
  43. Knöll, P.; Schiperski, F.; Roesrath, A.; Scheytt, T. Effects of Model Complexity on Karst Catchment Runoff Modeling for Flood Warning Systems. J. Hydrol. X 2025, 26, 100194. [Google Scholar] [CrossRef]
  44. Ohad, S.; Ovadia, L.; Yakov, L.; Haim, G. Groundwater Flow Modelling of a Large-Scale Thick Vadose Zone Including Two Perched Aquifers, the Jerusalem Mountains. Hydrol. Process. 2025, 39, e70216. [Google Scholar] [CrossRef]
  45. Poulain, A.; Watlet, A.; Kaufmann, O.; Van Camp, M.; Jourde, H.; Mazzilli, N.; Rochez, G.; Deleu, R.; Quinif, Y.; Hallet, V. Assessment of Groundwater Recharge Processes through Karst Vadose Zone by Cave Percolation Monitoring. Hydrol. Process. 2018, 32, 2069–2083. [Google Scholar] [CrossRef]
  46. Yan, Y.; Dai, Q.; Jin, L.; Wang, X. Geometric Morphology and Soil Properties of Shallow Karst Fissures in an Area of Karst Rocky Desertification in SW China. CATENA 2019, 174, 48–58. [Google Scholar] [CrossRef]
  47. Mangin, A. Contribution à l’étude Hydrodynamique des Aquifères Karstiques; Université de Dijon: Dijon, France, 1975. [Google Scholar]
  48. Williams, P.W. The Role of the Subcutaneous Zone in Karst Hydrology. J. Hydrol. 1983, 61, 45–67. [Google Scholar] [CrossRef]
  49. Bakalowicz, M. La Zone d’infiltration Des Aquifères Karstiques. Méthodes Dtétude. Structure et Fonctionnernent. Hydrogeol. J. 1995, 4, 3–21. Available online: https://digitalcommons.usf.edu/kip_articles/5677 (accessed on 13 October 2025).
  50. Hartmann, A.; Lange, J.; Vivó, À.; Mizyed, N.; Smiatek, G.; Kunstmann, H. A Multi-Model Approach for Improved Simulations of Future Water Availability at a Large Eastern Mediterranean Karst Spring. J. Hydrol. 2012, 468–469, 130–138. [Google Scholar] [CrossRef]
  51. Chang, Y.; Wu, J.; Jiang, G.; Liu, L.; Reimann, T.; Sauter, M. Modelling Spring Discharge and Solute Transport in Conduits by Coupling CFPv2 to an Epikarst Reservoir for a Karst Aquifer. J. Hydrol. 2019, 569, 587–599. [Google Scholar] [CrossRef]
  52. Petrič, M.; Kogovšek, J.; Ravbar, N. Effects of the Vadose Zone on Groundwater Flow and Solute Transport Characteristics in Mountainous Karst Aquifers–The Case of the Javorniki–Snežnik Massif (SW Slovenia). Acta Carsologica 2018, 47, 35–51. [Google Scholar] [CrossRef]
  53. Chen, X.; Zhang, Z.; Soulsby, C.; Cheng, Q.; Binley, A.; Jiang, R.; Tao, M. Characterizing the Heterogeneity of Karst Critical Zone and Its Hydrological Function: An Integrated Approach. Hydrol. Process. 2018, 32, 2932–2946. [Google Scholar] [CrossRef]
  54. Gunn, J. Point-Recharge of Limestone Aquifers—A Model from New Zealand Karst. J. Hydrol. 1983, 61, 19–29. [Google Scholar] [CrossRef]
  55. Gou, J.; Qu, S.; Shi, P.; Li, D.; Chen, X.; Wang, Y.; Shan, S.; Si, W. Application of Stable Isotope Tracer to Study Runoff Generation during Different Types of Rainfall Events. Water 2018, 10, 538. [Google Scholar] [CrossRef]
  56. Gou, J.; Qu, S.; Shi, P.; Wang, Y.; Shan, S.; Chen, X.; Li, D.; Si, W. Evaluating Runoff Generation in a Humid Bamboo Watershed Using Isotopic and Hydrochemical Tracer. J. Hydrol. Eng. 2019, 24, 05019003. [Google Scholar] [CrossRef]
  57. Wei, X.; Yan, Y.; Xie, D.; Ni, J.; Loáiciga, H.A. The Soil Leakage Ratio in the Mudu Watershed, China. Environ. Earth Sci. 2016, 75, 721. [Google Scholar] [CrossRef]
  58. Yan, Y.; Dai, Q.; Yuan, Y.; Peng, X.; Zhao, L.; Yang, J. Effects of Rainfall Intensity on Runoff and Sediment Yields on Bare Slopes in a Karst Area, SW China. Geoderma 2018, 330, 30–40. [Google Scholar] [CrossRef]
  59. Wang, L.; Zhu, L.; Cao, Z.; Liu, J.; Xue, Y.; Wang, P.; Cao, X.; Liu, Y. Thermo-Mechanical Degradation and Fracture Evolution in Low-Permeability Coal Subjected to Cyclic Heating-Cryogenic Cooling. Phys. Fluids 2025, 37, 086617. [Google Scholar] [CrossRef]
  60. Teng, T.; Chen, Y.; Wang, Y.; Qiao, X. In Situ Nuclear Magnetic Resonance Observation of Pore Fractures and Permeability Evolution in Rock and Coal under Triaxial Compression. J. Energy Eng. 2025, 151, 04025036. [Google Scholar] [CrossRef]
  61. Bacdk, S.J.; Krothe, N.C. Derivation of Effective Hydraulic Parameters of a Karst Aquifer from Discharge Hydrograph Analysis. Water Resour. Res. 2001, 37, 13–19. [Google Scholar] [CrossRef]
  62. LA, R. Capillary Conduction of Liquids in Porous Mediums. Physics 1931, 1, 318–333. [Google Scholar]
  63. van Genuchten, M. A Closed-Form Equation for Predicting the Hydraulic Conductivity of Unsaturated Soils. Soil Sci. Soc. Am. J. 1980, 44, 892–898. [Google Scholar] [CrossRef]
  64. Chen, Z.; Zhang, L.; Lingfan, Z.; Min, B.; Zihan, Z. Rock and Soil Mechanics Treatment of Two Boundary Conditions for Rainfall Infiltration in Slope and Its Application. Rock Soil Mech. 2021, 41, 4105–4115. [Google Scholar]
  65. Toss, D.K. Ground Water Hydrology; Wiley: New York, NY, USA, 1959. [Google Scholar]
  66. Hou, X.P.; Fan, H.H. Study on Rainfall Infiltration Characteristics of Unsaturatedfractured Soil Based on COMSOL Multiphysics. Rock Soil Mech. 2022, 43, 563–572. [Google Scholar] [CrossRef]
  67. Carsel, R.F.; Parrish, R.S. Developing Joint Probability Distributions of Soil Water Retention Characteristics. Water Resour. Res. 1988, 24, 755–769. [Google Scholar] [CrossRef]
  68. Mualem, Y. A New Model for Predicting the Hydraulic Conductivity of Unsaturated Porous Media. Water Resour. Res. 1976, 12, 513–522. [Google Scholar] [CrossRef]
  69. Williams, P.W. The Role of the Epikarst in Karst and Cave Hydrogeology: A Review. Int. J. Speleol. 2008, 37, 1–10. [Google Scholar] [CrossRef]
  70. Zhu, S.; Zhou, Z.; Werner, A.D.; Chen, Y. Experimental Analysis of Intermittent Pumping Effects on Seawater Intrusion. Water Resour. Res. 2023, 59, e2022WR032269. [Google Scholar] [CrossRef]
  71. Hu, X.; Wang, X.; Gunzburger, M.; Hua, F.; Cao, Y. Experimental and Computational Validation and Verification of the Stokes-Darcy and Continuum Pipe Flow Models for Karst Aquifers with Dual Porosity Structure. Hydrol. Process. 2012, 26, 2031–2040. [Google Scholar] [CrossRef]
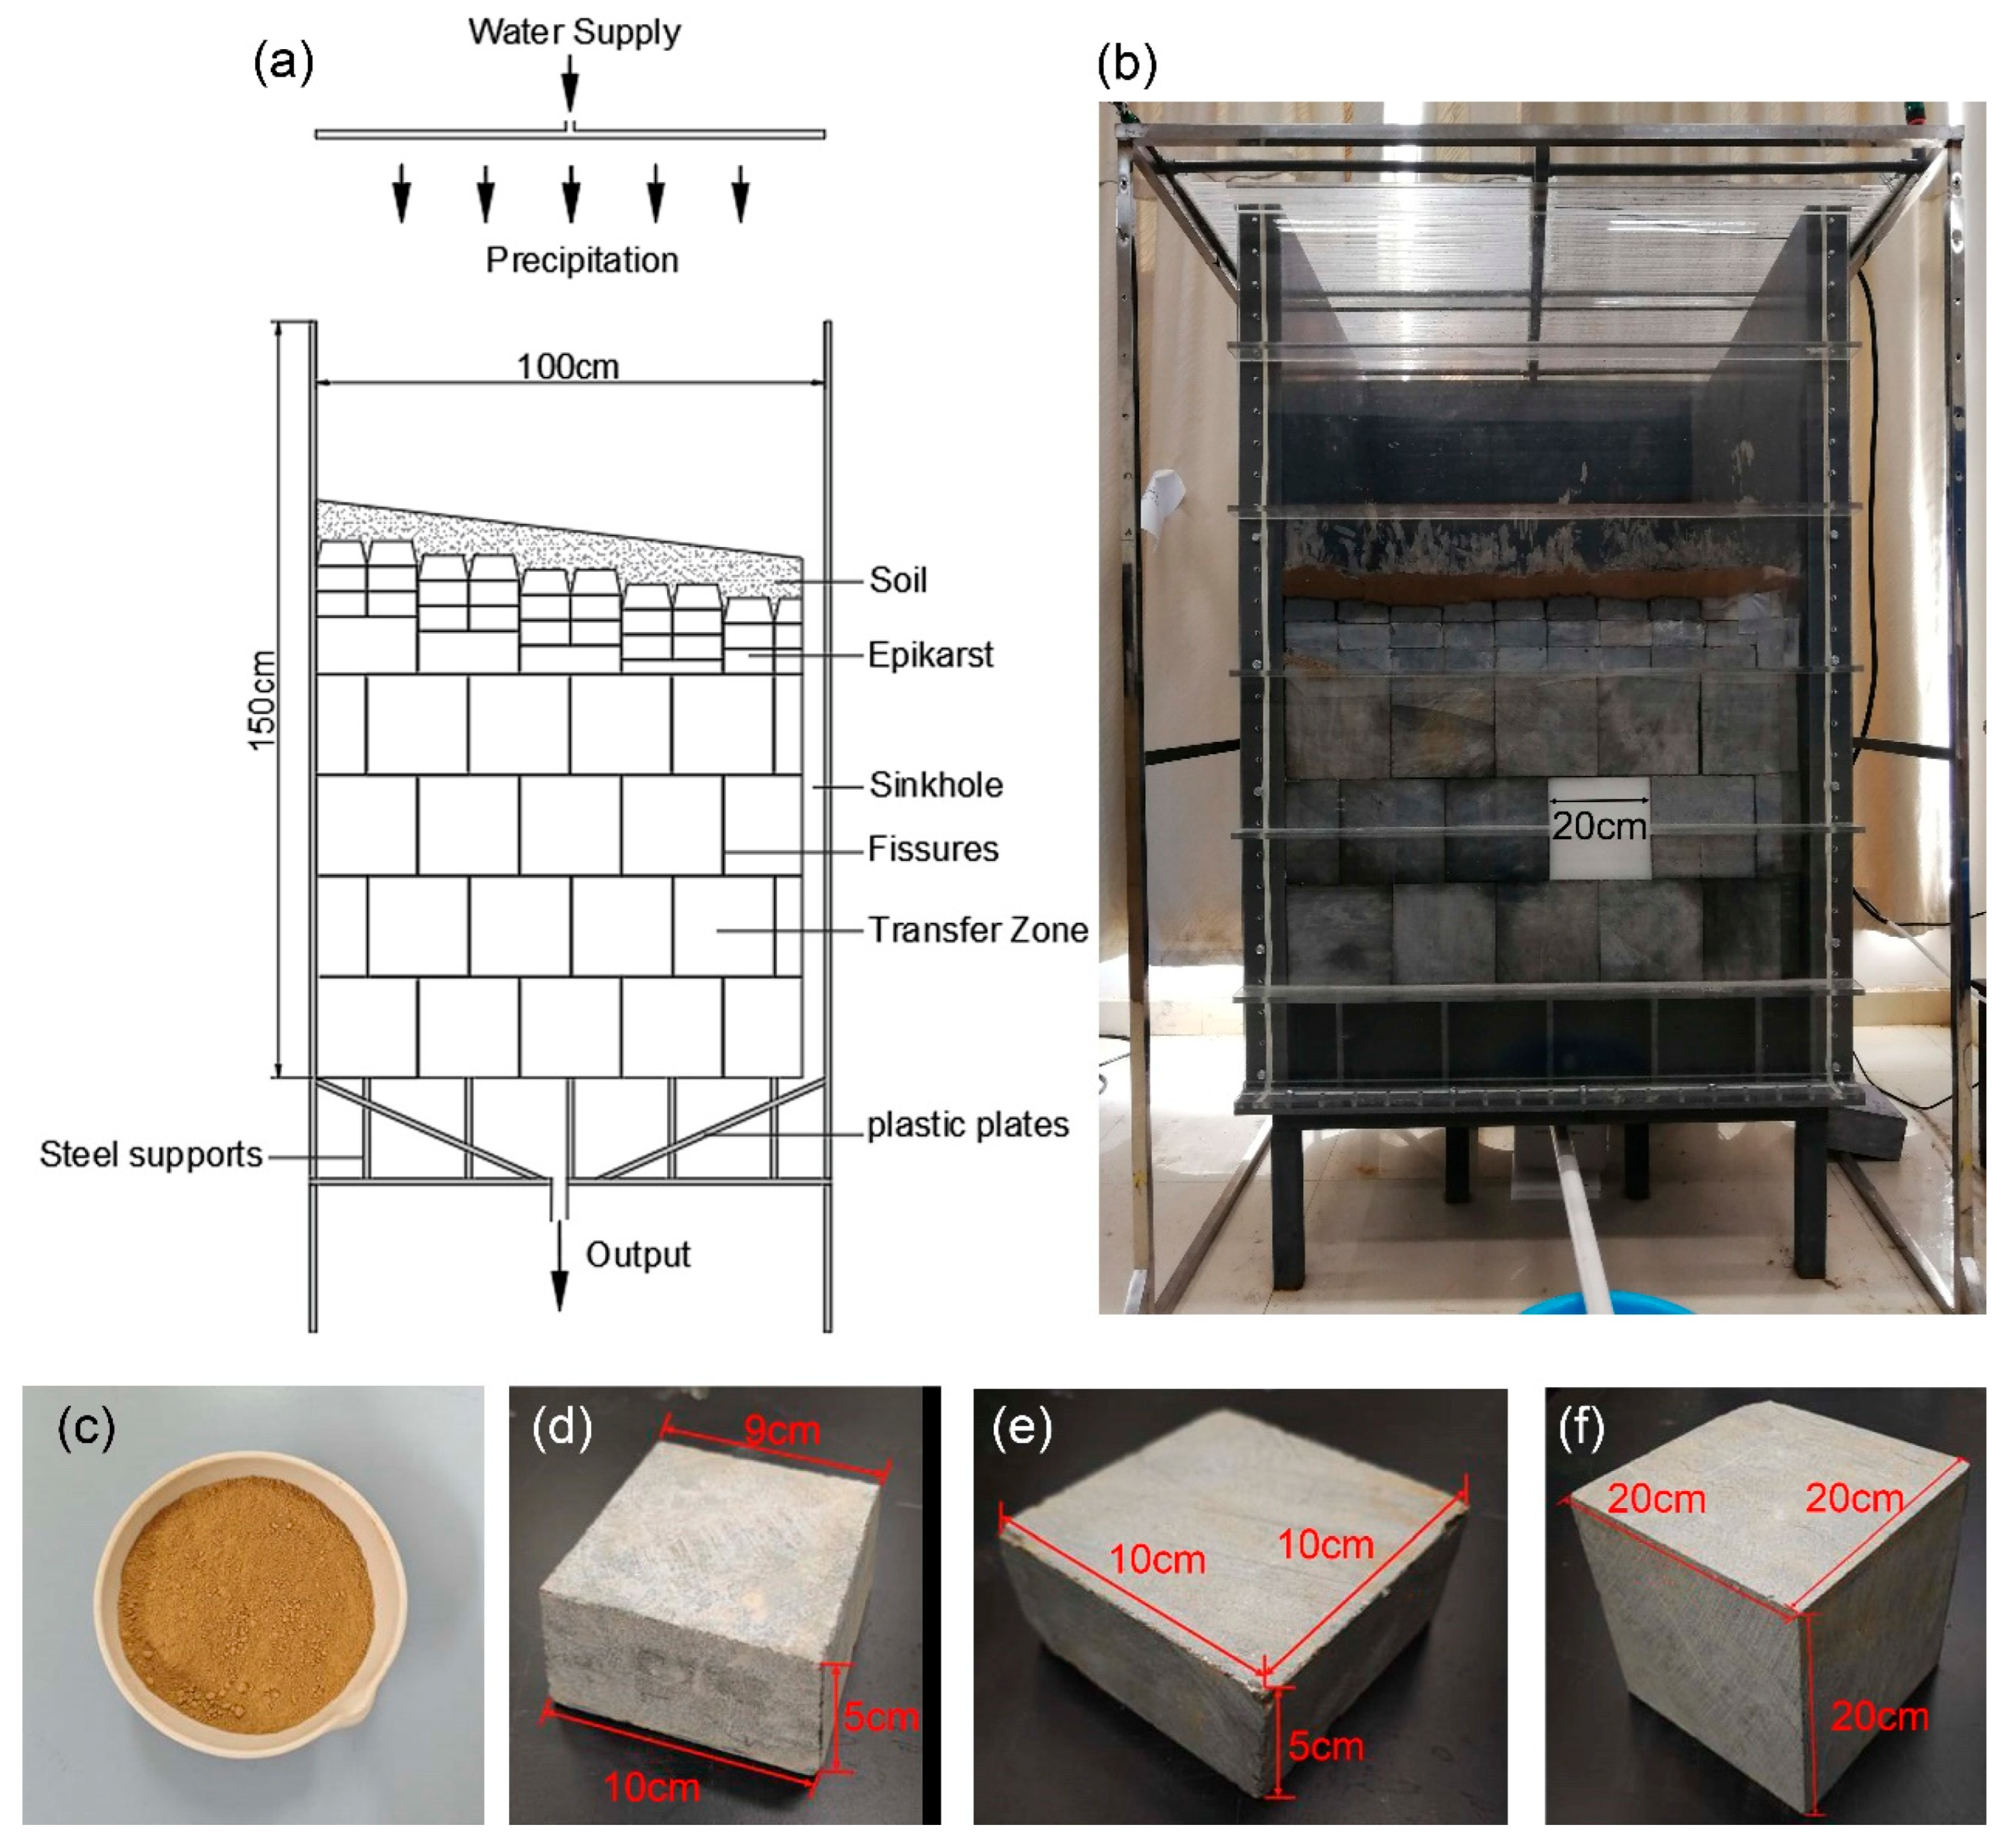
Figure 1. Experimental model. (a) schematic view, (b) photo, (c) experimental soil, (d) surface epikarst rock block, (e) epikarst rock block, (f) transfer zone rock block (after Liu et al. [37]).
Water 17 02976 g001
Figure 2. The distribution of fractures and their widths (ae) and classification of fast and slow flow systems in transfer zone (fj) under different karstification.
Water 17 02976 g002
Figure 3. Diagram of the fracture network model. (a) Boundary conditions, (b) division of the simulated areas, (c) mesh generation.
Water 17 02976 g003
Figure 4. Influences of factors on recession coefficient: (a) Transfer zone thickness, (b) Surface slope, (c) Karstification degree, (d) Rainfall intensity.
Water 17 02976 g004
Figure 5. Sensitivity analysis results of influencing factors on the recession coefficient.
Water 17 02976 g005
Figure 6. Influences of factors on regulating coefficient: (a) Transfer zone thickness, (b) Surface slope, (c) Karstification degree, (d) Rainfall intensity.
Water 17 02976 g006
Figure 7. Sensitivity analysis results of influencing factors on the regulating coefficient.
Water 17 02976 g007
Figure 8. Comparison of the measured and the simulated data (Experiment C1).
Water 17 02976 g008
Figure 9. Influence of transfer zone thickness on flux in fast and slow flow systems. (a) Water flux over time in fast and slow systems, (b) the percentage of water flux in the fast flow system and sinkhole.
Water 17 02976 g009
Figure 10. Influence of surface slope on flux in fast and slow flow systems. (a) Water flux over time in fast and slow systems, (b) the percentage of water flux in the fast flow system and sinkhole.
Water 17 02976 g010
Figure 11. Influence of karstification degree on flux in fast and slow flow systems. (a) Water flux over time in fast and slow systems, (b) the percentage of water flux in fast flow system and sinkhole.
Water 17 02976 g011
Figure 12. Influence of rainfall intensity on flux in fast and slow flow systems. (a) Water flux over time in fast and slow systems, (b) the percentage of water flux in fast flow system and sinkhole.
Water 17 02976 g012
Table 1. Experiment No. and condition setting.
Experimental FactorsNO.Transfer Zone Thickness (cm)Surface Slope (◦)Karstification DegreeRainfall Intensity (mm/h)
Transfer zone thicknessA1400220
A2600220
A3800220
A41000220
A51200220
Surface slopeB1800160
B2805160
B38010160
B48015160
B58020160
Karstification degreeC1800120
C2800220
C3800320
C4800420
C5800520
Rainfall intensityD1801525
D28015210
D38015220
D48015230
D58015250
Table 2. Value of parameters used in the numerical model.
ParametersDescriptionUnitsValueType *
Soil layerKs_soilSaturated hydraulic conductivitym s−10.0054fixed
θs_soilVolumetric saturated water content-0.61fixed
θr_soilVolumetric residual water content-0.1fitting
α_soilParameter of VG modelm−17.5a
n_soilParameter of VG model-1.89a
l_soilParameter of VG model-0.5b
EpikarstK_epiSaturated hydraulic conductivitym s−10.08fixed
θs_epiVolumetric saturated water content-0.15fitting
θr_epiVolumetric residual water content-0.015fitting
Slow flow systemK_slowSaturated hydraulic conductivitym s−10.03fixed
θs_slowVolumetric saturated water content-0.2fitting
θr_slowVolumetric residual water content-0.02fitting
Fast flow systemK_fastSaturated hydraulic conductivitym s−10.83fixed
θs_fastVolumetric saturated water content-0.1fitting
θr_fastVolumetric residual water content-0.01fitting
Other parametersα_fastParameter of VG model for epikarst, slow flow system, and fast flow systemm−19fitting
n_fastParameter of VG model for epikarst, slow flow system, and fast flow system-2fitting
l_fastParameter of VG model for epikarst, slow flow system, and fast flow system-0.5b
Note: * The type identifiers a and b represent references from Carsel and Parrish (1988) [67] and Mualem (1976) [68], respectively. The fixed parameters are determined based on experiment. The fitting parameters are calibrated by trial-and-error method.
Table 3. Evaluation of numerical model fitting results.
NO.NSENO.NSENO.NSENO.NSE
A10.883B10.879C10.879D10.719
A20.883B20.802C20.855D20.744
A30.855B30.848C30.848D30.855
A40.872B40.852C40.821D40.901
A50.876B50.861C50.833D50.913
Disclaimer/Publisher’s Note: The statements, opinions and data contained in all publications are solely those of the individual author(s) and contributor(s) and not of MDPI and/or the editor(s). MDPI and/or the editor(s) disclaim responsibility for any injury to people or property resulting from any ideas, methods, instructions or products referred to in the content.