Article

Water and Salt Transport and Balance in Saline Soils Under Different Land Use Types in the Seasonally Frozen Zone of Songnen Plain

1
Key Laboratory of Groundwater Resources and Environment, Ministry of Education, Jilin University, Changchun 130021, China
2
Jilin Provincial Key Laboratory of Water Resources and Environment, Jilin University, Changchun 130021, China
*
Author to whom correspondence should be addressed.
Water 2025, 17(20), 2974; https://doi.org/10.3390/w17202974
Submission received: 29 August 2025 / Revised: 3 October 2025 / Accepted: 9 October 2025 / Published: 15 October 2025
(This article belongs to the Section Soil and Water)

Abstract

To investigate differences in water and salt transport during irrigation, freezing, and thawing periods in typical saline-affected paddy fields and saline-affected upland fields, field-based automated in situ monitoring was conducted in both types of saline-affected farmland (May 2023 to May 2024). Correlation analysis identified seasonal drivers of water–salt migration, while the HYDRUS-3D model simulated transport and equilibrium processes. The HYDRUS-3D model, equipped with a freeze–thaw module, accurately simulated complex water–salt transport in cold arid regions. Key findings include: (1) During freeze–thaw periods, soil moisture content and electrical conductivity (Ec) increased with the retreating frost front in both upland and paddy soils. During the irrigation period, maximum soil moisture content and Ec values occurred at 80 cm depth in dryland soils and 60 cm depth in paddy soils, primarily influenced by irrigation and capillary rise. (2) Groundwater salt ions significantly affected soil salinization in both farmland types. During the freeze–thaw period, Ec positively correlated with soil temperature. During the irrigation period, Ec positively correlated with evapotranspiration and negatively correlated with precipitation. (3) Salt changes during the irrigation, freezing, and thawing periods were −565.4, 326.85, and 376.55 kg/ha for upland fields, respectively; corresponding changes for paddy fields were −1217.0, 280.07, and 299.35 kg/ha. (4) Both land types exhibited reduced salinity during the irrigation period, with paddy fields showing a reduction 3.36 times greater than dryland fields. During the freezing and thawing periods, both land types experienced salinity accumulation, with dryland fields accumulating higher salinity levels than paddy fields. These results indicate that paddy field irrigation and drainage systems help mitigate salinization, while dryland fields are more prone to springtime salt accumulation. These findings provide a basis for developing targeted management strategies for saline–alkali soils.

1. Introduction

Soil salinization, as a global ecological and environmental issue, poses a serious threat to food security and ecological balance. The global area affected by salinization has reached 9.5 × 10⁸ hectares, accounting for approximately 18% of arable land, with saline soils primarily distributed in arid, semiarid regions, and coastal areas. Additionally, the global area of land affected by salinization is growing steadily at a rate of 10% annually, and it is projected that by 2050, it will affect half of the world’s farmland. In China, the total area of saline–alkali soil is approximately 3.6 × 10⁷ hectares, accounting for 4.9% of the country’s total arable land area, with a significant concentration in the Songnen Plain of the northeast region [1,2]. The root cause of soil salinization is the water–salt balance issue, with water–salt dynamic changes being the external manifestation of this balance. Water balance determines salt balance [3]. Therefore, the water–salt balance and its movement patterns form the theoretical foundation for improving soil salinization and preventing secondary soil salinization, and also serve as the primary basis for agricultural and ecological environmental protection, as well as land reclamation in arid and semiarid regions.
Continuous monitoring of soil water–salt dynamics in farmland is often challenging, and it is difficult to systematically characterize the continuous dynamics of soil water–salt changes over time. Numerical simulation methods provide an effective approach for continuously analyzing the dynamic changes of soil water–salt. Currently, the numerical models mainly used to simulate soil water–salt transport include HYDRUS, SWAP, and SHAW [4,5,6,7,8,9,10,11]. Among them, the HYDRUS model is widely applied in studying the dynamic processes of water and salt in unsaturated porous media in farmland soil. This series of models includes HYDRUS-1D and HYDRUS-2D/3D. The HYDRUS-1D model was first developed in 1998 by the US Salinity Laboratory, the US Department of Agriculture, and the Agricultural Research Service. To mitigate soil salinization and alleviate the harm caused by excessive salt to crops, numerous scholars have used the HYDRUS-1D model to simulate and verify the water–salt transport patterns under soil salt leaching conditions during crop growth periods. It was found that combined irrigation and drainage, subsurface drainage, and open trench drainage can all achieve desalination effects in saline soil [12,13,14,15,16,17]. With in-depth research on soil water–salt transport patterns, the study of water–salt transport patterns in saline soil under freezing and thawing conditions in cold and arid regions has become a hot and difficult topic in academia. Hansson introduced a freezing and thawing module into HYDRUS-1D, comparing the normal module of the HYDRUS-1D model with a frozen module coupled with permafrost processes. The results showed that considering the freezing module significantly improved the simulation results of water under frozen soil conditions [18]. After continuous improvements, Simunek et al. developed the Hydrus-2D/3D model in 2006, which can be used to simulate water and salt transport, heat transfer, and root water absorption patterns in soil under different irrigation methods in two-dimensional and three-dimensional spaces. Compared to one-dimensional and two-dimensional numerical models, HYDRUS-3D has advantages such as more realistic spatial distribution, consideration of three-dimensional flow and transport, adaptation to complex boundary conditions, high model accuracy, and ease of visualization, gradually gaining favor among scholars both domestically and internationally [19].
Water–salt balance calculation is an important means for macroscopically describing the development direction of farmland soil salinization. In 1930, American soil scientist Sofield first proposed the concept of water–salt balance, referring to the relationship between the amount of soluble salts entering the irrigation area and the amount of salts discharged through drainage as salt balance. Traditional methods often involve specifying the various recharge and discharge items in the water–salt balance calculation formula and listing the soil water–salt balance equation accordingly. Existing research focuses on analyzing the water–salt balance of single farmland types in typical arid areas such as the Hetao Irrigation District, Xinjiang, and Inner Mongolia during the irrigation period. However, in the typical seasonal permafrost region of the Songnen Plain in Northeast China, the freezing and thawing processes play a significant role in redistributing soil water and salt migration, significantly affecting soil water–salt balance. There is relatively little research considering water–salt balance calculations under different farmland types throughout the entire season (irrigation period, freezing period, and thawing period) [20,21,22]. In addition, traditional water–salt balance calculations rely on the combined use of tensiometers and Darcy’s law to obtain boundary fluxes, while obtaining actual measurement data during the freezing and thawing period is costly and prone to significant errors. Using the HYDRUS model to simulate water and salt fluxes at the lower boundary of the root zone can reduce the cost of field monitoring during the freezing and thawing period [23].
The Songnen Plain is one of the world’s three major concentrated distribution areas of soda saline–alkali soil. Its formation is influenced by factors such as an arid/semiarid climate, enclosed low-lying topography, and a sodium-rich parent material. The inherently high sodium content in the parent material serves as a fundamental driver of soil alkalization, as it directly promotes the accumulation of exchangeable sodium ions (Na+) in the soil colloids, leading to the deterioration of soil physical and chemical properties. In addition, this area is a typical seasonal frozen soil region, where the widespread phenomenon of freezing in winter and thawing in spring causes soil salt to accumulate in the shallow surface layer, leading to secondary salinization issues [24]. Da’an City, located in the hinterland of the Songnen Plain, is one of the counties with the highest degree of soil salinization. With a total cultivated land area of approximately 186,000 hectares, it is an important grain-producing area in western Jilin Province. Dry land and paddy fields are the main types of cultivated land in this area. Among these, dry fields employ drip irrigation under plastic mulch during the irrigation period. While water-efficient, this method lacks a leaching mechanism to remove accumulated salts, leading to salt buildup in the tillage layer. Paddy fields primarily employ conventional irrigation following a “shallow–deep–shallow” pattern: shallow water for transplanting and regreening, maintaining moisture during early tillering, deep watering from late tillering to heading/flowering to meet peak rice water demand, shallow irrigation during grain filling and milk ripening, as rice water demand decreases. Fields are kept moist during grain filling, irrigation ceases at harvest, and fields are drained to facilitate harvesting. Currently, irrigation water sources for paddy fields in the irrigation district include channel diversion and groundwater extraction, with channel diversion being the primary method [25,26]. In recent years, the construction of medium and large-scale water conservancy projects such as the Qianguo, Songyuan, and Da’an irrigation areas has developed previously saline–alkali wasteland into paddy fields, using irrigation, drainage, and salt leaching methods to manage soil salinization. This paper takes Da’an City in Jilin Province as an example, selects different types of farmland (dry land and paddy fields) as research objects, and based on long-term field monitoring data during the irrigation, freezing, and thawing periods, precisely depicts the dynamic characteristics of water, heat, and salt. It uses correlation analysis to clarify the driving factors of soil salinization in different farmland types and periods. Based on the Hydrus-3D model, it simulates the laws of water and salt transport and calculates water and salt balance, exploring the characteristics of soil water and salt transport throughout the entire season and process in typical farmland saline soil. This provides a quantitative basis for the zoned management of saline soil in cold regions and irrigation area planning, helping Jilin Province to promote the implementation of the “100 million kilograms of grain” strategy [27].

2. Materials and Methods

2.1. Study Area Overview

This study selected Da’an City, Jilin Province, as the study area, whose geographical location is shown in Figure 1. Da’an City is under the jurisdiction of Baicheng City, Jilin Province, located in the northwestern part of Jilin Province, in the heart of the Songnen Plain, with geographical coordinates of 123°08′45″–124°21′56″ E, 44°57′00″–45°45′51″ N. The Quaternary river and lake sediments in the western part of the Songnen Plain are rich in sodium-bearing minerals. The closed, low-lying topography formed by tectonic movements during geological history obstructs surface water and groundwater runoff, preventing salt from being effectively drained, thereby creating a natural salt-rich area. Additionally, Da’an City has a temperate arid–semiarid continental monsoon climate, with an annual average precipitation of 413.7 mm and a long-term average evaporation rate of 1757 mm. Precipitation is primarily concentrated between June and September, and the maximum evaporation rate in spring exceeds three times the precipitation rate, resulting in prominent soil salinization issues during spring. Furthermore, the region is a seasonal permafrost zone with a long freeze–thaw cycle lasting more than 150 days. Soil freezing begins in early November each year, with a maximum permafrost depth of 1.7 m, and thawing typically occurs between late March and early April [28]. During the freezing period, permafrost continues to develop, and unfrozen water in the soil carries salts upward, accumulating in the permafrost layer. During the thawing period, as the frozen soil begins to melt, the frozen layer within the soil profile obstructs the downward infiltration of water and salts from the thawed upper soil layers before the frozen layer is completely thawed. At this point, surface evaporation causes salts to accumulate in the upper layers, leading to secondary soil salinization.
Da’an City in Jilin Province is the core agricultural area and an important commodity grain base in the western part of the Songnen Plain [29]. The total arable land area of Da’an City is approximately 186,000 hectares, with the main land use types including dry fields (corn), paddy fields (rice), and saline–alkali wasteland. Dry fields are concentrated in the western and northern townships of Da’an City, where drip irrigation under plastic film is widely adopted. However, the lack of drainage channels for salt accumulation leads to salt accumulation. Paddy fields are concentrated in low-lying areas, relying on water sources such as the Nenjiang River and Tao’er River, and employ a combined irrigation and drainage system to achieve salt leaching. The construction of the Da’an Irrigation District is a core project for the comprehensive management of saline–alkali land and agricultural development, covering an irrigation area of 134,300 mu. It involves transforming saline–alkali land, wasteland, and other low-yield fields into high-yield paddy fields. The first phase of the Da’an Irrigation District developed 540,000 mu of paddy fields, while the Longhai Irrigation Area added 435,000 mu of paddy fields. The unique climate conditions and human irrigation activities have created dual threats to the saline–alkali soils in the Daan Irrigation District. Therefore, research is being conducted on the water and salt transport and balance of saline–alkali soils under different farmland types (dry fields, paddy fields) throughout the entire season (irrigation period, freezing period, thawing period).

2.2. Data Collection

Long-term monitoring was conducted in Da’an City by selecting two farmland types: saline–alkali dry land and saline–alkali paddy field (Figure 1). At each monitoring site, soil automatic sensors (Model 5TE, METER Group, Inc., Pullman, WA, USA) were installed at depth profiles of 20, 40, 60, 80, and 100 cm. In the dry land, the sensor profile was positioned directly beneath a dripper. In the paddy field, which was managed under a “shallow–wet–deep” irrigation regime, the sensors were installed vertically within the inter-row space of the rice plants. Soil water content, electrical conductivity, and temperature were measured using the 5TE sensors, with data stored and recorded by EM50 data loggers. The monitoring period spanned from May 2023 to May 2024, and the collected data were used for subsequent model calibration and validation.
At the beginning of the observation period, a 1 m soil profile was excavated at the sensor installation locations in both dry land and paddy fields. Three undisturbed soil samples were collected near the sensors at each depth for both farmland types, resulting in a total of 30 soil samples. Basic physical and chemical properties of the soil samples were analyzed in the laboratory, including soil dry bulk density, soil particle-size distribution, soil water content (SWC), soil electrical conductivity (Ec), and soil pH. Dry bulk density was determined using the cutting ring method, particle-size distribution was measured by laser diffraction, soil water content was obtained via the oven-drying method, and soil Ec was measured using a conductivity meter (Model DDS-11A, Shanghai INESA Scientific Instrument Co., Ltd, Shanghai, China) after preparing saturated paste extracts from air-dried and sieved (2 mm) soil samples with deionized water. Soil pH was determined using the extraction method. The average value of three replicate samples from the same depth was taken as the representative value for each soil property, as shown in Table 1 and Table 2. The pH of paddy fields ranged from 8.3 to 8.5, while that of dryland fields ranged from 7.5 to 8.0, indicating higher alkalinity in paddy fields. Additionally, soil samples were sent to the Northeast Institute of Geography and Agroecology, Chinese Academy of Sciences, for analysis of CO32−, HCO3, Cl, SO42−, Na+, Mg2+, K+, Ca2+, SAR, and organic matter. The results are presented in Table 3. The soil type was identified as soda saline–alkali soil. The total salt content (sum of the eight major ions) in dryland fields ranged between 0.1% and 0.3%, indicating mild salinization, while that in paddy fields exceeded 0.6%, indicating severe salinization. In terms of the sodium adsorption ratio (SAR), dryland fields exhibited values between 8 and 16, whereas paddy fields showed values between 45 and 95. Both farmland types displayed significant sodicity, with severe soil alkalinization, which was more pronounced in paddy fields than in dryland fields.
To convert the apparent electrical conductivity (Eca) measured by field automatic sensors into the agronomically standard saturated paste electrical conductivity (Ec), linear regression analysis was conducted using concurrently measured Eca and Ec data from the initial observation period for both dry land and paddy fields. Two linear calibration equations were established (dry land: Ec = 2.34 × Eca, R2 = 0.87; paddy field: Ec = 3.18 × Eca, R2 = 0.89). These equations were subsequently applied to convert the respective long-term in situ Eca datasets into Ec values, estimating soluble salt content in soil using the empirical formula SC = 0.64 × Ec, where Ec represents the electrical conductivity of saturated paste extract (mS/cm), SC denotes soluble salt content in soil (g/kg), 0.64 is the conversion factor, Ss = Ec × Dq × BD × 640 where Dq is the soil layer depth (m), BD is the bulk density of the soil (kg/m3), and 640 is the standard conversion factor.
Meteorological data, including precipitation, evaporation, air temperature, and soil temperature, were obtained from the China Meteorological Science Data Sharing Service (http://data.cma.cn/, accessed on 20 May 2024). Groundwater quality data were collected and analyzed by the research group between 2023 and 2024, with sampling conducted in May 2023, November 2023, and March 2024. The analyzed ions included HCO3, Cl, Na+, Ca2+, and Mg2+. Different irrigation regimes were implemented in the dry land and paddy fields. In the paddy fields, a shallow–deep–shallow flooding pattern was maintained during the rice growing season, with standing water preserved at critical growth stages. Irrigation was applied four times, with a total amount of 610 m3 per mu. In contrast, the dryland fields primarily received supplemental drip irrigation during crop water-sensitive periods, totaling three irrigation events and approximately 180 m3 per mu. The irrigation water for paddy fields was sourced from canals, while groundwater from local wells was used for dryland irrigation. In April 2023, eight water samples were collected from adjacent canals and five groundwater samples from wells near the dryland fields. These samples were analyzed for Ec, Na+, HCO3, and Cl at the Northeast Institute of Geography and Agroecology, Chinese Academy of Sciences. The average values of these measurements are presented in Table 4.

2.3. HYDRUS-3D Model Principles

2.3.1. Model Equations

Soil Water Transport Equation
The HYDRUS-3D model is a three-dimensional finite element model that simulates soil water–salt–heat transport. In the model, various boundary conditions, irregular boundaries, and soil heterogeneity can be simulated. During the irrigation period, the Richards equation is used to describe the water transport process, and the Van Genuchten model is adopted for soil hydraulic properties [30,31].
θ t = x K ( h ) h x + y K ( h ) h y + z K ( h ) h z + K ( h ) z S ( h )
In the equation, θ represents soil volumetric water content (cm3/cm3); h represents soil negative pressure (cm); t is the water movement time (min); x, y, and z are the spatial geographic coordinates in the three-dimensional model (cm); k(h) is the unsaturated hydraulic conductivity of the soil (cm/min); S(h) represents the root water uptake term. The soil hydraulic parameters and moisture characteristic curve parameters required for model calculations are all expressed using the VG equation.
θ ( h ) = θ r + ( θ s θ r ) ( 1 + α h n ) m   h < 0 θ s h 0
K ( h ) = K s s e l 1 ( 1 s e l / m ) m 2   h < 0 K s     h 0
S e = θ θ r θ s θ r
In the equation, θr is the residual moisture content of the soil; θs is the saturated moisture content of the soil; Se is the effective moisture content of the soil; α is the reciprocal of the intake suction force (cm−1); l, m, and n are empirical parameters, with m = 1 − 1/n.
During the freeze–thaw period, considering water phase change and heat transfer, the Hydrus-3D freeze–thaw module was introduced to simulate soil water movement, without considering the presence of gaseous water. The modified Richards equation is shown below [32,33]:
θ u t + ρ i ρ w θ i t =   x K L h h x + y K L h h y + z K L h h z + x K L T T x + y K L T T y + z K L T T z + z K L h g S ( h )
( C p T ) t L f ρ i θ i t = x λ T x + y λ T y + z λ T z C w x ( q l , x T ) + y ( q l , y T ) + z ( q l , z T ) C w S T
In the equation, θu (cm3/cm3) represents the volume fraction of unfrozen water (equal to the volume of liquid water), θi (cm3/cm3) represents the ice content, ρi and ρw represent the densities of ice and liquid water, respectively. KLh (cm/s) denotes the hydraulic conductivity of liquid water. KLT is the temperature gradient conductivity coefficient of liquid water (cm2/(s*K)), g is the gravitational acceleration vector, t is time, z is soil depth, h is the pressure head, CP is the volumetric heat capacity of soil, Lf is the latent heat of phase change of water, T is temperature, λ is the thermal conductivity of soil, ql,x, ql,y, and ql,z are the velocity vectors of liquid water flow in the x, y, and z directions, respectively.
Soil Heat Transport Equation
The governing equation for energy transport in variably saturated rigid porous media is expressed by the following conduction–convection heat flow equation:
C t h T t = x ( λ t h , x T x ) + y ( λ t h , y T y ) + z ( λ t h , z T x ) ( c w ρ w q x T x + c w ρ w q y T y + c w ρ w q z T z ) + L f ρ i θ i t
In the equation, T is soil temperature (°C); t is time; Cth is soil volumetric heat capacity (J·m−3·K−1); λth,x/y/z are thermal conductivities in the x, y, and z directions (W·m−1·K−1); cw is the specific heat capacity of liquid water (J·kg−1·K−1); ρw is the density of liquid water (kg/m3); ρi is the density of ice (kg/m3); qx/y/z is the Darcy velocity in the x, y, and z directions (m/s); and Lf is the latent heat of phase change (J/kg).
Soil Salinity Transport Equation
In the HYDRUS-3D model, the convection–dispersion equation is employed to describe the transport of salts within the soil profile. Soil electrical conductivity is used as a proxy indicator for salt concentration. Based on the theory of solute transport in porous media, a three-dimensional unsaturated solute transport model was formulated to simulate salt dynamics during the irrigation, freezing, and thawing periods, as follows:
( θ c ) t = x ( θ D xx c x ) + y ( θ D y y c y ) + z ( θ D z z c z ) ( θ μ x c ) x ( θ μ y c ) y ( θ μ z c ) z
In the equation, c is the solute concentration (mg/cm3); µx, µy, and µz are the water flux along the x, y, and z directions (cm min−1); Dxx, Dyy, and Dzz represent the components of the hydrodynamic dispersion coefficient along the x, y, and z directions (cm2 min−1).
Root Water Uptake Equation
The irrigation period represents the primary stage of crop growth, during which root water uptake is calculated using the Feddes model. The corresponding expression is as follows:
S ( h ) = α ( h ) b ( x , y , z ) T P L
In the equation, α(h) is the moisture and osmotic stress function; b(x, y, z) is the normalized root water uptake spatial distribution function; L is the maximum soil surface width in the root zone, cm; Tp is the potential transpiration rate, cm/d. During the freeze–thaw period, root water uptake stagnates S(h) = 0.

2.3.2. Model Initial and Boundary Conditions

Initial Conditions
Assuming uniform distributions of initial soil water content and salinity within the simulation domain, the initial conditions are defined as follows:
θ ( x , y , z , t ) = θ 0 ( x , y , z ) ( x 0 , y 0 , z 0 , t = 0 ) c ( x , y , z , t ) = c 0 ( x , y , z ) ( x 0 , y 0 , z 0 , t = 0 )
In the equation, θ0 is the initial soil water content (cm3/cm3); c0 is the initial salt concentration (mg/cm3).
Boundary Conditions
(1)
Upper Boundary Condition
During the irrigation period, the upper boundary for both water and solute transport is defined as a variable flux boundary. The corresponding expression is as follows:
θ ( t ) = θ s ,     t 0 D ( θ ) c x + c y + c z + q c = q s c s ( t ) ,   t 0
During the freeze–thaw period, the transport of water and salts to the upper boundary is considered an atmospheric boundary condition, with the relevant expression being:
D ( θ ) θ z + K ( θ ) = 0
D i j ω c z q i c = 0
D ( c / z ) + ε c z = 0 , c z = 0 < c m , t 0
(2)
Lower Boundary Condition
The groundwater table in the study area is located at a depth of 6–8 m; thus, the lower boundary is treated as a free drainage boundary. The water boundary condition is defined as θ0 = θin , ∂θ/∂z = 0, and the solute boundary condition is specified as c (x, y, z, t) == cb(t); z = 100 cm.
(3)
Other Boundary Surfaces
For all other boundaries, the model assumes zero water flux, which can be expressed as:
D ( θ ) θ x = 0 D ( θ ) c x = 0
In the equation, t is time (d); K is the unsaturated hydraulic conductivity (cm·d−1); D is the hydrodynamic dispersion coefficient (cm2·d−1); θ is the soil volumetric water content (cm3·cm−3); c is the soil salinity concentration (mg·cm−3).

2.3.3. Model Evaluation Criteria

In this study, selected soil water and salinity data were used for numerical simulation of soil water–salt dynamics. To evaluate the model’s accuracy, simulated results were compared against field measurements collected during the same period. The model performance was assessed using three statistical indicators: root mean square error (RMSE), normalized root mean square error (nRMSE), and the Willmott index of agreement (d). Lower RMSE and nRMSE values (approaching zero) indicate higher simulation accuracy [34]. A value of d = 1 denotes perfect agreement between measured and simulated values. The formulas for these evaluation metrics are as follows:
R M S E = i = 1 n ( X i Y i ) 2 n
n R M S E = R M S E X ¯
d = 1 i = 1 n X i Y i 2 / i = 1 n X i X ¯ + Y i Y ¯ 2
In the equation, Xi represents the observed value at the ith time interval; Yi denotes the corresponding simulated value, and n is the total number of samples; X and Y represent the mean values of Xi and Yi.

2.4. Soil Water–Salt Balance Equation

2.4.1. Soil Water Balance Equation

Two types of farmland—dry land and paddy fields—were selected for studying soil water balance calculations. Corn was planted in dry land, and rice was planted in paddy fields. Under different crop coverings, the soil vertical direction consists of surface water, soil water, and groundwater. Since corn roots are mainly concentrated in the 0–100 cm soil layer and rice roots reach a maximum depth of 60 cm, the 0–100 cm unsaturated zone was selected for calculating water balance. For dry land and paddy fields, the soil water balance equation is:
ΔW = P + I + B – Dv − ET
where P denotes precipitation (mm), I represents irrigation water input (mm), Dv is the drainage or surface runoff (mm), ET indicates evapotranspiration (mm), and B refers to the water flux at the lower boundary (mm). The change in soil water storage is denoted as ΔW, where ΔW > 0 indicates a surplus in soil moisture, ΔW = 0 suggests a balance between water inputs and outputs, and ΔW < 0 reflects a deficit in soil moisture status [35].
During the irrigation period, surface drainage in dryland fields is negligible (Dv = 0). Therefore, the soil water balance equation for dryland croplands can be simplified as follows:
ΔW = P + I + B − ET
During the freezing and thawing periods, neither irrigation nor drainage occurs in dry land or paddy fields; i.e., I = 0 and Dv = 0. Accordingly, the soil water balance equation for both dry land and paddy fields can be further simplified as follows:
ΔW = P + B − ET

2.4.2. Soil Salt Balance Equation

Two types of farmland, dry fields and paddy fields, were selected for the study of soil salt balance calculations. The salt concentration in precipitation is relatively low, and the amount of salt brought in by rainfall can be neglected. The salt balance equation is generally expressed as follows:
ΔS = Si + Sb − Sd
where Si denotes the amount of salt introduced through irrigation water (kg/hm2), Sd represents the amount of salt removed via surface drainage, and Sb is the salt flux across the lower boundary. ΔS refers to the change in the cumulative soil salt storage (kg/hm2). A positive ΔSS > 0) indicates salt accumulation in the soil; ΔS = 0 suggests a balance between salt input and output; and ΔS < 0 indicates a net salt loss; i.e., desalinization of the soil [36,37].
During the irrigation period, there is no surface drainage in dryland fields (Sd = 0). Therefore, the soil salt balance equation for dryland croplands can be simplified as follows:
ΔS = Si + Sb
During the freezing and thawing periods, there is neither irrigation nor surface drainage in dry land or paddy fields; i.e., Si = 0 and Sd = 0. Therefore, the soil salt balance equation for both dry land and paddy fields can be simplified as follows:
ΔS = Sb

3. Results and Discussion

3.1. Dynamics of Soil Water, Heat, and Salinity Under Different Cropland Types

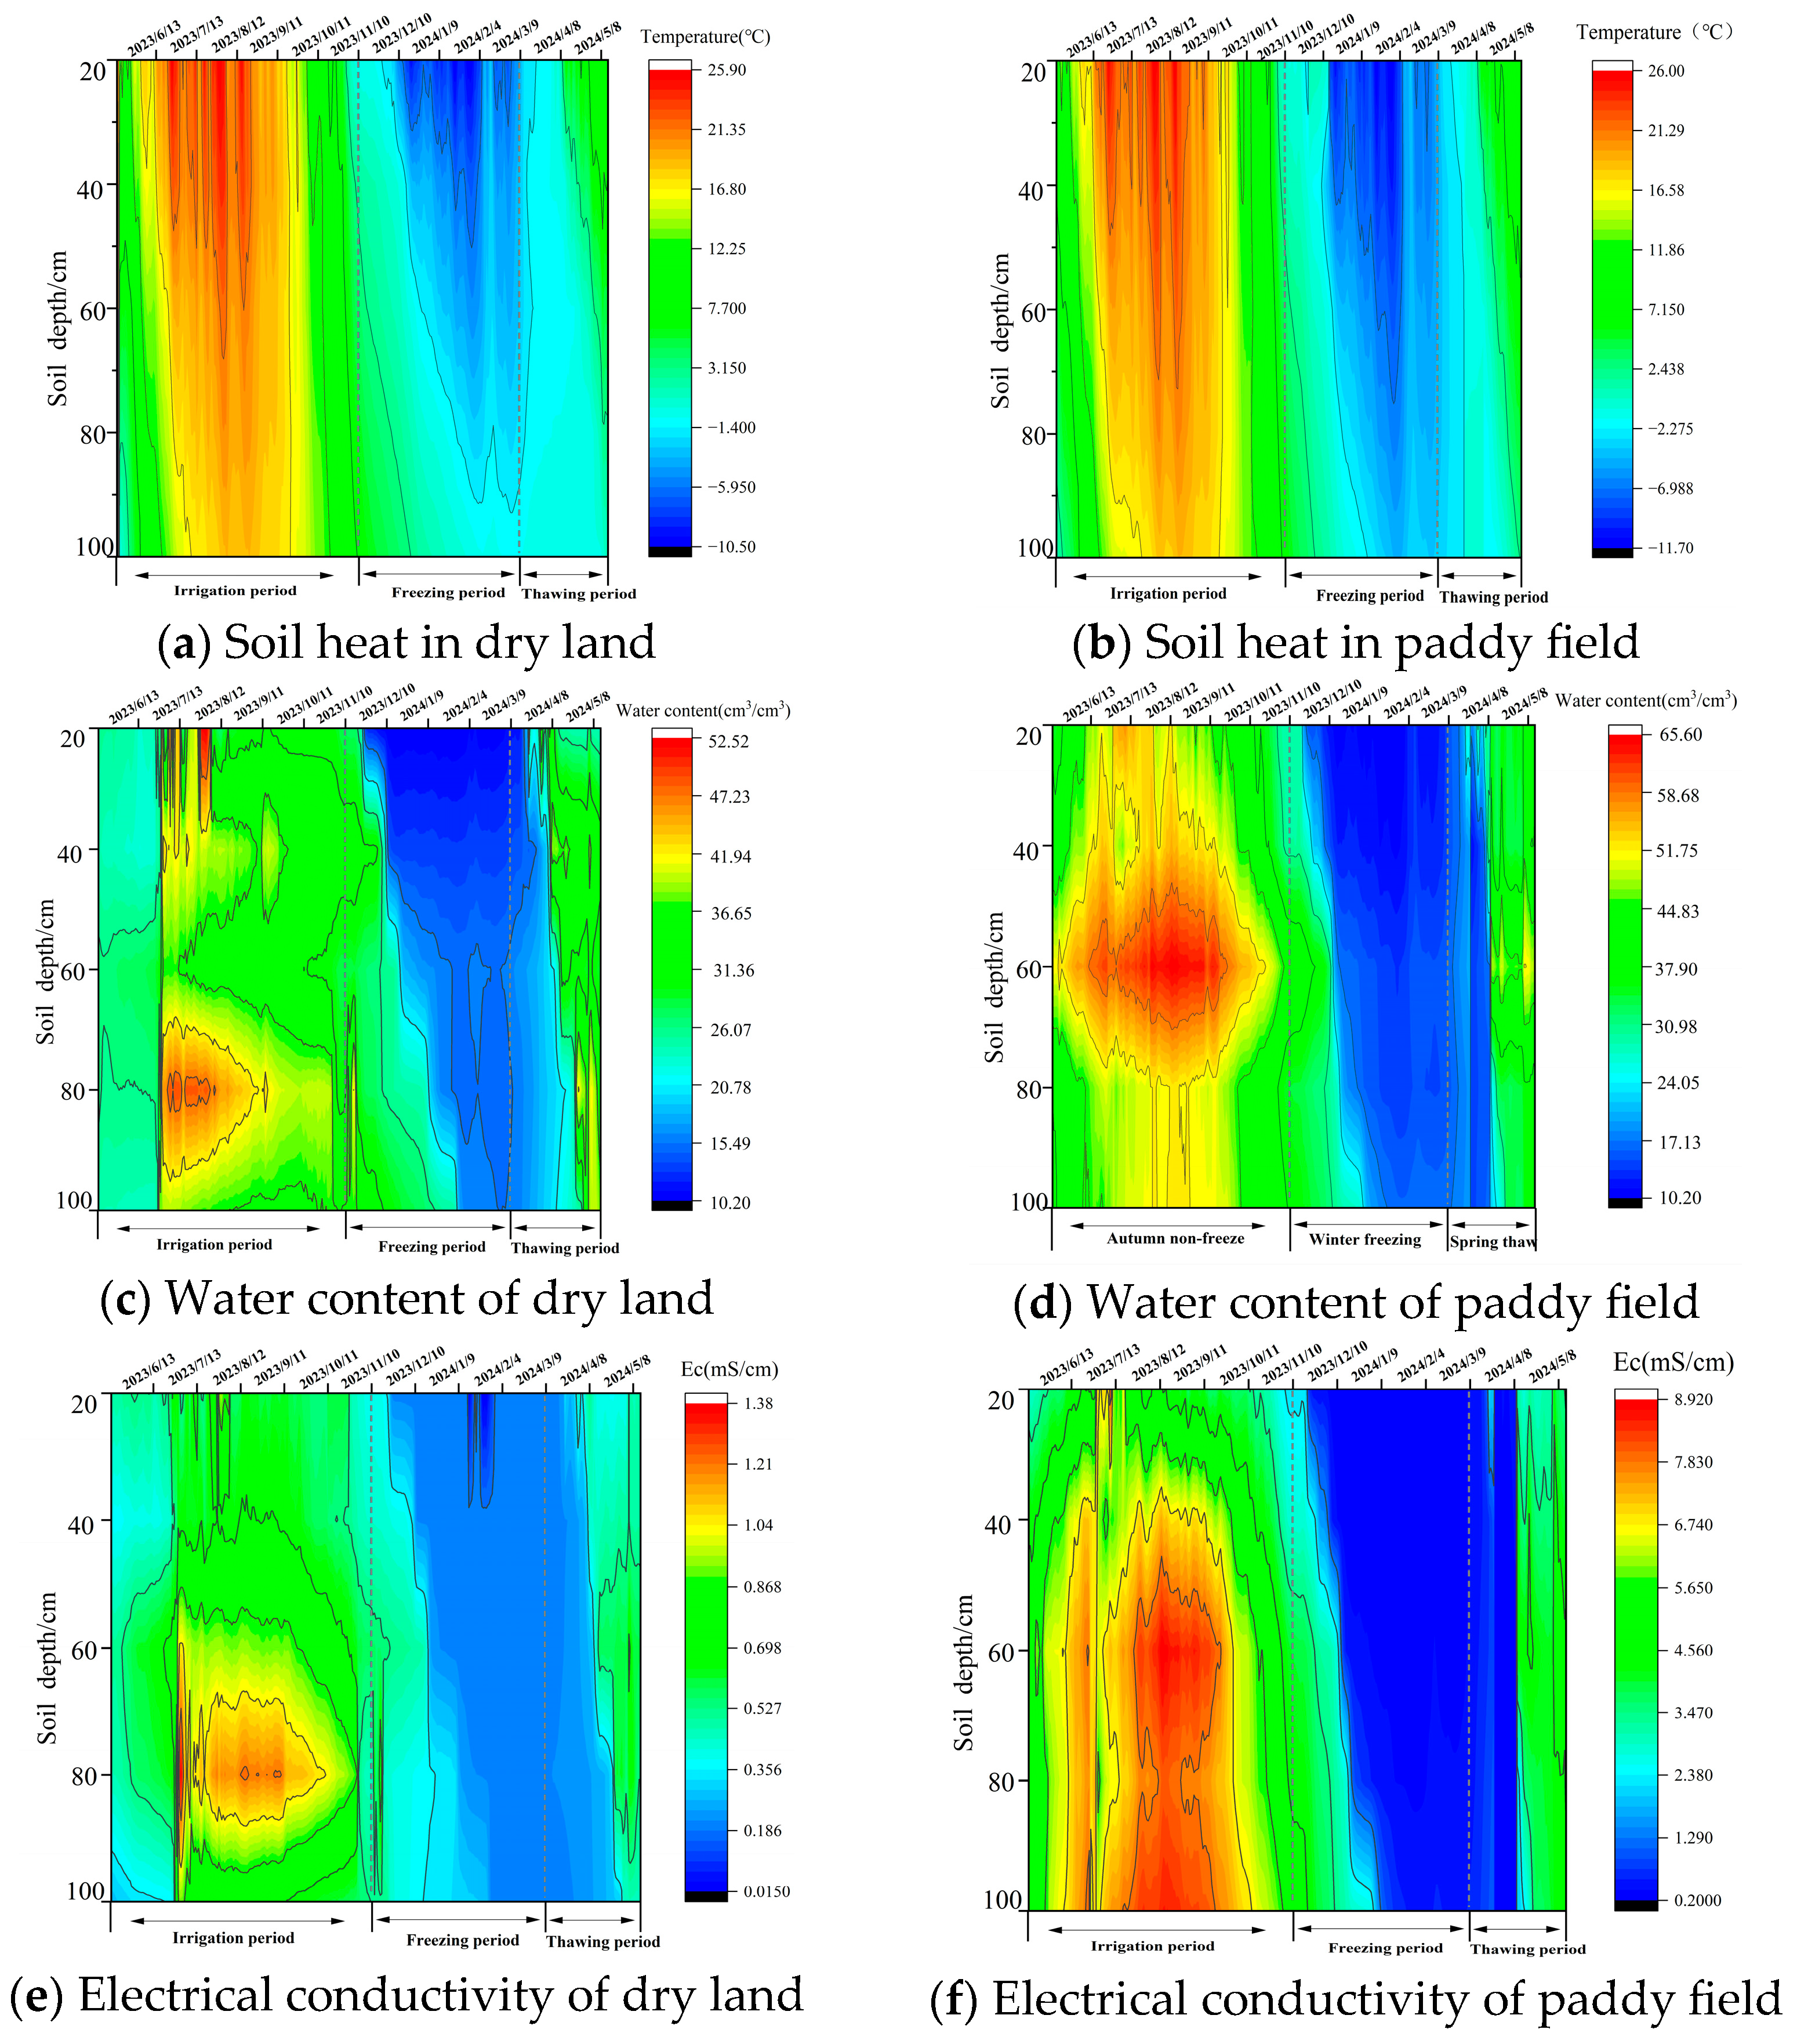
To clarify the dynamic changes and differences between dry land and paddy fields during different periods (irrigation period, freezing period, and thawing period), based on long-term field monitoring data from dry land and paddy fields from 15 May 2023 to 14 May 2024, using air temperature and soil temperature as indicators, the period from 15 May 2023 to 10 November 2023 was designated as the irrigation period, the period from 11 November 2023 to 9 March 2024 as the freezing period, and the period from 10 March 2023 to 14 May 2024 was designated as the thawing period. The meteorological conditions of the study area are shown in Figure 2. Soil temperature was used as an indicator of heat, and two-dimensional cloud maps of soil moisture, electrical conductivity, and heat were plotted, as shown in Figure 3.
For soil temperature indicators, during the irrigation period, as air temperatures gradually rose, soil temperatures in both dry fields and paddy fields also increased. The highest soil temperatures occurred in July and August, with surface temperatures reaching up to 24–26 °C. Along the vertical profile, soil temperatures decreased with increasing depth. From July to September, the regions with higher temperature values along the vertical profile were more prevalent in paddy fields than in dry fields. During the soil freezing period, as air temperatures gradually decreased; soil temperatures in both dry fields and paddy fields also decreased. The lowest soil temperatures occurred in January and February, with surface temperatures dropping as low as −10 °C. Soil temperatures decreased with increasing depth in the vertical profile, and during December to February, the regions with lower temperatures in the vertical profile were higher in paddy fields than in dry fields. During the thawing period, as air temperatures rose, soil temperatures in both dry fields and paddy fields reached around 0 °C, and the soil began to enter a stable thawing period. As temperatures continued to rise, soil temperatures also increased. The dynamic changes in dry fields and paddy fields during the irrigation period, freezing period, and thawing period exhibited high similarity. On a temporal scale, soil temperatures in both types of farmland followed an “increasing–decreasing–increasing” trend. On a vertical profile scale, soil temperatures in both types of farmland decreased gradually with increasing soil depth.
Regarding moisture content indicators, during the irrigation period, both dryland and paddy field soils exhibited significant vertical differentiation in moisture content. The peak moisture content in dryland soils occurred at a soil depth of 80 cm, while the peak moisture content in paddy field soils occurred at a soil depth of 60 cm. The dense root zone of corn forms a deep water absorption funnel, promoting water migration to deeper layers. Rice roots are primarily distributed at 0–60 cm, and under the combined influence of irrigation water and capillary action, water accumulates at the 60 cm soil layer. During the freezing period, when temperatures drop below 0 °C, the unfrozen water content in all soil layers of both dry fields and paddy fields decreases sharply, and the freezing front continues to move downward. The freezing depth in both paddy fields and dry fields reached 60 cm. The vertical profile of water content distribution in paddy fields was more uniform than in dry fields, and the rate of decrease in water content in paddy fields was significantly faster than in dry fields during this period. During the thawing period, as temperatures rose, snow melted, and the unfrozen water content in both dry fields and paddy fields gradually increased. Overall, on a temporal scale, the moisture content of both farmland types followed an “increase–decrease–increase” trend, with paddy fields exhibiting significantly higher moisture content than dryland fields.
For the electrical conductivity indicator, during the irrigation period, the vertical distribution of soil electrical conductivity exhibited similar vertical differentiation to soil moisture content. In upland fields, the conductivity peak occurred at a soil depth of 80 cm, while in paddy fields, the peak was located between 60 and 100 cm. This phenomenon likely arose because increased water content dissolved salts that were previously crystallized or bound, enhancing ionic conductivity and causing a rapid rise in conductivity. Under irrigation, conductivity in both paddy and upland soils migrates toward deeper layers with water movement. However, paddy fields employ combined irrigation and drainage, while upland fields use drip irrigation with lower water volumes. Consequently, paddy fields exhibited downward salt migration and greater concentration in deeper layers. During the freezing period, conductivity values rapidly decreased in both farmland types. This phenomenon likely stemmed from reduced ion activity due to water scarcity, with paddy fields exhibiting a significantly faster decline than upland fields. During the thawing period, as temperatures rose, frozen soil water gradually melted, releasing salts and causing conductivity values to gradually increase. On a temporal scale, both farmland types exhibited an “increase–decrease–increase” trend in electrical conductivity. Overall, paddy fields demonstrated significantly higher conductivity than upland fields throughout the entire period.

3.2. Correlation of Soil Water and Salinity by Cropland Type

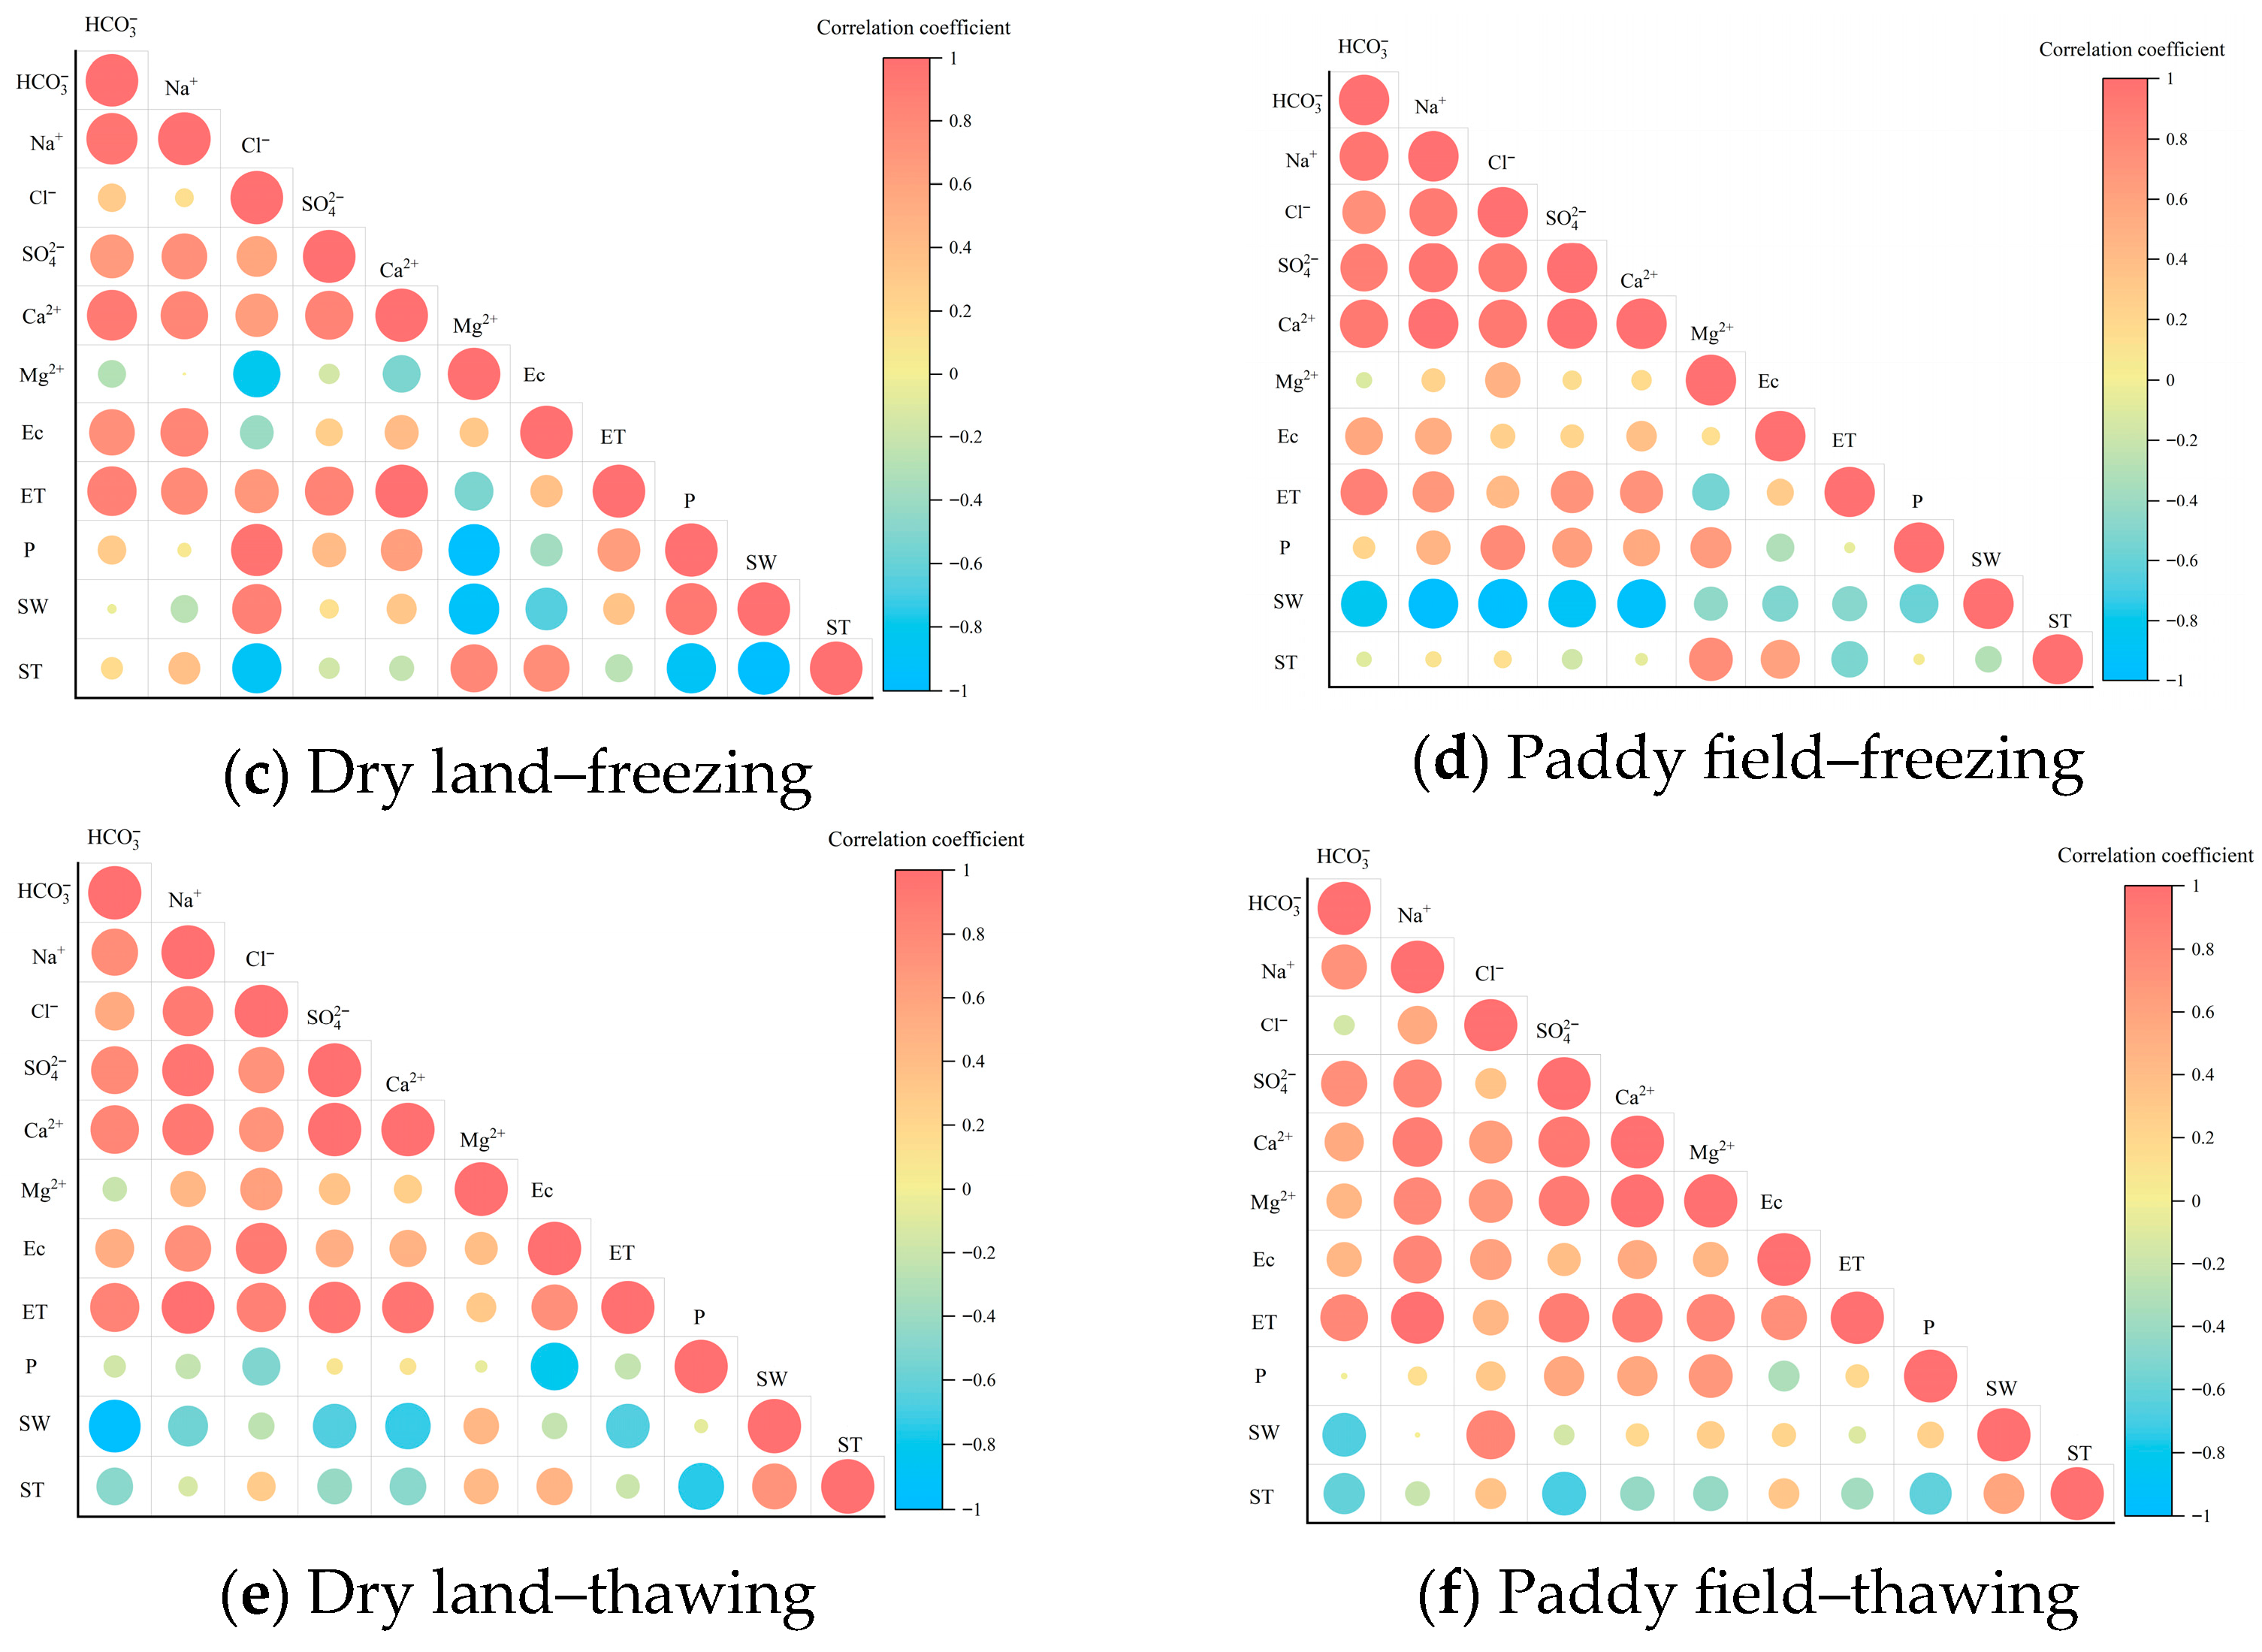
To identify the driving factors of soil salinity and water salinity in different types of farmland (dry fields, paddy fields) during different periods (irrigation period, freezing period, thawing period), we selected the main ions in groundwater (HCO3, Cl, SO42−, Na+, Ca2+, Mg2+), soil electrical conductivity (Ec), evapotranspiration (ET), precipitation (P), soil water content (SW), and soil temperature (ST). A total of 11 factors were used for correlation analysis, and a correlation heat map was plotted, as shown in Figure 4.
As shown in Figure 4, during the irrigation period, the correlation coefficients between HCO3, Na+, P, ET, and Ec in dryland fields were greater than those between other factors and Ec. In paddy fields, the correlation coefficients between HCO3, Na+, SW, and Ec were greater than those between other factors and Ec. This indicates that the primary drivers of soil salinization in dryland fields were HCO3, Na+, P, and ET, while the primary drivers in paddy fields were HCO3, Na+, and SW. During the irrigation period, evaporation is intense in dryland fields, with limited irrigation water, primarily relying on precipitation for replenishment. Surface salinity continues to accumulate due to capillary action. In paddy fields, high SW promotes salt leaching, mitigating soil salinization to some extent.
During the freezing period, the correlation coefficients between HCO3, Na+, SW, ST, and Ec in both upland and paddy fields were higher than those between other factors and Ec, indicating that the primary drivers of soil salinization in upland and paddy fields during the freezing period were HCO3, Na+, SW, and ST. During freezing, significant soil temperature gradients cause salt ions in groundwater to continuously migrate toward the frozen layer via capillary action. Under the constraints of freezing, soil moisture decreases sharply, leading to restricted salt migration.
During the thawing period, the correlation coefficients between HCO3, Na+, P, and ET and Ec in dryland fields were greater than those of other factors with Ec, while the correlation coefficients between HCO3, Na+, and ET and Ec in paddy fields were greater than those of other factors with Ec. This indicates that the primary driving factors for soil salinization in dryland fields were HCO3, Na+, P, and ET, while the primary driving factors for soil salinization in paddy fields were HCO3, Na+, and ET. In dry fields, snowmelt and spring rain promote salt leaching, but as temperatures rise, ET increases, causing salts to migrate upward via capillary action. In paddy fields, the surface layer may still have shallow waterlogging or high soil moisture saturation, leading to accelerated evaporation rates and exacerbating salt migration upward.

3.3. Simulation of Soil Water and Salt Dynamics Across Cropland Types

3.3.1. Model Setup and Spatiotemporal Discretization

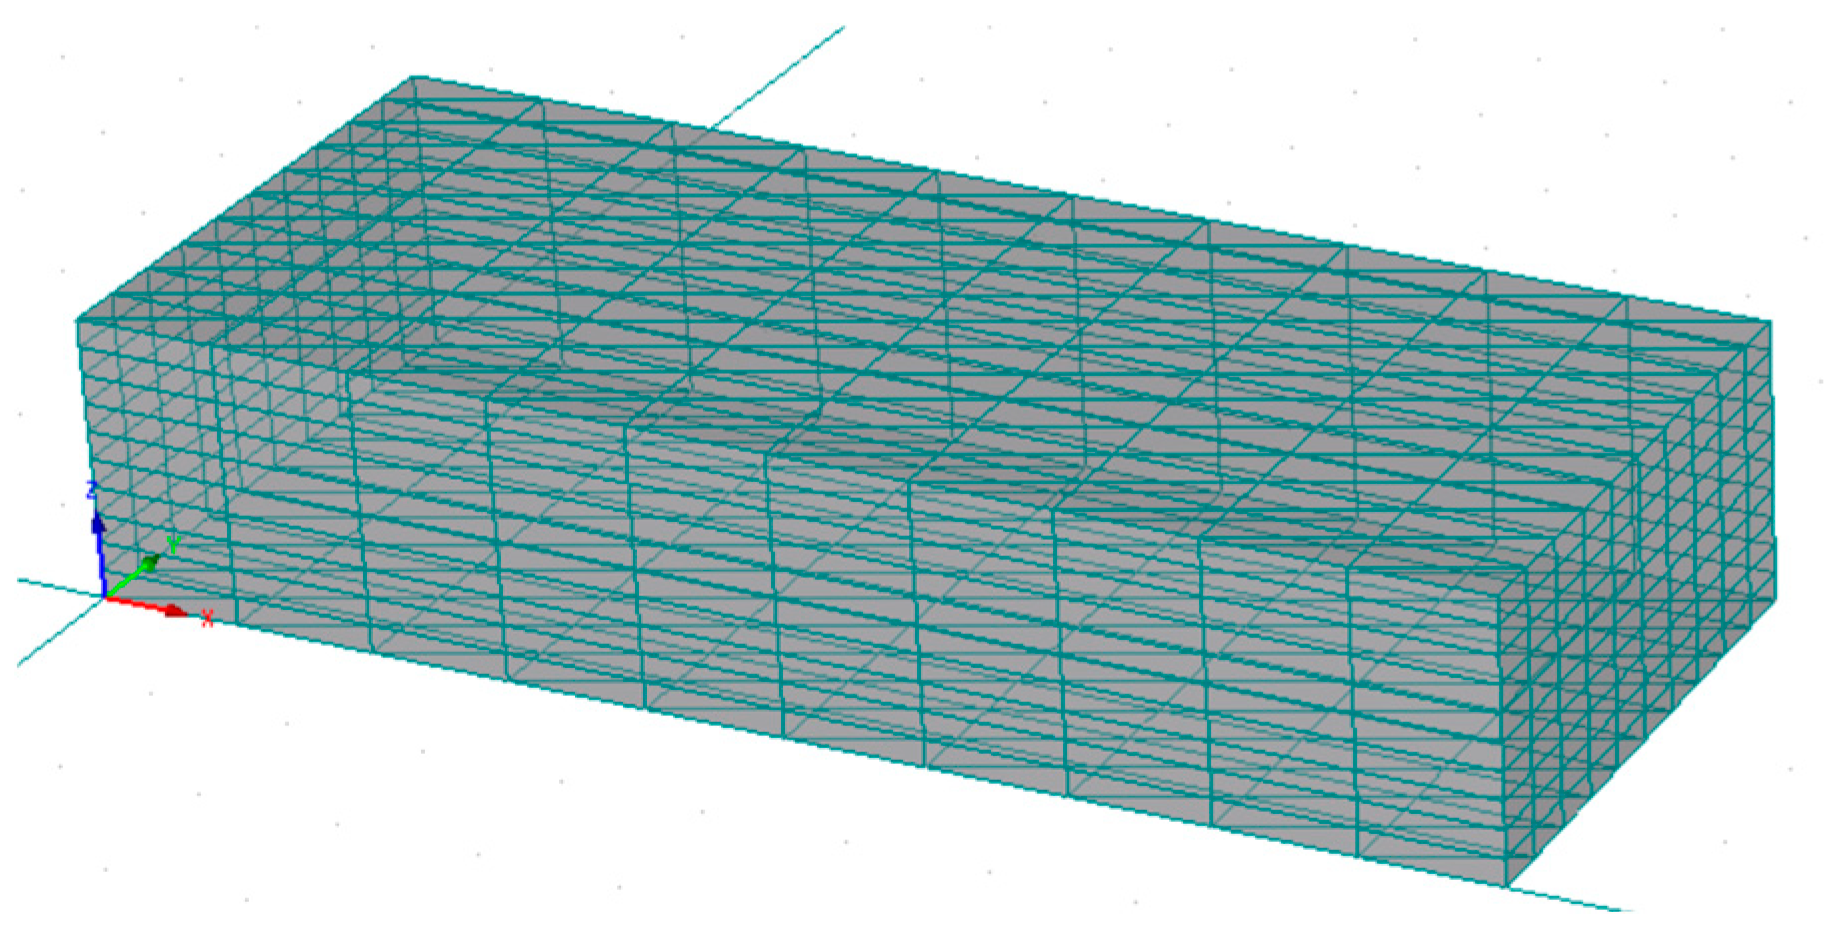
To simulate water and salt transport in saline soils under different cropland types (dry land and paddy fields), separate three-dimensional models were developed for each land use type. Both the dryland and paddy field models were configured with an initial time step of 0.001 days, a maximum time step of 5 days, and a minimum time step of 0.00001 days. The tolerance for volumetric water content was set to 0.001, and the tolerance for pressure head was set to 1 cm. For each model, 364 days of meteorological data—including precipitation and evapotranspiration—were input as boundary conditions. The spatial domain of both models was defined as 500 cm (X-direction) × 200 cm (Y-direction) × 100 cm (Z-direction). The three-dimensional soil modeling framework and corresponding mesh discretization are shown in Figure 5.

3.3.2. Model Parameter Calibration

The soil hydraulic parameters (θs, θr, n, m, α, Ks) were initially estimated using the ROSETTA pedotransfer function, based on soil bulk density and the proportions of sand, silt, and clay. These estimates served as the initial values for hydraulic properties. Previous studies have shown that the solute dispersion coefficient is linearly correlated with soil bulk density. The longitudinal dispersivity (DL) was calculated using the empirical formula: DL = 24.4 × BD − 32.34 where BD denotes soil bulk density. The transverse dispersivity was set to one-tenth of the longitudinal dispersivity. These values were used as the initial estimates for solute transport parameters. Model calibration was performed by comparing simulated and observed values of soil water content and salt concentration. Hydraulic and solute transport parameters were iteratively adjusted until satisfactory agreement between simulated and measured values was achieved. The final calibrated soil hydraulic and solute transport parameters are summarized in Table 5. Root water uptake parameters were determined using default empirical values provided by the simulation model, and are presented in Table 6.

3.3.3. Model Calibration and Validation

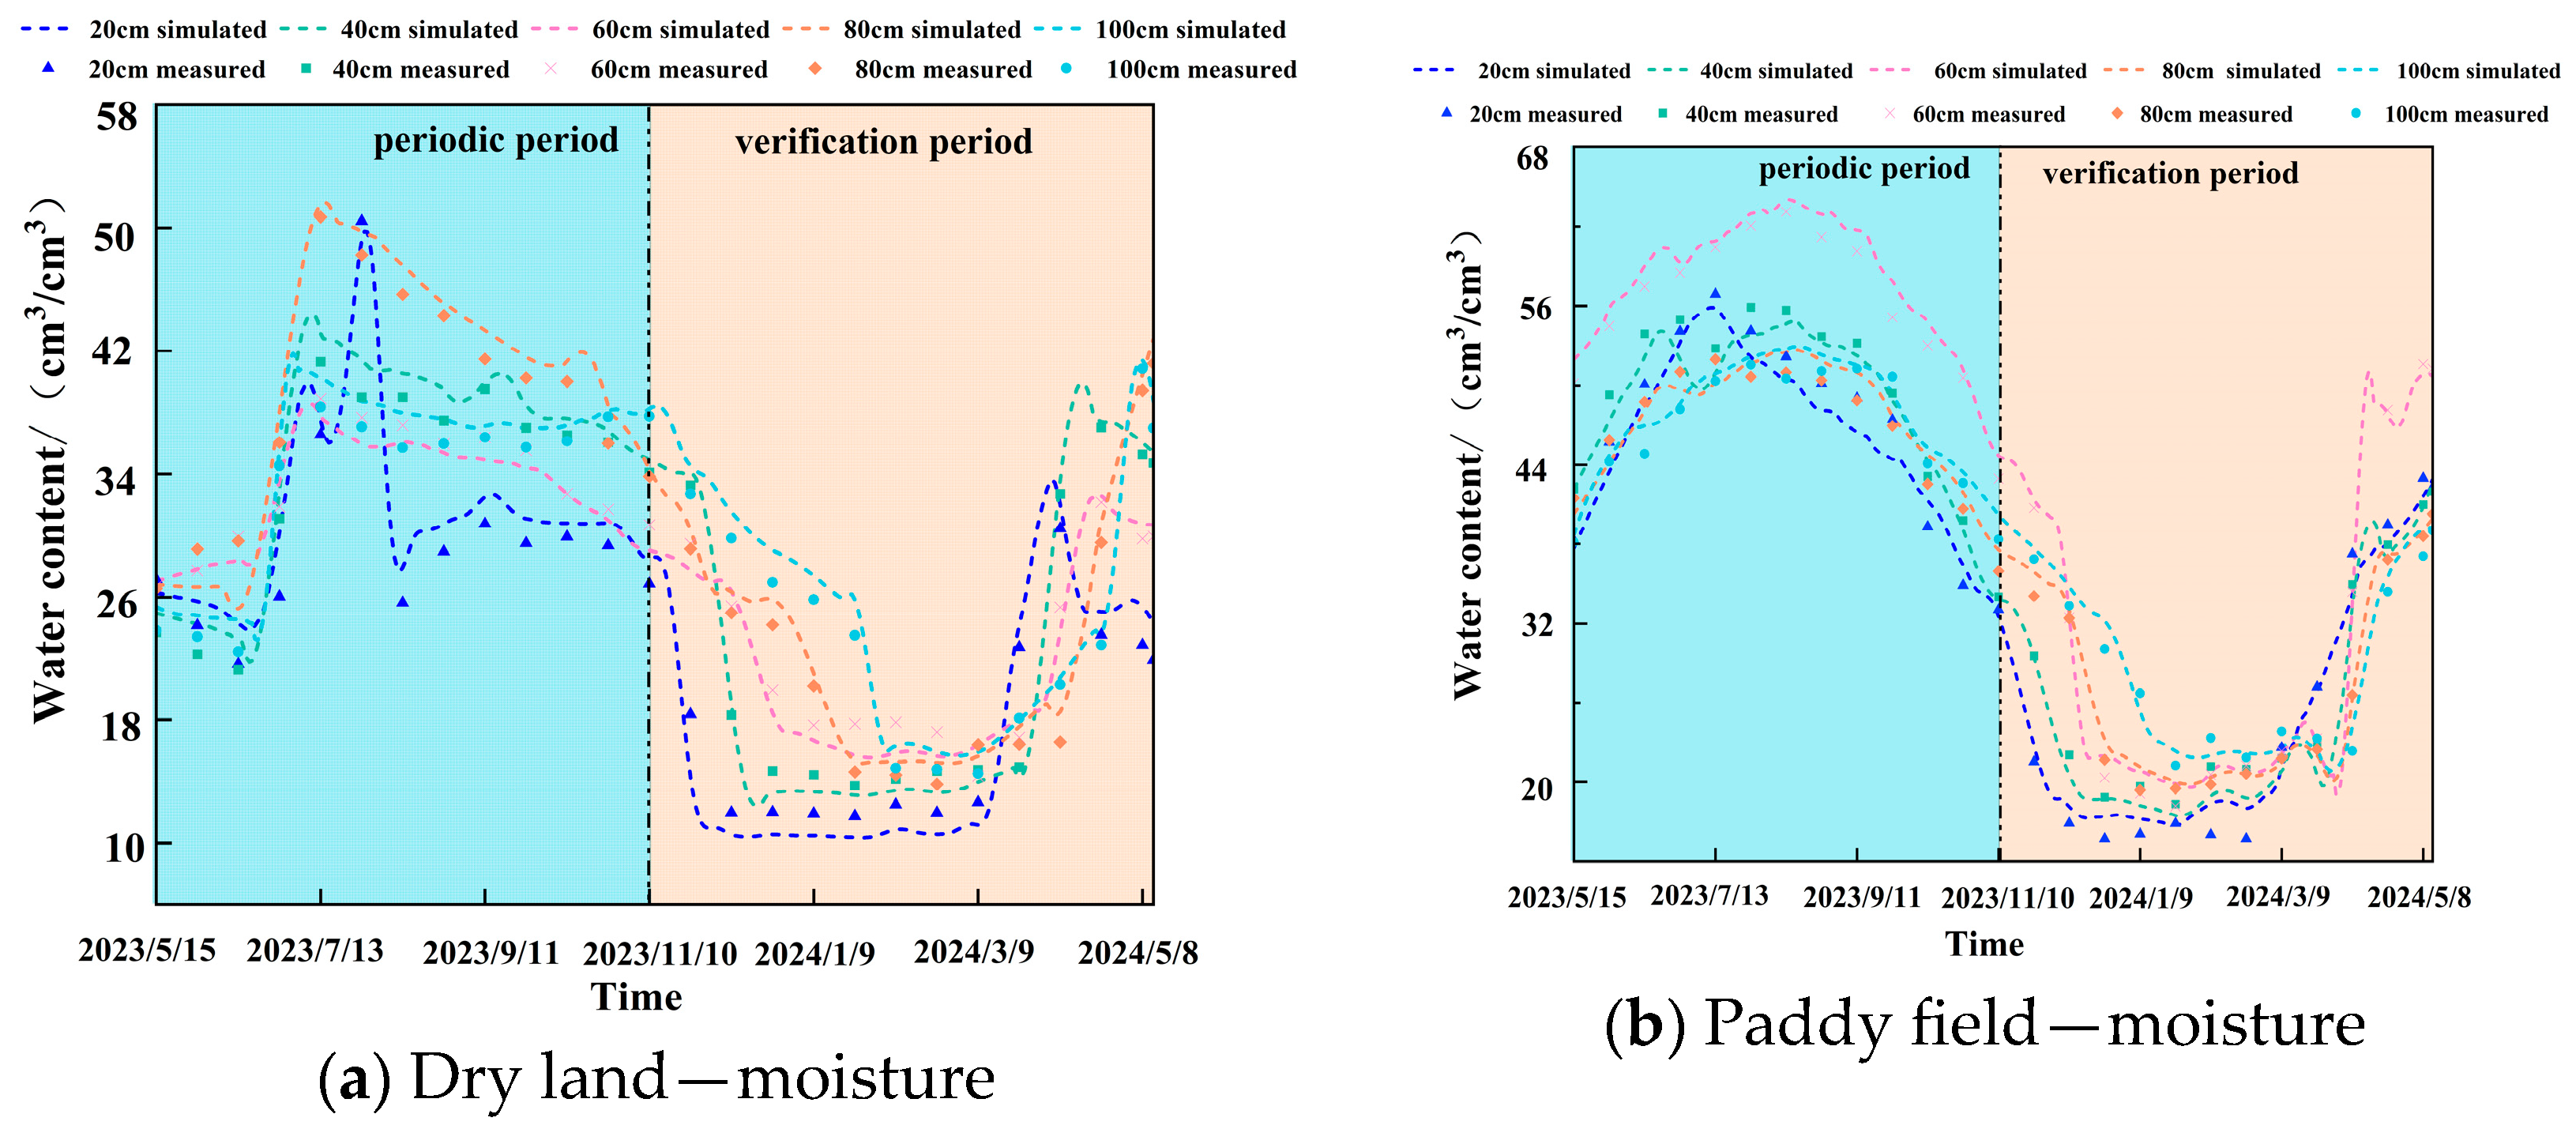
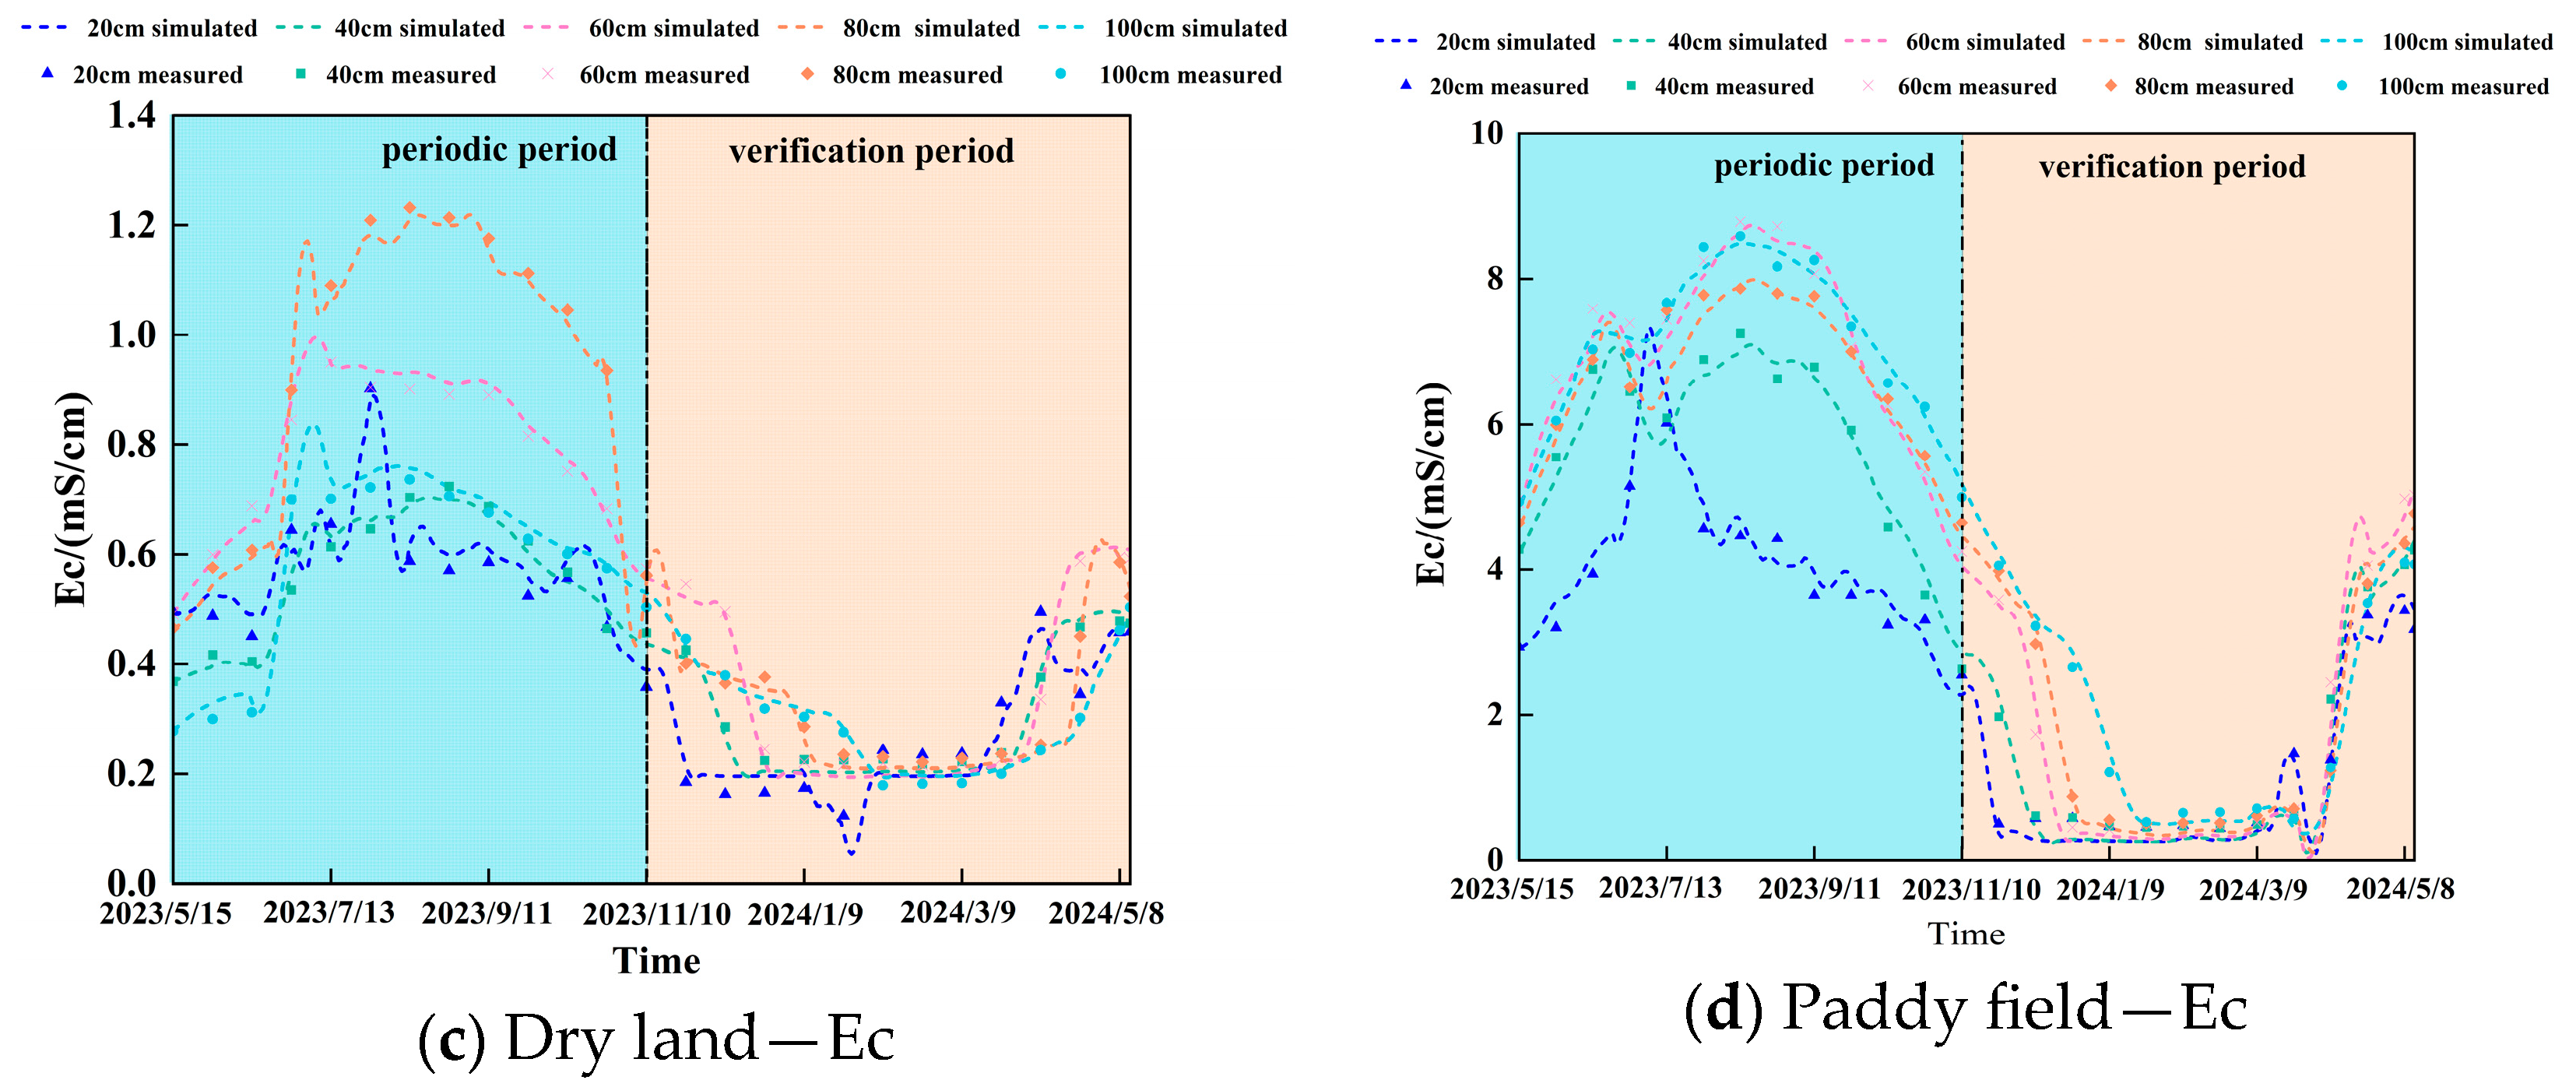
The consistency between simulated and measured values was assessed using root mean square error (RMSE), normalized root mean square error (nRMSE), and the consistency index d. Model calibration and validation were based on field-measured soil water and salt data. The period from 15 May 2023 to 10 November 2023 (i.e., the first 179 days of the simulation period) was used for model calibration, while the period from 11 November 2023 to 14 May 2024 (i.e., the last 183 days of the simulation period) was used for model validation.
During the model calibration period, the simulation results for soil moisture content in both dry land and paddy fields were satisfactory (RMSE = 0.015–0.03; nRMSE = 3.14–8.72%). The consistency between simulated and measured soil moisture content values at various soil depths was good (d > 0.8). The simulation results for soil electrical conductivity in both dry land and paddy fields were satisfactory (RMSE = 0.017–0.038; nRMSE = 2.24–7.701%). The simulated soil moisture content values at various soil depths showed good consistency with measured values (d > 0.8).
During model validation, the simulation results for dry land and paddy fields at all soil layers were good (RMSE = 0.011–0.031; nRMSE = 3.99–15.82%). The simulated soil moisture content values at all soil layer depths showed good consistency with measured values (d > 0.8). The simulation results for all soil layers in both dry land and paddy fields were satisfactory (RMSE = 0.012–0.033; nRMSE = 3.89–11.83%). The simulated soil moisture content values at various soil layer depths showed good consistency with measured values (d > 0.8). The validation results indicate that the model is reliable and can accurately reflect the soil water and salt transport patterns under different farmland types. The model calibration and validation results are shown in Table 7 and Table 8 and Figure 6.

3.3.4. Analysis of Simulation Results

Simulation of Soil Water Dynamics
The validated HYDRUS-3D model was used to simulate the three-dimensional distribution characteristics of soil water and salt dynamics under different farmland types in the study area. The simulation period was from 15 May 2023 to 13 May 2024. Rectangular plots measuring 500 cm × 200 cm × 100 cm were selected from dry fields and paddy fields to simulate soil moisture content. The distribution of soil moisture content during the irrigation period, freezing period, and thawing period within the simulation period is shown in Figure 7 and Figure 8 .
Throughout the simulation area, soil moisture content in both dry fields and paddy fields exhibited a trend of first decreasing and then increasing over time. During the irrigation period, under the combined influence of rainfall and irrigation, soil moisture content in both dry fields and paddy fields showed a rapid increase, with dry fields approaching the saturated moisture content of 52.2% and paddy fields approaching 64.5%. During the freezing period, the unfrozen water content in all layers of dry land and paddy fields decreased sharply, with the freezing front continuously moving downward. Each layer reached a stable threshold value for moisture content. The surface layer was more significantly affected by freezing, resulting in a rapid decrease in surface moisture content. The moisture content of the 80–100 cm layer in both dry land and paddy fields was higher than that of other soil layers. During the thawing period, as temperatures rose, the unfrozen water content in both dry fields and paddy fields gradually increased. Overall, the highest soil moisture content in dry fields was at 80 cm, while in paddy fields, it was at 60 cm.
Simulation of Soil Salinity Dynamics
Based on the predictive simulation of soil electrical conductivity in rectangular plots measuring 500 cm × 200 cm × 100 cm in both dry land and paddy fields, the distribution of soil electrical conductivity during the irrigation period, freezing period, and thawing period within the simulation period is shown in Figure 9 and Figure 10. Overall, the soil electrical conductivity in both dry land and paddy fields exhibited a trend of first decreasing and then increasing over time, consistent with the patterns of moisture content changes. During the irrigation period, under the combined effects of rainfall and irrigation, the soil electrical conductivity of both farmland types rapidly increased. Paddy fields undergo flooding irrigation, which involves a larger irrigation volume compared to drip irrigation in dry fields. The irrigation water carries a significant amount of salts, resulting in paddy field soil electrical conductivity being notably higher than that of dry field soil. During the freezing period, soil salts in both dry land and paddy fields crystallize as water freezes, causing a sharp decrease in soluble salt content. Conductivity values across all layers decrease, and conductivity increases with soil depth. During the thawing period, as temperatures rise, frozen water in both dry land and paddy fields gradually melts, releasing salts, and conductivity values gradually increase. In dryland fields, salt return occurs in the 0–20 cm soil layer. As temperatures warm, increased soil evaporation drives salt upward. In paddy fields, irrigation methods involving irrigation and drainage during the irrigation period carry surface salts downward and expel them during drainage, suppressing salt return in the surface soil layer. Overall, paddy field conductivity is significantly greater than dryland field conductivity.

3.4. Water and Salt Dynamics in Saline Soils by Cropland Type

3.4.1. Water and Salt Fluxes at the Soil Profile Lower Boundary

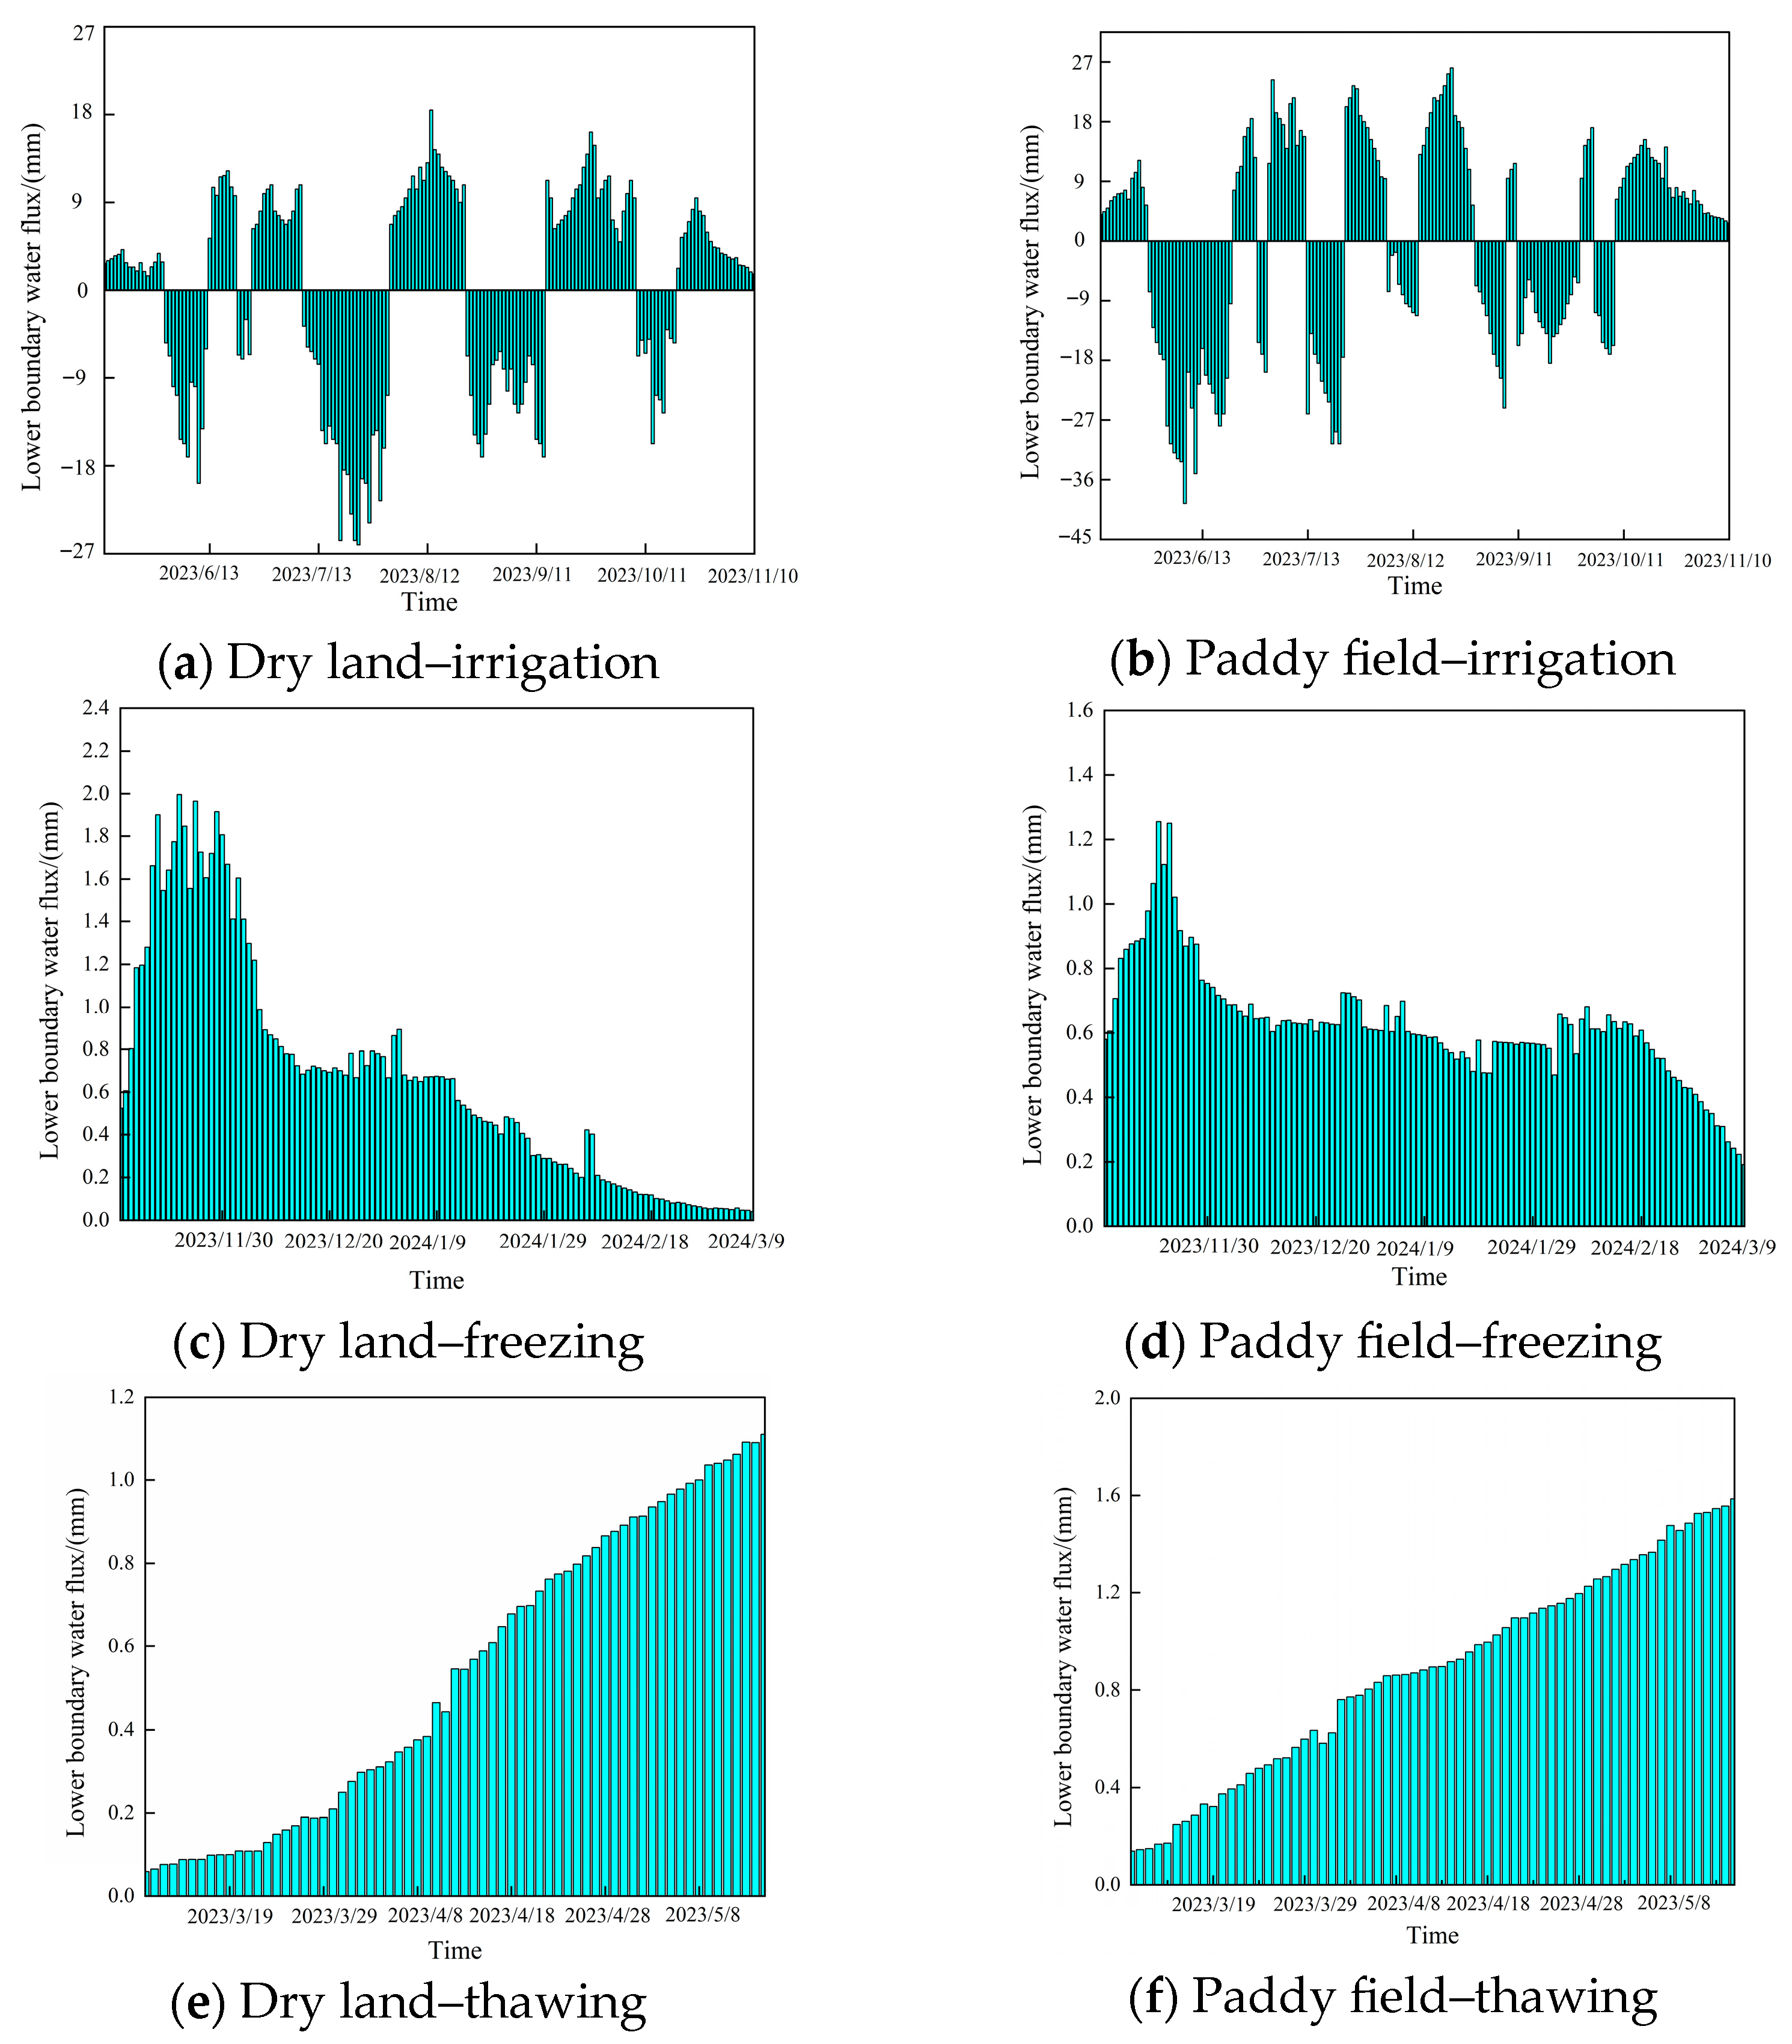
Using the HYDRUS-3D model, the water and salt fluxes at the lower boundary of soil profiles were simulated for dry land and paddy fields during the irrigation, freezing, and thawing periods (Figure 11 and Figure 12). During the irrigation period, the cumulative water and salt fluxes at the lower boundary were negative, indicating net downward movement. In dryland fields, the fluxes were −54.68 mm for water and −565.4 kg/hm2 for salt, while in paddy fields, they reached −112.5 mm and −1217 kg/hm2, respectively. This downward transport was driven by the combined effects of rainfall and irrigation, causing water to move from the soil layers into the groundwater, thus recharging the water table. Although both field types exhibited similar temporal patterns—with a rapid decline in bottom flux following irrigation—the magnitude differed significantly due to irrigation methods. Paddy fields, which received approximately 5.6 times more water than dryland fields due to flood irrigation, exhibited much greater downward fluxes. During the freezing period, the cumulative water and salt fluxes at the lower boundary became positive. In dry land fields, the values were 79.26 mm and 326.85 kg/hm2, and in paddy fields, 74.54 mm and 280.07 kg/hm2, respectively. These upward fluxes were driven by temperature and matric potential gradients, with groundwater migrating toward the freezing front. Additionally, the ice cover in paddy fields reduced surface evaporation, helping to conserve soil moisture. During the thawing period, cumulative water and salt fluxes remained positive. In dryland fields, the values were 35.51 mm and 376.55 kg/hm2, and in paddy fields, 58.9 mm and 299.35 kg/hm2. Snowmelt and early-season precipitation replenished soil moisture; however, as air temperature rose, soil evaporation intensified. Capillary rise became the dominant mechanism, driving upward migration of water and salts.

3.4.2. Calculation of Soil Water and Salt Balance

According to field investigations, the total irrigation amount during the irrigation period was 71.3 mm for dryland fields, using irrigation water with a salt load of 348.5 kg/hm2, and no drainage occurred. In contrast, paddy fields received 397.2 mm of irrigation water with a salt concentration of 627.8 kg/hm2, and produced 145.8 mm of drainage. No irrigation or drainage occurred during the freezing and thawing periods for either field type. The water and salt fluxes at the soil profile lower boundary were obtained from HYDRUS-3D simulations as described in Section 3.4.1. Salt loss via drainage was calculated by combining drainage volume with the salt concentration of the irrigation water. Based on literature values indicating that drainage accounts for 20% of irrigation in paddy fields, the salt carried away by drainage during the irrigation period was estimated at 138.26 kg/hm2. Using Equations (19) to (24), the soil water and salt balance for dry land and paddy fields was calculated for the irrigation, freezing, and thawing periods between 15 May 2023 and 15 May 2024. The results are presented in Table 9 and Table 10.
During the irrigation period, the cumulative water content changes ΔW for dry fields and paddy fields were −18.58 mm and 60.92 mm, respectively, while the cumulative salt content changes ΔS were −216.5 kg/hm2 and −727.46 kg/hm2, respectively. The soil moisture in the 0–100 cm layer of dry fields was in a deficit state, while that in the 0–100 cm layer of paddy fields was in a surplus state. Both types of fields exhibited desalination in the 0–100 cm soil layer, with paddy fields showing 2.5 times the desalination rate of dry fields. Dry fields experienced low precipitation and intense evaporation, resulting in soil moisture primarily lost through evapotranspiration. Paddy fields introduced water from the Nenjiang River through irrigation, significantly increasing soil water storage capacity. Under the influence of irrigation and drainage, salt content in the 0–100 cm soil layer of paddy fields was leached, achieving desalination. In contrast, dry fields lacked leaching, resulting in significantly lower desalination rates compared to paddy fields. During the freezing period, the cumulative moisture change (ΔW) in dry fields and paddy fields was 5.56 mm and 10.8 mm, respectively, and the cumulative salt change (ΔS) was 326.85 kg/hm2 and 280.07 kg/hm2, respectively. After the freezing period, both soil moisture and salinity accumulated in both types of farmland. Freezing drove deep-layer moisture to migrate toward the surface and freeze, but paddy fields may have slightly higher residual moisture due to irrigation. During the thawing period, the cumulative water content changes (ΔW) for dry fields and paddy fields were −44.52 mm and −15.27 mm, respectively, and the cumulative salt content changes (ΔS) were 376.55 kg/hm2 and 299.35 kg/hm2, respectively. Soil moisture in both dry fields and paddy fields at the 0–100 cm depth was in a deficit state, with dry fields losing approximately 1.56 times more moisture than paddy fields. Soil salinity in both dry fields and paddy fields at the 0–100 cm depth was in an accumulation state. As temperatures rise, evaporation rates accelerate, and soil water is transported through capillary action to replenish the primary root zone of crops in the cultivated fields. This water is then consumed through transpiration, with salts moving with the water and accumulating in the shallow layers. Since the paddy fields were not flooded at this time, the clay soil in the paddy fields has stronger water retention capacity than the dry fields, resulting in lower evaporation rates. This leads to higher water deficit and salt accumulation in the dry fields compared to the paddy fields.

4. Conclusions

Based on long-term in situ monitoring data from saline-affected upland fields and saline-affected paddy fields, combined with meteorological conditions, a systematic analysis was conducted on the seasonal water, heat, and salt dynamics of the soil. Correlation analysis was used to clarify the driving factors of soil water and salt content in saline-affected upland fields and saline-affected paddy fields during different periods. The Hydrus-3D model was employed to conduct a detailed simulation of the soil water and salt transport patterns and lower boundary water and salt flux during the crop irrigation period, freezing period, and thawing period in dry fields and paddy fields. Additionally, the water and salt balance calculation formula was used to analyze the seasonal water and salt balance characteristics of typical saline–alkali soils in farmland. The following conclusions can be drawn.
(1)
During the irrigation period, peak soil water content and electrical conductivity (Ec) occurred at 80 cm in dryland fields and at 60 cm (water content) and 60–100 cm (Ec) in paddy fields. During the freezing period, soil water content and Ec decreased sharply across all depths with no significant stratification, and the Ec decline was more pronounced in paddy fields. In the thawing period, soil water content, Ec, and heat all showed increasing trends without apparent vertical heterogeneity. Over the full year, paddy fields exhibited higher Ec values than dryland fields, while both field types showed similar vertical distributions of soil heat.
(2)
Correlation analysis revealed that the main driving factors of soil salinization during the irrigation period were HCO3, Na+, precipitation (P), and evapotranspiration (ET) in dryland fields, and HCO3, Na+, and soil water content (SW) in paddy fields. During the freezing period, the dominant factors in both field types were HCO3, Na+, SW, and soil temperature (ST). During the thawing period, the primary drivers were HCO3, Na+, P, and ET in dryland fields, and HCO3, Na+, and ET in paddy fields.
(3)
The HYDRUS-3D model simulated temporal patterns of water–salt transport and bottom boundary fluxes. In saline dryland fields, the bottom boundary water and salt fluxes were −54.68 mm and −565.4 kg/hm2 (irrigation), +79.26 mm and +326.85 kg/hm2 (freezing), and +35.51 mm and +376.55 kg/hm2 (thawing). In saline paddy fields, these values were −112.5 mm and −1217.0 kg/hm2 (irrigation), +74.54 mm and +280.07 kg/hm2 (freezing), and +58.9 mm and +299.35 kg/hm2 (thawing).
(4)
Based on bottom boundary water and salt fluxes simulated by the HYDRUS-3D model, the seasonal soil water–salt balance was quantitatively assessed for saline dry land and paddy fields. During the irrigation period, paddy fields achieved significant salt leaching, with a desalinization magnitude 3.36 times greater than that of dry lands. In the freezing period, the water storage in paddy soils was 1.94 times higher than in dry lands, while salt accumulation in dry lands exceeded that in paddy fields by 17%. During the thawing period, previously accumulated salts migrated upward as thawing progressed. Enhanced evaporation in dry lands led to secondary salinization, with water loss 1.61 times and salt accumulation 1.3 times that of paddy fields.

Author Contributions

Data curation, Y.W. (Yanchen Wang) and X.S.; writing—original draft preparation, C.C.; writing—review and editing, Y.W. (Yu Wang) and J.B.; project administration, Y.W. (Yu Wang); funding acquisition, Y.W. (Yu Wang); All authors have read and agreed to the published version of the manuscript.

Funding

This research was funded by the National Key Research and Development Program of China (Grant No. 2022YFD1500500), and the Projects of Jilin Provincial Department of Science and Technology (Grant No. 20240101059JC).

Data Availability Statement

The original contributions presented in this study are included in the article. Further inquiries can be directed to the corresponding author.

Conflicts of Interest

The authors declare no conflicts of interest.

References

  1. Ma, Y.; Tashpolat, N. Current Status and Development Trend of Soil Salinity Monitoring Research in China. Sustainability 2023, 15, 5874. [Google Scholar] [CrossRef]
  2. Luo, P.; Zhao, L.; Chen, R.; Chen, P.; Dhital, Y.P.; Li, H.; Wang, D.; Yang, J.; Chen, Y.; Liu, Q.; et al. Leaching Salinity and Mulching Straws during Freeze-Thaw Period Enhance Post-Thawing Cotton Yield and Quality by Optimizing Soil Aggregates Stability. Soil Tillage Res. 2025, 250, 106506. [Google Scholar] [CrossRef]
  3. Yu, M.; Rui, X. Water and Salt Balance Model and Its Application in Yinbei Irrigation District, Ningxia. J. Hohai Univ. (Nat. Sci. Ed.) 2009, 37, 367–372. [Google Scholar] [CrossRef]
  4. Mao, J.; Wu, J.; Liu, Y.; Guo, C.; Xiao, C.; Lu, Y.; Zhao, L.; Zhang, R.; Zhang, H. A Model for Simulating Evaporation from Seasonally Frozen Saline Soil. J. Hydrol. 2025, 659, 133259. [Google Scholar] [CrossRef]
  5. Wang, Y.; Sun, H.; Mo, Q.; Zhuo, C. Application of Hydrus-2D Model in Subsurface Drainage of Saline Soil in Coastal Forest Land-A Case Example of Fengxian, Shanghai. Sustainability 2024, 16, 4590. [Google Scholar] [CrossRef]
  6. Zhang, S.; Zhou, Y.; Huang, L.; Fang, R.; Liu, S.; Liu, T.; Huang, B. Effects of the Hydrolysis of Mudstone on Soil Infiltration: Experiments versus Numerical Modelling. J. Hydrol. 2025, 660, 133254. [Google Scholar] [CrossRef]
  7. Casillas-Trasvina, A.; Meles, M.B.; Cui, W.; Hatch, T.; Bradford, S.; Harter, T. Integrated Hydrologic Modeling of Groundwater Flow Dynamics and Recharge in the San Joaquin Valley. J. Hydrol. 2025, 660, 133377. [Google Scholar] [CrossRef]
  8. Jiang, J.; Feng, S.; Ma, J.; Huo, Z.; Zhang, C. Irrigation Management for Spring Maize Grown on Saline Soil Based on SWAP Model. Field Crops Res. 2016, 196, 85–97. [Google Scholar] [CrossRef]
  9. Xun, Y.; Xiao, X.; Sun, C.; Meng, H.; Gao, Y.; Huang, G.; Xu, X. Modeling Heat-Water-Salt Transport, Crop Growth and Water Use in Arid Seasonally Frozen Regions with an Improved Coupled SPAC Model. J. Hydrol. 2022, 615, 128703. [Google Scholar] [CrossRef]
  10. Yuan, C.; Feng, S.; Huo, Z.; Ji, Q. Simulation of Saline Water Irrigation for Seed Maize in Arid Northwest China Based on SWAP Model. Sustainability 2019, 11, 4264. [Google Scholar] [CrossRef]
  11. Yuan, C. Simulation of Water-Salt Transport and Balance in Cultivated-Wasteland System Based on SWAP Model in Hetao Irrigation District of China. Agric. Water Manag. 2024, 305, 109132. [Google Scholar] [CrossRef]
  12. Wang, Z.; Heng, T.; Li, W.; Zhang, J.; Yang, B.; Jiang, Y. Effects of Drainage Tile Spacing on Soil Salt Leaching under Drip Irrigation. Trans. Chin. Soc. Agric. Mach. 2017, 48, 253–261. [Google Scholar] [CrossRef]
  13. Li, J.; Huang, S.; Jiang, Z.; Xin, L.; Liu, X. Study on Soil Water and Salt Transport in Shallow-Buried Film Mulched Drip-Irrigated Maize Fields Based on HYDRUS-2D. Water-Saving Irrig. 2025, 6, 82–89. [Google Scholar] [CrossRef]
  14. He, X.; Liu, H.; Ye, J.; Yang, G.; Li, M.; Gong, P.; Aimaiti, A. Comparative Investigation on Soil Salinity Leaching under Subsurface Drainage and Ditch Drainage in Xinjiang Arid Region. Int. J. Agric. Biol. Eng. 2016, 9, 109–118. [Google Scholar] [CrossRef]
  15. Tao, Y.; Wang, S.; Xu, D.; Qu, X. Experiment and Analysis on Flow Rate of Improved Subsurface Drainage with Ponded Water. Agric. Water Manag. 2016, 177, 1–9. [Google Scholar] [CrossRef]
  16. Hou, M.; Zhu, L.; Jin, Q. Surface Drainage and Mulching Drip-Irrigated Tomatoes Reduces Soil Salinity and Improves Fruit Yield. PLoS ONE 2016, 11, e0154799. [Google Scholar] [CrossRef]
  17. Jia, H.; Li, B.; Li, W. Simulation of water and salt transport under combined irrigation and drainage based on HYDRUS-1D model. Water Sav. Irrig. 2021, 1, 27–32. [Google Scholar]
  18. Hansson, K.; Simunek, J.; Mizoguchi, M.; Lundin, L.C.; van Genuchten, M.T. Water Flow and Heat Transport in Frozen Soil: Numerical Solution and Freeze-Thaw Applications. Vadose Zone J. 2004, 3, 693–704. [Google Scholar] [CrossRef]
  19. Xu, Y.; Liu, Z.; Cheng, H.; Zhu, X.; Huang, H.; Li, Z. Simulation of Field Water and Salt Transport under Ridge Irrigation Mode Based on HYDRUS-3D. Hydropower Water Resour. Technol. 2021, 52, 14–22. [Google Scholar] [CrossRef]
  20. Yan, Y.; Shi, H.; Miao, Q.; Wang, G.; Su, Y.; Yang, S. Analysis of Water and Salt Transport and Balance among Different Land Types in the Yellow River Irrigation District Based on a Dry Drainage Salt Control Model. Trans. Chin. Soc. Agric. Mach. 2024, 55, 346–359. [Google Scholar]
  21. Wang, G. Study on Water and Salt Transport and Salt Redistribution among Different Land Types in the Hetao Irrigation District. Ph.D. Thesis, Inner Mongolia Agricultural University, Hohhot, China, 2022. [Google Scholar]
  22. Shao, J.; Li, S.; Yang, X.; Zhang, F.; Yang, H.; Peng, Z.; Zulfiqar, T. Evaluating Soil Salinity Dynamics under Drip Irrigation in the Manas River Basin, Xinjiang: A Long-Term Analysis (1996–2019). PeerJ 2025, 13, e19295. [Google Scholar] [CrossRef]
  23. Sun, W.; Shi, H.; Li, X.; Miao, Q.; Feng, Z.; Su, H. Simulation of Water Flux and Irrigation Schedule Optimization in Typical Sand-layered Farmland in Hetao Irrigation District. Trans. Chin. Soc. Agric. Mach. 2025, 56, 639–652. [Google Scholar] [CrossRef]
  24. Liu, J. Study on Water and Salt Transport and Plant Response Under Microtopography in the Soda Saline-Alkali Soil Region of the Songnen Plain. Master’s Thesis, University of Chinese Academy of Sciences (Northeast Institute of Geography and Agroecology, Chinese Academy of Sciences), Changchun, China, 2021. [Google Scholar] [CrossRef]
  25. Shi, Q. Experimental Study on Water and Salt Distribution Characteristics and Transport Simulation in the Da’an Irrigation District. Master’s Thesis, Changchun Institute of Technology, Changchun, China, 2024. [Google Scholar] [CrossRef]
  26. Li, S. Distribution Characteristics and Ecological Risk Assessment of Fluorine in the Da’an Irrigation District. Master’s Thesis, Liaoning Technical University, Fuxin, China, 2024. [Google Scholar] [CrossRef]
  27. Wang, X. Jilin Implements the “Ten Billion Jin Grain” Production Capacity Construction Project to Strive for the Vanguard of Agricultural Modernization. Rural Work Commun. 2023, 5, 55–56. [Google Scholar]
  28. Shi, Z. Effects of Freeze-Thaw Cycles on Dispersivity of Saline Soil in Western Jilin and Improvement Methods. Master’s Thesis, Jilin University, Changchun, China, 2021. [Google Scholar] [CrossRef]
  29. Li, J. Study on Water and Salt Transport Characteristics of Dispersive Saline Soil in Da’an Area, Jilin Province. Master’s Thesis, Jilin Jianzhu University, Changchun, China, 2024. [Google Scholar] [CrossRef]
  30. Chen, W.; Xu, S.; Sheng, T.; Ferre, T.P.A.; Zhu, Q.; He, Y.; Liu, Y. Numerical Simulations of Soil Water-Salt Movement Considering the Dynamics of Cotton Fine Root Growth under Film-Mulched Drip Irrigation. J. Hydrol. 2024, 638, 131543. [Google Scholar] [CrossRef]
  31. Guo, L.; Wang, Z.; Simunek, J.; He, Y.; Muhamma, R. Optimizing the Strategies of Mulched Brackish Drip Irrigation under a Shallow Water Table in Xinjiang, China, Using HYDRUS-3D. Agric. Water Manag. 2023, 283, 108303. [Google Scholar] [CrossRef]
  32. Zheng, C.; Šimůnek, J.; Zhao, Y.; Lu, Y.; Liu, X.; Shi, C.; Li, H.; Yu, L.; Zeng, Y.; Su, Z. Development of the Hydrus-1D Freezing Module and Its Application in Simulating the Coupled Movement of Water, Vapor, and Heat. J. Hydrol. 2021, 598, 126250. [Google Scholar] [CrossRef]
  33. Zhao, Y.; Si, B.; He, H.; Xu, J.; Peth, S.; Horn, R. Modeling of Coupled Water and Heat Transfer in Freezing and Thawing Soils, Inner Mongolia. Water 2016, 8, 424. [Google Scholar] [CrossRef]
  34. Bian, J.; Wu, J.; Nie, S.; Wang, Y.; Lin, X. The Parametric Uncertainty Estimation of Water and Nitrogen Transport Simulation in a Paddy Field Experiment Using HYDRUS-1D. Irrig. Drain. 2023, 72, 451–464. [Google Scholar] [CrossRef]
  35. Hou, C.; Shi, H.; Miao, Q.; Hu, Z.; Zhao, Y.; Yu, C.; Yan, Y.; Fan, L.; Zhang, T. Hydrochemical Characteristics of Groundwater and Water-Salt Transport in Different Land Types in Hetao Irrigation District. Arid Zone Res. 2024, 41, 1956–1968. [Google Scholar] [CrossRef]
  36. Ma, G.; Qu, Z.; Feng, X.; Wang, L.; Li, E.; Jin, C. Analysis of Water-Salt Balance Before and After Saline-Alkali Land Reclamation: A Case Study of Hetao Irrigation District. J. Irrig. Drain. 2021, 40, 95–103. [Google Scholar] [CrossRef]
  37. Gao, H.; Liu, X.; Gao, X.; Qu, Z. Transport law and balance analysis of salt and ions in salinized soil under different irrigation and drainage patterns. J. Soil Water Conserv. 2023, 37, 361–370. [Google Scholar] [CrossRef]
Figure 1. Geographical location of the study area.
Water 17 02974 g001
Figure 2. Meteorological conditions in the study area from May 2023 to May 2024.
Water 17 02974 g002
Figure 3. Dynamic variations of soil moisture content, electrical conductivity, and heat.
Water 17 02974 g003
Figure 4. Correlation heatmap of saline soils under different land use types.
Water 17 02974 g004
Figure 5. Three-dimensional computational model.
Water 17 02974 g005
Figure 6. Observed vs. simulated soil moisture and Ec across depths.
Water 17 02974 g006aWater 17 02974 g006b
Figure 7. 3D soil moisture dynamics in dry fields.
Water 17 02974 g007
Figure 8. 3D soil moisture dynamics in paddy fields.
Water 17 02974 g008
Figure 9. 3D dynamics of electrical conductivity in dry fields.
Water 17 02974 g009
Figure 10. 3D dynamics of electrical conductivity in paddy fields.
Water 17 02974 g010
Figure 11. Bottom boundary water flux.
Water 17 02974 g011
Figure 12. Bottom boundary salt flux.
Water 17 02974 g012aWater 17 02974 g012b
Table 1. Physical properties of the soil in the experimental area.
Farmland TypeSoil Depth
/(cm)
Grain Content/%Bulk Density/(g/cm3)Soil Type
SandSiltClay
Dry land0–202.3481.1316.531.483Silt loam
20–400.5280.0519.431.483Silty loam
40–602.276.3421.461.517Silty loam
60–800.4874.824.721.417Silty loam
80–100070.8629.141.617Silty clay loam
Paddy field0–204.0382.4513.521.567Silty loam
20–400.0282.7517.231.593Silty loam
40–600.0271.2628.721.450Silty clay loam
60–800.6481.3817.981.610Silty loam
80–1000.0279.9520.031.682Silty loam
Table 2. Measured initial soil moisture content and electrical conductivity.
Soil Depth/(cm)0–20 cm20–40 cm40–60 cm60–80 cm80–100 cm
Dry landSWC/(cm3·cm−3)0.2670.2500.2750.2740.254
Ec/(mS/cm)0.5130.3820.5120.4680.279
SAR8.9712.6811.812.3515.32
pH7.517.637.727.927.93
Organic matter/%2.1901.0381.3061.0760.620
Paddy fieldSWC/(cm3·cm−3)0.3510.3910.4860.3620.342
Ec/(mS/cm)3.0704.4414.9304.7145.010
SAR94.1146.5578.6455.4348.92
pH8.398.488.438.458.45
Organic matter/%0.5620.3980.4130.5630.624
Table 3. Physicochemical properties of the soil in the experimental area.
Farmland
Type
Soil
Depth
/(cm)
Content of the Eight Major Ions/(mg/kg)
CO32−HCO3ClSO42−Na+Mg2+K+Ca2+
Dry land0–200.0698.888.8105.3165.520.117.295.4
20–400.0685.488.890.2221.714.212.992.2
40–600.0779.4117.297.8238.312.510.6111.3
60–8066.11317.0110.189.1376.217.24.4203.3
80–10033.11068.3113.684.9339.914.93.1104.2
Paddy field0–203145.91343.83809.21364.23687.810.12.031.7
20–401639.01437.91047.3557.81759.417.82.6201.5
40–601652.31343.81047.3405.11543.27.71.375.4
60–801321.82244.21054.4700.22332.925.13.6250.8
80–1001321.82163.61086.3650.42156.723.12.9271.0
Table 4. Water quality index values for irrigation water in different farmland types.
Farmland TypeEc/(mS/cm)Na+/(mg/L)HCO3/(mg/L)Cl/(mg/L)
Dry land0.8520.13135.6631.95
Paddy field1.44166.52342.3782.36
Table 5. Calibrated soil hydraulic and solute transport parameters.
Farmland
Type
Soil
Depth
/(cm)
Content of the Eight Major Ions/(mg/kg)
θr
/(cm3/cm3)
θs
/(cm3/cm3)
α
/(cm−1)
nlKs
/(cm/day)
DL
/(cm)
DT
/(cm)
Dry land0–200.06980.45870.00611.620.512.67.691.13
20–400.07440.44080.00631.600.59.367.81.2
40–600.07080.42790.00641.590.57.749.351.8
60–800.08190.52500.00661.580.59.254.470.56
80–1000.07940.41260.00771.500.52.8614.231.86
Paddy field0–200.06140.56720.00661.600.511.9411.791.54
20–400.06770.56500.00681.570.56.5313.062.45
40–600.08120.64580.00751.520.53.746.080.85
60–800.06720.56690.00691.560.55.7613.892.66
80–1000.06720.56430.00731.520.53.7217.403.94
Note: θr is the residual water content; θs is the saturated water content; Ks is the saturated hydraulic conductivity; α is the inverse of air-entry suction; n is the pore-size distribution parameter; DL is the longitudinal solute dispersion coefficient; DT is the transverse solute dispersion coefficient.
Table 6. Root water uptake parameters under different cropland types.
Cropland TypeCultivated Croph0 (cm)hopt (cm)h2H (cm)h2l (cm) H3 (cm)
Dry landMaize−15−30−325−600−8000
Paddy fieldRice−10−55−160−250−15,000
Note: h0 represents the upper limit of soil water potential at which root water uptake begins; hopt is the upper limit of soil water potential at which root water uptake reaches its maximum rate; h2H is the lower limit of water potential under high evapotranspiration conditions; h2l is the lower limit under low evapotranspiration; and H3 represents the wilting point, i.e., the lowest soil water potential at which root water uptake can occur.
Table 7. Model performance evaluation during the calibration period.
Cropland TypeSoil
Depth
/(cm)
Soil Moisture ContentSoil Salinity
RMSEnRMSEdRMSEnRMSEd
Dry land0–200.0257.160.920.0325.790.87
20–400.0204.980.950.0203.650.95
40–600.0153.790.980.0222.900.96
60–800.0245.330.940.0212.240.97
80–1000.0184.640.970.0223.910.94
Paddy field0–200.0308.720.880.0387.0710.91
20–400.0253.610.930.0253.4860.95
40–600.0253.140.940.0273.1210.92
0–200.0257.160.920.0325.790.87
20–400.0204.980.950.0203.650.95
Table 8. Model performance evaluation during the validation period.
Cropland TypeSoil
Depth
/(cm)
Soil Moisture ContentSoil Salinity
RMSEnRMSEdRMSEnRMSEd
Dry land0–200.03115.820.870.03311.830.85
20–400.0114.330.980.0185.870.91
40–600.0187.070.950.0185.100.92
60–800.0165.990.960.0164.690.96
80–1000.0186.420.960.0123.890.98
Paddy field0–200.0279.190.910.02916.780.90
20–400.0237.330.930.02610.210.92
40–600.0153.990.980.0178.620.93
0–200.0154.680.970.0157.470.91
20–400.0236.540.940.0165.800.96
Table 9. Soil moisture balance calculation.
PeriodCropland TypePrecipitation (mm)Irrigation (mm)Evapotranspiration (mm)Drainage (mm)Bottom Water Flux (mm)Soil Water Change ΔW (mm)
IrrigationDry land445.271.3480.40−54.68−18.58
Paddy field445.2397.2523.18145.8−112.560.92
FreezingDry land20.83094.53079.265.56
Paddy field20.83084.57074.5410.8
ThawingDry land38.220118.25035.51−44.52
Paddy field38.220112.39058.9−15.27
Table 10. Soil salinity balance calculation.
PeriodCropland TypeIrrigation Water Salt Load (kg/hm2)Bottom Salt Flux (kg/hm2)Return Flow Salt Load (kg/hm2)Soil Salt Change
ΔS (kg/hm2)
IrrigationDry land348.5−565.40−216.5
Paddy field627.8−1217.0138.26−727.46
FreezingDry land0326.850326.85
Paddy field0280.070280.07
ThawingDry land0376.550376.55
Paddy field0299.350299.35
Disclaimer/Publisher’s Note: The statements, opinions and data contained in all publications are solely those of the individual author(s) and contributor(s) and not of MDPI and/or the editor(s). MDPI and/or the editor(s) disclaim responsibility for any injury to people or property resulting from any ideas, methods, instructions or products referred to in the content.