Flood Risk Prediction and Management by Integrating GIS and HEC-RAS 2D Hydraulic Modelling: A Case Study of Ungheni, Iasi County, Romania
Abstract
1. Introduction
2. Literature Review
3. Materials and Methods
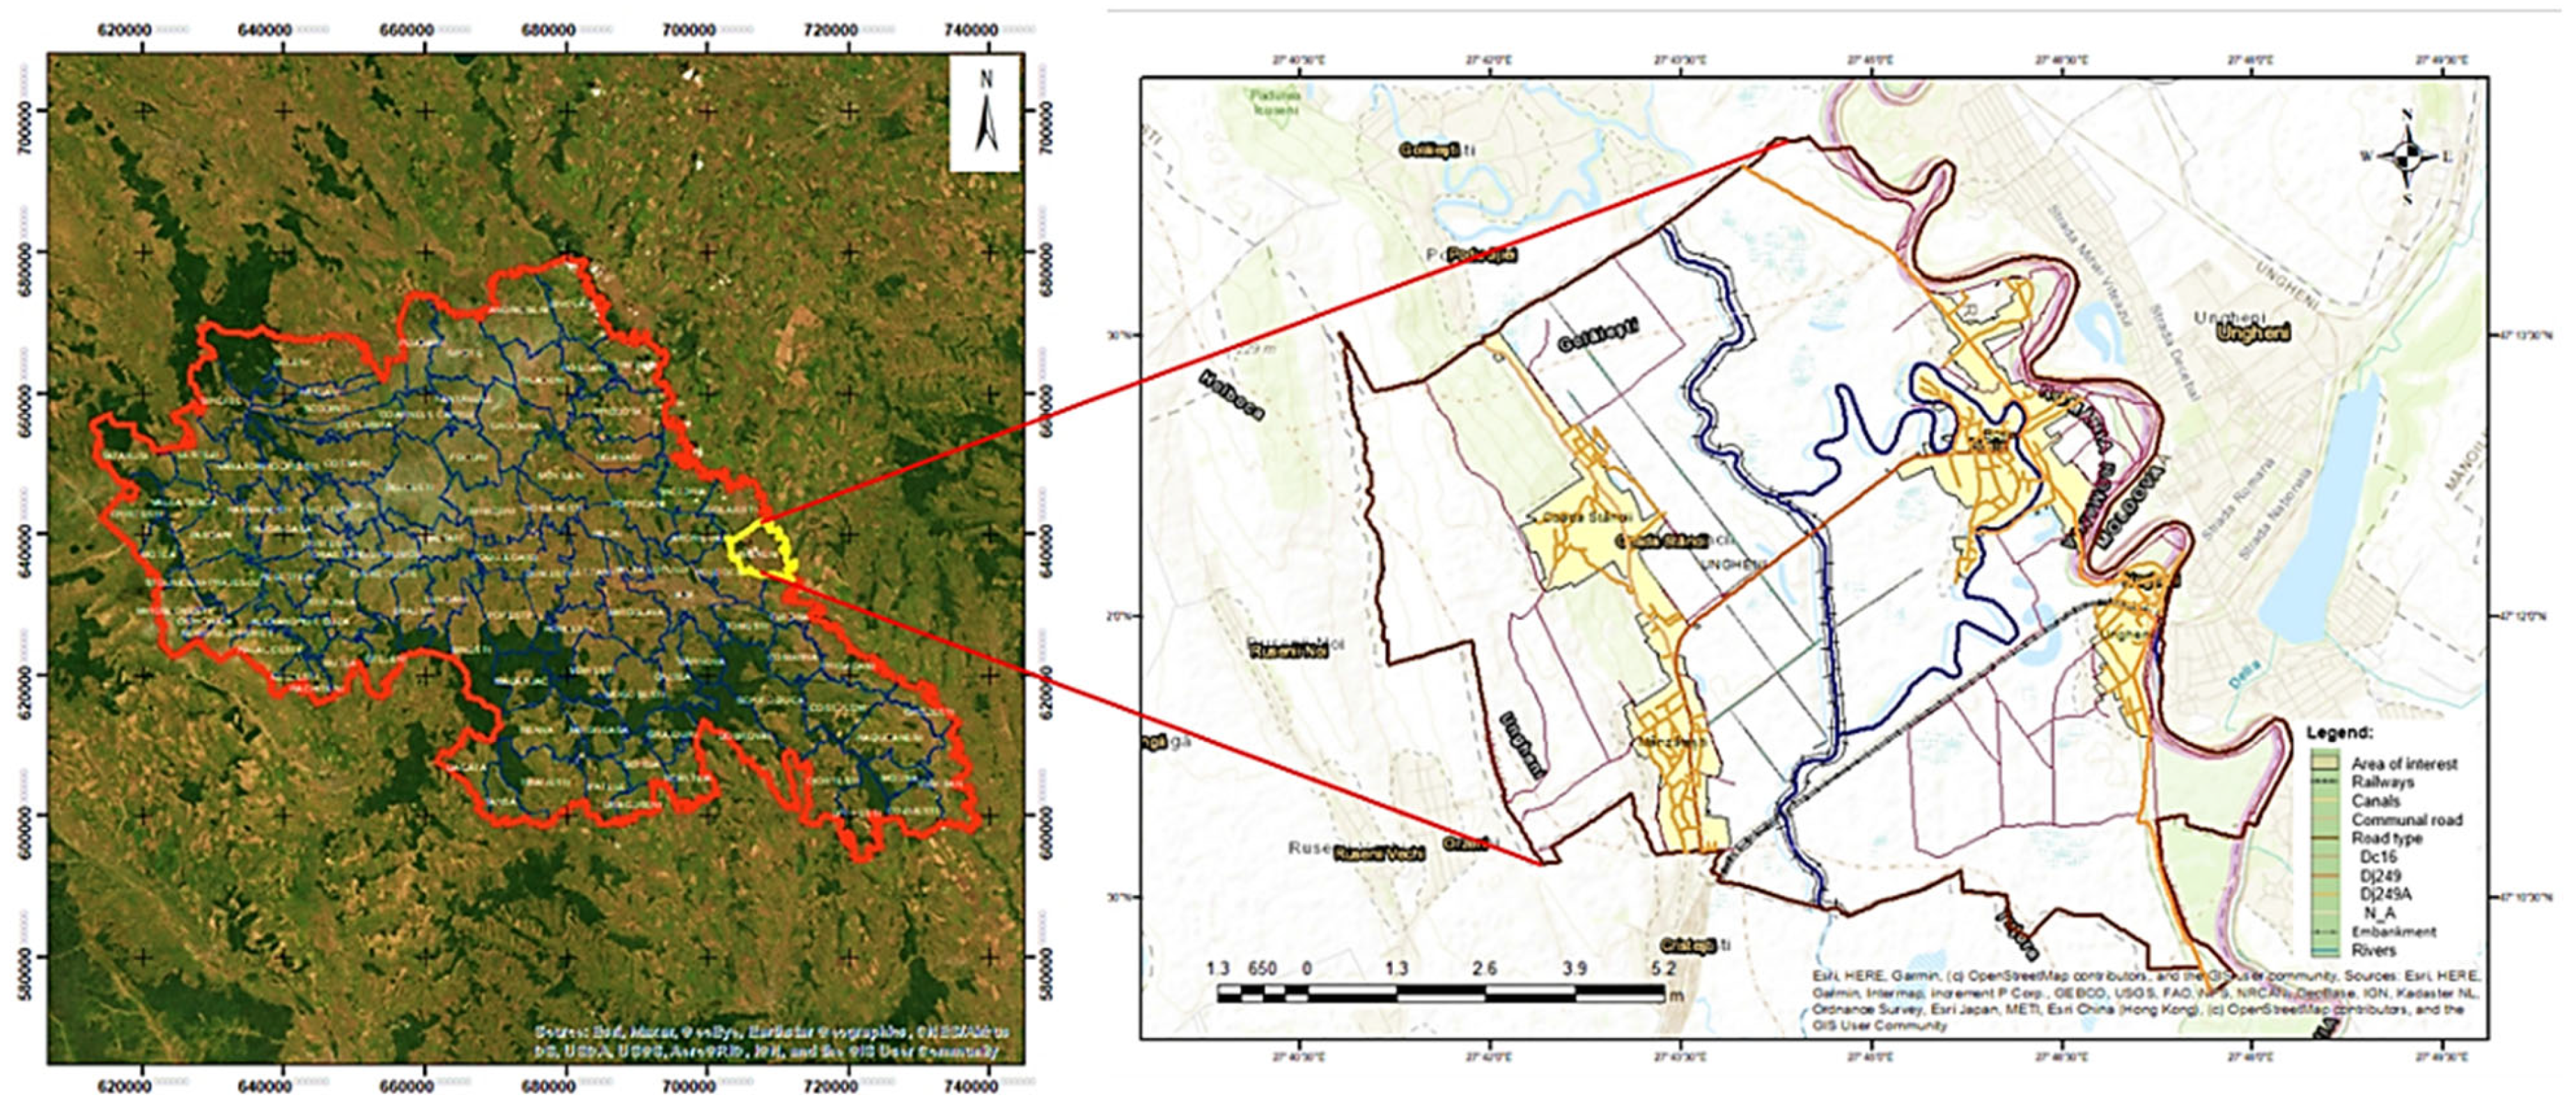
3.1. Study Area
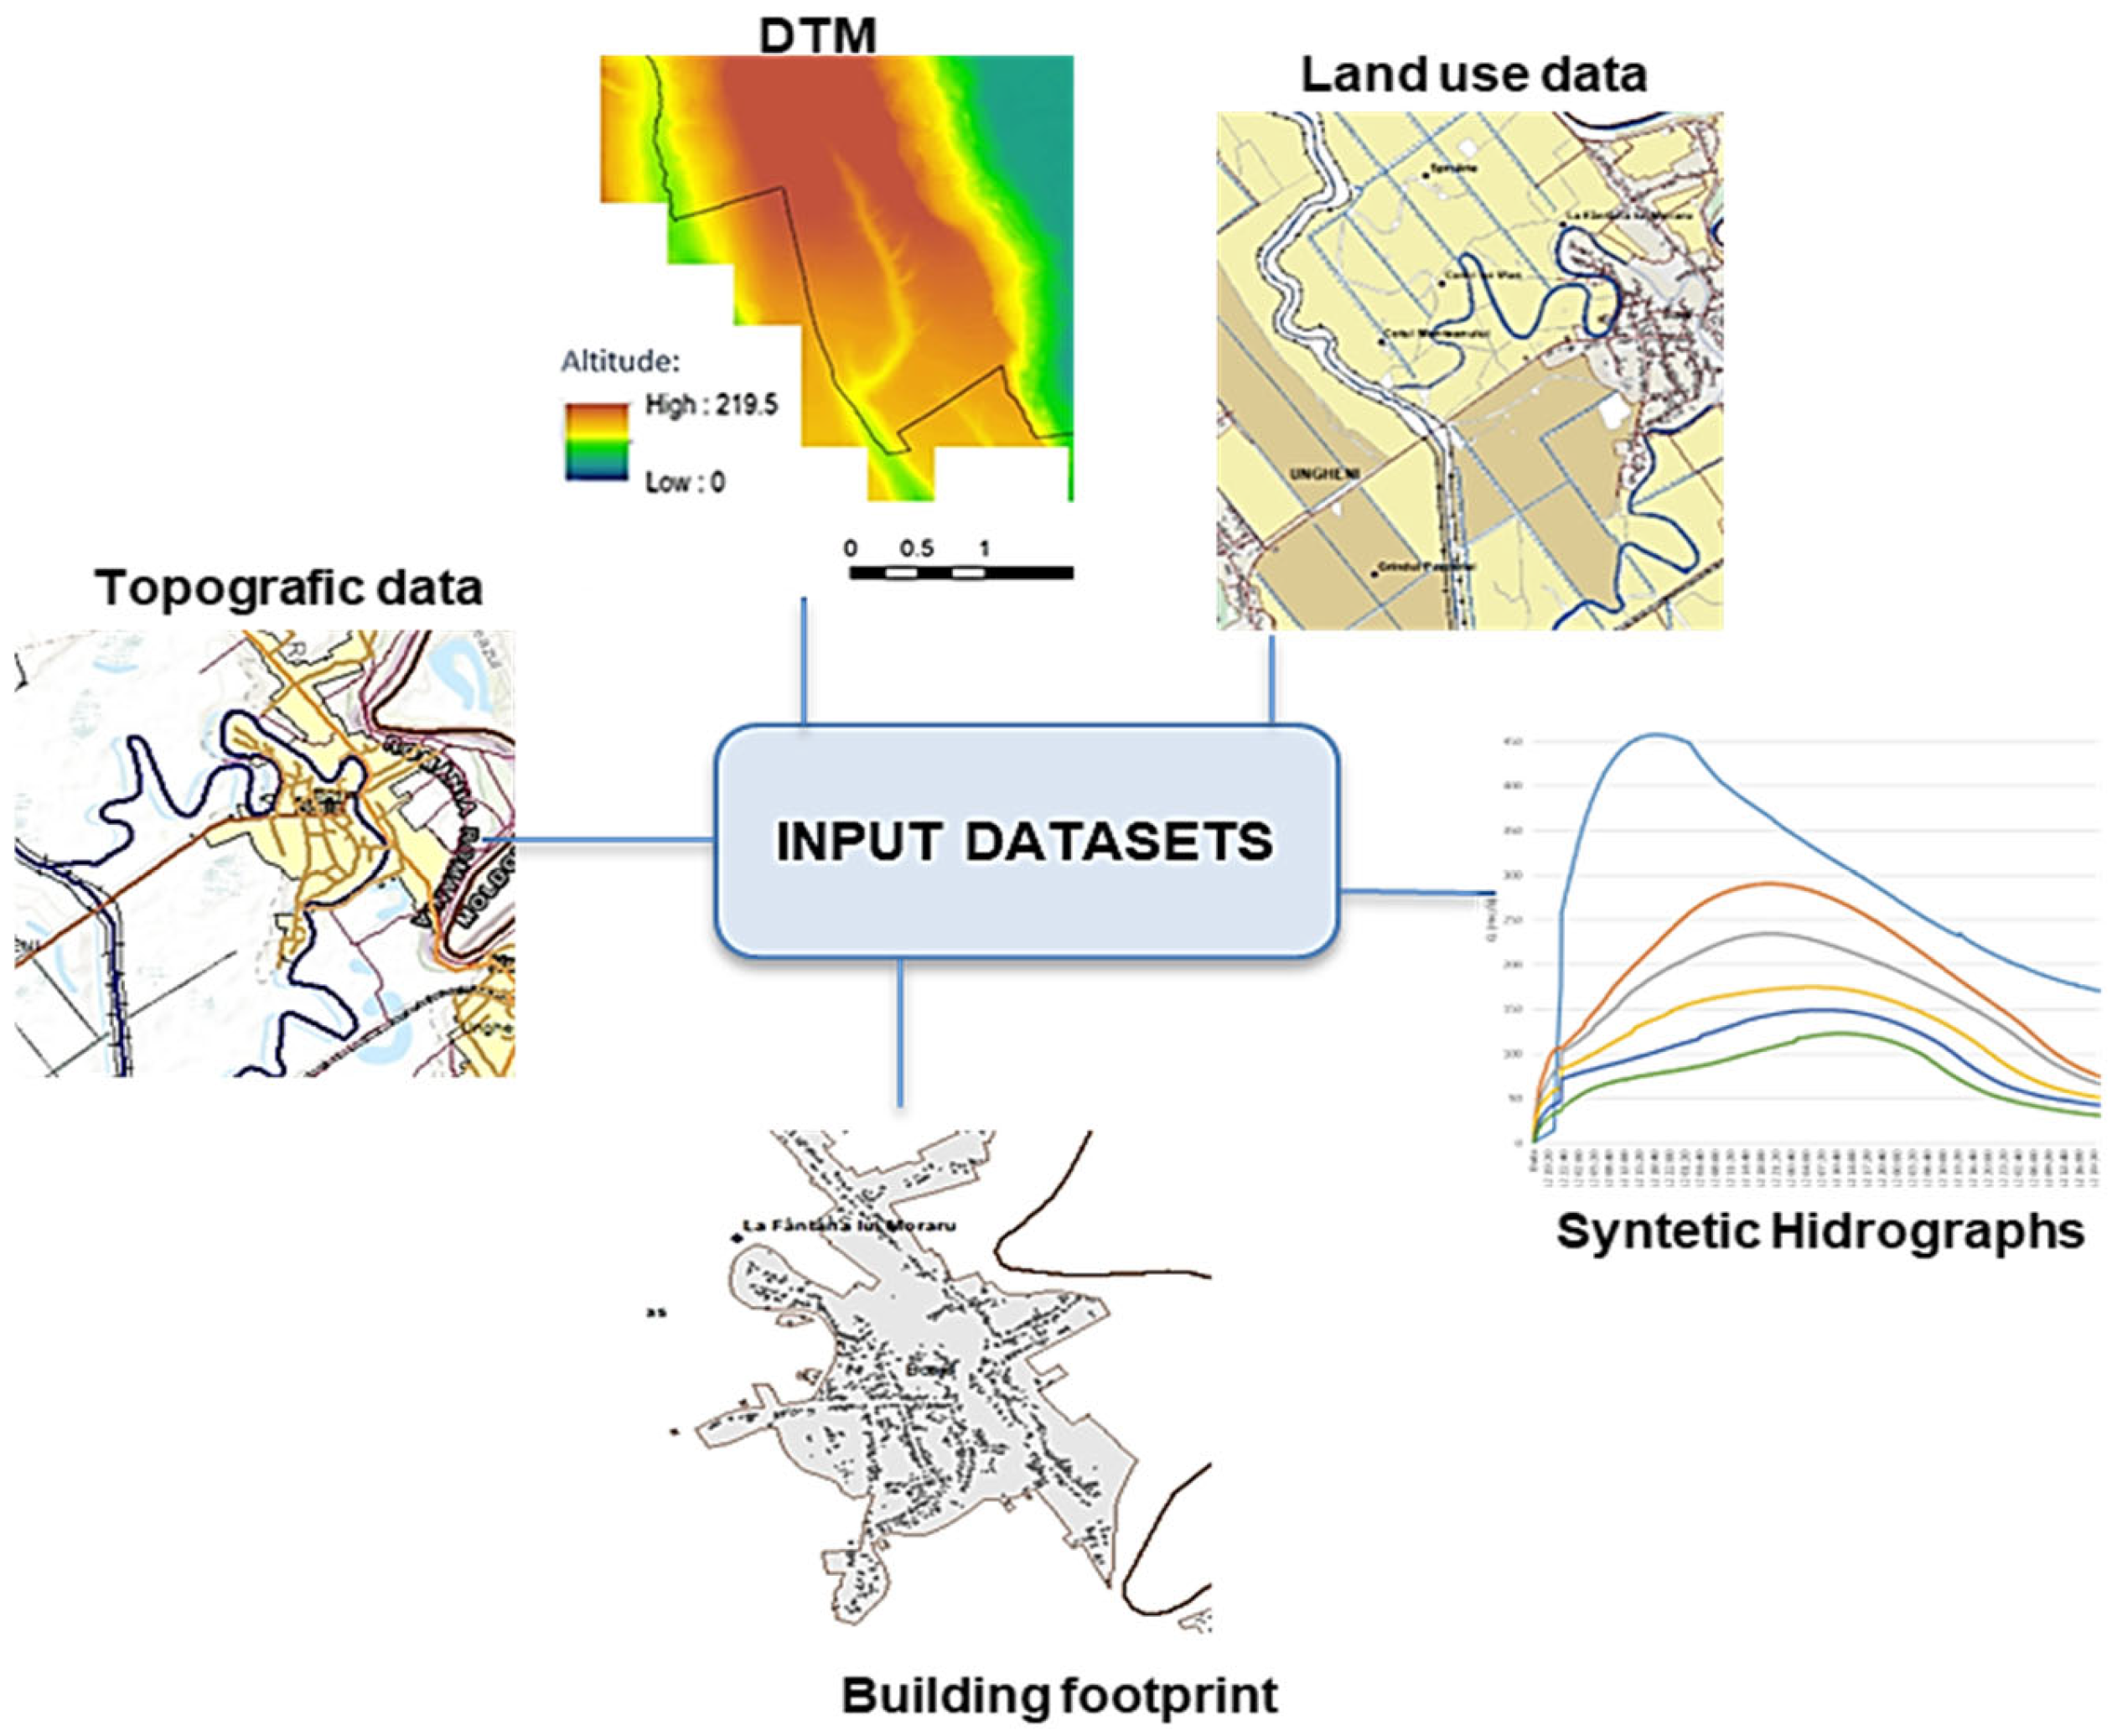
3.2. Input Datasets
- (1)
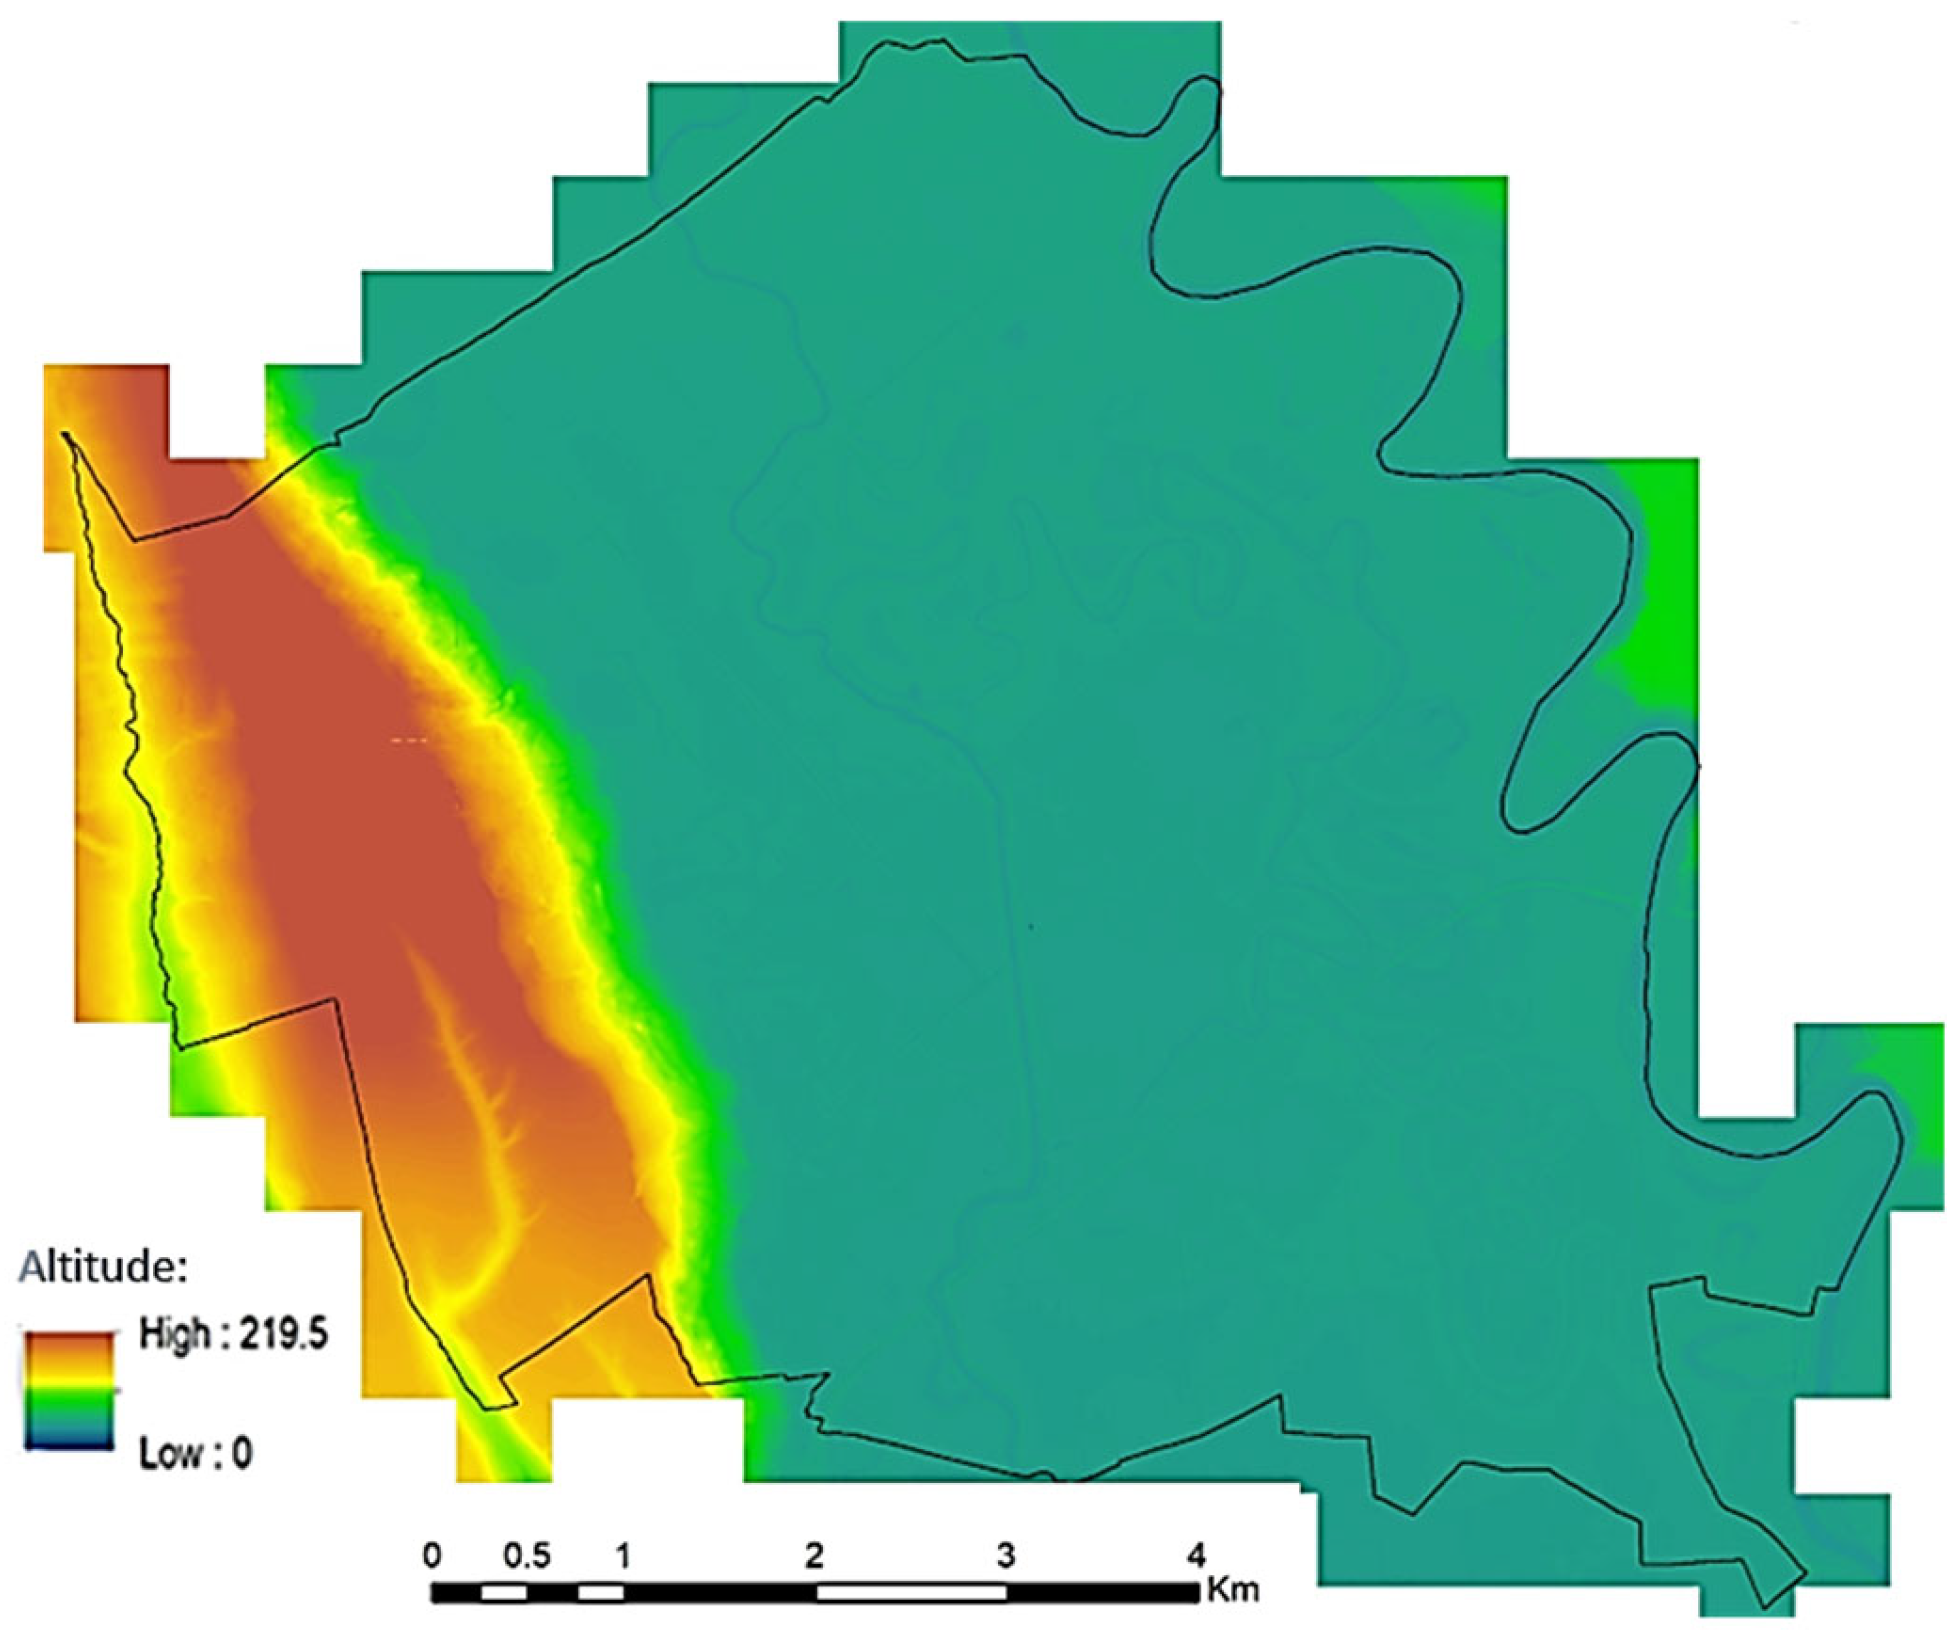
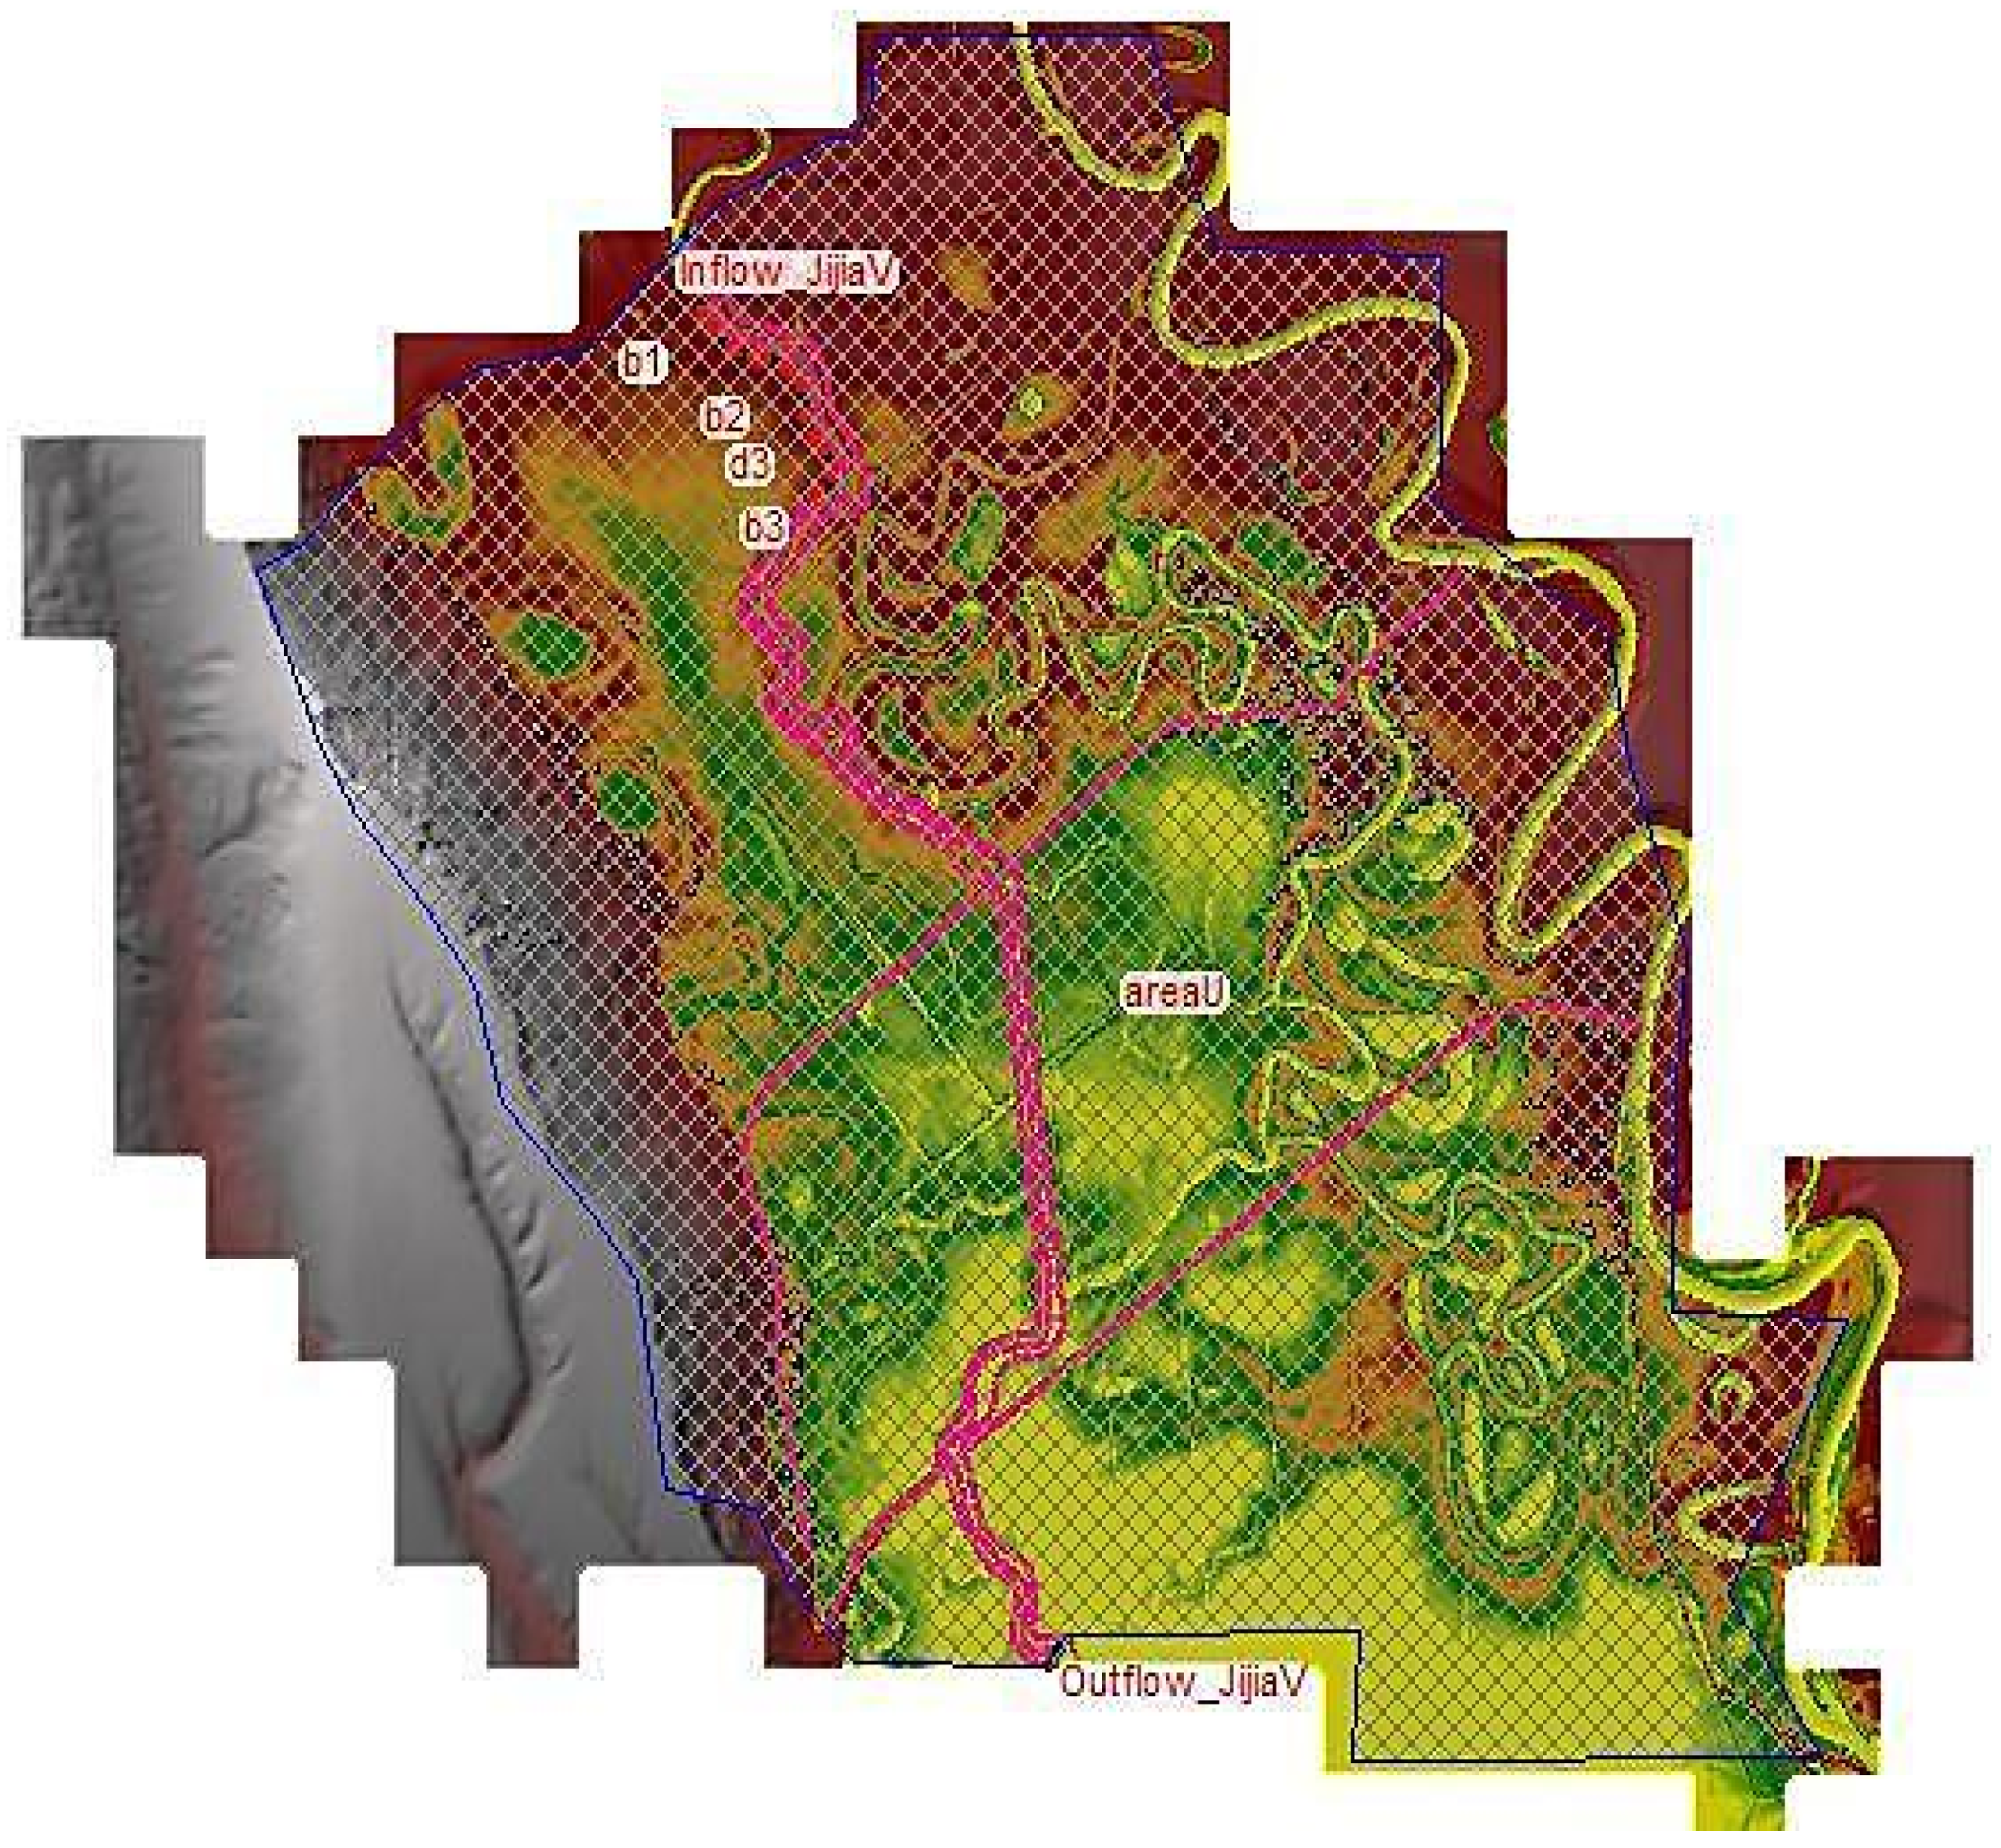
- The main data source for deriving the DTM of the study area is represented by an Airborne Laser Scanning (ALS) dataset acquired in 2012 with the LEICA ALS 70 sensor and a wavelength of 1064 nm, for modeling flood hazard and risk maps in the Prut-Bârlad hydrographic basin according to European Directive 60/2007. These LiDAR data were reused in the present study and specifically processed to obtain the DTM on which the hydraulic model in HEC-RAS was based. The LiDAR strips have an average length of 45 km and a width between 1.5 km and 2.0 km, these specific dimensional parameters being required for precision reasons, taking into account the use of IMU inertial systems. The rectangular plane coordinates were calculated in the WGS84 Universal Transverse Mercator System zone 35N, and the altitudes in the WGS84 ellipsoidal reference system. The spatial resolution of the scan is 1 point/4 m2, and in the overlapping areas between strips, it reaches 1 point/2 m2. The use of airborne LiDAR technology in hydrological and hydraulic modeling is the best option since the altimetric precision is superior to the planimetric precision [49].
- (2)
- In this study, we also employed topographic data comprising the river network, road network, railways, and delineation of the study area, as well as defensive structures. We accurately delineated the last using vectorization techniques based on the high-resolution digital terrain model (1 × 1 m), with a vertical accuracy of 10 cm.For computational efficiency, a variable 2D mesh was applied: 2 × 2 m cells for critical features (minor channels, roads, levees) and 8 × 8 m cells in less sensitive floodplain areas. This ensures accurate representation of narrow features while keeping computation times manageable.
- (3)
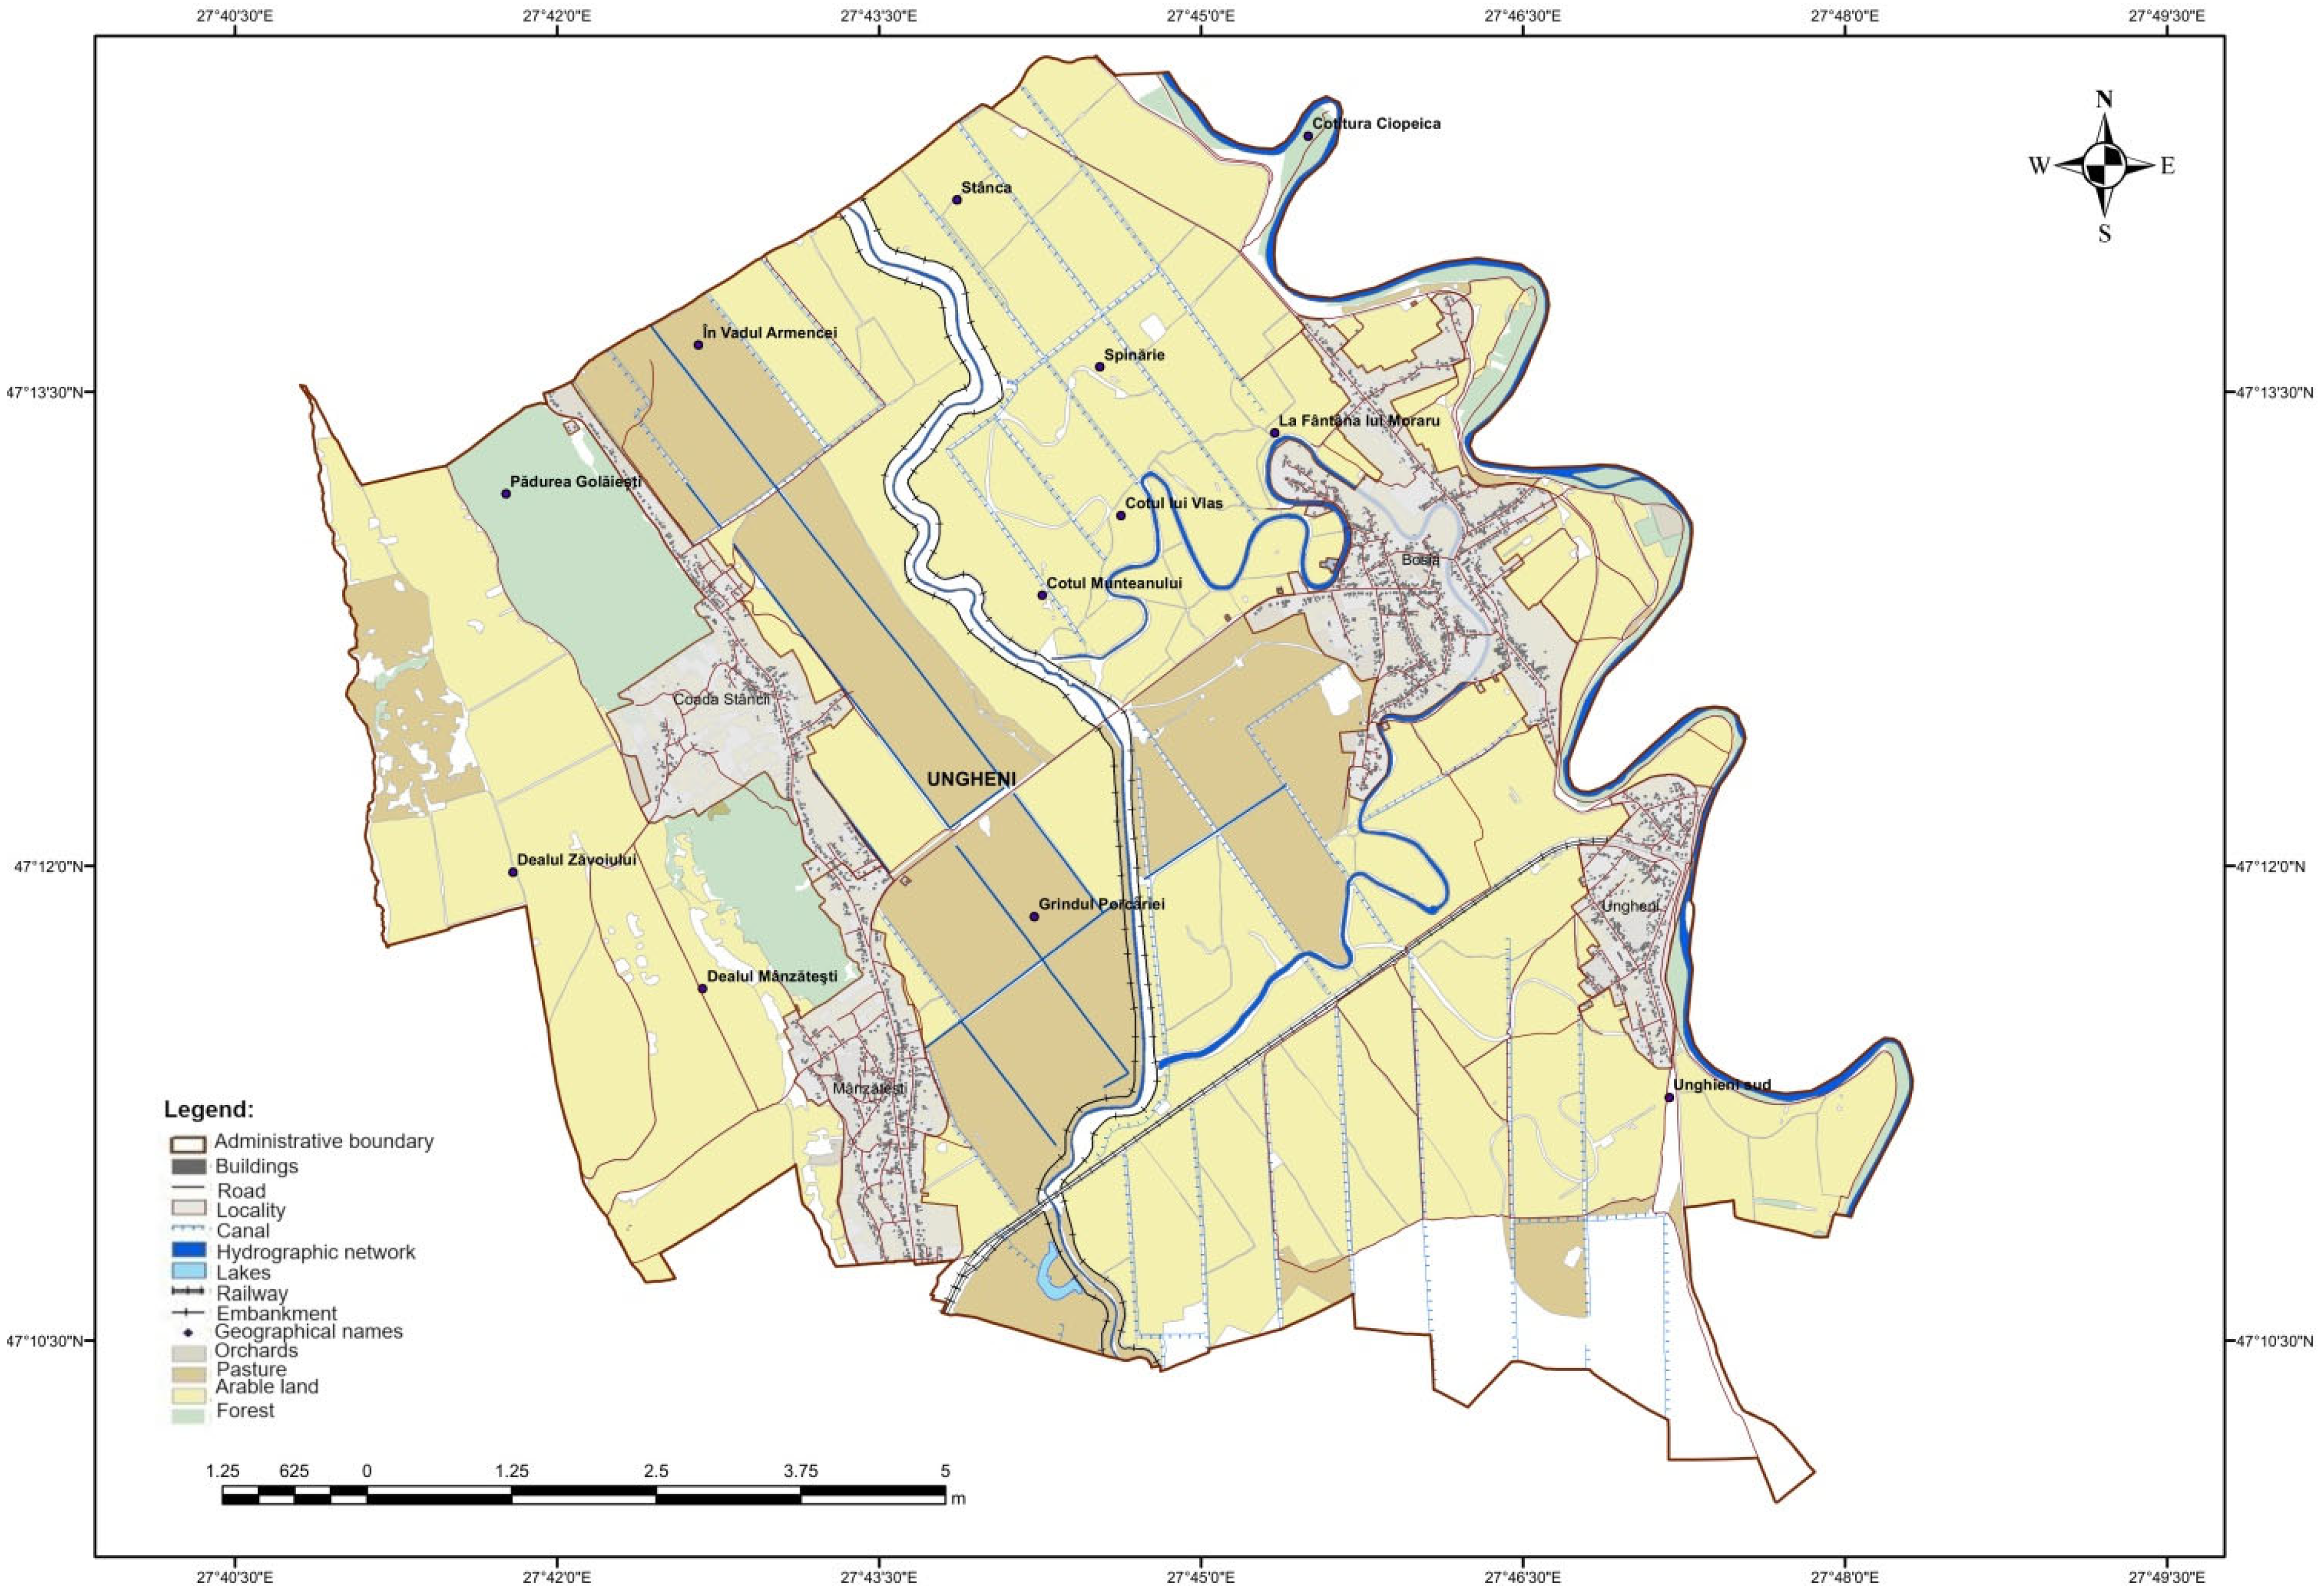
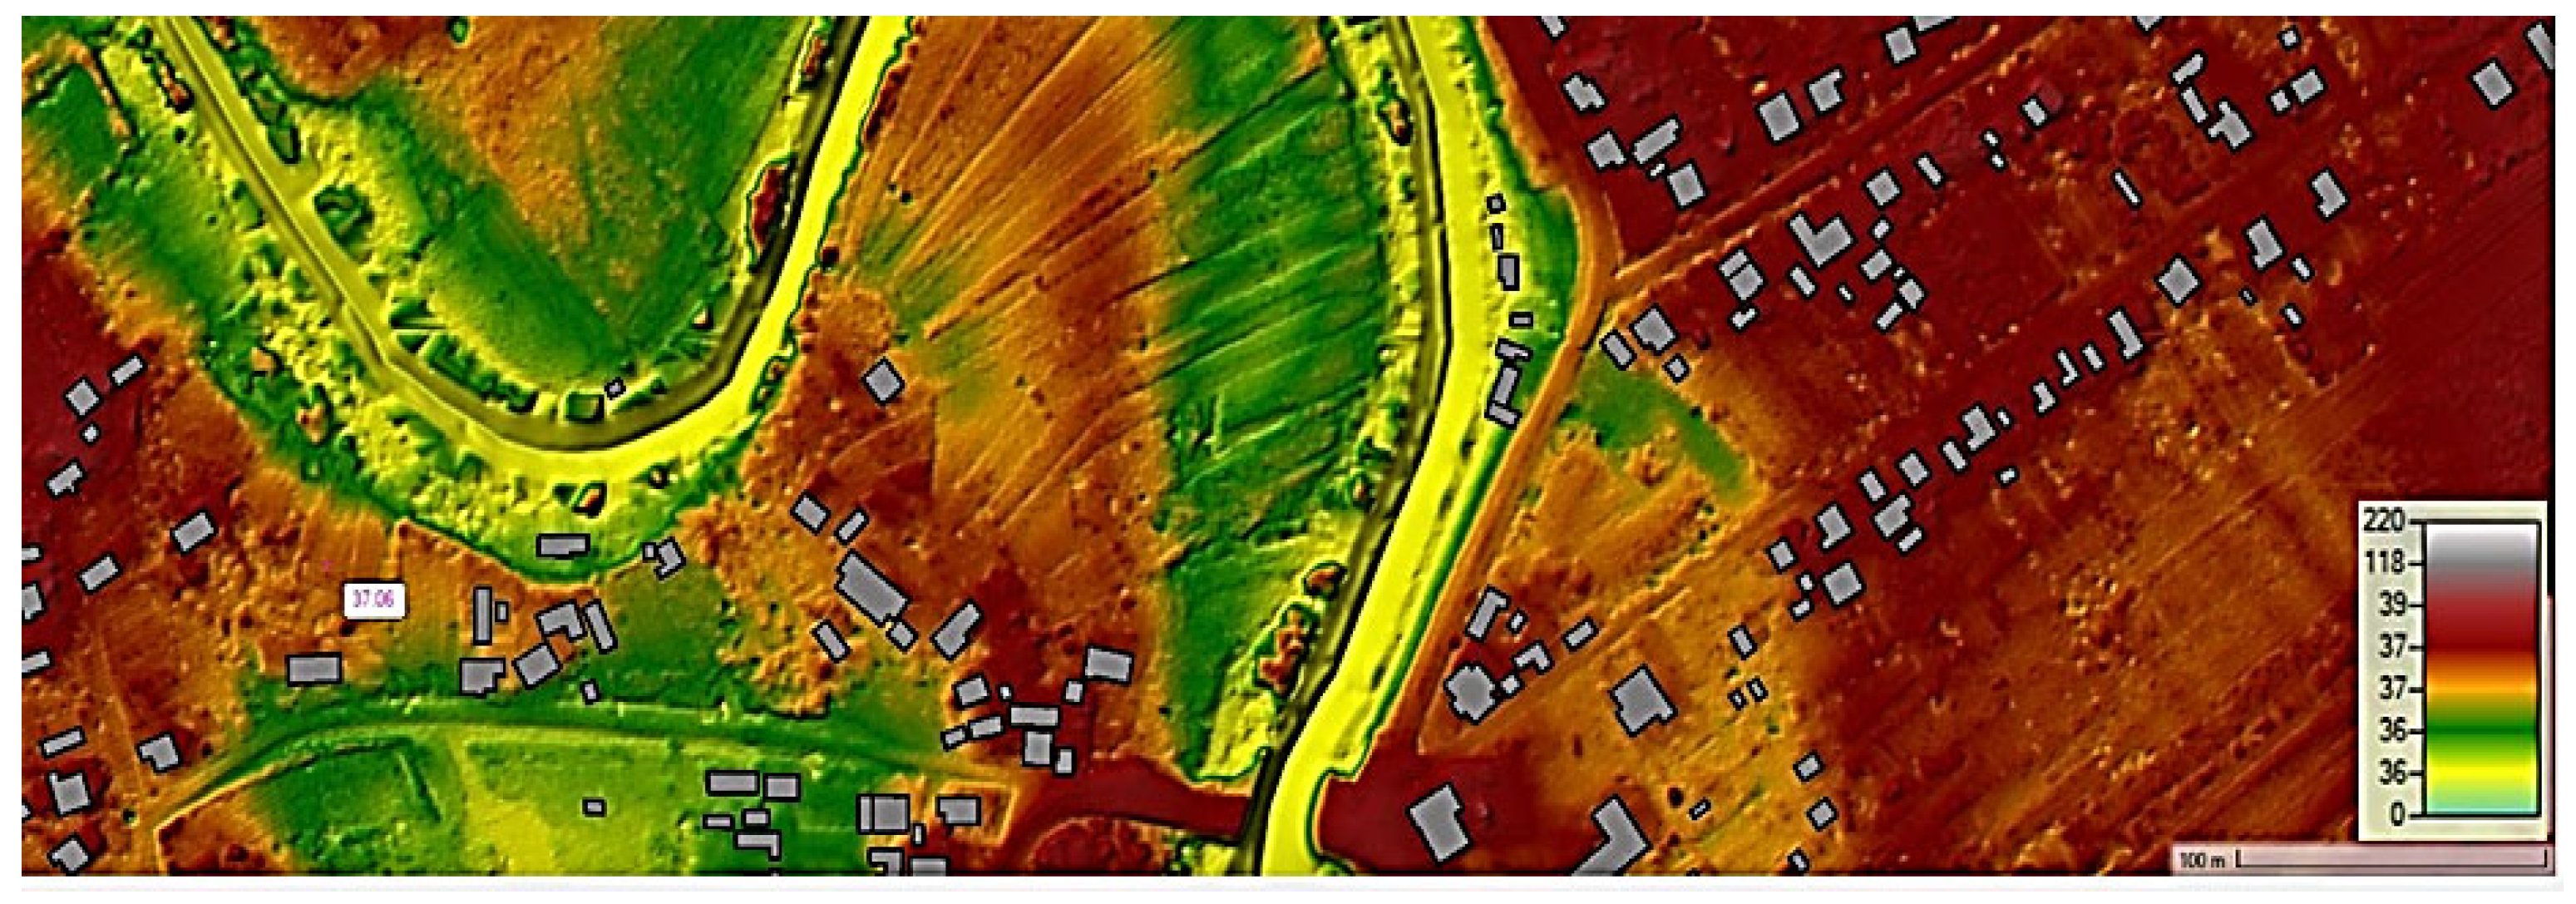
- The building footprint data are sourced from the National Cartography Center (CNC), under the coordination of the National Agency for Cadastre and Land Registration (ANCPI). These georeferenced vector datasets provide accurate building outlines within the study area and are regularly updated to reflect recent urban development. Their integration into hydraulic models enables realistic flood simulations in urban settings and improves flood risk assessments (Figure 4).
- (4)
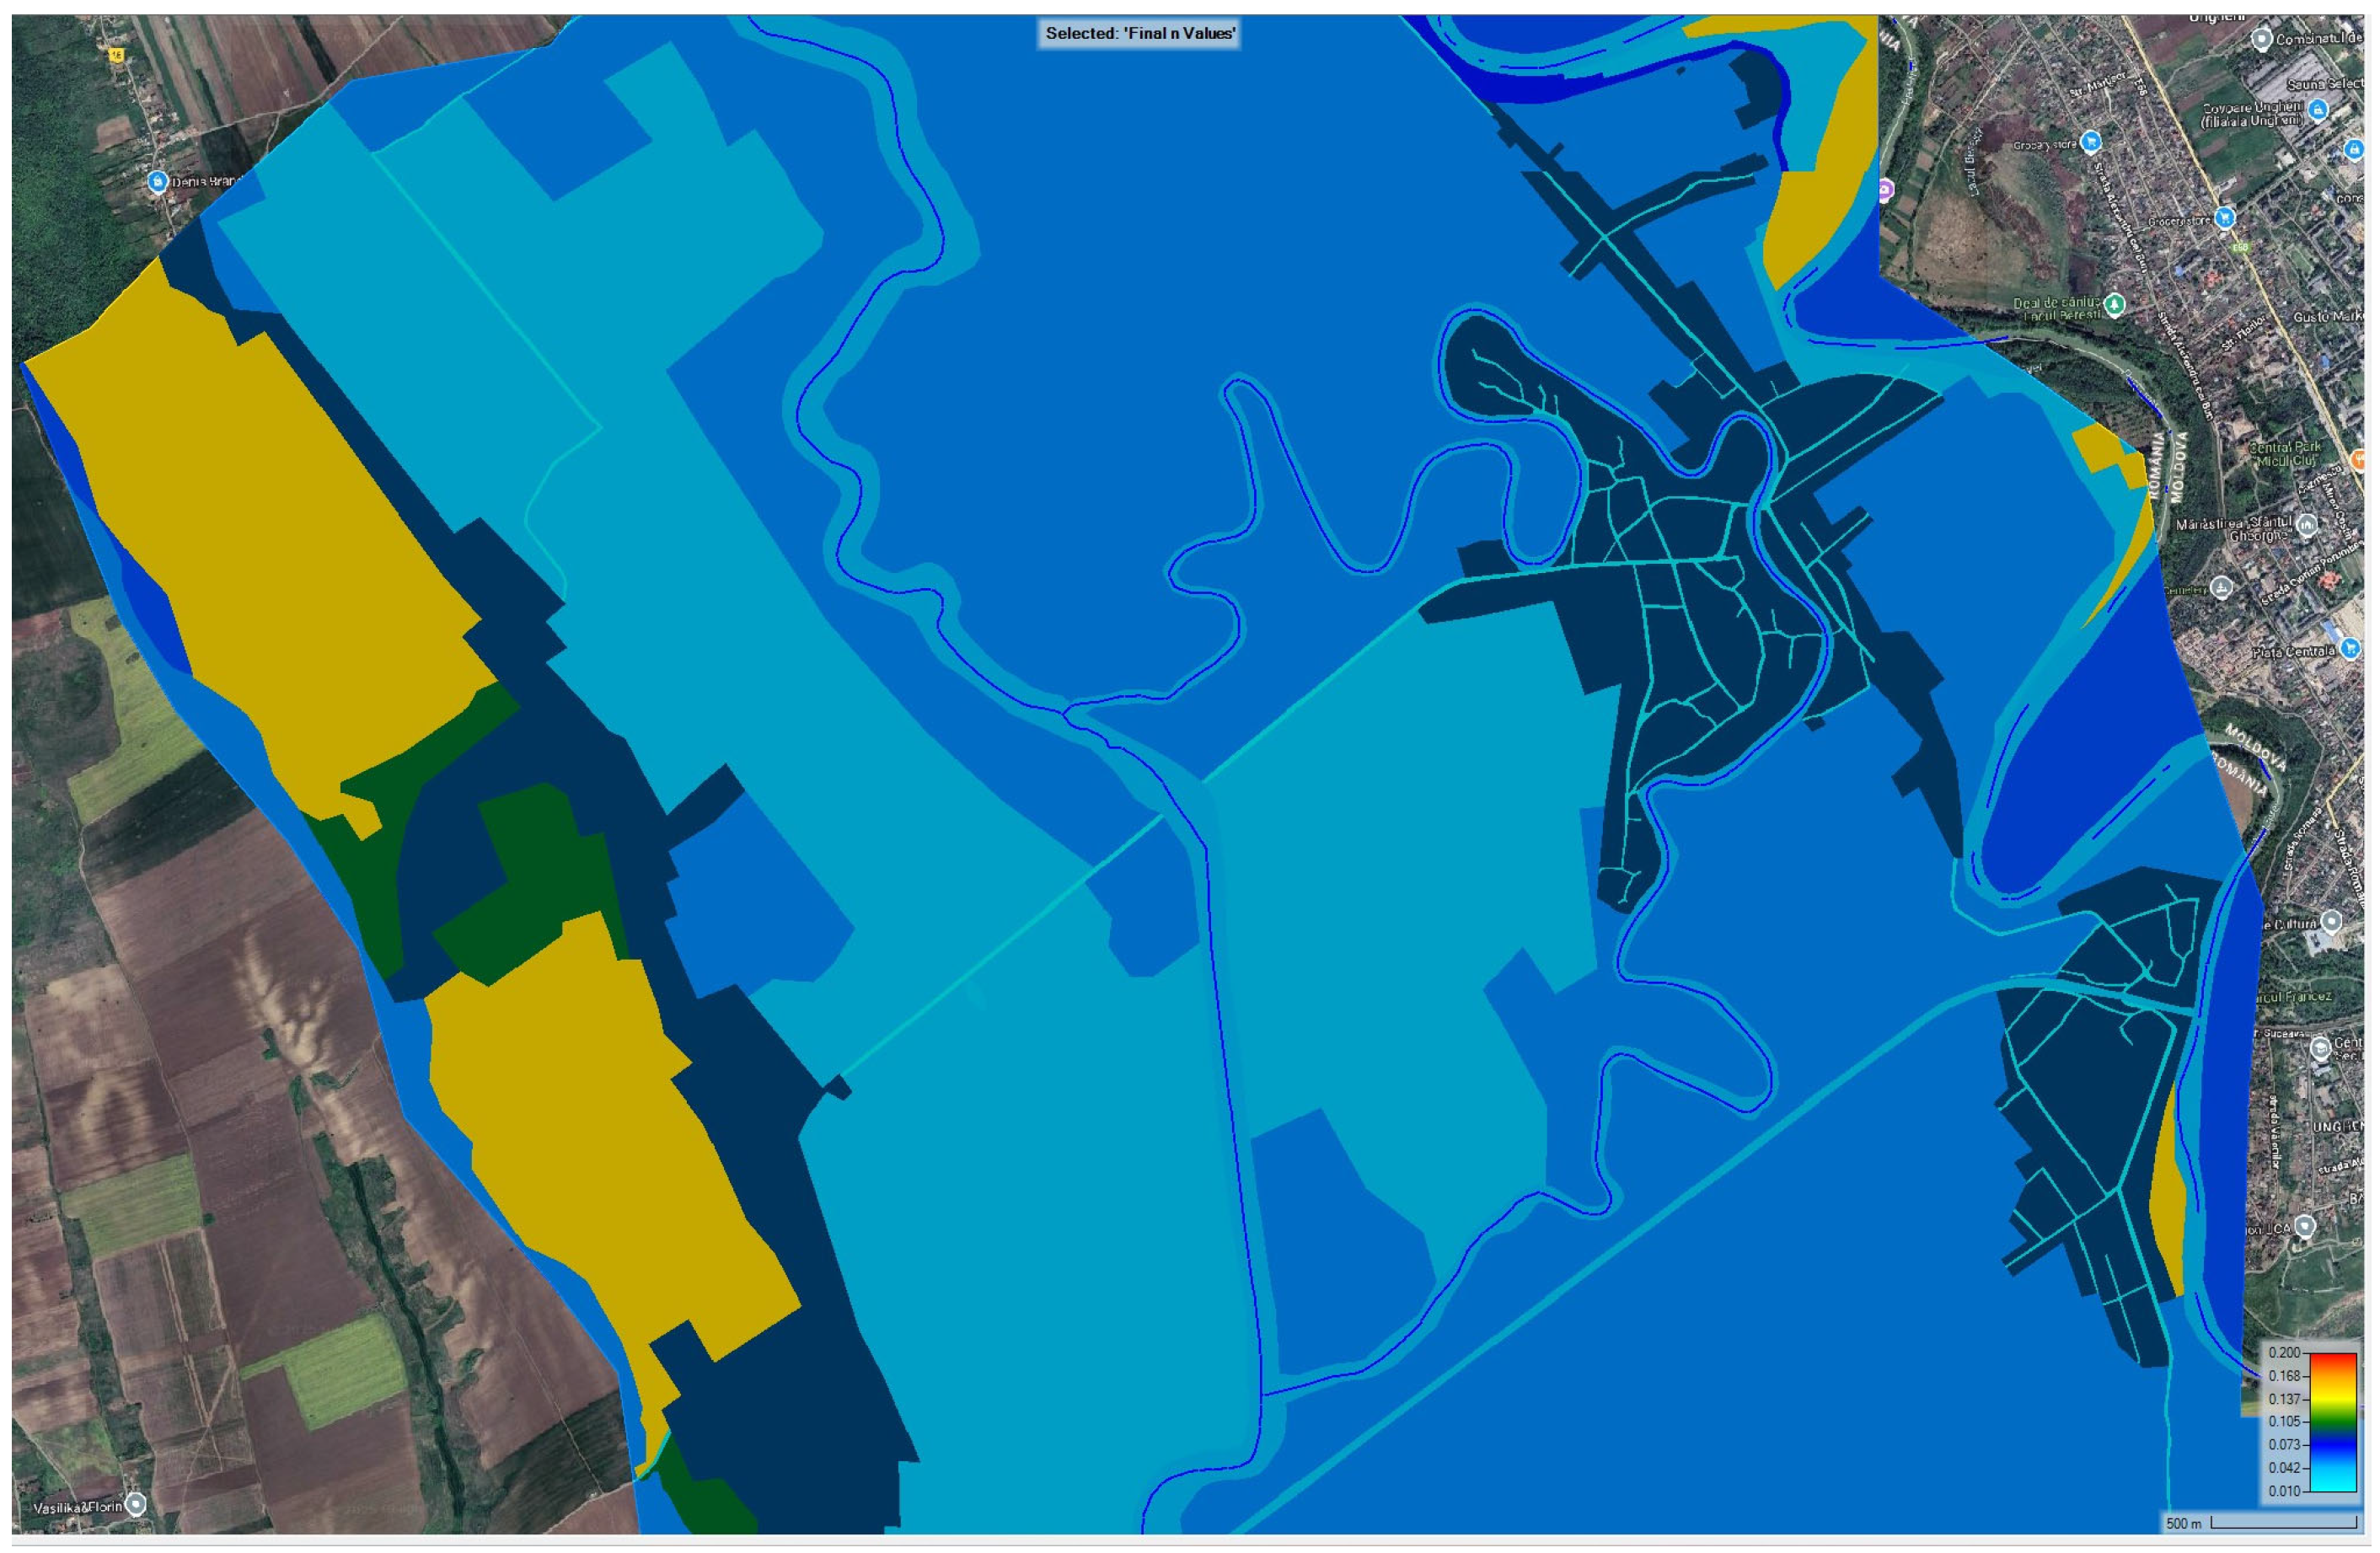
- Land use data represent another important input dataset (see Figure 5). We derived these data from the 2020 color orthophoto plan provided by the National Agency for Cadastre and Land Registration (ANCPI), captured at a scale of 1:5000 and delivered in raster format with a spatial resolution of 50 cm. The data acquisition involved both analog and digital sensors, including the analog ZEISS LMK camera (model RC30) and digital sensors such as the Inertial Measurement Unit (IMU) and Digital Mapping Camera (DMC) with a focal length of 120 mm. Additional ancillary databases from APIA (Agency for Payments and Intervention in Agriculture) were used to support land use classification. These land use data were subsequently employed to estimate surface parameters relevant for hydraulic modeling, such as Manning’s roughness coefficients.
- (5)
- Another input dataset represented by the climatology data, including precipitation and temperature records, was provided by the national meteorological services to inform hydrological inputs and boundary conditions in the modeling process.
4. Proposed Methodology for Data Analysis
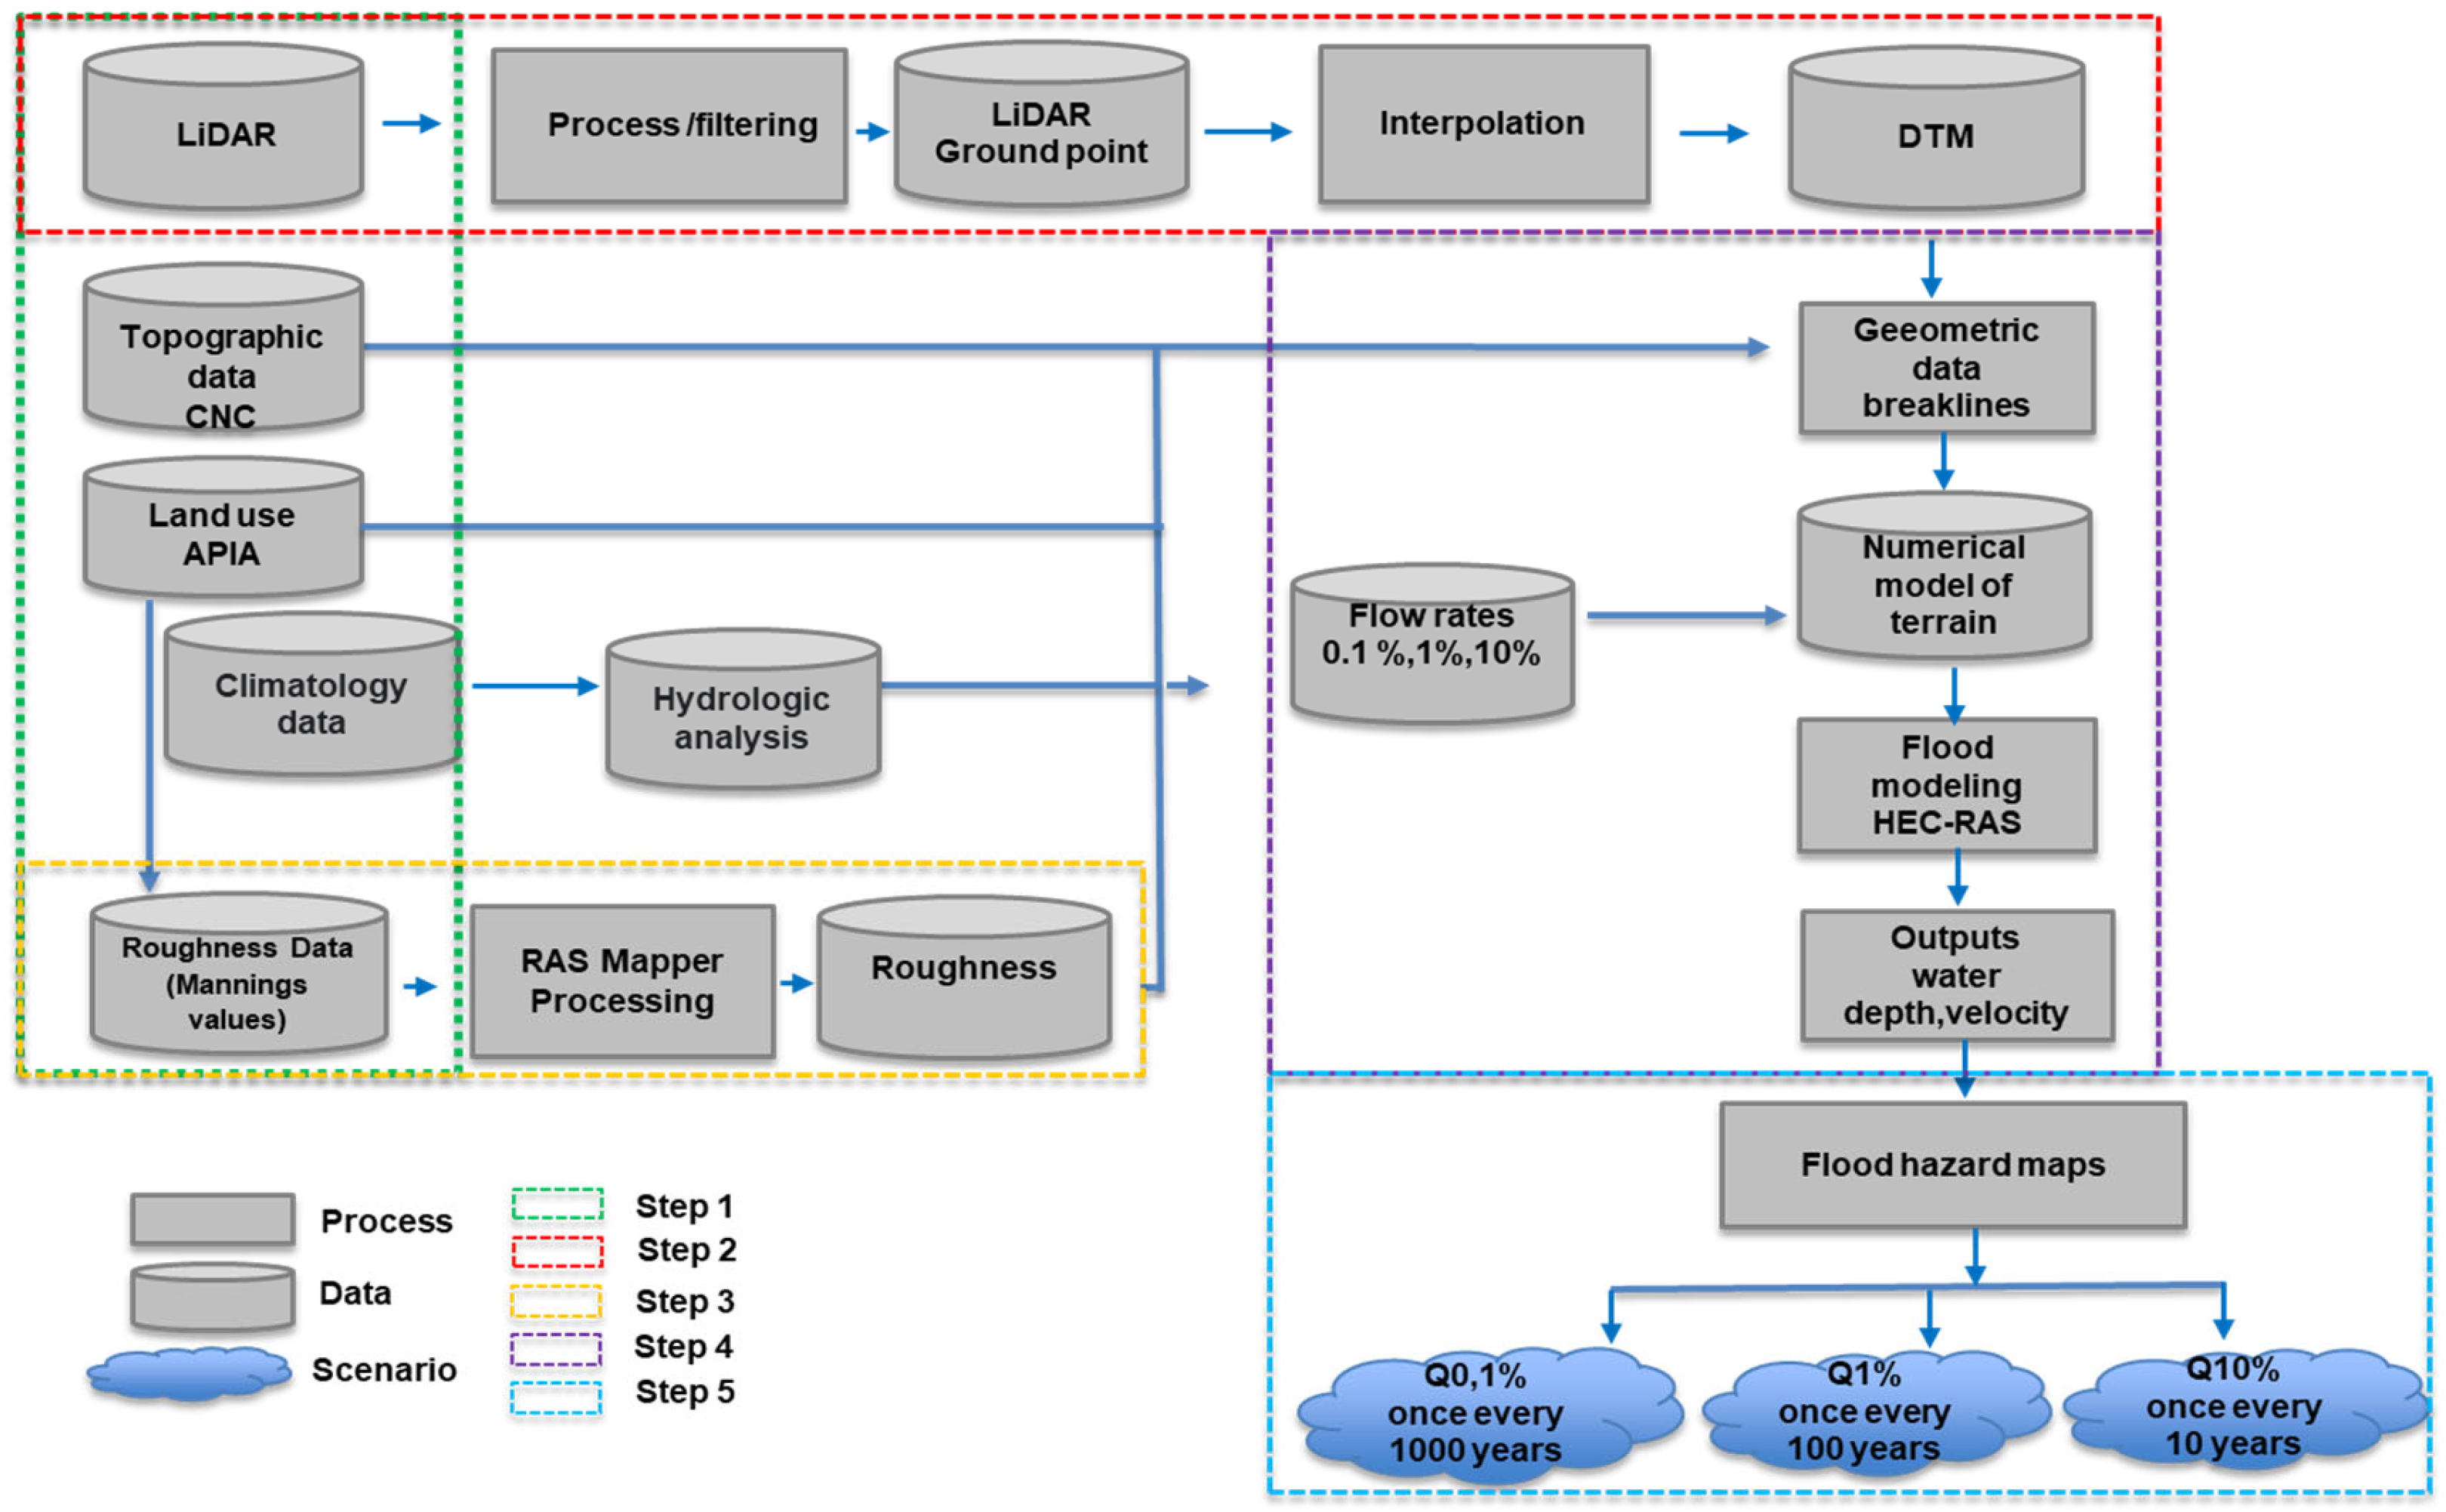
- Step 1: Geospatial data preparation and pre-processing.
- Step 2: Improved DTM derivation.
- Step 3: Derivation of roughness layers.
- Step 4: Hydraulic modeling.
- Step 5: Hazard mapping.
- Q represents the flow in cubic meters per second (m3/s).
- A denotes the flooded area of the transversal section in square meters (m2).
- R signifies the hydraulic radius of the transversal section, calculated as the ratio of A to the wet perimeter (R = A/P)—m2/m.
- P is the wet perimeter of the transversal section—m.
- s is the slope of the water surface—m/m.
- n is Manning’s roughness coefficient—s/m1/3.
- (a)
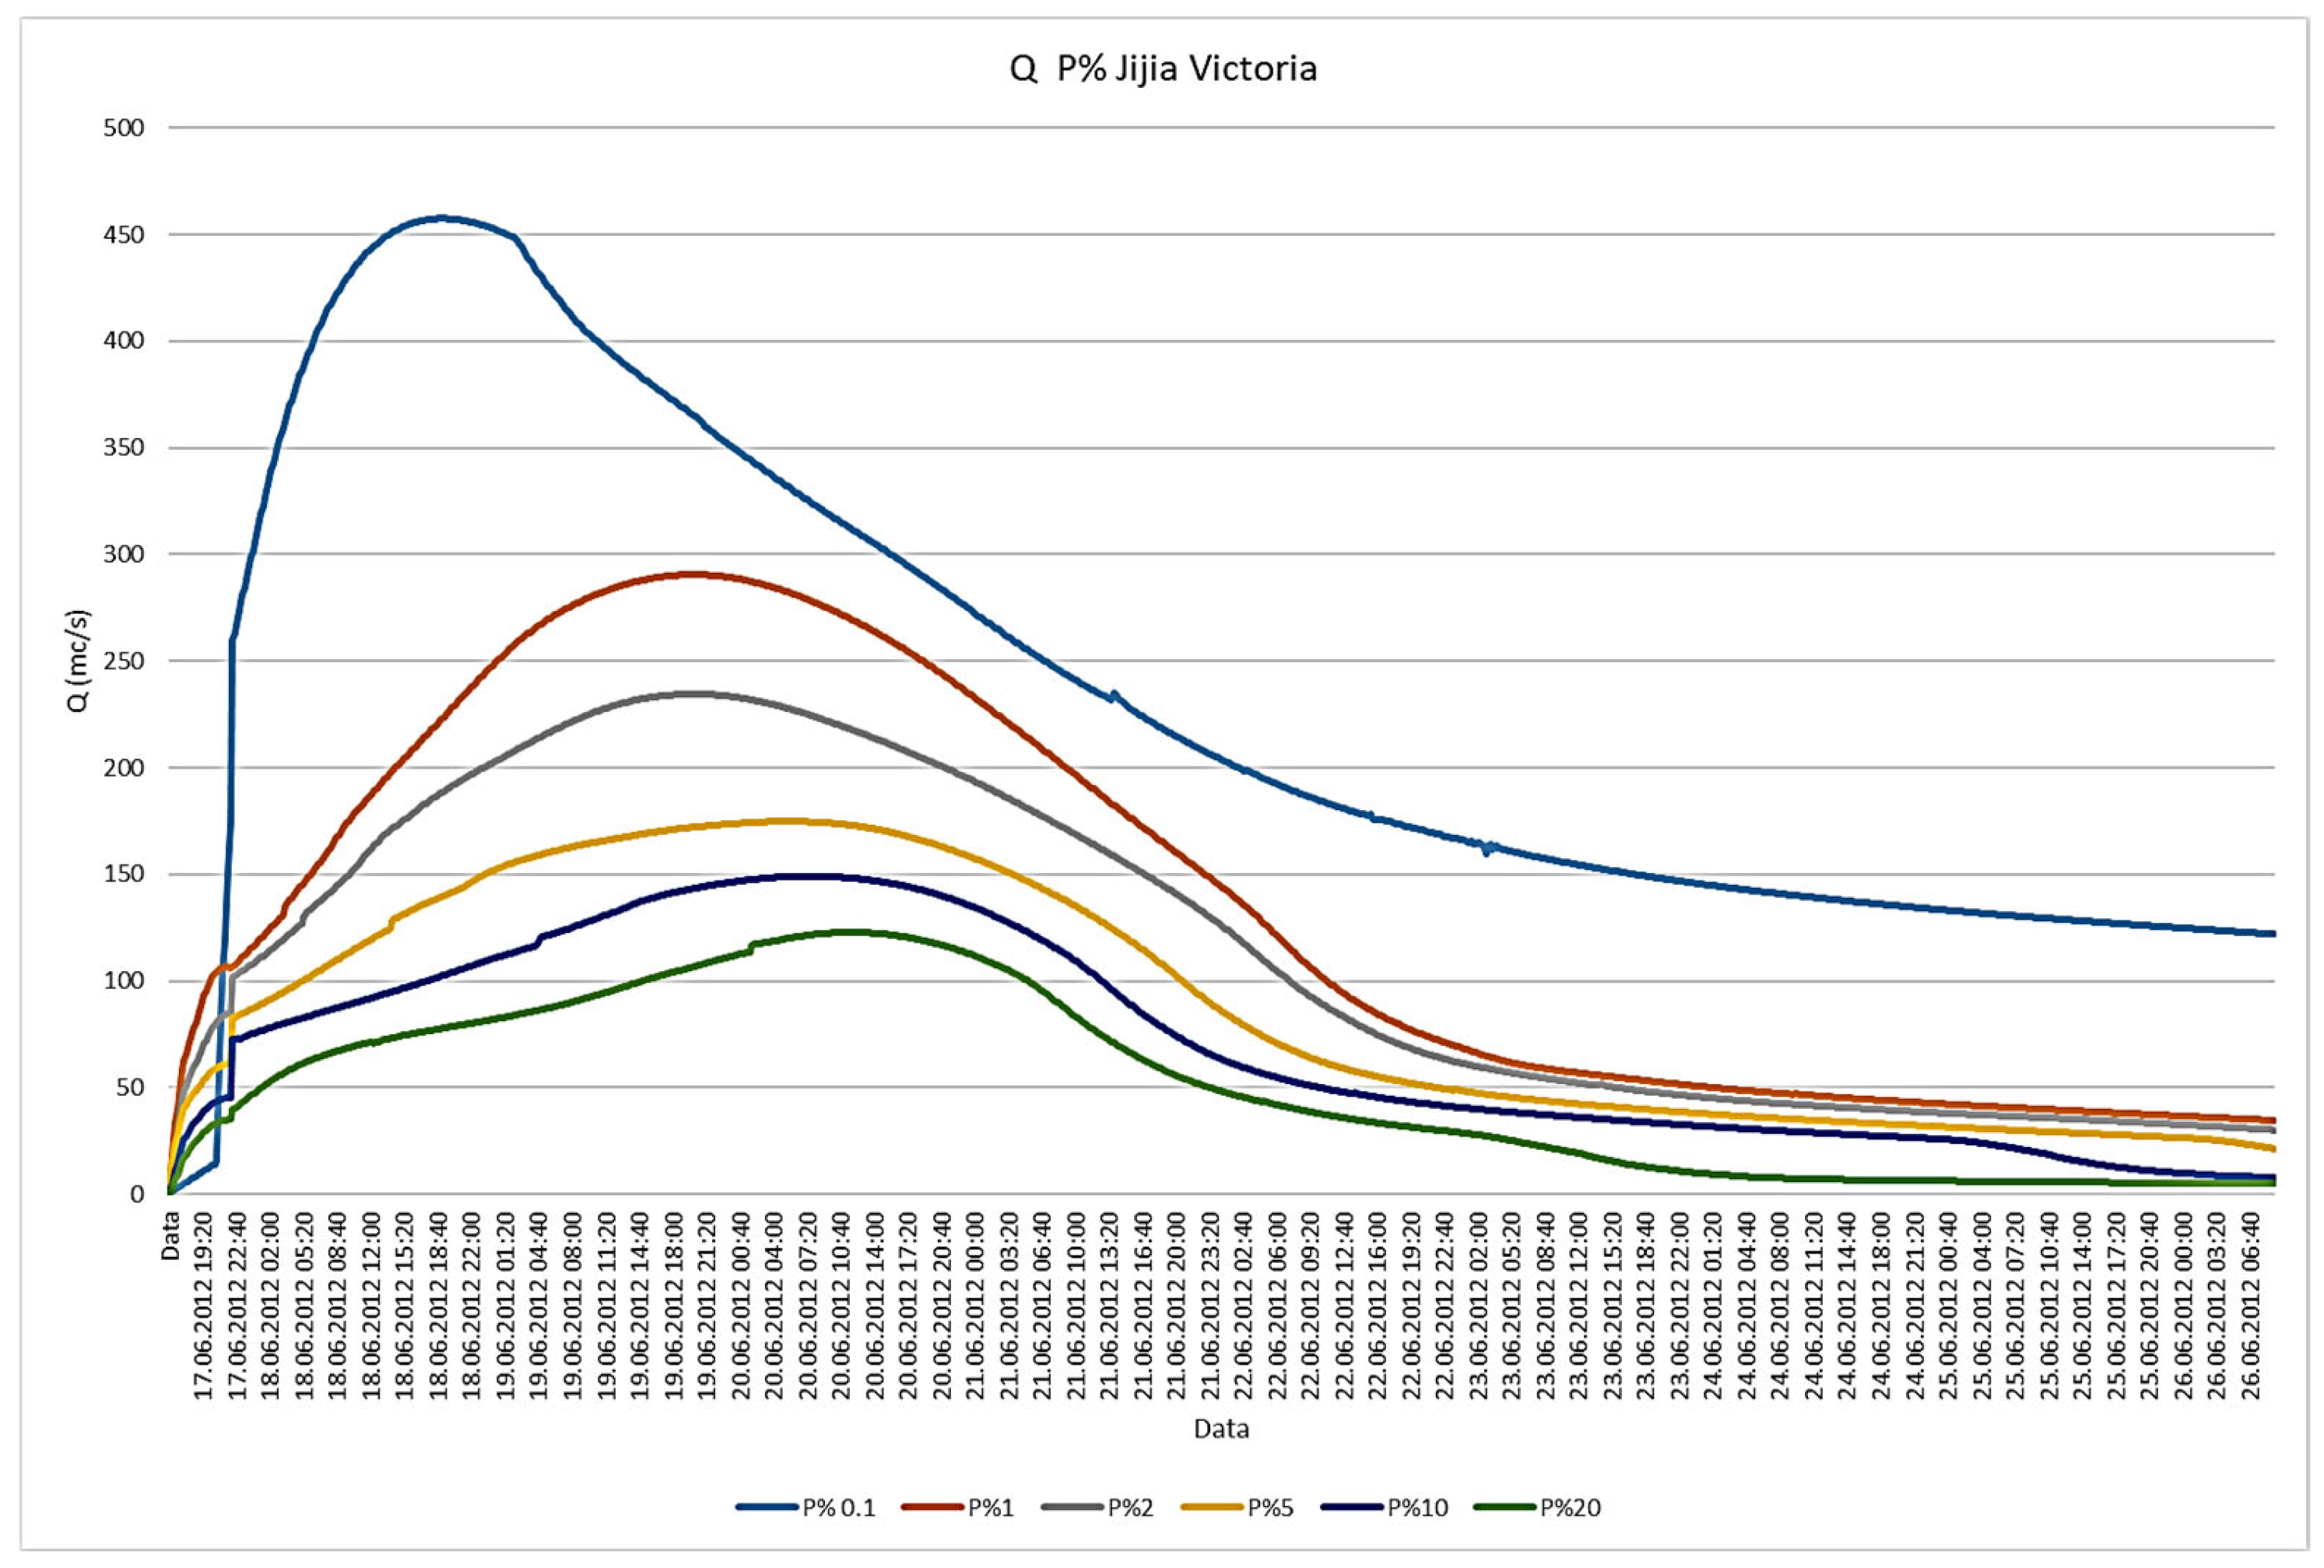
- Upstream (i.e., describes the inflow characteristics at the upper limit of the hydraulic model domain derived from the INHGA synthetic hydrograph).
- (b)
- Downstream Normal Depth condition with a slope of 0.007, applied across the respective boundaries of the 2D domain (i.e., the outflow behavior at the lower end of the model domain).
- (a)
- Upstream condition:
- (b)
- Downstream condition:
5. Results and Discussion
5.1. Improved DTM Derivation
5.2. Roughness Coefficient Estimation
5.3. Hydraulic Modeling Results
5.4. Model Calibration and Scenario Predictions
5.5. Extraction of Results: Types, Generation, Storage, and Processing
- ‑
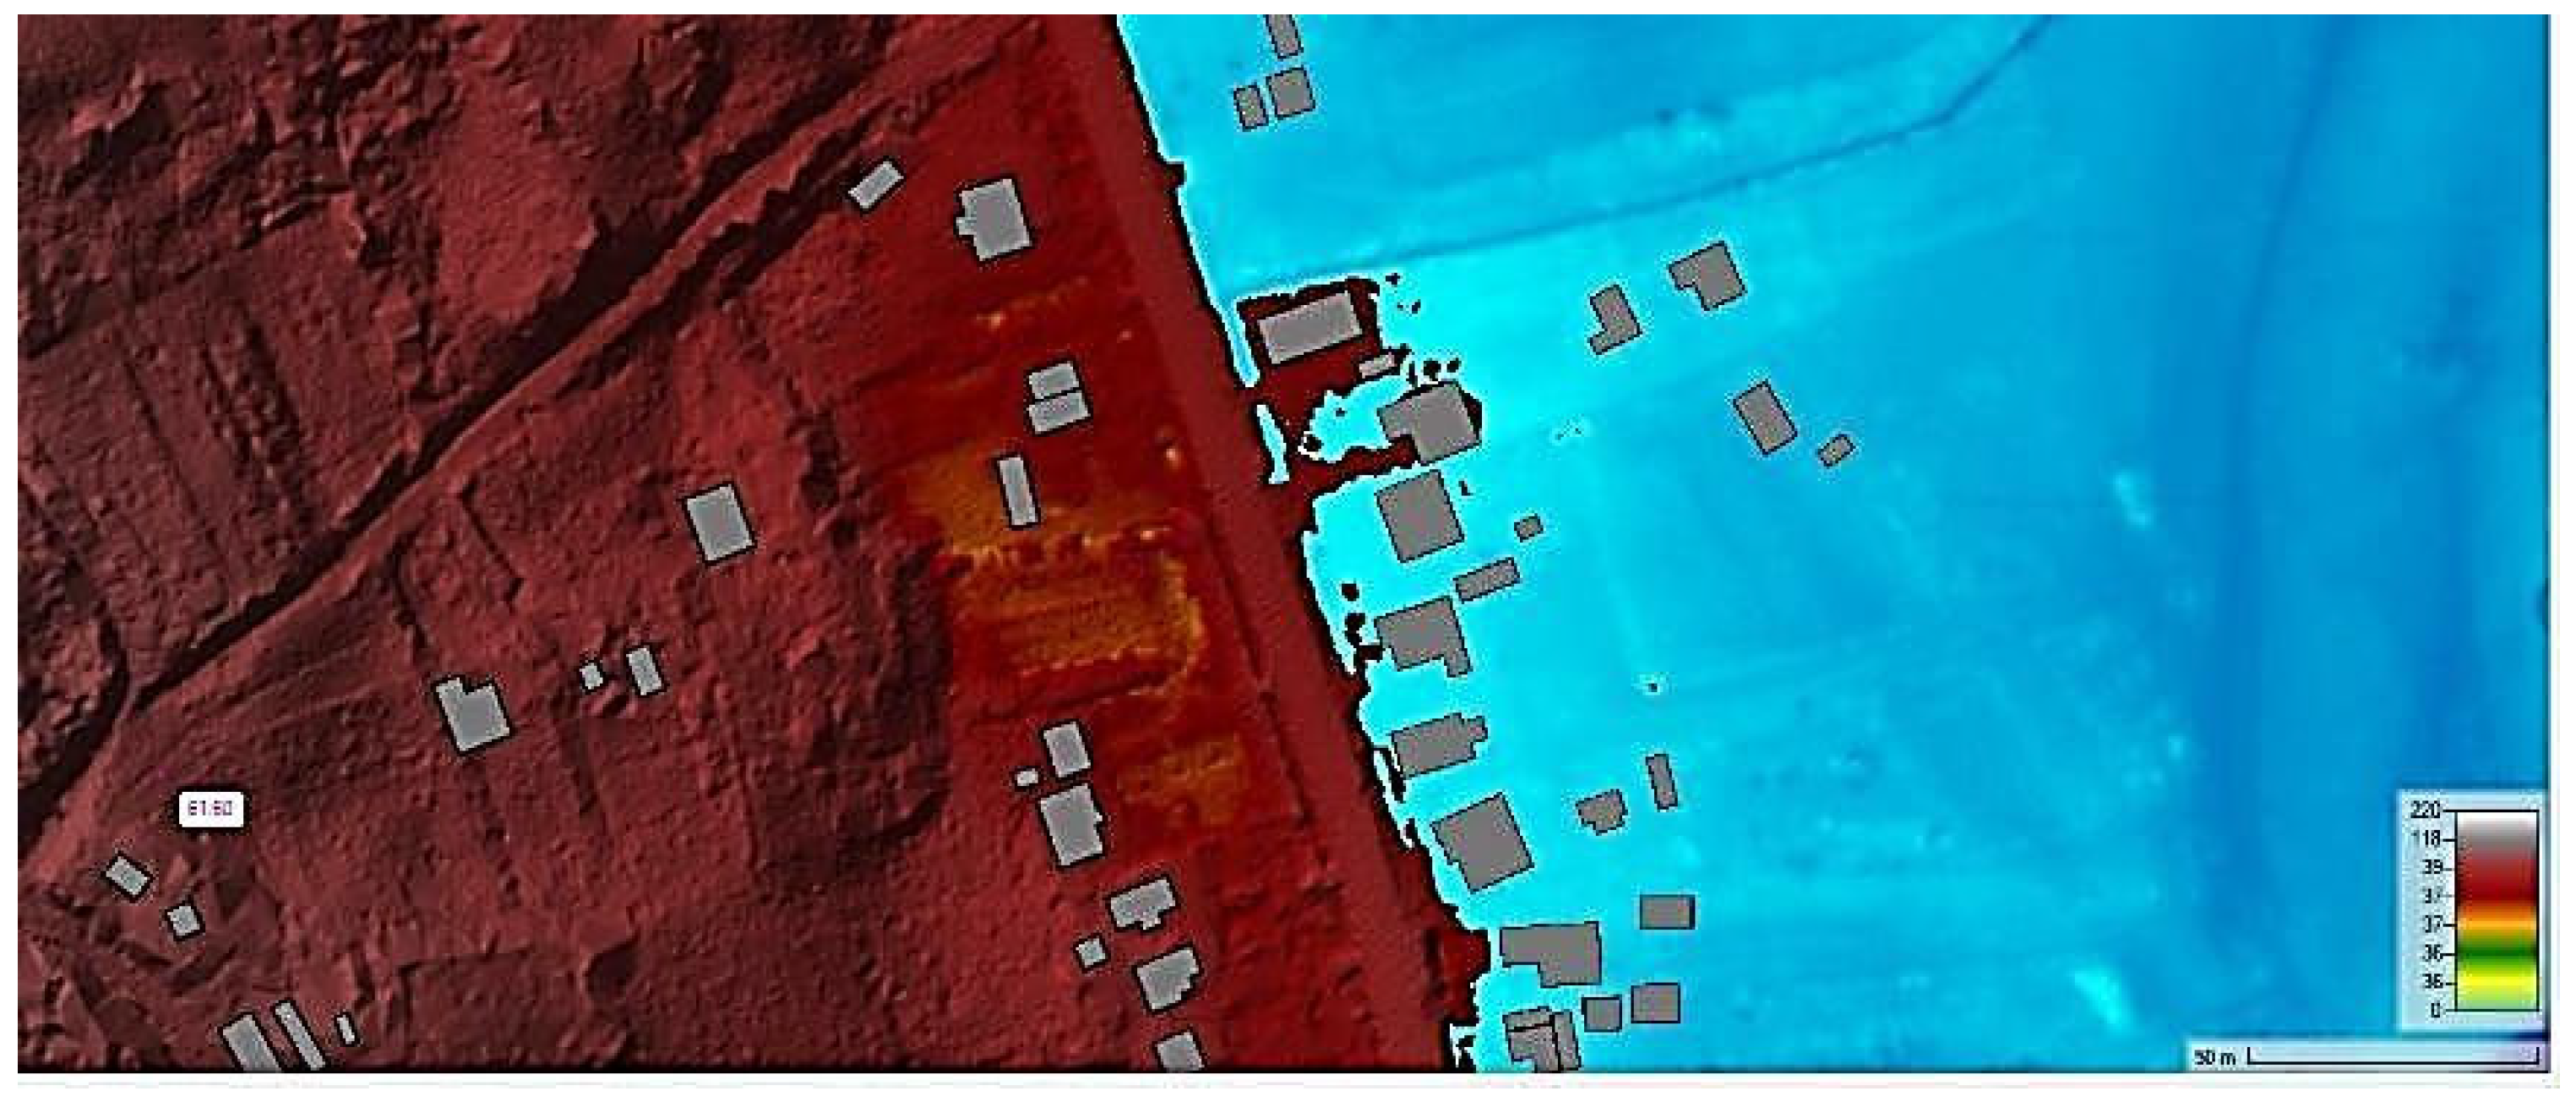
- Maximum water depth was generated as raster files, indicating inundation severity. Areas with depths below 0.1 m were filtered out. The <0.1 m threshold is used solely for visualization purposes in the map legend and does not affect the underlying simulation data. All shallow flows, including those around buildings, are fully retained in the model computations. These resulting layers were later used for classifying flood intensity and for exposure analysis.
- ‑
- Flow velocity rasters were extracted per scenario to assess the energy of floodwaters. These helped in identifying areas with high erosive or structural impact potential.
- ‑
- Flood extents were derived from depth rasters and stored as vector polygons. These delineate the spatial spread of each simulated flood scenario and serve as the basis for intersection with exposure layers.
- ‑
- Hazard level maps (depth × velocity) were computed and classified into low, moderate, and high hazard zones. These were used to inform priority areas for intervention.
- ‑
- Building exposure was assessed by intersecting flood extents with ANCPI building footprints. Under the 0.1% scenario, 882 buildings (totaling 62,600 m2) were affected, primarily in Coada Stâncii and Mânzătești.
- ‑
- Affected land parcels were identified using cadastral data. For example, the 1% scenario impacted 18 land plots (~152 ha), while the 0.1% scenario affected 42 plots totaling over 840 ha.
- ‑
- Exposed infrastructure, including roads and railways, was quantified by intersecting linear networks with flood extents. In the 0.1% case, 55 segments were exposed, totaling 13.5 km.
- ‑
- Final flood hazard maps were created for each scenario and exported as both raster layers and printable PDFs. These maps, shown in Figure 16, visualize depth, velocity, and affected assets.
- (a)
- 10%—frequent floods, likely to occur approximately once every 10 years;
- (b)
- 1%—moderate floods, with a recurrence interval of about 100 years;
- (c)
- 0.1%—rare floods, expected to occur once in 1000 years.
6. Discussion
7. Conclusions
Author Contributions
Funding
Data Availability Statement
Conflicts of Interest
Abbreviations
| DTM | Digital Terrain Model |
| LiDAR | Light Detection and Ranging |
| GIS | Geographic Information System |
| HEC-RAS | Hydrologic Engineering Center’s River Analysis System |
| HEC-HMS | Hydrologic Engineering Center’s Hydrologic Modeling System |
| APIA | Agency for Payments and Intervention in Agriculture |
| ANCPI | National Agency for Cadastre and Land Registration (Romania) |
| CNC | National Cartography Center (Romania) |
| ALS | Airborne Laser Scanning |
| IMU | Inertial Measurement Unit |
| DMC | Digital Mapping Camera |
| UTM | Universal Transverse Mercator |
| EU | European Union |
| USGS | United States Geological Survey |
Appendix A
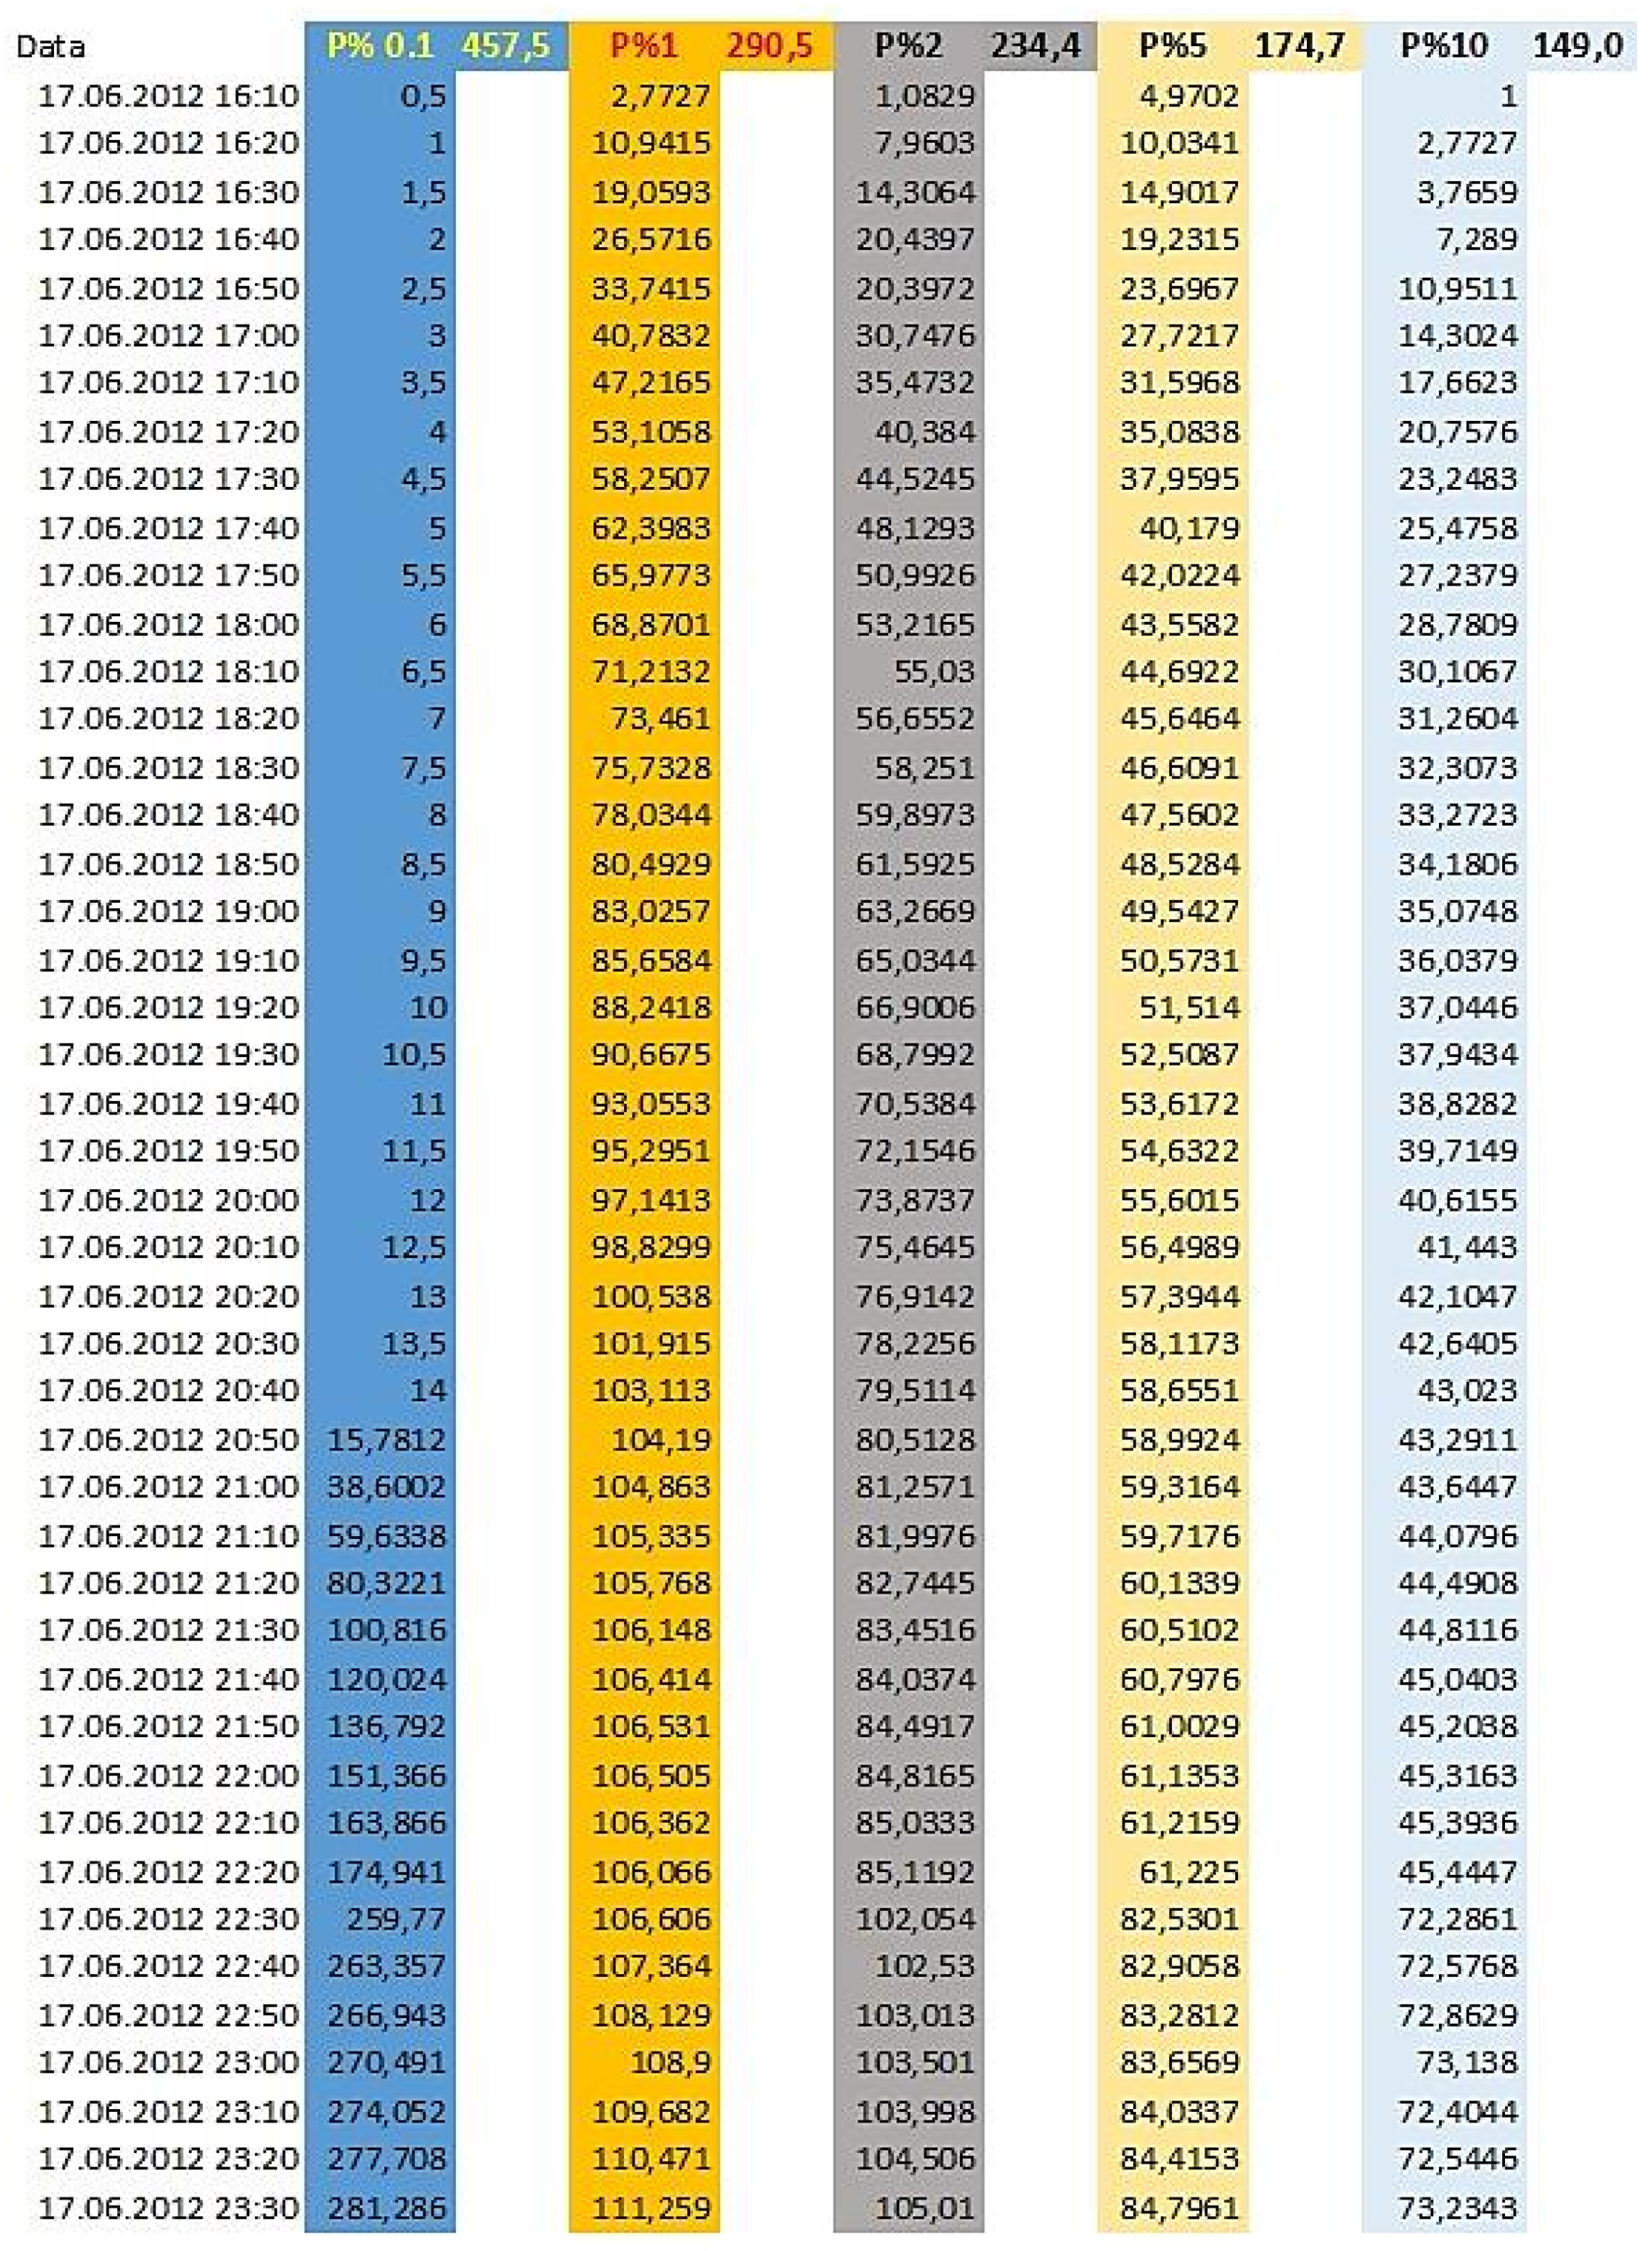
References
- Kundzewicz, Z.W.; Kanae, S.; Seneviratne, S.I.; Handmer, J.; Nicholls, N.; Peduzzi, P.; Mechler, R.; Bouwer, L.M.; Arnell, N.; Mach, K.; et al. Flood risk and climate change: Global and regional perspectives. Hydrol. Sci. J. 2014, 59, 1–28. [Google Scholar] [CrossRef]
- Oniga, V.E.; Crenganiş, L.; Diac, M.; Chirilă, C. Overview on Remote Sensing Methods and Data Sources for Floods and Landslides Management. Bul. Institutului Politeh. Din lasi. Sect. Constr. Arhit. 2020, 66, 59–70. [Google Scholar]
- Rentschler, J.; Salhab, M.; Jafino, B.A. Flood exposure and poverty in 188 countries. Nat. Commun. 2022, 13, 3527. [Google Scholar] [CrossRef] [PubMed]
- Brakenridge, G.R.; Anderson, E. Flood detection and monitoring using satellite data. In Remote Sensing of Floods; Springer: Dordrecht, The Netherlands, 2006; pp. 29–50. [Google Scholar]
- Anderson, R. Application of GIS in Hydrological Modeling. J. Hydrol. 2017, 123, 567–580. [Google Scholar]
- Demir, V.; Kisi, O. Flood Hazard Mapping by Using Geographic Information System and Hydraulic Model: Mert River, Samsun, Turkey. Adv. Meteorol. 2016, 4891015. [Google Scholar] [CrossRef]
- Almeida, G.A.; Silva, R.M.; Santos, M.J.; Costa, A.M. Hydrodynamic Modeling for Flood Risk Mapping Using HEC-RAS: A Case Study from a Semi-Arid Basin in Brazil. Water 2021, 13, 522. [Google Scholar] [CrossRef]
- Edirisooriya, E.M.N.T.; Neluwala, N.G.P.B.; Weerakoon, W.M.S.B. Flood Inundation Modelling in Greater Colombo Region Using HEC-RAS 2D. Eng. J. Inst. Eng. Sri Lanka 2022, 55, 21. [Google Scholar] [CrossRef]
- Adhikari, S. Evaluation of Model Parameter Sensitivity of Hec-Ras-2D Model on Flood Inundation Mapping Case Study of Surahi River and Banganga River, Nepal. Master’s Thesis, Institute of Engineering, Lalitpur, Nepal, 2020. [Google Scholar]
- Dottori, F.; Salamon, P.; Bianchi, A.; Alfieri, L.; Hirpa, F.A.; Feyen, L. Development and Evaluation of a Framework for Global Flood Hazard Mapping. Adv. Water Resour. 2018, 94, 87–102. [Google Scholar] [CrossRef]
- Di Baldassarre, G.; Schumann, G.; Bates, P.D.; Freer, J.E.; Beven, K.J.; Simpson, M. Floodplain Mapping: A Critical Discussion of Deterministic and Probabilistic Approaches. Hydrol. Process. 2010, 24, 1914–1924. [Google Scholar] [CrossRef]
- Ghimpu, L.; Apostol, L.; Rizea, I. Flood Hazard Mapping: A Case Study for Compliance with the European Floods Directive. J. Hydrol. Hydromech. 2019, 67, 175–185. [Google Scholar] [CrossRef]
- Neal, J.C.; Schumann, G.; Bates, P.D. A subgrid channel model for simulating river hydraulics and floodplain inundation over large and data-sparse areas. Water Resour. Res. 2012, 48. [Google Scholar] [CrossRef]
- Topolniceanu, A.; Balan, I.; Pricop, C.; Balan, I.E.; Giurma-Handley, C.; Crenganis, L. Runoff Simulation Through the Non-Permanent Accumulation Ciurea Using Hec-Ras 2d. Pangeea 2023, 14–22. [Google Scholar]
- US Army Corps of Engineers. HEC-RAS 2D User’s Manual. 2022. Available online: https://www.hec.usace.army.mil/software/hec-ras/download.aspx (accessed on 20 August 2025).
- Jha, A.K.; Bloch, R.; Lamond, J. Cities and Flooding: A Guide to Integrated Urban Flood Risk Management for the 21st Century; The World Bank: Washington, DC, USA, 2012; Available online: https://www.researchgate.net/publication/277827291_Cities_and_Flooding_A_Guide_to_Integrated_Urban_Flood_Risk_Management_for_the_21st_Century (accessed on 20 August 2025).
- Merz, B.; Kreibich, H.; Schwarze, R.; Thieken, A. Assessment of economic flood damage. Nat. Hazards Earth Syst. Sci. 2010, 10, 1697–1724. [Google Scholar] [CrossRef]
- Hagos, E.Y.; Gebremichael, M. GIS-based flood modeling and risk assessment using HEC-RAS: A case study of Awash River Basin, Ethiopia. Sustainability 2020, 12, 8082. [Google Scholar] [CrossRef]
- Horita, F.E.A.; de Albuquerque, J.P.; Marchezini, V.; Mendiondo, E.M. Bridging the gap between decision-making and hydrological modeling: A systematic review of flood risk decision support systems. Environ. Model. Softw. 2020, 129, 104697. [Google Scholar] [CrossRef]
- Alfieri, L.; Bisselink, B.; Dottori, F.; Hirabayashi, Y.; Naumann, G.; Salamon, P.; Sylla, M.; Feyen, L. Flood Risk Assessment at the Global Scale: A Review. Earth-Sci. Rev. 2020, 201, 102949. [Google Scholar] [CrossRef]
- Teng, J.; Jakeman, A.J.; Vaze, J.; Croke, B.F.; Dutta, D.; Kim, S. Flood inundation modelling: A review of methods, recent advances and uncertainty analysis. Environ. Model. Softw. 2017, 90, 201–216. [Google Scholar] [CrossRef]
- Zischg, A.P. Floodplains and Complex Adaptive Systems—Perspectives on Connecting the Dots in Flood Risk Assessment with Coupled Component Models. Systems 2018, 6, 9. [Google Scholar] [CrossRef]
- Mosavi, A.; Ozturk, P.; Chau, K.W. Flood Prediction Using Machine Learning Models: Literature Review. Water 2018, 10, 1536. [Google Scholar] [CrossRef]
- Vezzoli, R.; Salvadori, G.; De Michele, C. A Distributional Multivariate Approach for Assessing Performance of Climate-Hydrology Models. Sci. Rep. 2017, 7, 12071. [Google Scholar] [CrossRef]
- The European Parliament and Council. Directive 2007/60/EC on the assessment and management of flood risks. Off. J. Eur. Union 2007, 288, 27–34. Available online: https://www.eea.europa.eu/policy-documents/directive-2007-60-ec-of (accessed on 1 September 2025).
- Mihu-Pintilie, A.; Cîmpianu, C.I.; Stoleriu, C.C.; Pérez, M.N.; Paveluc, L.E. Using High-Density LiDAR Data and 2D Streamflow Hydraulic Modeling to Improve Urban Flood Hazard Maps: A HEC-RAS Multi-Scenario Approach. Water 2019, 11, 1832. [Google Scholar] [CrossRef]
- Ajin, R.S.; Loghin, A.M.; Vinod, P.G.; Jacob, M.K. Flood Hazard Zone Mapping in the Tropical Achankovil River Basin in Kerala: A Study Using Remote Sensing Data and Geographic Information System. J. Wetl. Biodiv. 2019, 9, 45–58. [Google Scholar]
- Peker, İ.B.; Gülbaz, S.; Demir, V.; Orhan, O.; Beden, N. Integration of HEC-RAS and HEC-HMS with GIS in Flood Modeling and Flood Hazard Mapping. Sustainability 2024, 16, 1226. [Google Scholar] [CrossRef]
- Gutenson, J.L.; Tavakoly, A.A.; Islam, M.S.; Wing, O.E.J.; Lehman, W.P.; Hamilton, C.O.; Wahl, M.D.; Massey, T.C. Comparison of Estimated Flood Exposure and Consequences Generated by Different Event-Based Inland Flood Inundation Maps. Nat. Hazards Earth Syst. Sci. 2023, 23, 261–277. [Google Scholar] [CrossRef]
- Ciurte, D.L.; Mihu-Pintilie, A.; Urzică, A.; Grozavu, A. Integrating LiDAR Data, 2D HEC-RAS Modeling and Remote Sensing to Develop Flood Hazard Maps Downstream of a Large Reservoir in the Inner Eastern Carpathians. Carpath. J. Earth Environ. Sci. 2023, 18, 149–169. [Google Scholar] [CrossRef]
- Pathan, A.I.; Agnihotri, P.G.; Patel, D.; Prieto, C. Mesh Grid Stability and Its Impact on Flood Inundation through (2D) Hydrodynamic HEC-RAS Model with Special Use of Big Data Platform—A Study on Purna River of Navsari City. Arab. J. Geosci. 2022, 15, 659. [Google Scholar] [CrossRef]
- Darijani, Z.; Ghaeini-Hessaroeyeh, M.; Fadaei-Kermani, E. Flood Inundation and Hazard Mapping Using the HEC-RAS 2D Model: A Case Study of Adoori River, Iran. Model. Earth Syst. Environ. 2025, 11, 78. [Google Scholar] [CrossRef]
- Salman, A.; Hassan, S.S.; Khan, G.D.; Goheer, M.A.; Khan, A.A.; Sheraz, K. HEC-RAS and GIS-Based Flood Plain Mapping: A Case Study of Narai Drain Peshawar. Acta Geophys. 2021, 69, 1383–1393. [Google Scholar] [CrossRef]
- Awah, L.S.; Belle, J.A.; Nyam, Y.S.; Orimoloye, I.R. A Systematic Analysis of Systems Approach and Flood Risk Management Research: Trends, Gaps, and Opportunities. Int. J. Disaster Risk Sci. 2024, 15, 45–57. [Google Scholar] [CrossRef]
- Pinos, J.; Timbe, L.; Timbe, E. Evaluation of 1D Hydraulic Models for the Simulation of Mountain Fluvial Floods: A Case Study of the Santa Bárbara River in Ecuador. Water Pract. Technol. 2019, 14, 341–354. [Google Scholar] [CrossRef]
- Ahmad, I.; Wang, X.; Waseem, M.; Zaman, M.; Aziz, F.; Khan, R.Z.N.; Ashraf, M. Flood Management, Characterization and Vulnerability Analysis Using an Integrated RS-GIS and 2D Hydrodynamic Modelling Approach: The Case of Deg Nullah, Pakistan. Remote Sens. 2022, 14, 2138. [Google Scholar] [CrossRef]
- Santillan, J.R.; Marqueso, J.T.; Makinano-Santillan, M.; Serviano, J.L. Beyond Flood Hazard Maps: Detailed Flood Characterization with Remote Sensing, GIS and 2D Modelling. ISPRS Int. Arch. Photogramm. Remote Sens. Spat. Inf. Sci. 2016, XLII-4/W1, 315–323. [Google Scholar] [CrossRef]
- Skilodimou, H.D.; Bathrellos, G.D.; Alexakis, D.E. Flood Hazard Assessment Mapping in Burned and Urban Areas. Sustainability 2021, 13, 4455. [Google Scholar] [CrossRef]
- Su, X.; Shao, W.; Liu, J.; Jiang, Y.; Wang, K. Dynamic Assessment of the Impact of Flood Disaster on Economy and Population under Extreme Rainstorm Events. Remote Sens. 2021, 13, 3924. [Google Scholar] [CrossRef]
- Ministry of Environment. Water and Forests—Romania. Romanian Waters—Stânca–Costești Reservoir. Available online: http://www.rowater.ro/retention-area-stanca-costesti/ (accessed on 22 August 2025).
- Smith, C.; Williams, D. Estimation of Manning’s Roughness Coefficient in 2D Hydraulic Models. J. Hydraul. Eng. 2016, 89, 201–215. [Google Scholar]
- Rădulescu, D.; Chendeș, V.; Ion, M.B. Realizarea Hărților de Hazard și Risc pe Teritoriul României, Conform Cerințelor Directivei 2007/60/CE; Institutul Național de Hidrologie și Gospodărire a Apelor: București, România, 2016. [Google Scholar]
- Diac, M.; Crenganis, L.M.; Bofu, C.; Marcu, C. Geospatial Input Data Validation in Modelling Hydrological Risk. In Modern Technologies for the 3rd Millennium; Editografica S.R.L.: Bologna, Italy, 2019; pp. 13–20. [Google Scholar]
- Geeshan, P.G.T.N.; Wijayaratne, T.M.N.; Jayasundara, J.M.A.S.S. Vulnerability of Colombo Suburbs for Kelani River Floods. In Proceedings of the 2023 Moratuwa Engineering Research Conference (MERCon), Moratuwa, Sri Lanka, 9–11 November 2023; pp. 143–148. [Google Scholar] [CrossRef]
- Mustafa, A.; Szydlowski, M. Application of Different Building Representation Techniques in HEC-RAS 2-D for Urban Flood Modeling Using the Toce River Experimental Case. PeerJ 2021, 9, e11235. [Google Scholar] [CrossRef]
- Iordan, I. Toponimia Românească; Editura Academiei Republicii Populare Romîne: București, Romania, 1963. [Google Scholar]
- Administrația Națională Apele Române. Hărți de Hazard și Risc la Inundații. Available online: www.inundatii.ro (accessed on 22 August 2025).
- Tan, Z.; Xu, D.; Taraphdar, S.; Ma, J.; Bisht, G.; Leung, L.R. An Efficient Hybrid Downscaling Framework to Estimate High-Resolution River Hydrodynamics. Hydrol. Earth Syst. Sci. 2025, 29, 3833–3850. [Google Scholar] [CrossRef]
- Leon, P.A. Tutorial on Using HEC-GeoRAS 10.1 (or Newer) with ArcGIS; University of Houston: Houston, TX, USA, 2017. [Google Scholar]
- USGS NWIS Site Information for USA: Site Inventory. Available online: https://waterdata.usgs.gov/nwis/inventory/?site_no=08073500 (accessed on 22 August 2025).
- Riche, A.; Drias, A.; Guermoui, M.; Gherib, T.; Boulmaiz, T.; Souissi, B.; Melgani, F. A Novel Hybrid Deep-Learning Approach for Flood-Susceptibility Mapping. Remote Sens. 2024, 16, 3673. [Google Scholar] [CrossRef]
- Akinboyewa, T.; Ning, H.; Lessani, M.N.; Li, Z. Automated Floodwater Depth Estimation Using Large Multimodal Model for Rapid Flood Mapping. arXiv 2024, arXiv:2402.16684. [Google Scholar] [CrossRef]
- Chirilă, C.; Oniga, V.E.; Diac, M.; Crenganiș, L.M. Overview of Spatial Reference Systems for Hazard Risk Management in the NE Region of Romania. Bull. Politehn. Inst. Iasi Constr. Archit. 2020, 66, 85–98. [Google Scholar]
- Mustafa, A.; Szydłowski, M.; Veysipanah, M.; Hameed, H.M. GIS-Based Hydrodynamic Modeling for Urban Flood Mitigation in Fast-Growing Regions: A Case Study of Erbil, Kurdistan Region of Iraq. Sci. Rep. 2023, 13, 8935. [Google Scholar] [CrossRef] [PubMed]
- Saylam, K.; Briseno, A.; Averett, A.R.; Andrews, J.R. Analysis of Depths Derived by Airborne Lidar and Satellite Imaging to Support Bathymetric Mapping Efforts with Varying Environmental Conditions: Lower Laguna Madre, Gulf of Mexico. Remote Sens. 2023, 15, 5754. [Google Scholar] [CrossRef]
- Młyński, Z.; Halecki, W.; Surowiec, K. Urban Flood Modeling for Sustainability Management: Role of Design Rainfall and Land Use. Sustainability 2024, 16, 4805. [Google Scholar] [CrossRef]
- Mittapalli, G.V.S.S.; Gorthi, K.V. Development of Spatial Analyst Toolbar in ArcGIS. Int. J. Geoinf. Sci. 2012, 1, 25–30. [Google Scholar]
- Allafta, H.; Opp, C. GIS-Based Multi-Criteria Analysis for Flood Prone Areas Mapping in the Trans-Boundary Shatt Al-Arab Basin, Iraq-Iran. Geomat. Nat. Hazards Risk 2021, 12, 2087–2116. [Google Scholar] [CrossRef]
- El-Haddad, B.A.; Youssef, A.M.; Karimi, Z.; Pourghasemi, H.R. Flood Inundation Mapping Using HEC-RAS 2D Modeling and Examining the Impact of Changes in the Model-Meshing Pixel Scale on the Final Output. Water Resour. Manag. 2025, 39, 5807–5826. [Google Scholar] [CrossRef]
- Guven, D.S.; Yenigun, K.; Isinkaralar, O.; Isinkaralar, K. Modeling flood hazard impacts using GIS-based HEC-RAS technique towards climate risk in Şanlıurfa, Türkiye. Nat. Hazards 2025, 121, 3657–3675. [Google Scholar] [CrossRef]
- Haces-Garcia, F.; Maslennikova, N.; Glennie, C.L.; Rifai, H.S.; Hoskere, V.; Ekhtari, N. Deep Learning Hydrodynamic Forecasting for Flooded Region Assessment in Near-Real-Time (DL Hydro-FRAN). arXiv 2023, arXiv:2305.12052. [Google Scholar]
- Liu, B.; Li, Y.; Ma, M.; Mao, B. A Comprehensive Review of Machine Learning Approaches for Flood Depth Estimation. Int. J. Disaster Risk Sci. 2025, 16, 433–445. [Google Scholar] [CrossRef]
- Qureshi, M.U.A.; Amiri, A.; Ebtehaj, I.; Guimere, S.J.; Cunderlik, J.; Bonakdari, H. Coupling HEC-RAS and AI for River Morphodynamics Assessment Under Changing Flow Regimes: Enhancing Disaster Preparedness for the Ottawa River. Hydrology 2025, 12, 25. [Google Scholar] [CrossRef]
- Dong, S.; Yu, T.; Farahmand, H.; Mostafavi, A. A Hybrid Deep Learning Model for Predictive Flood Warning and Situation Awareness Using Channel Network Sensors Data. Comput.-Aided Civ. Infrastruct. Eng. 2021, 36, 402–420. [Google Scholar] [CrossRef]
- Gacu, J.; Kantoush, S.; Candelario, R.; Falculan, J.; Moaje, K.V.; Famaran, M.J.; Quinton, E. Integrated Multi-Hazard Risk Assessment under Compound Disasters Using Analytical Hierarchy Process (AHP). Heliyon 2025, 11. [Google Scholar] [CrossRef]
- Roohi, M.; Ghafouri, H.R.; Ashrafi, S.M.; Motagh, M.; Haghshenas Haghighi, M. A Hybrid Approach for Enhanced Flood Prediction and Assessment: Leveraging Physical Models, Deep Learning and Satellite Remote Sensing. Big Earth Data 2025, 9, 439–472. [Google Scholar] [CrossRef]
- Afzal, M.A.; Ali, S.; Nazeer, A.; Khan, M.I.; Waqas, M.M.; Aslam, R.A.; Shah, A.N. Flood Inundation Modeling by Integrating HEC–RAS and Satellite Imagery: A Case Study of the Indus River Basin. Water 2022, 14, 2984. [Google Scholar] [CrossRef]
- Ahmad, I.; Farooq, R.; Ashraf, M.; Waseem, M.; Shangguan, D. Improving flood hazard susceptibility assessment by integrating hydrodynamic modeling with remote sensing and ensemble machine learning. Nat. Hazards 2025, 121, 7839–7868. [Google Scholar] [CrossRef]
- Khoshkonesh, A.; Nazari, R.; Nikoo, M.R.; Karimi, M. Enhancing flood risk assessment in urban areas by integrating hydrodynamic models and machine learning techniques. Sci. Total Environ. 2024, 952, 175859. [Google Scholar] [CrossRef]






| ID | Land Use Classes | Manning’s n |
|---|---|---|
| 1 | Running water/Natural streambed with stones and vegetation | 0.04 |
| 2 | Arable land/Uncompacted earth, bare soil | 0.05 |
| 3 | Communication routes/Asphalt | 0.016 |
| 4 | Construction yards/Smooth concrete | 0.09009 |
| 5 | Forest with dense undergrowth | 0.149925 |
| 6 | Short grass pasture/Lawn | 0.0350018 |
| 7 | Unproductive land/Dense weeds | 0.069979 |
| 8 | Standing water/Excavated earth channel (unfinished) | 0.030003 |
| 9 | Railways/Gravel, cobble | 0.033 |
| 10 | Fruit trees/Tall vegetation | 0.1 |
| Result Type | Format | Storage Location | Purpose/Use |
|---|---|---|---|
| Maximum water depth | Raster (.tif), Shapefile (.shp) | GDB: Depth | Quantify inundation severity; identify flood-prone zones |
| Maximum flow velocity | Raster (.tif), Shapefile (.shp) | GDB: Velocity | Assess the dynamic impact of floodwater on structures and terrain |
| Flood extent | Polygon shapefile (.shp) | GDB: Extent | Delineate the spatial extent of flood hazard for each scenario |
| Hazard level (depth × velocity) | Raster (.tif) | GDB: HazardClass | Classify hazard zones by severity; input for risk mapping |
| Affected buildings | Table (.csv), Shapefile (.shp) | Exposed_Buildings | Identify infrastructure exposure per scenario |
| Affected land parcels | Table (.csv), Shapefile (.shp) | Exposed_Land | Assess land use categories at risk (agricultural, residential, etc.) |
| Road/rail infrastructure | Line shapefile (.shp) | Exposed_Infrastructure | Quantify linear infrastructure exposure (e.g., km affected) |
| Combined hazard maps | Map layouts (.pdf/.jpg) | Maps/FloodHazard | Cartographic output for stakeholders and spatial planners |
| Study | HEC-RAS Hydrodynamic Modeling | DEM Source and Resolution | Hydrograph Source | Study Area | Key Contributions Limitations |
|---|---|---|---|---|---|
| Pintilie et al. [26] | 2D | LiDAR, 1 m | Synthetic | Bacău City, Romania | High-resolution urban flood modeling; |
| No hybrid mesh refinement, limited transferability | |||||
| Ciurte et al. [30] | 2D | LiDAR, 1 m | Synthetic | Carpathians, Romania | Multi-scenario modeling; |
| Not urban–peri-urban detailed discretization, no transferable workflow for data-scarce regions. | |||||
| Peker et al. [28] | 2D | DEM, 5 m | HEC-HMS simulated | Göksu River Basin, Turkey | Integration of HEC-HMS and HEC-RAS with GIS; |
| Coarser DEM, not urban, no transferable workflow. No direct synthetic hydrograph integration, not an urban–peri-urban context. | |||||
| El-Haddad et al. [59] | 2D | Not specified | HEC-HMS simulated | Sohag, Egypt | Semi-arid flood mapping; |
| Limited urban focus, no hybrid mesh or synthetic hydrographs. | |||||
| Gutenson et al. [29] | 2D | LiDAR, not specified | Observed | Multiple European sites | Urban inundation modeling; |
| No detailed channel + floodplain discretization | |||||
| Ahmad et al. [36] | HEC-RAS 2D | SRTM DEM 12.5 × 12.5 m | Observed | Deg Nullah, Pakistan | Flood extent covers urban and peri-urban areas; Proposed an entropy distance-based approach for integrated multivariate flood vulnerability classification |
| The simulated flood extent was 6% less than the MODIS registered extents, potentially due to the courser DEM resolution. The study was limited to simulating the 2014 flood event (200-year return period). | |||||
| Guven et al. [60] | HEC-RAS 1D flood analysis | 10 m | Observed | Şanlıurfa city center, Türkiye | Determined economic, social, and environmental risk areas; focus on localized urban flood patterns; spatial flood risk of residences, shopping malls, and commercial areas. |
| Decision-makers often need to consider research in practice | |||||
| Pathan et al. [31] | HEC-RAS 2D | SRTM 30 m | Observed, collected | Navsari city, southern Gujarat, India | Impact of various 2D mesh grid sizes (300, 200, 100, 90, 50, and 30 m) on flood inundation depth and extent; Identified the 50 m mesh grid as the most accurate size |
| 30 m SRTM DEM, and future research is recommended to use higher resolution DEMs to increase model accuracy. Did not include break lines during mesh generation, which could help define barriers and reduce simulation time | |||||
| Darijani et al. [32] | HEC-RAS 2D model | Topographic maps and ALOS gauge DEM (30 m) | Derived from the HEC-HMS rainfall–runoff model | Adoori River in Bam city, Kerman province, Iran | Used hydraulic modeling to integrate flood depth (D) and velocity (V) to produce flood hazard maps; Achieved suitable calibration accuracy for the HEC-HMS rainfall–runoff model |
| Coarse DEM resolution | |||||
| Salman et al. [33] | HEC-RAS 1D steady flow analysis | DEM 30 m | Computed using the WinTR-20 hydrological model | Narai Drain watershed in Hayatabad, Peshawar, Pakistan | Integrated HEC-RAS (1D) and GIS (Arc-GIS and ERDAS Imagine) to produce flood plain maps and delineate vulnerable areas; Used the WinTR-20 model to develop a rainfall–runoff relationship and estimate discharges for various return periods. |
| Coarse DEM resolution 30 m; The ability to show extreme inundation for high flood stages was constrained due to settlements/population near both banks; HEC-RAS one-dimensional steady flow model | |||||
| Proposed method | Integrated GIS and HEC-RAS 2D hydraulic modeling | DTM 1m | Synthetic | Ungheni, Iasi, Romania | Establishing a transferable, data-driven workflow for flood hazard mapping in urban–peri-urban areas characterized by limited observed hydrological data. Integration of anthropogenic features (buildings and levees) to ensure a realistic representation of local flood dynamics: Use of high-resolution DTM |
| Generally, hydraulic models, despite their value in flood risk assessment, are fundamentally a simplified representation of reality and may not capture every relevant factor present on the ground |
| Research Direction | Current Status | Description/Contribution | References |
|---|---|---|---|
| Combined HEC-HMS/HEC-RAS simulations with deep-learning models | Emerging/Operational research | Weighted-Residual U-Net that fuses HEC-HMS/HEC-RAS outputs and limited ground truth to produce flood-susceptibility maps with higher sensitivity/AUC than HEC-RAS alone, improving mapping where ground data are sparse. | Riche et al. [51] |
| AI Integration in Flood Modeling | Emerging/Pilot implementations | Integration of machine learning (ML) and deep learning (DL) with HEC-RAS for improved flood prediction, model calibration, and hazard mapping. Demonstrated in pilot studies; further validation needed for Romanian urban–peri-urban contexts. | Haces-Garcia et al. [61]; Qureshi et al. [63]; Gacu et al. [65] |
| Real-Time Data Assimilation | Emerging/Experimental | Use of real-time hydrological sensor data (IoT, UAVs, gauges) to dynamically update 2D HEC-RAS/GIS models for rapid flood forecasting and hazard assessment. | Dong et al. [64]; Roohi et al. [66] |
| Multi-Hazard Modeling | Emerging/Future | Expanding flood modeling frameworks to include compound hazards (e.g., floods + landslides, extreme rainfall events). AI and remote sensing integration support scenario analysis and rapid multi-hazard assessment. | Liu et al. [62]; Afzal et al. [67] |
| Hybrid framework combining hydrodynamic modeling, remote sensing and machine learning | Emerging/Operational research | Integrated methodology where unsteady 2D HEC-RAS modeling of a 100-year return flood is used to generate inundation extents that serve as a flood inventory; this is combined with ten geo-environmental remote sensing ensemble ML models (RF, XGBoost), and the RF model. | Ahmad et al. [68] |
| Integration of advanced hydrodynamic models with machine learning techniques | Emerging/Operational research | Integration of advanced hydrodynamic models with machine learning techniques to enhance flood risk assessment in urban areas. | Khoshkonesh et al. [69] |
Disclaimer/Publisher’s Note: The statements, opinions and data contained in all publications are solely those of the individual author(s) and contributor(s) and not of MDPI and/or the editor(s). MDPI and/or the editor(s) disclaim responsibility for any injury to people or property resulting from any ideas, methods, instructions or products referred to in the content. |
© 2025 by the authors. Licensee MDPI, Basel, Switzerland. This article is an open access article distributed under the terms and conditions of the Creative Commons Attribution (CC BY) license (https://creativecommons.org/licenses/by/4.0/).
Share and Cite
Crenganis, L.M.; Pricop, C.I.; Diac, M.; Olteanu-Raimond, A.-M.; Loghin, A.-M. Flood Risk Prediction and Management by Integrating GIS and HEC-RAS 2D Hydraulic Modelling: A Case Study of Ungheni, Iasi County, Romania. Water 2025, 17, 2959. https://doi.org/10.3390/w17202959
Crenganis LM, Pricop CI, Diac M, Olteanu-Raimond A-M, Loghin A-M. Flood Risk Prediction and Management by Integrating GIS and HEC-RAS 2D Hydraulic Modelling: A Case Study of Ungheni, Iasi County, Romania. Water. 2025; 17(20):2959. https://doi.org/10.3390/w17202959
Chicago/Turabian StyleCrenganis, Loredana Mariana, Claudiu Ionuț Pricop, Maximilian Diac, Ana-Maria Olteanu-Raimond, and Ana-Maria Loghin. 2025. "Flood Risk Prediction and Management by Integrating GIS and HEC-RAS 2D Hydraulic Modelling: A Case Study of Ungheni, Iasi County, Romania" Water 17, no. 20: 2959. https://doi.org/10.3390/w17202959
APA StyleCrenganis, L. M., Pricop, C. I., Diac, M., Olteanu-Raimond, A.-M., & Loghin, A.-M. (2025). Flood Risk Prediction and Management by Integrating GIS and HEC-RAS 2D Hydraulic Modelling: A Case Study of Ungheni, Iasi County, Romania. Water, 17(20), 2959. https://doi.org/10.3390/w17202959


