Article

Study of the Motion Path of Water-Intercepting Aggregate in a Coal–Rock Mass Water Gush Roadway

1
College of Architecture and Civil Engineering, Xi’an University of Science and Technology, Xi’an 710054, China
2
School of Highway Engineering, Shaanxi College of Communications Technology, Xi’an 710018, China
3
The Youth Innovation Team of Shaanxi Universities, Xi’an 710018, China
*
Author to whom correspondence should be addressed.
Water 2025, 17(20), 2956; https://doi.org/10.3390/w17202956
Submission received: 2 September 2025 / Revised: 6 October 2025 / Accepted: 12 October 2025 / Published: 14 October 2025
(This article belongs to the Section Hydraulics and Hydrodynamics)

Abstract

After water gushing occurs in a coal mine roadway, abundant aggregate needs to be perfused into the water gush roadway to establish a water interception section and reduce the current velocity. Clarifying the water-intercepting aggregate motion path and quantitatively calculating the displacement distance are critical for determining perfusion hole spacing. This paper employs the CFD-DEM coupling approach, which is capable of accurately characterizing the water gush continuous flow properties and the aggregate discrete motion behavior. This can be used to simulate and analyze the water-intercepting aggregate motion in a water gush roadway, categorizing it into three phases: free fall, curvilinear projectile, and sliding. The theoretical motion model aggregate can be developed, and the calculation formulas for aggregate motion distances in each phase derived. A parameter test scheme was designed and combined with numerical simulation methods to verify the accuracy of the formulas. Finally, based on this research, it is proposed that the theoretical model can be used to dynamically optimize the design of perfusion hole spacing, maximizing the synergistic effect of multi-hole perfusion. The selection of aggregate density and size should ensure the vector sum of the aggregate motion distance in phase II and III approaches zero, thereby improving the water-intercepting efficiency.

1. Introduction

Water gush, a major hazard impacting safe mining operations, is distinguished by its suddenness, severe destructiveness, and great difficulty in governance [1,2]. For such water disasters, methods of roadway diversion and borehole drainage are employed to perform pre-mining dewatering of recharge aquifers and enhance drainage capacity within the roadway, which can effectively prevent water gush disasters [3]. However, when facing sudden water gush events, these methods, which serve as passive response measures, are often unable to control disasters in a timely manner due to limitations in drainage capacity [4,5,6]. Although the traditional grouting method can form a persistent plugging body in the water gush roadway to achieve water-blocking, the slurry under high-velocity water gush conditions is extremely easy to be diluted and washed out, resulting in its inability to solidify effectively [7,8,9]. Consequently, this method exhibits low success rates in practical engineering applications. In contrast, the progressive treatment method based on “aggregate interception-grouting consolidation-underground drainage” is the fastest and most effective approach for controlling water gush disasters in coal mines [10]. This method involves the following steps: perfusing water-intercepting aggregate into the coal–rock mass water gush roadway to establish a low-permeability water blocking body; forming a persistent plugging stone body through grouting after transforming high-velocity pipe flow into low-velocity non-Darcy seepage; carrying out further drainage depending on the actual engineering requirements [11,12].
Among them, aggregate interception is the first step of the comprehensive treatment method. Clarifying the water-intercepting aggregate motion path in the coal–rock mass water gush roadway is crucial. It serves as the foundation to ensure the effective creation of a low-permeability water-intercepting barrier and the provision of prerequisites for subsequent grouting operations. Deriving the calculation formula for the displacement distance of the aggregate is essential. It is the key to selecting an aggregate with appropriate density and size and optimizing the spacing of the aggregate perfusion holes in the water interception project. To address these challenges, scholars both home and abroad have carried out extensive investigations in this domain. Vlasak et al. [13]. analyzed the various motion types of aggregate in a transparent pipeline at a specific flow velocity, providing a detailed description of the motion process of individual aggregate. Ravelet et al. [14]. analyzed the motion characteristics of aggregate under dynamic water flow conditions through hydraulic transport experiments in horizontal pipelines, clearly demonstrating that the size and density of the aggregate directly control the flow regime within the pipeline. Arolla and Desjardins [15] employed a Euler–Lagrange large eddy simulation coupled with the immersed boundary method to analyze the movement types of aggregate within horizontal pipelines under turbulent flow, and proposed a forecasting model for the critical settling velocity of the aggregate. Uzi and Levy [16] applied CFD-DEM to numerically simulate the hydraulic transportation of coarse aggregate in horizontal pipelines, captured the mesoscopic mechanism of the interaction between the aggregate and the water, and found that the flow velocity threshold effect and the aggregate size-to-pipe diameter ratio have a significant impact on the flow pattern. Zhou et al. [17] conducted a simulation study on the hydraulic conveyance of coarse-grained aggregate in a vertical pipeline using CFD-DEM. The results showed that the aggregate tends to gather towards the center, and the lift force dominates the movement. The water flow velocity and aggregate concentration significantly affect the pressure drop in the pipeline, while the aggregate size has a relatively small influence. Sui et al. [18] established a visualization experimental platform for tunnel water inrush, simulated the aggregate perfusion process under dynamic water conditions, analyzed various influencing factors that affect the movement distance and accumulation efficiency of the aggregate, and furnished a theoretical grounding for the aggregate water-blocking engineering of tunnel water inrush. Su et al. [19] studied the aggregate motion mechanism in water inrush channels and established a migration and diffusion model of individual aggregate and aggregate groups in the horizontal direction.
Current research on the water-intercepting aggregate motion path in a coal–rock mass water gush roadway primarily focuses on indoor visual experiments (describing the aggregate motion in a horizontal dynamic water roadway) and numerical simulations (analyzing the aggregate accumulation process). However, it rarely considers the geometric characteristics of the gush water roadway, and no formulas for calculating the water-intercepting aggregate displacement distances have been proposed. In light of this, this study first incorporates deep mine hydrogeological settings, summarizes the types of roadway water gush disasters, and uses the CFD-DEM coupling method to simulate the deposition and movement of water-intercepting aggregate in an inclined upward gush water roadway via a simplified perfusion model, identifying three characteristic motion phases: free fall, curvilinear projectile, and sliding. Second, a physical-mechanical model is established to analyze individual aggregate forces and motion, deriving a formula for aggregate displacement distance. Third, a parameter test scheme is designed to analyze the key factors affecting the aggregate motion path in the theoretical model, with numerical simulations verifying the aggregate displacement distance calculation formula’s accuracy. Finally, based on these findings, discussions on the perfusion hole spacing design and the construction methods aim to provide reasonable recommendations for engineering practice.

2. Methods

This section first summarizes the types of prone water gush hazards occurring in a coal–rock mass roadway. Using the CFD-DEM coupling approach, a numerical model of the water gush roadway section is established by simplifying the roadway boundaries and water gush conditions. Subsequently, the motion path of the water-interception aggregate is simulated within the model, and the motion phases are classified. Finally, based on this, a theoretical model describing the full motion process of aggregate is proposed. The calculation formulas for the displacement distances of aggregate along and vertically to the water gush roadway direction in each phase are derived, and the application method of these formulas in practical engineering is provided.

2.1. Numerical Model of Water-Intercepting Aggregate Motion Path

After summarizing and analyzing the characteristics of common water hazards in a coal mine, the inducements of prone-to-occur water gush disasters are categorized into three types: water gush from bedrock aquifers, water gush induced by the instability of separated layer water body, and water gush caused by the damage of the floor that connects the pressurized aquifers [20]. Subsequently, the simplified hydrogeological conditions are illustrated in Figure 1.
Among these, the water gush from bedrock aquifers refers to the situation where the primary fractures in the bedrock aquifer are highly concentrated, and the hydro-conductive fracture zone develops to the highest level of the bedrock aquifer. The effective aquiclude between the aquifer and the roadway roof is penetrated and thus becomes ineffective, resulting in the water gush with a high water pressure acting together [21,22]. Water gush induced by the instability of the separated layer water body means the strong supporting effect of key strata causes a deformation difference between the key strata and the adjacent lower rock layers, thus forming a separated layer space. Under stable conditions of the separated layer space, water enters and accumulates to form separated layer water [23]. When the lower rock layers, namely the aquiclude, rupture, the separated water body instantaneously bursts out causing a water hazard. Water gush caused by the damage of the floor that connects pressurized aquifers refers to the situation where the roadway floor rock layers are damaged due to mining activities, and the development of fractures connects the pressurized water beneath the floor, forming a water-conducting pathway and resulting in water gush [24,25].
Regardless of the inducements, when large volumes of groundwater gush from the working face, the roof and floor, the roadway may be rapidly inundated as a new water gush roadway. The sections traversed by the water flow are highly susceptible to secondary disasters such as roof fall or collapse [26]. At this time, it is necessary to construct directional, through-roadway drilling holes from the surface to rapidly perfuse the aggregate into the water gush roadway, establishing a water interception section for timely water blocking. In this section, a segment of the water gush roadway with a stable current velocity after the water gush is selected, and an aggregate perfusion hole is set above it. The CFD-DEM (Fluent 19.0 and EDEM 2020) coupling method was used [27,28,29]: Within Fluent 19.0, the Eulerian method is employed to compute the flow field of water gush at a specific time state. Within EDEM 2020, the Lagrangian method is employed to transform the flow field data into external forces exerted on individual aggregate. Thereby, the computation of the aggregate motion situation (including the forces, velocity, and position) is updated to simulate the motion of the aggregate from the perfusion hole into the water gush roadway and to determine the complete motion path.
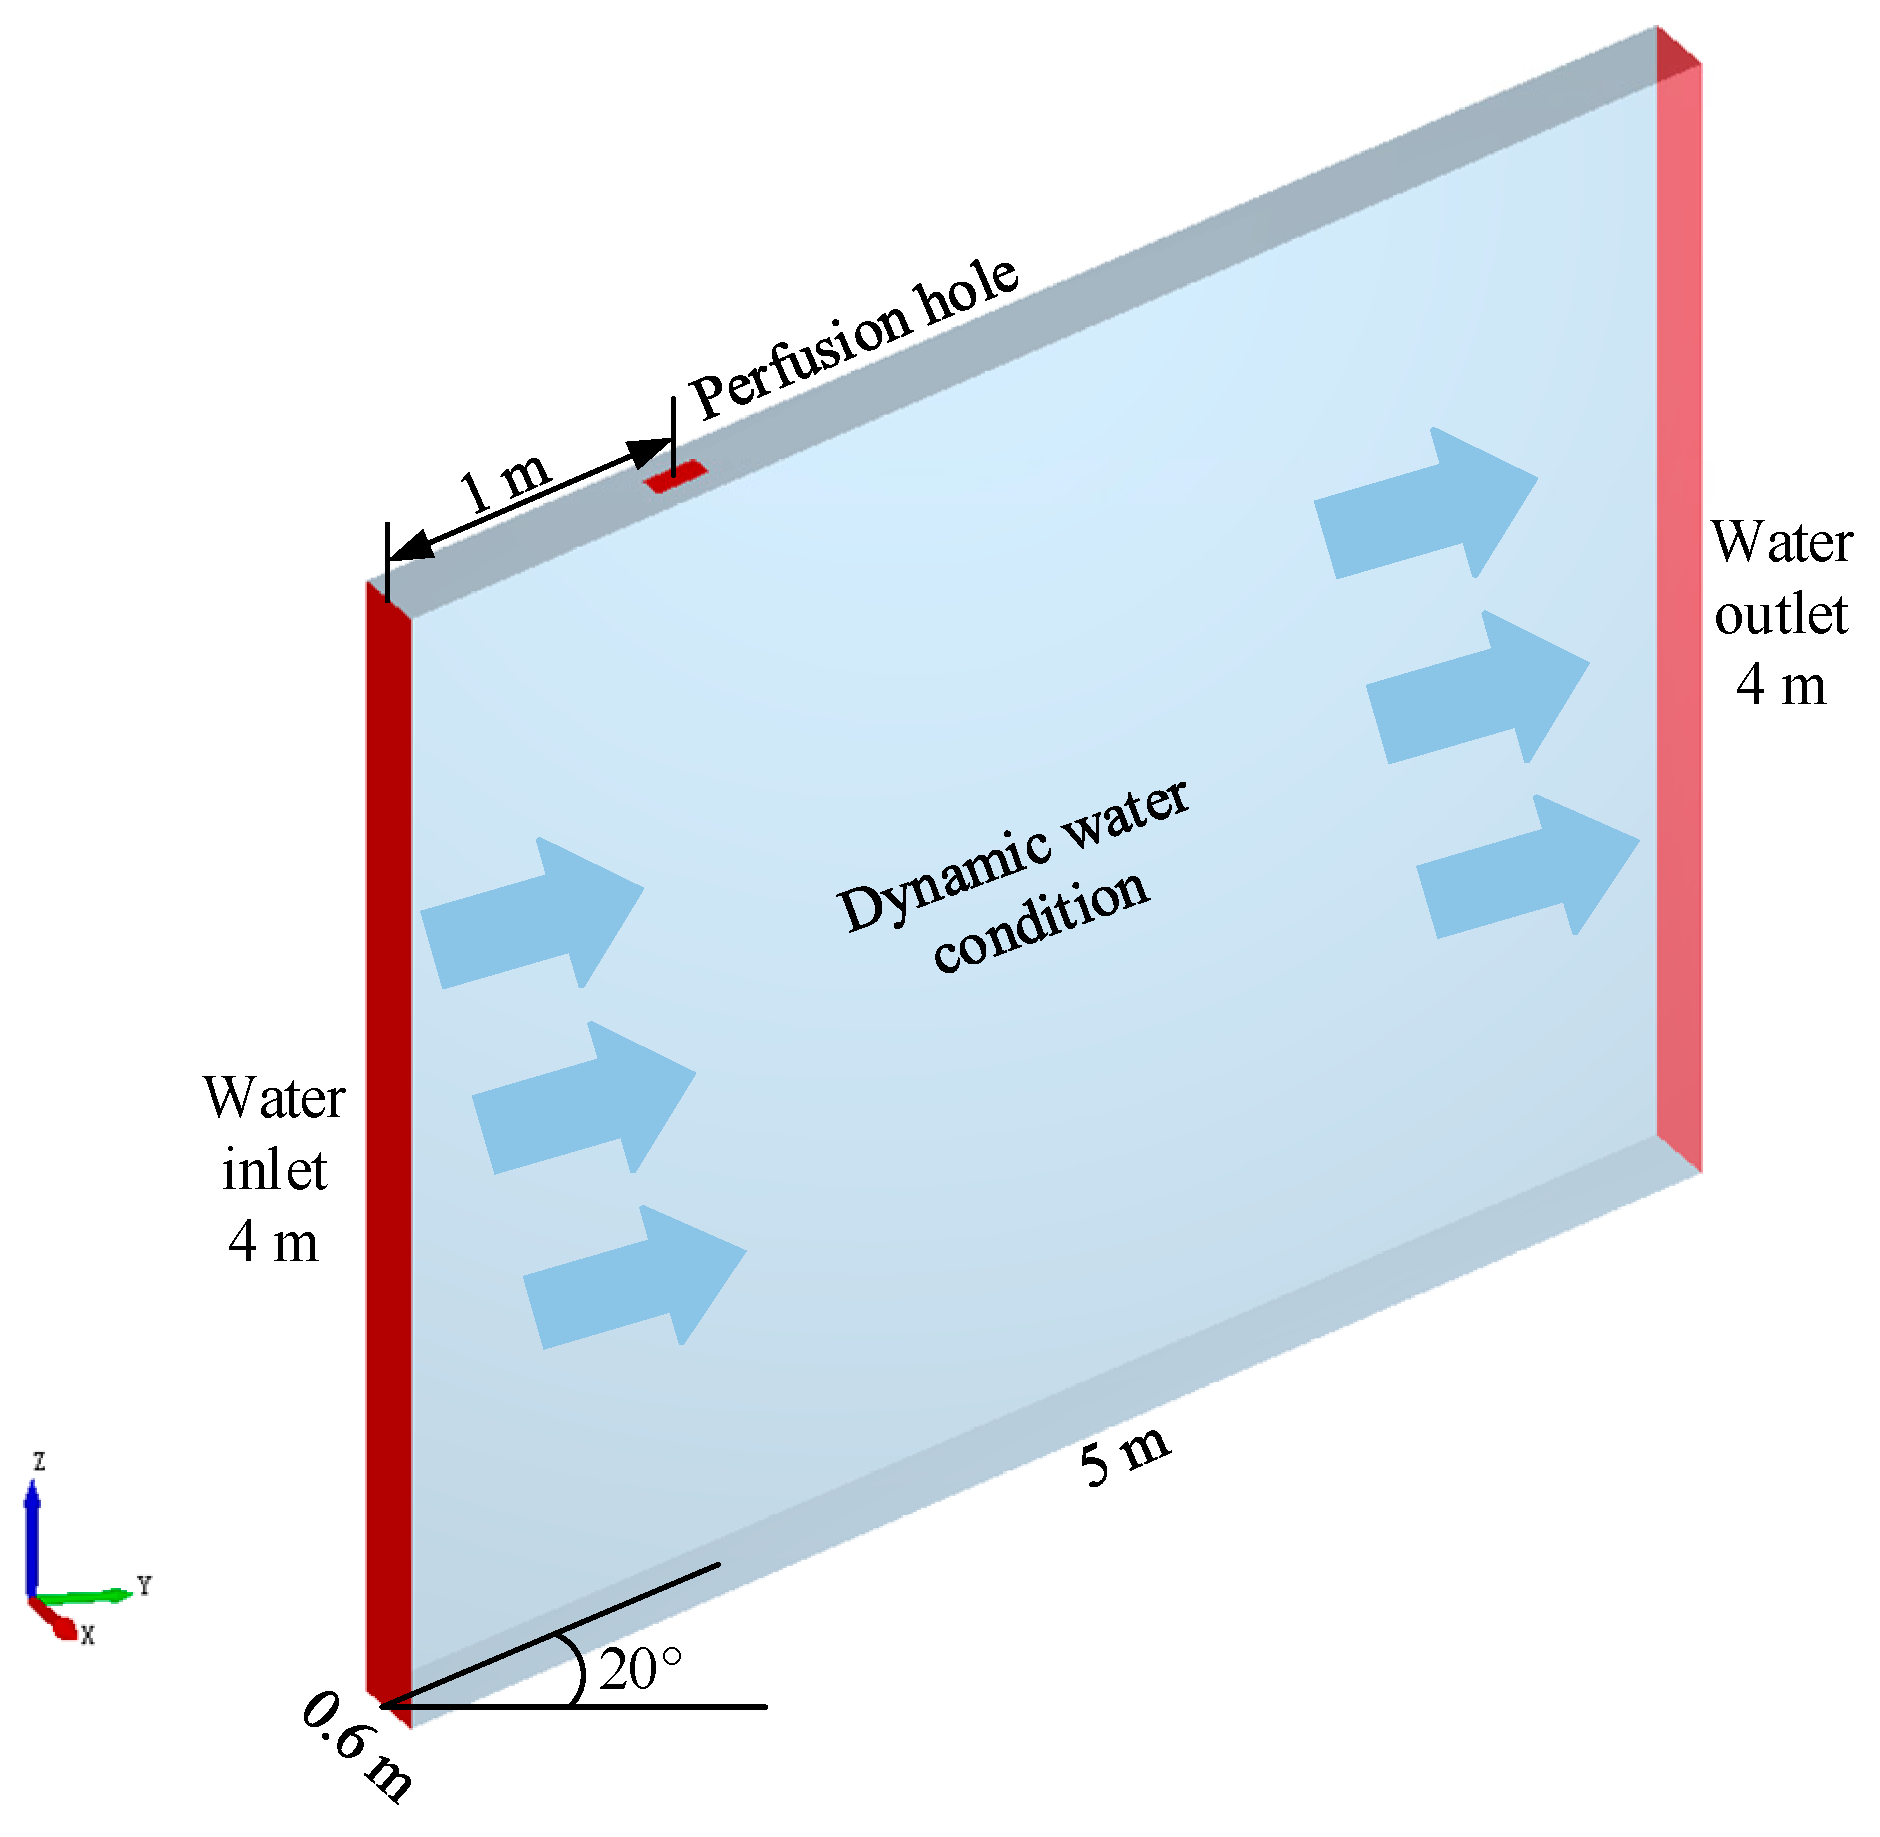
In Fluent 19.0, based on actual engineering conditions, the water gush velocity in the numerical model is set to 0.5 m/s [30]. In order to effectively control the calculation amount, the size of a water gush roadway segment with a stable current velocity and the aggregate cannot escape after the trial calculations are set as 5 m × 0.6 m × 4 m (the cross-sectional dimensions of a rectangular coal–rock roadway are typically 4 m × 4 m [31]). Among them, the length and height of the model are consistent with engineering practice and set in equal proportion, while the width is subjected to large-scale scaling-down based on the principle of distorted similarity. The roadway dip angle is set to 20° (the dip angle of a rectangular coal–rock roadway generally ranges from 10° to 30° [32]). The model size is shown in Figure 2.
In the numerical model, the left boundary of the model is set as a water inlet continuously generating water with a flow velocity of 0.5 m/s. The right boundary is set as a water outlet for water discharge. The remaining four walls are set as solid walls to constrain the water flow as boundary conditions. To simulate the entire water gush process based on all the above boundaries, the aggregate perfusion hole is set 1 m from the left boundary on the upper boundary of the model to ensure that the flow field has stabilized when the aggregate comes into contact with water. The fluid calculation domain within the boundaries is subjected to unstructured cubic mesh division, which can effectively capture the details of the complex flow field while ensuring the calculation stability of Fluent 19.0. Since EDEM 2020 requires that the mesh size in the fluid domain must be greater than or equal to the solid particle size during calculation, to enable the model to meet the numerical simulation needs for the perfusion of aggregate with various sizes in this paper (the water-intercepting aggregate size commonly used in actual engineering is approximately 5–25 mm), the mesh size of the fluid domain should be greater than or equal to 25 mm. When the mesh size is set to 25 mm, the trial calculation time is 12.5 h, and the calculation speed is extremely slow. The calculation results are used at this time as the benchmark for test comparison: when the mesh size is set to 40 mm, the calculation time is 3.05 h, with a relative error of 10.4% compared to that with a mesh size of 25 mm. Although the calculation speed is faster, it does not meet the accuracy requirements. When the mesh size is set to 30 mm, the calculation time is 7.2 h, with a relative error of 1.6% compared to that with a mesh size of 25 mm; although the calculation accuracy is high, the calculation speed is still slow. Finally, after multiple rounds of trial calculations, the mesh size is determined to be 35 mm, with a calculation time of 4.5 h and a relative error of 4.8% compared to that with a mesh size of 25 mm, meeting the accuracy requirements while ensuring the calculation speed.
To circumvent the solid–liquid–gas three phase coupling complex computations, the perfusion hole is modeled as a virtual particle factory (0.2 m × 0.2 m) capable of producing aggregate as required during the simulation [33]. This paper centers on exploring the motion path of an individual aggregate. In the simulation process, the particle factory can produce 100 globular aggregate per second, each having an initial velocity of −1 m/s (along the Z-direction). This setup was implemented to guarantee that the simulation results hold statistical significance.
Within EDEM 2020, the Hertz–Mindlin (no slip) “soft-sphere” model was selected to depict the impact among the aggregate [34]. Meanwhile, for the computation of the drag force, the Gidaspow model, which is well-suited for multiphase flow scenarios and capable of more precisely capturing dynamic characteristics, was adopted [35]. Table 1 shows the determination of the material parameters of the aggregate.
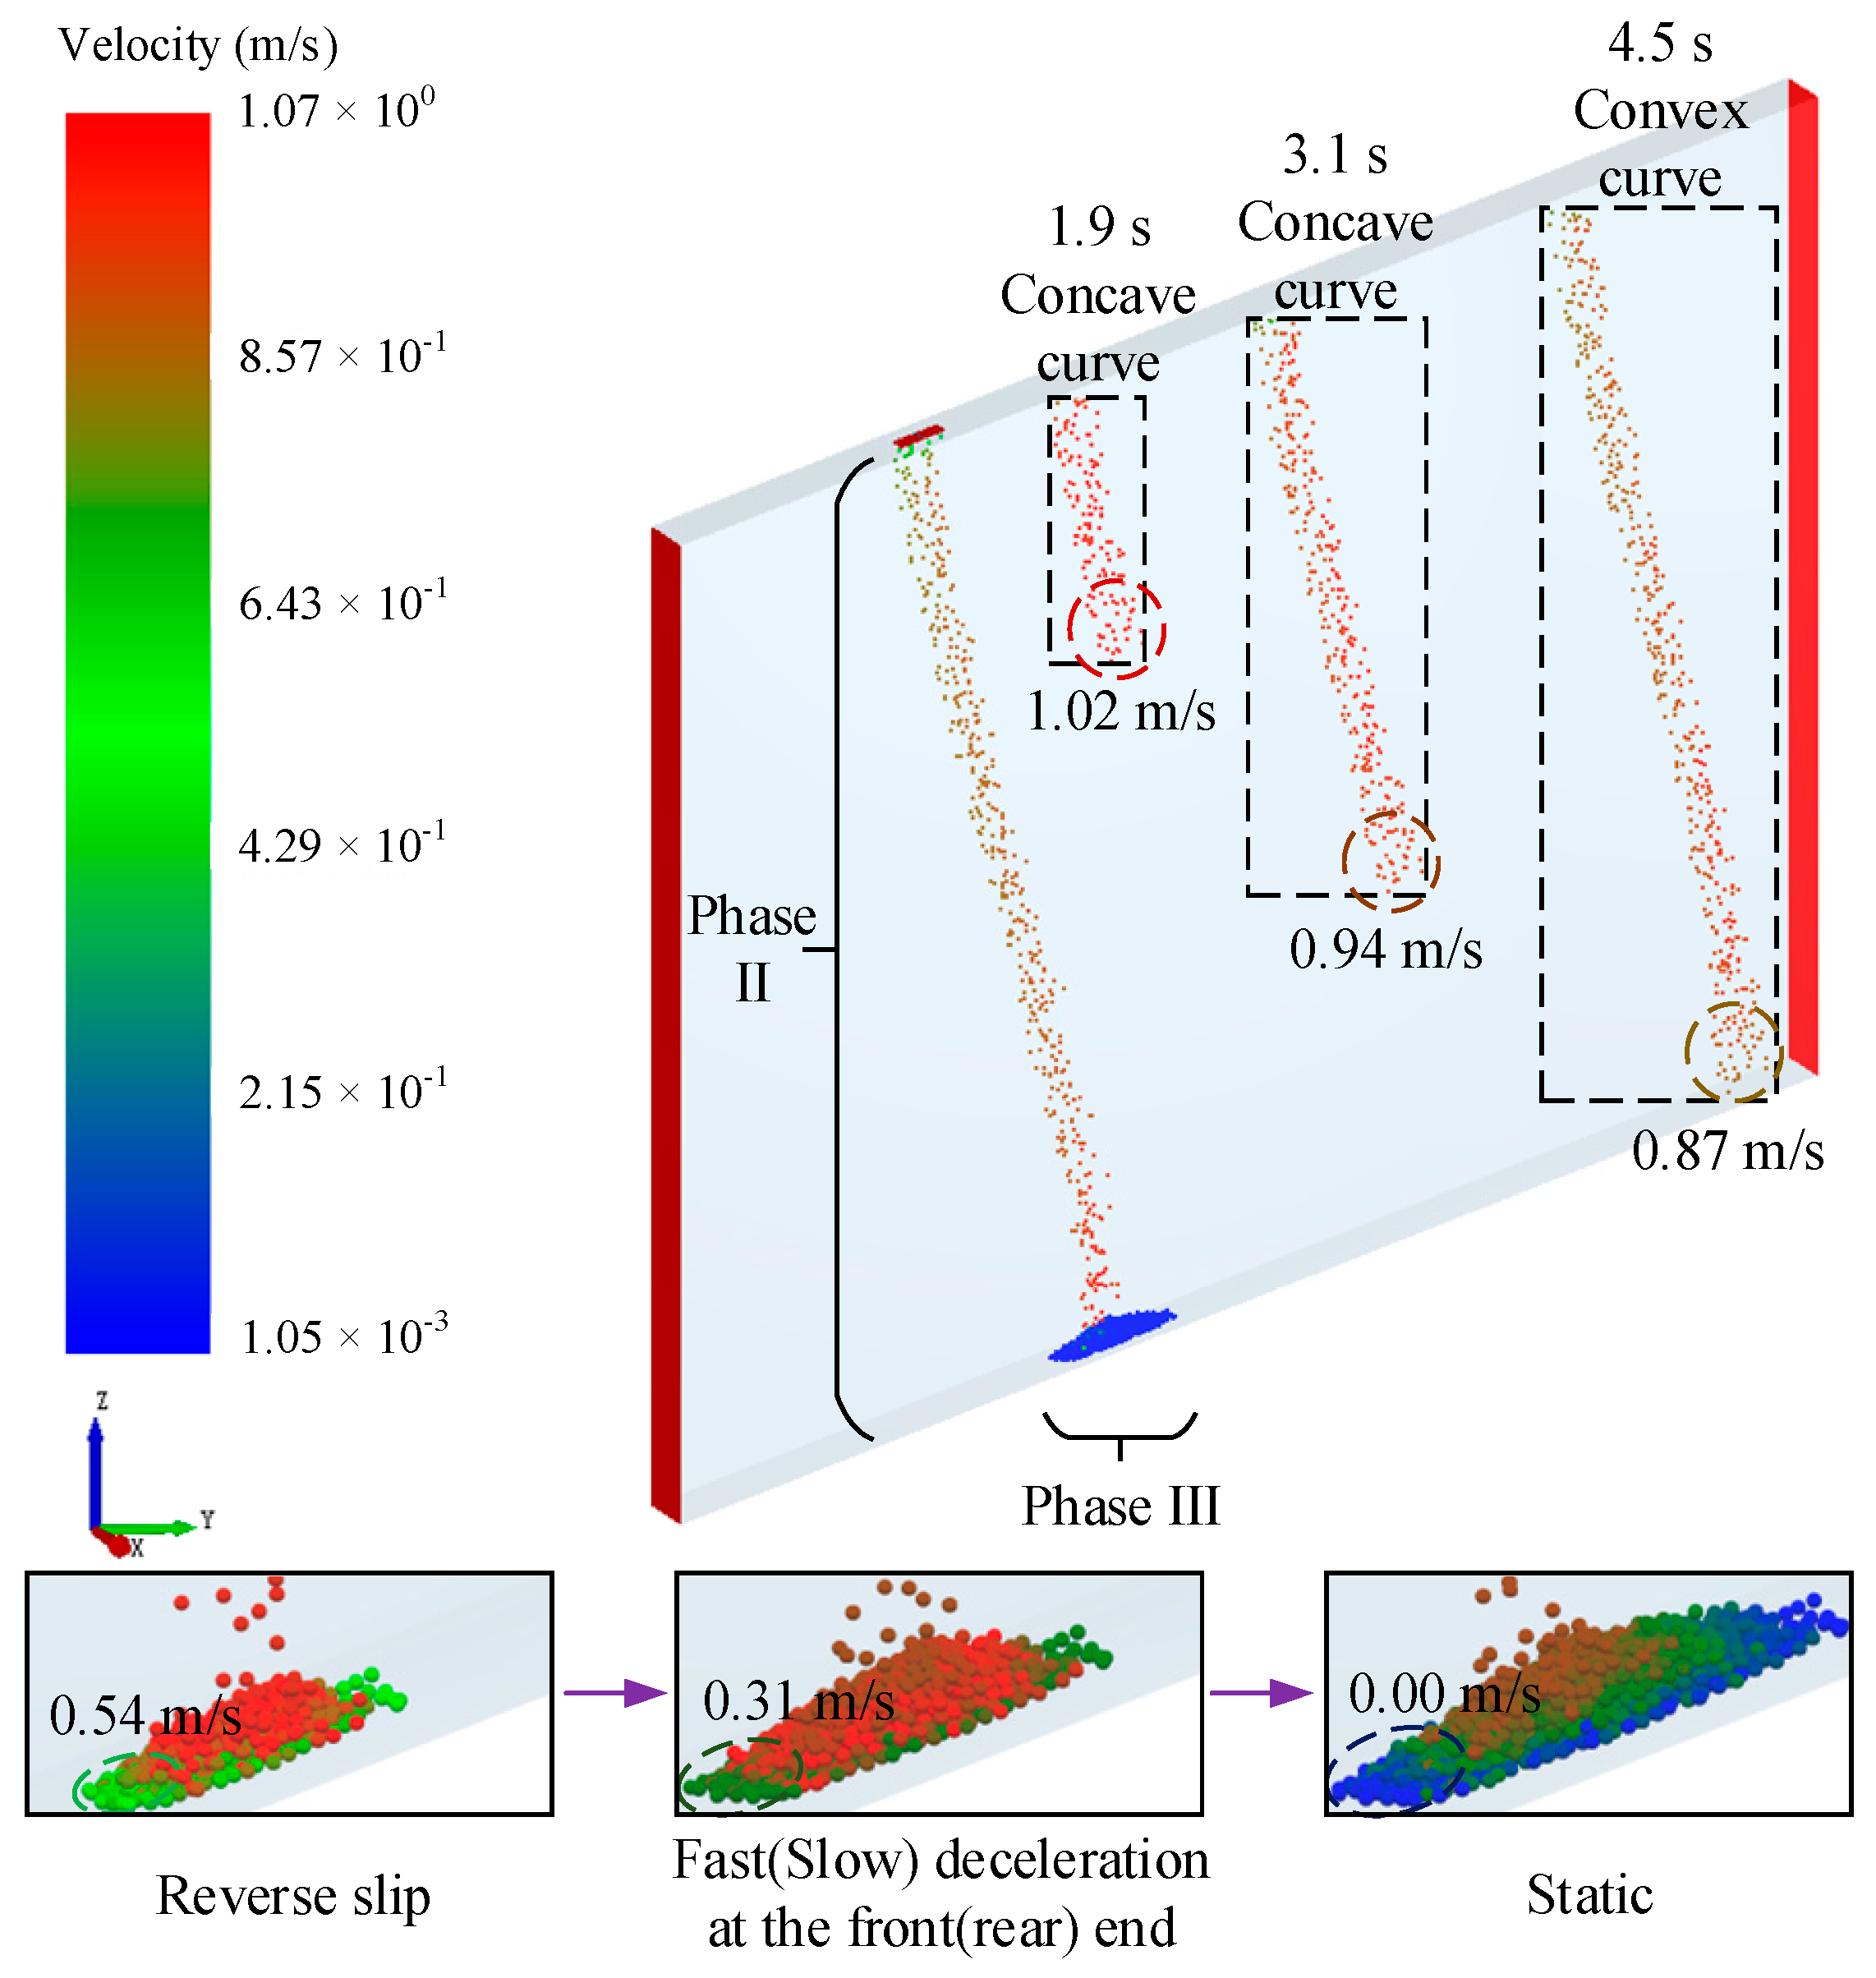
Under the effect of gravitational force (neglecting air drag and collisions between aggregate), the aggregate experiences free-fall motion inside the perfusion hole and the motion paths are clear. Therefore, the simulation results will no longer focus on demonstrating this phase. The detailed numerical simulation results for the motion path of water-intercepting aggregate after entering the water gush roadway and making contact with water are displayed in Figure 3.
Based on the analysis of the simulation and calculation results for the motion path of water-intercepting aggregate within the coal–rock water gush roadway, the complete motion path can be categorized into three characteristic phases. Phase I: The water-intercepting aggregate experiences free-fall motion inside the perfusion hole. Phase II: The water-intercepting aggregate enters the water gush roadway, where it accelerates in the inclined upward water gush roadway direction and decelerates vertically in the inclined upward water gush roadway direction. Overall, it follows a curvilinear projectile motion and settles at the bottom after 4.5 s. Phase III: When the size and density of the aggregate is large and the velocity of the flowing water is low, such that the generated thrust is insufficient to support its forward movement, the aggregate will slip in the direction opposite to the flow velocity direction, as is the situation shown in Figure 3. When the size and density of the aggregate are small and the flowing water velocity is high, the aggregate will slide forward for a certain distance and then come to rest. During its motion in Phase III, the overall performance is that the aggregate in the front section, which first comes into contact with the base of the water gush roadway, decelerates quickly, while the aggregate in the rear section, which sinks to the bottom and starts to slide, decelerates more slowly. When the first aggregate comes to rest, the subsequent aggregate piles up on it.

2.2. Theoretical Model of Water-Intercepting Aggregate Motion Path

Based on the numerical simulation results, this section used physical-mechanical methods to analyze the force characteristics of the water-intercepting aggregate in the water gush roadway at different motion phases. A theoretical model for the water-intercepting aggregate motion in the coal–rock water gush roadway is established, and a calculation formula for predicting the motion distance of aggregate is derived. An application method for actual engineering is provided.
Combined with the numerical simulation results, the complete theoretical motion path of individual aggregate through the perfusion hole and entering the water gush roadway until it settles to the base of the water gush roadway is portrayed in Figure 4.
To simplify the theoretical analysis and computational modeling of the overall motion process of water-intercepting aggregate in the water gush roadway, the following fundamental assumptions are proposed for the diverse influencing factors: (1) the water in the water gush roadway cannot penetrate the roadway; (2) the water in the water gush roadway is directionally uniform and non-compressible; (3) in comparison with the water gush roadway, the perfusion hole width is negligibly small, with the postulation that water does not escape from the hole; (4) aggregate is postulated as globular particles with a homogeneous mass; (5) prior to the aggregate entering the perfusion hole and making contact with water, it experiences free-fall motion, with the effects of air resistance and mutual collisions among the aggregate being neglected; (6) the interior of the water gush roadway is postulated as a homogeneous plane with a uniform friction coefficient throughout; (7) the motion of the aggregate in the water gush roadway falls under the category of solid–liquid two-phase pipe flow problems; (8) before the aggregate is perfused, the current velocity in the water gush roadway is high, and the state of flow is turbulent (the Reynolds number Re > 4000, and all subsequent analyses of the various forces acting on the aggregates are based on this Reynolds number); (9) when the aggregate enters the water gush roadway and forms a water-intercepting barrier, the current velocity in the roadway decreases and the flow regime transitions to a state between turbulent and laminar flow [36].
Phase I: Under the previously stated assumptions of ignoring mutual collisions between aggregate and air resistance, the aggregate undergoes free fall in the perfusion hole. In this phase, the water-intercepting aggregate motion and force are shown in Figure 5.
Water-intercepting aggregate self-gravity Gs (spheres with uniform mass):
G s = ρ s V s g = ρ s 4 3 π d s 2 3 g = π d s 3 ρ s g / 6
where ρs is aggregate density—the unit is kg/m3; Vs is aggregate volume—the unit is m3; g is gravitational acceleration—the value is 9.8 m/s2; ds is aggregate size—the unit is m.
In phase I, the water-intercepting aggregate displacement distances in the direction along and vertically to the water gush roadway are shown in Equation (2):
X I = 0 Y I = h I
The aggregate undergoes free fall motion in the perfusion hole until it comes into contact with the water in the roadway. Assuming the falling height of the aggregate is hI, the falling time is tI(D) = 2 h I / g , and upon contacting the water, the instantaneous velocity of aggregate is vI(D) = 2 g h I .
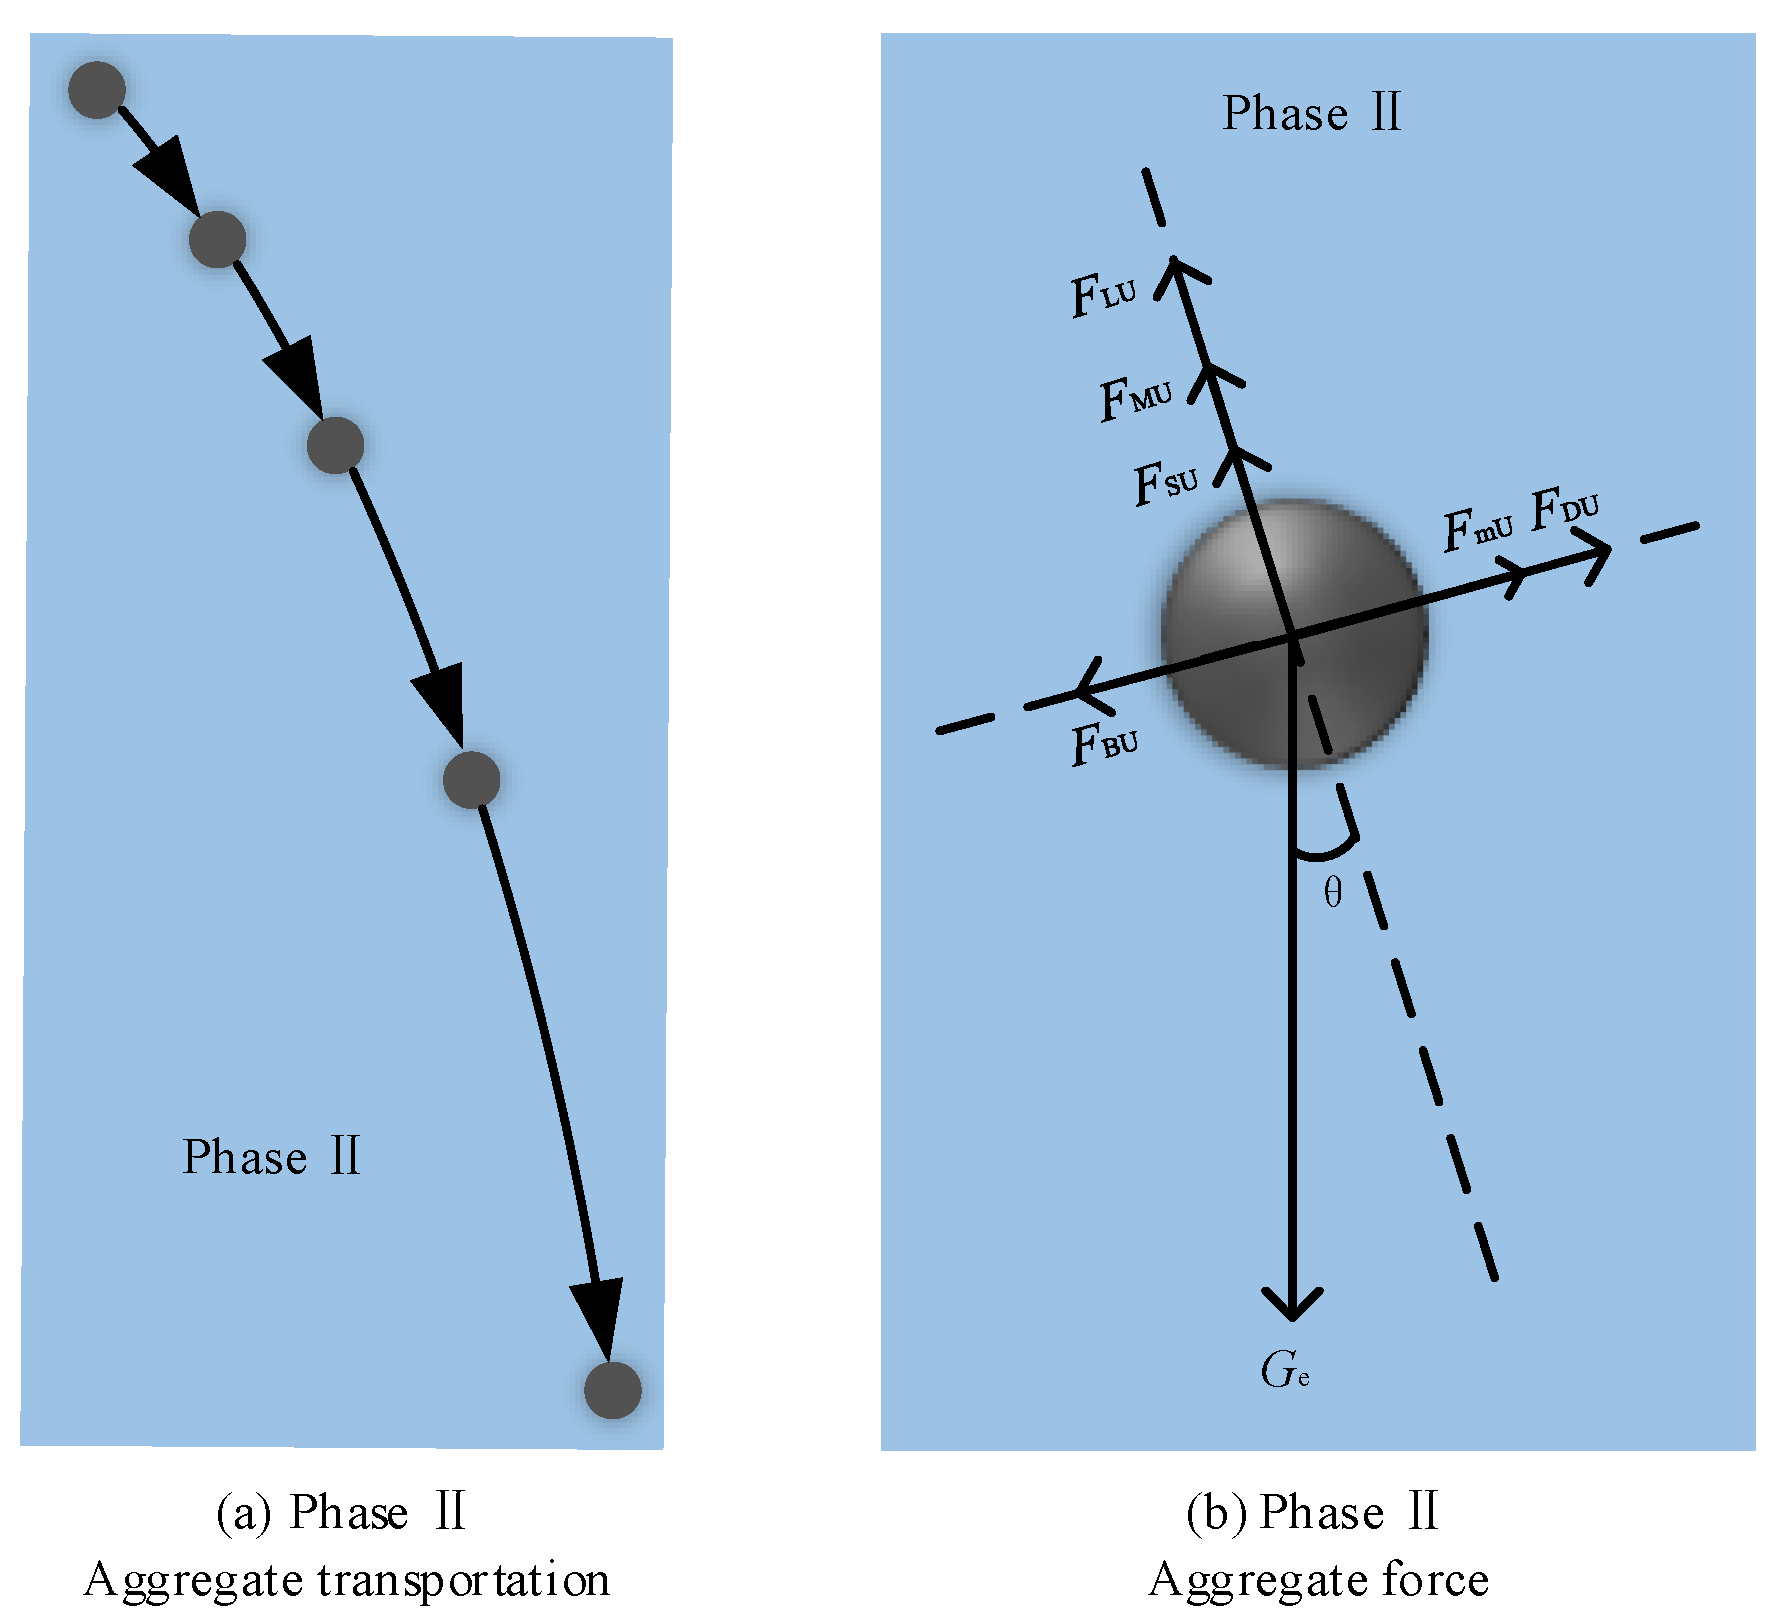
Phase II: the aggregate makes curvilinear projectile motion in the water gush roadway. In this phase, the water-intercepting aggregate motion and force are shown in Figure 6.
FDU is the drag force provided by the water flow to the aggregate in the direction along the water gush roadway (inclined upward) [37]:
F DU = C D ρ w μ r x U 2 S / 2 = π C D ρ w v w x U v s x U 2 d s 2 / 8
where CD is the water flow drag coefficient, dimensionless quantity; μrxU is the velocity difference between water flow and aggregate along the water gush roadway direction (x-direction)—the unit is m/s; S is the water-projected area of aggregate normal to the flow direction—the unit is m2; vwxU is the water gush velocity along the roadway direction (x-direction)—the unit is m/s; vsxU is the water-intercepting aggregate motion velocity along the roadway direction—the unit is m/s.
FmU is the additional mass force provided by the water flow to the aggregate in the direction along the water gush roadway (inclined upward) [38]:
F mU = π d s 3 ρ w d v w x U d v s x U / 12 d t II ( D )
where tII(D) is the water-intercepting aggregate curvilinear projectile motion time in phase II—the unit is s.
FBU is the Basset force provided by the water flow to the aggregate in the direction opposite to the water gush roadway (inclined upward) [39]:
F BU = 3 2 d s 2 π μ ρ w 0 t II ( D ) d v w x U d v s x U d t II ( D ) d t II ( D ) t II ( D ) t II ( D ) 1 / 2
where μ is the water viscosity—the unit is Pa·s.
Ge is the apparent gravity of aggregate in the water:
G e = π d s 3 ρ s ρ w g / 6
FLU is the lifting force provided by the water flow to the aggregate in the direction vertical to the water gush roadway (inclined upward) [40]:
F LU = C D ρ w μ r y U 2 S / 2 = π C D ρ w v w y U v s y U 2 d s 2 / 8
where μryU is the velocity difference between water flow and aggregate vertical to the water gush roadway direction (y-direction)—the unit is m/s; vwxU is the water gush velocity vertical to the roadway direction (y-direction)—the unit is m/s; vsxU is water-intercepting aggregate motion velocity vertical to the roadway direction—the unit is m/s.
FMU is the Magnus force provided by the water flow to the aggregate in the direction vertical to the water gush roadway (inclined upward) [41]:
F MU = π d s 3 ρ w ω d v w x U d v s x U / 8
where ω is the rotational palstance for the motion process of aggregate—the unit is rad/s.
FSU is the Saffman force provided by the water flow to the aggregate in the direction vertical to the water gush roadway (inclined upward) [42]:
F SU = 1.61 d s 2 ρ w μ v w y U / y 1 2 d v w x U d v s x U
where ∂vwyU/∂y is the water gush velocity gradient.
Then, establish the mechanical equilibrium equation for an individual aggregate in the direction along the water gush (inclined upward):
F DU + F mU + G e sin θ F BU = m a x U
Substitute the force FDU, FmU, FBU, and Gesinθ in the direction along the water gush into Equation (10):
π C D ρ w v w x U v s x U 2 d s 2 / 8 + π d s 3 ρ w d v w x U d v s x U / 12 d t II D π d s 3 ( ρ s ρ w ) g sin θ / 6 1.5 d s 2 π μ ρ w 0 t II D d v w x U d v s x U d t II D / t II D t II D 1 / 2 d t II D = π d s 3 ρ s d v s x / 6 d t II D
Neglecting the exceedingly minor force water flow exerted on the aggregate in the direction along the water gush roadway, the following is obtained:
π C D ρ w v w x U v s x U 2 d s 2 / 8 π d s 3 ( ρ s ρ w ) g sin θ / 6 = π d s 3 ρ s d v s x / 6 d t II D
Substitute vsxU = dXII/dtII(D), boundary condition XII|tII(D)=0 = 0 and vsxU|tII(D)=0 = − 2 g h I sinθ into Equation (12), and let A = 4 d s ρ s g ( 1 ρ w / ρ s ) sin θ / 3 C D ρ w . By integrating and simplifying the above equation, the expression for the water-intercepting aggregate displacement distance along the water gush roadway in phase II can be derived:
X II = v w x U t II D + A t II D + 4 d s ρ s 3 C D ρ w ln v w x U + 2 g h I sin θ A e 3 A t II D C D ρ w 2 d s ρ s v w x U + 2 g h I sin θ + A 2 A
Establish the mechanical equilibrium equation for an individual aggregate in the direction vertical to the water gush roadway (inclined upward):
G e cos θ F LU F MU F SU = m a y U
Substitute the force FLU, FMU, FSU, and Gecosθ in the direction vertical to the water gush roadway into Equation (14) to obtain the following:
π d s 3 ρ s ρ w g cos θ / 6 π C D ρ w v w y U v s y U 2 d s 2 / 8 π d s 3 ρ w ω d v w x U d v s x U / 8 1.61 d s 2 ρ w μ v w y U / y 1 / 2 d v w x U d v s x U = π d s 3 ρ s d v s y U / 6 d t II D
Neglecting the exceedingly minor force water flow exerted on the aggregate in the direction vertical to the water gush, the following is obtained:
π d s 3 ρ s ρ w g cos θ / 6 π C D ρ w v w y U v s y U 2 d s 2 / 8 = π d s 3 ρ s d v s y U / 6 d t II D
Substitute vsyU = dYII/dII(D), boundary condition YII|tII(D)=0 = 0 and vsyU|tII(D)=0 = 2 g h I cosθ into Equation (13). By integrating and simplifying the above equation, the expression for the water-intercepting aggregate displacement distance in the direction vertical to the water gush roadway in phase II can be derived:
Y II = 4 d s ρ s 3 C D ρ w ln 2 g h I cos θ + A e 3 A t II D C D ρ w 2 d s ρ s 2 g h I cos θ A / 2 A A t II D
The water-intercepting aggregate displacement distance in the direction along and vertically to the water gush roadway (inclined upward) in phase II are, respectively, as follows:
X II = v w x U t II D + A t II D + 4 d s ρ s 3 C D ρ w ln v w x U + 2 g h I sin θ A e 3 A t II D C D ρ w 2 d s ρ s v w x U + 2 g h I sin θ + A 2 A Y II = 4 d s ρ s 3 C D ρ w ln 2 g h I cos θ + A e 3 A t II D C D ρ w 2 d s ρ s 2 g h I cos θ A 2 A A t II D
Equation (17) provides the expression for the water-intercepting aggregate displacement distance YII and motion time tII(D) in the direction vertical to the water gush roadway in phase II. By substituting the water gush roadway height H into this equation, tII(D) can be solved. Subsequently, substituting tII(D) into Equation (13) yields the water-intercepting aggregate curvilinear projectile motion distance XII along the water gush roadway.
Phase III: the aggregate makes a sliding motion at the base of the water gush roadway. Influenced by the frictional force, the velocity of the water-intercepting aggregate gradually decreases until rest, and the motion path follows a straight line. In this phase, the aggregate motion and force are displayed in Figure 7.
Listing the equilibrium equation using the kinetic energy theorem as follows:
F DU G e sin θ f G e cos θ F LU X III = 1 2 m v s x U 2 2 1 2 m v s x U 1 2
where F DU and F L U are the mean values of FDU and FLU, respectively. The specific calculation methods are as follows:
F DU = 1 v w x U v w x U 0 1 8 π C D ρ w v w x U 2 d s 2 d v w x U = 1 24 π C D ρ w v w x U 2 d s 2
F LU = 1 v w y U v w y U 0 1 8 π C D ρ w v w y U 2 d s 2 d v w y U = 1 24 π C D ρ w v w y U 2 d s 2
F L U can be neglected, as the water flow velocity vwyU in the direction vertical to the water gush roadway is remarkably low. Thus, Equation (19) can be reduced to (22):
F DU G e sin θ + f cos θ X III = 1 2 m v s x U 2 2 1 2 m v s x U 1 2
The water-intercepting aggregate starting velocity vsx1 in phase III is equal to its velocity at the end of phase II motion. The specific calculation method is the following:
v s x 1 = v s x U = v w x U A + 2 A 1 v w x U + 2 g h I sin θ + A v w x U + 2 g h I sin θ A e 3 C D ρ w A t II D 2 d s ρ s
Equation (23) provides the expression for the water-intercepting aggregate velocity vsxU and the water gush velocity vwxU in phase III. Substituting these values into Equation (22) yields the water-intercepting aggregate sliding motion distance XIII along the water gush in phase III as follows:
X III = 2 d s ρ s v w x U A + 2 A / 1 v w x U + 2 g h I sin θ + A v w x U + 2 g h I sin θ A e 3 C D ρ w A t II D 2 d s ρ s 2 C D ρ w 2 v w x U 2 4 d s g ρ s ρ w sin θ + f cos θ
The water-intercepting aggregate displacement distance in the direction along and vertically to the water gush roadway (inclined upward) in phase III are, respectively, the following:
X III = 2 d s ρ s v w x U A + 2 A / 1 v w x U + 2 g h I sin θ + A v w x U + 2 g h I sin θ A e 3 C D ρ w A t II D 2 d s ρ s 2 C D ρ w 2 v w x U 2 4 d s g ρ s ρ w sin θ + f cos θ Y III = 0
From the calculation formula for an individual aggregate displacement distance in phase II and III in Equations (18) and (25), it can be seen that the aggregate size influences the individual aggregate motion path and thereby controls the aggregate particle group motion process [43]. Therefore, to ensure that the calculation formula for the individual aggregate displacement distance in phase II and III is also applicable to the aggregate particle group, the aggregate volume concentration Sv is introduced to correct the aggregate size ds based on the existing formula [44]. Among them, the relationship between the corrected aggregate size D and the aggregate volume concentration Sv is shown in Equation (26) as follows:
D = d s ( 1 + Sv ) x
where Sv is the aggregate volume concentration in the water gush roadway. When the amount of aggregate in the water gush roadway is small at the initial stage of perfusion, D is the individual aggregate size. x is an undetermined coefficient. x = (1200 ds2 + 12.15)Sv3.31ds−0.74.
Substituting the corrected aggregate size D into Equations (18) and (25), the calculation formula for the aggregate particle group displacement distance in phase II and III can be obtained.
Among them, the water-intercepting aggregate particle group displacement distance in the direction along and vertically to the water gush roadway (inclined upward) in phase II are, respectively, the following:
X II = v w x U t II D + A t II D + 4 D ρ s 3 C D ρ w ln v w x U + 2 g h I sin θ A e 3 A t II D C D ρ w 2 D ρ s v w x U + 2 g h I sin θ + A 2 A Y II = 4 D ρ s 3 C D ρ w ln 2 g h I cos θ + A e 3 A t II D C D ρ w 2 D ρ s 2 g h I cos θ A 2 A A t II D
The water-intercepting aggregate particle group displacement distance in the direction along and vertically to the water gush roadway (inclined upward) in phase III are, respectively, the following:
X III = 2 D ρ s v w x U A + 2 A / 1 v w x U + 2 g h I sin θ + A v w x U + 2 g h I sin θ A e 3 C D ρ w A t II D 2 D ρ s 2 C D ρ w 2 v w x U 2 4 D g ρ s ρ w sin θ + f cos θ Y III = 0
The water gush velocity is relatively high, exerting a significant influence on the water-intercepting aggregate motion path. According to the theoretical model of the motion path of the individual water-intercepting aggregate established in this section and the calculation formula for the corrected aggregate particle group displacement distance, which is combined with the specific actual engineering parameters, the reasonable interval between the first perfusion hole and the subsequent perfusion holes in the same plane can be determined.

3. Results and Discussion

This section first conducts a parameter analysis of various factors influencing the aggregate motion path in the water-intercepting aggregate theoretical motion model. This is conducted to clarify the influence rules of each factor on the aggregate motion distance under different working conditions. Then, the accuracy of the calculation formulas and the results from the parameter analysis are verified by combining numerical simulations. Finally, based on the research of this paper, discussions are carried out on the design of the perfusion hole spacing for water-intercepting aggregate, as well as the selection of aggregate sizes and densities.

3.1. Analysis and Results of Factors Influencing the Motion Path of Aggregate

Analyzing the theoretical model for the motion path of water-intercepting aggregate in the water gush roadway reveals that, beyond the water flow resistance coefficient, which can be determined based on the current velocity, the aggregate density and size, the water gush roadway dip angle and height, and the current velocity all serve as influencing factors directly controlling the aggregate displacement distance. For this reason, this section shows the designed orthogonal test plans with multiple factors and levels to examine the parameters involved in the previous theoretical formulas. In addition, according to the results, uses range analysis to explore the influence of various factors on the aggregate displacement distance under different engineering conditions. The rationality of the parameter analysis was then validated by integrating the numerical simulation results.
An L25(55) orthogonal test scheme with five factors and five levels was designed to conduct the test calculations on the parameters involved in Equations (27) and (28). Among them, the aggregate density and size, the water gush roadway dip angle and height, and the current velocity were adopted from the Table 2 parameter settings.
The calculation results of the orthogonal test for the motion path of the water-intercepting aggregate in the water gush roadway are displayed in Table 3.
For the calculation results of the orthogonal test on the water-intercepting aggregate motion path in the water gush roadway, multi-factor analysis of variance (ANOVA) was used to judge the parameter significance under different cross-levels of various influencing factors. The analysis determined that the water-intercepting aggregate density and size, the water gush roadway dip angle and height, and the current velocity all exhibit significance. This indicates that these five factors, as main effects, will have differential influences on the displacement distances XII and XIII in phase II and III.
Then, built on the test results, the range analysis was used to explore the impact of individual factors on the displacement distances XII and XIII of the water-intercepting aggregate in the water gush roadway during phase II and III. The result of the range analysis in phase II is shown in Table 4.
The result of the range analysis in phase III is shown in Table 5.
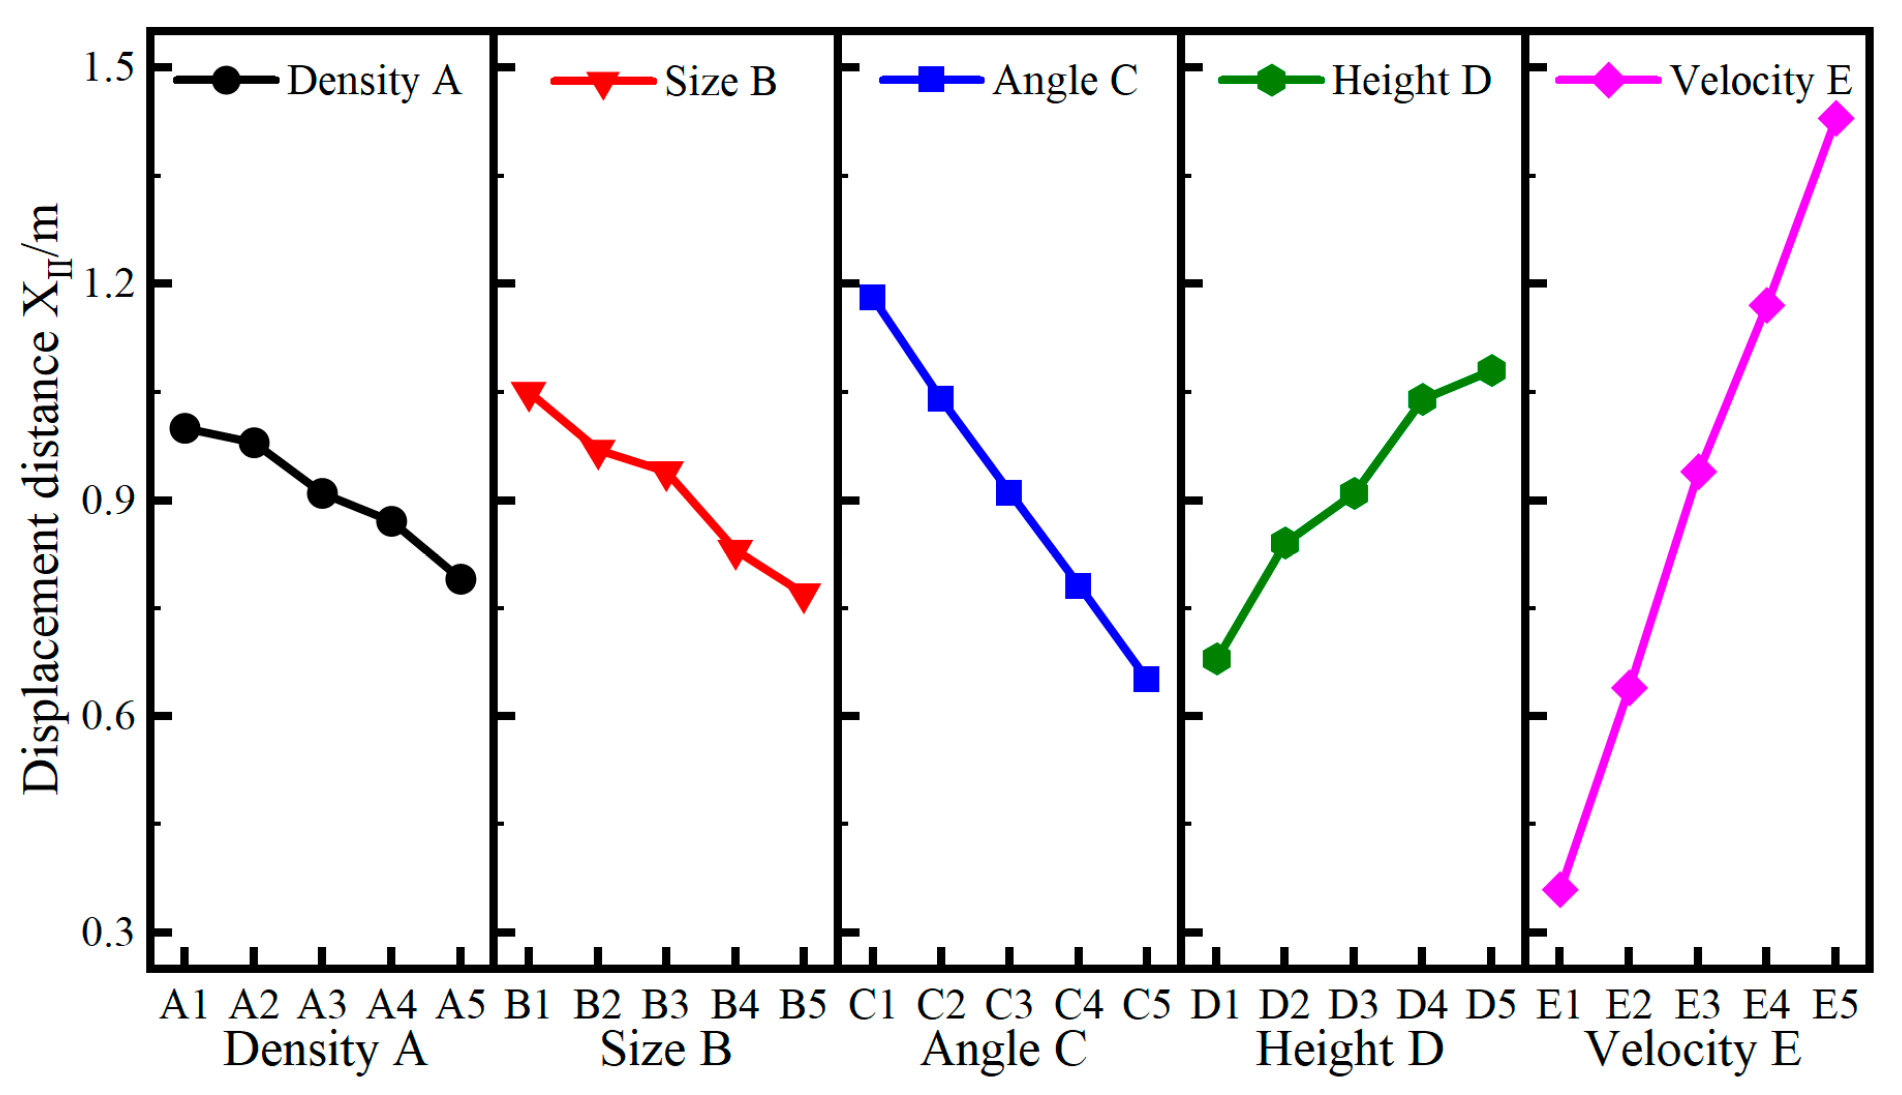
According to the results of the range analysis, the ranking of influencing factors by significance for the water-intercepting aggregate displacement distance in the water gush roadway during phase II is as follows: current velocity > water gush roadway dip angle > water gush roadway height > aggregate size > aggregate density. The ranking of the influencing factors by significance for the water-intercepting aggregate displacement distance in the water gush roadway during phase III is as follows: aggregate size > current velocity > water gush roadway dip angle > water gush roadway height > aggregate density. To further analyze the impact of each factor on the displacement distance, the different factors and the mean values of the displacement distances XII and XIII in phase II and III along the water gush roadway direction were plotted as curve graphs, and the final results are displayed in Figure 8 and Figure 9.
It can be seen from the results of the range analysis that the aggregate density, aggregate size, and water gush roadway dip angle are negatively correlated with the water-intercepting aggregate displacement distance along the water gush roadway direction in phase II and III; the water gush roadway height and current velocity have a positive correlation with the water-intercepting aggregate displacement distance along the water gush roadway direction in phase II and III.
The rationality of the theoretical model and the parametric analysis results were validated through numerical simulations. Combined with the parameter analysis of the motion path theoretical model for the water-intercepting aggregate in the water gush roadway, the aggregate density and size, water gush roadway dip angle and height, and the current velocity, acting as the main effects, will have differential influences on the displacement distances XII and XIII in phase II and III. However, in an actual water gush disaster, the current velocity, an objective condition, cannot be modified and the aggregate density and size can be mutually regulated. Thus, in numerical simulations, only the aggregate size, which has a higher subjective influence degree, was used to verify the motion path of the aggregate. The detailed aggregate parameters (with three sizes from small to large) are shown in Table 6, and the calculation model is the same as before.
The comparison of the curvilinear projectile distances in phase II for the sizes of 10 mm, 15 mm, and 20 mm of water-intercepting aggregate (same density: 2600 kg/m3) under the same engineering condition is displayed in Figure 10.
Phase II: the curvilinear projectile distance of 15 mm aggregate along the water gush roadway direction is 0.83 m (the theoretical model-derived result is 0.91 m, presenting an 8.8% error); the curvilinear projectile distance of 20 mm aggregate along the water gush roadway direction is closer than that of the 15 mm aggregate, which is 0.79 m (the theoretical model-derived result is 0.84 m, presenting a 6.0% error); the curvilinear projectile distance of 10 mm aggregate along the water gush roadway direction is farther than that of the 15 mm aggregate, which is 0.90 m (the theoretical model-derived result is 0.97 m, presenting a 6.0% error). The errors between the numerical simulation test results of the above three groups and the theoretical model-derived results are within a 10% margin. Furthermore, a comparison of the three test groups reveals that when the aggregate density and other parameters are held constant, increasing the aggregate size leads to a decrease in the aggregate displacement distance in phase II. This finding is in agreement with the results of the theoretical model parameter analysis.
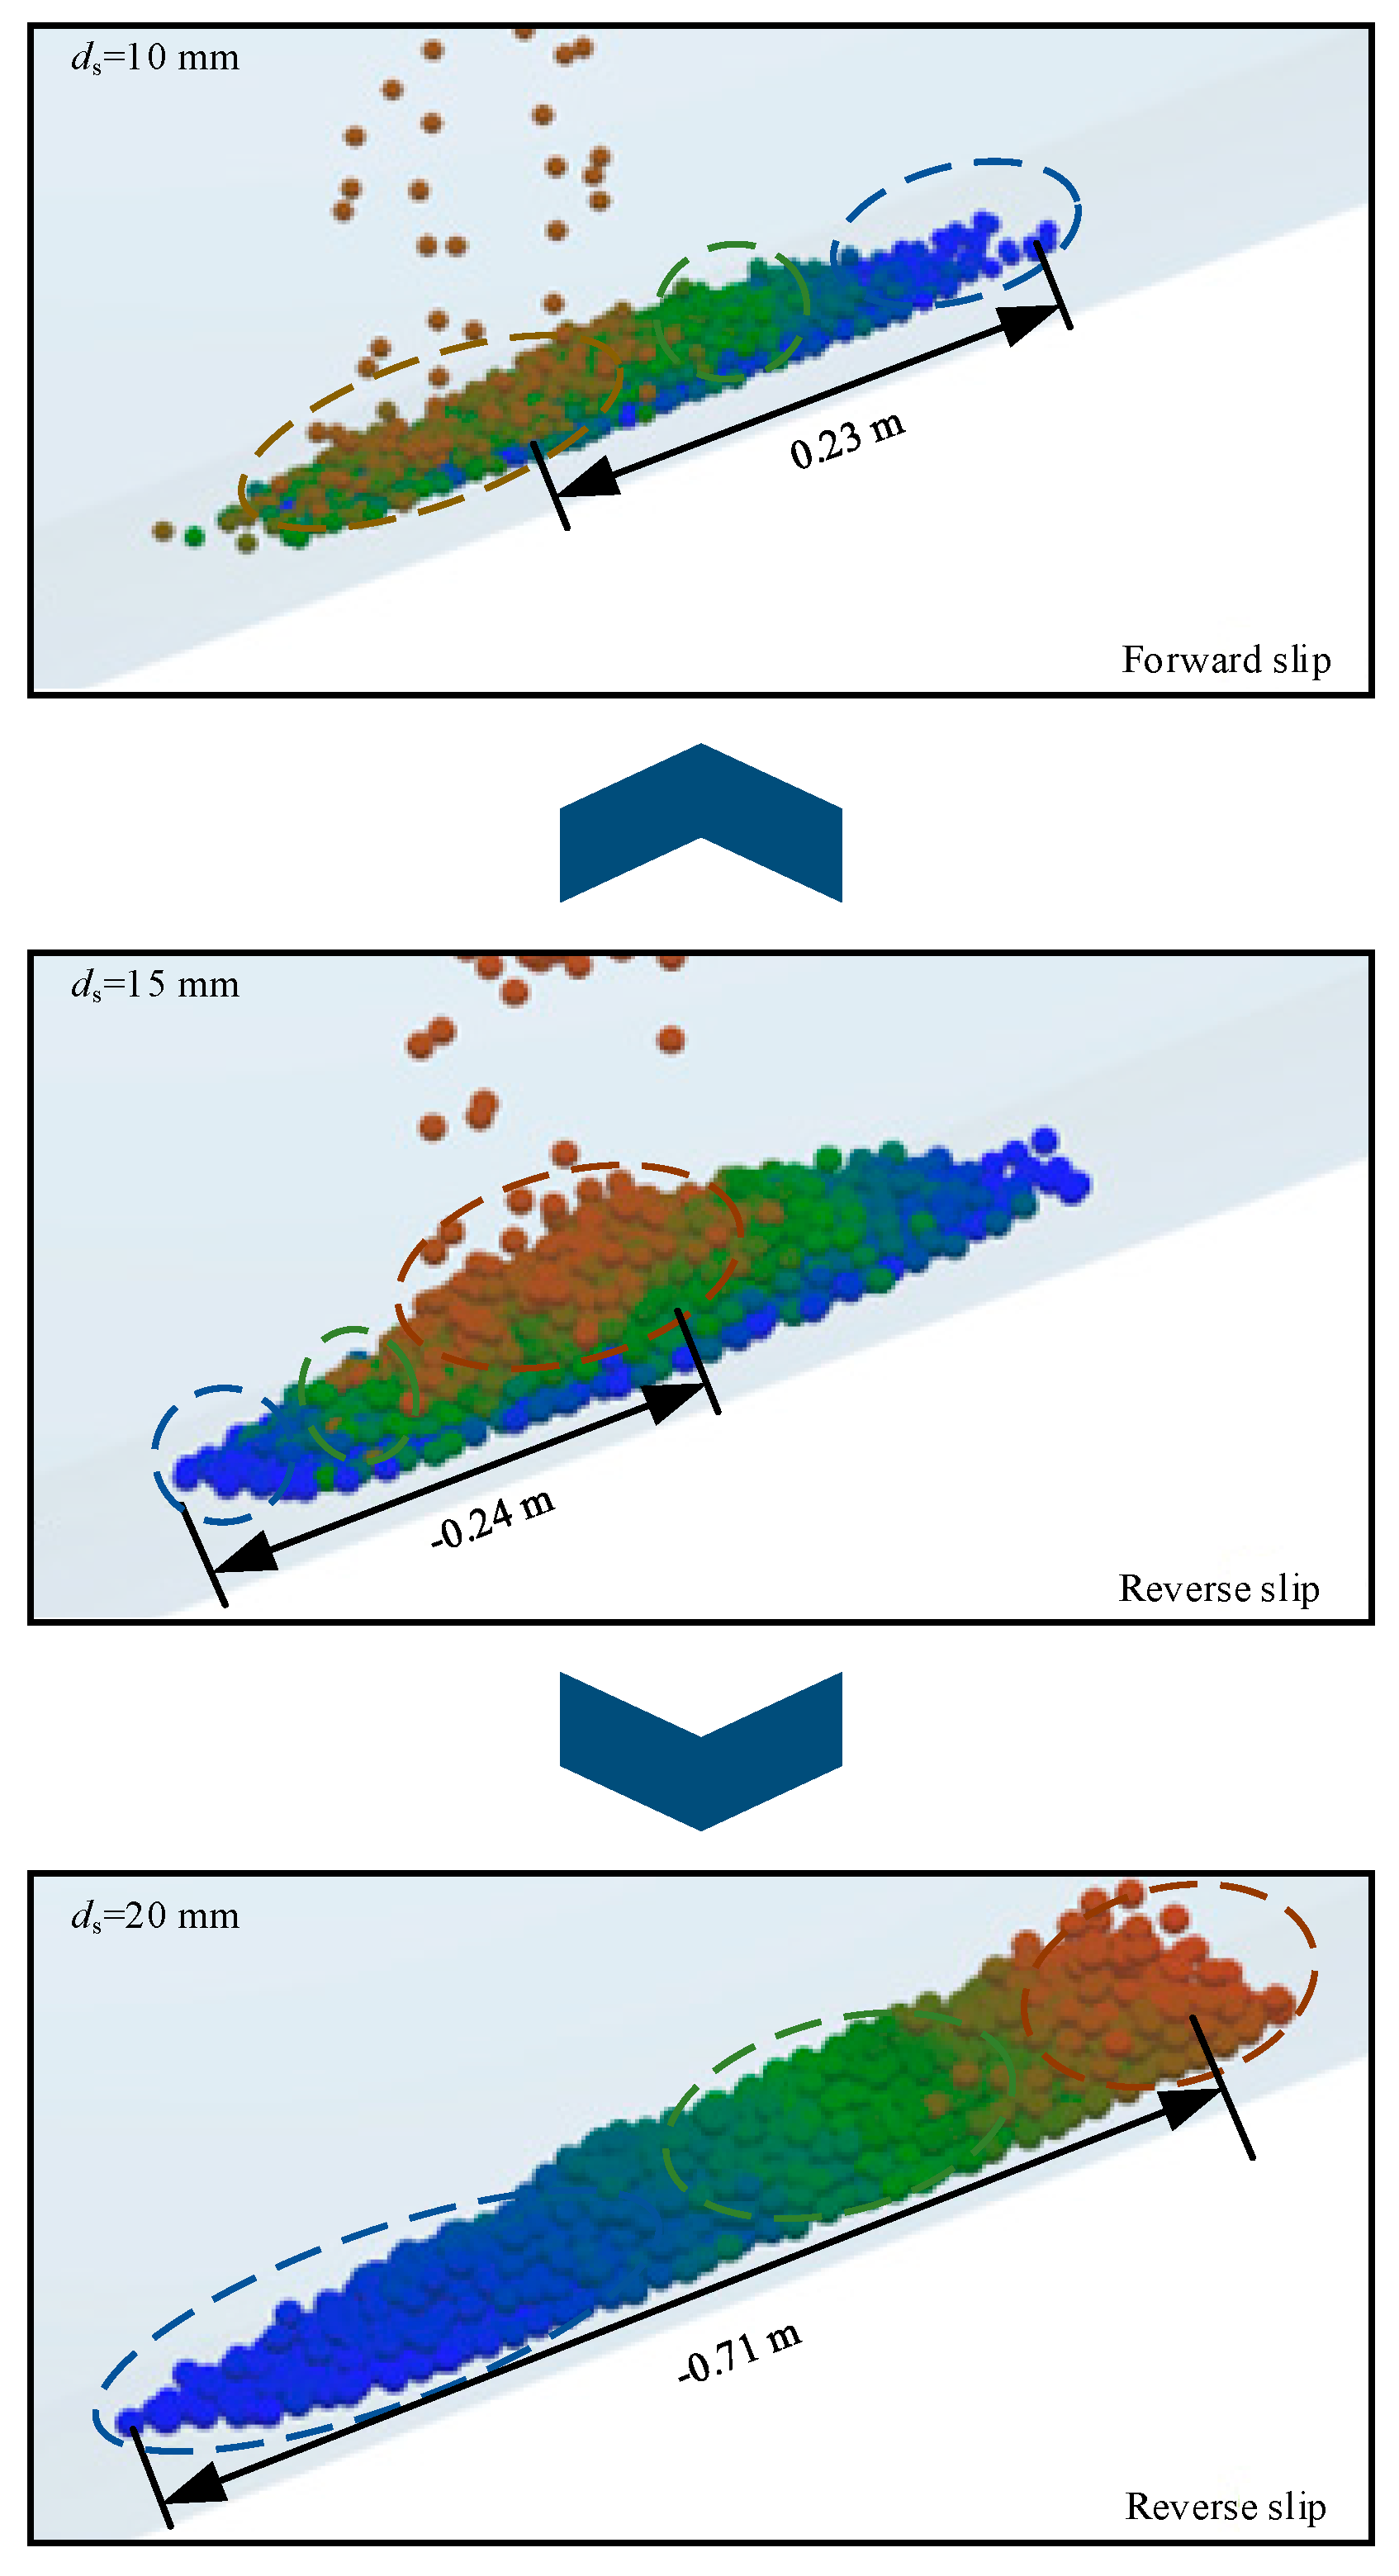
The contrast of the sliding distances in phase III for the sizes of 10 mm, 15 mm, and 20 mm water-intercepting aggregate (same density: 2600 kg/m3) under the same engineering condition is shown in Figure 11.
Phase III: the sliding distance of 15 mm aggregate along the water gush roadway direction is −0.24 m (the theoretical model-derived result is −0.25 m, presenting a 4.0% error), and the direction of sliding is opposite to the water flow direction; the sliding distance of 20 mm aggregate along the water gush roadway direction is farther than that of the 15 mm aggregate, which is −0.71 m (the theoretical model-derived result is −0.75 m, presenting a 5.3% error), and the direction of sliding is opposite to the water flow direction; the sliding distance of 10 mm aggregate along the water gush roadway direction is 0.23 m (the theoretical model-derived result is 0.25 m, presenting a 4.0% error), and the direction of sliding is consistent with the water flow direction. The errors between the numerical simulation test results of the above three groups and the theoretical model-derived results are within a 10% margin. Furthermore, a comparison of the three test groups reveals that when the aggregate density and other parameters are held constant, increasing the aggregate size leads to a change in the sliding direction of the aggregate from forward to reverse, resulting in reverse sliding in phase III. This finding is in agreement with the results of the theoretical model parameter analysis.

3.2. Discussion on Spacing Design of Perfusion Holes and Specific Construction Methods

On the basis of the numerical simulation results for the individual aggregate motion path in the coal–rock mass water gush roadway, and by combining the theoretical calculation models and the parameter analysis, relevant proposals are made regarding the design of the water-intercepting aggregate perfusion holes and the specific construction methods.
The following recommendations are presented for the design of aggregate perfusion holes. Once the first aggregate enters the coal–rock mass water gush roadway through the perfusion hole and comes to rest at a certain position after undergoing the curvilinear projectile motion in phase II and the sliding motion in phase III, subsequent aggregate perfused through the same hole will accumulate based on this position. By combining the calculation formulas for aggregate motion distances in phase II and III as proposed in this study, it is possible to determine approximately this position. In actual engineering applications, the second aggregate perfusion hole on the same plane can be positioned accordingly, and the spacing of subsequent perfusion holes can be determined in a similar manner. This design approach maximizes the synergistic effects of perfusing from multiple holes, thereby improving the water interception efficiency.
The following recommendations are proposed for water-intercepting aggregate perfusion. In the water gush roadway, since the dip angle of the roadway is positive, the component force of the water-intercepting aggregate gravity in the direction along the roadway is opposite to the water flow direction. When the current velocity and water gush roadway height are small as well as the water gush roadway dip angle, the aggregate size and density are large, during the aggregate motion process in phase III, after the aggregate moves upward along the roadway for a certain distance, its velocity will decrease to zero, and then it will slide downward. In some cases, it is possible for the aggregate to slide below the perfusion hole. This kind of situation exists in the numerical simulation and theoretical calculation process. The reverse sliding of aggregate in phase III can make it accumulate more effectively. However, sliding below the perfusion hole and generating a sliding distance far greater than that in the inclined upward direction in phase II is unnecessary and will significantly reduce the accumulation efficiency. Therefore, we cannot blindly select aggregate with larger sizes and densities. Instead, we should select aggregate (size and density) that matches the actual current velocity and the roadway dip angle and height according to the specific working conditions of this type of water gushing, ensuring that the vector sum of the motions of aggregate in phase II and III is as close to zero as possible during the perfusion process.

4. Conclusions

(1)
A numerical model was constructed for large cross-sectional water gush roadway sections, and the CFD-DEM coupling method was used to simulate the water-intercepting aggregate motion process. Pursuant to the simulation results, the complete aggregate motion path was categorized into three characteristic phases: free fall, curvilinear projectile motion, and sliding.
(2)
The stage-by-stage force analysis of individual aggregate established a theoretical model for describing its motion path, with a derived formula for its displacement distance (along and vertically to the roadway). Then, the aggregate volume concentration Sv was introduced to modify this formula, so that it can also be applied to the aggregate particle group. The model’s error (compared with the numerical simulations) was within 10%. Parameter analysis showed that the aggregate density/size and the water gush roadway dip angle were negatively correlated with aggregate displacement distances in phase II and III, while the roadway height and current velocity were positively correlated—consistent with simulations.
(3)
When dealing with actual water gush conditions in coal mines, for water-intercepting aggregate that is locally available, based on the engineering data and combined with the existing aggregate density and size, the formulas in this paper can be used to calculate the aggregate displacement distance after entering the water gush roadway. On this basis, the subsequent spacing of the perfusion holes can be dynamically optimized. If there is no ready-made aggregate, the engineering data can be used to back-calculate the aggregate size and density that will ensure the vector sum of the aggregate motion in phase II and III approaches zero as closely as possible, thereby selecting the appropriate aggregate to significantly improve the water-intercepting efficiency after perfusing.

Author Contributions

Conceptualization, J.W., J.L., S.G., S.L. and P.S.; Methodology: J.W., S.G. and S.L.; Software, J.W., J.L., S.L. and R.H.; Validation, S.G. and P.S.; Formal Analysis, J.W., S.G., S.L. and R.H.; Investigation, J.W., J.L., S.L. and R.H.; Resources, J.L., S.G. and P.S.; Data Curation, J.W., S.L. and R.H.; Writing—Original Draft Preparation, J.W. and S.L.; Writing—Review and Editing, J.L., S.G. and P.S.; Visualization, J.W., S.L. and R.H.; Supervision: S.G.; Project Administration, J.L., S.G. and P.S.; Funding Acquisition, S.G., P.S. and R.H. All authors have read and agreed to the published version of the manuscript.

Funding

This research was funded by the National Natural Science Foundation of China (grant No. 51508462) and Science and Technology Program of Shaanxi Province (grant No. 2018JM5126) from Peili Su; and Natural Science Basic Research Program of Shaanxi Province (grant No. 2024JC-YBQN-0609) from Rongbin Huang.

Data Availability Statement

The original contributions presented in this study are included in the article. Further inquiries can be directed to the corresponding author.

Acknowledgments

Jiahao Wen would like to express my gratitude to the School of Architecture and Civil Engineering at Xi’an University of Science and Technology for providing me with a scientific research platform. I am thankful to the teachers Shuancheng Gu, Jinhua Li, Peili Su, and Rongbin Huang for their guidance on my thesis, as well as junior fellow apprentice Liu Suliu’s contributions to the thesis structure and writing. Lastly, I would like to thank my girlfriend, Bi Yuan, for her unwavering support and encouragement throughout this journey.

Conflicts of Interest

The authors declare no conflicts of interest.

References

  1. Ma, D.; Duan, H.; Zhang, J.; Bai, H. A state-of-the-art review on rock seepage mechanism of water inrush disaster in coal mines. Int. J. Coal. Sci. Technol. 2022, 9, 50. [Google Scholar] [CrossRef]
  2. Sun, W.; Li, W.; Ren, L.; Li, K. Spatial and Temporal Characterization of Mine Water Inrush Accidents in China, 2014–2022. Water 2024, 16, 656. [Google Scholar] [CrossRef]
  3. Liang, D.; Jiang, Z.; Zhu, S.; Sun, Q.; Qian, Z. Experimental research on water inrush in tunnel construction. Nat. Hazard. 2016, 81, 467–480. [Google Scholar] [CrossRef]
  4. Li, L.; Tu, W.; Shi, S.; Chen, J.; Zhang, Y. Mechanism of water inrush in tunnel construction in karst area. Geomat. Nat. Hazards Risk. 2016, 7, 35–46. [Google Scholar] [CrossRef]
  5. Soni, A.K.; Wolkersdorfer, C. Mine water: Policy perspective for improving water management in the mining environment with respect to developing economies. Int. J. Min. Reclam. Environ. 2016, 30, 115–127. [Google Scholar] [CrossRef]
  6. Shi, Q.; Sakai, M. Recent progress on the discrete element method simulations for powder transport systems: A review. Adv. Powder Technol. 2022, 33, 103664. [Google Scholar] [CrossRef]
  7. Li, S.; Liu, R.; Zhang, Q.; Zhang, X. Protection against water or mud inrush in tunnels by grouting: A review. J. Rock Mech. Geotech. Eng. 2016, 8, 753–766. [Google Scholar] [CrossRef]
  8. Zhao, Y.; Li, P.; Tian, S. Prevention and treatment technologies of railway tunnel water inrush and mud gushing in China. J. Rock Mech. Geotech. Eng. 2013, 5, 468–477. [Google Scholar] [CrossRef]
  9. Cao, Z.; Yi, X.; Yi, X.; Feng, D.; Li, Z.; Huang, C.; Wang, S.; Yu, Y.; Wang, W.; Zhai, M.; et al. Diffusion Evolution Rules of Grouting Slurry in Mining-induced Cracks in Overlying Strata. Rock Mech. Rock Eng. 2025, 58, 6493–6512. [Google Scholar] [CrossRef]
  10. Mou, L.; Dong, S.; Zhou, W.; Wang, W.; Li, A.; Shi, Z. Data Analysis and Key Parameters of Typical Water Hazard Control Engineering in Coal Mines of China. Mine Water Environ. 2020, 39, 331–344. [Google Scholar] [CrossRef]
  11. Zhai, M.; Bai, H. Precise application of grouting technology in underground coal mining: Water inrush risk of floor elimination. Environ. Sci. Pollut. Res. 2023, 30, 24361–24376. [Google Scholar] [CrossRef]
  12. Yilmaz, E. Innovative mine backfill materials and structures. Int. J. Min. Reclam. Environ. 2023, 37, 731–734. [Google Scholar] [CrossRef]
  13. Vlasak, P.; Kysela, B.; Chara, Z. Flow structure of coarse-grained slurry in a horizontal pipe. J. Hydrol. Hydromech. 2012, 60, 115–124. [Google Scholar] [CrossRef]
  14. Ravelet, F.; Bakir, F.; Khelladi, S.; Rey, R. Experimental study of hydraulic transport of large particles in horizontal pipes. Exp. Therm. Fluid Sci. 2013, 45, 187–197. [Google Scholar] [CrossRef]
  15. Arolla, S.K.; Desjardins, O. Transport modeling of sedimenting particles in a turbulent pipe flow using Euler–Lagrange large eddy simulation. Int. J. Multiph. Flow 2015, 75, 1–11. [Google Scholar] [CrossRef]
  16. Uzi, A.; Levy, A. Flow characteristics of coarse particles in horizontal hydraulic conveying. Powder Technol. 2018, 326, 302–321. [Google Scholar] [CrossRef]
  17. Zhou, M.; Wang, S.; Kuang, S.; Luo, K.; Fan, J.; Yu, A. CFD-DEM modelling of hydraulic conveying of solid particles in a vertical pipe. Powder Technol. 2019, 354, 893–905. [Google Scholar] [CrossRef]
  18. Sui, W.; Liu, Z.; Zhang, G.; Mao, D.; Li, R.; Liang, J. Experimental investigation on grout propagation in poured aggregates for controlling water inrush in tunnels with flowing water. Geoenviron. Disasters 2023, 10, 15. [Google Scholar] [CrossRef]
  19. Su, P.; Wen, J.; Gu, S.; Liu, F.; Li, C. Study on the migration law of aggregate sediment in the water inrush channel of coal rock mass. Coal Sci. Technol. 2023, 51, 200–207. [Google Scholar]
  20. Luo, B.; Sun, Y.; Xu, Z.; Chen, G.; Zhang, L.; Lu, W.; Zhao, X.; Yuan, H. Damage Characteristics and Mechanism of the 2017 Groundwater Inrush Accident That Occurred at Dongyu Coalmine in Taiyuan, Shanxi, China. Water 2021, 13, 368. [Google Scholar] [CrossRef]
  21. Teng, T.; Chen, Y.; Wang, Y.; Qiao, X. In Situ Nuclear Magnetic Resonance Observation of Pore Fractures and Permeability Evolution in Rock and Coal under Triaxial Compression. J. Energy Eng. 2025, 151, 04025036. [Google Scholar] [CrossRef]
  22. Fei, Y.; Liu, S.; Xu, Y.; Zhao, L. Failure Analysis of Thin Bedrock and Clay Roof in Underground Coal Mining: Case Study in Longdong Coal Mine. Int. J. Geomech. 2020, 20, 04020187. [Google Scholar] [CrossRef]
  23. Gong, X.; Ma, D.; Wu, L.; Li, Q.; Li, Z.; Du, F.; Qiao, R.; Han, J. Water Inrush Mechanism During Mining Adjacent to Large Water-Conducting Faults. Water 2025, 17, 1508. [Google Scholar] [CrossRef]
  24. Cao, M.; Yin, S.; Lian, H.; Wang, X.; Wang, G.; Li, S.; Li, Q.; Xu, W. Failure Mechanism and Risk Evaluation of Water Inrush in Floor of Extra-Thick Coal Seam. Water 2025, 17, 743. [Google Scholar] [CrossRef]
  25. Wang, L.; Zhu, L.; Cao, Z.; Liu, J.; Xue, Y.; Wang, P.; Cao, X.; Liu, Y. Thermo-mechanical degradation and fracture evolution in low-permeability coal subjected to cyclic heating–cryogenic cooling. Phys. Fluids 2025, 37, 086617. [Google Scholar] [CrossRef]
  26. Kong, D.; Pu, S.; Cheng, Z.; Wu, G.; Liu, Y. Coordinated Deformation Mechanism of the Top Coal and Filling Body of Gob-Side Entry Retaining in a Fully Mechanized Caving Face. Int. J. Geomech. 2021, 21, 04021030. [Google Scholar] [CrossRef]
  27. Zhao, J.; Shan, T. Coupled CFD-DEM simulation of fluid-particle interaction in geomechanics. Powder Technol. 2013, 239, 248–258. [Google Scholar] [CrossRef]
  28. Otieno, F.; Shukla, S.K. How does mine tailings slurry solids concentration affect stability of dam embankment slope? Int. J. Min. Reclam. Environ. 2024, 38, 281–292. [Google Scholar] [CrossRef]
  29. Zhang, G.; Zhou, G.; Song, S.; Zhang, L.; Sun, B. CFD investigation on dust dispersion pollution of down/upwind coal cutting and relevant countermeasures for spraying dustfall in fully mechanized mining face. Adv. Powder Technol. 2020, 31, 3177–3190. [Google Scholar] [CrossRef]
  30. Reddy, N.V.K.; Pothal, J.K.; Barik, R.; Senapati, P.K. Pipeline Slurry Transportation System: An Overview. J. Pipeline Syst. Eng. Pract. 2023, 14, 03123001. [Google Scholar] [CrossRef]
  31. Shen, B. Coal Mine Roadway Stability in Soft Rock: A Case Study. Rock Mech. Rock Eng. 2014, 47, 2225–2238. [Google Scholar] [CrossRef]
  32. Goh, A.T.C.; Zhang, W. Reliability assessment of stability of underground rock caverns. Int. J. Rock Mech. Min. Sci. 2012, 55, 157–163. [Google Scholar] [CrossRef]
  33. He, Y.; Bayly, A.E.; Hassanpour, A. Coupling CFD-DEM with dynamic meshing: A new approach for fluid-structure interaction in particle-fluid flows. Powder Technol. 2018, 325, 620–631. [Google Scholar] [CrossRef]
  34. Stewart, C.; Balachandar, S.; Mcgrath, T.P. Soft-sphere simulations of a planar shock interaction with a granular bed. Phys. Rev. Fluids. 2018, 3, 034308. [Google Scholar] [CrossRef]
  35. Sobieski, W. Switch Function and Sphericity Coefficient in the Gidaspow Drag Model for Modeling Solid-Fluid Systems. Dry. Technol. 2009, 27, 267–280. [Google Scholar] [CrossRef]
  36. Wen, J.; Gu, S.; Su, P.; Li, J. Study on the two-phase coupling migration mechanism of deceleration aggregate and water in coal mine water inrush channel. Sci. Rep. 2025, 15, 11702. [Google Scholar] [CrossRef]
  37. Ekanayake, N.I.K.; Berry, J.D.; Harvie, D.J.E. Lift and drag forces acting on a particle moving in the presence of slip and shear near a wall. J. Fluid Mech. 2021, 915, A103. [Google Scholar] [CrossRef]
  38. Van Der Wijk, V.; Herder, J.L.; Demeulenaere, B. Comparison of Various Dynamic Balancing Principles Regarding Additional Mass and Additional Inertia. J. Mech. Rob. 2009, 1, 041006. [Google Scholar] [CrossRef]
  39. Bombardelli Fabián, A.; González Andrea, E.; Niño Yarko, I. Computation of the Particle Basset Force with a Fractional-Derivative Approach. J. Hydraul. Eng. 2008, 134, 1513–1520. [Google Scholar] [CrossRef]
  40. Hessenkemper, H.; Ziegenhein, T.; Rzehak, R.; Lucas, D.; Tomiyama, A. Lift force coefficient of ellipsoidal single bubbles in water. Int. J. Multiph. Flow 2021, 138, 103587. [Google Scholar] [CrossRef]
  41. Shorbagy, M.; Taha, H. Magnus Force Estimation Using Gauss’s Principle of Least Constraint. AIAA J. 2024, 62, 1962–1969. [Google Scholar] [CrossRef]
  42. Cui, Y.; Ravnik, J.; Hriberšek, M.; Steinmann, P. A novel model for the lift force acting on a prolate spheroidal particle in an arbitrary non-uniform flow. Part I. Lift force due to the streamwise flow shear. Int. J. Multiph. Flow 2018, 104, 103–112. [Google Scholar] [CrossRef]
  43. Gu, J.; Ma, D.Q.; Chen, W.; Qin, X.; Wang, X.L.; Yang, J.Z. Study on Settling Velocity of Sediment Particle Cloud in the Water. Adv. Mater. Res. 2013, 610–613, 2451–2454. [Google Scholar] [CrossRef]
  44. Kuang, C.; Zheng, H.; Gu, J.; Ma, D. Settling velocity of sediment particle clusters. J. Tongji Univ. (Nat. Sci.) 2016, 44, 1845–1850+1866. [Google Scholar]
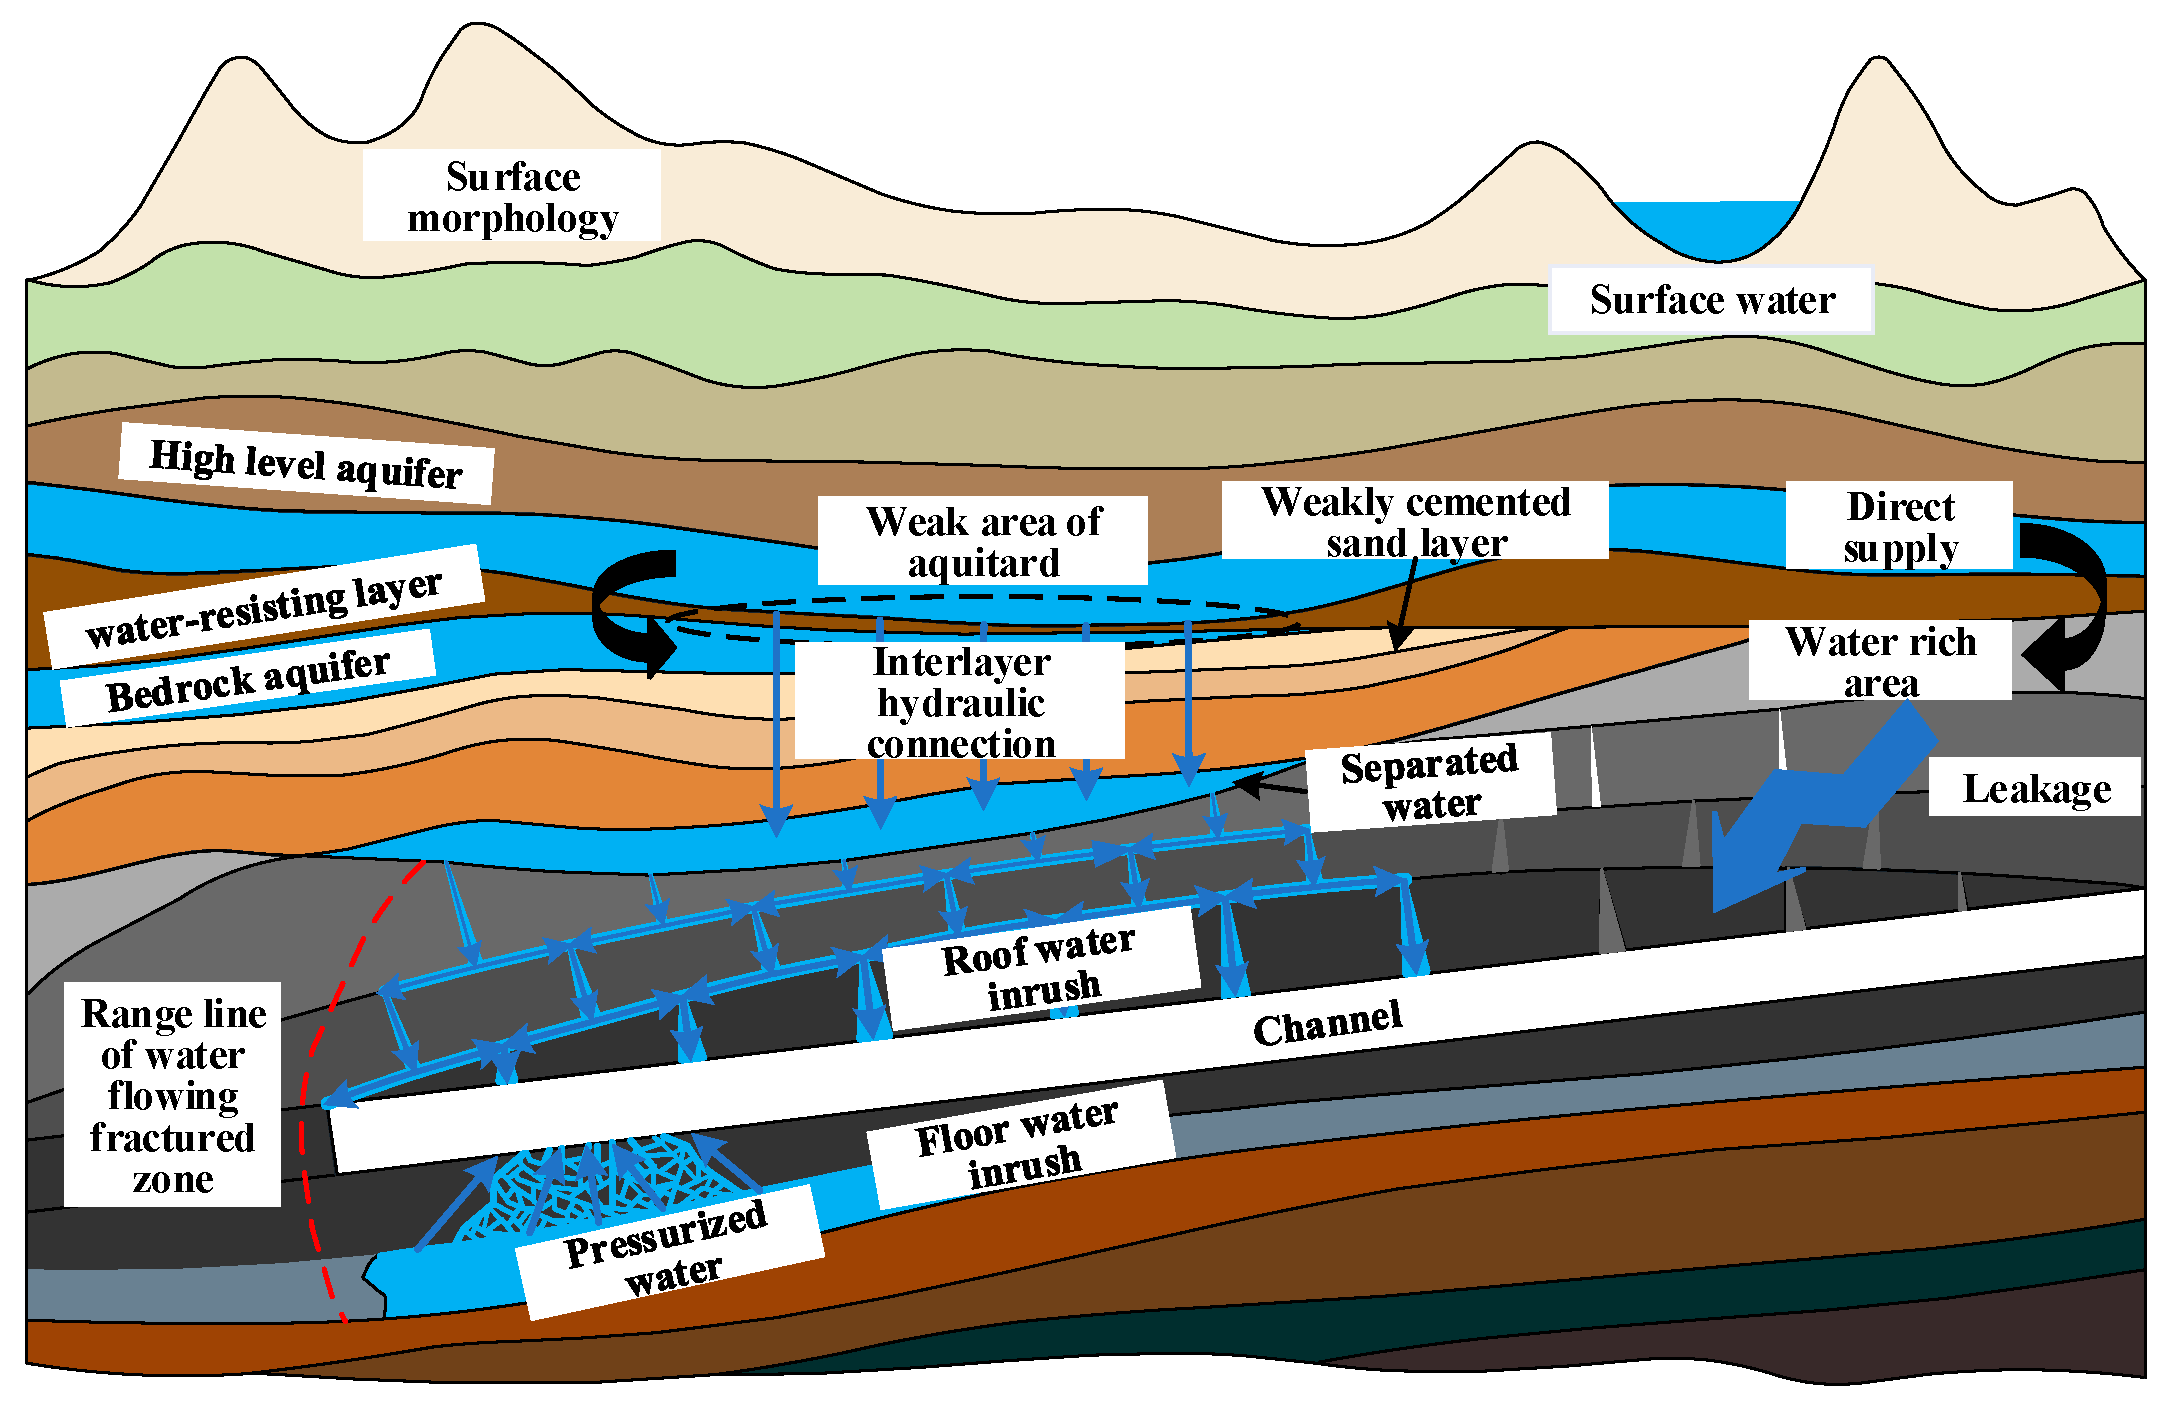
Figure 1. Sketch map of different types of coal–rock roadway water gush disaster.
Water 17 02956 g001
Figure 2. The numerical model of a water gush roadway segment.
Water 17 02956 g002
Figure 3. The numerical model of the water-intercepting aggregate motion path.
Water 17 02956 g003
Figure 4. Sketch map of the water-intercepting aggregate motion path theoretical model.
Water 17 02956 g004
Figure 5. Sketch map of the water-intercepting aggregate motion and force in phase I.
Water 17 02956 g005
Figure 6. Sketch map of the water-intercepting aggregate motion and force in phase II.
Water 17 02956 g006
Figure 7. Sketch map of the water-intercepting aggregate motion and force in phase III.
Water 17 02956 g007
Figure 8. Line chart of the impact of different factors on the water-intercepting aggregate displacement distance in water gush roadway during phase II.
Water 17 02956 g008
Figure 9. Line chart of the impact of different factors on the water-intercepting aggregate displacement distance in water gush roadway during phase III.
Water 17 02956 g009
Figure 10. Side-by-side slide graphs of curvilinear projectile distances in phase II for three sizes of water-intercepting aggregate in an inclined upward water gush roadway.
Water 17 02956 g010
Figure 11. Side-by-side slide graphs of sliding distances in phase III for three sizes of water-intercepting aggregate in an inclined upward water gush roadway.
Water 17 02956 g011
Table 1. Material parameter table of aggregate in numerical model.
Density
ρs kg/m3
Size
ds mm
Coefficient of Restitution eCoefficient of Friction fPoisson’s
Ratio ν
Elastic Modulus
G Mpa
2600150.510.2510
Table 2. Orthogonal test factors and levels distribution table for the motion path of aggregate.
Test LevelsTest Factors
Density
A, kg/m3
Size
B, mm
Dip Angle
C, °
Height
D, m
Velocity
E, m/s
118005103.00.1
2220010153.50.3
3260015204.00.5
4300020254.50.7
5340025305.00.9
Table 3. Calculation results of the orthogonal test for the motion path of aggregate.
Test
Number
Allocation
of Factor
Levels
Test FactorsPhase II
XII, m
Phase III
XIII, m
Density
A, kg/m3
Size
B, mm
Angle
C, °
Height
D, m
Velocity
E, m/s
1A1B1C1D1E118005103.00.10.570.28
2A1B2C3D4E5180010204.50.91.721.49
3A1B3C5D2E4180015303.50.70.97−0.09
4A1B4C2D5E3180020155.00.51.270.02
5A1B5C4D3E2180025254.00.30.47−1.54
6A2B1C5D4E322005304.50.51.030.58
7A2B2C2D2E2220010153.50.30.770.06
8A2B3C4D5E1220015255.00.10.51−0.83
9A2B4C1D3E5220020104.00.91.70.61
10A2B5C3D1E4220025203.00.70.89−1.00
11A3B1C4D2E526005253.50.91.381.14
12A3B2C1D5E4260010105.00.71.681.44
13A3B3C3D3E3260015204.00.50.91−0.25
14A3B4C5D1E2260020303.00.30.08−2.00
15A3B5C2D4E1260025154.50.10.51−1.65
16A4B1C3D5E230005205.00.30.920.51
17A4B2C5D3E1300010304.00.10.13−1.33
18A4B3C2D1E5300015153.00.91.330.40
19A4B4C4D4E4300020254.50.70.99−0.65
20A4B5C1D2E3300025103.50.50.98−0.97
21A5B1C2D3E434005154.00.71.331.19
22A5B2C4D1E3340010253.00.50.53−0.69
23A5B3C1D4E2340015104.50.30.96−0.15
24A5B4C3D2E1340020203.50.10.1−1.99
25A5B5C5D5E5340025305.00.91.02−1.16
Table 4. Range analysis table of impact factors on aggregate displacement distance in phase II.
Test
Number
Test Factors
Density ASize BAngle CHeight DVelocity E
KII15.005.235.893.401.82
KII24.904.835.214.203.2
KII34.564.684.544.544.72
KII44.354.143.885.215.86
KII53.943.873.235.407.15
K ¯ II11.001.051.180.680.36
K ¯ II20.980.971.040.840.64
K ¯ II30.910.940.910.910.94
K ¯ II40.870.830.781.041.17
K ¯ II50.790.770.651.081.43
RII0.210.270.530.401.07
Table 5. Range analysis table of impact factors on aggregate displacement distance in phase III.
Test
Number
Test Factors
Density ASize BDip angle CHeight DVelocity E
KIII10.163.701.21−3.01−5.52
KIII2−0.580.970.02−1.85−3.12
KIII3−1.32−0.92−1.24−1.32−1.31
KIII4−2.04−4.01−2.57−0.380.89
KIII5−2.80−6.32−4.00−0.022.48
K ¯ III10.030.740.24−0.60−1.10
K ¯ III2−0.120.190.00−0.37−0.62
K ¯ III3−0.26−0.18−0.25−0.26−0.26
K ¯ III4−0.41−0.80−0.51−0.080.18
K ¯ III5−0.56−1.26−0.800.000.50
RIII0.592.001.040.601.60
Table 6. Material parameter table of three sizes of water-intercepting aggregate in numerical models.
Density ρs
kg/m3
Size ds
mm
Coefficient of
Restitution e
Coefficient of
Friction f
Poisson’s
Ratio ν
Elastic Modulus
G Mpa
2600100.50.10.2510
15
20
Disclaimer/Publisher’s Note: The statements, opinions and data contained in all publications are solely those of the individual author(s) and contributor(s) and not of MDPI and/or the editor(s). MDPI and/or the editor(s) disclaim responsibility for any injury to people or property resulting from any ideas, methods, instructions or products referred to in the content.