Article

Optimizing Pier Arrangement for Flood Hazard Mitigation: A Comparative Mobile-Bed and Fixed-Bed Experimental Study

State Key Laboratory of Water Engineering Ecology and Environment in Arid Area, Xi’an University of Technology, Xi’an 710048, China
*
Author to whom correspondence should be addressed.
Water 2025, 17(20), 2951; https://doi.org/10.3390/w17202951
Submission received: 7 August 2025 / Revised: 13 September 2025 / Accepted: 10 October 2025 / Published: 14 October 2025
(This article belongs to the Section Hydraulics and Hydrodynamics)

Abstract

River bridge engineering alters the hydraulic characteristics of rivers, impacting fluvial morphological stability. To investigate issues concerning flood conveyance capacity within the river reach hosting a new bridge and the safe operation of existing bridges, comparative physical model tests employing both mobile-bed and fixed-bed configurations were conducted. A 1:60 scale model was used to test flood peak discharges corresponding to 30-year and 100-year return periods and investigate pier spacings of 30 m and 40 m. These tests evaluated the relative advantages and limitations of each model type in simulating flow patterns, sediment transport, and riverbed evolution. Specifically, mobile-bed models more effectively capture the interaction between water flow and sediment dynamics, while fixed-bed experiments enable more precise measurement of hydraulic parameters. Pier spacing is recognized as one of the most critical factors influencing river flow regimes. Larger pier spacing (40 m) was found to reduce upstream backwater and local scour depth compared to smaller spacing (30 m), particularly under the 30-year flood scenario. Consequently, this study investigated the effects of pier spacing on flow patterns, obtained flood conveyance characteristics under various flood frequencies, and analyzed the underlying mechanisms governing flow fields, velocity variations, and local scour around piers. The research outcomes not only elucidate multiscale coupling mechanisms between water flow and sediment but also quantify the relationship between the extent of pier-induced flow disturbance and subsequent channel morphological adjustments. This quantification provides a dynamic criterion for risk mitigation of river-crossing structures and establishes a hydrodynamic foundation for studying flood hazards in complex river reaches.

1. Introduction

River floods rank among the world’s most severe natural disasters. Flash floods are particularly destructive, causing significant loss of human life and property. However, under the influence of climate change, extreme rainfall events are projected to intensify, leading to more severe flooding [1]. The construction of river-crossing structures, such as bridges, significantly alters the hydraulic characteristics of rivers, thereby affecting fluvial morphological stability. Newly constructed bridges can elevate upstream water levels, potentially compromising embankments and threatening the safety of riverside communities [2,3]. The obstruction effect of bridge piers leads to flow redistribution, upstream backwater, and complex local scour, posing direct threats to the structural safety of the bridges themselves and the flood conveyance capacity of the river reach. Furthermore, vortices and high-velocity flows forming near bridge piers can induce local scouring of the riverbed. Therefore, optimizing pier arrangement to mitigate impacts on river flooding is crucial for both bridge design and flood risk management. Consequently, accurately predicting and mitigating the comprehensive impact of bridge construction on river channels has long been a central topic in hydraulics and river engineering.
Extensive research has been conducted to investigate bridge pier hydraulics using various methods, including numerical simulations and physical modeling. It is widely recognized within the academic community that factors such as pier spacing and pier shape are critical influencing factors. Among these, increasing pier spacing is generally understood to help reduce flow contraction, alleviate upstream backwater, and diminish local scour depth. Current research on river flood hazards primarily involves calculating flood inundation extents for various design frequencies. When hydraulic structures such as bridges or weirs exist within the channel, their flow capacity and backwater extent become critical factors for risk and impact assessment. Existing studies mainly employ empirical formulae to calculate backwater values upstream of bridges [4,5,6], with related theories and empirical approaches being relatively well-established [7,8]. Physical scale model testing helps identify the hydraulic impacts of projects during floods and validates the effectiveness of design modifications; the ultimately optimized design ensures the hydraulic transparency of the project. Such models are invaluable tools for optimizing major linear infrastructure crossing floodplains, particularly in areas where flow patterns and hydraulic structure behavior are difficult to ascertain solely through numerical modeling. The numerical modeling of river channels often incorporates a fixed-bed boundary condition. Nevertheless, relatively few investigations have been conducted to quantify the differences in outcomes between movable-bed and fixed-bed scenarios.
Heng et al. emphasized the significant role of physical models in hydraulic engineering and fluvial geomorphology, within which mobile-bed and fixed-bed tests are key components [9]. Mobile-bed experiments simulate deformable riverbeds where sediment can erode, transport, and deposit under flow action, leading to bedform changes [10,11]. The core of these experiments lies in capturing the coupled effects between sediment movement and water flow, making them especially suitable for studying scouring, sedimentation, riverbed evolution, reservoir sediment management, and sediment transport laws [12,13,14]. This capability affords mobile-bed tests unique advantages in river flood control [15]. Wang Chen conducted experiments investigating local scouring mechanisms in stratified sand with an upper coarse layer, specifically examining the scouring development process under conditions of upper coarse and lower fine sand [16,17]. Research on long-distance mobile-bed models of the Yellow River holds practical significance for guiding sediment management in large rivers [18]. Furthermore, factors such as particle size, shape, and specific gravity significantly influence sediment movement, rendering refined sediment simulation a persistent challenge.
Cantero-Chinchilla et al. utilized fixed-bed experimental data to validate turbulence models for rivers and hydraulic structures [19]. A major limitation, however, is their inability to simulate morphological changes in the riverbed induced by sediment erosion and deposition [15], restricting their application to problems involving bed dynamics, such as scouring and sedimentation. Kim and Hwang performed three-dimensional numerical simulations of dam-break waves in an L-shaped channel, comparing water level variations induced by the dam-break wave under both mobile-bed and fixed-bed conditions. Integrating mobile-bed and fixed-bed experiments can yield a more comprehensive understanding of river systems [20]. For instance, a review by Hamidifar et al. highlighted the role of sediment transport in flood modeling and river dynamics, emphasizing significant differences in water depth and discharge between mobile-bed and fixed-bed conditions [15].
However, existing studies often focus on a single model type or a specific flood event, lacking a systematic comparative evaluation of the simulation capabilities of different model types (fixed-bed vs. mobile-bed), particularly within the specific engineering context of determining the optimal pier spacing for new bridge constructions. A clear research gap exists in directly linking engineering design choices regarding pier spacing to quantifiable flood control and safety benefits (e.g., flood discharge capacity, scour depth), which is essential for providing dynamic and explicit criteria for engineering decision-making.
Consequently, the model tests concerning the river channel in the present study are conducted within two distinct systems: the fixed sand bed (fixed bed) and the movable sand bed (mobile bed). To address these gaps, this study instituted a comparative physical modeling campaign. The primary objectives were:
(1)
To evaluate the relative advantages and limitations of fixed-bed and mobile-bed physical models in simulating the flow patterns, velocity variations, and local scour phenomena induced by bridge piers under flood conditions corresponding to 30-year and 100-year return periods.
(2)
To quantitatively investigate the effect of pier spacing (30 m vs. 40 m) on key hydraulic and morphological responses, including upstream backwater rise, local scour depth, and overall flood conveyance capacity within the studied river reach.
(3)
To elucidate the underlying mechanisms governing the interaction between flow fields, sediment transport, and riverbed evolution, thereby establishing a hydrodynamic foundation for risk assessment.

2. Experimental Work

2.1. Experimental Apparatus

A proposed bridge project on the Chihe River, a tributary of the Hanjiang River within Shaanxi Province, was selected as a case study (Figure 1). This reach is characterized by two consecutive bends, with mountainous terrain on one side and a residential area on the other. The flood risk in this area poses potential threats to urban infrastructure and public safety. Furthermore, an existing highway bridge within the same reach necessitates that the physical model experiments also account for the scour effects on in-stream structures.
A physical hydraulic model was constructed to simulate a newly proposed bridge at the river. The model employed a geometric scale ratio of 1:60; prototype river reach length: 1000 m; model length: 18 m; prototype channel width: 80 m; and model width: 1.5 m. An existing highway bridge is located along the left bank, featuring bridge piers spaced at 20 m intervals, each with a diameter of 1.5 m. The proposed bridge features piers spaced at intervals of 30 m and 40 m, with a pier diameter of 1.3 m. Comparative tests were conducted for both the fixed sand bed (fixed bed, Figure 2) and the movable sand bed (mobile bed) under flood peak discharge conditions (Table 1) corresponding to 30-year and 100-year return periods.
To ensure flow similarity between the model and prototype water bodies, both the model water depth (hm) and the model flow Reynolds number (Rem) must satisfy the requirements. Natural sand is selected as the model sediment, and since the sediment particle size scale ratio is identical to the geometric scale ratio, the similarity condition for bed roughness (flow resistance) is automatically satisfied.
Based on the bed material gradation and calculations of the incipient motion condition of granular sediment, natural sand can be selected as the model sediment. According to Shamov’s formula for incipient motion of granular sediment, the grain size scale ratio between bedload sediment and bed material can be directly determined.
λv0 = λv = (λLd)1/6 λ(γs − γ)1/2 λd1/2
It is derived that
λd = λL = 60
Since this is an undistorted physical model and natural sand is adopted as the model sediment, the sediment grain size scale ratio is consistent with the geometric scale of the model. Consequently, the similarity condition for bed roughness (resistance) is automatically satisfied. Regarding the roughness of embankment slopes, the governing scale relationship follows λn = λL1/6= 1.98. Therefore, the roughness of the embankment slopes must be controlled according to this relationship. Consequently, the model roughness coefficient (n) equals 0.035. The details of all model scale ratios are presented in Table 2.
The derivation of time scale ratios for sediment transport and bed deformation follows the principles of geometric, kinematic, and dynamic similarity as applied to movable-bed models [21].
The dry bulk density of naturally deposited bedload sediment was set at 1.6 t/m3 for the prototype and 1.2 t/m3 for the model. This results in a scale ratio for dry bulk density of bedload deposits, denoted as λ γ , of approximately 1.33. Based on the similarity conditions for bed deformation due to bedload transport, the time scale for bed evolution similarity was derived as:
λ t 2   =   λ L λ h λ γ / λ gb = 10.3
It can be observed that the time scale for bed deformation similarity related to bedload transport differs from the hydrodynamic time scale. According to the principles of sediment model design, when these two time scales are not identical, the time scale governing bed deformation should be adopted as the controlling criterion [22]. Tests were conducted under steady-flow conditions. Flow duration for mobile-bed tests was 5 model hours (48 prototype hours) to achieve equilibrium.
Based on our preliminary geological survey, the gradation of sediment used in this model was determined according to the model scales, as shown in Table 3. Two types of natural river sand were selected and blended in a specific proportion to prepare the sediment for the experiments. The prototype gradation of the bed material, the theoretical model gradation, and the actual gradation of the blended sediment are presented in Figure 3.

2.2. Experimental Design

The channel sidewalls of the physical model were constructed using masonry bricks. Both the embankment slopes and the inlet/outlet sections were configured as fixed beds with a cement mortar finish applied to their surfaces. Steeper slopes along both banks within the model channel were also constructed as fixed beds, representing the stone masonry slope protection lining the prototype river banks. The riverbed portion of the model featured a movable layer, formed using model sand to simulate the erodible bed of the prototype channel. The fixed beds were created by applying a surface finish directly over the foundation rock layer according to its elevation, resulting in a rigid sand bed. Within the modeled river reach, both the existing highway bridge and the proposed bridge group (including the bridge piers) were incorporated. The external dimensions of all bridge piers were geometrically scaled down and fabricated from acrylic tubes of identical size. The elevation error during the actual model construction was strictly controlled within 1 mm.
Control sections were established starting from the upstream boundary at measured intervals of 30 m. Additionally, two control sections were added within two river bends. Section CS32 serves as the downstream water level control section, as depicted in Figure 4. A hydrometric station (HS) is located between CS7 and CS8. Figure 5 shows a schematic bathymetric cross section of the prototype channel at the bridge site, annotated with the water levels for the 30-year and 100-year flood events. All elevation data presented in the figures and throughout the study use the Yellow Sea Height Datum. The pier of the proposed bridge (Pier 1) is situated downstream of section #9. The specific locations of all sections are detailed in Table 4.
Measurements commenced after the flow had stabilized for 2 h. Due to the significant difference in flow path length between the left and right banks, the water surface elevations were recorded separately for each bank. Velocity measurements were obtained using a propeller-type current meter (Ouka Instruments Co., Ltd., Nanjing, China), with five to eight measurement points deployed at each cross section. The sampling interval was set to 15 s.The measurement uncertainty for the velocity magnitude, derived from instrument calibration and repeated measurements under stable conditions, is estimated to be ±2%. In fixed-bed tests, the bed was pre-formed. In mobile-bed tests, the local scour depth at each pier location of the highway bridge were measured using a point gauge (Lainde Intelligent Technology Co., Ltd., Shandong, China) and a laser distance sensor (Yachen Instruments and Meters Co., Ltd., Fujian, China) traversing on a movable rack.

2.3. Stage–Discharge Relationship

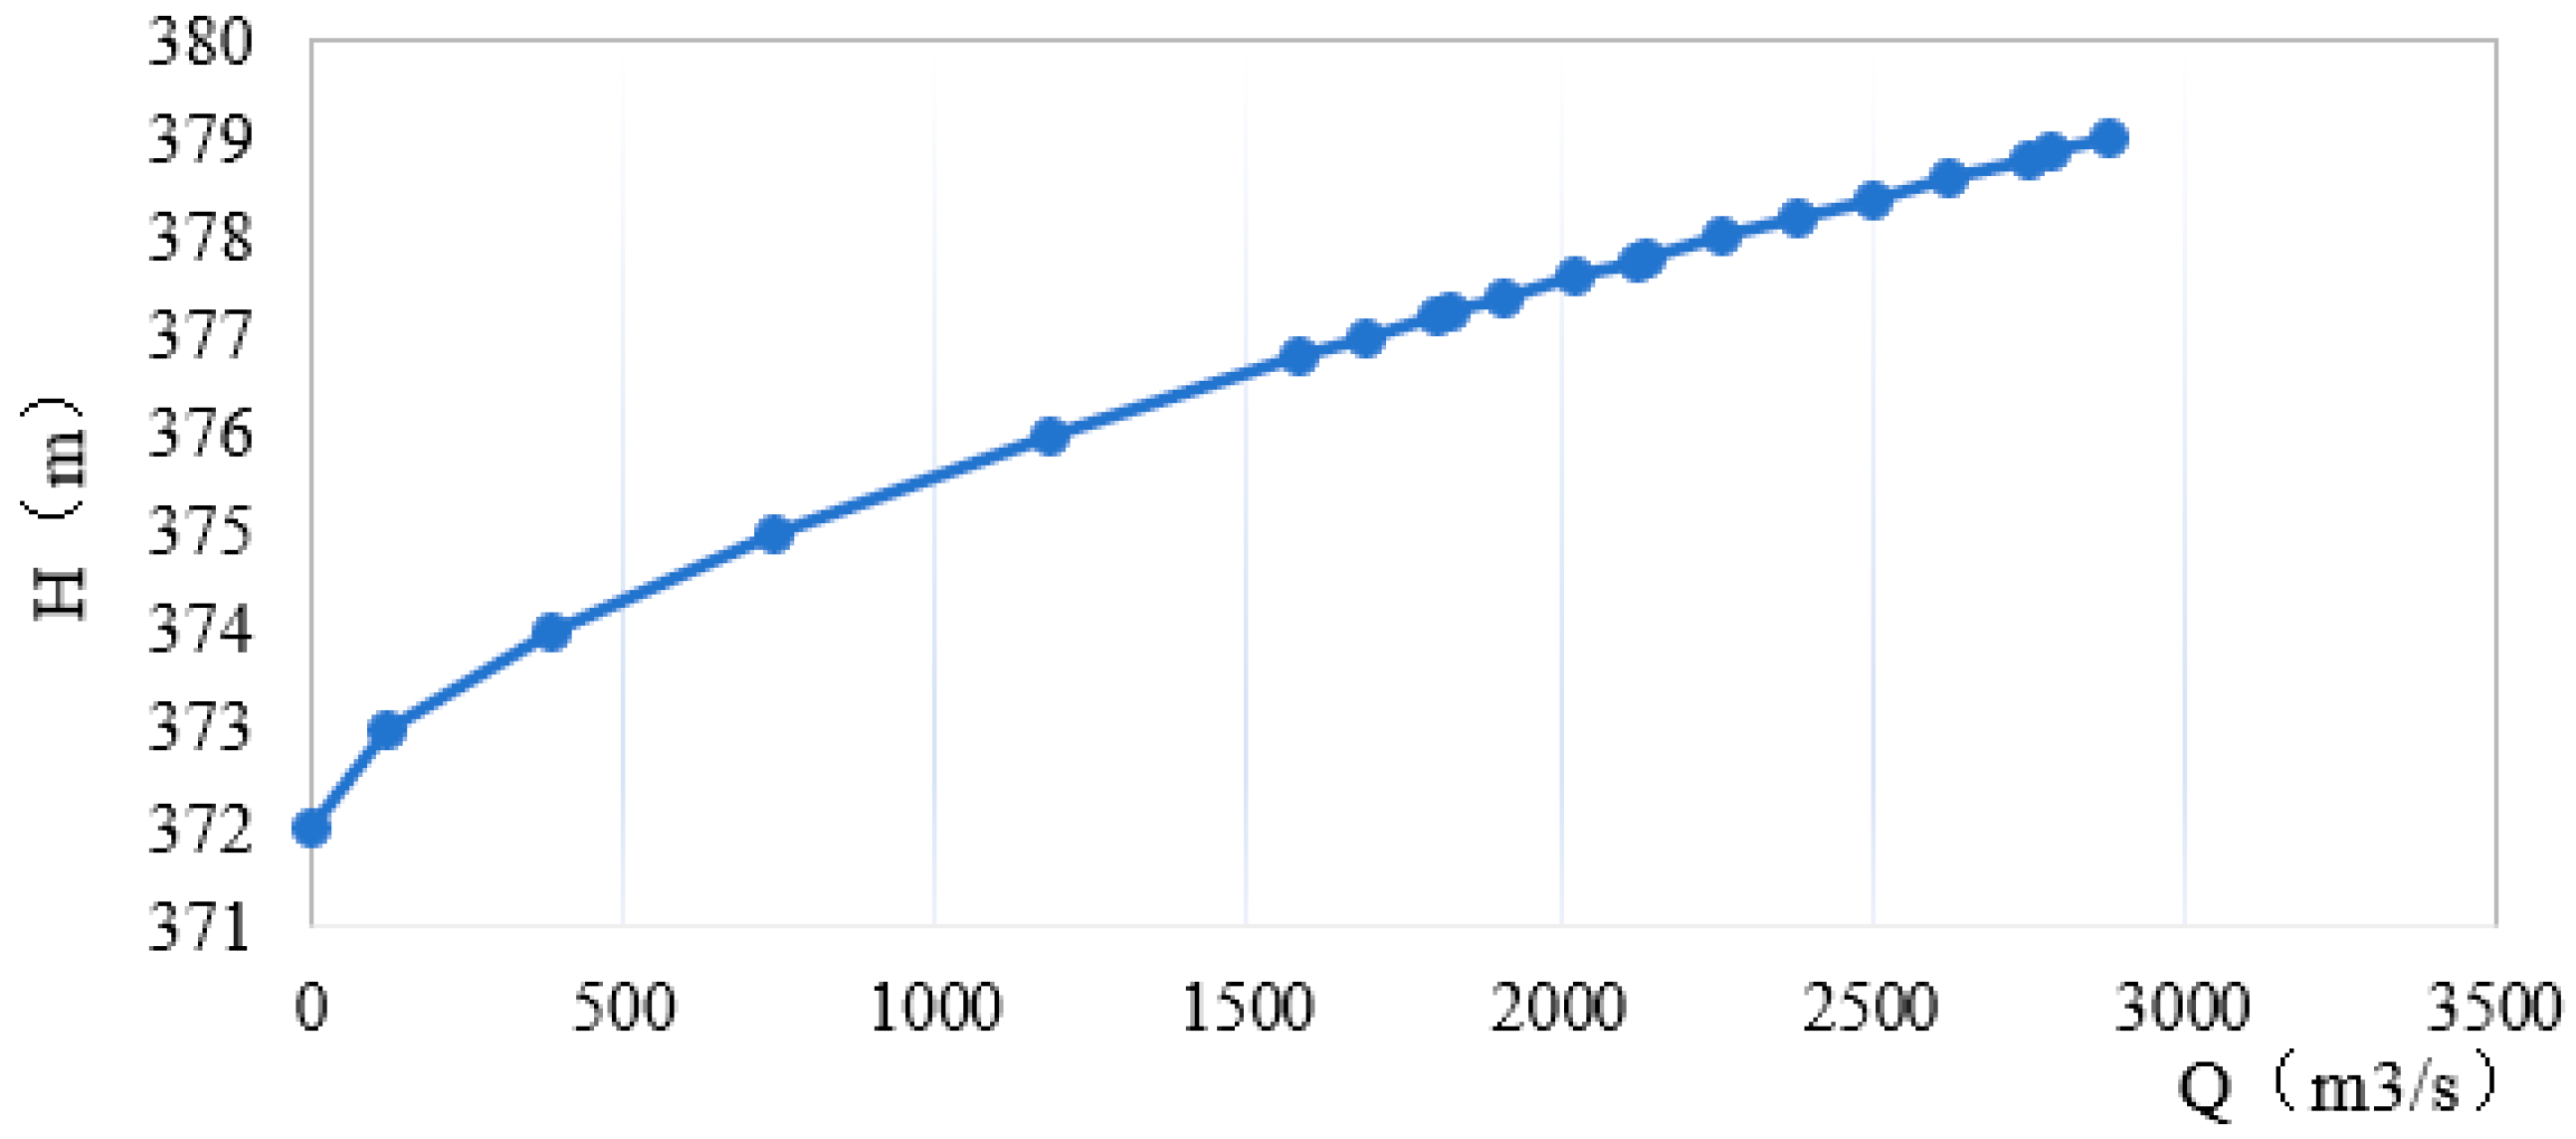
The downstream boundary water level is determined by the stage–discharge relationship curve at the downstream outlet cross section. The model outlet section was selected at a location characterized by relatively straight local channel alignment and stable cross-sectional geometry. Based on analyses of the low-flow channel slope and the thalweg slope, the design flood slope for this reach was established as 0.003. Considering the riverbed composition, bed surface characteristics, channel bank properties, and planform morphology, a comprehensive analysis determined the channel’s Manning’s roughness coefficient to be 0.035. Accordingly, the stage–discharge relationship at the downstream boundary section was calculated using Manning’s equation:
Q   =   AC R J  
where Q, n, J, R, and A represent discharge, roughness coefficient, energy slope, hydraulic radius, and cross-sectional flow area, respectively. The resulting relationship curve between the downstream boundary water level and discharge is presented in Figure 6.

3. Results and Analysis

3.1. Backwater

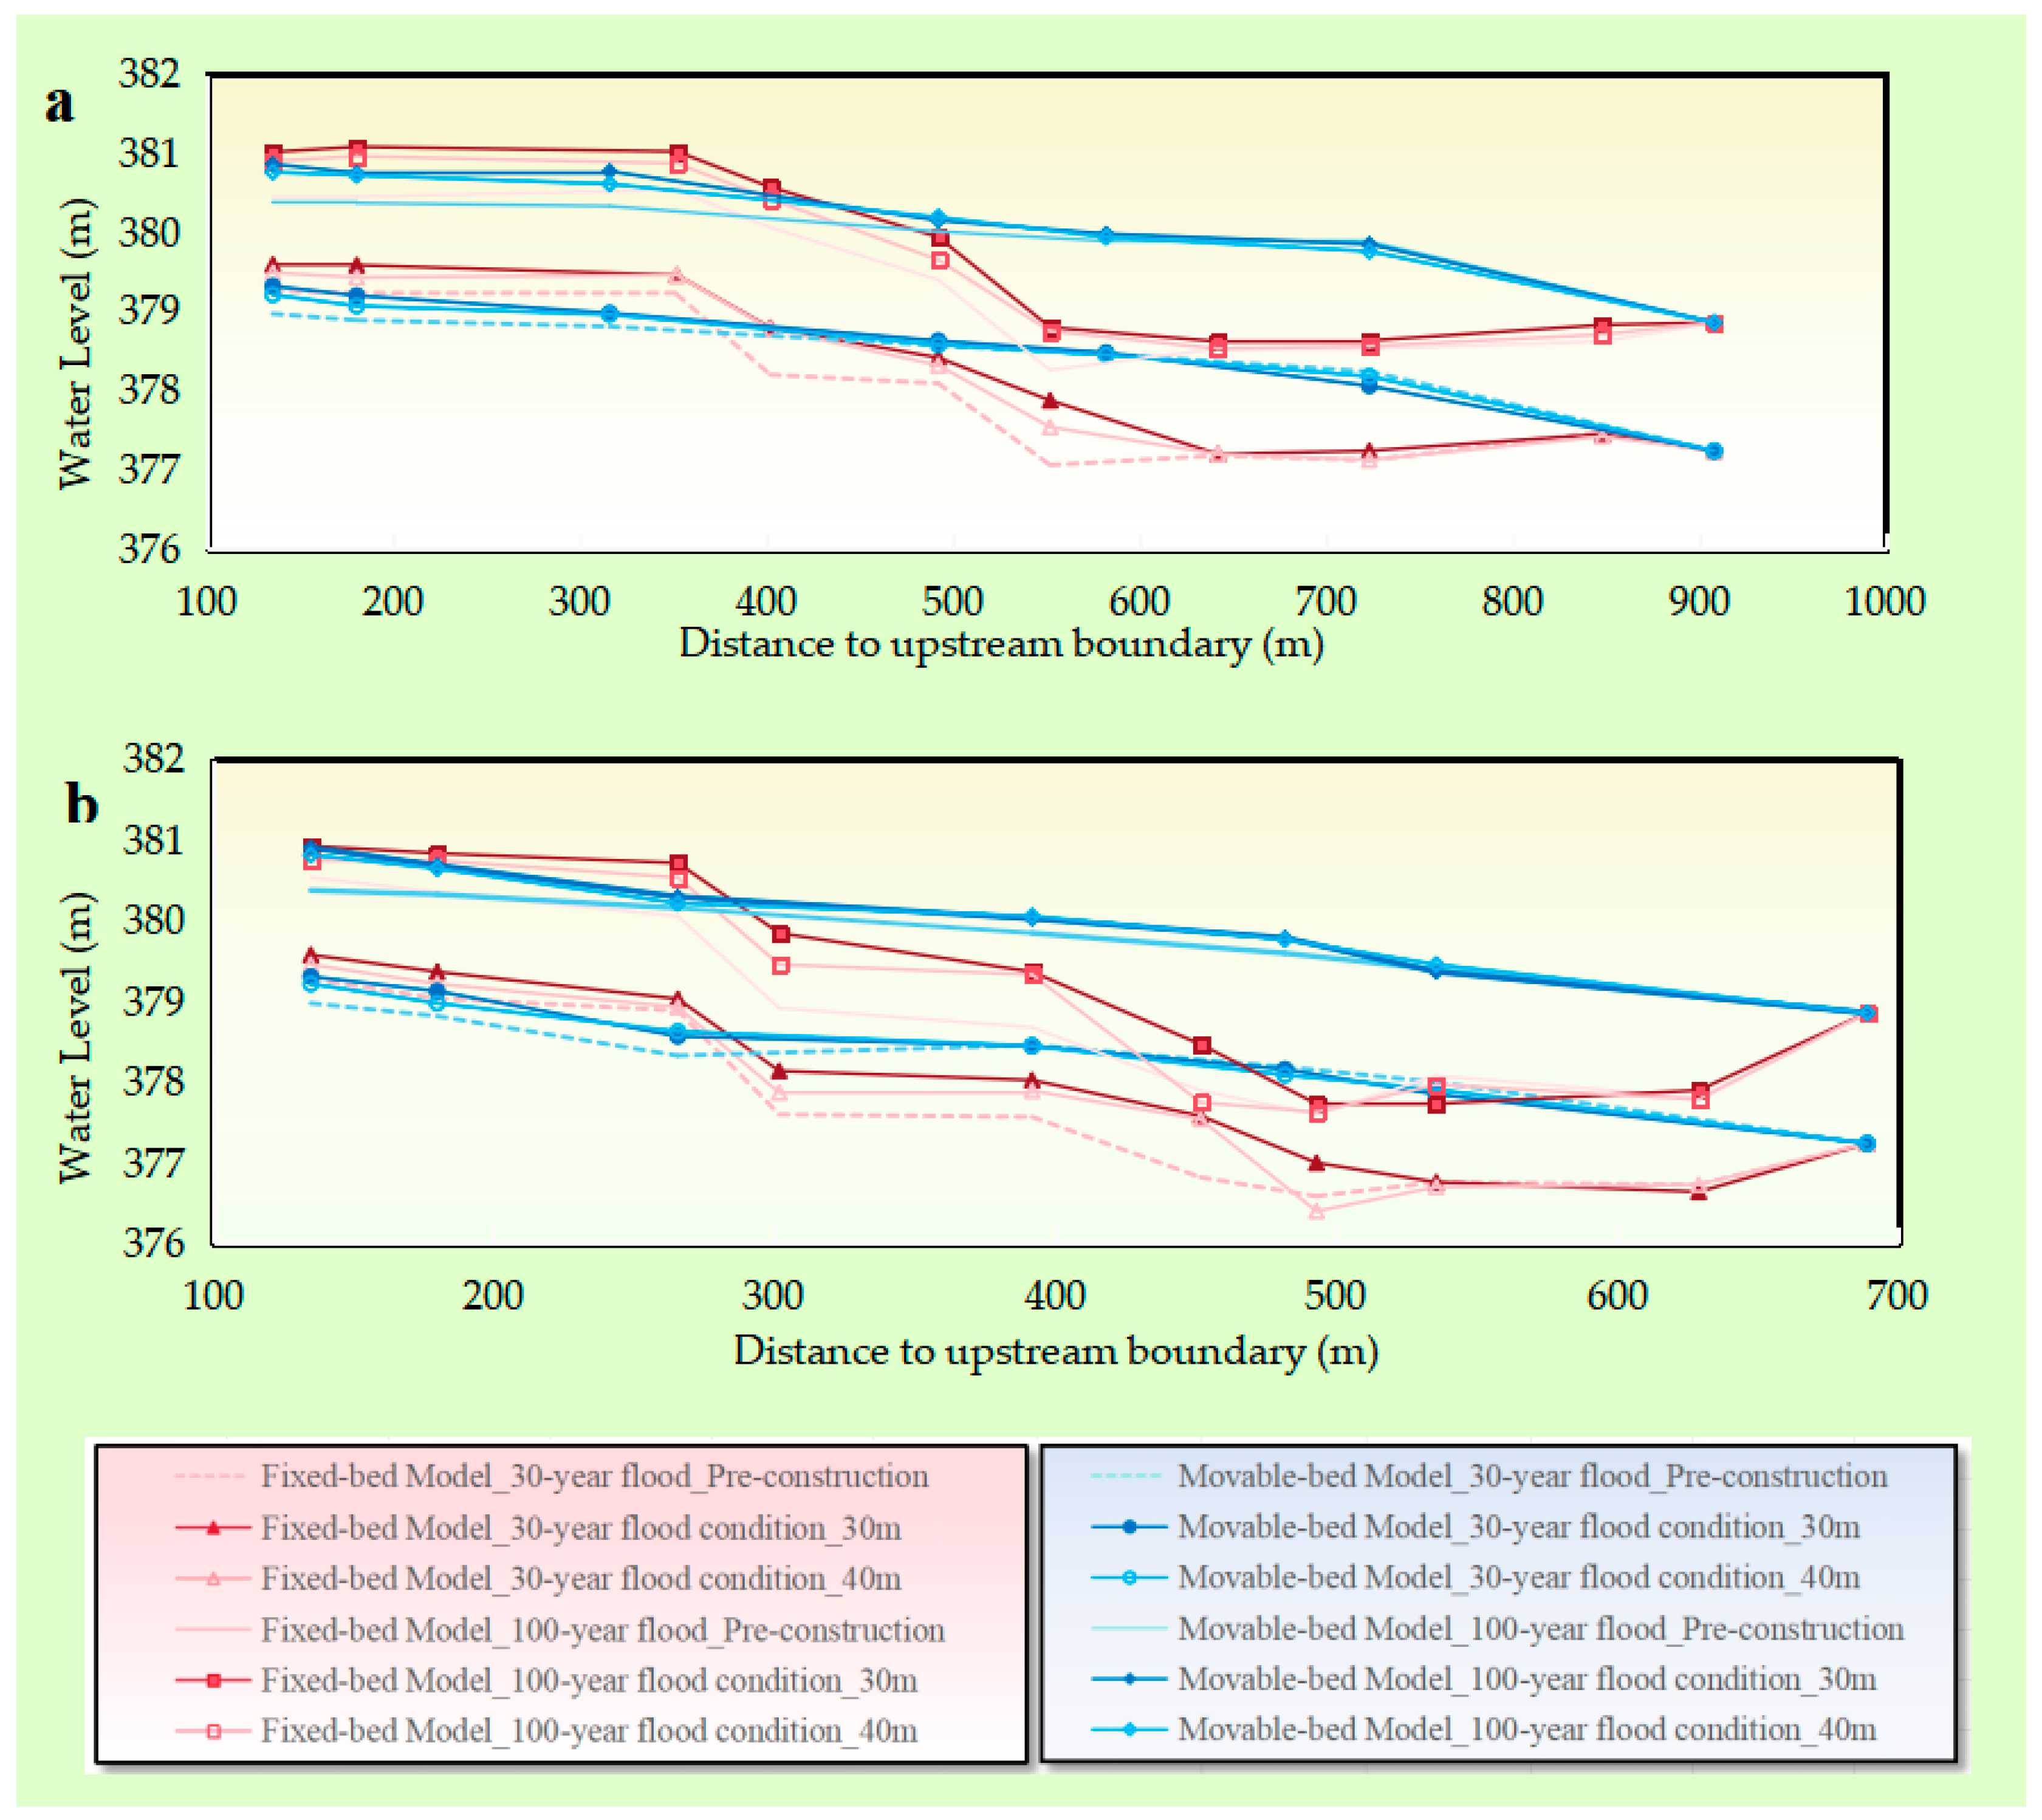
The water level variation patterns in the experimental reach distinctly reveal fundamental differences in flow responses under varying boundary conditions. In the fixed-bed experiments, the water surface profile exhibits two pronounced drawdowns within the bend section, reflecting the rigid channel’s constraining effect on flow energy. Specifically, concentrated energy release during high-magnitude floods causes abrupt water surface transitions, with this phenomenon becoming more pronounced under the centennial flood scenario. Conversely, mobile-bed conditions demonstrate a gently descending water surface trend, indicating gradual energy dissipation along the channel through continuous self-adjustment of the erodible bed.
Regarding the impact of pier spacing adjustments, divergent manifestations emerge between systems: while enlarged pier spacing induces negligible changes in upstream backwater levels for the mobile bed due to autonomous channel adaptation, corresponding modifications in the fixed-bed system trigger significant backwater fluctuations that propagate considerable distances downstream (Figure 7).
Hydraulic restructuring induced by bridge construction is visually evidenced through water surface transformations (Figure 8). Notably, the upstream water surface undulates periodically near piers, with distinct surface rollers developing around pier peripheries, while the downstream surface exhibits sustained oscillations. Collectively, these features characterize the comprehensive establishment of characteristic flow patterns around bridge piers. Compared to a movable bed, a fixed-bed experiment exhibits larger water surface fluctuations and more intense oscillations, indicating that a sandy bed has a lesser disturbing effect on the water flow.
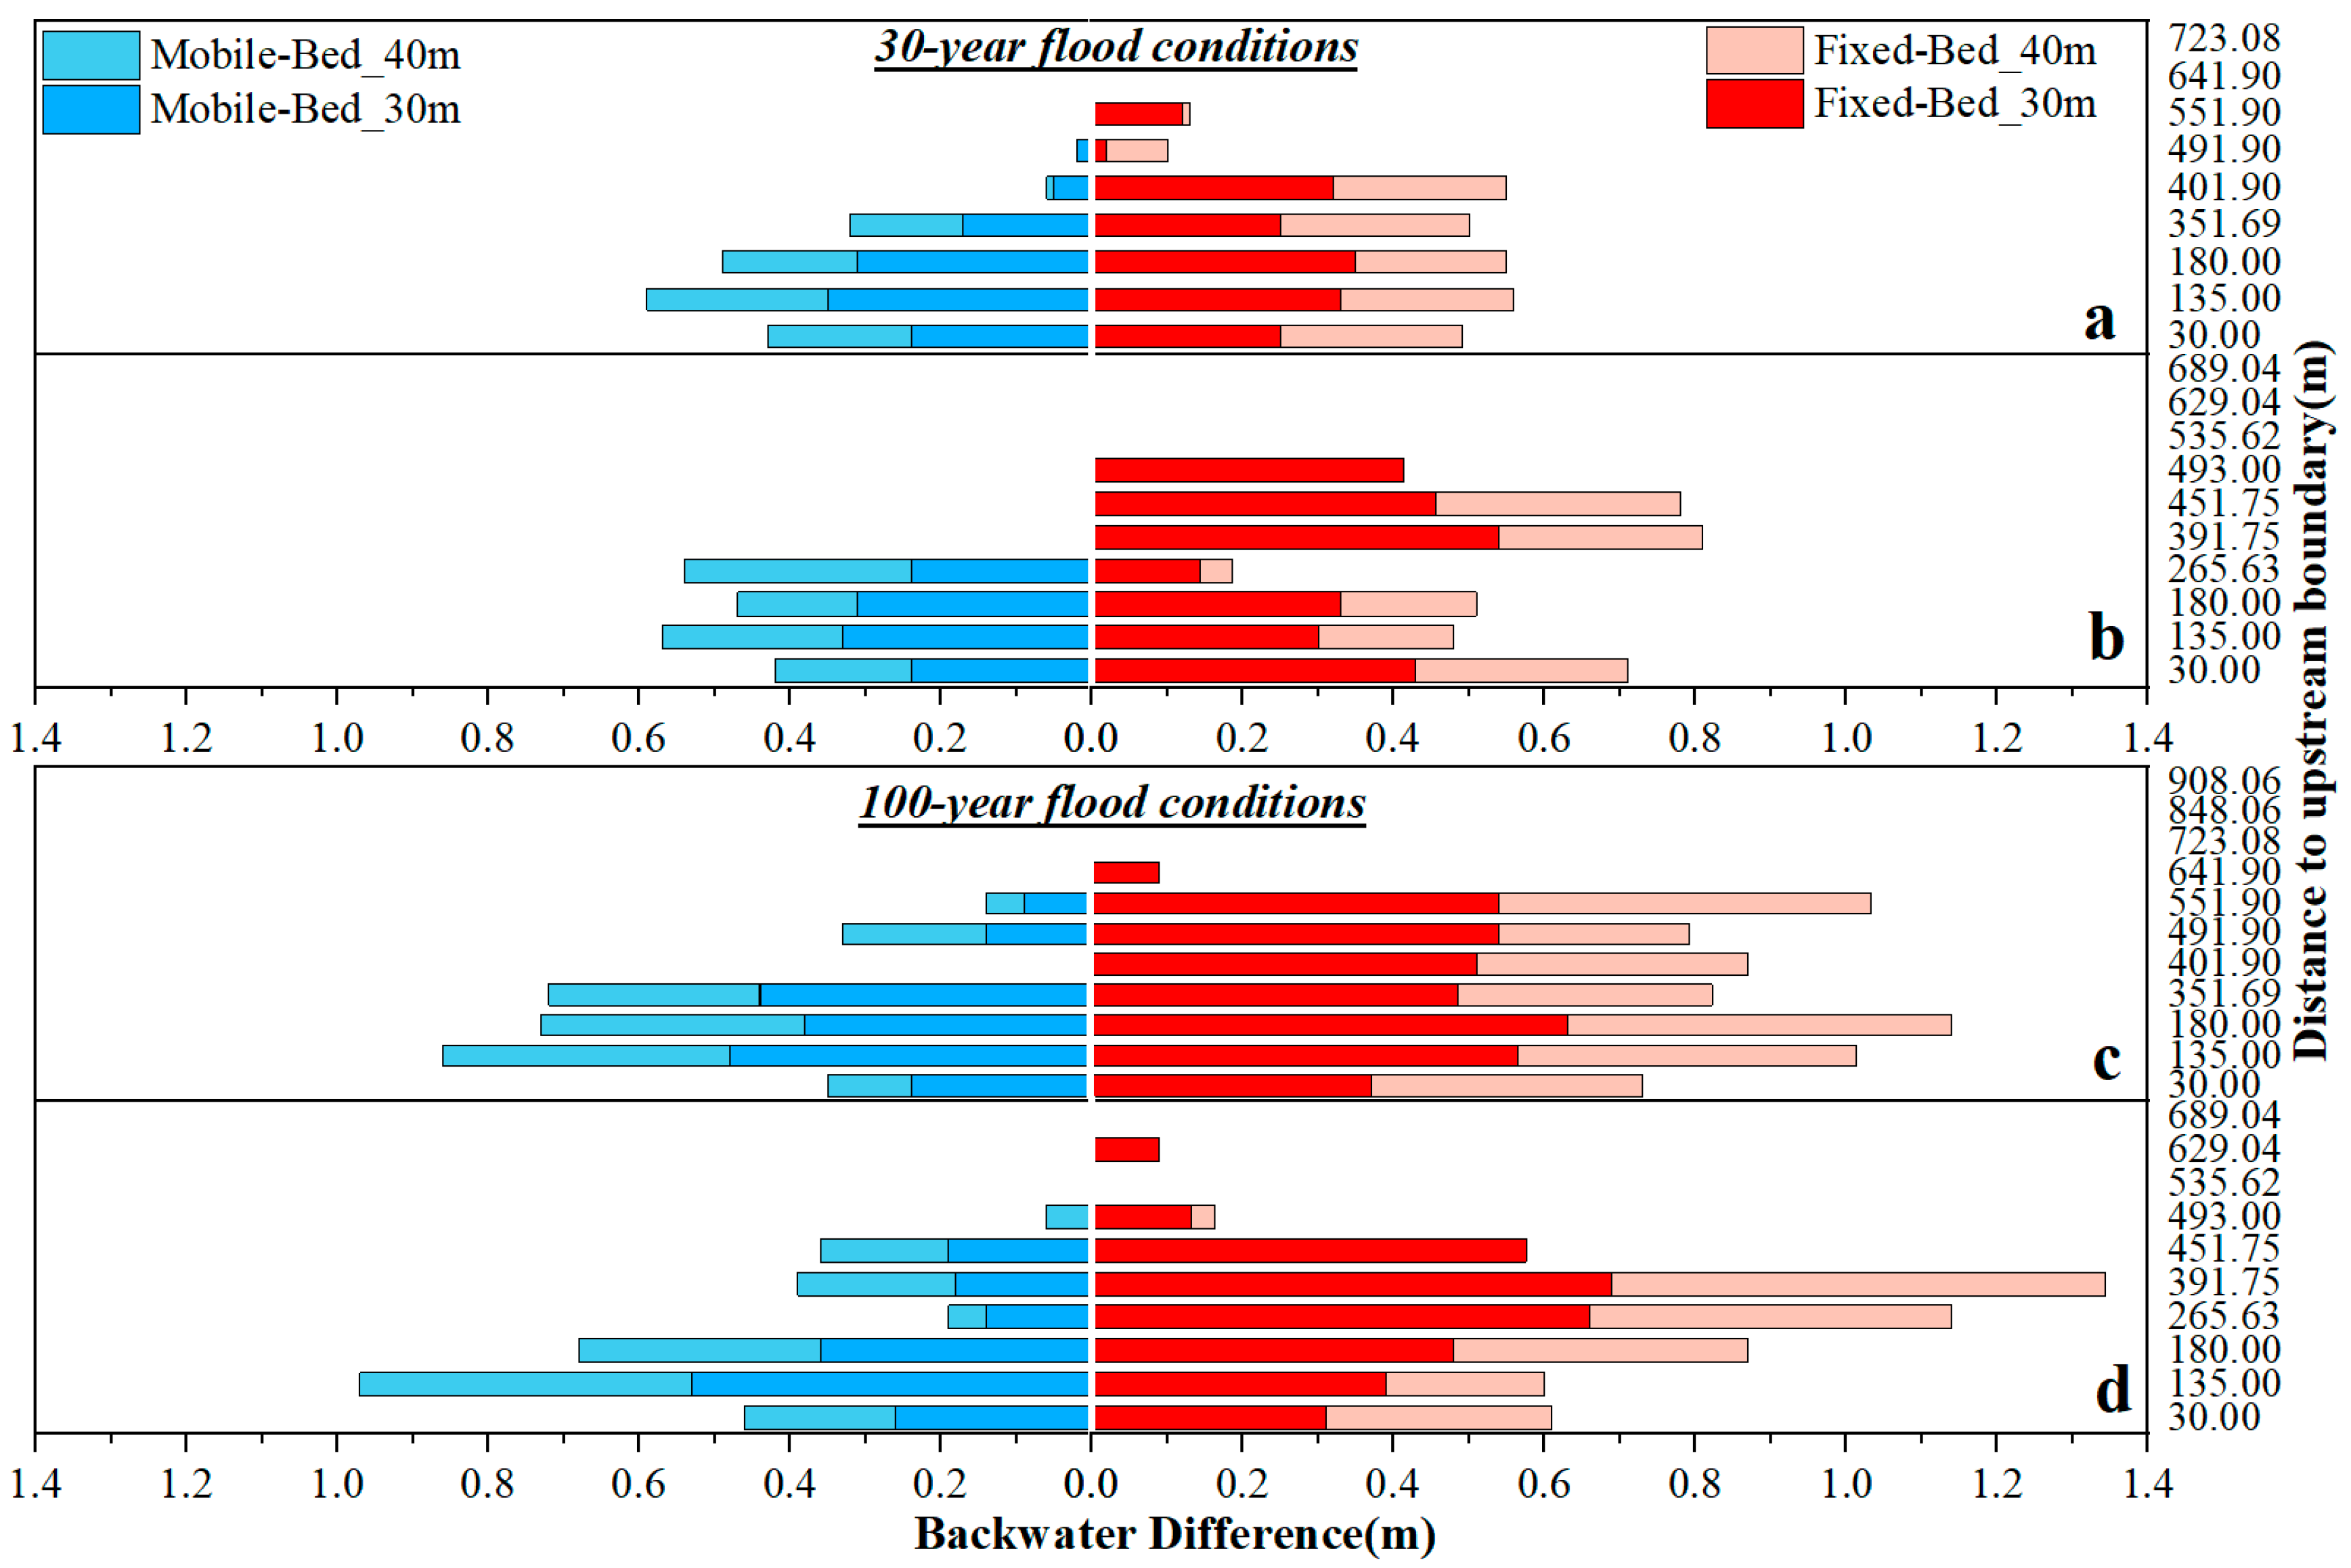
The backwater response mechanisms in the experimental reach critically demonstrate how boundary mobility modulates hydrodynamic disturbances induced by bridges (Figure 9). In the mobile-bed system, sediment transport processes in the sandy channel establish a natural negative feedback mechanism—flow energy is continuously consumed through bedform reorganization rather than being solely converted into backwater potential. This energy redistribution pattern intensifies during high-magnitude floods as sediment mobility increases. Conversely, rigid boundaries in the fixed-bed system obstruct energy dissipation pathways, forcing hydrodynamic perturbations to manifest entirely as backwater height increments, resulting in systematically higher values compared to mobile-bed conditions. The spatiotemporal disparity in backwater peak locations reveals fundamental differences in system response rates: the mobile bed achieves immediate flow section expansion via scour, causing earlier backwater culmination, whereas the fixed bed relies solely on limited depth variations for energy regulation, exhibiting pronounced response hysteresis. The water level regulation effect from pier spacing adjustments demonstrates asymmetric efficacy across systems: mobile beds show negligible backwater pattern changes due to inherent self-organizing regulatory capacity, while fixed beds display heightened sensitivity, with backwater fluctuation ranges attenuating exponentially as pier spacing widens. Strategically coordinating spatial distributions of bridge groups enables regional backwater mitigation through phase modulation of disturbance waves, thereby establishing a physical basis for optimizing flood conveyance safety.

3.2. Velocity

The arrangement of bridge piers significantly alters the local flow field structure, inducing complex hydrodynamic responses. Figure 10 uses a heatmap with color gradients to illustrate changes in the average flow velocity along the left, middle, and right sections of the channel before and after bridge construction under movable-bed measurement conditions. Experimentally measured velocity distributions visually reveal the impact of different pier spacing schemes (30 m and 40 m) on the spatial redistribution of flow velocity under distinct design flood frequencies (30-year and 100-year recurrence intervals). The core phenomena manifest as follows: the constriction of the effective flow cross section resulting from bridge construction, combined with the confining effects of existing bank control works and the bend topography, collectively drive a forced shift of the primary dynamic flow axis towards the right bank. This shift exhibits a more pronounced velocity gradient near the right bank due to enhanced boundary constraints, whereas the left bank maintains lower velocity levels owing to relatively relaxed boundary conditions.
Under fixed-bed measurement conditions, Figure 11 presents a comparative visualization of measured flow velocities along the left, middle, and right sections of the channel under various peak discharge conditions, both before and after bridge construction. Each row corresponds to a specific peak discharge, with subplots contrasting pre-construction conditions against post-construction scenarios featuring a pier span of 30 m and 40 m. Under the 30-year flood condition, quantitative analysis demonstrates that as the pier spacing increases from 30 m to 40 m, the maximum velocity at the representative section upstream of the bridge increases from 4.24 m/s to 4.98 m/s, representing an 18.27% increase. Moreover, the rate of increase exhibits nonlinear acceleration with widening spacing, clearly illustrating a positive feedback mechanism between the local contraction ratio and the velocity amplification. The 100-year flood scenario further amplifies this dynamic process, although the increased peak discharge significantly elevates the cross-sectional average kinetic energy, resulting in a more pronounced absolute magnitude of local velocity attenuation downstream of the bridge; the larger incoming flow momentum concurrently causes the high-velocity core zones within the flow-separation regions near the piers and the shifted main flow path to expand spatially. Consequently, the peak maximum velocity is further elevated. This spatial expansion and intensification of the high-energy flow zones potentially exacerbates the risk of local scour around the piers and the right bank bed, thereby highlighting the intrinsic relationship between bridge-induced hydrodynamic disturbances and energy redistribution within the river system.

3.3. Scour

Mobile-bed experiments confirm that newly constructed bridges significantly reduce scour at existing highway bridges. As shown in Figure 12, after bridge construction, scour depths at the left-bank bridge systematically decrease under floods of different frequencies, while scour reduction efficiency negatively correlates with peak discharge. For the 30-year return period flood, pier spacing dominates the scour mitigation effect, and its influence demonstrates clear discharge dependency: when peak discharge is below 50% of the design value, increasing pier spacing (tested range: 3–6 times pier diameter) reduces scour depth by 1.2–1.5 m; however, when discharge approaches the design peak for the 100-year flood, the impact of spacing attenuates by over 40%, resulting in scour depth variations of less than 0.7 m, indicating that flow energy supersedes structural interference under high hydrodynamic loading.
Figure 13 further quantitatively reveals that under the 30-year flood, the maximum scour depth decreases from >6.0 m (pre-construction) to ≈4.0 m (post-construction), achieving an absolute reduction of 2.0 m (33% decrease), and this reduction effect progressively diminishes downstream; conversely, for the 100-year flood, although the local maximum scour depth near piers still decreases by ≈2.0 m, downstream scour depths remain essentially consistent before and after construction (difference <0.2 m), demonstrating limited protective capacity of new bridges during high-intensity floods. This phenomenon is attributable to fundamental differences in flood energy levels: under 30-year floods, pier groups effectively dissipate energy by disrupting flow structures; whereas higher velocities in 100-year floods allow flow to penetrate pier interstices, leading to rapid downstream energy recovery.

4. Conclusions

To investigate flood-response mechanisms to newly constructed river bridges, we established a 1:60 scale physical model based on an actual engineering case. Comparative analyses of 30-year and 100-year return-period flood propagation were conducted under scenarios with and without the proposed bridge, using both mobile-bed and fixed-bed systems. Through parametric regulation of pier spacing, key flood-routing responses were systematically quantified, including spatial flood-level distributions, flow-velocity field reorganization, and local scouring dynamics at existing bridges. Critically, the study demonstrates that the backwater effect induced by the new bridge fundamentally represents propagation of disturbance waves within the channelized reach, while alterations in the flow-velocity field originate from momentum redistribution and turbulence restructuring caused by pier–flow separation. Collectively, these hydrodynamic modifications significantly influence local scour patterns around bridge piers. Thus, the integrated mobile- and fixed-bed modeling framework establishes a hydrodynamic basis for investigating flood-response mechanisms to newly constructed river bridges. The main conclusions are drawn as follows.
The construction of new bridges significantly alters the flow dynamics structure of river channels, inducing upstream backwater effects whose intensity nonlinearly increases with proximity to the bridge axis. Fixed-bed experiments produce larger backwater rises and more extensive inundation extents while achieving high-fidelity replication of water surface profiles. These experiments cannot capture the dynamic feedback mechanisms present in natural riverbeds. Conversely, mobile-bed experiments better align with natural fluvial conditions by enabling dynamic coupling between bedform evolution and flow hydraulics; this process provides more practically relevant hydrodynamic foundations for flood risk assessment. The fundamental distinction between these methodologies lies in how boundary conditions govern energy dissipation pathways: fixed-bed tests isolate purely hydrodynamic responses, while mobile-bed tests elucidate complex sediment–flow–structure interactions. Thus, these approaches collectively advance a comprehensive understanding of backwater phenomena—fixed-bed modeling elucidates idealized mechanistic principles, whereas mobile-bed simulations reveal realistic system evolution.
The placement of bridge piers significantly disturbs the natural flow continuity within the river channel, thereby reshaping the local flow field structure. The hydraulic contraction effect induced by bridge construction, specifically, the narrowing of the effective flow cross section elevates the maximum flow velocity near the pier groups. Furthermore, when flowing past these obstructions, the spatially asymmetric nature of the flow separation phenomenon often causes systematic deflection of the primary flow path; in this instance, manifesting as a rightward shift towards the bank. Consequently, this flow deflection not only modifies the near-bank flow regime but, more critically, substantially amplifies the hydrodynamic shear stress and scouring potential acting upon the foundation of the right-bank embankment. This intensified scouring poses a significant threat to the embankment’s stability. In contrast, the complex vortex structures and flow stagnation zones formed upstream of the pier groups partially dissipate the kinetic energy of the approaching flow. This dissipation generates a sheltering effect for the foundation of the pre-existing downstream bridge, consequently reducing the local flow velocity and scouring intensity acting upon it. This phenomenon is evidenced by the effective reduction in the maximum scour depth observed at the pre-existing bridge following the new bridge’s construction.
In studies concerning bridge construction across rivers and associated flood risks, numerical simulations are commonly employed, typically assuming a fixed riverbed boundary. However, results from movable-bed experiments, as presented above, show significant discrepancies compared to those under fixed-bed conditions. From the perspective of flood risk assessment and safety considerations, it is imperative to conduct movable-bed physical model experiments. This study has not fully accounted for the influence of unsteady flow dynamics. The study was conducted under steady-flow conditions. The effects of unsteady flood wave propagation were not considered. The model did not incorporate the potential effects of vegetation on flow resistance and bank stability. Although scale effects were minimized through careful design, they may still influence very small-scale turbulent structures and extreme local scour phenomena. Given the highly complex and variable terrain, future research should consequently incorporate experimental investigations using representative and critical flood events. The mechanisms revealed in this study can provide critical insights for the preliminary design and risk assessment of new bridges. Such targeted studies would thereby enable enhanced scientific and technical guidance for practical engineering projects.

Author Contributions

Conceptualization, M.H.; Methodology, M.H., G.L. and X.S.; Validation, M.H.; Investigation, X.S.; Writing–original draft, M.H. and X.S.; Writing–review & editing, M.H. and G.L.; Visualization, M.H.; Supervision, G.L. All authors have read and agreed to the published version of the manuscript.

Funding

Shaanxi Provincial Natural Science Basic Research Plan (2022JC-LHJJ-10).

Data Availability Statement

The original contributions presented in this study are included in the article. Further inquiries can be directed to the corresponding author.

Conflicts of Interest

The authors declare no conflict of interest.

References

  1. Wang, W.; Zhou, K.; Jing, H.; Zuo, J.; Li, P.; Li, Z. Effects of Bridge Piers on Flood Hazards: A Case Study on the Jialing River in China. Water 2019, 11, 1181. [Google Scholar] [CrossRef]
  2. Jing, H.; Niu, L.; Hou, J. Effect of bridge blockage on flood flow by three dimensional numerical simulation. Water Resour. Hydropower Eng. 2025, 56, 59–70. (In Chinese) [Google Scholar]
  3. Hou, J.M.; Li, G.D.; Li, G.; Liang, Q.; Zhi, Z. Application of efficient high-resolution hydrodynamic model to simulations of flood propagation. J. Hydroelectr. Eng. 2018, 37, 96–107. [Google Scholar]
  4. Tang, W. Analysis of the flood control impact of a large bridge construction across the Hanjiang River Delta. Hydro Sci. Cold Zone Eng. 2024, 7, 136–140. [Google Scholar]
  5. Zhao, J.; Liang, Z.; Liu, J.; Li, B.; Duan, Y. Variable runoff generation layer distributed hydrological model for hilly regions. Adv. Water Sci. 2022, 33, 429–441. [Google Scholar]
  6. Cao, X.; Xu, J.; Qi, Y. “Three lines of defense” empowers urban flood forecasting: Mechanisms and approaches. Water Resour. Dev. Res. 2024, 24, 27–30. [Google Scholar]
  7. Hou, J.; Wang, R.; Li, G.; Li, G. High-performance numerical model for high-resolution urban rainfall-runoff process based on dynamic wave method. J. Hydroelectr. Eng. 2018, 37, 40–49. [Google Scholar]
  8. Hou, J.; Liang, Q.; Zhang, H.; Hinkelmann, R. An efficient unstructured MUSCL scheme for solving the 2D shallow water equations. Environ. Model. Softw. 2015, 66, 131–152. [Google Scholar] [CrossRef]
  9. Hengl, M.; Stephan, U.; Kainz, S.; Hasenhündl, M. Gegenständliche Modelle für Fließgewässer-Erfahrungen und Perspektiven. Österr. Wasser-Abfallwirtsch. 2024, 76, 176–181. [Google Scholar] [CrossRef]
  10. Atsumi, T.; Fukuda, T.; Fukuoka, S. Saltation Motions and Vertical Sorting Mechanism of Gravel Particles by Numerical Mobile-Bed Experiment. J. Jpn. Soc. Civ. Eng. 2021, 77, 619–624. [Google Scholar] [CrossRef]
  11. Büyüker, Z.; Bombar, G.; Cardoso, A.H. Effect of Sediment Load on Bed Morphology of a Mobile-Bed Symmetrical Confluence. In Proceedings of the 8th International Students Science Congress, Gaziantep, Türkiye, 1–4 November 2024. [Google Scholar] [CrossRef]
  12. Liu, X.; Xia, J.; Zhou, M.; Deng, S.; Li, Z. A New Formula for Predicting Movable Bed Roughness Coefficient in the Middle Yangtze River. Prog. Phys. Geogr. Earth Environ. 2021, 46, 441–457. [Google Scholar] [CrossRef]
  13. Khorrami, Z.; Banihashemi, M.A. Development of a Non-Coupled Algorithm for Simulating Long-Term Sedimentation in the Zonouz Dam Reservoir, Iran. J. Soils Sediments 2021, 21, 545–560. [Google Scholar] [CrossRef]
  14. Ramesh, B.; Kothyari, U.C.; Murugesan, K. Near-Bed Particle Motion over Transitionally-Rough Bed. J. Hydraul. Res. 2011, 49, 757–765. [Google Scholar] [CrossRef]
  15. Hamidifar, H.; Nones, M.; Rowinski, P.M. Flood Modeling and Fluvial Dynamics: A Scoping Review on the Role of Sediment Transport. Earth-Sci. Rev. 2024, 253, 104775. [Google Scholar] [CrossRef]
  16. Liang, F.; Wang, C. Flume Tests of Local Scour Around Pile Groups in Composite-Sandy Soils. J. Tongji Univ. Nat. Sci. 2017, 45, 978–984. [Google Scholar]
  17. Wang, C.; Yuan, Y.; Liang, F.; Tao, J. Experimental Investigation of Local Scour Around Cylindrical Pile Foundations in a Double-Layered Sediment Under Current Flow. Ocean Eng. 2022, 251, 111084. [Google Scholar] [CrossRef]
  18. Zhang, L.; Wan, Q. Analysis of Bed Load Simulation Methods of Long Reach Mobile-Bed Model of the Yellow River. In Proceedings of the 2011 International Conference on Multimedia Technology, Hangzhou, China, 26–28 July 2011; pp. 3842–3843. [Google Scholar] [CrossRef]
  19. Cantero-Chinchilla, F.N.; Castro-Orgaz, O.; Ali, S.Z.; Dey, S. Experiments on Hydraulic Jumps over Uneven Bed for Turbulent Flow Modelling Validation in River Flow and Hydraulic Structures. Sci. Data 2024, 11, 313. [Google Scholar] [CrossRef] [PubMed]
  20. Kim, D.-G.; Hwang, G. Numerical Analysis of Dam-Break Waves in an L-Shaped Channel with a Movable Bed. J. Korea Water Resour. Assoc. 2012, 45, 291–300. [Google Scholar] [CrossRef]
  21. Yalin, M.S. Theory of Hydraulic Models; Macmillan: London, UK, 1971. [Google Scholar]
  22. Zhang, R.; Xie, J. Sediment Research; China Water & Power Press: Beijing, China, 1989. [Google Scholar]
Figure 1. Schematic diagram of the engineering location.
Water 17 02951 g001
Figure 2. Photo of the fixed-bed model test.
Water 17 02951 g002
Figure 3. Gradation curve of bed material.
Water 17 02951 g003
Figure 4. Layout of the mobile-bed model.
Water 17 02951 g004
Figure 5. Bathymetric profile. (Using the CS19 as an example, the left bank is taken as the datum.)
Water 17 02951 g005
Figure 6. Stage–discharge rating curve (CS32).
Water 17 02951 g006
Figure 7. Longitudinal variation of backwater along the river channel: (a) left bank; and (b) right bank.
Water 17 02951 g007
Figure 8. Flow pattern changes under the 30-year return period flood: (a) mobile-bed; and (b) fixed-bed.
Water 17 02951 g008
Figure 9. Magnitude of backwater rise under different flood conditions for different scenarios: (a,c) left bank; (b,d) right bank; (a,b) 30-year flood condition; and (c,d) 100-year flood condition.
Water 17 02951 g009
Figure 10. Movable bed: heatmap of the relative impact of various variables on flow velocity (circles denote bridge piers; (ac): 30-year flood condition, Q = 1840 m3/s; and (df): 100-year flood condition, Q = 2650 m3/s. White, pink, and blue denote the existing bridge, the proposed bridge with a 30-m pier spacing, and the proposed bridge with a 40-m pier spacing, respectively).
Water 17 02951 g010
Figure 11. Fixed bed: flow velocities magnitude before and after bridge construction under different flood conditions: (a,b) left bank; (c,d) centerline velocity; (e,f) right bank; (a,c,e) 30-year flood conditions; and (b,d,f) 100-year flood conditions.
Water 17 02951 g011
Figure 12. Evolution of scour depth at highway bridge piers under varying flood conditions: (a) 30-year flood conditions; and (b) 100-year flood conditions.
Water 17 02951 g012
Figure 13. Distribution of scour depth at each pier of the highway bridge under various peak discharge conditions: (a) 30-year flood conditions; and (b) 100-year flood conditions.
Water 17 02951 g013
Table 1. Experimental conditions.
Flood FrequencyFlood Discharge (m3/s)Water Levels (m)Flow
Depth
(m)
FrModelLongitudinal Pier Spacing
30-year floods1840377.245.240.56movable/
fixed
30 m/40 m
100-year floods2650378.866.860.61
Table 2. Compilation of primary scaling ratios.
Similarity ConditionScale Ratio DesignationSymbolCalculated ValueExpression
Geometric SimilarityHorizontal ScaleλL60
Vertical Scaleλh60
Flow Kinematic SimilarityVelocity Scaleλv7.75λv = λh1/2
Roughness Scaleλn1.98
Discharge ScaleλQ27,900λQ = λLλhλv
Flow Time Scaleλt17.74λt1 = λLv
Bedload Motion SimilarityThreshold Velocity Scaleλvo7.75λvo = λv
Particle Size Scaleλd60λd = λ/λγs − γ3/2
Bedload Transport Rate Scaleλgb465λgb = λdλv
Bed Deformation SimilarityBed Evolution Time Scaleλt210.3λt2 = λLλh λ γ gb
Table 3. Gradation of model sediment.
Particle Size (mm)1051.250.630.3150.160.08
Percentage Finer (%) by Weight10098.7290.8970.3331.505.741.41
Table 4. Locations of left and right banks at each surveyed cross section.
Cross SectionDistance to Upstream Boundary (m)Cross SectionDistance to Upstream Boundary (m)
Left BankRight BankLeft BankRight Bank
1−60−6016431.91331.79
2−30−3017461.91361.79
30018491.91391.79
4303019521.91421.79
5606020551.91451.79
6909021581.91481.79
712012022611.91511.79
HS13513523641.91544.61
815015024671.91568.33
918018025701.91532.04
1021021026-1723.08535.62
1124024026736.79497.91
1227027027766.79539.74
13-1315.69265.6328796.79569.74
13341.91226.9629826.79599.74
14371.91271.7930848.06629
15401.91301.7932908.06689
Disclaimer/Publisher’s Note: The statements, opinions and data contained in all publications are solely those of the individual author(s) and contributor(s) and not of MDPI and/or the editor(s). MDPI and/or the editor(s) disclaim responsibility for any injury to people or property resulting from any ideas, methods, instructions or products referred to in the content.