Article

Holistic Assessment of Social, Environmental and Economic Impacts of Pipe Breaks: The Case Study of Vancouver

1
Dipartimento di Ingegneria Civile e Architettura, University of Pavia, Via Ferrata 3, 27100 Pavia, Italy
2
Department of Building, Civil and Environmental Engineering, Concordia University, 1455 De Maisonneuve Blvd. W., Montreal, QC H3G 1M8, Canada
*
Author to whom correspondence should be addressed.
Water 2025, 17(2), 252; https://doi.org/10.3390/w17020252
Submission received: 16 December 2024 / Revised: 8 January 2025 / Accepted: 15 January 2025 / Published: 17 January 2025

Abstract

:
This paper presents a holistic assessment framework for the impacts of water distribution pipe breaks to promote environmentally sustainable and socially resilient cities. This framework considers social, environmental, and economic vulnerabilities as well as probabilities associated with pipe failure. The integration of these features provides a comprehensive approach to understanding infrastructure risks. Taking the city of Vancouver as a case study, the social vulnerability index (SVI) is obtained following the application of a cross-correlation matrix and principal component analysis (PCA) to identify the most influential among 33 selected variables from the 2021 census of the Canadian population. The Environmental Vulnerability Index (EVI) is evaluated by considering the park and floodplain areas. The Economic Vulnerability Index (ECI) is derived from the replacement cost of pipes. These indices offer valuable insights into the spatial distribution of vulnerabilities (consequences) across urban areas. Subsequently, the Consequence of Failure (COF) is computed by aggregating the three vulnerabilities with equal weights. Pipe probability of failure (POF) is evaluated by a Weibull model calibrated on real break data as a function of pipe age. This approach enables a dynamic evaluation of pipe deterioration over time. Risk is finally assessed by combining COF and POF for prioritizing pipe replacement and rehabilitation, with the final objective of mitigating the adverse impacts of infrastructure failure. The findings show the significant impact of ethnicity, socioeconomic indices, and education on the social vulnerability index. Moreover, the areas close to English Bay and Fraser River are more environmentally vulnerable. The pipes with high economic vulnerability are primarily concrete pipes, due to their expensive replacement costs. Finally, the risk framework resulting from the vulnerabilities and pipe break probabilities is used to rank the Vancouver City water distribution network pipes. This ranking system highlights critical areas requiring different levels of attention for infrastructure improvements. All the pipes and corresponding risks are illustrated in Vancouver maps, highlighting that the pipes associated with a very high level of risk are mostly in the south and north of Vancouver.

1. Introduction

A resilient water distribution network (WDN) has a great impact on the social and economic growth of a society. There is currently no universally accepted definition for a resilient drinking water system. In this context, [1] proposed a definition based on the relationship between the capacities (absorptive, adaptive, and restorative), the properties (robustness, redundancy, resourcefulness, and rapidity), and the characteristics or goals of the systems (reduction in the probability of failure consequences and recovery time).
Assessment of resilience in any complex urban system needs a holistic approach to provide an overall study of the systemic behaviour. As the fundamental components of urban sub-systems, in most studies, the economic, social, physical, and institutional issues are mentioned [2]. While physical vulnerabilities have been extensively studied, the emerging trend of exploring the integral of both physical and non-physical vulnerabilities requires further investigation.
Numerous research efforts have recently been dedicated to studying social vulnerability, which refers to the susceptibility of certain social groups to natural hazards and human-caused disasters. Social vulnerability stems from social inequalities present in society, such as differences in the quality of life and development and environmental aspects, among others, which together determine the extent to which an incident harms a group of people and how they can handle it [3]. Social vulnerability is also affected by the characteristics of a place, such as accessibility to critical services and jobs and the quality of the transportation network [4] and of local infrastructure [5]. According to vulnerability studies, social groups are differently affected by the effects of natural hazards/human-caused disasters and by the related infrastructural breakdowns [6].
As social vulnerability can clash with human life or the accessibility of resources, it can be subdivided into four main components because of direct and indirect impacts: population vulnerability, career vulnerability, economic vulnerability, and infrastructure vulnerability [7]. Risk assessments are typically aimed at reducing vulnerability through actions including inspection, prediction, and spatial planning, while typically prioritizing the assessment of the hazard. However, this assessment must also be extended to analyze exposure hazards [8].
Based on a place-related approach [9], all the data and factors related to a certain place can be used to characterize it in terms of vulnerability, as well as to identify, analyze, compare, and forecast the more vulnerable present areas. A combination of appropriate socioeconomic indices available in a GIS map can be used in the characterization phase [10,11]. For infrastructure optimization planning, social vulnerability indices, which can be categorized into different subgroups, i.e., demographic, social, cultural, economic, environmental, and infrastructural indices, can be considered [7,12,13]. In various cases, these indices are available in the census of each country, on national, regional, census subdivision, and statistical block scales. As an example, after being developed for county-level socioeconomic and demographic data in some studies [3,14], the social-vulnerability (SVI) index was considered at the census tract level for emergency management in some events, such as hurricanes and floods [12,15,16]. Social vulnerability indices to assess flood exposure for the Indigenous Canadian population on a census subdivision scale were also created [17]. However, the impact of social vulnerability on decisions at a smaller scale, e.g., city block or single water pipe, has not been explored.
Different approaches have been applied for weighting SVI, including factor analysis [5,18], principal component analysis (PCA) [3,10,17,19], TOPSIS [20], and improved analytical hierarchy process [7]. To avoid underestimating the role of authorities and policymakers and covering up the data by them, they should be involved in defining the SVI [14]. Excluded stakeholders may decrease the level of acceptance of results. To avoid stakeholder bias, strictly statistical approaches such as factor analysis or component analysis can be applied. Nevertheless, because they generally seek to explain variance, they may neglect the importance of correlated variables that together further increase vulnerability [21].
While social vulnerability has been mainly analyzed in the context of natural hazards and human-caused disasters, other worthwhile fields of application include urban infrastructures. In fact, any service disruption and system deterioration at the level of urban infrastructure causes enormous socioeconomic and environmental impacts that need to be thoroughly assessed and addressed [22]. Among these infrastructures, water distribution systems play a crucial role in sustaining human life by delivering safe and clean drinking water to billions of people worldwide. Therefore, they should be protected from deterioration, which may result in critical consequences, such as water loss, quality degradation, and health problems [23], thus requiring frequent maintenance actions, updates, and upgrades [24].
In the operation of water distribution systems, the events of mechanical failure, that is, pipe bursts, must be addressed as a source of risk, as they cause service disruptions in the areas being served. In this context, various research efforts were dedicated to forecast the occurrence of these anomalous events. For estimating the probability of breaks, statistical models [25] and machine learning models [26] have been applied. While machine learning models have led to better performing models, in the context of risk frameworks, statistical models are more commonly applied due to their simplicity and reliability [27,28].
The consequences of water system failures have been framed largely in two ways: (1) hydraulic and water quality impacts and (2) costs. From a hydraulic and water quality perspective, various methods have been proposed to assess the ability of the network to meet demands and maintain safe pressure levels [29,30,31]. Costs associated with pipe breaks have been estimated according to rehabilitation costs [27,28,32,33], as well as combined with water loss costs [27] and energy costs [33]. However, an accurate assessment of the risk associated with pipe bursts cannot overlook aspects related to social, economic, and environmental vulnerability. Indeed, these aspects have been poorly investigated in the past, though the impact of pipe bursts depends undisputedly on the socioeconomic vulnerability of the area under consideration [34]. Thus, the present paper seeks to develop a holistic framework for the assessment of pipe failure risk, including social, environmental, and economic aspects, which has not been explored in existing studies. By providing a dynamic and adaptable methodology, this study allows decision-makers to better prioritize actions in complex urban water distribution systems, advancing beyond the limitations of traditional approaches.
The novelty of this work lies in the development of a comprehensive risk framework that uniquely integrates the consequences of failure in social, economic, and environmental aspects with pipe failure probabilities to assess the risk of water distribution system failures. Unlike traditional studies, this framework considers a holistic perspective, incorporating demographic and socioeconomic factors, land use characteristics, and financial costs rather than focusing solely on physical vulnerabilities or hydraulic impacts. This framework empowers decision-makers to dynamically adjust variables and attributes within each index based on their preferences and objectives, providing a customizable and adaptable approach to risk management in water distribution networks. This approach not only helps manage water infrastructure more effectively but also shows how different vulnerabilities overlap, making it a useful tool for decision-making.
The remainder of the paper is organized as follows. The following (Section 2) describes the case study, which serves to validate the approach in the context of the city of Vancouver, followed by the description of the methodology (Section 3), the analysis of the results (Section 4), and the discussion of key findings (Section 5). The paper ends with the conclusions (Section 6).

2. Case Study

2.1. Study Area

The city of Vancouver in the Metro Vancouver region is, at 114 square kilometres, the largest city in British Columbia (BC) and the eighth largest municipality in Canada. According to the latest census profile, as of 2021 [35], the population of Vancouver was estimated at approximately 662,248. Vancouver is a seaport and coastal city located on the western end of the Burrard Peninsula in the southwest of Canada; see Figure 1. The city is enclosed by a floodplain area, bordered to the north by English Bay and the Burrard Inlet, and to the south by the Fraser River. The local government of Vancouver collaborates with Metro Vancouver’s regional authorities on regional planning and growth management, public transportation, drinking water and sewage (regional treatment facilities and significant pipelines crossing city boundaries), air and water quality monitoring, and regional health services. Vancouver’s water and sewer system is a complex network of pipes that daily distributes 295 million litres of potable water to homes and businesses while draining wastewaters for treatment. Stanley Park in the northwest of Vancouver, next to the West End neighbourhood, as shown in Figure 1, is one of the largest urban parks in North America [36].

2.2. Data Sources of Social Vulnerability

The 2021 Census of Population data for Vancouver was used in this work at the dissemination area (DA) level [37]. DAs are the smallest and most homogenous census tracts in Canada. They are relatively stable geographic units comprising adjacent blocks with an average population of 400 to 700 people based on data from the previous Census of Population Program. The Vancouver dataset contains around 2240 variables and 1025 DAs. The data from two dissemination areas were unavailable to meet the confidentiality requirements and were eliminated from the dataset. Each variable has a specific rate, which is the ratio of the population associated with that variable to the total population of the related DA.

2.3. Data Sources of Environmental Vulnerability

This study used a dataset of polygon vector files focusing on parks and floodplain areas, downloaded from the open data portal of Vancouver [38] to analyze environmental vulnerability. It also combined quantitative modelling and GIS methods, employing the DA as the geographical units for spatial analysis.

2.4. Data Sources of Economic Vulnerability

The economic data comprises pipe replacement costs, the inventory of the water distribution system [39], and the engineering design manual for Vancouver [40]. The RS Means heavy construction catalogue was used for the pipe replacement cost analysis [41].

2.5. Data Sources for Estimating the Probability of Failure

The shapefile of the water distribution system was collected from Vancouver’s open data source [39]. This contains information on each individual pipe, such as installation date, material, length, and diameter. Historical data of pipe failures between 2009 and 2020 was provided directly by the City.

3. Materials and Methods

The methodology aims to assess the risk associated with water distribution main failure. Risk involves estimating the consequences of failure (COF), including social, environmental, and economic vulnerabilities, and the probability of failure (POF). As for social vulnerability, this study selected initial variables based on the previous literature (Table 1) while considering the demographic, social, cultural, economic, and infrastructure characteristics of the Canadian population, with original SVI by Cutter [3], and availability of the data in the relevant DAs. The following subsections describe the methodological elements used for assessing social, environmental, and economic vulnerability (3.1), consequence of failure (3.2), probability of pipe failure (3.3), and risk (3.4). All steps were carried out in Python and are available in [42], together with the relevant data.

3.1. Vulnerability

3.1.1. Social Vulnerability Index (SVI)

Social vulnerability refers to the susceptibility of specific groups or communities to adverse effects such as disasters, economic inequalities, or other external influences [4]. It is caused by socioeconomic status, housing, transportation, language, education, and demographic status. The social dimensions of vulnerability are frequently considered to identify and understand whether certain groups of individuals or communities are more sensitive to the effects of natural disasters [17]. Social vulnerability is assessed using various indicators [10]. The 33 selected variables described in Table 2 for this work are well-established in the most recent vulnerability literature (Table 1). However, as this list may be exceedingly long, procedures for reducing it to the most significant variables must be adopted before estimating the social vulnerability index. This study applied a two-staged feature extraction process utilizing Pearson correlation matrix analysis and principal component analysis (PCA) [3] with varimax rotation. The variables were standardized to a consistent scale before applying the PCA approach [17]. As certain variables have an inverse impact on the vulnerability [3,18], namely postsecondary certificate diploma or degree, median value of dwellings ($), average total income in 2020 among recipients ($), and average total income of household in 2020 ($), their reciprocals were considered.

Pearson Correlation Matrix

The Pearson correlation matrix is a statistical measure to assess the relationships between pairs of continuous variables within a dataset. For each identified pair of variables with a correlation greater than 0.9, the variable within each pair with the highest relationship with other variables in the dataset was eliminated [4,16,18,43].

PCA

The PCA approach was used in this work to create a comprehensive social vulnerability index (SVI). PCA is a statistical method for reducing dimensionality while providing an effective approach to correlated variables [3,17,43,44]. This method converts the original set of correlated variables into a new set of uncorrelated variables called principal components. To determine the optimal number of components, three distinct selection criteria were compared:
  • Kaiser’s stopping rule: In this approach, only principal components with eigenvalues greater than one are retained. This approach implies that such components explain more variance than individual variables, therefore reducing the data while retaining significant information [5].
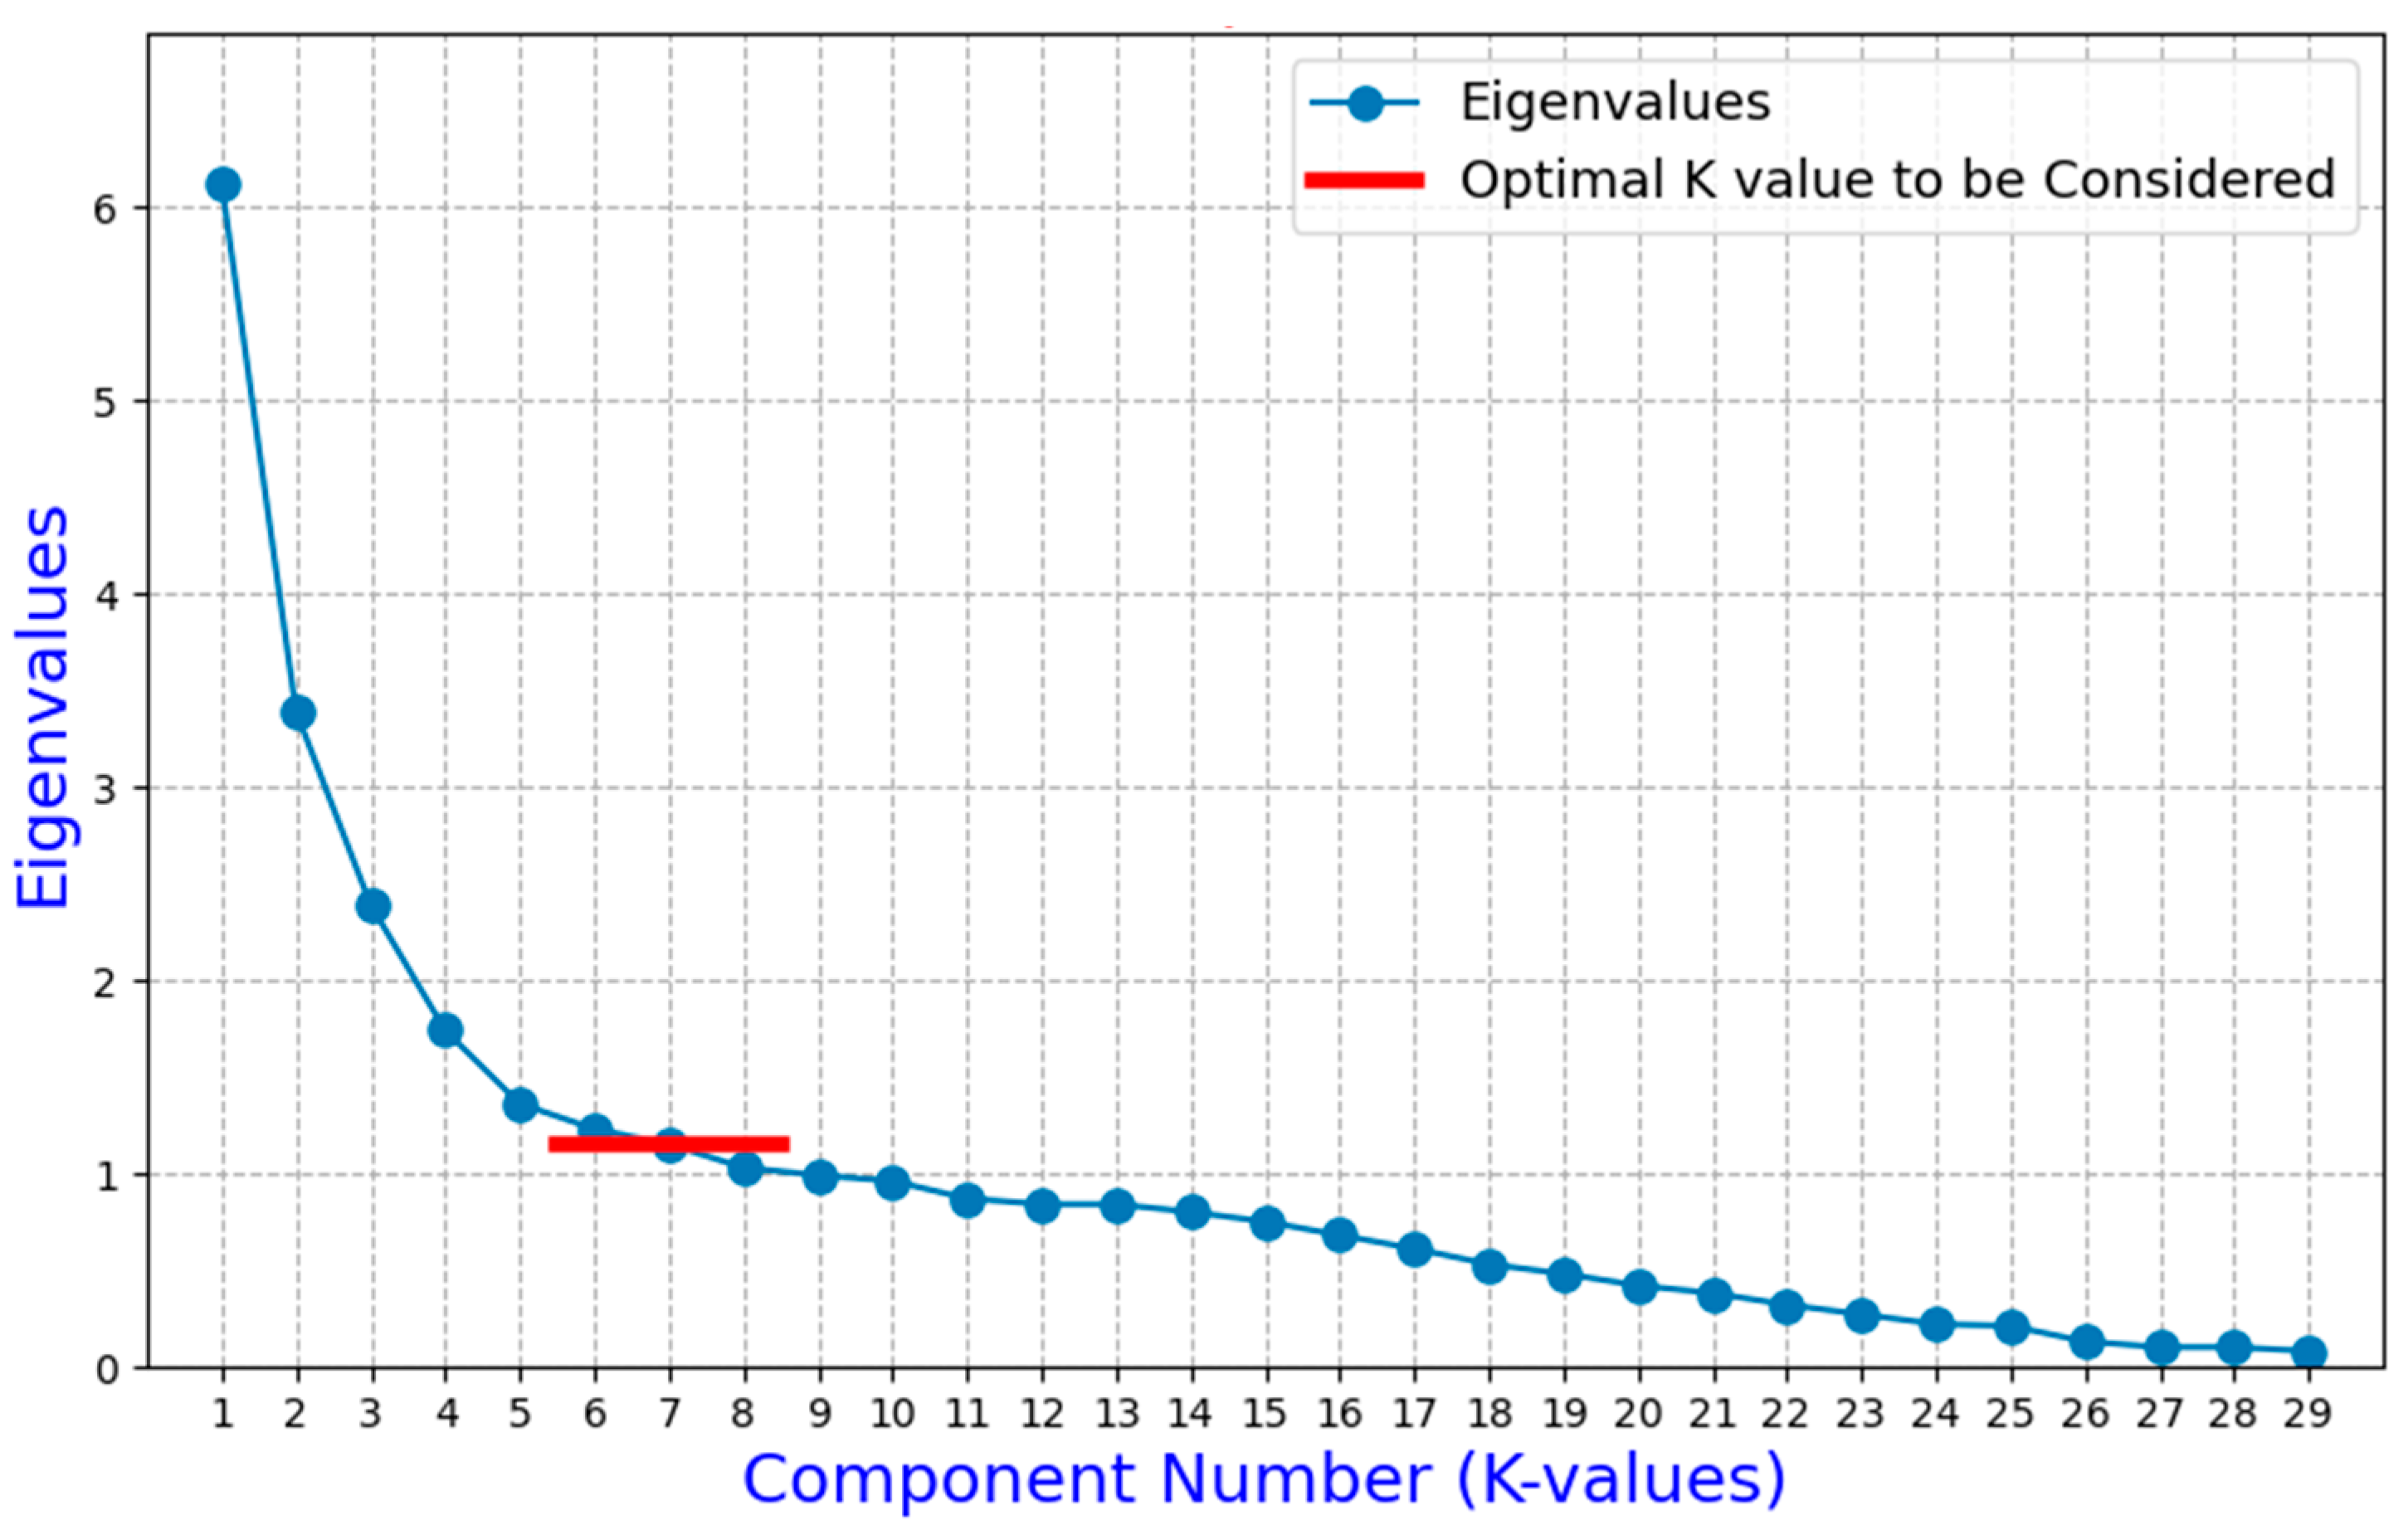
  • The scree plot: This graphical method represents the eigenvalue variance on the Y-axis and the PCs on the X-axis. Because the ’elbow point’ represents the optimal number of principal components to retain while balancing explained variance and dimensionality reduction, only the components included in the steep part of the curve are retained in the dataset [16,18,34].
  • Cumulative variance plot: This plot shows how much of the total variance in the dataset is included in the analysis. This study considered a threshold of roughly 85% of the total variance to retain an appropriate number of principal components [3,5,18]. The cumulative variance explained for each principal component is calculated by the following formula (Equation (1)) [16,17].
W i = P r o p o r t i o n   o f   V a r i a n c e   f o r   F a c t o r   i T o t a l   v a r i a n c e   E x p l a i n e d × 100 % ;   i = 1 , 2 , n
Varimax rotation was used to improve weight interpretation. It determines a connection between the rotated components and the variables. The arbitrary association cutoff value of 0.3 was chosen to preserve variables with stronger associations. Variables with association higher than this threshold were kept, while variables with association lower than this threshold were eliminated.
By applying varimax rotation, a single principal component coefficient is calculated for each variable in our dataset. The social vulnerability index (VI) for each dissemination area (DA) was calculated using the sum of these component coefficients multiplied by the cumulative variance explained by each component, following (Equation (2)) [17]:
                            V I D A = i = 1 n W i × P C i   ;   n = 15
The SVI for all DAs was then scaled from 0 to 100. The higher the SVI score in the DA, the more critical the socioeconomic status in that DA.

3.1.2. Environmental Vulnerability Index (EVI)

Parks require, by nature, substantial quantities of water to remain green and contribute to ecosystem service. A small 1-hectare park generally requires an annual water consumption of 3300 m3 for irrigation, and a larger 10-hectare park consumes an average of 33,000 m3 per year [45]. Therefore, pipe breaks may have a great impact on these environments.
Factors such as the elevation of area, soil permeability, soil texture, and land use can make an area more prone to floods. The source of a flood can be excessive rainfall, river discharge or a pipe break. The occurrence of the flood will affect the area’s environment by its destructive force. Therefore, the areas with more floodplains are more environmentally vulnerable [46]. This work used two factors, i.e., floodplains and parks area, to compute the environmental vulnerability index (EVI), selected based on data availability. The areas of each factor within each DA were extracted from their shapefiles using intersection in QGIS. The percentage of park and floodplain area for each DA was then calculated and scaled from 0 to 100. Finally, the EVI was calculated by combining these two factors with equal weights.

3.1.3. Economic Vulnerability Index (ECI)

Pipes deteriorate over time due to various factors, causing a reduction in their capacity and an increase in the risk of failure. In old water distribution systems, replacement is more economical than repairment [47]. Although the main portion is the cost related to the pipe replacement, there are other costs in the case of breakage such as those associated with causing damage to other infrastructures, water loss, and downtime of transportation or other services. Moreover, these costs vary based on land use. For instance, the costs associated with water supply reduction are greater in the industrial sector than in municipal areas due to the difference in the demand for and unit value of water [48]. Though considering the costs mentioned above would improve the assessment of economic vulnerability, these costs are highly site specific and difficult to assess. Therefore, only the cost of replacement was chosen in this research for assessing the Economic Vulnerability Index. Pipes were assumed to be replaced by either PVC or concrete pipes if their diameter was lower than/equal to or higher than 600 mm, respectively. These materials are preferred by the engineering design manual and Construction Specifications of Vancouver [40]. Unit costs for each material and diameter combination were sourced from RS Means [41]. Replacement costs were then calculated based on pipe diameters and lengths. Because pipe lengths provided in the inventory ranged from less than 0.1 m to 1700 m, all pipes were split in sections of 120 m or less to better match potential replacement sections and to not skew ECI results. Costs were scaled from 0 to 100 to assess the economic vulnerability index (ECI).

3.2. Consequences of Failure (COF)

To find the overall consequences of failure (COF) SVI, EVI, and ECI were summed with equal weights and scaled from 0 to 100. To develop the risk assessment model, the COF was assigned to each pipe (including social, environmental, and economic vulnerability).

3.3. Probability of Failure (POF)

A probability of failure (POF) model was developed by fitting the Weibull probability density function to the historical break data [49,50]. The Weibull cumulative density function, as defined in Equation (3), has acceptable flexibility in different failure rates, from initial failures to wear-out events
F X , α , β = 1 e ( X / β ) α                                                                  
In Equation (3) the cumulative probability of failure (F) is a function of the shape factor (α), the scale factor (β), and the age of each pipe (X). Thus, POF was calculated based on pipe ages.

3.4. Risk Assessment

This study assessed the risk of each pipe failure in 2023. The risk score for each pipe in the water distribution system was obtained by multiplying COF by POF [51]. According to the considered consequences and calculated POF, the risk scores were classified into five categories, namely Very Low (0% to 20%), Low (20% to 40%), Medium (40% to 60%), High (60% to 80%), and Very High (80% to 100%). These classifications were considered to facilitate the prioritization of rehabilitating and replacing the most critical pipes [52].

4. Results

The Pearson correlation and the three PCA selection techniques are evaluated and compared in Section 4.1 to obtain the principal components for SVI. Section 4.2 and Section 4.3 report the assessment of environmental and economic vulnerability indices, respectively. Section 4.4 shows how SVI, EVI, and ECI are combined to produce a single COF. Next, the results of the Weibull model for POF are reported in Section 4.5. Finally, the Risk Framework is developed by multiplying COF and POF in Section 4.6.

4.1. Results on Social Vulnerability Index (SVI)

The Pearson correlation analysis highlighted four pairs of variables with a correlation higher than 0.9. Four variables were then eliminated from the analysis, namely, average total income in 2020 among recipients, female in the labour force, no high school diploma or equivalency certificate, and non-official languages. The remaining 29 variables were used in the PCA method. Based on the results of the three selected approaches in PCA, the relevance of extracted components was assessed. Kaiser Criterion (selection criterion 1) retained eight components with eigenvalues higher than 1 representing approximately 60% of total variance. The scree plot (selection criterion 2) retained seven components (Figure 2).
The cumulative variance plot (selection criterion 3) was finally selected as the ultimate approach as it incorporated more components (15), effectively representing approximately 85% of the total variance in the dataset (Figure 3).
As PCA identified the most critical social vulnerability patterns while reducing dimensionality, it can provide a holistic perspective of the variance explained by the retained components. However, the expert weighting approach may result in either decreased or increased prioritization of actions [53].
After varimax rotation was applied, the “Movers” variable was eliminated since it does not satisfy the threshold coefficient. The coefficients associated with the remaining variables were assigned to the 15 principal components (Table 3). For instance, PC1 consists of Chinese ethnic and total visible minority, period of home construction (2000 and before), and house major repair needed that involve cultural and infrastructure groups. This principal component shows 21.14% of the total variance. PC2 includes government transfer, Indigenous identity, no certificate diploma or degree, one-maintainer household, and spending 30% or more of income on shelter costs, which cover economic, cultural, and social groups. This principal component accounts for 11.69% of the total variance. The variables coefficient in PC3 with 8.24% variation represents female employed, male not in the labour force, and 65 years and over population. This principal component describes socio-economically sensitive groups.
Given the result of the weighted variables, the most important variables overall are as follows: period of home construction (2000 and before), house with major repair, Chinese, no certificate, diploma, or degree, Indigenous identity, postsecondary certificate, diploma, or degree, spending 30% or more of income on shelter costs, and government transfers. Therefore, home characteristics and costs, education, and ethnicity are key indicators of social vulnerability in Vancouver.
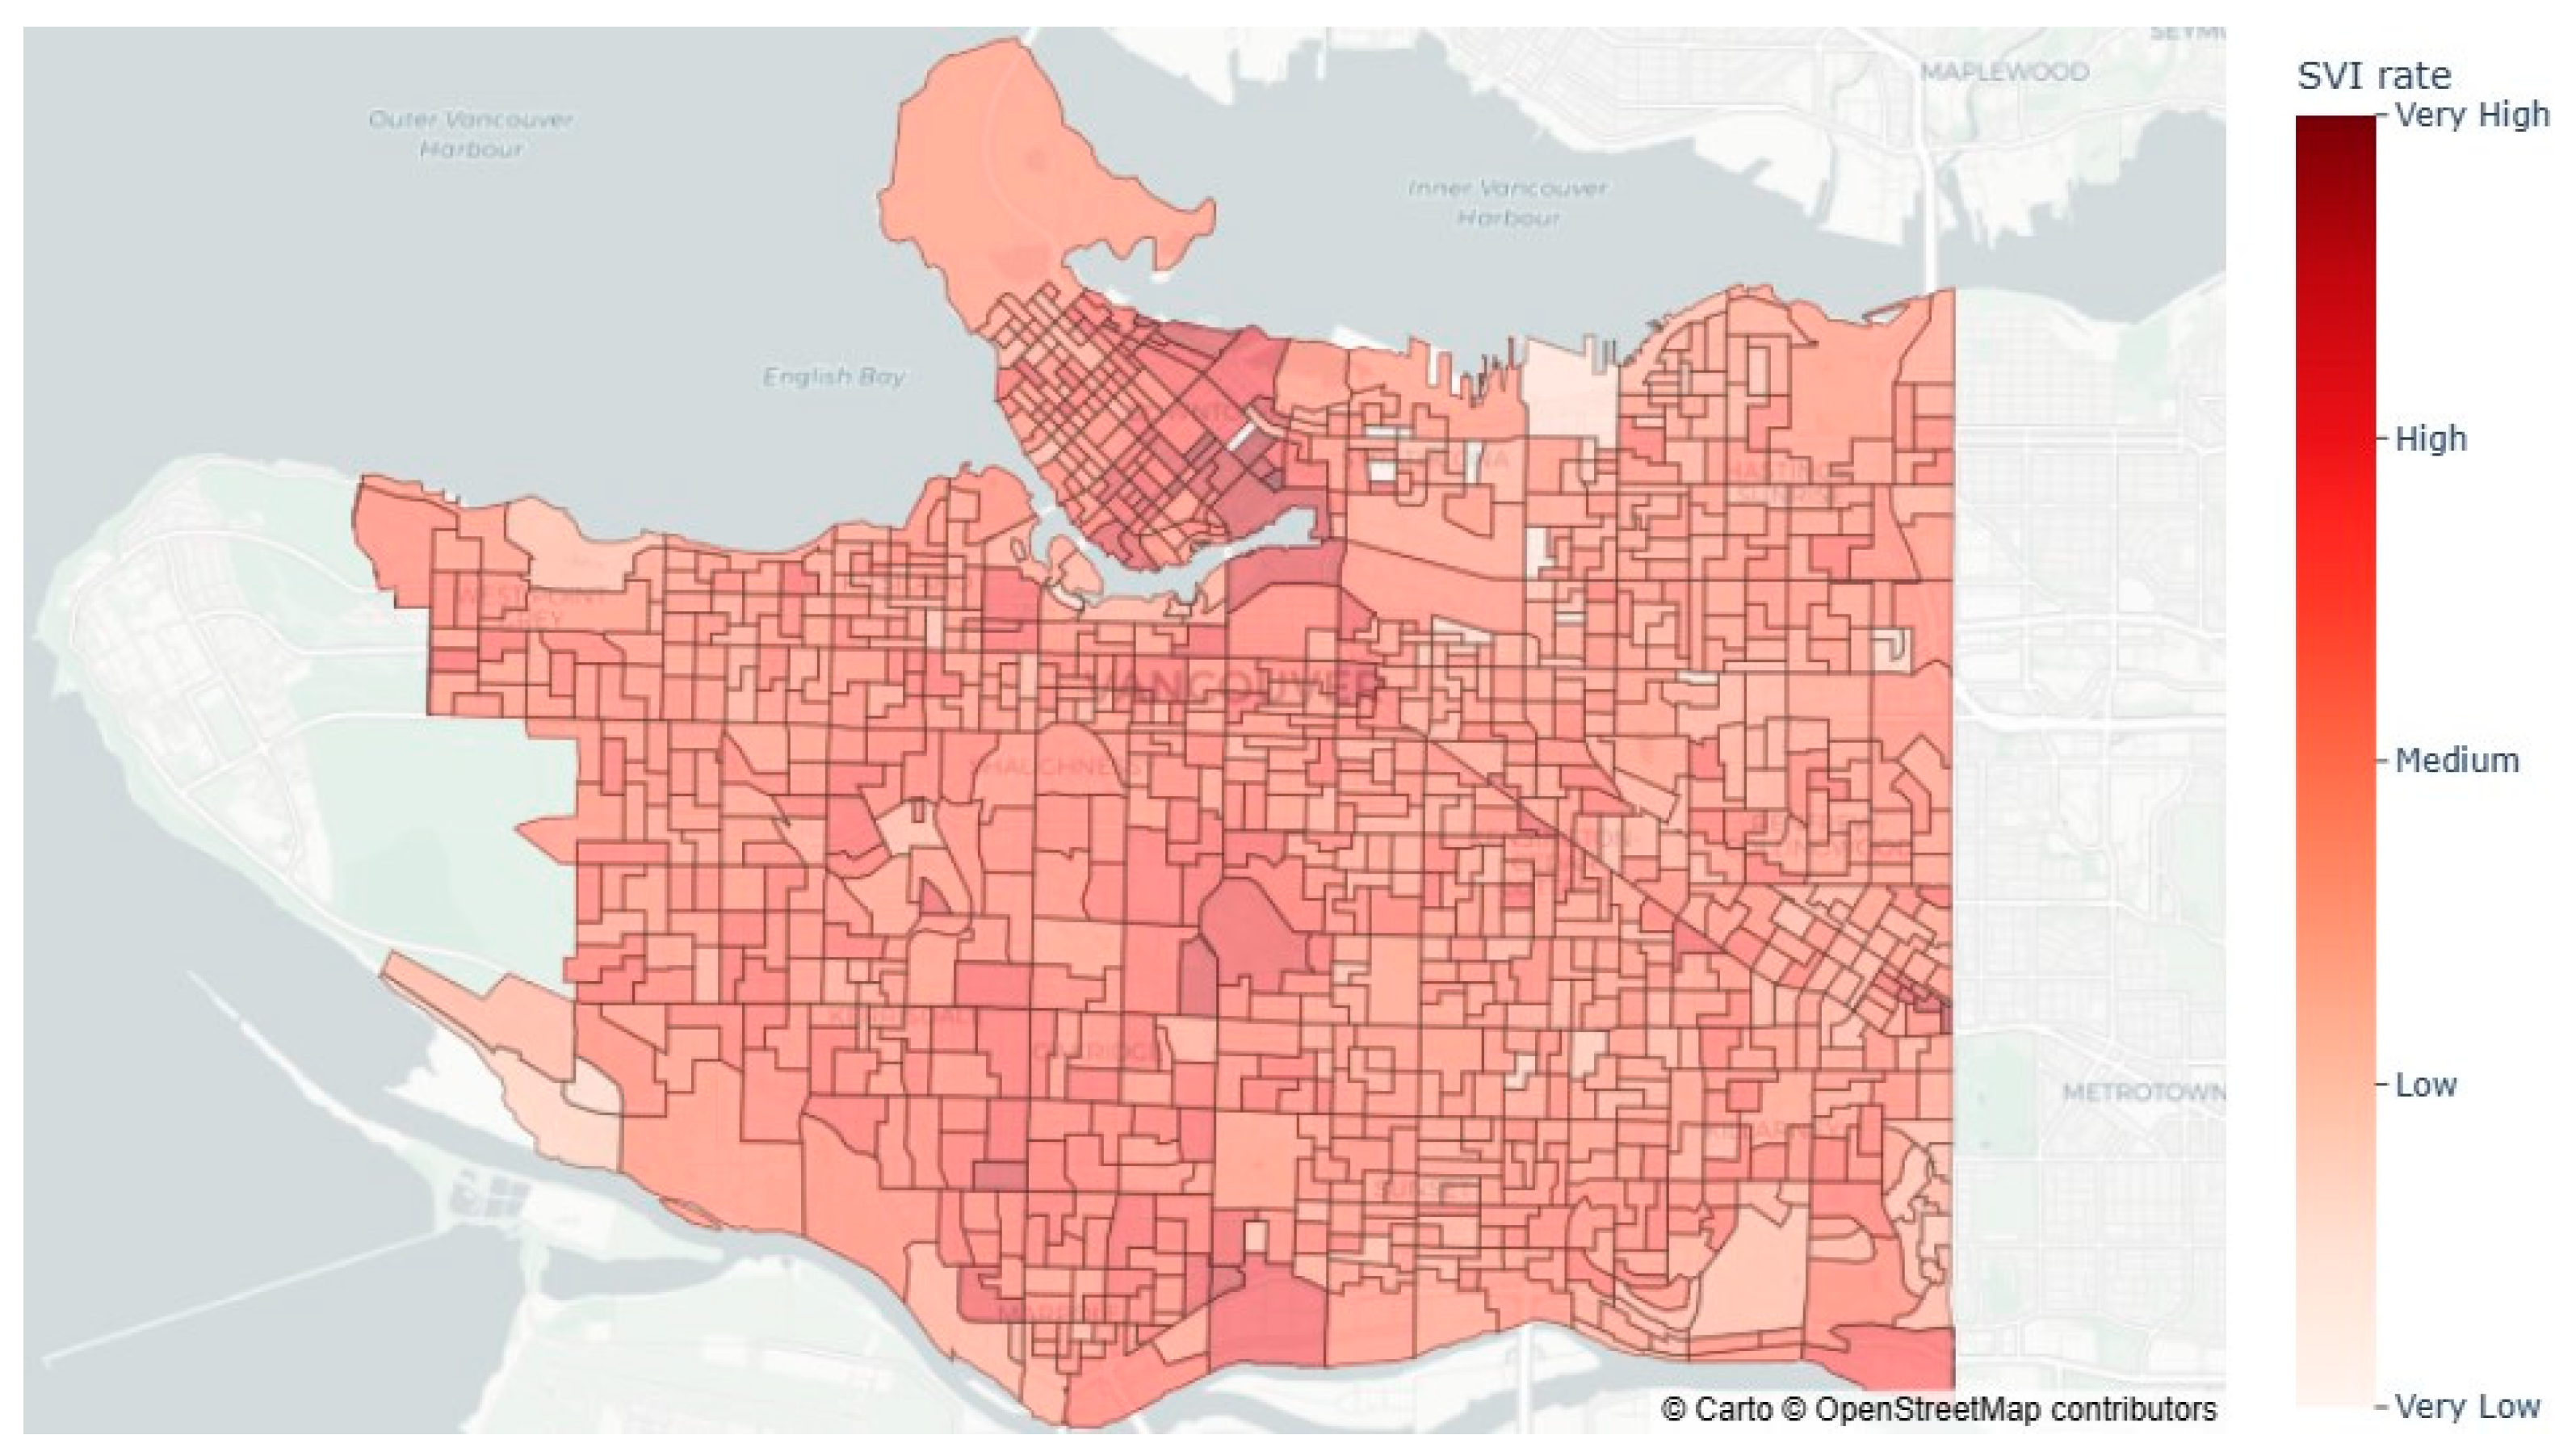
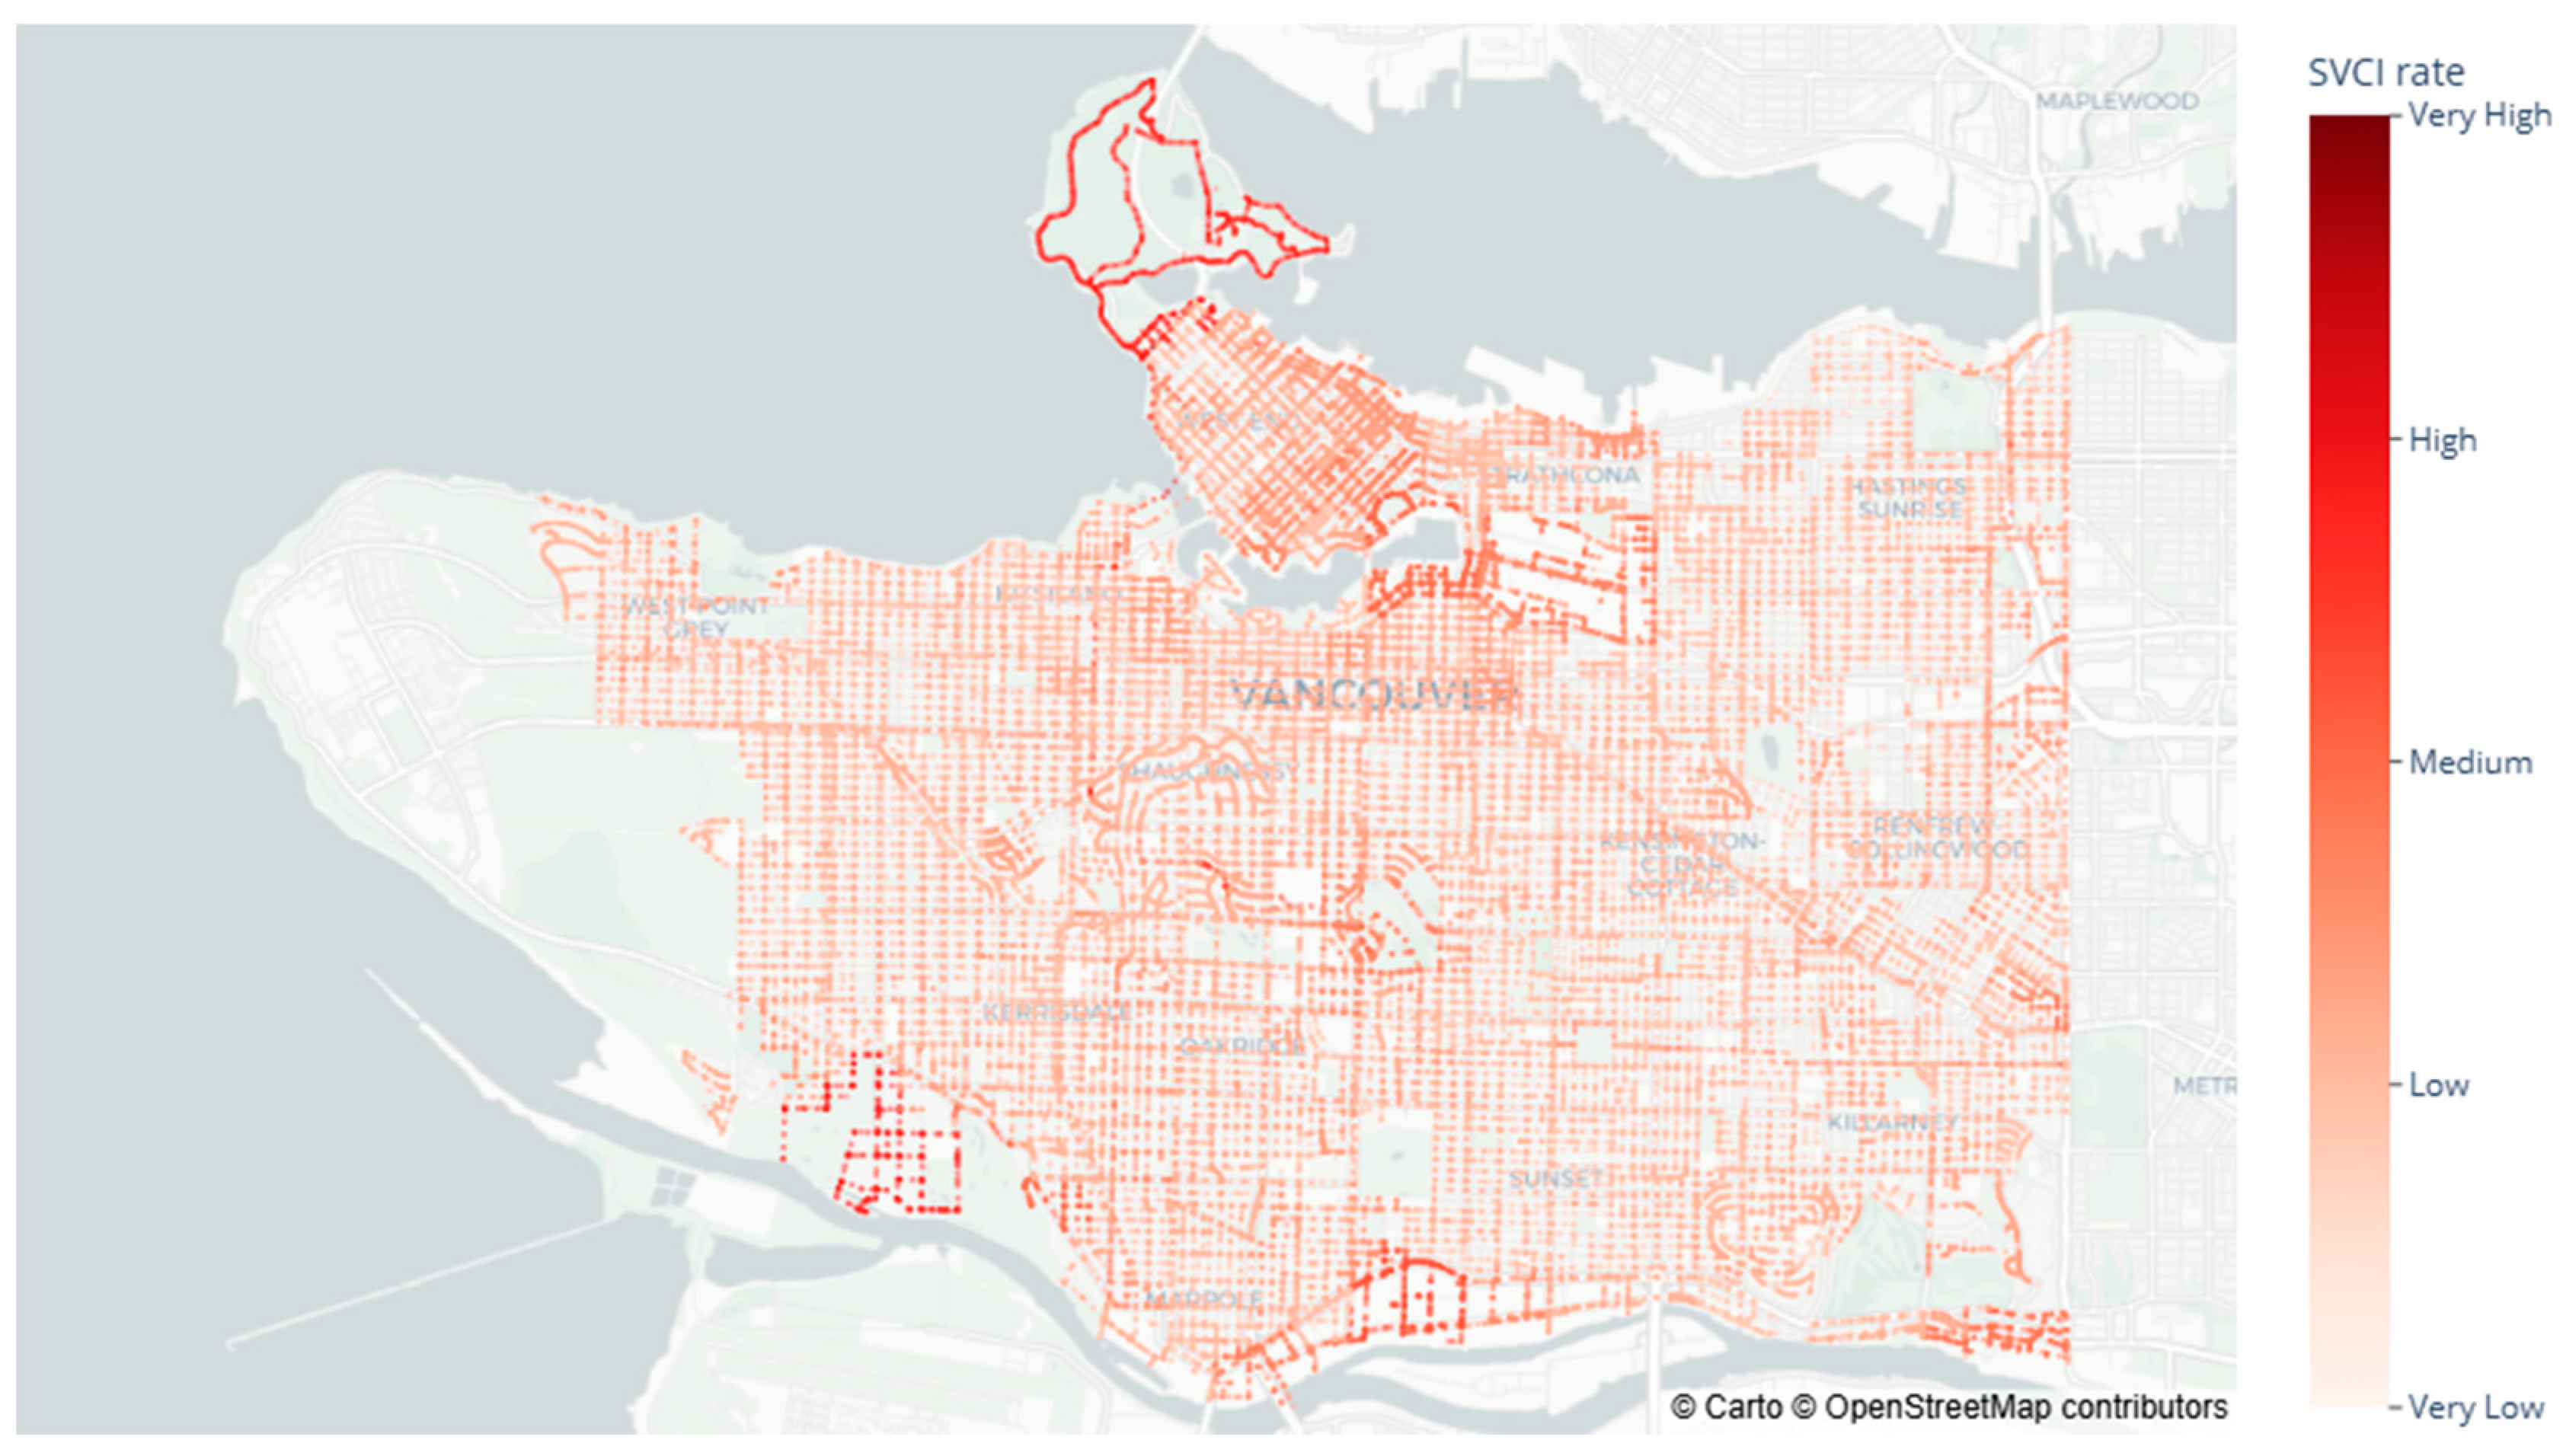
The SVI was joined to the associated DA using QGIS to visualize social vulnerability on a map. As illustrated in Figure 4, the darker colour represents more socially vulnerable areas, whereas the lighter colour depicts less socially vulnerable areas. SVI was classified as Very Low (0% to 20%), Low (20% to 40%), Moderate (40% to 60%), High (60% to 80%), and Very High (80% to 100%). Figure 4 shows the most vulnerable DAs in the Downtown, South Cambie, Kerrisdale, Marpole, and Mount Pleasant neighbourhoods. For reference, neighbourhoods are depicted in Figure 4. Most DAs with Very High SVI are located in Downtown. Variables such as female employed, all occupations, renter, postsecondary certificate diploma or degree, spending 30% or more of income on shelter costs, total visible minority, and one-maintainer household made this region the most vulnerable. The South Cambie region became vulnerable due to all occupations, postsecondary certificate diploma or degree, spending 30% or more of income on shelter costs, total visible minority, Chinese ethnicity, and one-maintainer household variables. The presence of Chinese ethnicity, renter, spending 30% or more of income on shelter costs, and total visible minority in Kerrisdale and female employed and spending 30% or more of income on shelter costs in Mount Pleasant made these regions vulnerable. Chinese ethnicity, one-maintainer household, renter, spending 30% or more of income on shelter costs, and total visible minority variables caused the Marpole region to be considered vulnerable as well. Generally, the DAs with very high vulnerability seem denser in the central corridor of the city, while the eastern and western parts are visibly scattered.

4.2. Results on Environmental Vulnerability Index (EVI)

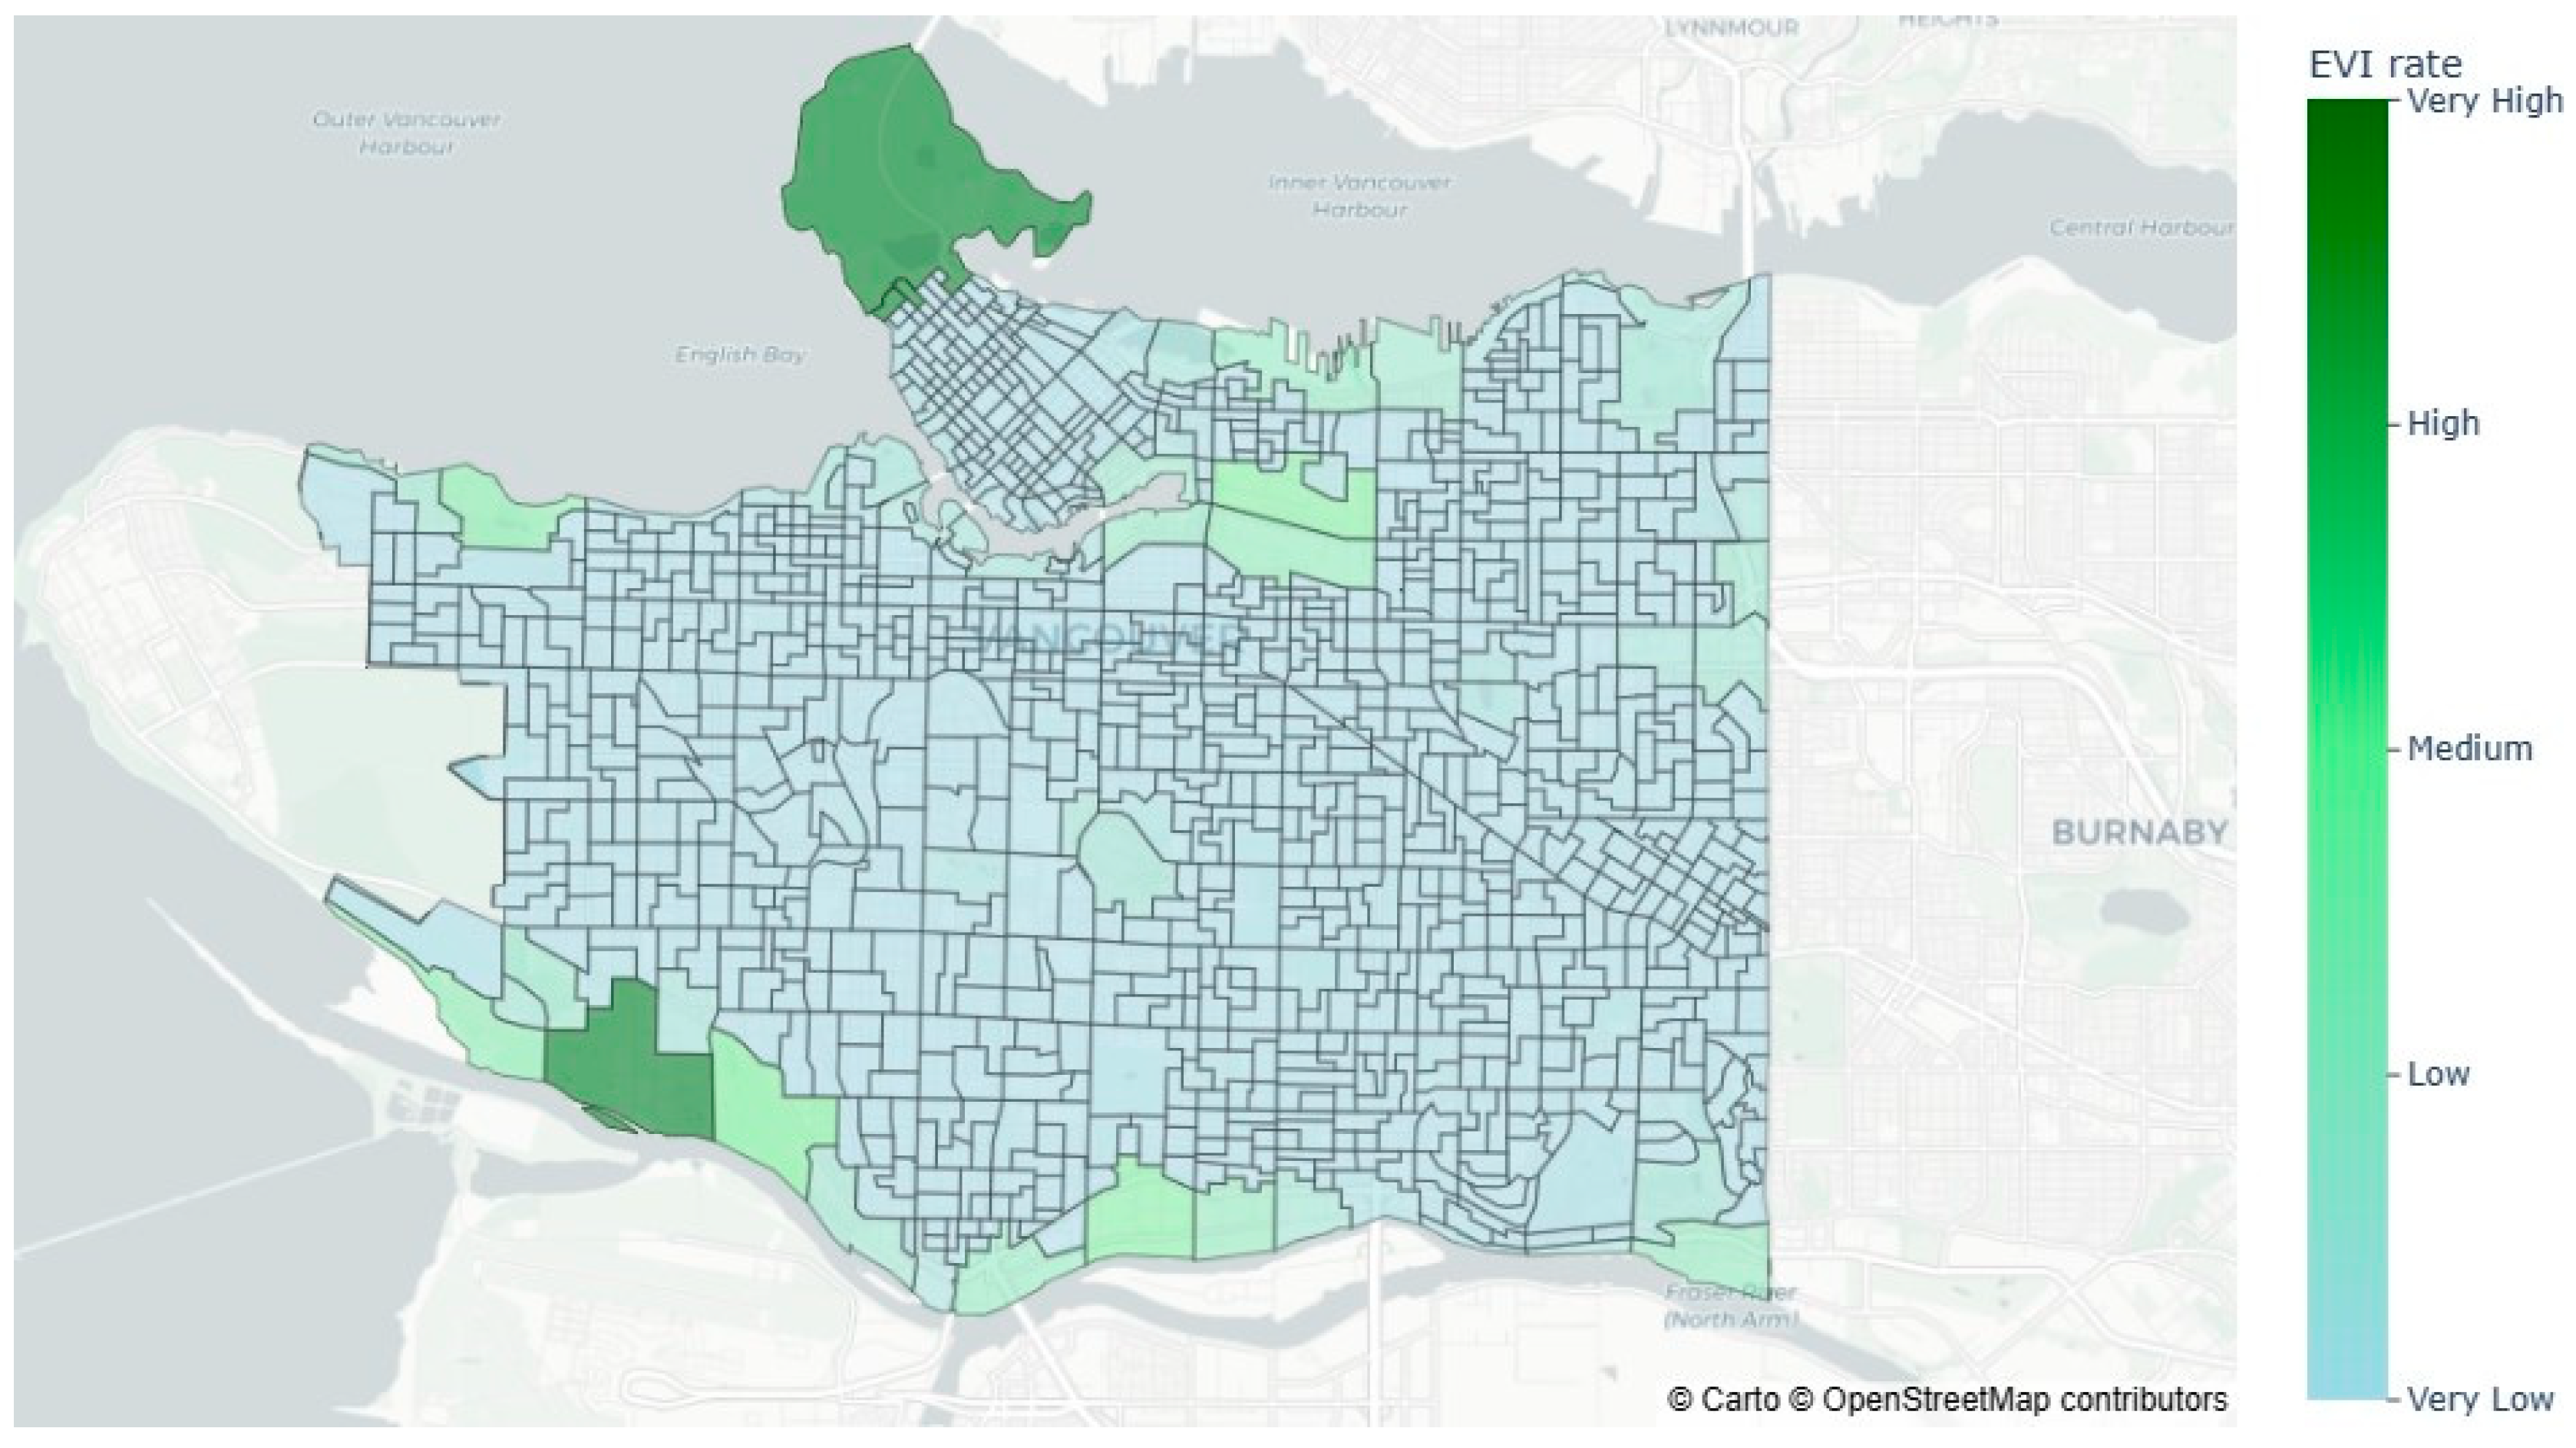
The environmental vulnerability assessment map shown in Figure 5 was created by combining the floodplain and park areas. The areas of Kerrisdale, Dunbar-Southlands, West End, and Stanley Park are more vulnerable due to their proximity to the English Bay (to the north), Fraser River (to the south), and park areas. Around the city, except for the city boundary with Burnaby to the east and Pacific Spirit Regional Park to the west, there are more dissemination areas with High and Very High EVI compared to the city centre. The Pacific Spirit Regional Park in the West is not part of the City of Vancouver and thus does not impact the EVI of the adjacent DAs.

4.3. Results on Economic Vulnerability Index (ECI)

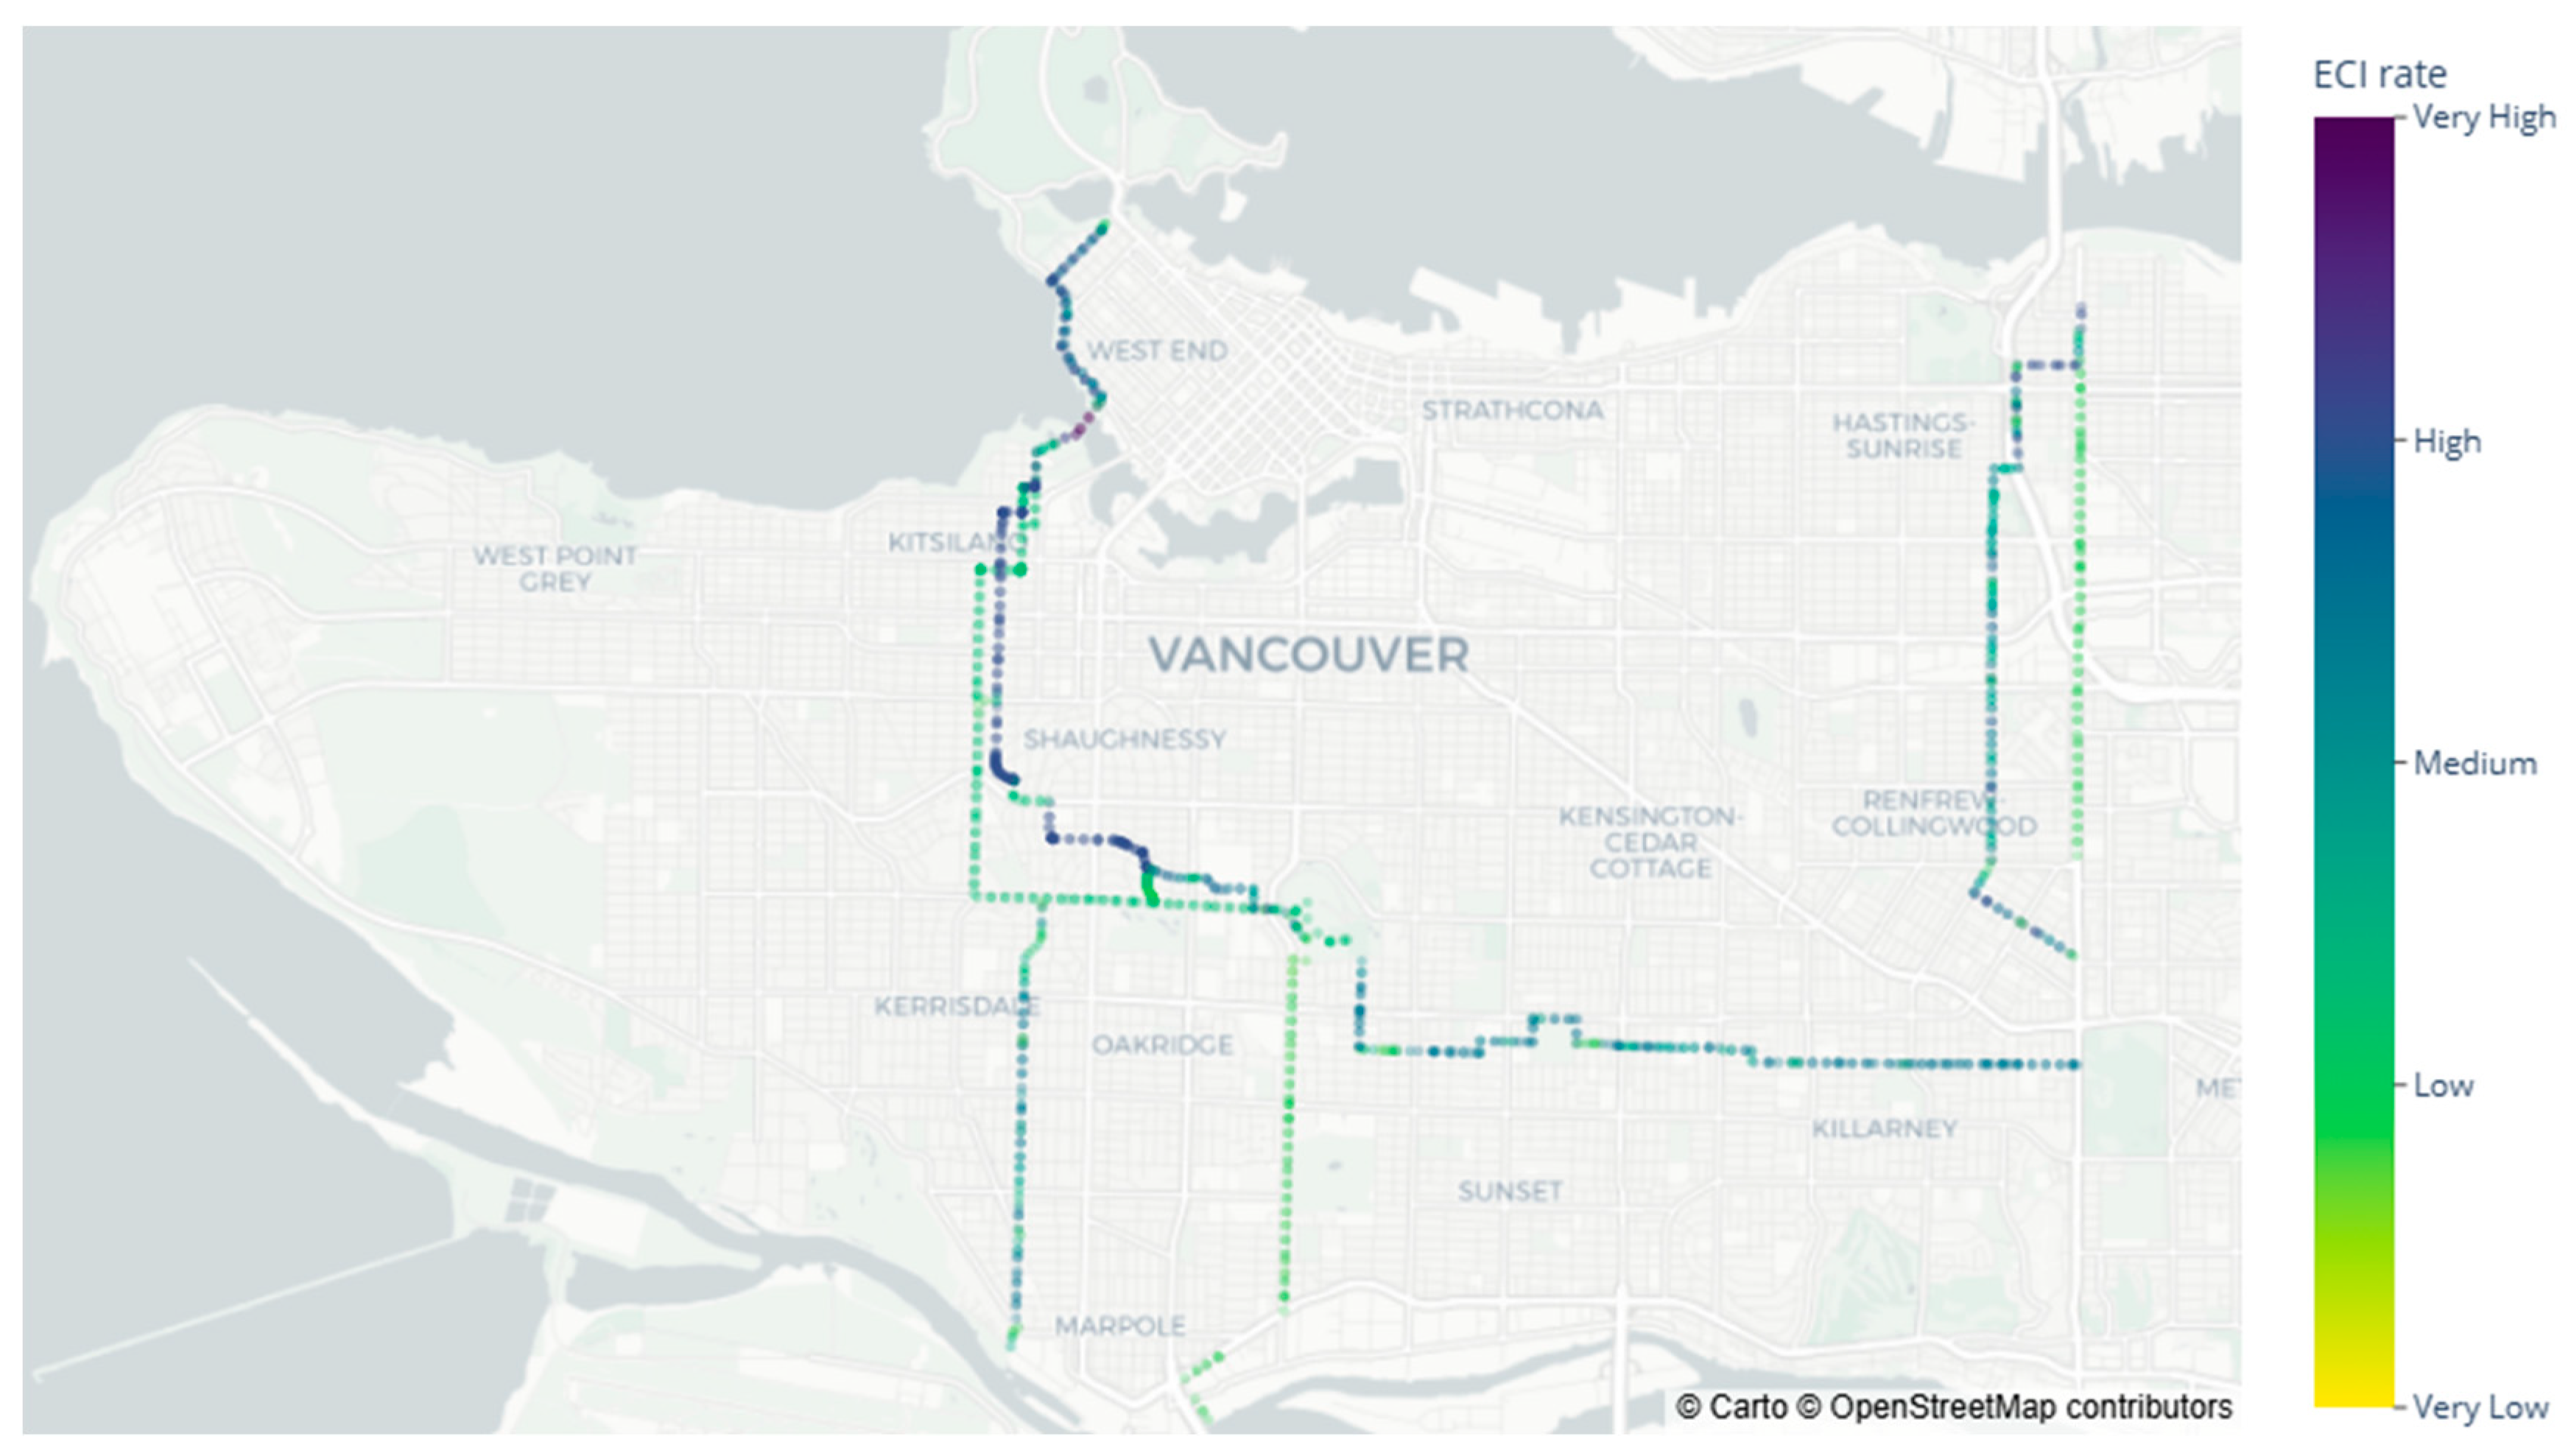
In order to calculate the ECI, the pipes were divided into sections of 120 m or less. In North America, the cost of concrete pipes per metre is approximately twice that of PVC pipes [41]. Moreover, larger pipes are more likely to be replaced with concrete pipes. Therefore, they have the highest ECI and are shown in darker hues as the High and Very High classes in Figure 6.
The analysis shows that ECI is primarily driven by the replacement costs of pipes, particularly larger-diameter ones, which tend to be more expensive due to the use of concrete materials. These high-cost pipes are concentrated in the central areas of Vancouver, where infrastructure density further amplifies their economic significance. Additionally, the role of land use in economic vulnerability cannot be overlooked, as pipes located in industrial or commercial areas often carry higher replacement costs due to their critical role in supporting economic activities.
The spatial mapping of ECI provides critical insights for prioritizing areas with the highest economic impact, supporting resource allocation strategies that maximize cost-effectiveness and reduce financial strain on water infrastructure systems.

4.4. Results on Consequence of Failure (COF)

The three vulnerability indices were combined as the consequence of failure (COF) of each pipe and scaled between 0 and 100 Figure 7. Though featuring a Very Low ECI, some pipe groups located in areas with High and Very High SVI and EVI resulted in High or Very High values of COF, such as those in Dunbar-Southlands, Kerrisdale, Stanley Park, Downtown, Mount Pleasant, and Marpole. High ECI values impacted on COF in central areas such as South Cambie, and the western side, including Kitsilano and the West End.

4.5. Results on Probability of Pipe Failure (POF)

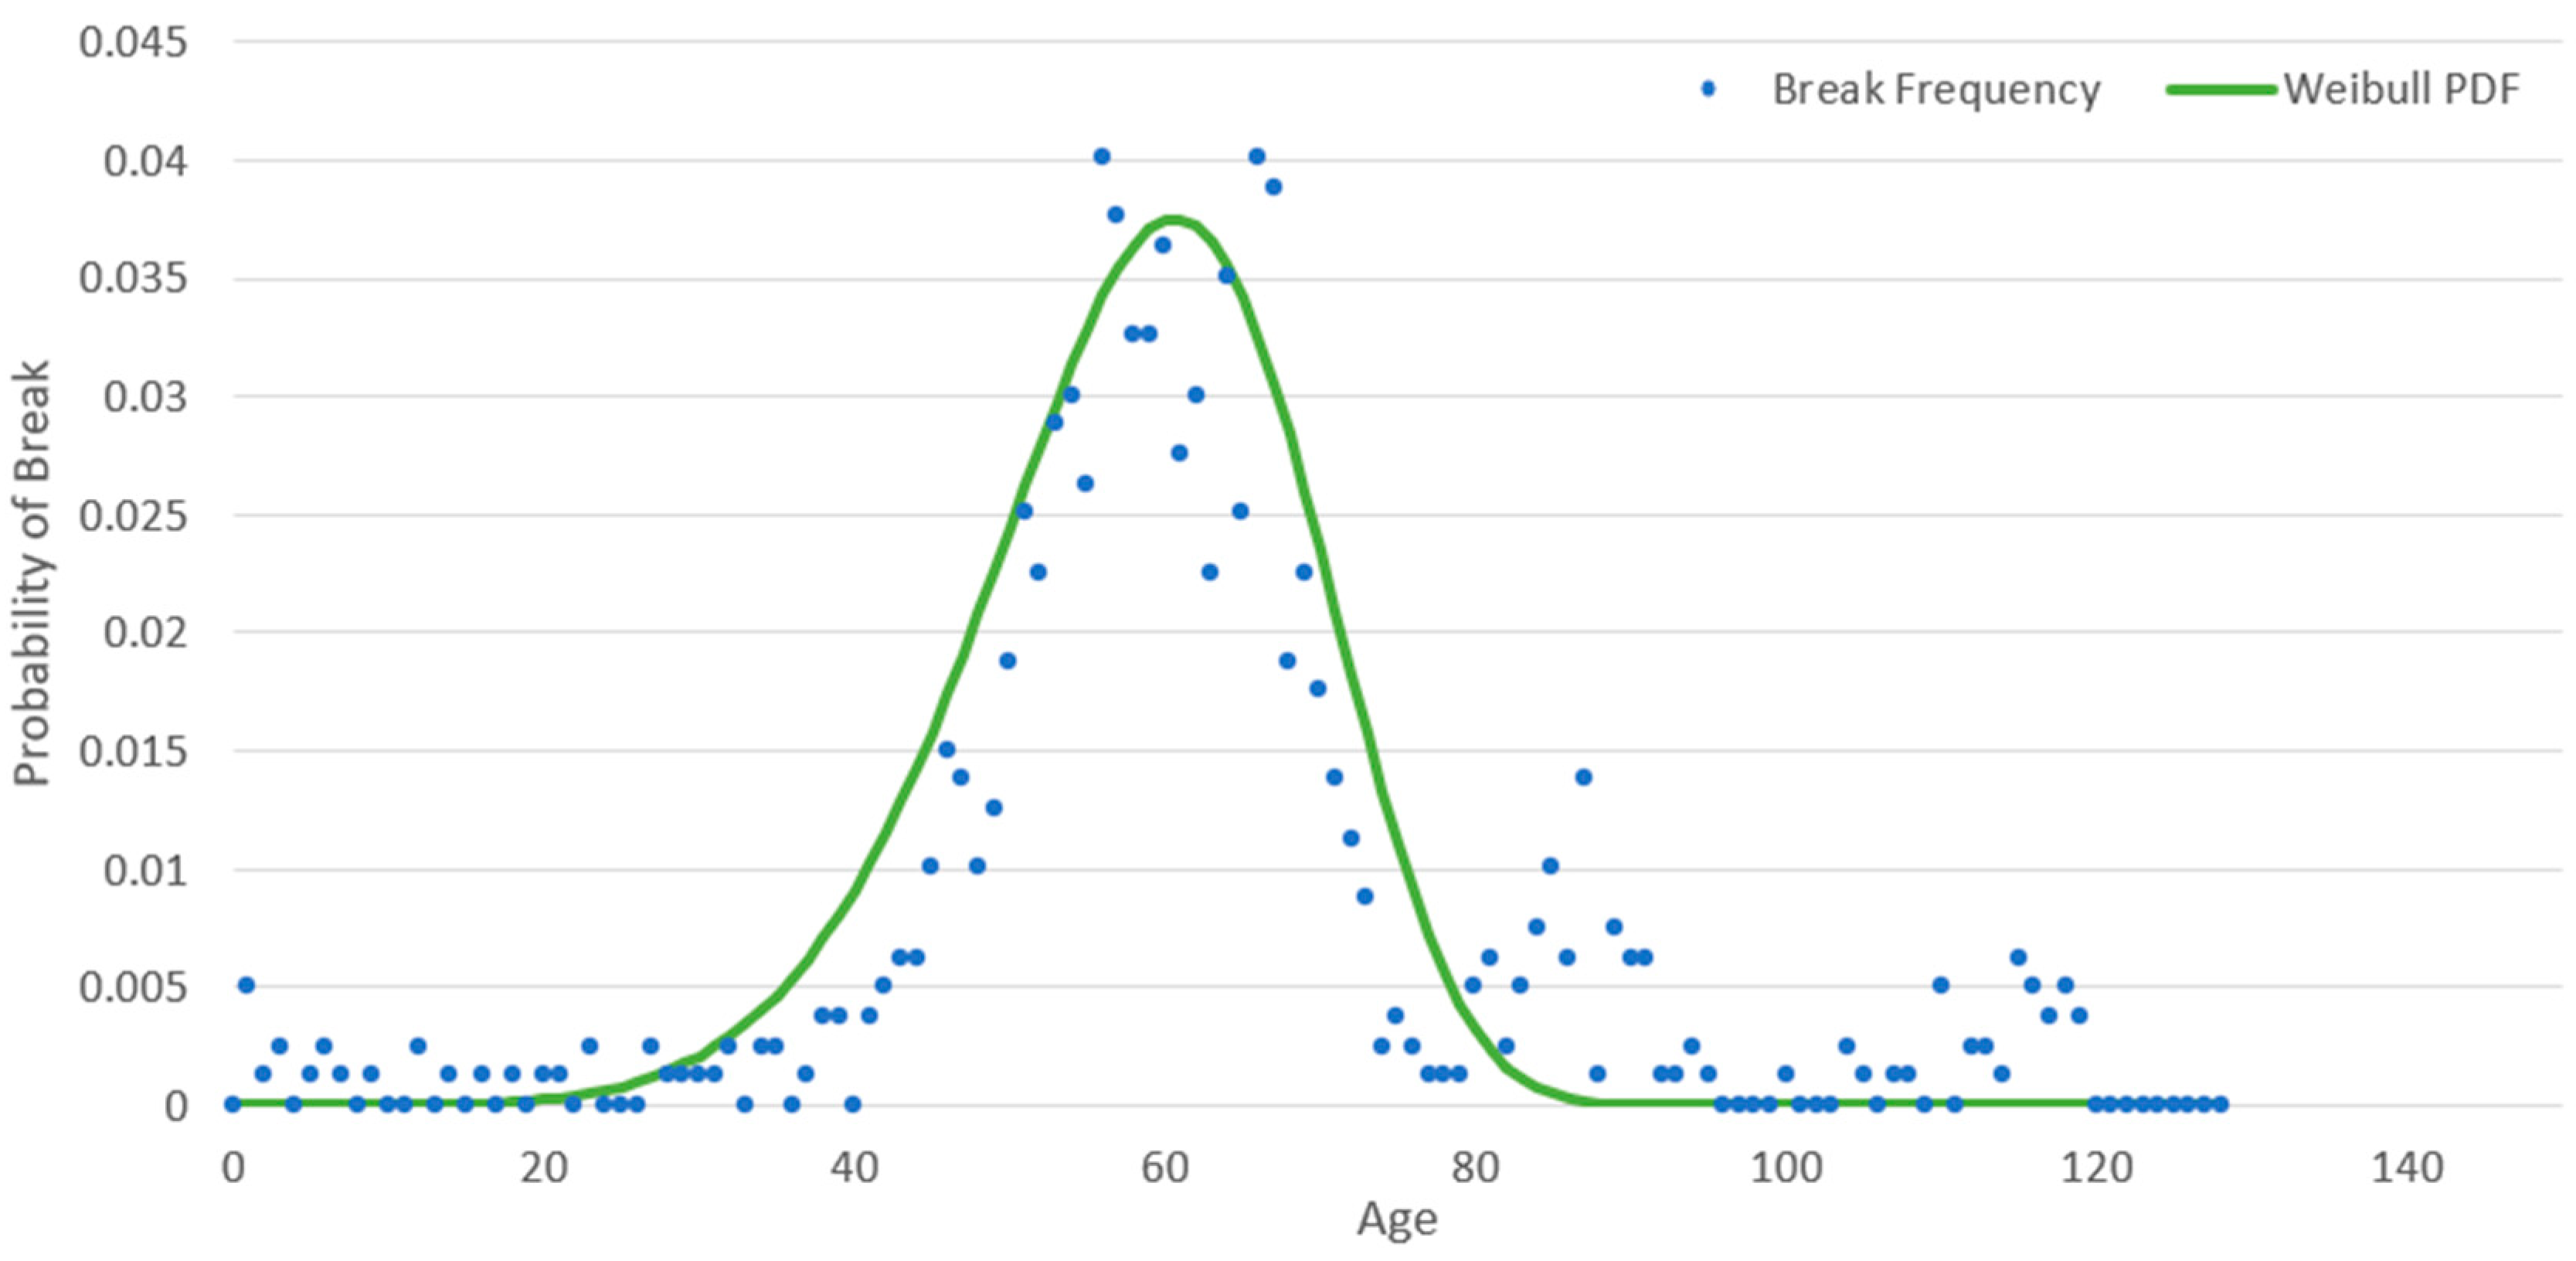
The probability of failure for each pipe in the water distribution system can be well expressed by a robust Weibull model with a shape factor (α in Equation (3) of 6.273 and a scale factor (β in Equation (3) of 62.364. These values were calculated by fitting the break frequency dataset of Vancouver City, shown in Figure 8, with the cumulative probability density function of the Weibull distribution. The low Mean Squared Error (MSE) of 2.12 × 10⁻⁵ confirmed the model’s accuracy. The results showed that the probability of failure sharply increases between 40 and 80 years.

4.6. Results on Risk Assessment

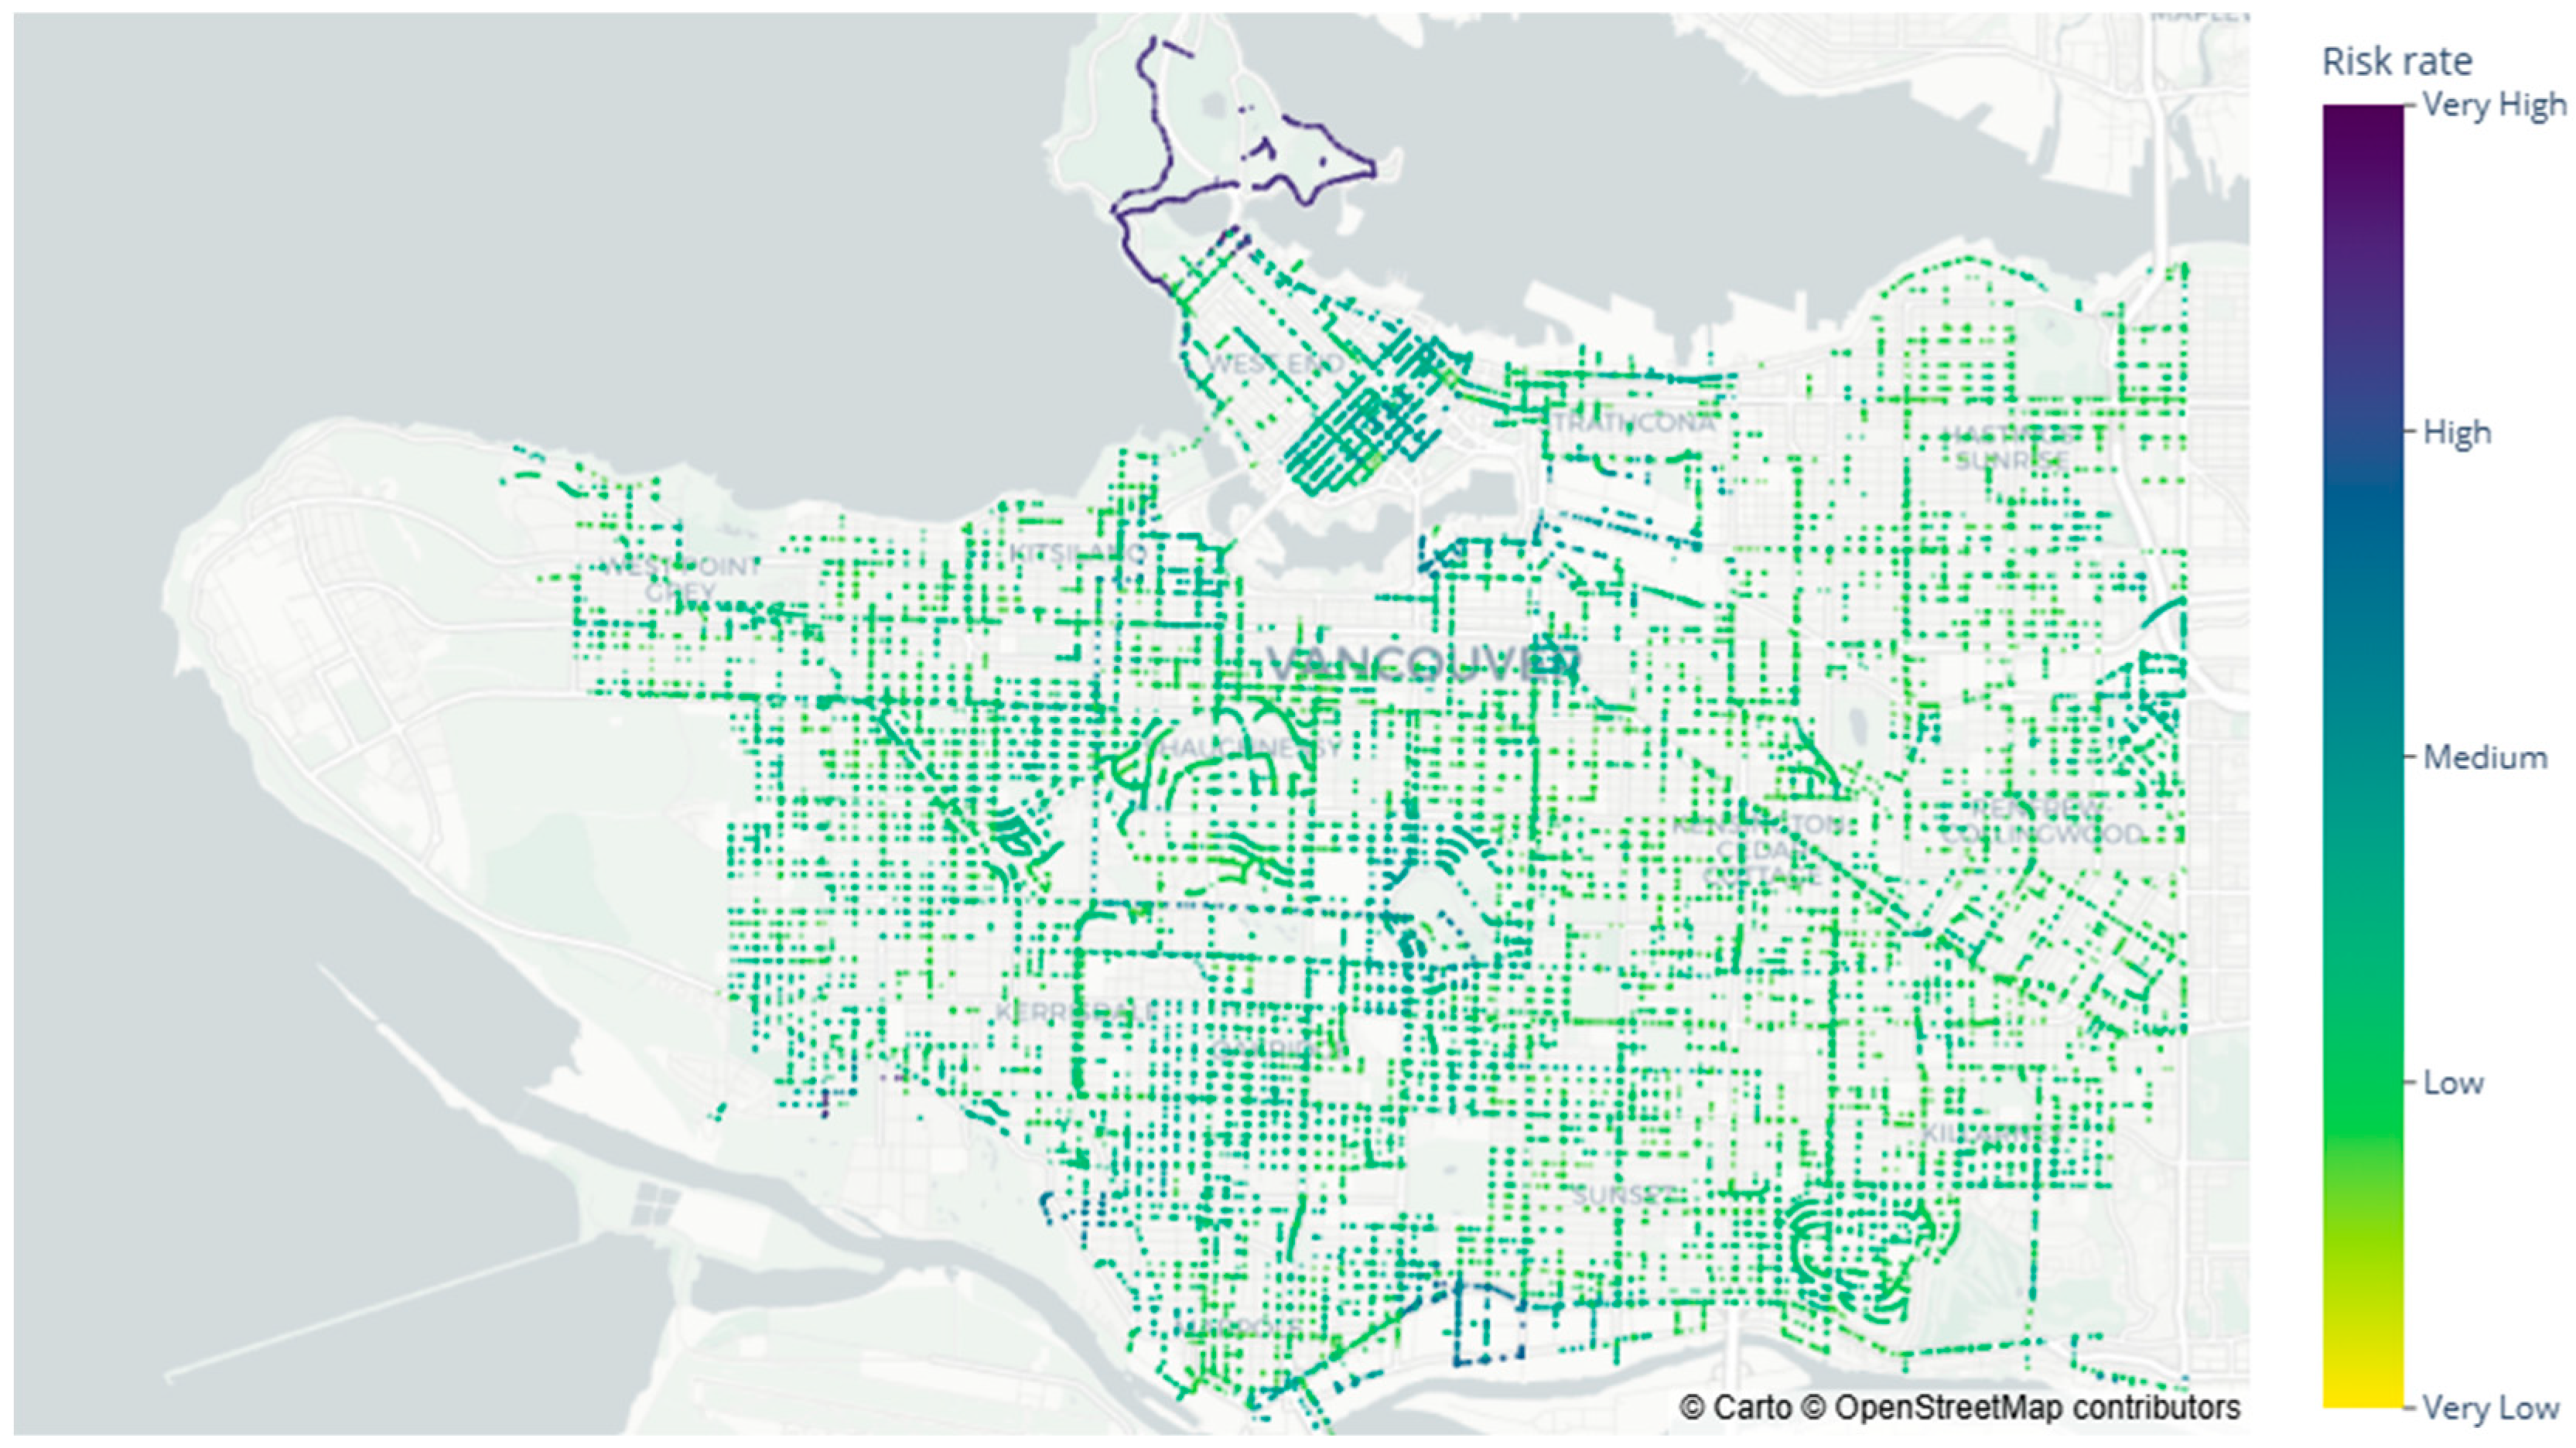
The concept of the risk-assessment method aids us in asset-level decision-making. The risk score of each pipe represents the priority of its replacement and rehabilitation. In this study, pipes were prioritized based on their risk depending on the POF and the COF of the area in which those pipes are located. Figure 9 demonstrates the risk level of different pipes. Regarding consequences, based on what was mentioned in Sec 4.4, high-risk pipes are mostly located in socially and environmentally vulnerable areas. For instance, pipes in the Stanley Park, Dunbar-Southlands, Downtown, West End, Marpole, Mount Pleasant, and Kerrisdale neighbourhoods were scored as High and Very High risk. In Table 4, the characteristics of the ten highest risk pipes are summarized. It is important to note that pipes with the highest risk level do not necessarily have the highest COF or POF. For example, while the EVI is Very High for the top 7 pipes, ECI and SVI are medium or below. Instead, for pipes ranked from 8 to 10, SVI is the driving factor leading to a high COF.

5. Discussion

The results of this study provide a holistic understanding of the risk associated with water distribution pipe failures, integrating social, environmental, and economic vulnerabilities with the probability of failure. This approach allows for a more comprehensive evaluation of the impacts of such failures and offers a structured framework for prioritizing interventions.
The social vulnerability index (SVI) highlighted the significant influence of factors such as ethnicity, socioeconomic status, and education levels on the vulnerability of certain neighbourhoods. Areas like Downtown Vancouver, South Cambie, and Marpole exhibited very high levels of social vulnerability, underscoring the need for targeted measures to support these communities in the context of potential water infrastructure failures.
In terms of environmental vulnerability, the findings showed that areas near parks and floodplains, such as Stanley Park, West End, and Kerrisdale, are highly susceptible to the impacts of pipe failures. These results emphasized the importance of incorporating environmental sensitivity into decision-making processes for pipe rehabilitation and replacement, ensuring that critical natural resources are preserved.
Economic vulnerability highlighted the financial burden of pipe replacements, particularly for larger-diameter pipes, which are predominantly concrete and concentrated in central Vancouver. These areas exhibited high economic vulnerability due to significant replacement costs, although some low-ECI areas still show high overall risk when combined with social and environmental vulnerabilities. This interconnectedness emphasized the need to incorporate economic factors into risk assessments, providing a clearer understanding of cost-intensive areas and supporting effective prioritization of pipe rehabilitation.
The integration of these vulnerabilities into a unified framework allowed for a detailed risk prioritization process. By combining the consequences of failure (COF) with the probability of failure (POF), this study identified pipes with very high risk, primarily located in socially and environmentally vulnerable areas. This prioritization provided actionable insights for water distribution managers, helping in effective allocation of resources and in mitigation of risks, where they are most critical.
Overall, this study demonstrated the practicality and relevance of a holistic risk assessment framework that bridges technical assessments with broader societal and environmental considerations. The findings provided a valuable tool for decision-makers to optimize infrastructure planning, improve urban resilience, and contribute to sustainable and equitable urban development.

6. Conclusions

A risk assessment framework was developed for assessing the adverse impacts of pipe breaks at the dissemination area level in Vancouver City, Canada. By applying a cross-correlation matrix and PCA, the most influential types of variables for social vulnerability were identified, including ethnic and racial demographics, socioeconomic well-being, and education. Examples of these variables are female employment, total visible minority, postsecondary certificate diploma or degree, spending 30% or more of income on shelter costs, and Chinese ethnicity. Furthermore, environmental vulnerability was assessed based on parks and floodplains present in the DAs, which play a significant role in identifying areas prone to environmental risks. Similarly, economic vulnerability was estimated based on the cost of pipe replacements, reflecting the financial challenges of maintaining ageing infrastructure. By mapping the spatial distribution of vulnerabilities along with pipe failure data, this study established a relationship between water infrastructure failure and its associated risk, demonstrating the interconnection between social, environmental, and economic factors. The spatial distribution of social vulnerability and overall consequences of failure revealed that the DAs and pipes with very high vulnerability are often associated with a higher risk in Vancouver City. Finally, the results of this work provide valuable insights for water distribution managers, helping them prioritize pipe rehabilitation and replacement to mitigate risks effectively. This framework aligns with the Vancouver Plan 2050, already approved by the Vancouver City Council, supporting long-term strategies for resilient and sustainable urban development.
This study emphasizes the importance of adopting a holistic framework for assessing risks in water distribution systems, addressing gaps in traditional decision-making methods that solely focus on one factor. By incorporating social, environmental, and economic vulnerabilities alongside failure probabilities, the proposed risk framework provides a comprehensive perspective on the impacts of pipe failures. The application to Vancouver demonstrates how this approach can effectively identify critical areas of concern and guide the prioritization of rehabilitation efforts. This integrated perspective ensures that technical considerations are balanced with broader societal and environmental implications, contributing to more resilient and sustainable decision-making in water distribution systems.
While this study offers a comprehensive framework for assessing the risk of water distribution pipe failures by integrating social, environmental, and economic vulnerabilities, it has certain limitations. A detailed sensitivity analysis was not conducted, as weighing one feature over another would require input from expert surveys and a thorough investigation of various aspects, which was beyond the scope of this research. Assigning different weights without such in-depth study could risk introducing bias into the results. To maintain objectivity and transparency, equal weighting was applied in this study. Future research will aim to address these limitations by incorporating expert input and conducting a sensitivity analysis to explore the influence of weights and individual variables, further enhancing the robustness of the framework.

Author Contributions

Conceptualization, R.D.; methodology, A.S. and R.D.; investigation, A.S.; writing—original draft preparation, A.S. and E.C.; writing—review and editing, R.D.; supervision, R.D. and E.C. All authors have read and agreed to the published version of the manuscript.

Funding

This research was funded by Mitacs Award IT34159.

Data Availability Statement

All data, models, and code generated or used throughout the study are available at [42].

Acknowledgments

This study was conducted with support from the Mitacs Globalink Research Award. Furthermore, support from the Italian MIUR and the University of Pavia is acknowledged within the programme Dipartimenti di Eccellenza 2023–2027.

Conflicts of Interest

The authors declare no conflicts of interest.

References

  1. Quitana, G.; Molinos-Senante, M.; Chamorro, A. Resilience of Critical Infrastructure to Natural Hazards: A Review Focused on Drinking Water Systems; Elsevier Ltd.: Amsterdam, The Netherlands, 2020. [Google Scholar] [CrossRef]
  2. Dianat, H.; Wilkinson, S.; Williams, P.; Khatibi, H. Choosing a holistic urban resilience assessment tool. Int. J. Disaster Risk Reduct. 2022, 71, 102789. [Google Scholar] [CrossRef]
  3. Cutter, S.L.; Boruff, B.J.; Shirley, W.L. Social vulnerability to environmental hazards. Soc. Sci. Q. 2003, 84, 242–261. [Google Scholar] [CrossRef]
  4. Lawal, O.; Arokoyu, S.B. Modelling social vulnerability in sub-Saharan West Africa using a geographical information system. Jamba J. Disaster Risk Stud. 2015, 7, 155. [Google Scholar] [CrossRef]
  5. Wakhungu, M.J.; Abdel-Mottaleb, N.; Wells, E.C.; Zhang, Q. Geospatial Vulnerability Framework for Identifying Water Infrastructure Inequalities. J. Environ. Eng. 2021, 147, 04021034. [Google Scholar] [CrossRef]
  6. Bjarnadottir, S.; Li, Y.; Stewart, M.G. Social vulnerability index for coastal communities at risk to hurricane hazard and a changing climate. Nat. Hazards 2011, 59, 1055–1075. [Google Scholar] [CrossRef]
  7. Zhang, N.; Huang, H. Social vulnerability for public safety: A case study of Beijing, China. Chin. Sci. Bull. 2013, 58, 2387–2394. [Google Scholar] [CrossRef]
  8. Turner, B.L.; Kasperson, R.E.; Matson, P.A.; McCarthy, J.J.; Corell, R.W.; Christensen, L.; Eckley, N.; Kasperson, J.X.; Luers, A.; Martello, M.L.; et al. A framework for vulnerability analysis in sustainability science. Proc. Natl. Acad. Sci. USA 2003, 100, 8074–8079. [Google Scholar] [CrossRef] [PubMed]
  9. Wisner, B.; Blaikie, P.M.; Cannon, T.; Davis, I. At Risk: Natural Hazards, People’s Vulnerability and Disaster; Routledge: New York, NY, USA, 2004. [Google Scholar]
  10. Frigerio, I.; De Amicis, M. Mapping social vulnerability to natural hazards in Italy: A suitable tool for risk mitigation strategies. Environ. Sci. Policy 2016, 63, 187–196. [Google Scholar] [CrossRef]
  11. Collins, T.W.; Grineski, S.E.; de Lourdes Romo Aguilar, M. Vulnerability to environmental hazards in the Ciudad Juárez (Mexico)-El Paso (USA) metropolis: A model for spatial risk assessment in transnational context. Appl. Geogr. 2009, 29, 448–461. [Google Scholar] [CrossRef]
  12. Freitas, C.R.; D’avignon, A.L.d.A.; Castro, A.C. Urban social vulnerability and climate change in Rio de Janeiro city associated with population mobility. J. Environ. Policy Plan. 2019, 21, 797–810. [Google Scholar] [CrossRef]
  13. Peng, Y. Regional earthquake vulnerability assessment using a combination of MCDM methods. Ann. Oper. Res. 2012, 234, 95–110. [Google Scholar] [CrossRef]
  14. Fekete, A. Validation of a social vulnerability index in context to river-floods in Germany. Nat. Hazards Earth Syst. Sci. 2009, 9, 393–403. [Google Scholar] [CrossRef]
  15. Flanagan, B.E.; Gregory, E.W.; Hallisey, E.J.; Heitgerd, J.L.; Lewis, B. A Social Vulnerability Index for Disaster Management. J. Homel. Secur. Emerg. Manag. 2011, 8, 3. [Google Scholar] [CrossRef]
  16. Chakraborty, L.; Rus, H.; Henstra, D.; Thistlethwaite, J.; Scott, D. A place-based socioeconomic status index: Measuring social vulnerability to flood hazards in the context of environmental justice. Int. J. Disaster Risk Reduct. 2019, 43, 101394. [Google Scholar] [CrossRef]
  17. Chakraborty, L.; Thistlethwaite, J.; Minano, A.; Henstra, D. Leveraging Hazard, Exposure, and Social Vulnerability Data to Assess Flood Risk to Indigenous Communities in Canada. Int. J. Disaster Risk Sci. 2021, 12, 821–838. [Google Scholar] [CrossRef]
  18. Goto, E.A.; Suarez, A.M.; Ye, H. Spatial analysis of social vulnerability in São Paulo city, Brazil. Appl. Geogr. 2022, 140, 102653. [Google Scholar] [CrossRef]
  19. Ingle, K.; Chattopadhyay, S. A Place-based Approach to Assess the Vulnerability of Communities to Urban Floods: Case of Nagpur, India. Int. J. Disaster Risk Reduct. 2022, 75, 102933. [Google Scholar] [CrossRef]
  20. Mahdi, A.; Pourahmad, A.; Zarghamfard, M.; Qasemi, S. Analysis of urban health from a social capital perspective in Iranian religious cities: Qom. Spat. Inf. Res. 2016, 24, 689–699. [Google Scholar] [CrossRef]
  21. Dziedzic, R.; Schmitt, K. Social Vulnerability in the Context of Water Infrastructure Management. In Proceedings of the IEEE International Symposium on Technology and Society, Hong Kong, 10–12 November 2022. [Google Scholar] [CrossRef]
  22. World Health Organization. WHO Supports Consolidated Appeal for Humanitarian Funds. Available online: https://www.who.int/director-general/speeches/detail/who-supports-consolidated-appeal-for-humanitarian-funds# (accessed on 3 September 2023).
  23. D’Angelo, N. An aging infrastructure: Policy recommendations to modernize aging water distribution networks to protect human health. In Proceedings of the 2016 AIChE Annual Meeting, San Francisco, CA, USA, 13–18 November 2016; Volume 14. Available online: www.wise-intern.org (accessed on 1 May 2023).
  24. Creaco, E.; Franchini, M.; Walski, T. Network design through the phasing of construction approach. In Procedia Engineering; Elsevier Ltd.: Amsterdam, The Netherlands, 2014; pp. 823–830. [Google Scholar] [CrossRef]
  25. Wang, Y.; Zayed, T.; Moselhi, O. Prediction Models for Annual Break Rates of Water Mains. J. Perform. Constr. Facil. 2009, 23, 47–54. [Google Scholar] [CrossRef]
  26. Dawood, T.; Elwakil, E.; Novoa, H.M.; Delgado, J.F.G. Water pipe failure prediction and risk models: State-of-the-art review. Can. J. Civ. Eng. 2020, 47, 1117–1127. [Google Scholar] [CrossRef]
  27. Alvisi, S.; Franchini, M. Multiobjective Optimization of Rehabilitation and Leakage Detection Scheduling in Water Distribution Systems. J. Water Resour. Plan. Manag. 2009, 135, 426–439. [Google Scholar] [CrossRef]
  28. Roshani, E.; Filion, Y.R. Water Distribution System Rehabilitation under Climate Change Mitigation Scenarios in Canada. J. Water Resour. Plan. Manag. 2015, 141, 04014066. [Google Scholar] [CrossRef]
  29. Creaco, E.; Franchini, M.; Alvisi, S. Evaluating Water Demand Shortfalls in Segment Analysis. Water Resour. Manag. 2012, 26, 2301–2321. [Google Scholar] [CrossRef]
  30. Kanta, L.; Brumbelow, K. Vulnerability, Risk, and Mitigation Assessment of Water Distribution Systems for Insufficient Fire Flows. J. Water Resour. Plan. Manag. 2013, 139, 593–603. [Google Scholar] [CrossRef]
  31. Hernandez, E.H.; Ormsbee, L. Segment Identification Procedure for Water Distribution Systems. J. Water Resour. Plan. Manag. 2021, 147, 04021013. [Google Scholar] [CrossRef]
  32. Giustolisi, O.; Berardi, L. Prioritizing Pipe Replacement: From Multiobjective Genetic Algorithms to Operational Decision Support. J. Water Resour. Plan. Manag. 2009, 135, 484–492. [Google Scholar] [CrossRef]
  33. Rahmani, F.; Behzadian, K.; Ardeshir, A. Rehabilitation of a Water Distribution System Using Sequential Multiobjective Optimization Models. J. Water Resou.r Plan. Manag. 2016, 142, 1–7. [Google Scholar] [CrossRef]
  34. Klima, K.; Kong, W.; El Gammal, L.; Prosdocimi, D. Creating a water risk index to improve community resilience. IBM J. Res. Dev. 2020, 64, 16:1–16:11. [Google Scholar] [CrossRef]
  35. Statistics Canada, Profile table, Census Profile, 2021 Census of Population—Vancouver, City (CY) [Census Subdivision], British Columbia. Available online: https://www12.statcan.gc.ca/census-recensement/2021/dp-pd/prof/details/page.cfm?Lang=E&GENDERlist=1,2,3&STATISTIClist=1&HEADERlist=0&DGUIDlist=2021A00055915022&SearchText=vancouver (accessed on 3 September 2023).
  36. City of Vancouver, Water, Sewer, and Neighbourhood Energy Systems|City of Vancouver. Available online: https://vancouver.ca/home-property-development/water-and-sewer.aspx (accessed on 3 September 2023).
  37. Statistics Canada, Census Profile Downloads. 2021. Available online: https://www12.statcan.gc.ca/census-recensement/2021/dp-pd/prof/details/download-telecharger.cfm?Lang=E (accessed on 3 September 2023).
  38. City of Vancouver, Explore—City of Vancouver Open Data Portal. Available online: https://opendata.vancouver.ca/explore/ (accessed on 3 September 2023).
  39. City of Vancouver, Water Distribution mains—City of Vancouver Open Data Portal. Available online: https://opendata.vancouver.ca/explore/dataset/water-distribution-mains/export/ (accessed on 3 September 2023).
  40. City of Vancouver, Design Guidelines and Construction Standards|City of Vancouver. Available online: https://vancouver.ca/streets-transportation/street-design-construction-resources.aspx (accessed on 3 September 2023).
  41. RSMeans, Heavy Construction Costs, Kingston, MA: Means Kingston, MA: R.S. Means Co. Norwell, MA: RSMeans 1st Annual ed. (1987)–Ceased with 30th ed. 2016. Available online: https://www.rsmeansonline.com/ (accessed on 3 September 2023).
  42. Sinaei, A.; Dziedzic, R.; Creaco, E. Holistic Risk Assessment of Water Distribution Systems [Computer Software]. 2023. Available online: https://github.com/UrbanLinks/Holistic-WDS-Risk (accessed on 1 May 2023).
  43. Karakoc, D.B.; Barker, K.; Zobel, C.W.; Almoghathawi, Y. Social vulnerability and equity perspectives on interdependent infrastructure network component importance. Sustain. Cities Soc. 2020, 57, 102072. [Google Scholar] [CrossRef]
  44. Mendes, J.M.; Tavares, A.O.; Santos, P.P. Social vulnerability and local level assessments: A new approach for planning. Int. J. Disaster Resil. Built Environ. 2019, 11, 15–43. [Google Scholar] [CrossRef]
  45. Doll, C.; Polyakov, M.; Pannell, D.J.; Burton, M.P. Rethinking urban park irrigation under climate change. J. Environ. Manag. 2022, 314, 115012. [Google Scholar] [CrossRef] [PubMed]
  46. Nga, P.H.; Takara, K.; Van, N.C. Integrated approach to analyze the total flood risk for agriculture: The significance of intangible damages—A case study in Central Vietnam. Int. J. Disaster Risk Reduct. 2018, 31, 862–872. [Google Scholar] [CrossRef]
  47. Walski, T.M.; Pelliccia, A. Economic analysis of water main breaks. J. AWWA 1982, 74, 140–147. [Google Scholar] [CrossRef]
  48. Marlim, M.S.; Jeong, G.; Kang, D. Identification of critical pipes using a criticality index in water distribution networks. Appl. Sci. 2019, 9, 4052. [Google Scholar] [CrossRef]
  49. Elshaboury, N.; Attia, T.; Marzouk, M. Application of Evolutionary Optimization Algorithms for Rehabilitation of Water Distribution Networks. J. Constr. Eng. Manag. 2020, 146, 04020069. [Google Scholar] [CrossRef]
  50. Ramírez, R.; Cobacho, R.; Torres, D.; López-Jiménez, P.A. Implementación de un modelo de predicción de fallos orientado a la gestión y estrategias de mantenimiento en redes de distribución de agua potable. Ing. Del Agua 2019, 23, 247–258. [Google Scholar] [CrossRef]
  51. Rahman, S.; Devera, J.; Reynolds, J. Risk assessment model for pipe rehabilitation and replacement in a water distribution system, Pipelines 2014: From Underground to the Forefront of Innovation and Sustainability. In Proceedings of the Pipelines 2014 Conference, Portland, OR, USA, 3–6 August 2014; pp. 1997–2006. [Google Scholar] [CrossRef]
  52. Raspati, G.S.; Bruaset, S.; Bosco, C.; Mushom, L.; Johannessen, B.; Ugarelli, R. A Risk-Based Approach in Rehabilitation of Water Distribution Networks. Int. J. Environ. Res. Public Health 2022, 19, 1594. [Google Scholar] [CrossRef] [PubMed]
  53. Bucherie, A.; Hultquist, C.; Adamo, S.; Neely, C.; Ayala, F.; Bazo, J.; Kruczkiewicz, A. A comparison of social vulnerability indices specific to flooding in Ecuador: Principal component analysis (PCA) and expert knowledge. Int. J. Disaster Risk Reduct. 2022, 73, 102897. [Google Scholar] [CrossRef]
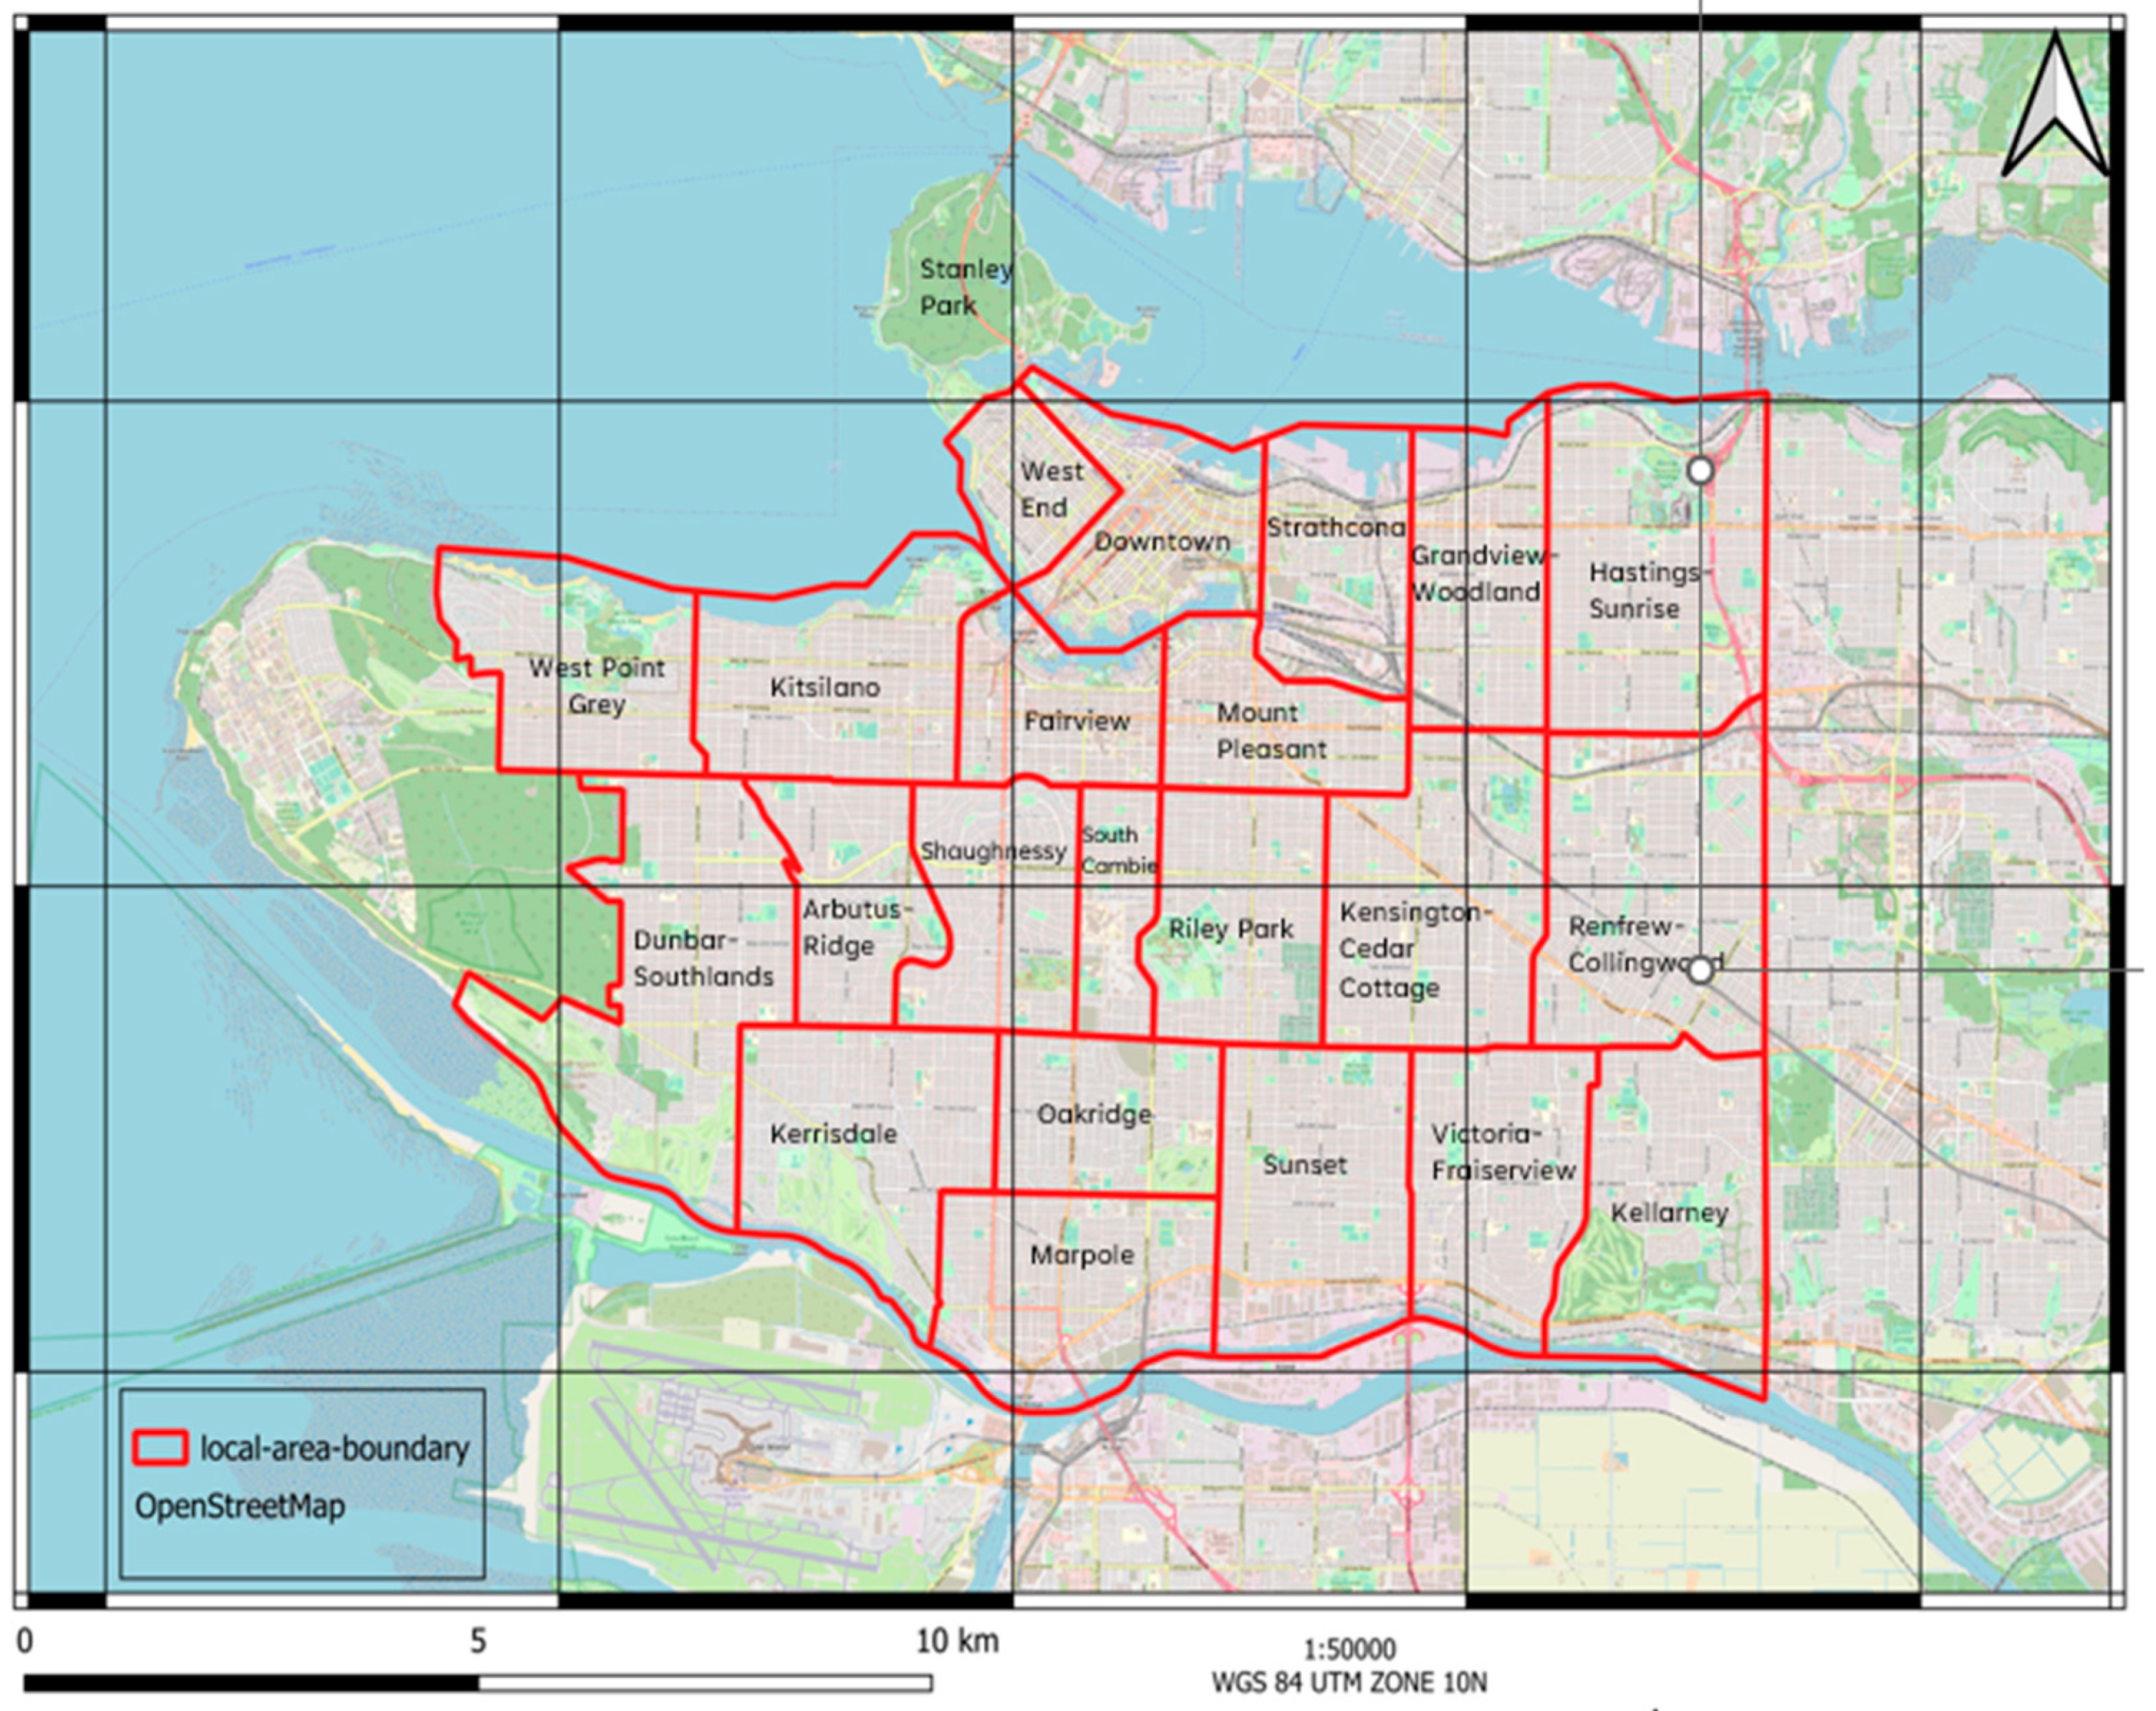
Figure 1. Map of neighbourhoods of the City of Vancouver, BC, Canada. Base map data © OpenStreetMap contributors.
Water 17 00252 g001
Figure 2. Scree plot of eigenvalues and associated components.
Water 17 00252 g002
Figure 3. Cumulative variance plot and associated components.
Water 17 00252 g003
Figure 4. Social vulnerability index (SVI) class of each dissemination area in Vancouver, from Very Low to Very High. Base map data © OpenStreetMap contributors, rendered using Plotly (http://plotly.com, accessed on 1 May 2023).
Water 17 00252 g004
Figure 5. Environmental vulnerability index (EVI) class of each dissemination area in Vancouver, from Very Low to Very High. Base map data © OpenStreetMap contributors, rendered using Plotly (http://plotly.com, accessed on 1 May 2023).
Water 17 00252 g005
Figure 6. Economic Vulnerability Index (ECI) class of pipes in Vancouver, from Low to Very High (Note: Very Low ECI is not shown to facilitate the visualization of more vulnerable pipes). Base map data © OpenStreetMap contributors, rendered using Plotly (http://plotly.com, accessed on 1 May 2023).
Water 17 00252 g006
Figure 7. Consequence of failure (COF) class of pipes in Vancouver, from Low to Very High (Note: Very Low COF is not shown to facilitate the visualization of more vulnerable pipes). Base map data © OpenStreetMap contributors, rendered using Plotly (http://plotly.com, accessed on 1 May 2023).
Water 17 00252 g007
Figure 8. Fitting curve of pipe break frequency and Weibull PDF.
Water 17 00252 g008
Figure 9. Risk class of pipes in Vancouver, from Low to Very High (Note: Very Low Risk is not shown to facilitate the visualization of high-risk pipes). Base map data © OpenStreetMap contributors, rendered using Plotly (http://plotly.com, accessed on 1 May 2023).
Water 17 00252 g009
Table 1. Social vulnerability indicators and associated selected variables based on the literature review.
SVI IndicatorVariablePrevious Studies
Sensitive populationUnder 5 years[4,5,10,16,17,18,43]
5 to 14 years
65 years and over[4,5,10,16,17,18,34,43]
Household/Quality of life/EducationNo certificate, diploma, or degree[16,17]
Postsecondary certificate, diploma, or degree[10,14,16,17]
No high school diploma or equivalency certificate[5,15]
Renter[5,14,18,34]
One-maintainer household[14]
Between 7 a.m. to 7:59 a.m.[5,10]
Ethnic and Racial DemographicsAfrican American[6,18,43]
South Asian[6,16,17,18,43]
Black[16,17]
Chinese[16,17]
Filipino[16,17]
Caucasian (White)[16,17,18]
Total visible minority population[4,5,7,15]
Indigenous identity[16,17,18]
Non-Official languages[16,17]
Socioeconomic
Well-being Index
Average total income of household in 2020 ($)[3,7,14,15,16,17,18]
Spending 30% or more of income on shelter costs[16,17]
Government transfer (%)[16,17]
Median value of dwellings ($)[16,17]
Average total income in 2020 among recipients ($)[3,7,14,15,16,17]
Unemployed[6,7,14,15,16,17,34]
Female labour force participation[10,14,16,17]
Female employed[14]
Male Not in the labour force[16,17]
All occupations[16,17]
Housing and
Mobility
Profile
Period of home construction (2000 and before)[16,17]
No private vehicle/Public transit[15,16,17]
Movers[3,15]
Average number of rooms per dwelling[16,17]
House with major repair[16,17]
Table 2. Description of selected variables.
VariableDescription
Under 5 yearsChildren aged under 5 years
5 to 14 yearsChildren aged between 5 to 14
65 years and overPopulation aged 65 and over
No certificate, diploma, or degreeThe population aged 15 years and over in private households without certificate, diploma or degree
Postsecondary certificate, diploma, or degreeThe population aged 15 years and over in private households with postsecondary, certificate, diploma or degree
No high school diploma or equivalency certificateThe population aged 15 years and over in private households with no high school diploma or equivalency certificate
RenterPrivate households that do not own the property and pay rent to the landlord
One-maintainer householdPrivate households where only one person is responsible for maintaining or supporting the household
Between 7 a.m. to 7:59 a.m.Time leaving for work for the employed labour force aged 15 years and over
African American African American ethnic or cultural origin in private households
South AsianSouth Asian ethnic or cultural origin in private households
BlackBlack ethnic or cultural origin in private households
ChineseChinese ethnic or cultural origin in private households
FilipinoFilipino ethnic or cultural origin in private households
Caucasian (White)Caucasian (White) ethnic or cultural origin in private households
Total visible minority populationVisible minority for the population in private households
Indigenous identityPopulation in private households affiliated with native communities
Non-Official languagesPopulation who conducts a conversation in a language other than English or French
Average total income of household in 2020 ($)Average income for private households
Spending 30% or more of income on shelter costsHouseholds spending over 30% of their income on shelter costs
Government transfer (%)All cash benefits received from federal, provincial, territorial or municipal governments
Median value of dwellings ($)Dollar amount expected by the owner if the asset were to be sold
Average total income in 2020 among recipients ($)Average total income in 2020 for the population aged 15 years and over
UnemployedIncludes unemployed persons aged 15 years and over who have never worked for pay or in self-employment
Female labour force participationFemales aged 15 or above who participate in the labour force
Female employedFemales aged 15 or above employed
Male Not in the labour forceMales aged 15 or above not in the labour force
All occupationsAll persons aged 15 years and over in the labour force in all occupations
Period of home construction (2000 and before)Private dwellings constructed between 2000 and before
No private vehicle/Public transitThe main form of transport for employed workers aged 15 and over
MoversPersons who have moved from one residence to another within the last year
Average number of rooms per dwellingNumber of rooms per occupied dwelling
House with major repairOccupied private dwellings that need major repairs
Table 3. The coefficient of each variable is linked to the principal component after varimax rotation.
VariablePrincipal Component
PC
1
PC
2
PC
3
PC
4
PC
5
PC
6
PC
7
PC
8
PC
9
PC
10
PC
11
PC
12
PC
13
PC
14
PC
15
FE 1 0.43
UE 2 −0.84
FTF 3 −0.96
AA 4 0.97
AO 5 −0.43 0.40
ATIH 6 −0.67
BSS 7 −0.97
BL 8 −0.98
CA 9 −0.88
CH 100.32
FI 11 −0.58
GT 12 −0.36 −0.33
II 13 −0.45 0.40
HMR 14−0.45 0.32 0.35
MVD 15 −0.84
MO 16
NCD 17 −0.46
MNL 18* −0.44
OMH 19 0.53
PDD 20 0.42
PT 21 −0.53
RE 22 0.46
SA 23 −0.99
SIS 24 0.37 −0.43
TVMP 250.32
UF 26 −0.98
ANRD 27 −0.51
PHC 28−0.63
SFO 29 −0.52
Notes: 1: Female employed, 2: Unemployed, 3: 5 to 14 years, 4: African American, 5: All occupations, 6: Average total income of household in 2020 ($), 7: Between 7 a.m. and 7:59 a.m., 8: Black, 9: Caucasian (white), 10: Chinese, 11: Filipino, 12: Government transfers (%), 13: Indigenous identity, 14: House with major repair, 15: Median value of dwellings ($), 16: Movers, 17: No certificate, diploma, or degree, 18*: Male Not in the labour force, 19: One-maintainer household, 20: Postsecondary certificate, diploma, or degree, 21: Public transit, 22: Renter, 23: South Asian, 24: Spending 30% or more of income on shelter costs, 25: Total visible minority population, 26: Under 5 years, 27: Average number of rooms per dwelling, 28: Period of home construction (2000 and before), 29: 65 years and over.
Table 4. Pipe characteristics and risk results for the top 10 highest risk pipes in Vancouver.
Risk RankNeighbourhoodPipe Length
(m)
AGEDiameter
(mm)
SVIEVIECIPOF (%)COFRisk (%)
1West End54.4884150047.5199.4427.9799.8578.64100
2Dunbar-Southlands38.139220052.091000.6810068.6987.48
3Downtown111.798530047.5199.443.7799.9167.7686.22
4Kerrisdale1207715052.091001.5197.6569.0685.88
5Stanley Park1209315047.5199.441.5110066.7585.01
6Downtown20.198530047.5199.440.6899.9166.3784.45
7West End7.747330047.5199.440.2693.1866.1978.55
8Marpole63.999315076.4945.71.5110055.6270.83
9Mount Pleasant648130081.6723.422.1699.4248.2261.05
10Riley Park1209680074.2712.4218.3510047.2360.15
Disclaimer/Publisher’s Note: The statements, opinions and data contained in all publications are solely those of the individual author(s) and contributor(s) and not of MDPI and/or the editor(s). MDPI and/or the editor(s) disclaim responsibility for any injury to people or property resulting from any ideas, methods, instructions or products referred to in the content.