Holistic Assessment of Social, Environmental and Economic Impacts of Pipe Breaks: The Case Study of Vancouver
Abstract
1. Introduction
2. Case Study
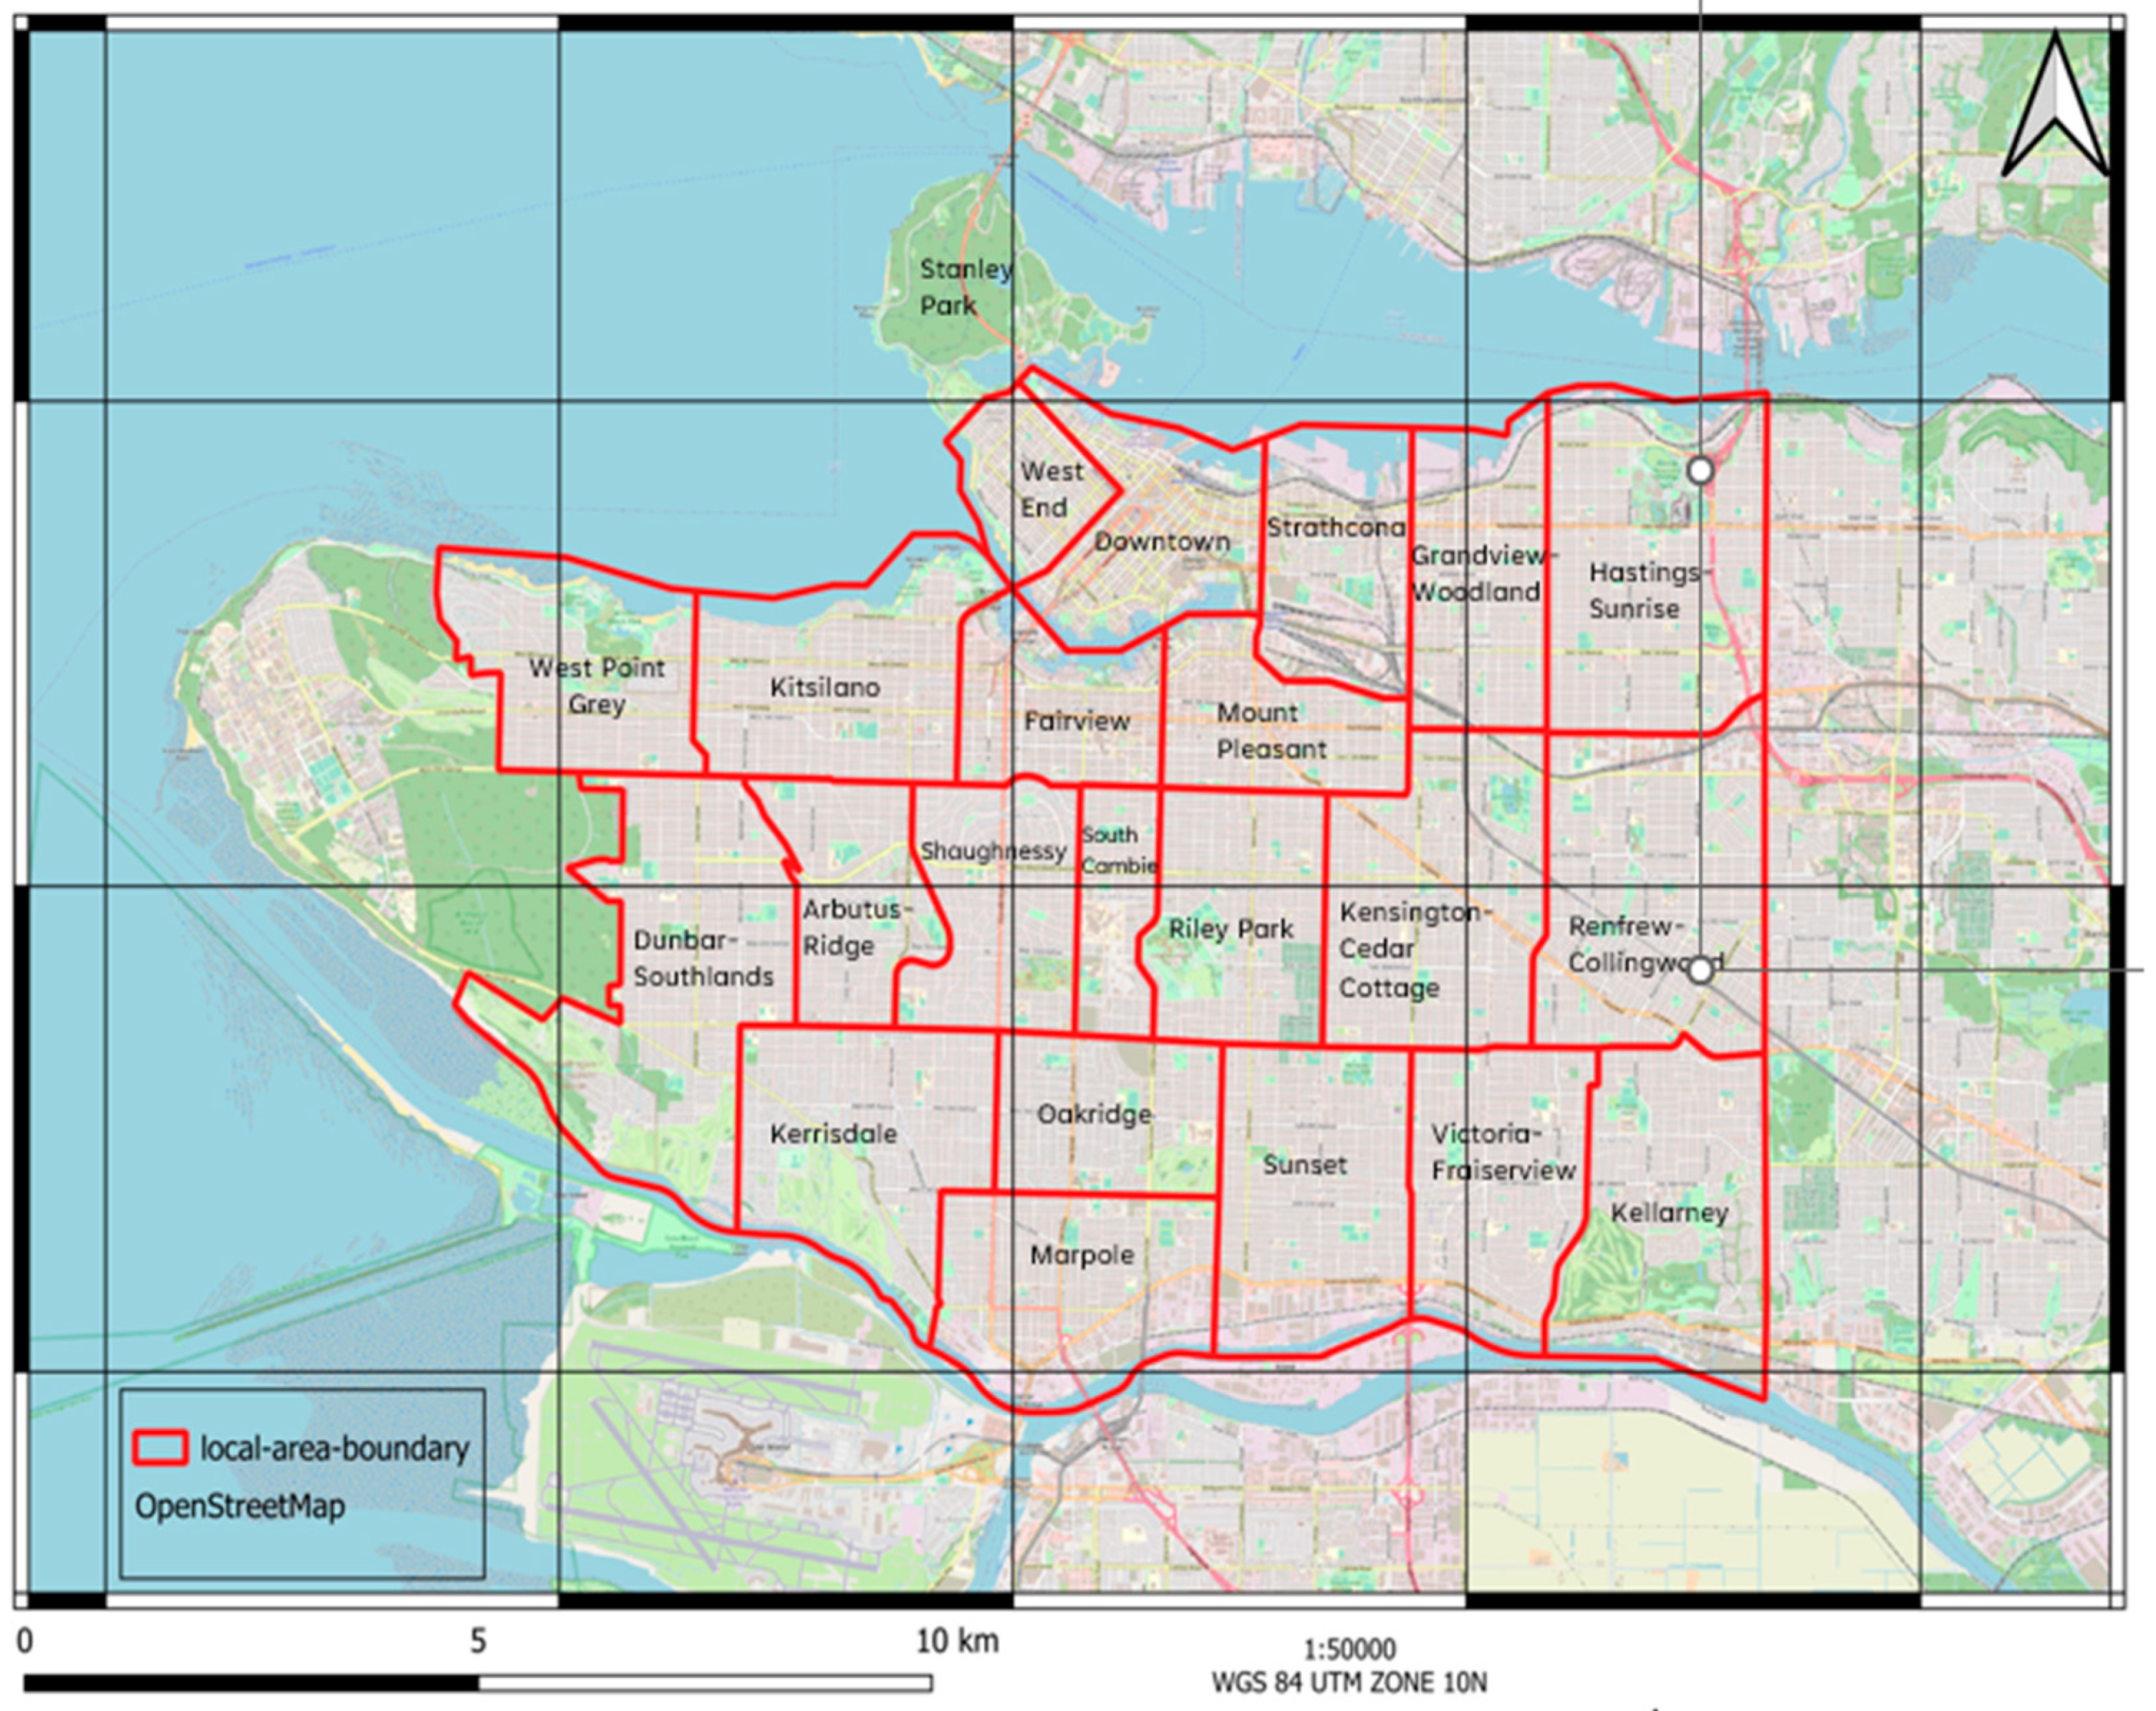
2.1. Study Area
2.2. Data Sources of Social Vulnerability
2.3. Data Sources of Environmental Vulnerability
2.4. Data Sources of Economic Vulnerability
2.5. Data Sources for Estimating the Probability of Failure
3. Materials and Methods
3.1. Vulnerability
3.1.1. Social Vulnerability Index (SVI)
Pearson Correlation Matrix
PCA
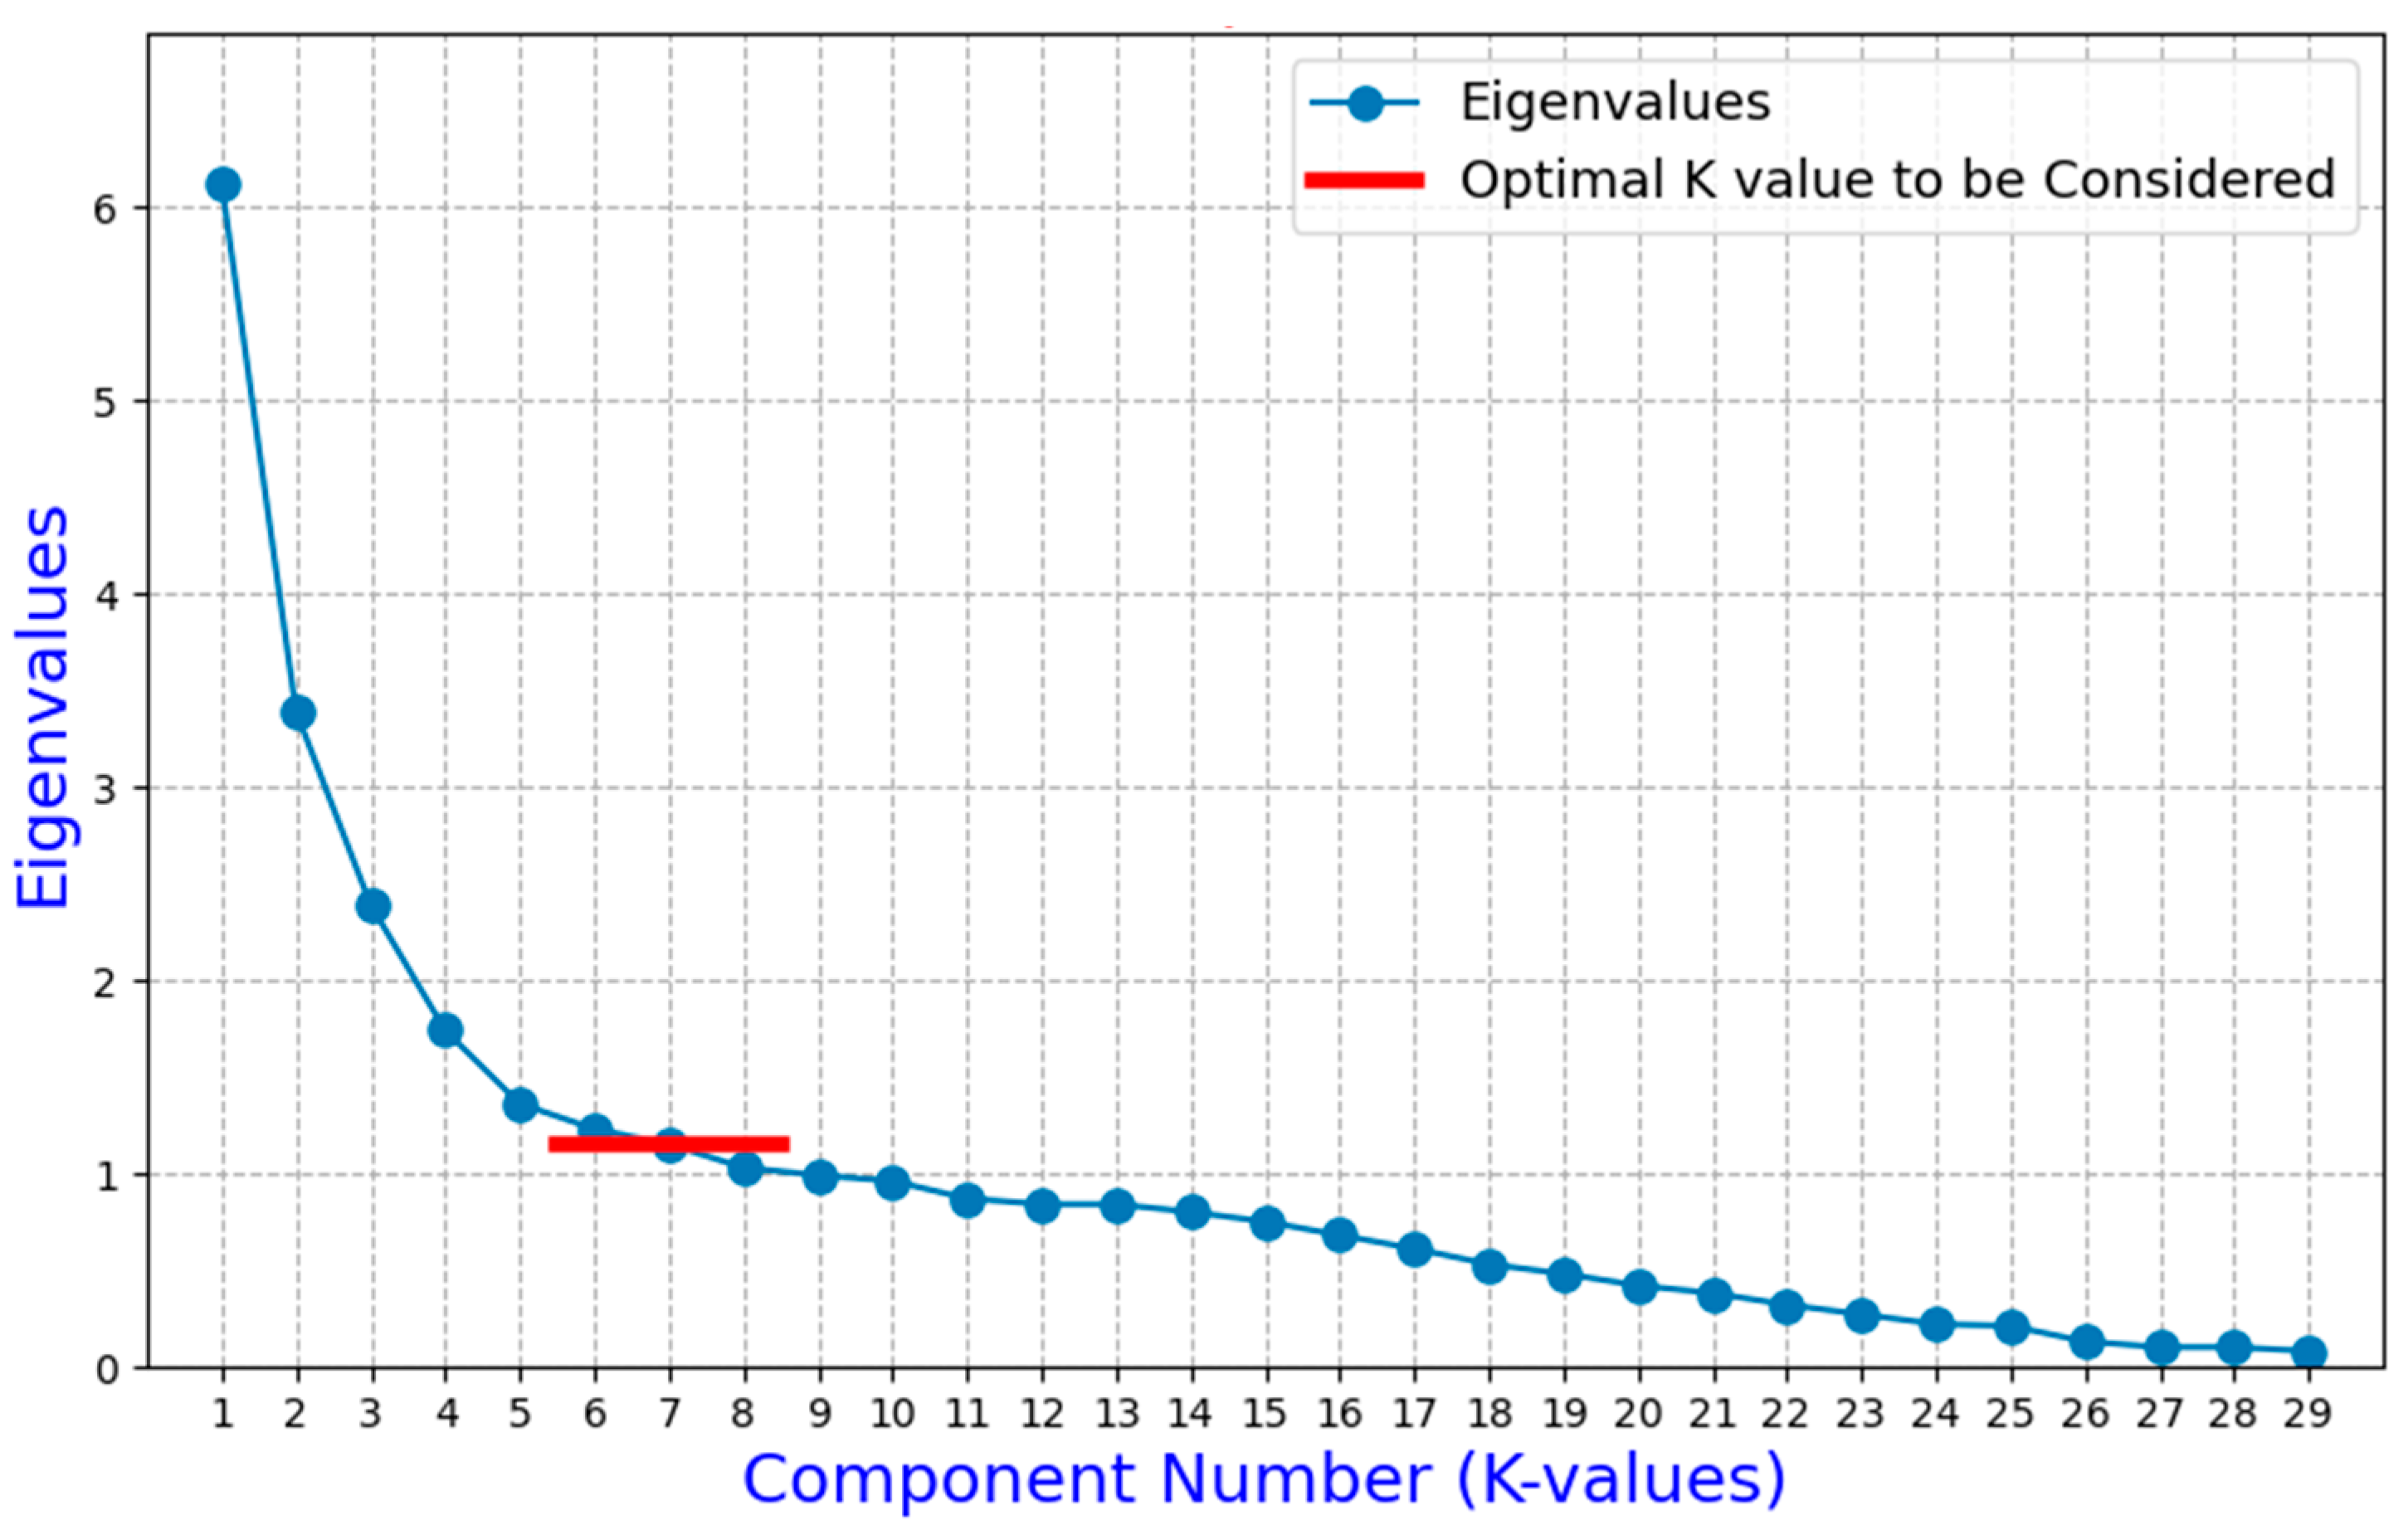
- Kaiser’s stopping rule: In this approach, only principal components with eigenvalues greater than one are retained. This approach implies that such components explain more variance than individual variables, therefore reducing the data while retaining significant information [5].
- The scree plot: This graphical method represents the eigenvalue variance on the Y-axis and the PCs on the X-axis. Because the ’elbow point’ represents the optimal number of principal components to retain while balancing explained variance and dimensionality reduction, only the components included in the steep part of the curve are retained in the dataset [16,18,34].
- Cumulative variance plot: This plot shows how much of the total variance in the dataset is included in the analysis. This study considered a threshold of roughly 85% of the total variance to retain an appropriate number of principal components [3,5,18]. The cumulative variance explained for each principal component is calculated by the following formula (Equation (1)) [16,17].
3.1.2. Environmental Vulnerability Index (EVI)
3.1.3. Economic Vulnerability Index (ECI)
3.2. Consequences of Failure (COF)
3.3. Probability of Failure (POF)
3.4. Risk Assessment
4. Results
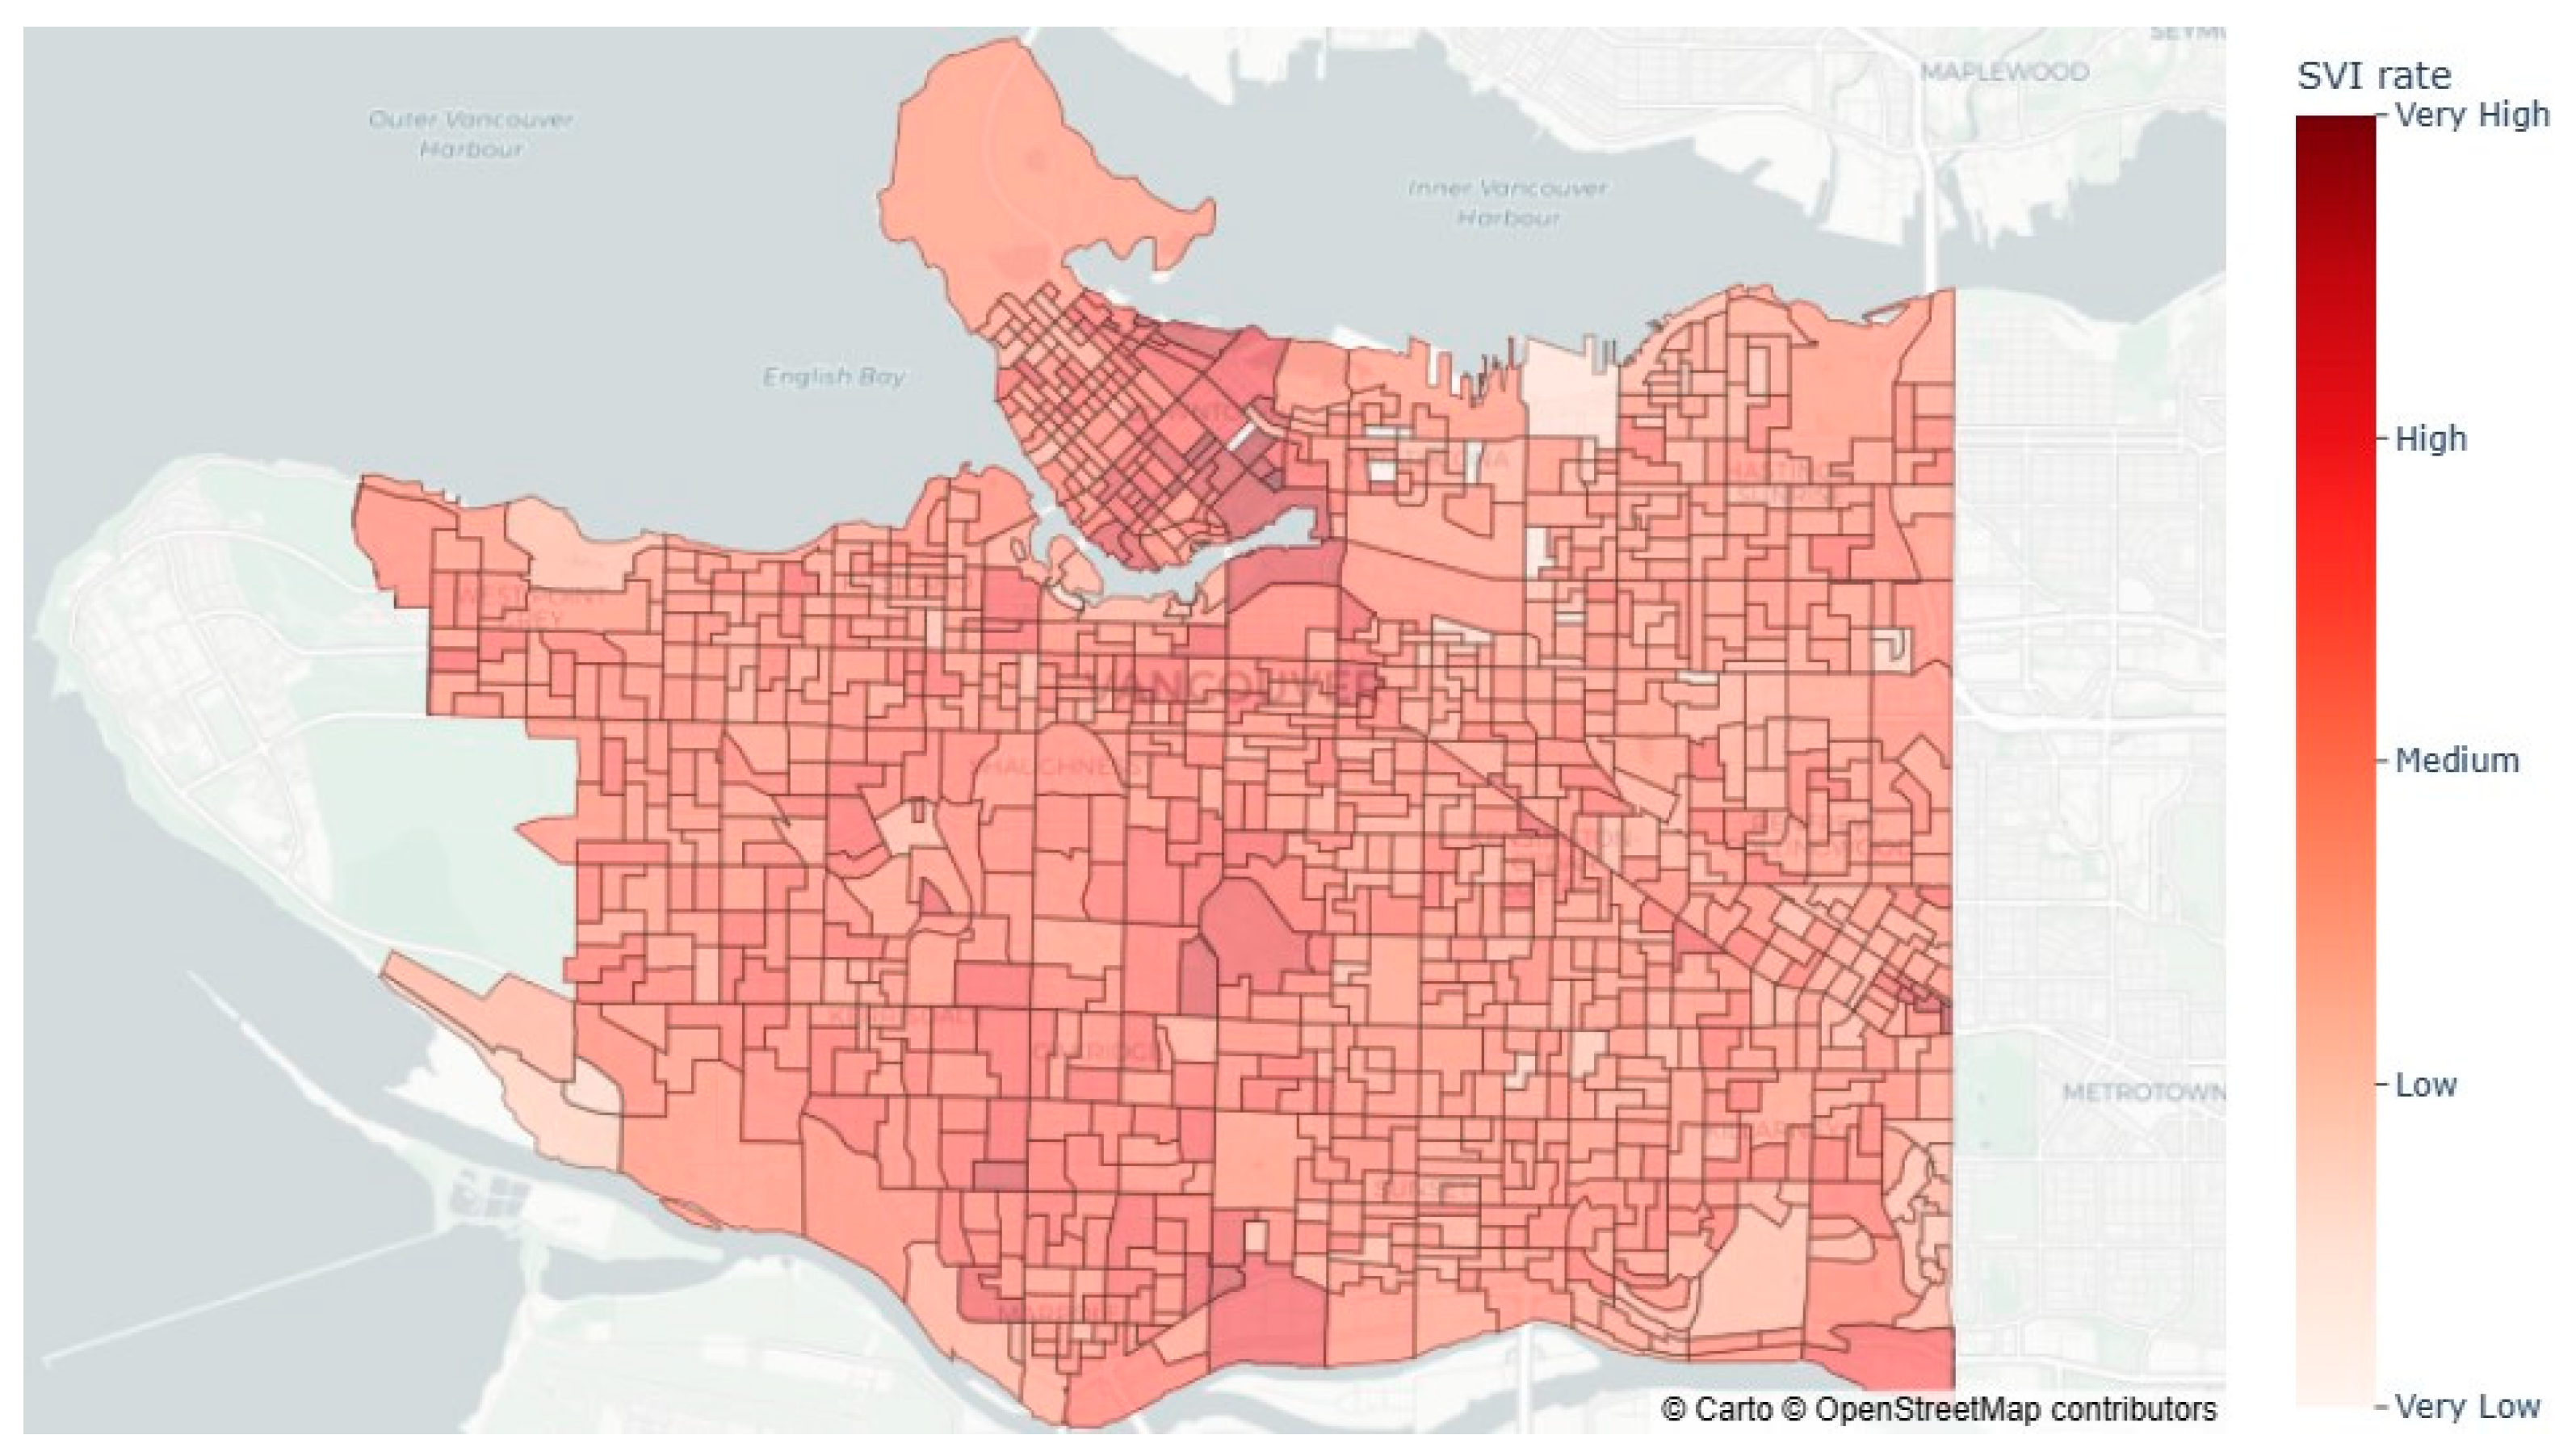
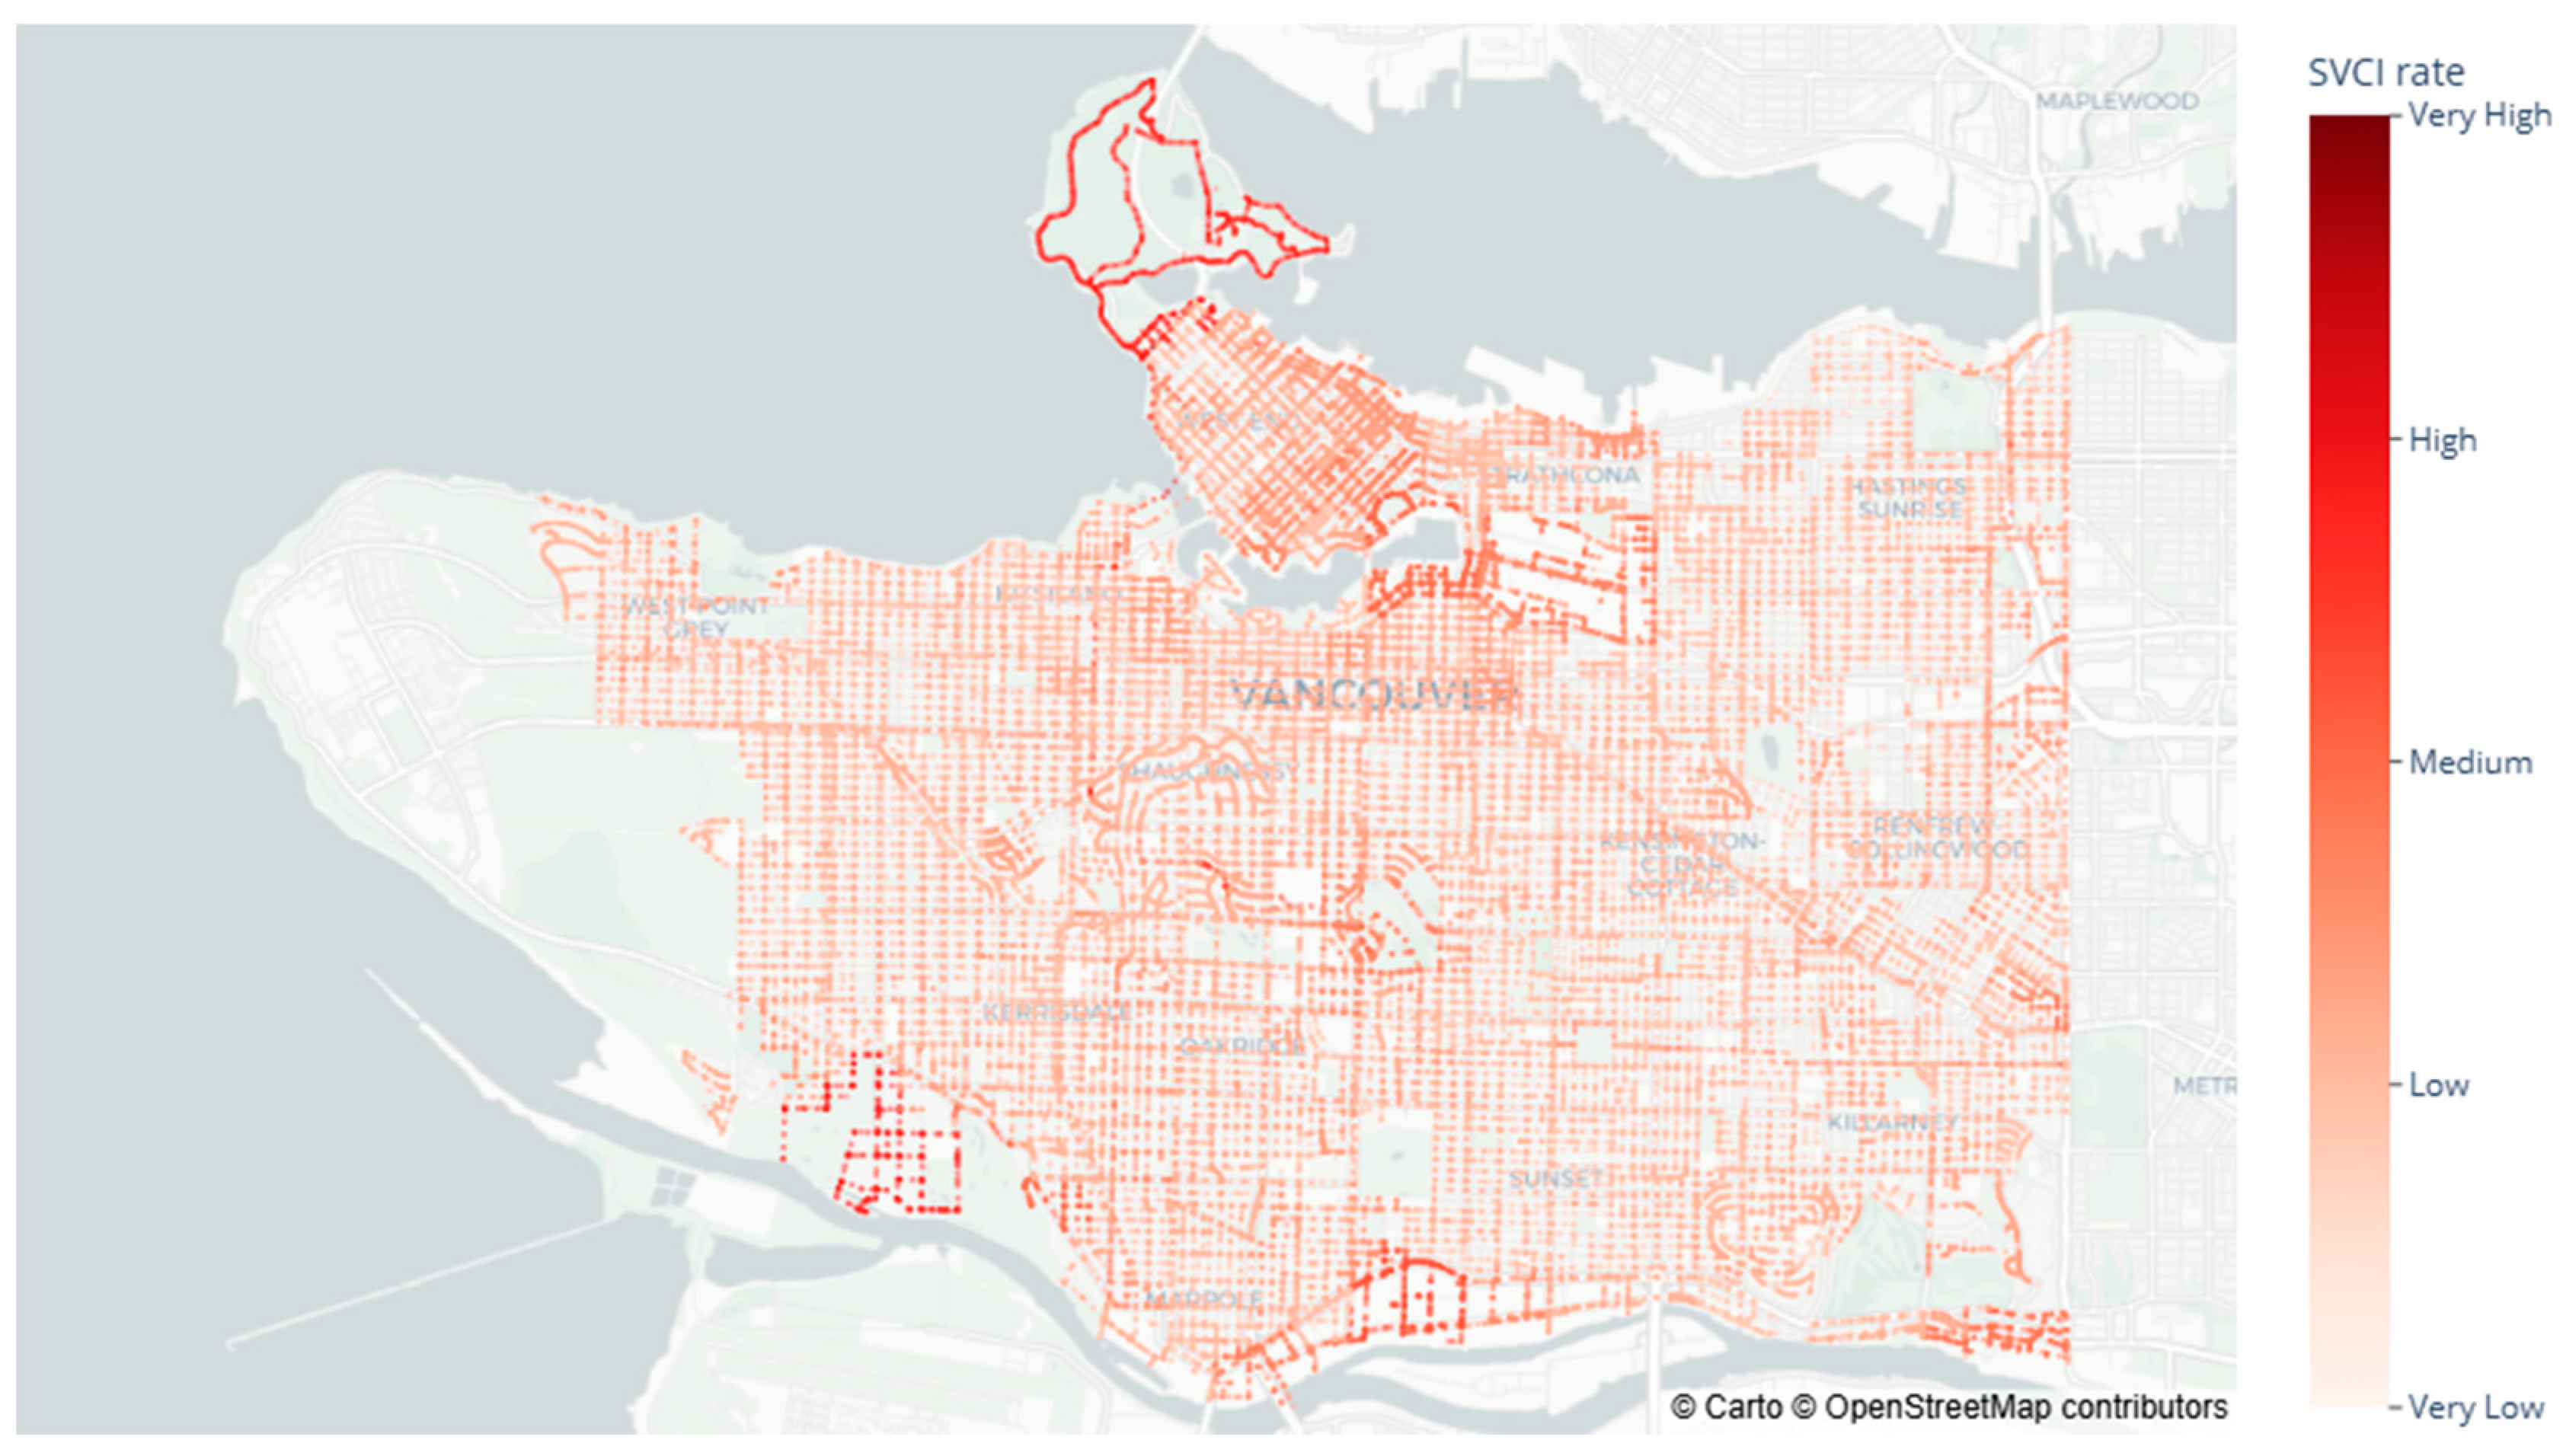
4.1. Results on Social Vulnerability Index (SVI)
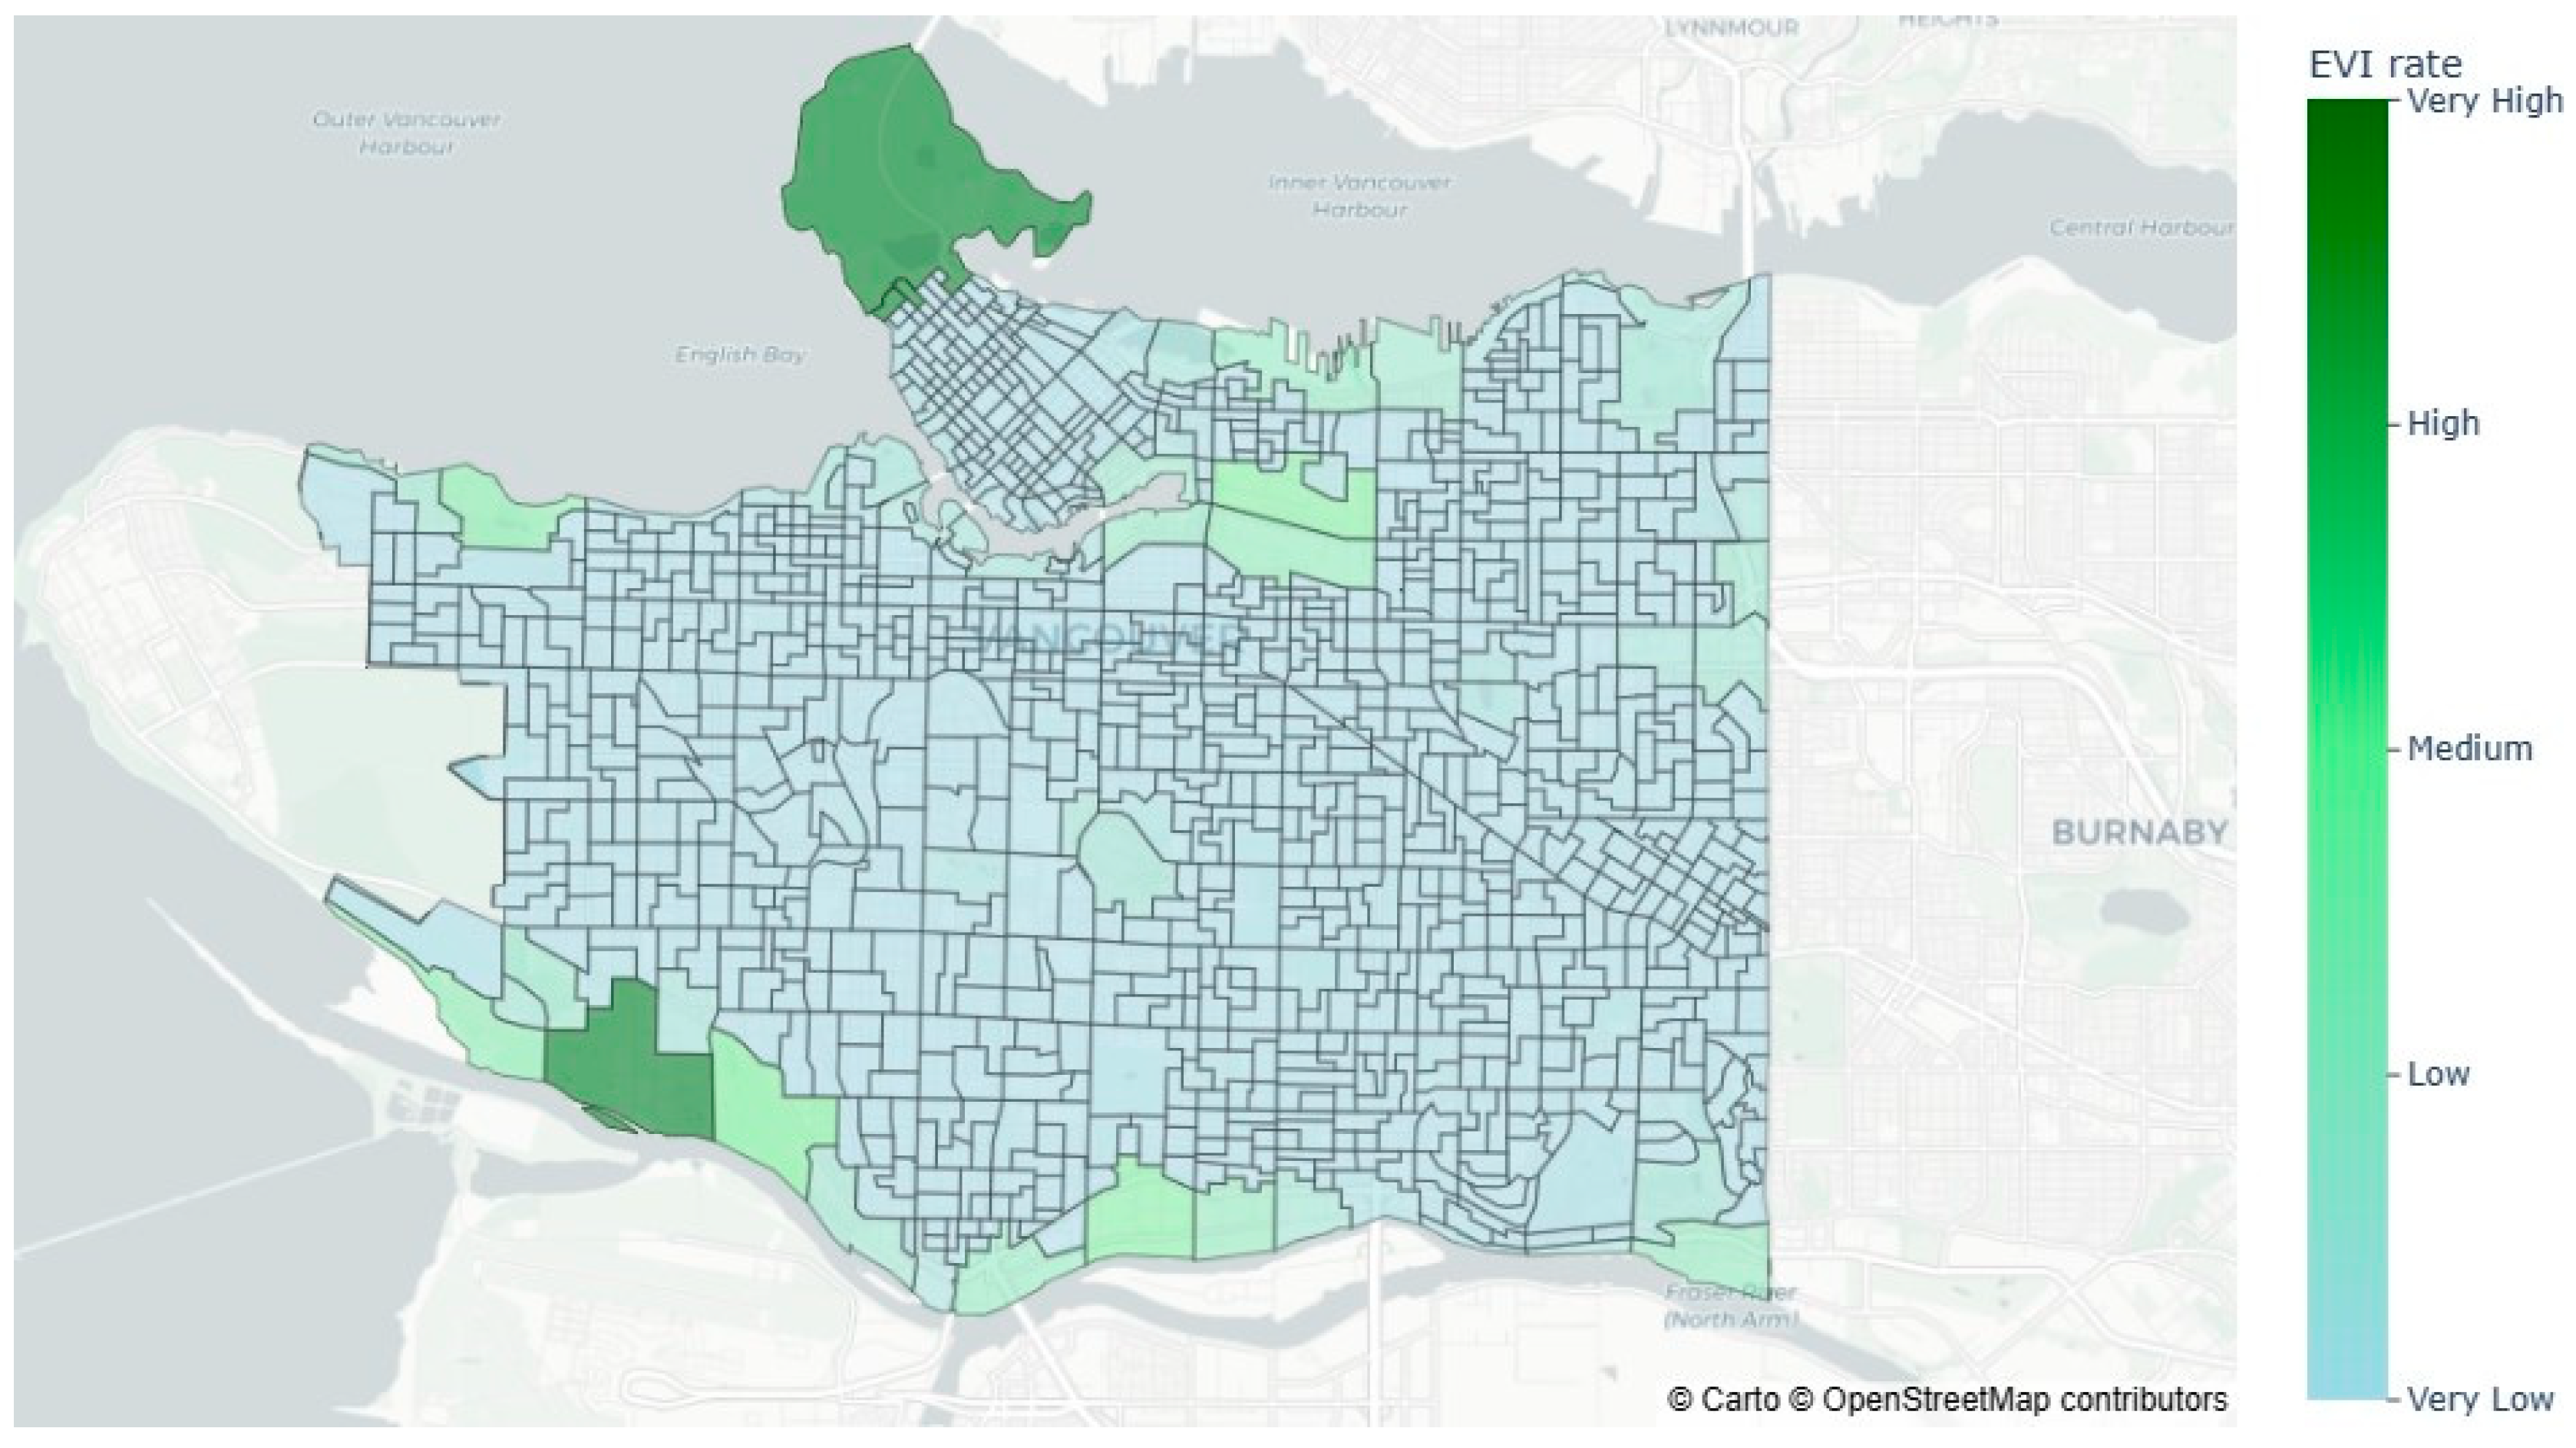
4.2. Results on Environmental Vulnerability Index (EVI)
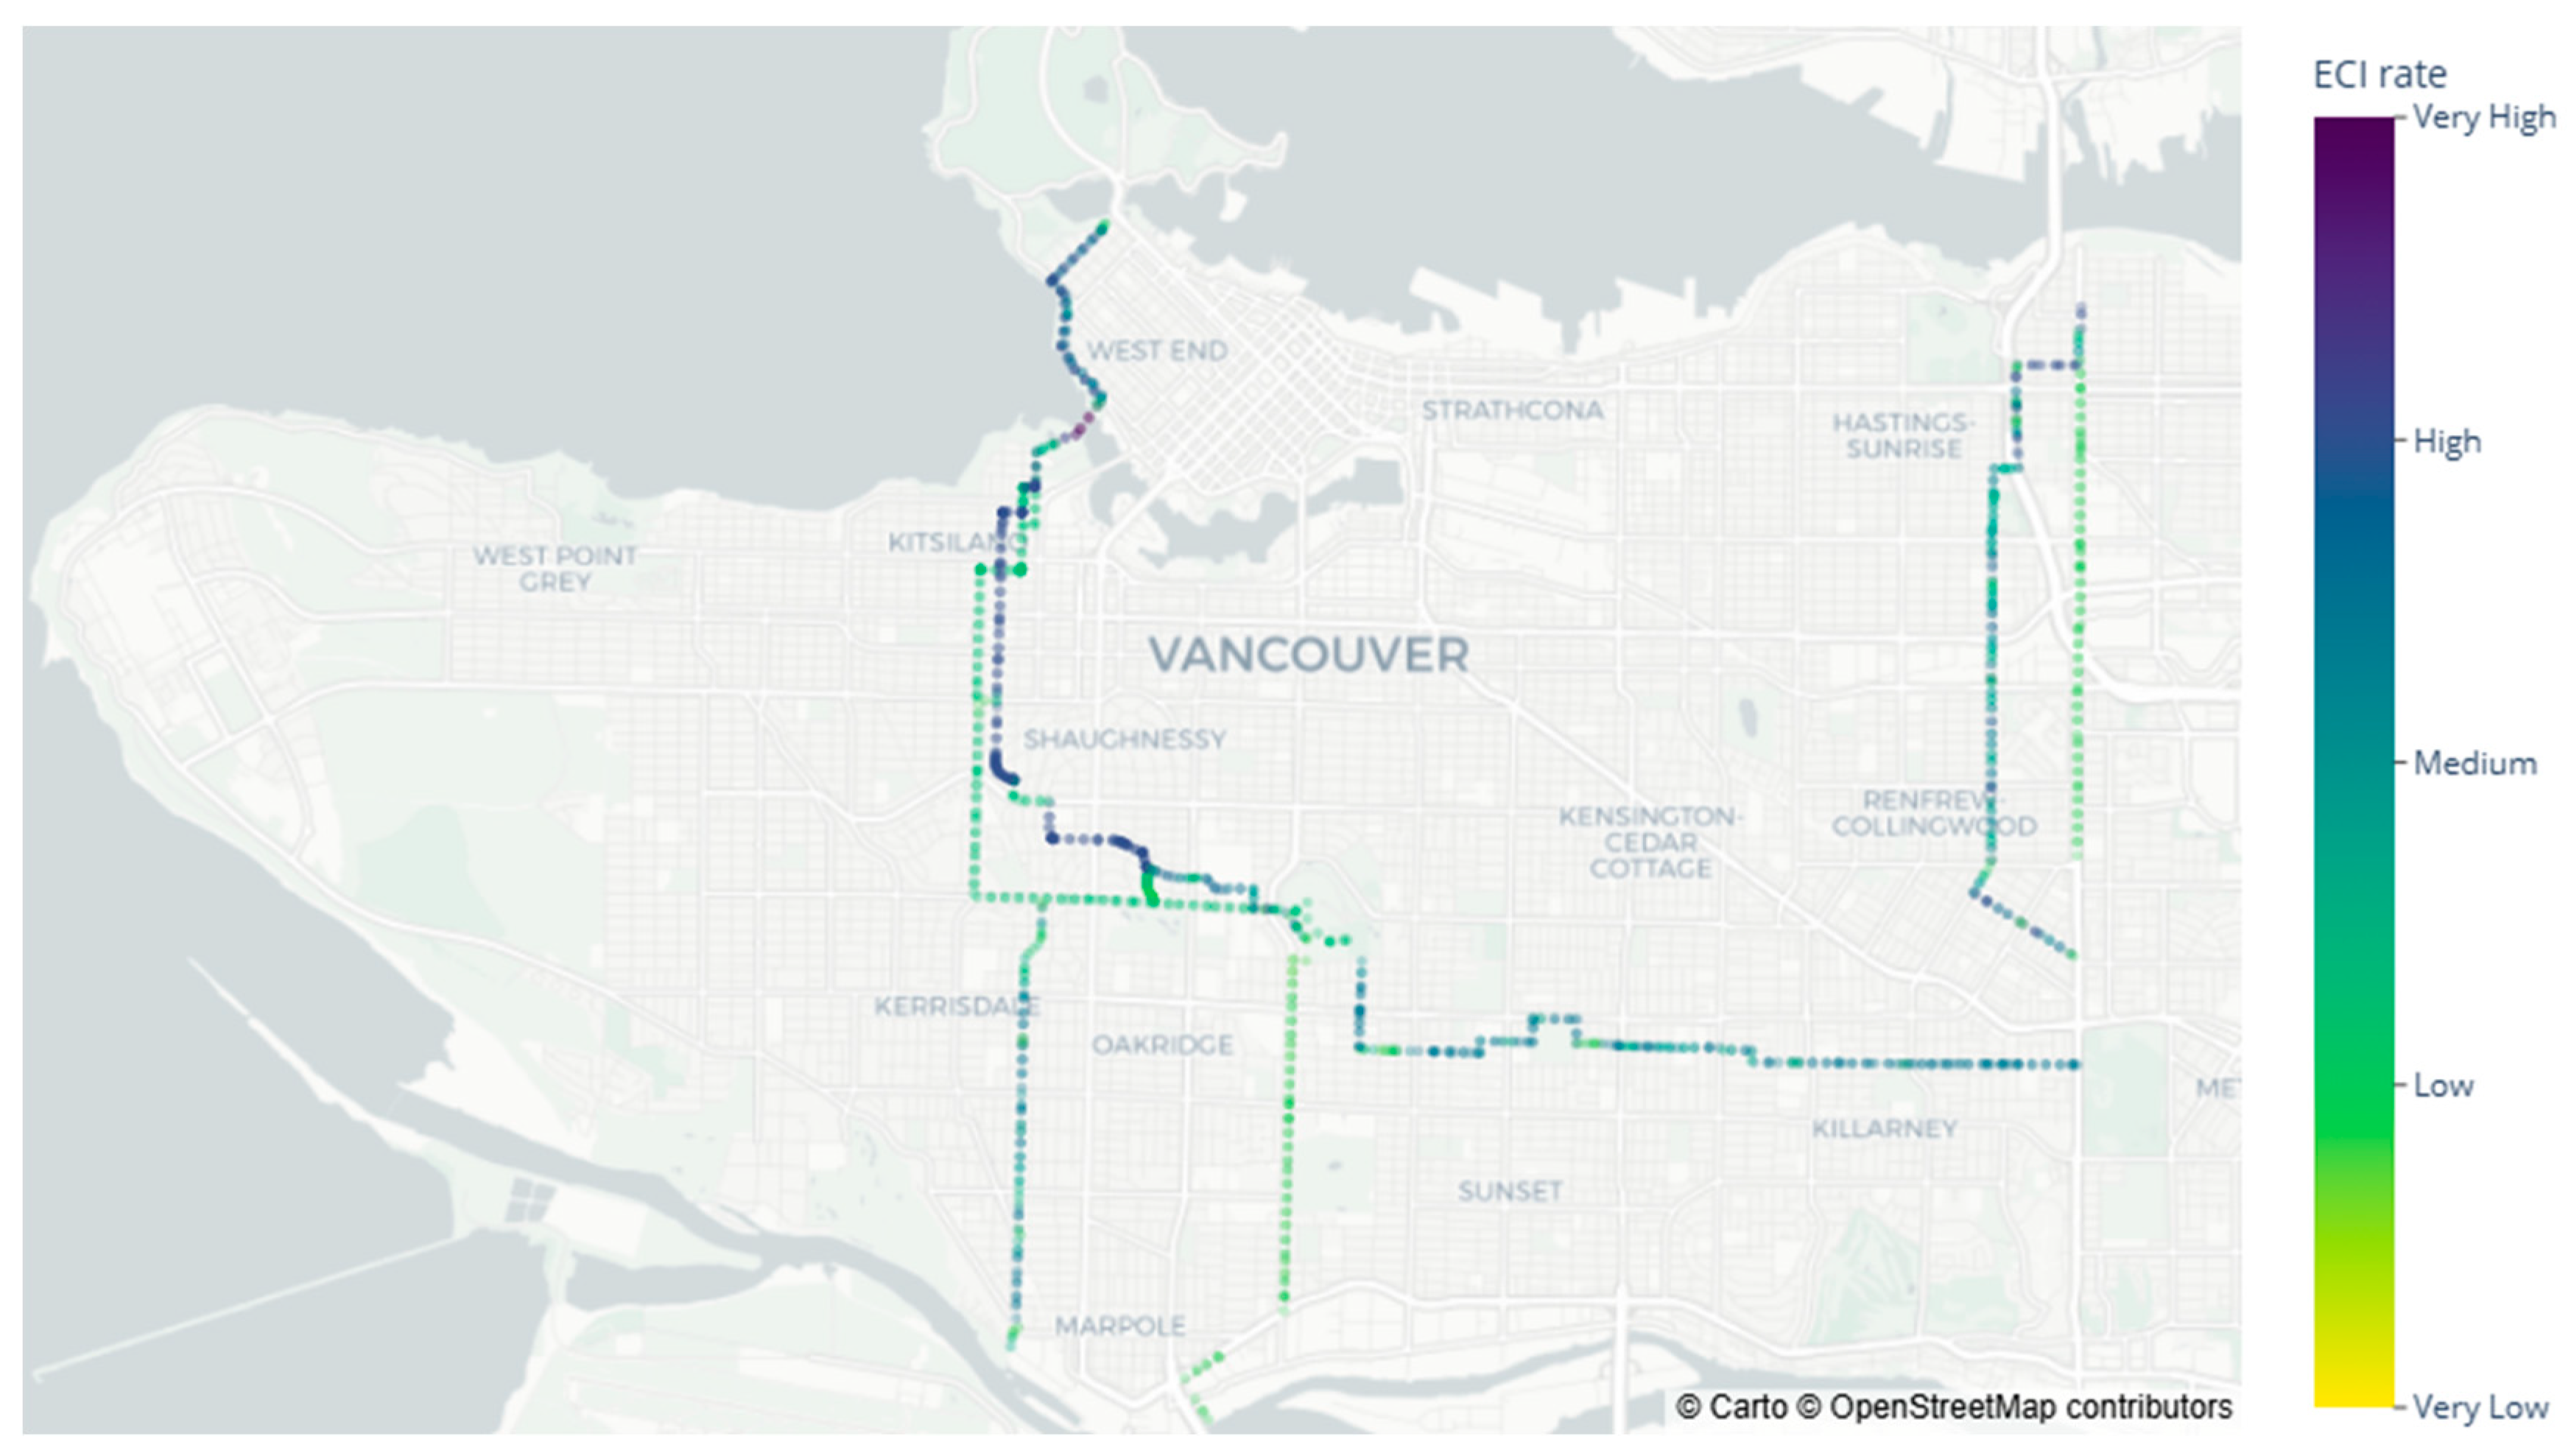
4.3. Results on Economic Vulnerability Index (ECI)
4.4. Results on Consequence of Failure (COF)
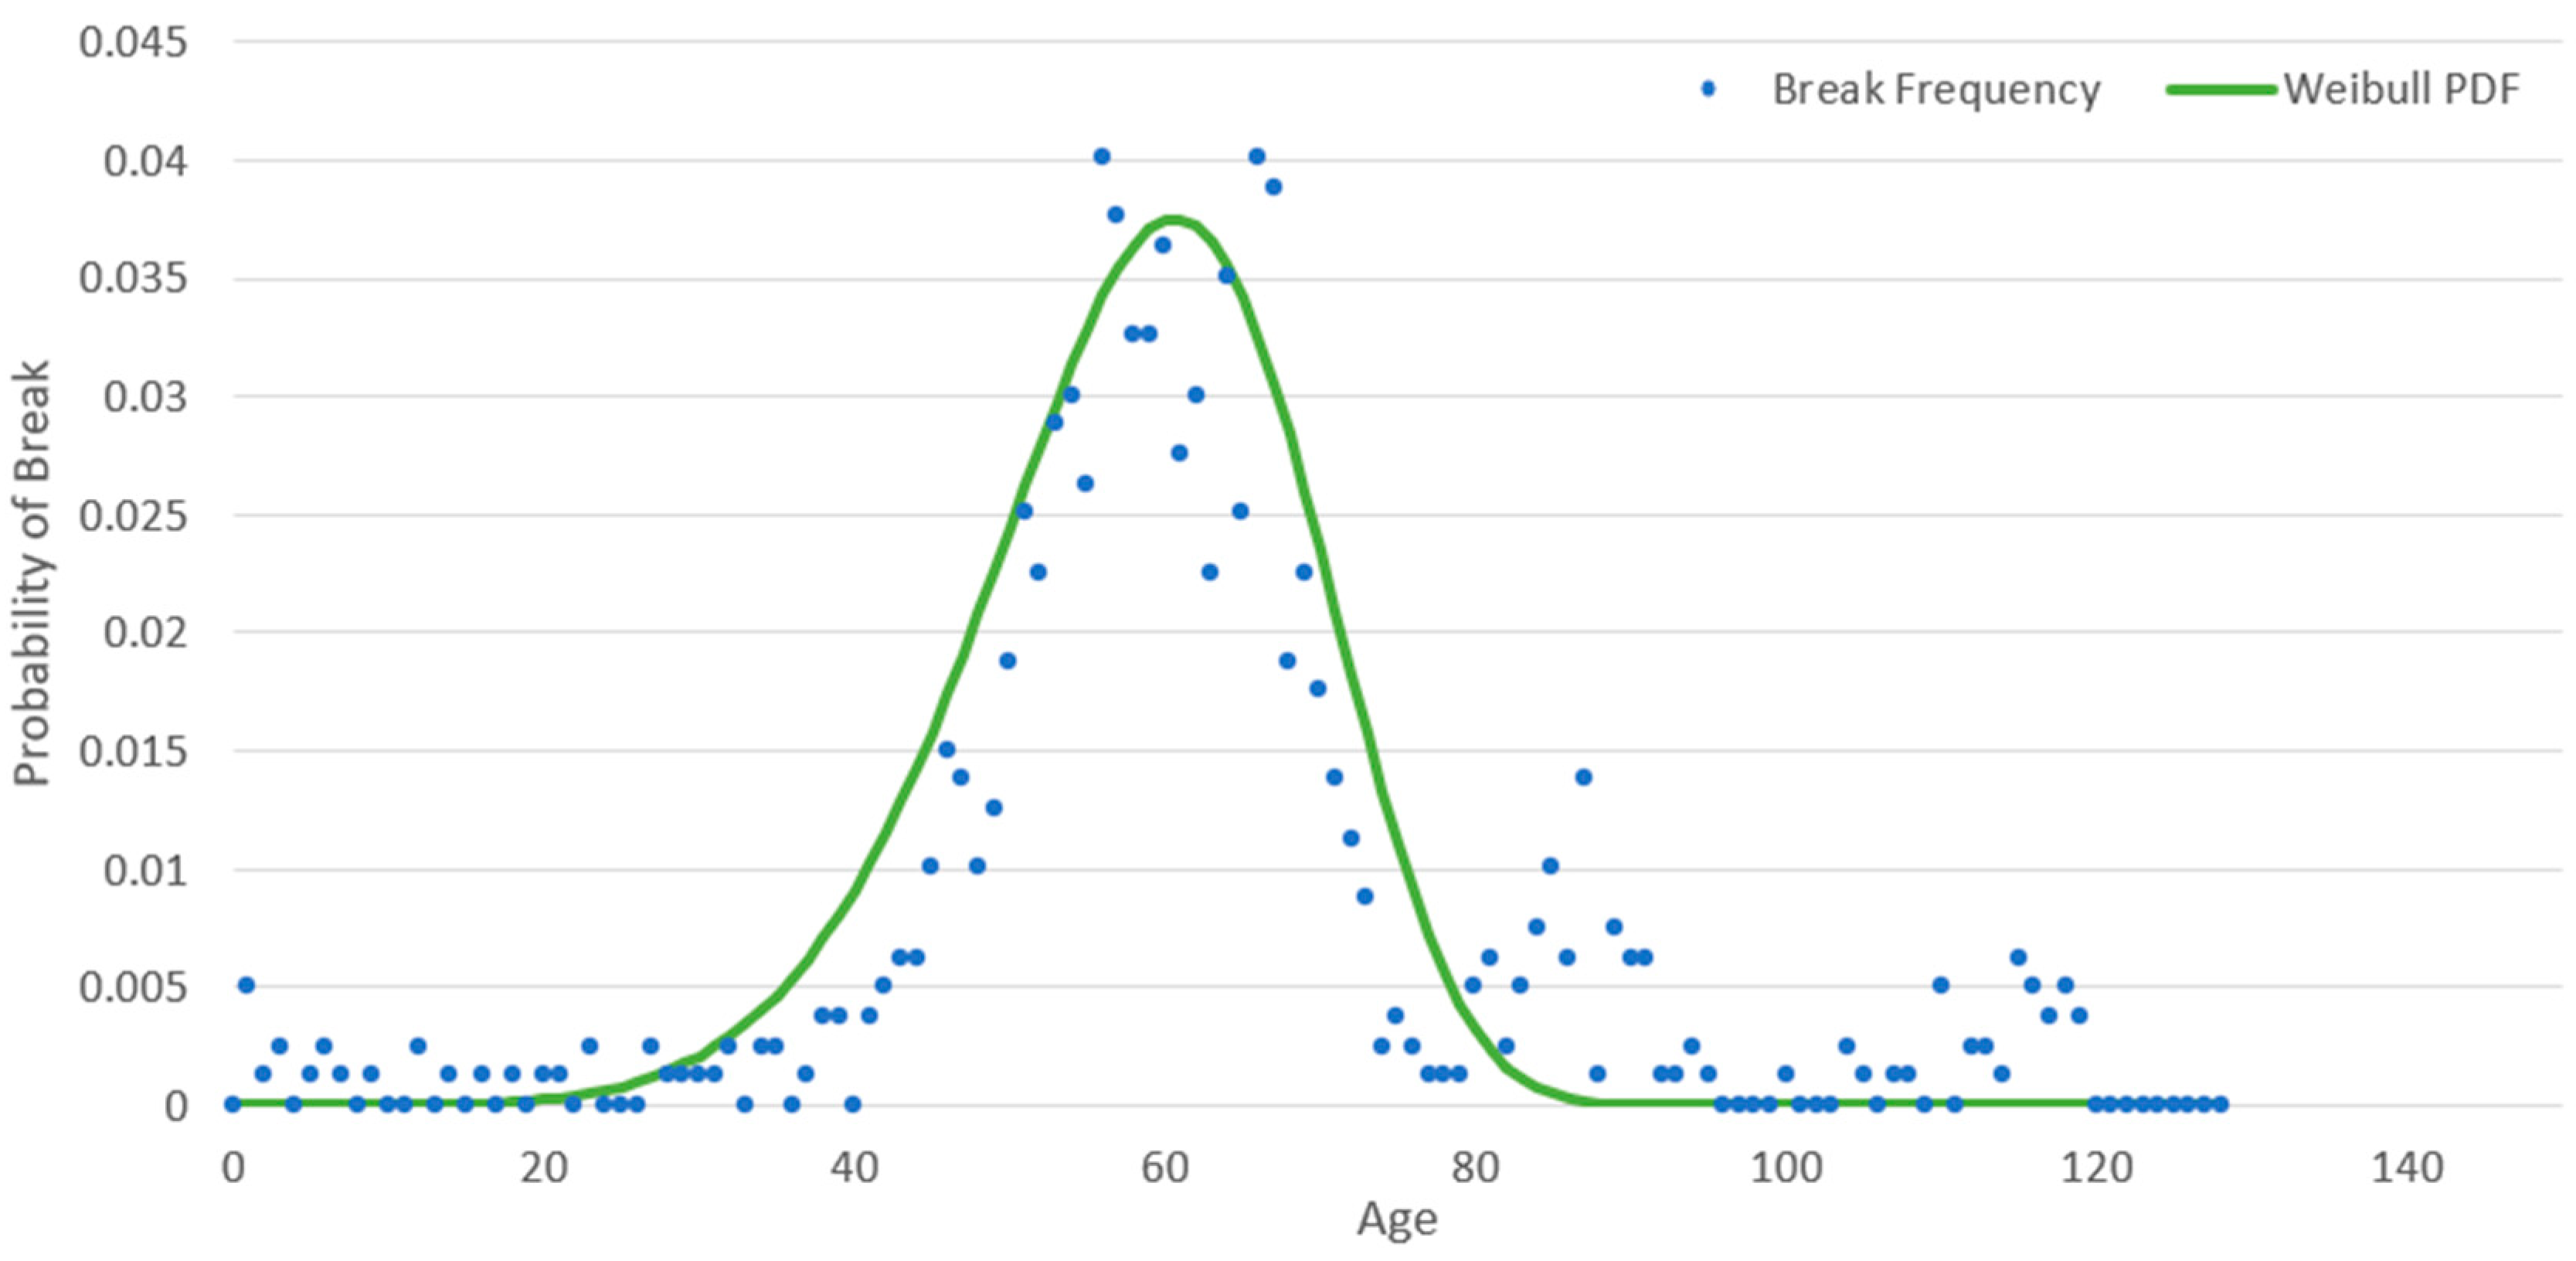
4.5. Results on Probability of Pipe Failure (POF)
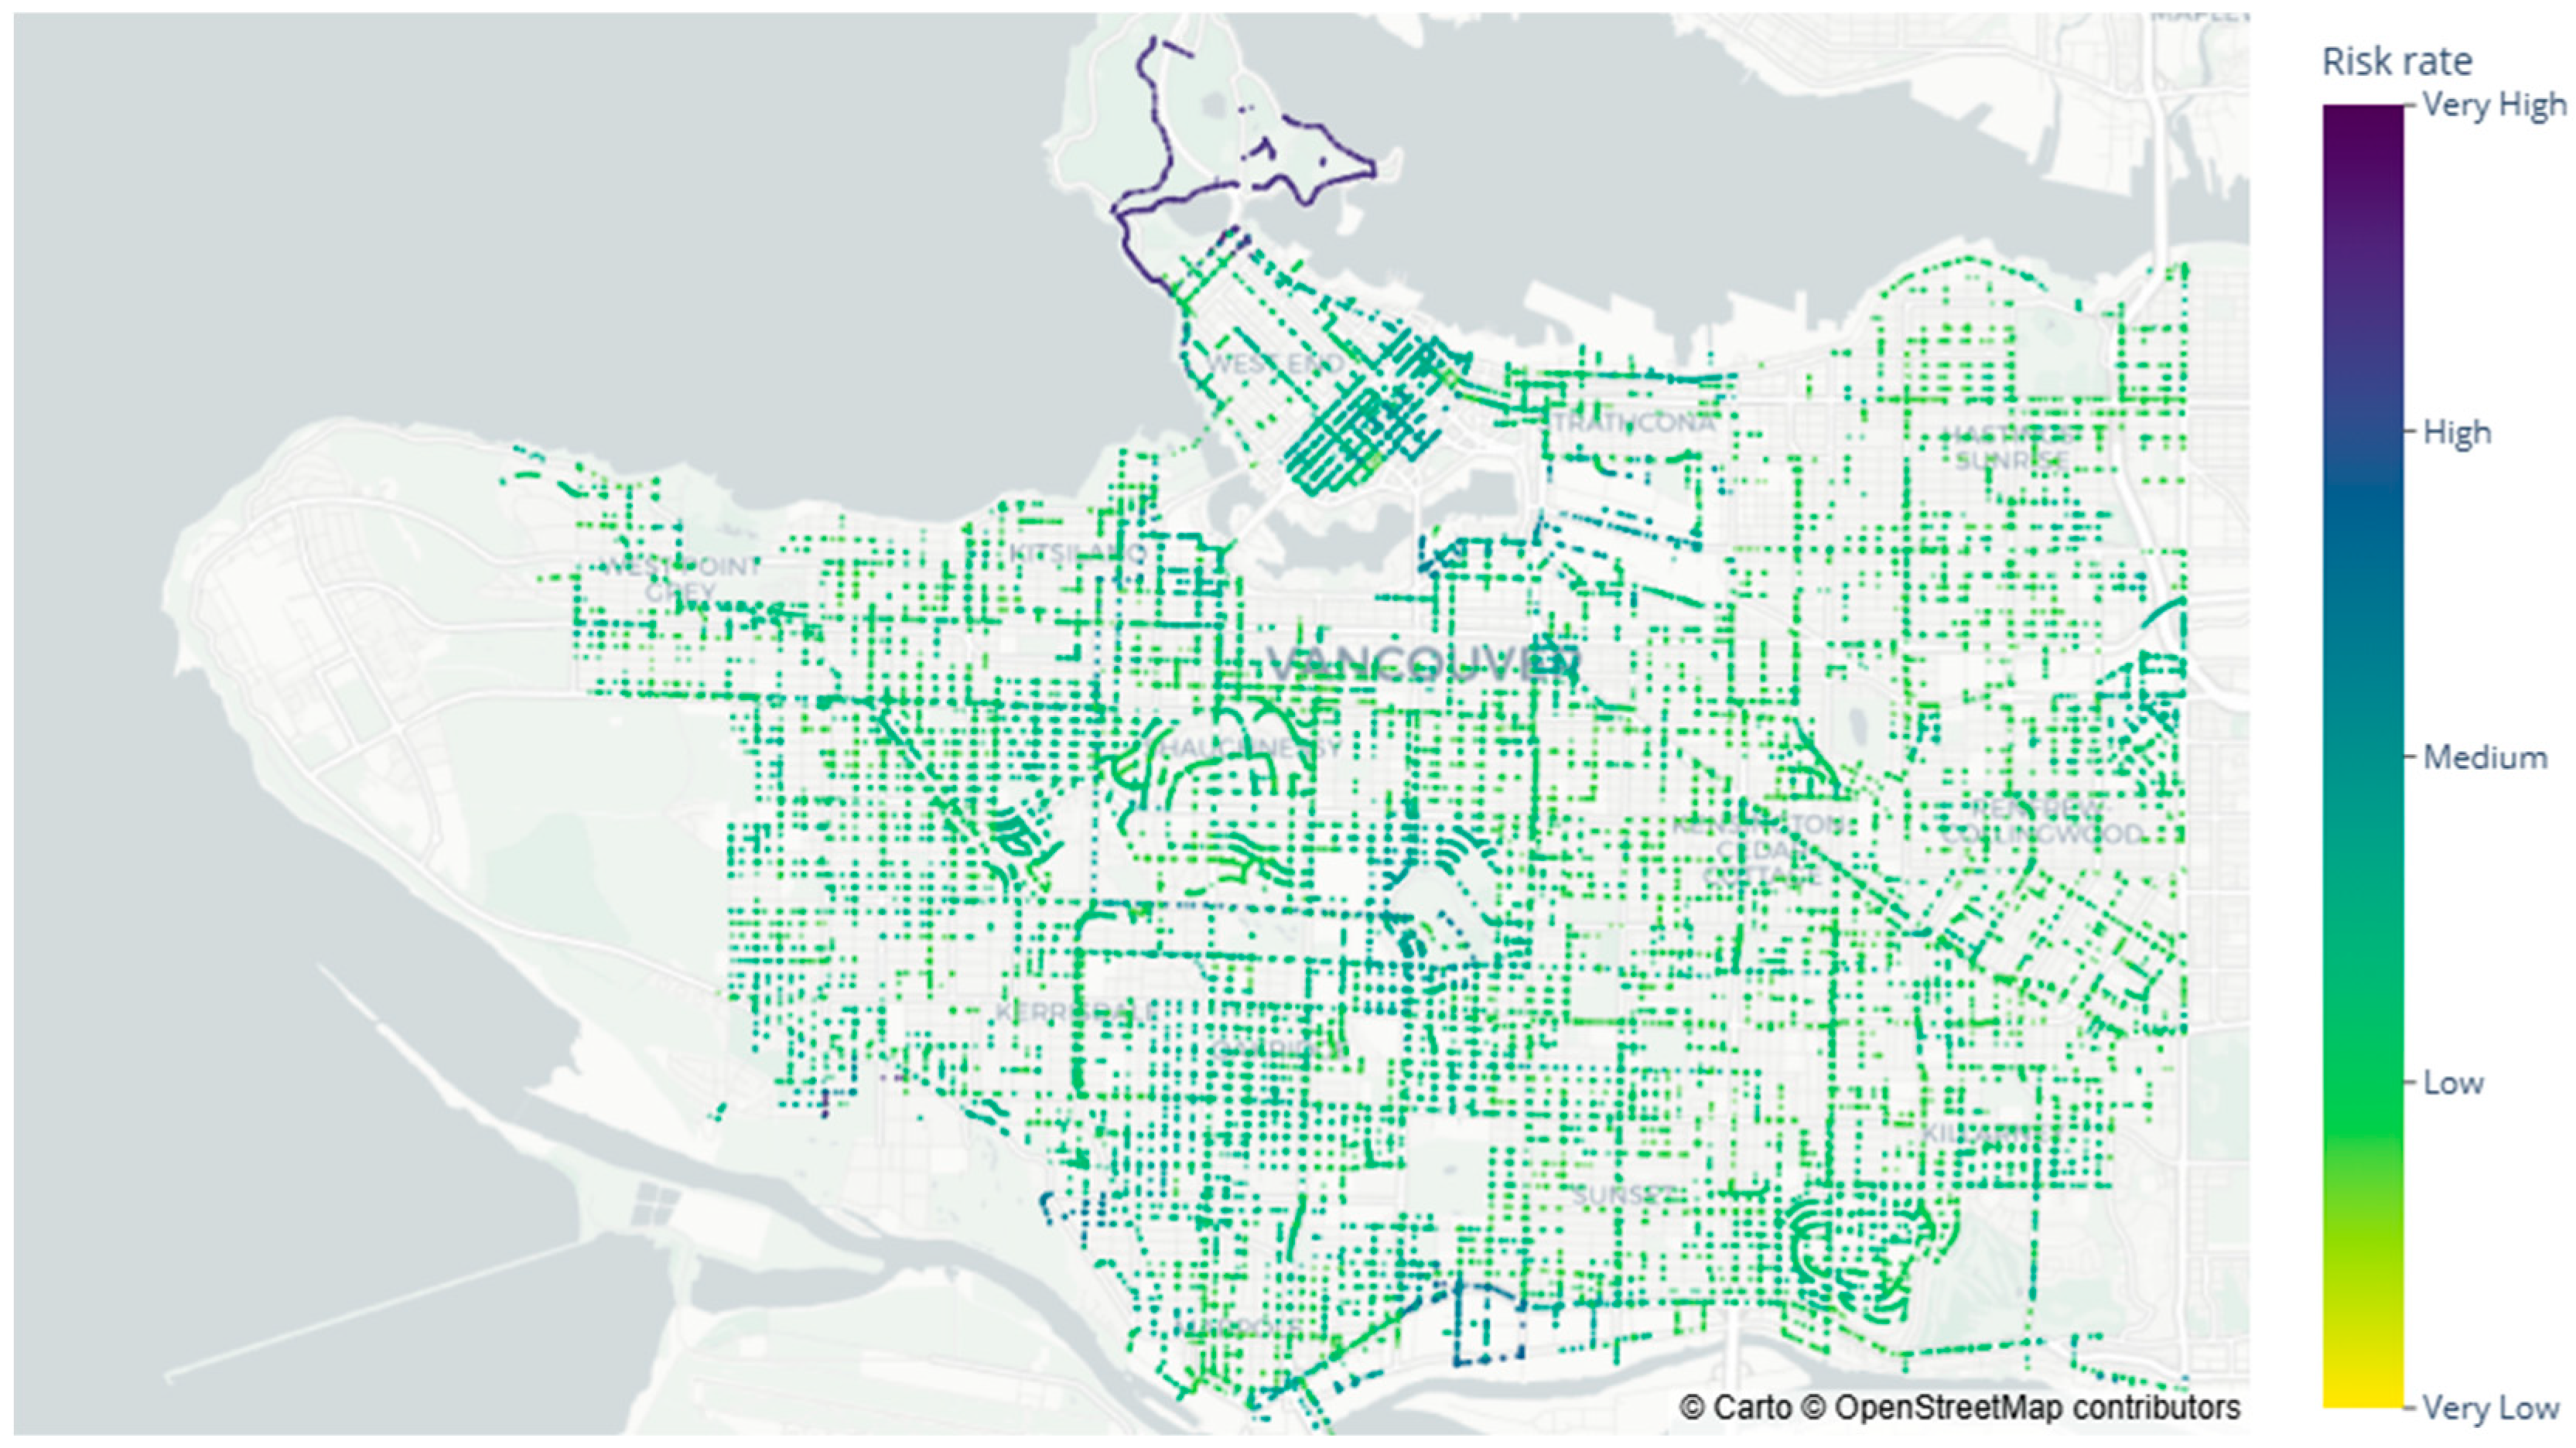
4.6. Results on Risk Assessment
5. Discussion
6. Conclusions
Author Contributions
Funding
Data Availability Statement
Acknowledgments
Conflicts of Interest
References
- Quitana, G.; Molinos-Senante, M.; Chamorro, A. Resilience of Critical Infrastructure to Natural Hazards: A Review Focused on Drinking Water Systems; Elsevier Ltd.: Amsterdam, The Netherlands, 2020. [Google Scholar] [CrossRef]
- Dianat, H.; Wilkinson, S.; Williams, P.; Khatibi, H. Choosing a holistic urban resilience assessment tool. Int. J. Disaster Risk Reduct. 2022, 71, 102789. [Google Scholar] [CrossRef]
- Cutter, S.L.; Boruff, B.J.; Shirley, W.L. Social vulnerability to environmental hazards. Soc. Sci. Q. 2003, 84, 242–261. [Google Scholar] [CrossRef]
- Lawal, O.; Arokoyu, S.B. Modelling social vulnerability in sub-Saharan West Africa using a geographical information system. Jamba J. Disaster Risk Stud. 2015, 7, 155. [Google Scholar] [CrossRef]
- Wakhungu, M.J.; Abdel-Mottaleb, N.; Wells, E.C.; Zhang, Q. Geospatial Vulnerability Framework for Identifying Water Infrastructure Inequalities. J. Environ. Eng. 2021, 147, 04021034. [Google Scholar] [CrossRef]
- Bjarnadottir, S.; Li, Y.; Stewart, M.G. Social vulnerability index for coastal communities at risk to hurricane hazard and a changing climate. Nat. Hazards 2011, 59, 1055–1075. [Google Scholar] [CrossRef]
- Zhang, N.; Huang, H. Social vulnerability for public safety: A case study of Beijing, China. Chin. Sci. Bull. 2013, 58, 2387–2394. [Google Scholar] [CrossRef]
- Turner, B.L.; Kasperson, R.E.; Matson, P.A.; McCarthy, J.J.; Corell, R.W.; Christensen, L.; Eckley, N.; Kasperson, J.X.; Luers, A.; Martello, M.L.; et al. A framework for vulnerability analysis in sustainability science. Proc. Natl. Acad. Sci. USA 2003, 100, 8074–8079. [Google Scholar] [CrossRef] [PubMed]
- Wisner, B.; Blaikie, P.M.; Cannon, T.; Davis, I. At Risk: Natural Hazards, People’s Vulnerability and Disaster; Routledge: New York, NY, USA, 2004. [Google Scholar]
- Frigerio, I.; De Amicis, M. Mapping social vulnerability to natural hazards in Italy: A suitable tool for risk mitigation strategies. Environ. Sci. Policy 2016, 63, 187–196. [Google Scholar] [CrossRef]
- Collins, T.W.; Grineski, S.E.; de Lourdes Romo Aguilar, M. Vulnerability to environmental hazards in the Ciudad Juárez (Mexico)-El Paso (USA) metropolis: A model for spatial risk assessment in transnational context. Appl. Geogr. 2009, 29, 448–461. [Google Scholar] [CrossRef]
- Freitas, C.R.; D’avignon, A.L.d.A.; Castro, A.C. Urban social vulnerability and climate change in Rio de Janeiro city associated with population mobility. J. Environ. Policy Plan. 2019, 21, 797–810. [Google Scholar] [CrossRef]
- Peng, Y. Regional earthquake vulnerability assessment using a combination of MCDM methods. Ann. Oper. Res. 2012, 234, 95–110. [Google Scholar] [CrossRef]
- Fekete, A. Validation of a social vulnerability index in context to river-floods in Germany. Nat. Hazards Earth Syst. Sci. 2009, 9, 393–403. [Google Scholar] [CrossRef]
- Flanagan, B.E.; Gregory, E.W.; Hallisey, E.J.; Heitgerd, J.L.; Lewis, B. A Social Vulnerability Index for Disaster Management. J. Homel. Secur. Emerg. Manag. 2011, 8, 3. [Google Scholar] [CrossRef]
- Chakraborty, L.; Rus, H.; Henstra, D.; Thistlethwaite, J.; Scott, D. A place-based socioeconomic status index: Measuring social vulnerability to flood hazards in the context of environmental justice. Int. J. Disaster Risk Reduct. 2019, 43, 101394. [Google Scholar] [CrossRef]
- Chakraborty, L.; Thistlethwaite, J.; Minano, A.; Henstra, D. Leveraging Hazard, Exposure, and Social Vulnerability Data to Assess Flood Risk to Indigenous Communities in Canada. Int. J. Disaster Risk Sci. 2021, 12, 821–838. [Google Scholar] [CrossRef]
- Goto, E.A.; Suarez, A.M.; Ye, H. Spatial analysis of social vulnerability in São Paulo city, Brazil. Appl. Geogr. 2022, 140, 102653. [Google Scholar] [CrossRef]
- Ingle, K.; Chattopadhyay, S. A Place-based Approach to Assess the Vulnerability of Communities to Urban Floods: Case of Nagpur, India. Int. J. Disaster Risk Reduct. 2022, 75, 102933. [Google Scholar] [CrossRef]
- Mahdi, A.; Pourahmad, A.; Zarghamfard, M.; Qasemi, S. Analysis of urban health from a social capital perspective in Iranian religious cities: Qom. Spat. Inf. Res. 2016, 24, 689–699. [Google Scholar] [CrossRef]
- Dziedzic, R.; Schmitt, K. Social Vulnerability in the Context of Water Infrastructure Management. In Proceedings of the IEEE International Symposium on Technology and Society, Hong Kong, 10–12 November 2022. [Google Scholar] [CrossRef]
- World Health Organization. WHO Supports Consolidated Appeal for Humanitarian Funds. Available online: https://www.who.int/director-general/speeches/detail/who-supports-consolidated-appeal-for-humanitarian-funds# (accessed on 3 September 2023).
- D’Angelo, N. An aging infrastructure: Policy recommendations to modernize aging water distribution networks to protect human health. In Proceedings of the 2016 AIChE Annual Meeting, San Francisco, CA, USA, 13–18 November 2016; Volume 14. Available online: www.wise-intern.org (accessed on 1 May 2023).
- Creaco, E.; Franchini, M.; Walski, T. Network design through the phasing of construction approach. In Procedia Engineering; Elsevier Ltd.: Amsterdam, The Netherlands, 2014; pp. 823–830. [Google Scholar] [CrossRef][Green Version]
- Wang, Y.; Zayed, T.; Moselhi, O. Prediction Models for Annual Break Rates of Water Mains. J. Perform. Constr. Facil. 2009, 23, 47–54. [Google Scholar] [CrossRef]
- Dawood, T.; Elwakil, E.; Novoa, H.M.; Delgado, J.F.G. Water pipe failure prediction and risk models: State-of-the-art review. Can. J. Civ. Eng. 2020, 47, 1117–1127. [Google Scholar] [CrossRef]
- Alvisi, S.; Franchini, M. Multiobjective Optimization of Rehabilitation and Leakage Detection Scheduling in Water Distribution Systems. J. Water Resour. Plan. Manag. 2009, 135, 426–439. [Google Scholar] [CrossRef]
- Roshani, E.; Filion, Y.R. Water Distribution System Rehabilitation under Climate Change Mitigation Scenarios in Canada. J. Water Resour. Plan. Manag. 2015, 141, 04014066. [Google Scholar] [CrossRef]
- Creaco, E.; Franchini, M.; Alvisi, S. Evaluating Water Demand Shortfalls in Segment Analysis. Water Resour. Manag. 2012, 26, 2301–2321. [Google Scholar] [CrossRef]
- Kanta, L.; Brumbelow, K. Vulnerability, Risk, and Mitigation Assessment of Water Distribution Systems for Insufficient Fire Flows. J. Water Resour. Plan. Manag. 2013, 139, 593–603. [Google Scholar] [CrossRef]
- Hernandez, E.H.; Ormsbee, L. Segment Identification Procedure for Water Distribution Systems. J. Water Resour. Plan. Manag. 2021, 147, 04021013. [Google Scholar] [CrossRef]
- Giustolisi, O.; Berardi, L. Prioritizing Pipe Replacement: From Multiobjective Genetic Algorithms to Operational Decision Support. J. Water Resour. Plan. Manag. 2009, 135, 484–492. [Google Scholar] [CrossRef]
- Rahmani, F.; Behzadian, K.; Ardeshir, A. Rehabilitation of a Water Distribution System Using Sequential Multiobjective Optimization Models. J. Water Resou.r Plan. Manag. 2016, 142, 1–7. [Google Scholar] [CrossRef]
- Klima, K.; Kong, W.; El Gammal, L.; Prosdocimi, D. Creating a water risk index to improve community resilience. IBM J. Res. Dev. 2020, 64, 16:1–16:11. [Google Scholar] [CrossRef]
- Statistics Canada, Profile table, Census Profile, 2021 Census of Population—Vancouver, City (CY) [Census Subdivision], British Columbia. Available online: https://www12.statcan.gc.ca/census-recensement/2021/dp-pd/prof/details/page.cfm?Lang=E&GENDERlist=1,2,3&STATISTIClist=1&HEADERlist=0&DGUIDlist=2021A00055915022&SearchText=vancouver (accessed on 3 September 2023).
- City of Vancouver, Water, Sewer, and Neighbourhood Energy Systems|City of Vancouver. Available online: https://vancouver.ca/home-property-development/water-and-sewer.aspx (accessed on 3 September 2023).
- Statistics Canada, Census Profile Downloads. 2021. Available online: https://www12.statcan.gc.ca/census-recensement/2021/dp-pd/prof/details/download-telecharger.cfm?Lang=E (accessed on 3 September 2023).
- City of Vancouver, Explore—City of Vancouver Open Data Portal. Available online: https://opendata.vancouver.ca/explore/ (accessed on 3 September 2023).
- City of Vancouver, Water Distribution mains—City of Vancouver Open Data Portal. Available online: https://opendata.vancouver.ca/explore/dataset/water-distribution-mains/export/ (accessed on 3 September 2023).
- City of Vancouver, Design Guidelines and Construction Standards|City of Vancouver. Available online: https://vancouver.ca/streets-transportation/street-design-construction-resources.aspx (accessed on 3 September 2023).
- RSMeans, Heavy Construction Costs, Kingston, MA: Means Kingston, MA: R.S. Means Co. Norwell, MA: RSMeans 1st Annual ed. (1987)–Ceased with 30th ed. 2016. Available online: https://www.rsmeansonline.com/ (accessed on 3 September 2023).
- Sinaei, A.; Dziedzic, R.; Creaco, E. Holistic Risk Assessment of Water Distribution Systems [Computer Software]. 2023. Available online: https://github.com/UrbanLinks/Holistic-WDS-Risk (accessed on 1 May 2023).
- Karakoc, D.B.; Barker, K.; Zobel, C.W.; Almoghathawi, Y. Social vulnerability and equity perspectives on interdependent infrastructure network component importance. Sustain. Cities Soc. 2020, 57, 102072. [Google Scholar] [CrossRef]
- Mendes, J.M.; Tavares, A.O.; Santos, P.P. Social vulnerability and local level assessments: A new approach for planning. Int. J. Disaster Resil. Built Environ. 2019, 11, 15–43. [Google Scholar] [CrossRef]
- Doll, C.; Polyakov, M.; Pannell, D.J.; Burton, M.P. Rethinking urban park irrigation under climate change. J. Environ. Manag. 2022, 314, 115012. [Google Scholar] [CrossRef] [PubMed]
- Nga, P.H.; Takara, K.; Van, N.C. Integrated approach to analyze the total flood risk for agriculture: The significance of intangible damages—A case study in Central Vietnam. Int. J. Disaster Risk Reduct. 2018, 31, 862–872. [Google Scholar] [CrossRef]
- Walski, T.M.; Pelliccia, A. Economic analysis of water main breaks. J. AWWA 1982, 74, 140–147. [Google Scholar] [CrossRef]
- Marlim, M.S.; Jeong, G.; Kang, D. Identification of critical pipes using a criticality index in water distribution networks. Appl. Sci. 2019, 9, 4052. [Google Scholar] [CrossRef]
- Elshaboury, N.; Attia, T.; Marzouk, M. Application of Evolutionary Optimization Algorithms for Rehabilitation of Water Distribution Networks. J. Constr. Eng. Manag. 2020, 146, 04020069. [Google Scholar] [CrossRef]
- Ramírez, R.; Cobacho, R.; Torres, D.; López-Jiménez, P.A. Implementación de un modelo de predicción de fallos orientado a la gestión y estrategias de mantenimiento en redes de distribución de agua potable. Ing. Del Agua 2019, 23, 247–258. [Google Scholar] [CrossRef]
- Rahman, S.; Devera, J.; Reynolds, J. Risk assessment model for pipe rehabilitation and replacement in a water distribution system, Pipelines 2014: From Underground to the Forefront of Innovation and Sustainability. In Proceedings of the Pipelines 2014 Conference, Portland, OR, USA, 3–6 August 2014; pp. 1997–2006. [Google Scholar] [CrossRef]
- Raspati, G.S.; Bruaset, S.; Bosco, C.; Mushom, L.; Johannessen, B.; Ugarelli, R. A Risk-Based Approach in Rehabilitation of Water Distribution Networks. Int. J. Environ. Res. Public Health 2022, 19, 1594. [Google Scholar] [CrossRef] [PubMed]
- Bucherie, A.; Hultquist, C.; Adamo, S.; Neely, C.; Ayala, F.; Bazo, J.; Kruczkiewicz, A. A comparison of social vulnerability indices specific to flooding in Ecuador: Principal component analysis (PCA) and expert knowledge. Int. J. Disaster Risk Reduct. 2022, 73, 102897. [Google Scholar] [CrossRef]

| SVI Indicator | Variable | Previous Studies |
|---|---|---|
| Sensitive population | Under 5 years | [4,5,10,16,17,18,43] |
| 5 to 14 years | ||
| 65 years and over | [4,5,10,16,17,18,34,43] | |
| Household/Quality of life/Education | No certificate, diploma, or degree | [16,17] |
| Postsecondary certificate, diploma, or degree | [10,14,16,17] | |
| No high school diploma or equivalency certificate | [5,15] | |
| Renter | [5,14,18,34] | |
| One-maintainer household | [14] | |
| Between 7 a.m. to 7:59 a.m. | [5,10] | |
| Ethnic and Racial Demographics | African American | [6,18,43] |
| South Asian | [6,16,17,18,43] | |
| Black | [16,17] | |
| Chinese | [16,17] | |
| Filipino | [16,17] | |
| Caucasian (White) | [16,17,18] | |
| Total visible minority population | [4,5,7,15] | |
| Indigenous identity | [16,17,18] | |
| Non-Official languages | [16,17] | |
| Socioeconomic Well-being Index | Average total income of household in 2020 ($) | [3,7,14,15,16,17,18] |
| Spending 30% or more of income on shelter costs | [16,17] | |
| Government transfer (%) | [16,17] | |
| Median value of dwellings ($) | [16,17] | |
| Average total income in 2020 among recipients ($) | [3,7,14,15,16,17] | |
| Unemployed | [6,7,14,15,16,17,34] | |
| Female labour force participation | [10,14,16,17] | |
| Female employed | [14] | |
| Male Not in the labour force | [16,17] | |
| All occupations | [16,17] | |
| Housing and Mobility Profile | Period of home construction (2000 and before) | [16,17] |
| No private vehicle/Public transit | [15,16,17] | |
| Movers | [3,15] | |
| Average number of rooms per dwelling | [16,17] | |
| House with major repair | [16,17] |
| Variable | Description |
|---|---|
| Under 5 years | Children aged under 5 years |
| 5 to 14 years | Children aged between 5 to 14 |
| 65 years and over | Population aged 65 and over |
| No certificate, diploma, or degree | The population aged 15 years and over in private households without certificate, diploma or degree |
| Postsecondary certificate, diploma, or degree | The population aged 15 years and over in private households with postsecondary, certificate, diploma or degree |
| No high school diploma or equivalency certificate | The population aged 15 years and over in private households with no high school diploma or equivalency certificate |
| Renter | Private households that do not own the property and pay rent to the landlord |
| One-maintainer household | Private households where only one person is responsible for maintaining or supporting the household |
| Between 7 a.m. to 7:59 a.m. | Time leaving for work for the employed labour force aged 15 years and over |
| African American | African American ethnic or cultural origin in private households |
| South Asian | South Asian ethnic or cultural origin in private households |
| Black | Black ethnic or cultural origin in private households |
| Chinese | Chinese ethnic or cultural origin in private households |
| Filipino | Filipino ethnic or cultural origin in private households |
| Caucasian (White) | Caucasian (White) ethnic or cultural origin in private households |
| Total visible minority population | Visible minority for the population in private households |
| Indigenous identity | Population in private households affiliated with native communities |
| Non-Official languages | Population who conducts a conversation in a language other than English or French |
| Average total income of household in 2020 ($) | Average income for private households |
| Spending 30% or more of income on shelter costs | Households spending over 30% of their income on shelter costs |
| Government transfer (%) | All cash benefits received from federal, provincial, territorial or municipal governments |
| Median value of dwellings ($) | Dollar amount expected by the owner if the asset were to be sold |
| Average total income in 2020 among recipients ($) | Average total income in 2020 for the population aged 15 years and over |
| Unemployed | Includes unemployed persons aged 15 years and over who have never worked for pay or in self-employment |
| Female labour force participation | Females aged 15 or above who participate in the labour force |
| Female employed | Females aged 15 or above employed |
| Male Not in the labour force | Males aged 15 or above not in the labour force |
| All occupations | All persons aged 15 years and over in the labour force in all occupations |
| Period of home construction (2000 and before) | Private dwellings constructed between 2000 and before |
| No private vehicle/Public transit | The main form of transport for employed workers aged 15 and over |
| Movers | Persons who have moved from one residence to another within the last year |
| Average number of rooms per dwelling | Number of rooms per occupied dwelling |
| House with major repair | Occupied private dwellings that need major repairs |
| Variable | Principal Component | ||||||||||||||
|---|---|---|---|---|---|---|---|---|---|---|---|---|---|---|---|
| PC 1 | PC 2 | PC 3 | PC 4 | PC 5 | PC 6 | PC 7 | PC 8 | PC 9 | PC 10 | PC 11 | PC 12 | PC 13 | PC 14 | PC 15 | |
| FE 1 | 0.43 | ||||||||||||||
| UE 2 | −0.84 | ||||||||||||||
| FTF 3 | −0.96 | ||||||||||||||
| AA 4 | 0.97 | ||||||||||||||
| AO 5 | −0.43 | 0.40 | |||||||||||||
| ATIH 6 | −0.67 | ||||||||||||||
| BSS 7 | −0.97 | ||||||||||||||
| BL 8 | −0.98 | ||||||||||||||
| CA 9 | −0.88 | ||||||||||||||
| CH 10 | 0.32 | ||||||||||||||
| FI 11 | −0.58 | ||||||||||||||
| GT 12 | −0.36 | −0.33 | |||||||||||||
| II 13 | −0.45 | 0.40 | |||||||||||||
| HMR 14 | −0.45 | 0.32 | 0.35 | ||||||||||||
| MVD 15 | −0.84 | ||||||||||||||
| MO 16 | |||||||||||||||
| NCD 17 | −0.46 | ||||||||||||||
| MNL 18* | −0.44 | ||||||||||||||
| OMH 19 | 0.53 | ||||||||||||||
| PDD 20 | 0.42 | ||||||||||||||
| PT 21 | −0.53 | ||||||||||||||
| RE 22 | 0.46 | ||||||||||||||
| SA 23 | −0.99 | ||||||||||||||
| SIS 24 | 0.37 | −0.43 | |||||||||||||
| TVMP 25 | 0.32 | ||||||||||||||
| UF 26 | −0.98 | ||||||||||||||
| ANRD 27 | −0.51 | ||||||||||||||
| PHC 28 | −0.63 | ||||||||||||||
| SFO 29 | −0.52 | ||||||||||||||
| Risk Rank | Neighbourhood | Pipe Length (m) | AGE | Diameter (mm) | SVI | EVI | ECI | POF (%) | COF | Risk (%) |
|---|---|---|---|---|---|---|---|---|---|---|
| 1 | West End | 54.48 | 84 | 1500 | 47.51 | 99.44 | 27.97 | 99.85 | 78.64 | 100 |
| 2 | Dunbar-Southlands | 38.13 | 92 | 200 | 52.09 | 100 | 0.68 | 100 | 68.69 | 87.48 |
| 3 | Downtown | 111.79 | 85 | 300 | 47.51 | 99.44 | 3.77 | 99.91 | 67.76 | 86.22 |
| 4 | Kerrisdale | 120 | 77 | 150 | 52.09 | 100 | 1.51 | 97.65 | 69.06 | 85.88 |
| 5 | Stanley Park | 120 | 93 | 150 | 47.51 | 99.44 | 1.51 | 100 | 66.75 | 85.01 |
| 6 | Downtown | 20.19 | 85 | 300 | 47.51 | 99.44 | 0.68 | 99.91 | 66.37 | 84.45 |
| 7 | West End | 7.74 | 73 | 300 | 47.51 | 99.44 | 0.26 | 93.18 | 66.19 | 78.55 |
| 8 | Marpole | 63.99 | 93 | 150 | 76.49 | 45.7 | 1.51 | 100 | 55.62 | 70.83 |
| 9 | Mount Pleasant | 64 | 81 | 300 | 81.67 | 23.42 | 2.16 | 99.42 | 48.22 | 61.05 |
| 10 | Riley Park | 120 | 96 | 800 | 74.27 | 12.42 | 18.35 | 100 | 47.23 | 60.15 |
Disclaimer/Publisher’s Note: The statements, opinions and data contained in all publications are solely those of the individual author(s) and contributor(s) and not of MDPI and/or the editor(s). MDPI and/or the editor(s) disclaim responsibility for any injury to people or property resulting from any ideas, methods, instructions or products referred to in the content. |
© 2025 by the authors. Licensee MDPI, Basel, Switzerland. This article is an open access article distributed under the terms and conditions of the Creative Commons Attribution (CC BY) license (https://creativecommons.org/licenses/by/4.0/).
Share and Cite
Sinaei, A.; Dziedzic, R.; Creaco, E. Holistic Assessment of Social, Environmental and Economic Impacts of Pipe Breaks: The Case Study of Vancouver. Water 2025, 17, 252. https://doi.org/10.3390/w17020252
Sinaei A, Dziedzic R, Creaco E. Holistic Assessment of Social, Environmental and Economic Impacts of Pipe Breaks: The Case Study of Vancouver. Water. 2025; 17(2):252. https://doi.org/10.3390/w17020252
Chicago/Turabian StyleSinaei, Armine, Rebecca Dziedzic, and Enrico Creaco. 2025. "Holistic Assessment of Social, Environmental and Economic Impacts of Pipe Breaks: The Case Study of Vancouver" Water 17, no. 2: 252. https://doi.org/10.3390/w17020252
APA StyleSinaei, A., Dziedzic, R., & Creaco, E. (2025). Holistic Assessment of Social, Environmental and Economic Impacts of Pipe Breaks: The Case Study of Vancouver. Water, 17(2), 252. https://doi.org/10.3390/w17020252


