Article

The Differences in Water Consumption Between Pinus and Salix in the Mu Us Sandy Land, a Semiarid Region of Northwestern China

1
State Key Laboratory of Water Resource Protection and Utilization in Coal Mining, Beijing 102211, China
2
School of Land Engineering, Chang’an University, Xi’an 710054, China
3
Key Laboratory of Subsurface Hydrology and Ecological Effects in Arid Region, Ministry of Education, Xi’an 710054, China
4
National Institute of Clean-and-Low-Carbon Energy, Beijing 102211, China
*
Author to whom correspondence should be addressed.
Water 2025, 17(19), 2895; https://doi.org/10.3390/w17192895
Submission received: 25 August 2025 / Revised: 23 September 2025 / Accepted: 1 October 2025 / Published: 6 October 2025

Abstract

The water consumption processes of vegetation play an important role in water resource management in semiarid regions, while the difference in water consumption between native and exotic species is unclear. In this study, the exotic Pinus sylvestris L. var. mongholica Litv. (Pinus) and the native Salix psammophila (Salix) in Mu Us Sandy Land were selected as the research objects, and their water consumption characteristics were studied via in situ experiment and stable isotopes (δ2H and δ18O). Results revealed that vegetation water consumption caused spatial variation in soil moisture, allowing the soil profile to be divided into active, stable, capillary support and saturated zones. Pinus primarily used water from the active and stable zones, whereas Salix relied more on the capillary support and saturated zones. Water consumption patterns also varied seasonally, for example, at the beginning of growth (May–June), Salix and Pinus mainly use shallow soil water and begin to use deep soil water and groundwater with growth. During July–September, they absorb soil water mainly in the active zone and stable zone. Both Salix and Pinus can freely switch water sources between deep and shallow layers according to water demand. The seasonal fluctuations in precipitation and groundwater level were the main factors driving the seasonal changes in the water consumption of the two vegetation types. Pinus has better strategies to adapt to droughts than Salix, but its water consumption is higher than that of Salix. Therefore, proper management is needed to control the reasonable density of Pinus plantation to balance the water consumption of vegetation and groundwater recharge. The results can provide a scientific basis for the reasonable vegetation reconstruction in the Mu Us Sandy Land.

1. Introduction

In semiarid regions of northwestern China, large-scale vegetation restoration through afforestation has been widely implemented to combat desertification, conserve water and soil, and enhance carbon sequestration [1,2,3,4]. However, the sustainability of these efforts is critically constrained by water availability, which is a major limiting factor in arid and semiarid ecosystems [5]. Numerous afforestation projects have proven to be costly and ineffective, often due to the selection of inappropriate tree species, leading to unintended consequences such as soil desiccation, environmental degradation, and large-scale vegetation mortality [6]. A key issue is that exotic, introduced species often exhibit higher water consumption than native vegetation, creating a significant imbalance between water supply and demand. Although research on the hydrological impact of afforestation continues to evolve, a clear scientific consensus on the differences between exotic and native species is lacking, with scholars holding divergent views [4,7]. Against the backdrop of increasing climate variability, a comprehensive understanding of how different vegetation types modulate hydrological processes is essential for designing sustainable restoration strategies in water-limited regions [8].
The ecohydrological consequences of large-scale afforestation on degraded land remain inadequately studied, and several potential risks have been identified [9]. First, the spatial heterogeneity of wetting and drying patterns across China means that many existing and planned vegetation restoration projects are vulnerable to failure, particularly in areas with scarce surface and groundwater resources [10]. Second, soil desiccation has emerged as a severe problem, resulting from the excessive depletion of deep soil water combined with insufficient precipitation to enable recharge [11]. Multiple studies confirm that afforestation often reduces soil water storage, and in arid zones, deep soil water is rarely replenished by rainfall [12,13]. Consequently, tree survival rates are notoriously low—averaging around 30% and dropping to as low as 10% in some areas—with surviving trees experiencing stunted growth due to water scarcity [14,15,16]. Third, afforestation can reduce basin-scale water yield [9], intensifying interspecies competition. Introduced trees and shrubs often consume large quantities of water through evaporation, lowering water tables and making it difficult for native herbaceous species to survive [17,18]. Fourth, large-scale tree planting may exacerbate environmental problems such as increased evapotranspiration and soil erosion [16]. In some cases, artificial vegetation has degraded so severely that desertification has re-emerged in previously restored areas, with vegetation cover decreasing by 6.1% [19,20].
Water consumption of vegetation is a central process in the groundwater–soil–plant–atmosphere continuum and plays a decisive role in maintaining water balance in semiarid ecosystems [21]. Root water uptake (RWU) is the primary mechanism of vegetation water consumption [22,23] and involves complex dynamic adjustments to water availability [24,25]. For instance, vegetation may shift water sources between shallow and deep soil layers depending on soil water conditions [26] or reduce stomatal conductance to minimize transpirational water loss. RWU patterns vary significantly among species due to differences in water requirements, growth stages, soil water conditions, groundwater depth, and interactions among these factors [27,28,29]. Shallow-rooted herbs primarily use shallow soil water, while deep-rooted shrubs and trees can access deep soil water or groundwater. Many xerophytic species also possess dimorphic root systems that allow them to switch between water sources based on availability [30]. Soil water content is a particularly important driver of RWU dynamics in water-limited ecosystems. To cope with water stress, xerophytes can adjust their water uptake depth to balance supply and demand, often shifting to deeper water sources during dry periods to maintain growth and functionality [31,32,33,34]. Age and developmental stage also influence RWU patterns. For example, the younger shrubs mainly absorb water from shallow and middle soil, while older shrubs derive water mainly from permanent groundwater in the arid desert, northwest China [30]. Although the importance of RWU has been widely recognized, the understanding of RWU processes is still not systematic or perfect due to the spatiotemporal variability of RWU [35].
In recent years, stable isotopes of hydrogen and oxygen (δ2H and δ18O) have become powerful tools for tracing vegetation water sources, based on the principle that xylem water reflects the isotopic composition of the water sources being used [36]. This approach has been widely applied across ecosystems to quantify dynamic shifts in water use. For example, Zhao et al. [28] found that in the Loess Plateau, Salix psammophila (Salix) primarily used water from the 30–80 cm soil layer during the drought period, while Caragana korshinskii relied more on the 80–100 cm soil layer. Both species shifted to shallow soil water (0–30 cm) during wet periods. Using stable isotopes and the IsoSource model, Zhang et al. [37] explored the effects of different grain–soybean intercropping patterns on grain yield, RWU, and water-use efficiency in the rain farming area and effectively determined the seasonal variations in RWU patterns of corn and soybeans in the Loess Plateau. Song et al. [38] evaluated the applicability of isotope ratio infrared spectrometry and isotope ratio mass spectrometry in discerning the water sources of Stipa breviflora from a desert steppe and explored its RWU characteristics and water-use strategy. Li et al. [39] combined with the MixSIAR model through corrected δ2H to determine RWU patterns of the riparian tree of Salix babylonica, and found significantly different seasonal RWU patterns. These studies highlight that stable isotopes are increasingly used to unravel mechanisms of species coexistence and resource competition [40,41,42,43].
However, it was found that the exotic artificial species and the local native species exhibited different water consumption characteristics in the vegetation restoration events in arid regions. For example, Zhang et al. [44] reported that exotic Masson pine uses deep soil water extravagantly, maintaining high transpiration rates, while native Quercus acutissima employs a conservative strategy with efficient water acquisition and transport. Ma et al. [45] found that artificial forests exhibit lower drought resistance and resilience than natural forests, increasing their vulnerability under future climate scenarios. Chen et al. [46] showed that when soil water is restricted, mountain artificial forests mainly cope by improving the water-use efficiency of vegetation, while plain artificial forests mainly regulate by converting water sources. Deng et al. [3] found that exotic Pinus sylvestris var. mongholica (Pinus) in the Mu Us Sandy Land increases water consumption with the growth, eventually exceeding ecosystem carrying capacity, whereas native species are adapted to drought and use water sparingly. Currently, little is known about the differences in water-use patterns and driving factors between exotic artificial species and local native species. Understanding the impact of water consumption patterns of different species on soil water resources, as well as how afforestation species adjust their water consumption strategies, is crucial for guiding future afforestation activities to achieve sustainable development of vegetation ecology in arid areas [47,48].
The “Returning Farmland to Forest” project, one of China’s largest afforestation initiatives, aims to reduce soil erosion and improve vegetation cover in the northwest. In this program, Pinus (an exotic tree species) and Salix (a native shrub) have been widely planted for their perceived drought resistance and ecological benefits, contributing significantly to windbreaking and sand fixation [3,30]. However, since the 1990s, Pinus plantations have shown widespread decline, characterized by yellowing branches, poor growth, regeneration failure, and mortality [3,49], raising concerns about the suitability of exotic trees for sand stabilization. A pressing issue is that introduced species often consume excessive water, reducing regional water availability [13]. There is an urgent need to clarify plant–soil water interactions of typical vegetation to quantify water-use patterns and stress responses and inform restoration practices.
In the aeolian region of the Mu Us Sandy Land, water scarcity profoundly influences vegetation survival and growth, yet the water-use strategies and competitive interactions between exotic and native species remain poorly understood. Two representative species—the exotic Pinus and the native dominant Salix—were selected as research objects to address this knowledge gap in this study. Using a combination of in situ monitoring and stable isotope analysis (δ2H and δ18O), we systematically investigate the soil water evolution processes influenced by these species’ water consumption. The stable isotope approach allows us to quantitatively identify the proportional contributions of various water sources to plant uptake and to analyze seasonal shifts in water-use strategies. The specific objectives are to (1) determine and compare the RWU patterns of Pinus and Salix across different seasons; (2) clarify the interplay between their water consumption strategies and spatial–temporal changes in soil water content; and (3) elucidate the differences in their water acquisition mechanisms and ecological adaptations to arid conditions. The results are anticipated to provide deeper insights into plant–water relations in semiarid sandy ecosystems, reveal species-specific adaptive traits, and offer a scientific foundation for the selection and management of appropriate afforestation species in desertification-prone regions.

2. Study Area and Methods

2.1. Study Area

The Mu Us Sandy Land (37°20′~39°20′ N, 107°10′~111°30′ E), covering an area of approximately 4.22 × 10⁴ km2, is located mainly in the Inner Mongolia Autonomous Region in northwestern China (Figure 1a). Since the 1990s, a large-scale desert rehabilitation project has been implemented in this region to curb land degradation, increase vegetation coverage, and improve the overall ecosystem. The study area is situated on the southeastern margin of the Mu Us Sandy Land and falls within a semiarid continental climate zone. Over recent decades, the mean annual temperature has been 8.8 °C, and the average annual precipitation has been 315.2 mm (Figure 1b). Precipitation is highly concentrated in the summer months, with over 70% occurring between June and September. The lowest and highest annual temperatures typically occur in January and August, respectively. Winters are prolonged and cold, characterized by low evapotranspiration and minimal vegetation transpiration.
The soil in the study area is dominated by aeolian sand, and the landforms are mainly composed of fixed and semifixed dunes as well as interdune depressions. Vegetation primarily involves local native species, represented by Salix, and exotic species, represented by Pinus. Salix is a desert shrub with root systems extending several meters deep. It has become one of the dominant shrub species in Mu Us Sandy Land and plays a key role in enhancing ecosystem functions and services [27]. Pinus is an evergreen tree characterized by rapid growth and high stress resistance, exhibiting strong adaptability to arid and cold conditions. It has also become an important species for sand fixation in desert regions [50]. Although these two typical drought-resistant vegetation types exhibit distinct seasonal water-use strategies, their specific water consumption patterns and differences in water sources remain poorly understood.

2.2. In Situ Experiments

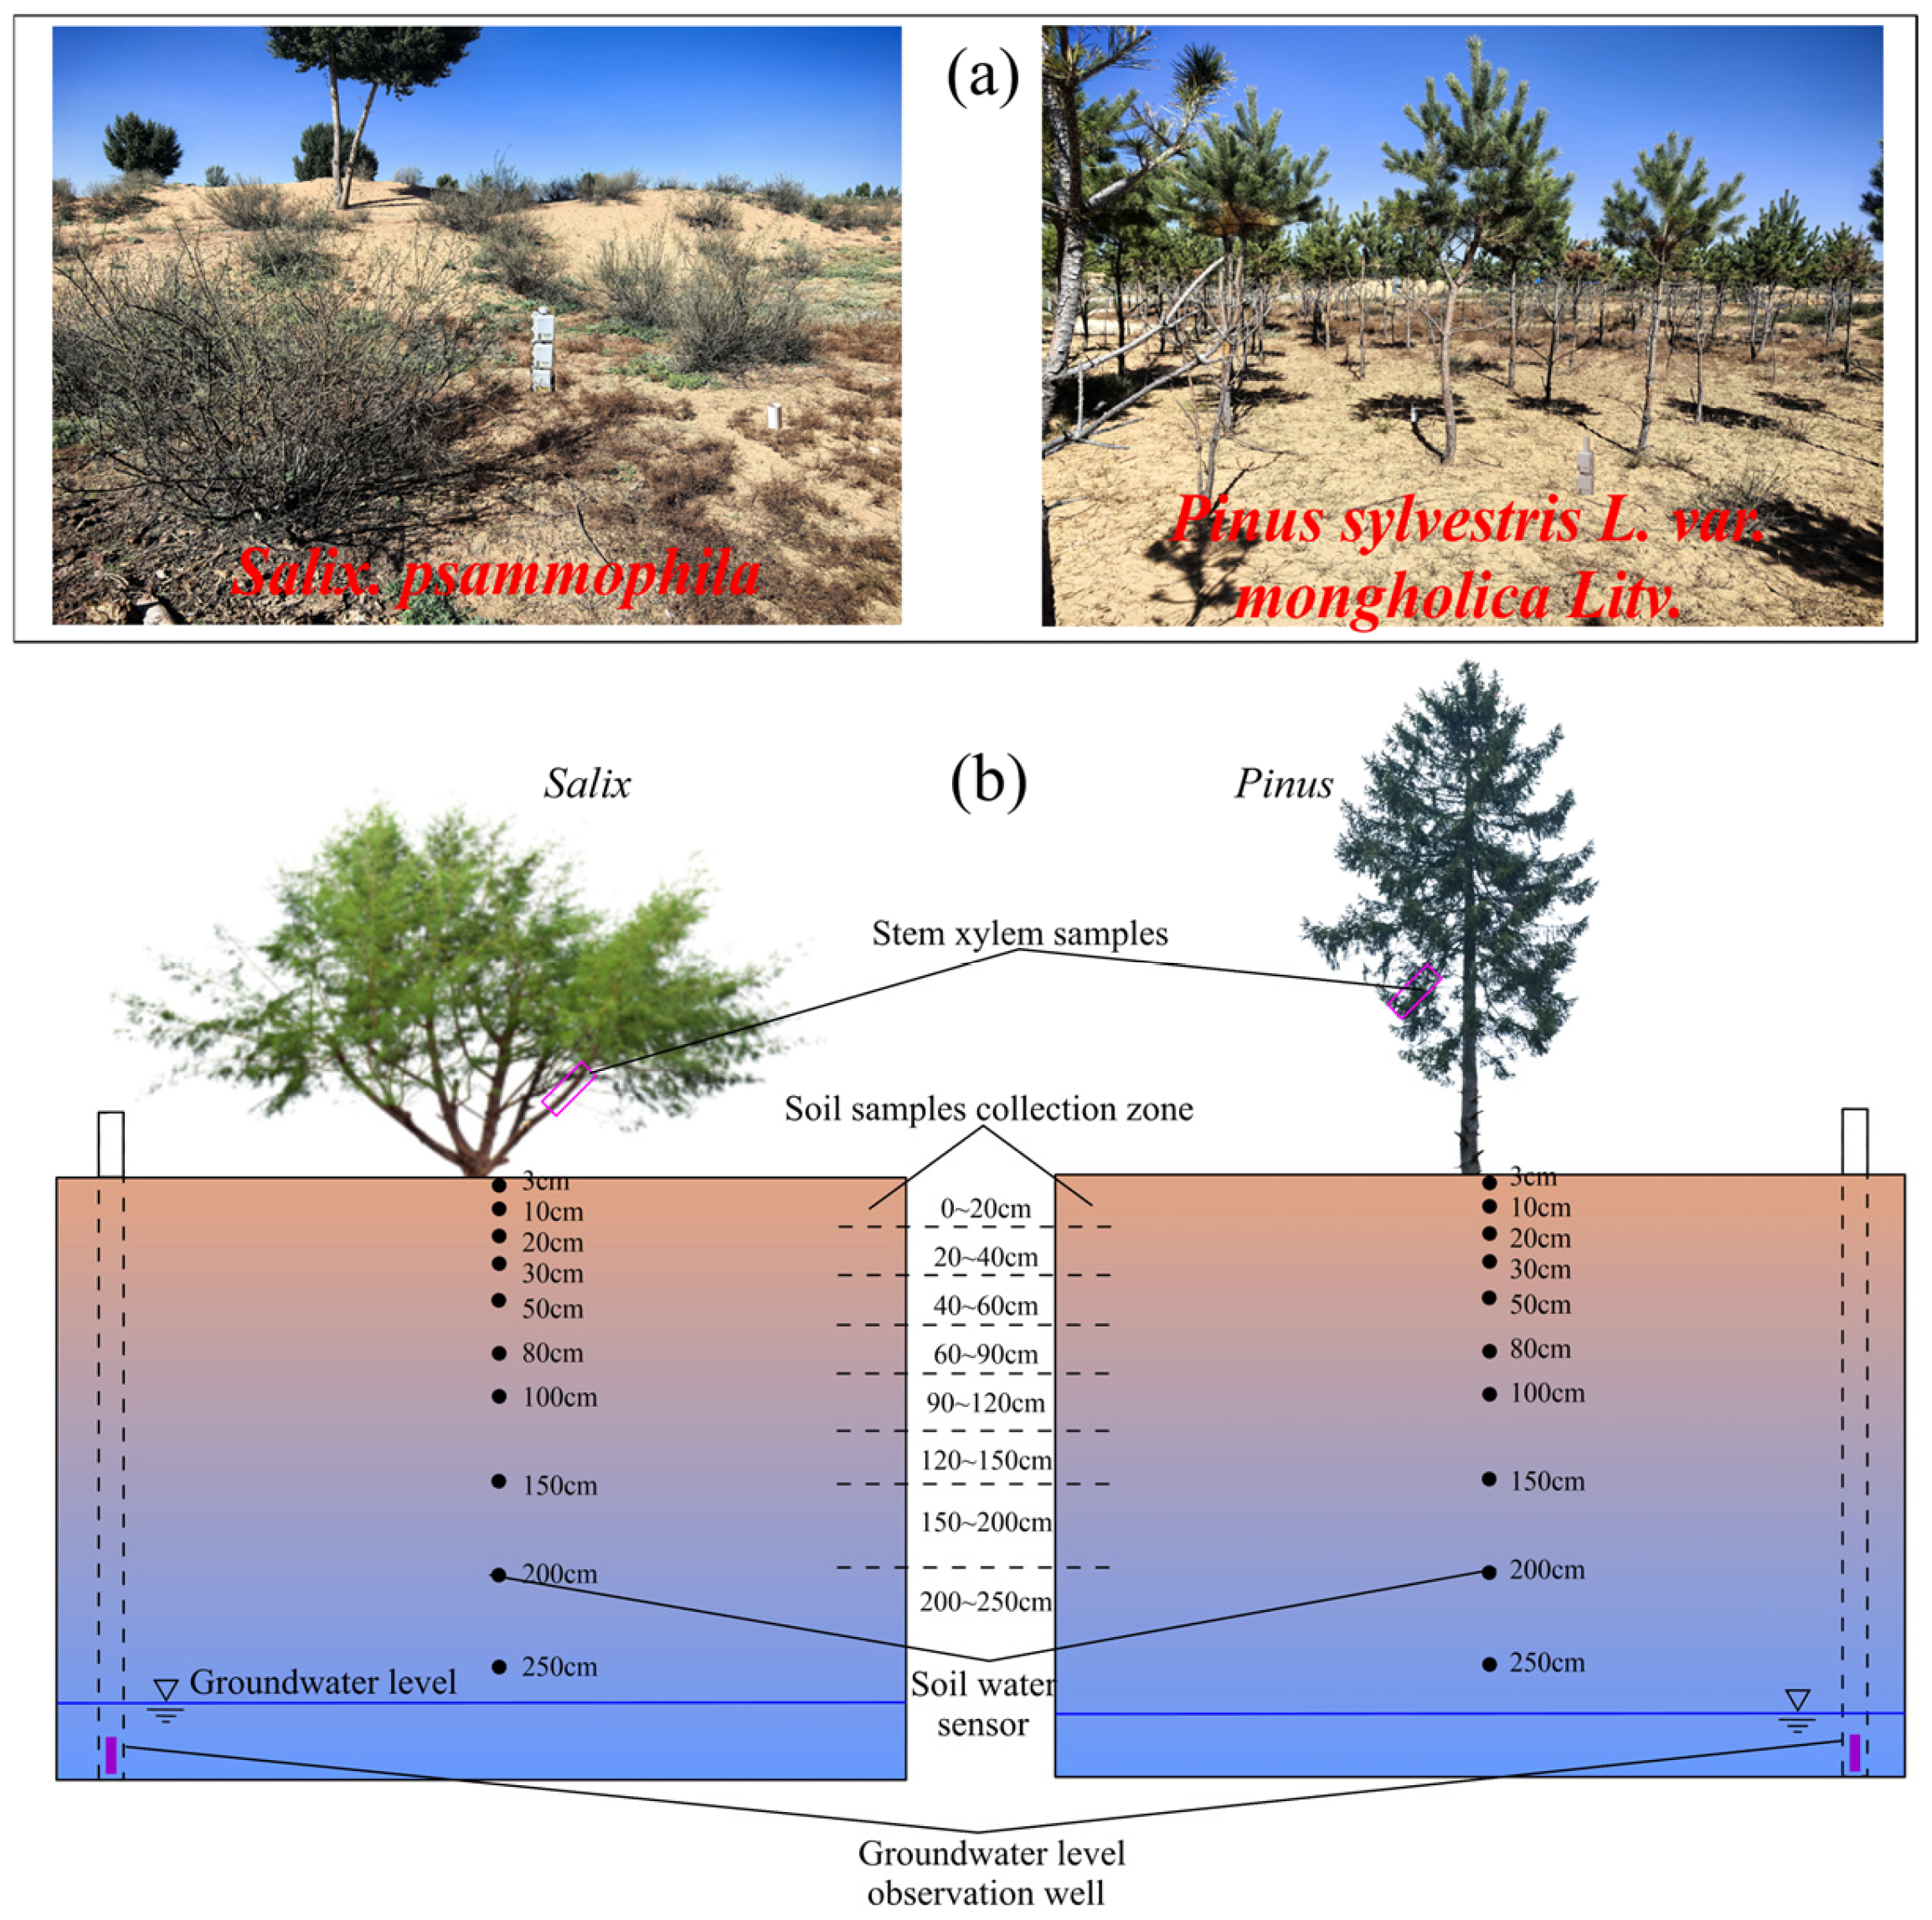
In situ experiments were conducted in the Narin River watershed within the Mu Us Sandy Land (Figure 2a). A standard automatic weather station was installed at the field site to record meteorological parameters, including atmospheric pressure, air temperature, vapor pressure deficit, sunshine duration, wind speed, wind direction, precipitation, etc. Two typical sand-fixing species—Salix and Pinus—were selected as the research object. Based on prior field surveys at the experimental site, the Salix plot had a vegetation coverage of approximately 52%, with water table depth fluctuating around 2.60 m. The Pinus plot exhibited approximately 89% vegetation coverage, with water table depth fluctuating approximately 2.75 m. For each plot, one individual Salix and Pinus was chosen for intensive monitoring by setting groundwater-level observation holes and soil water sensors. The water table depth was monitored with TD-Diver (±0.05%, Van Essen Instruments, Tucker, GA, USA), and the soil moisture content (SMC) was monitored with 5TE sensors (±1–2%, Decagon, Pullman, WA, USA). The sensors were installed at depths of 3, 10, 20, 30, 50, 80, 150, 200, and 250 cm. All the data were recorded hourly from 1 April in 2021 to 10 November 2022, covering the entire vegetation growth period. The experimental layout and instrument configuration for each plot are illustrated in Figure 2b, and the particle composition and hydraulic parameters of the aeolian sand are provided in Table 1.

2.3. Isotopic Sample Determination

2.3.1. Water Sample Collection from Different Vegetation Plots

In this study, water samples, including precipitation, soil water, groundwater, and stem xylem water, were collected during the vegetation growing season (from May to October) in both 2021 and 2022. Detailed information on isotope sample collection is presented in Figure 2.
Soil samples were collected monthly in triplicate for each plot using a soil drill method. Due to the presence of shallow groundwater and variations in groundwater levels among the plots, sampling depths were adjusted accordingly. The sampling intervals were set as follows: 0–60 cm at 20 cm intervals, 60–150 cm at 30 cm intervals, and below 150 cm at 50 cm intervals until reaching the groundwater table.
Groundwater samples were taken from the groundwater-level observation wells. The sampling, treatment, and storage procedures for groundwater, as well as the sampling schedule and frequency, were consistent with those applied to the soil samples. Encrypted sampling was conducted when heavy rain occurred in the rainy season (July–September). Precipitation samples were obtained from the rain gauge cylinder installed at the nearby meteorological station, and the collection time was 10 min after each precipitation event or the next morning after a nighttime precipitation event. After collection, the samples were immediately transferred to a brown glass bottle, sealed, and placed in a refrigerator at 4 °C for storage until the determination of isotope samples.
In each plot, freshly grown branches with a diameter of approximately 2 cm were selected for sampling. Xylem samples were collected monthly during the growth period between 09:00 and 14:00, when transpiration is most intense. To minimize isotopic variation due to canopy orientation, samples were taken from the base of the canopy in east, south, west, and north directions. All soil and xylem samples were collected in 10 mL glass bottles, sealed tightly, and stored in a portable incubator. After collection, the samples were immediately frozen at −20 °C and preserved until isotope extraction.

2.3.2. Water Isotope Extraction and Determination

Before the test, all samples were screened for organic pollutants using spectroscopic methods to ensure that any potential influence on the test results could be ruled out. Soil water and stem xylem water were extracted using an LI-2100 automatic vacuum condensation extraction system, with an extraction time of 1 to 2 h and an extraction efficiency of ≥99%. The δ2H and δ18O values of the precipitation, groundwater, and soil water samples were determined via an LGR liquid water isotope analyzer, with an accuracy of 0.5‰ and 0.1‰, respectively. The δ2H and δ18O values of the vegetation stem xylem water samples were determined via stable isotope ratio mass spectrometry with an accuracy of 0.1‰.
The formula for calculating isotope ratios is as follows:
𝜕 X = R s a m p l e R s t a n d a r d R s t a n d a r d
where X is δ2H and δ18O; Rsample is the isotope abundance ratio of the elements in the test sample (2H/1H, 18O/16O); Rstandard is the Vienna standard mean ocean water.

2.3.3. Bayesian Mixing Model MixSIAR

Based on the assumption that no isotope fractionation effect occurs in the process of water absorption and utilization by vegetation, the Bayesian mixing model (MixSIAR, version 3.1.12) was used to calculate the contribution rates of different potential water sources to vegetation water consumption [51] in this study. The Bayesian mixing model MixSIAR integrates the number of endmembers, analysis errors, and distribution characteristics as prior information, conducts iterative sampling based on the Markov Chain Monte Carlo method (MCMC) to quantitatively estimate the contribution ratio of each endmember to the mixed sample, and presents the results in the form of a posterior probability density distribution. This model adopts the Dirichlet distribution to construct the prior and combines it with the Bayesian inference framework, effectively improving the accuracy and stability of source resolution. Ultimately, the mean posterior distribution output by the model can be used to evaluate the relative contribution levels of each potential source.
The model is built on a standard linear mixing model:
δX_consumer = ∑(p_s × δX_s) + ε
where δX_consumer is the isotope value of the mixture (xylem water), p_s is the proportional contribution of source s, δX_s is the isotope value of source s, and ε is the residual error.
The values of vegetation stem xylem water isotopes (δ2H and δ18O) were input into the MixSIAR model as “mixed data”. The mean values and standard deviation of the soil water and groundwater isotopes (δ2H and δ18O) in each soil layer were entered into the MixSIAR model as “source data”. After the mixed source data were imported, the contribution rate of each water source to vegetation water consumption was obtained after iterative calculation. The model output is the full posterior distribution for each source proportion (p_s). We report the posterior medians as the point estimate and the 2.5th and 97.5th percentiles of this distribution as the 95% credibility interval. In this study, a total of three independent MCMC chains were run, with each chain iterated 10,000 times. To eliminate the influence of the initial values, the first 4000 iterations were excluded as the aging period. The remaining 6000 iterations were diluted and sampled at intervals of 100. Eventually, 60 valid posterior samples were retained for each chain. By combining the three chains, a total of 180 samples were obtained for subsequent analysis. The model introduces a residual error term to explain the uncertainties that are not fully captured by the terminal and fractionation factors.

3. Results

3.1. Dynamics of Major Meteorological Elements

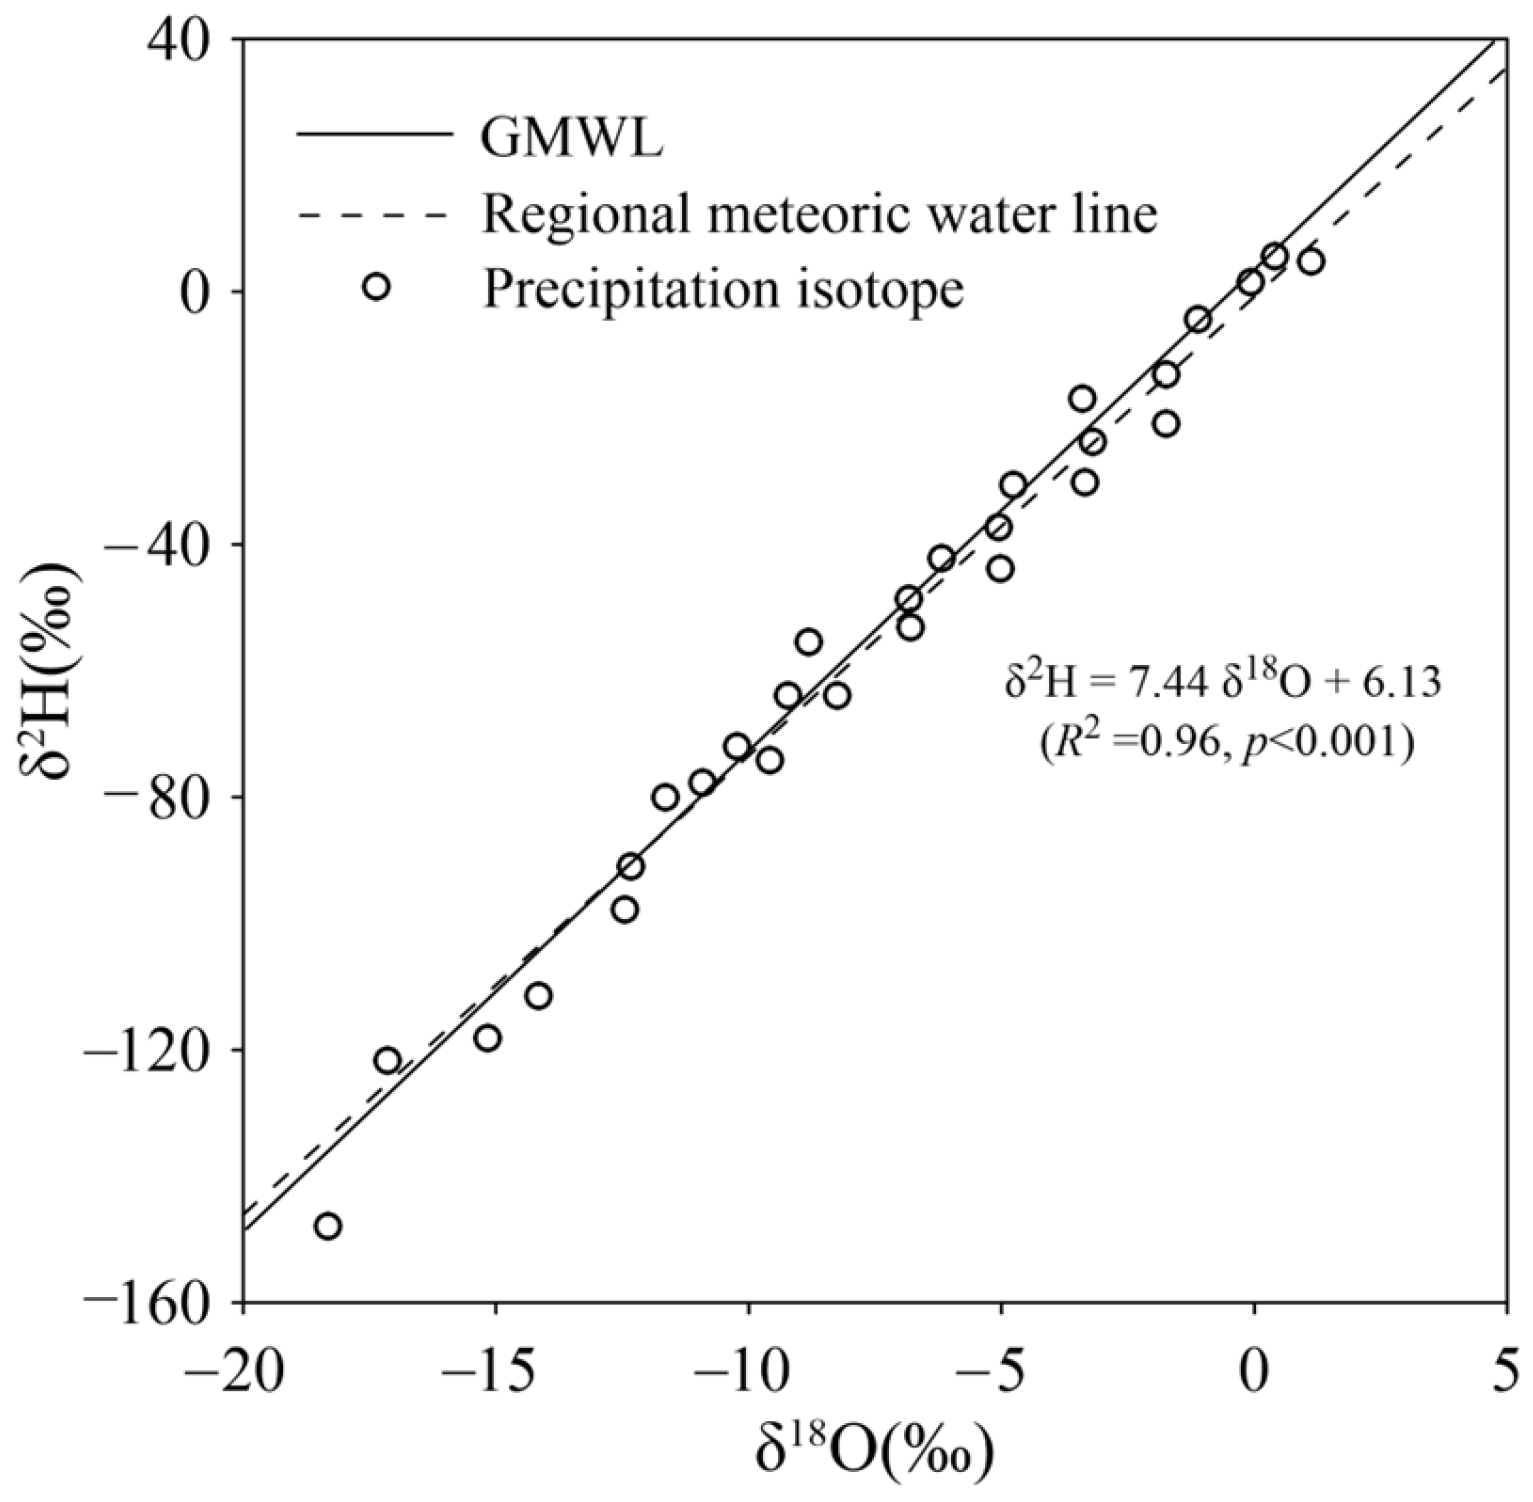
Precipitation exhibited distinct seasonal variability during the study period (Figure 3). Total precipitation in 2021 and 2022 was 400.8 mm and 338.3 mm, respectively, with the majority of rainfall events concentrated between July and September, accounting for 76% of the annual total. In contrast, lower precipitation amounts and fewer events occurred from December to April of the following year. The δ2H and δ18O values of precipitation showed noticeable temporal fluctuations from May to October in both years. Specifically, δ2H of precipitation ranged from −137.44‰ to 18.19‰, with a weighted average of −58.53‰, while δ18O of precipitation varied from −18.07‰ to −0.95‰, with a weighted average of −11.36‰. As shown in Figure 4, a strong linear relationship was observed between δ2H and δ18O in precipitation, yielding the local meteoric water line: δ2H = 7.44 δ18O + 6.13 (R2 = 0.96, p < 0.001). Both the slope and intercept of this local line are lower than those of the Global Meteoric Water Line (GMWL), indicating that evaporation occurred during the precipitation period in the study area.

3.2. Evolution Characteristics of Groundwater

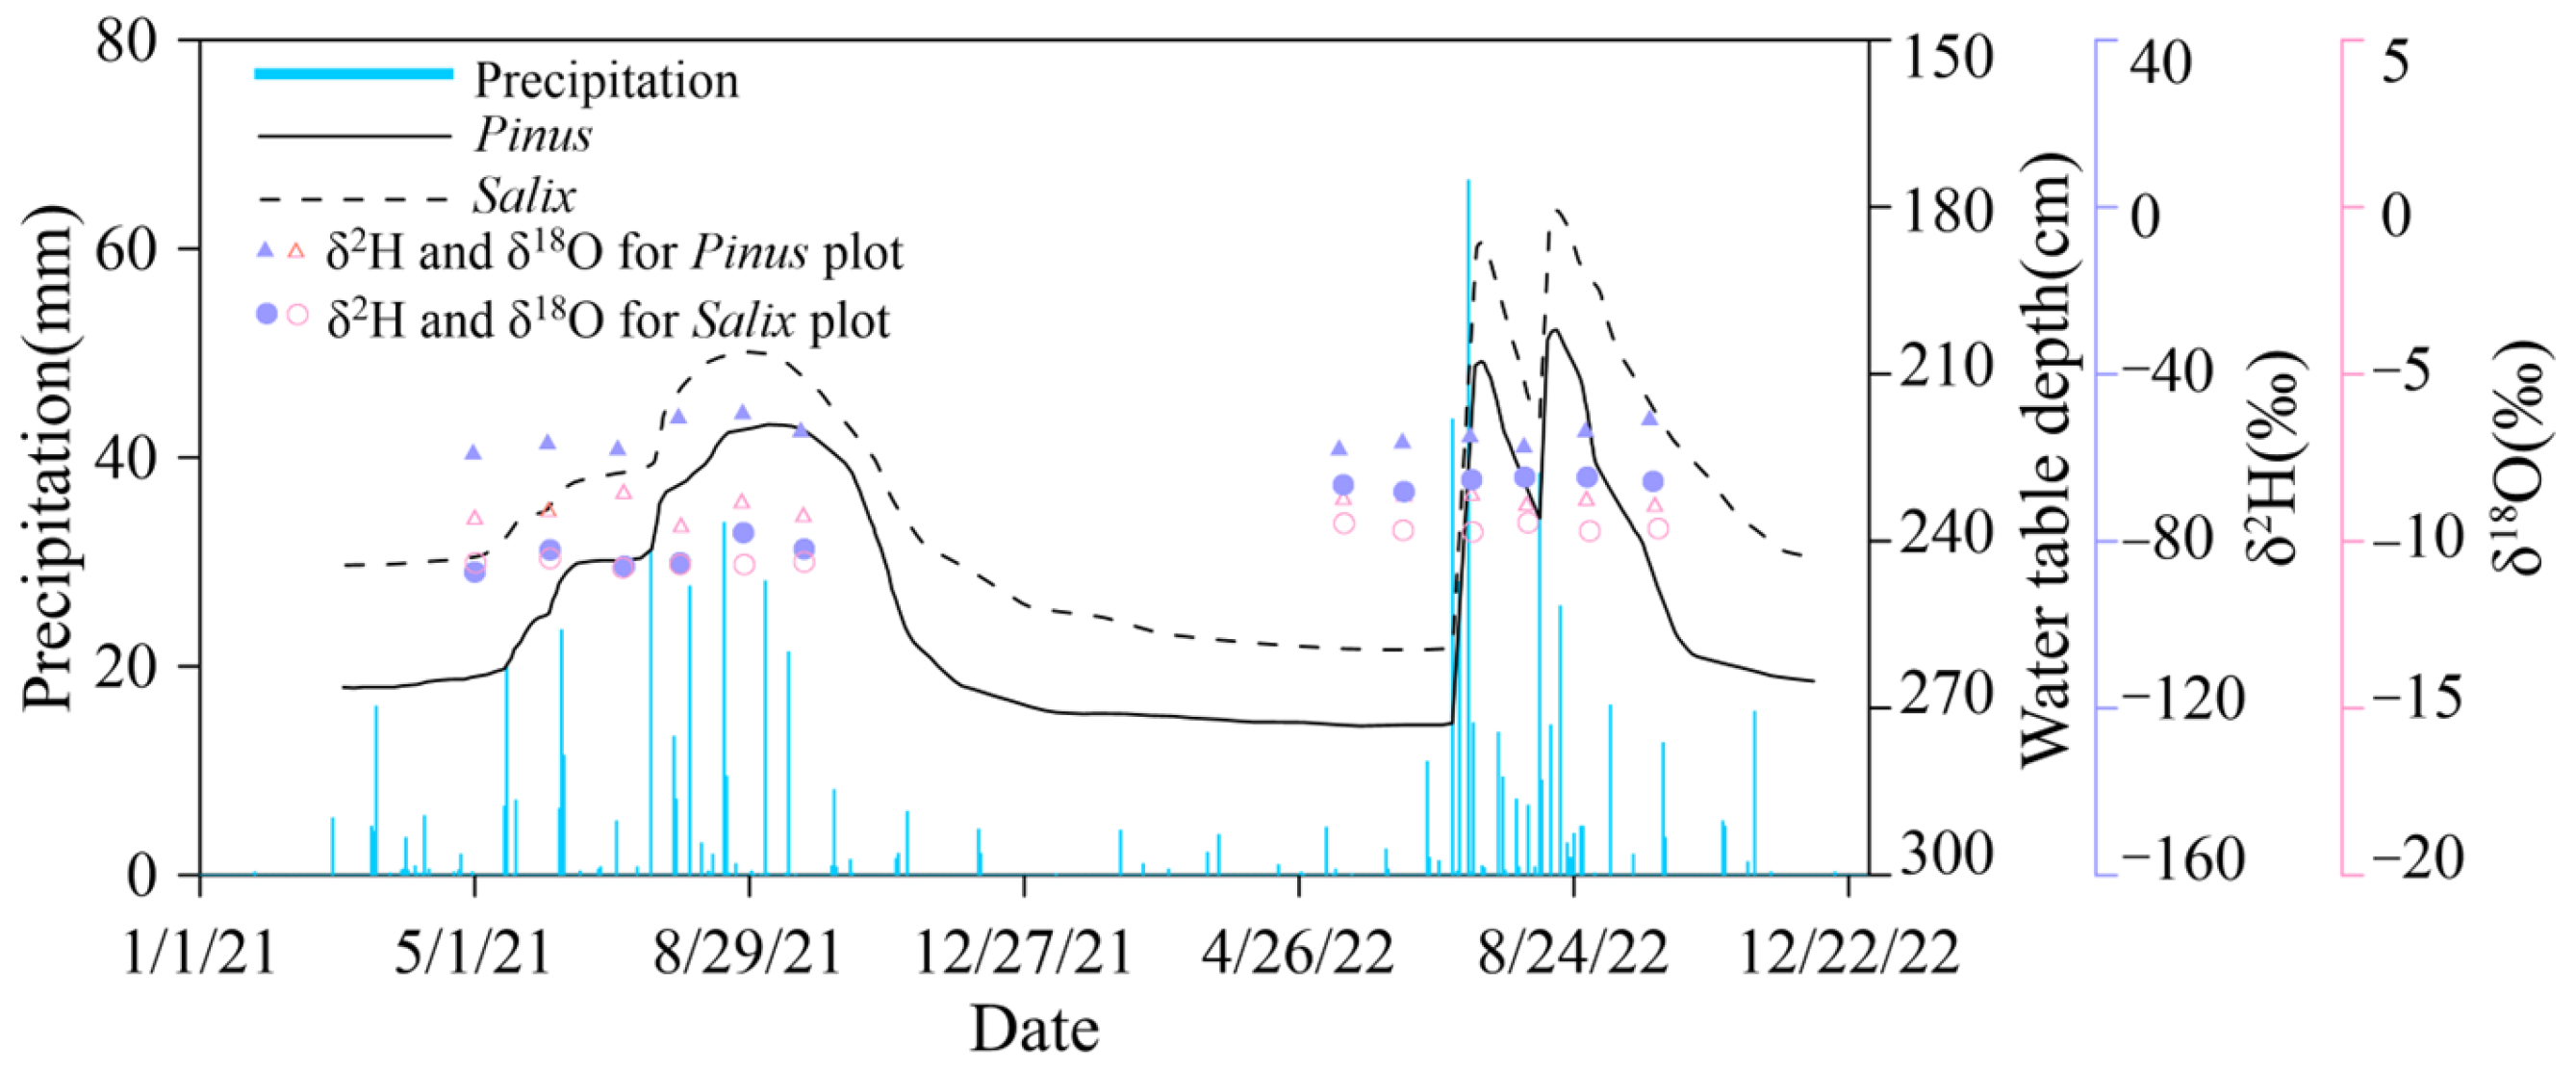
Figure 5 illustrates the variations in the water table depth for both vegetation plots. The water table depth fluctuated between 202–277 cm in the Pinus plot and 183–258 cm in the Salix plot. From May to October, the water level rose in response to increasing precipitation and declined afterward. During the rest of the study periods, the water level remained relatively stable despite minor rainfall. Notably, during the precipitation-induced recharge phases, the water level of both plots exhibited similar rising trends. However, during dry periods, the water table declined more rapidly in the Pinus plot than in the Salix plot.
Throughout the study period, groundwater isotopic composition remained relatively stable in each plot (Figure 5). In the Pinus plot, the mean δ2H values were −62.13‰ (range: −66.54‰ to −58.81‰; CV: 0.07) in 2021 and −61.33 ‰ (range: −63.24‰ to −59.09‰; CV: 0.04) in 2022. Corresponding, δ18O values were −8.55‰ (range: −9.77‰, −8.27‰; CV: 0.02) in 2021 and −8.08‰ (range: −8.61‰ to −8.23‰; CV: 0.02) in 2022. In the Salix plot, the mean δ2H values were −75.64‰ (range: −83.8‰ to −70.7‰; CV: 0.08) in 2021 and −66.47‰ (range: −71.74‰ to −60.82‰; CV: 0.06) in 2022. Correspondingly, δ18O values were −10.79‰ (range: −10.71‰ to −9.68‰; CV: 0.06) in 2021 and −9.16‰ (range: −9.77‰ to −8.22‰; CV: 0.05) in 2022. The groundwater isotopic composition remains stable annually due to the aquifer’s large storage capacity, which dilutes the input from individual precipitation events. The significant time lag for infiltration and mixing within the unsaturated zone further blends seasonal isotopic variations into a stable long-term average. This stability is methodologically advantageous, providing a well-defined endmember for mixing models. It allows us to reliably quantify shifts in plant water uptake between shallow soil layers and deeper, stable groundwater sources.

3.3. Temporal and Spatial Distribution Characteristics of Soil Water

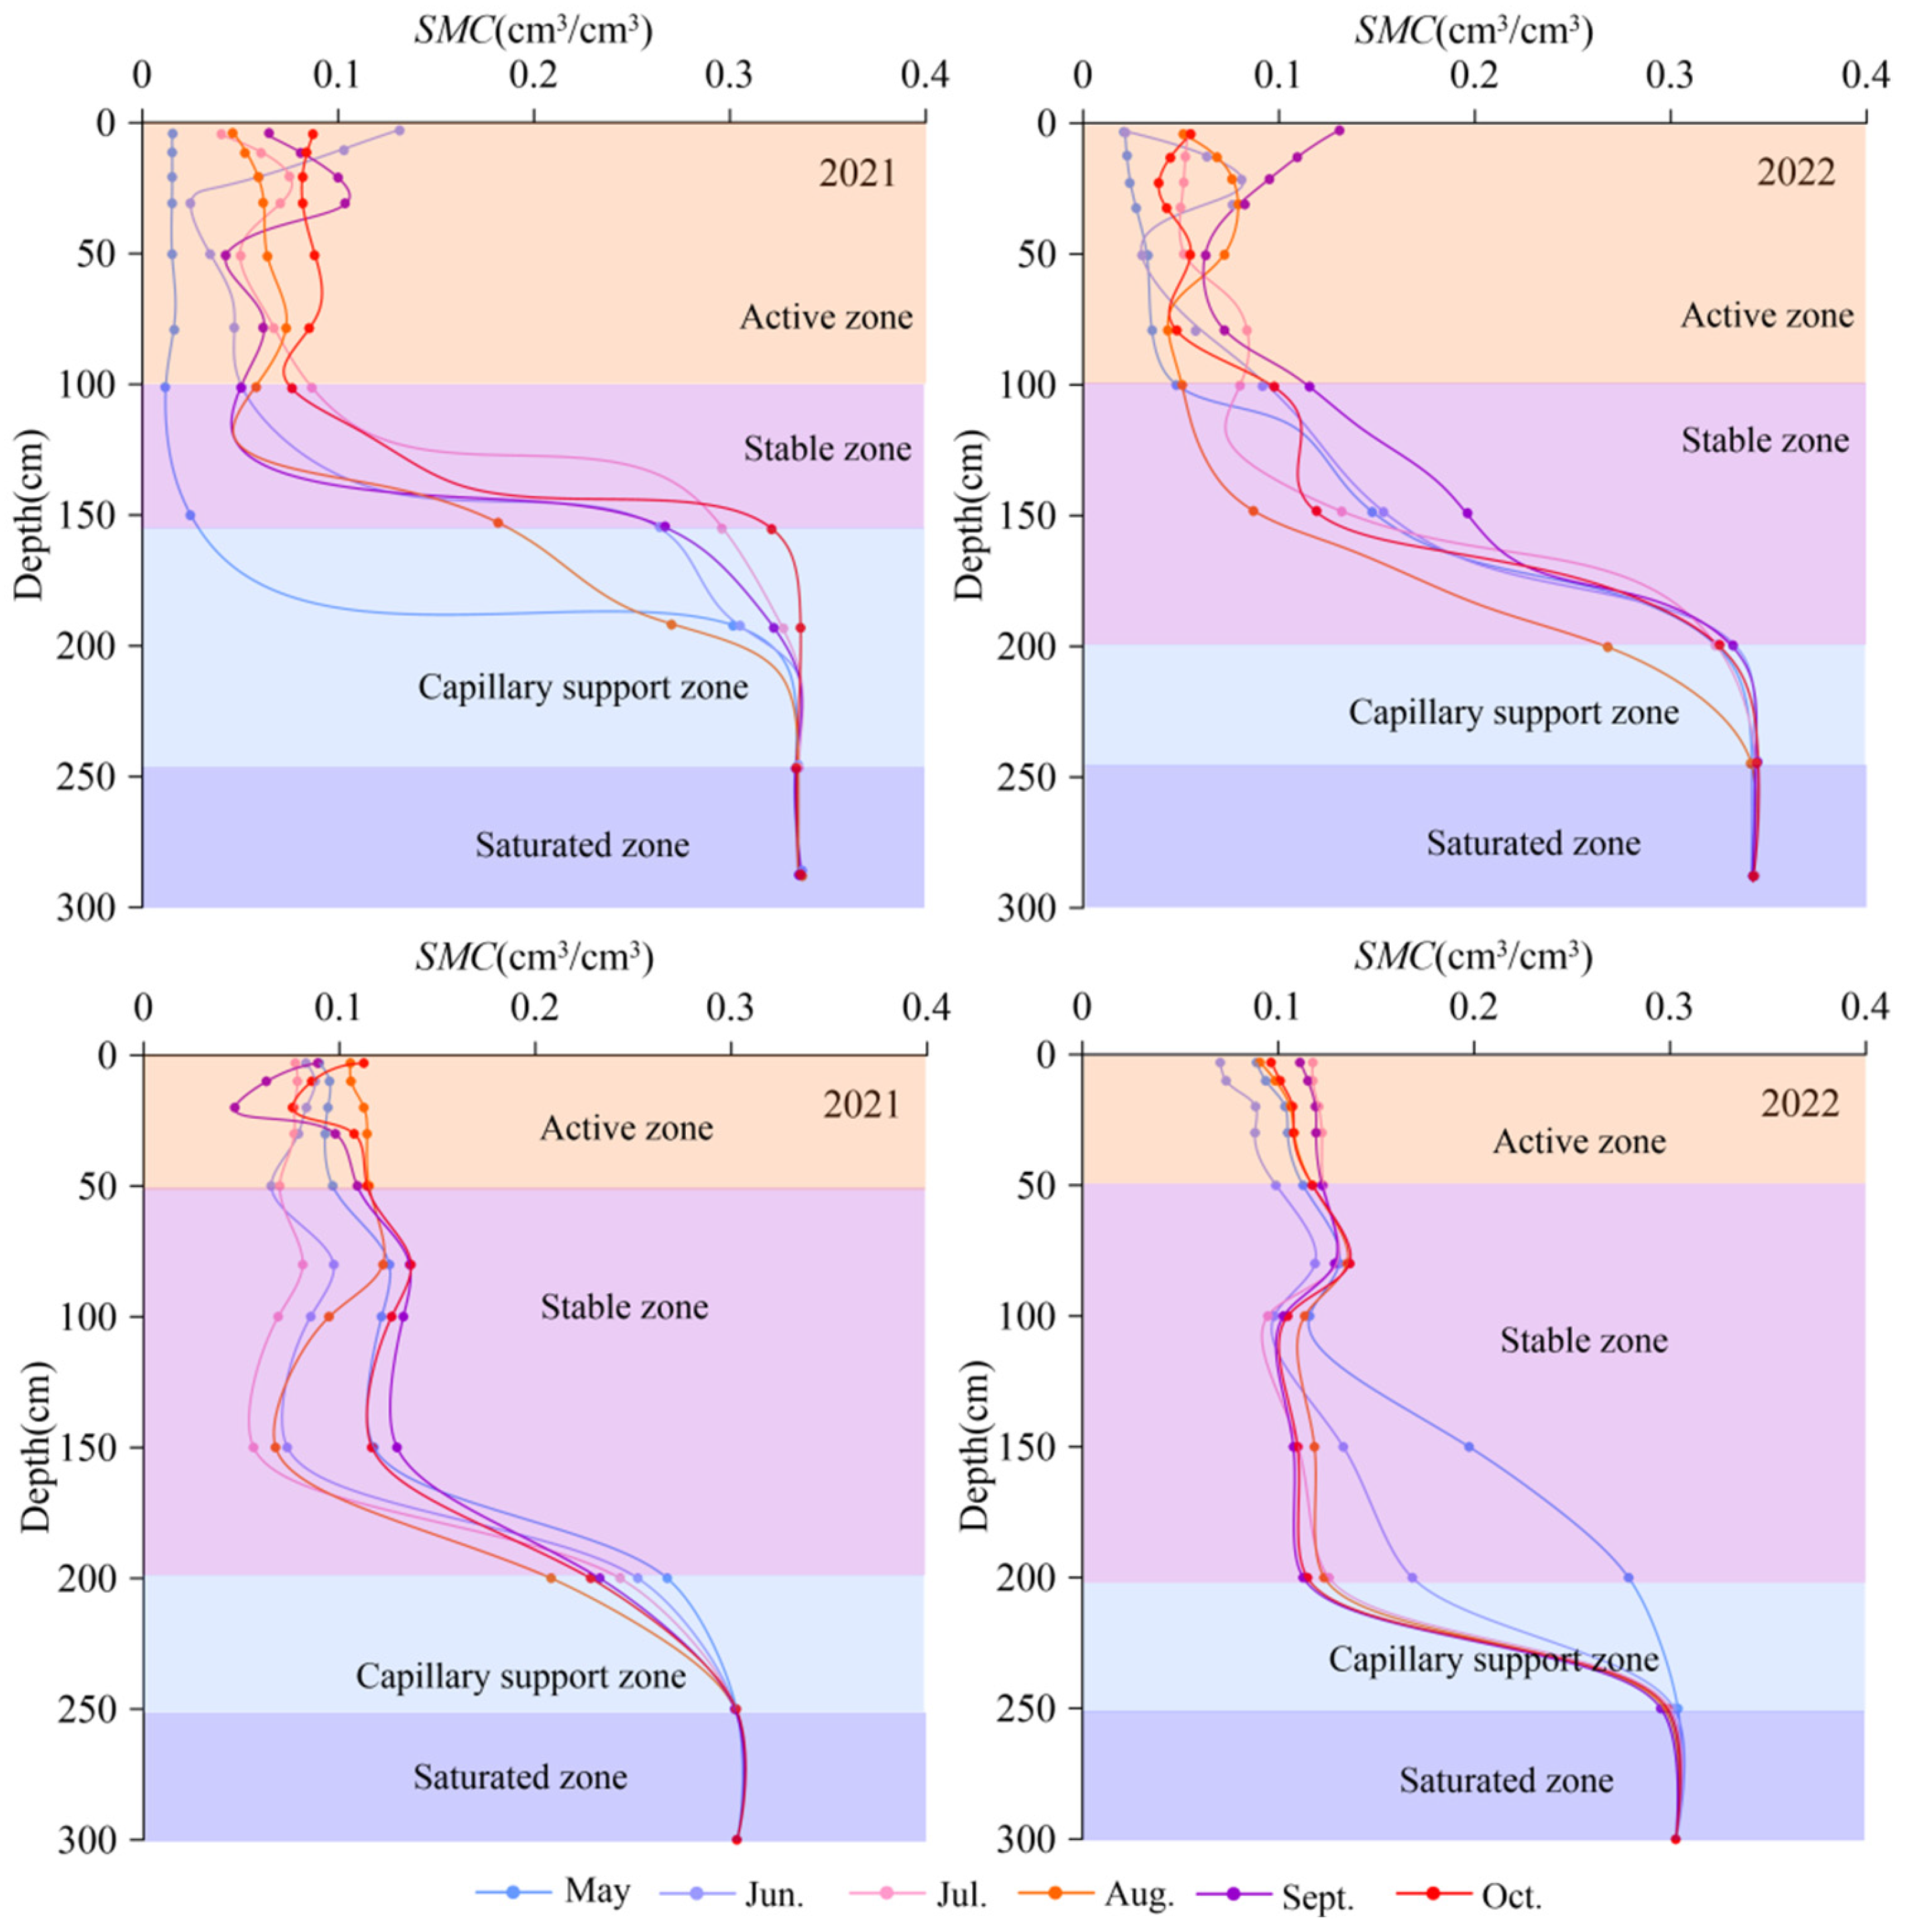
Figure 6 illustrates the spatiotemporal variations in SMC within the Salix and Pinus plots during the study period. The SMC of the two plots exhibited similar characteristics. That is, the SMC above a depth of 50 cm was affected by atmospheric conditions, showing pronounced fluctuations. Meanwhile, the capillary fringe—extending about 50 cm above the water table—was affected by groundwater-level changes. The remaining soil zones remained relatively stable, with variations primarily driven by RWU. Based on these variation characteristics of the SMC, the soil profile was categorized into the active zone, stable zone, capillary support zone, and saturated zone (Figure 6). Among them, the capillary support zone was not interpreted as a static reservoir but as a critical hydrological bridge that connects the saturated zone to the stable zone where the root systems were active.
In the Salix plot, the mean monthly SMC in the active zone remained below 0.1 cm3/cm3, while the stable zone consistently recorded higher values, ranging between 0.1 cm3/cm3 and 0.3 cm3/cm3. In the Pinus plot, the SMC showed interannual variability: in 2021, the SMC in the active zone fluctuated near 0.1 cm3/cm3, whereas it slightly exceeded this threshold in 2022. The SMC in the stable zone was lower and more variable in 2021 compared to 2022, while the capillary support zone showed lower values in 2022. Notably, the Pinus plot generally had higher SMC in the active zone than that in the Salix plot, but lower SMC in both the stable and capillary support zones.

3.4. Water Isotopic Composition of Vegetation Xylem

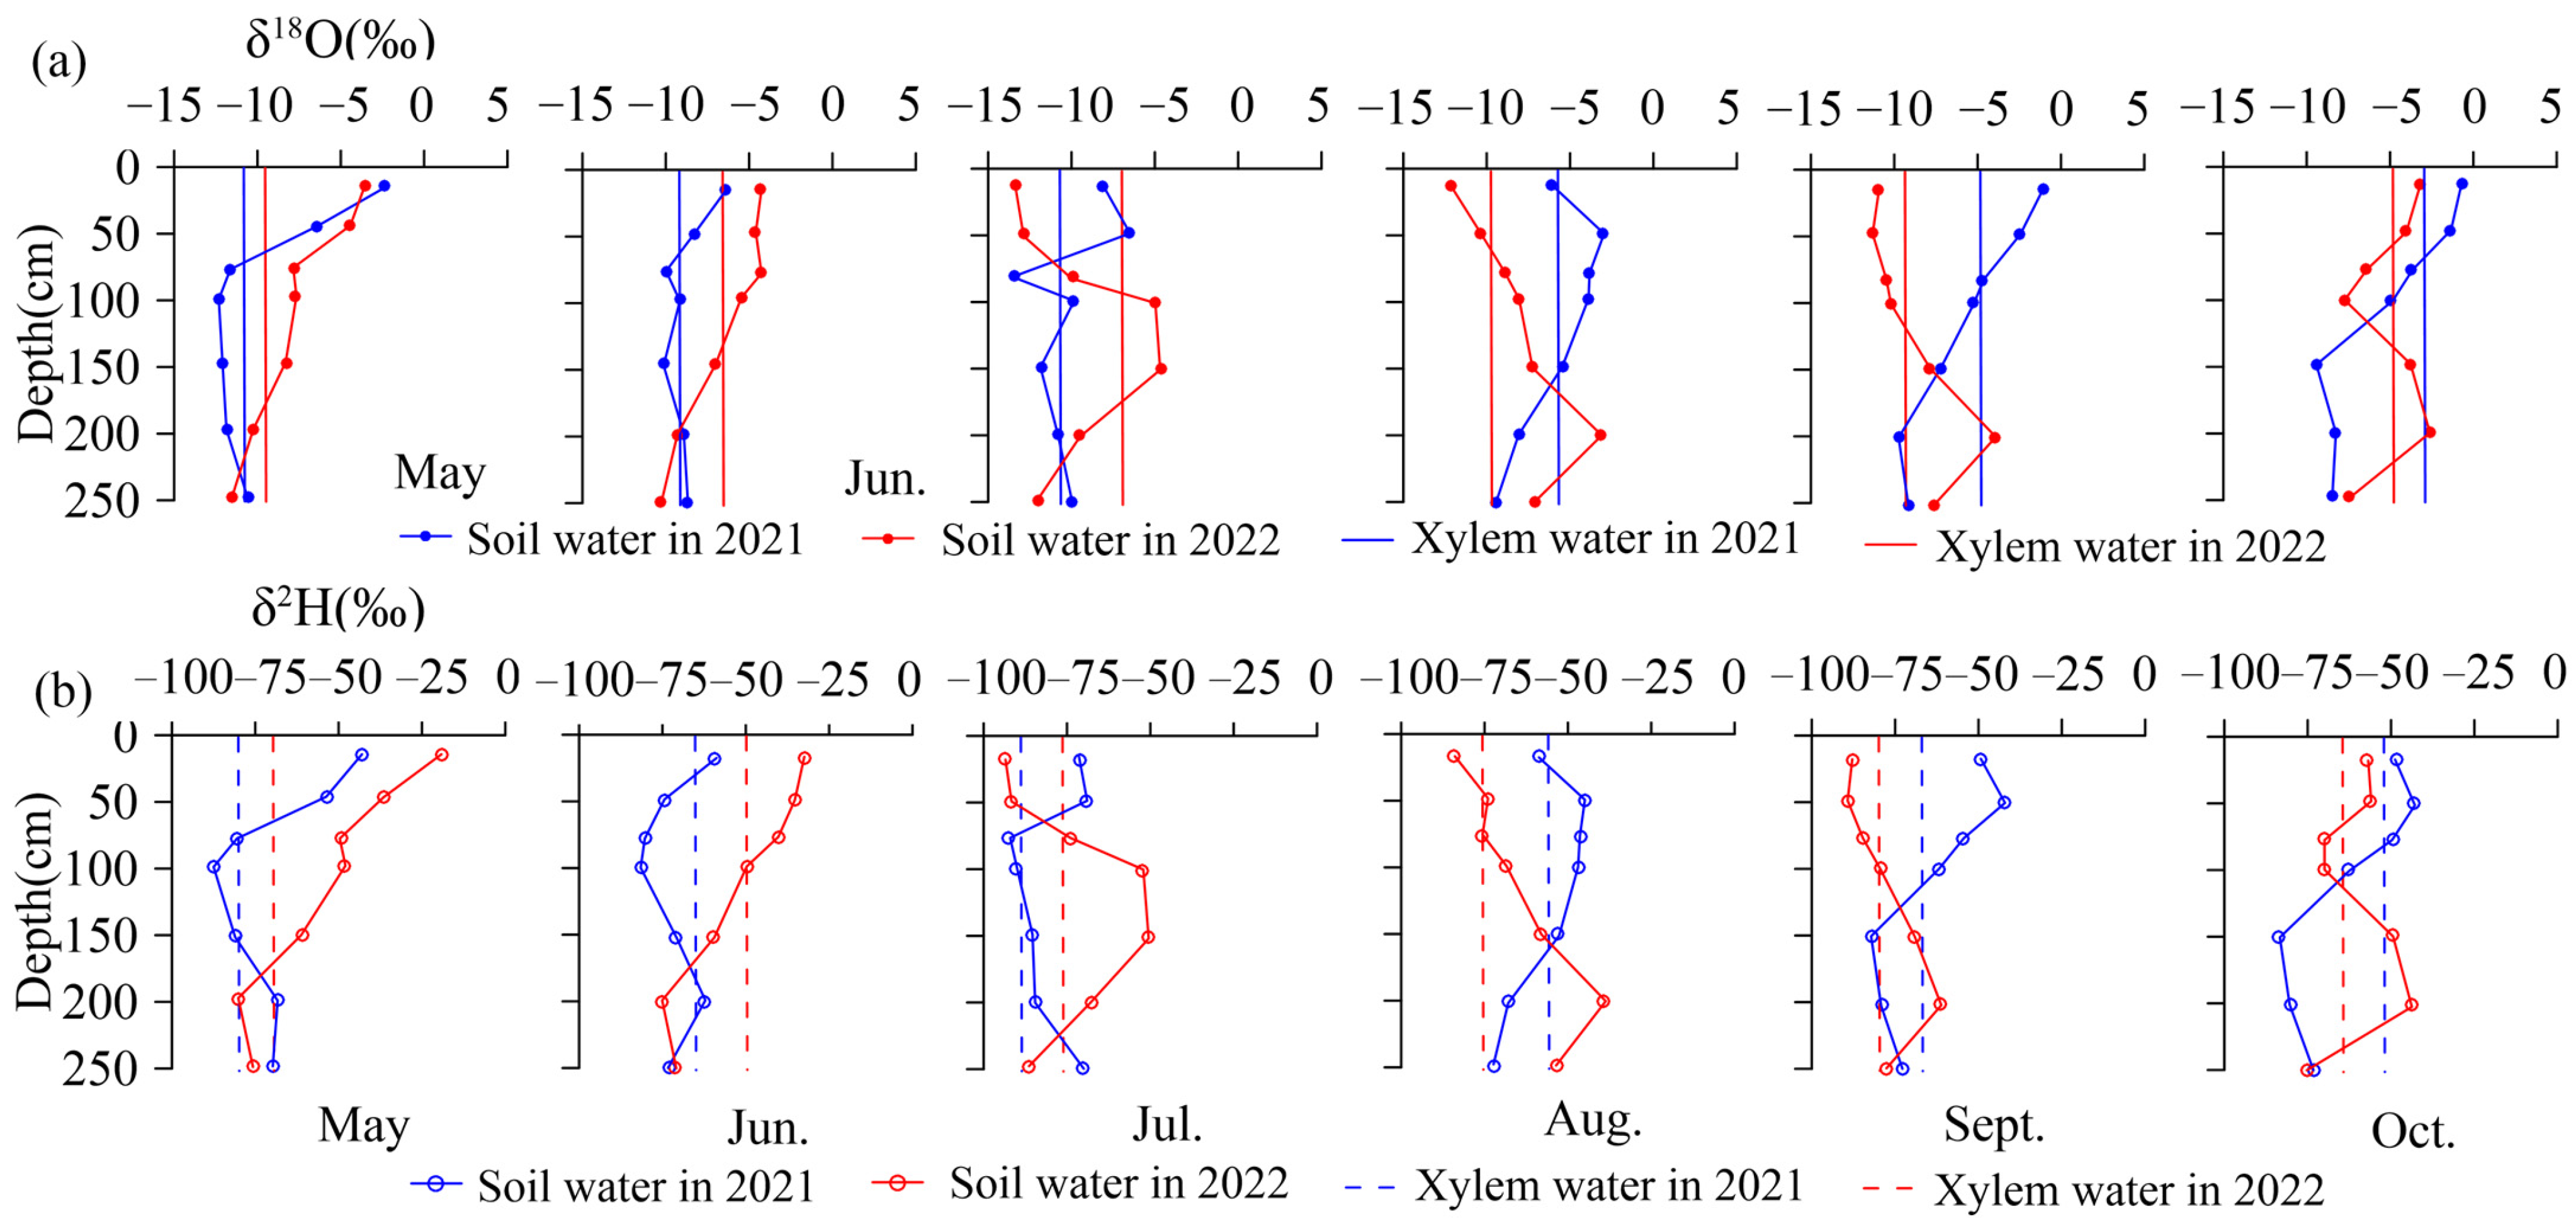
The variation characteristics of the soil water isotopic composition (δ18O and δ2H) in each soil layer of the Pinus plot and Salix plot are shown in Figure 7 and Figure 8. There was no significant difference in the isotopic composition of xylem water between the two vegetation types during the study period, and the isotopic composition of the xylem water was similar to that of the soil water in the corresponding plot. In 2021, the δ2H and δ18O values of the Pinus xylem water were enriched the most, ranging from 67.03‰ to 50.74‰ (average −59.34‰) and 9.17‰ to 6.89‰ (average −8.16‰), respectively. The average δ2H and δ18O values of the Salix xylem water were −67.84‰ and −7.98‰, respectively. In 2022, the average δ2H isotopic compositions of the xylem water of Pinus and Salix were −63.63‰ and −61.83‰, and the average δ18O isotopic compositions were −8.35‰ and −8.16‰, respectively.
There were differences in the vertical changes in the soil water isotopic composition among the different plots. The soil water isotopic recombination fraction decreased with increasing depth. The isotopic composition of the active zone was relatively enriched compared with that of the stable zone and the capillary support zone. The results revealed that the δ2H and δ18O values in the soil water gradually decreased with increasing soil depth, especially during May–June. However, during July–September, the mixing of soil water and infiltrated precipitation inhibited the enrichment of isotopes in shallow soil water by evaporation.

3.5. Contribution of Different Water Sources to Vegetation Water Consumption

The MixSIAR model calculation results (Table 2) revealed that Pinus absorbed 18.5%, 20.9%, 25.6%, and 35.0% of the water from the active zone, stable zone, capillary support zone, and saturation zone, respectively, during the period of observation, and they were 29.4%, 25.3%, 23.6%, and 21.7%, respectively, for Salix. Overall, Pinus absorbed 60.6% water from deep layers (the capillary support zone and saturation zone) and 39.4% water from shallow layers (the active zone and stable zone), respectively, and they were 45.3% and 54.7% for Salix. Compared with 2021, the water absorption in the saturation zone of Pinus increased by 15.1% in the wetter year of 2022, whereas the proportion of water absorbed by Salix changed little in 2022.
The two vegetation types exhibited distinct seasonal shifts in water source contributions between 2021 and 2022. During May–June, Pinus primarily utilized water from the capillary support zone and saturation zone, with maximum water contributions reaching 31.6% and 48.5% in 2021, and 26.7% and 60.1% in 2022, respectively (Table 2). From July to September, its main water sources shifted to the active zone and the stable zone, where contributions peaked at 29.9% and 40.3% in 2021, and 22.2% and 22.1% in 2022, respectively. The water contribution of Salix was mainly from the stable zone, capillary support zone, and saturation zone from May to June (Table 3). It gradually shifted toward shallower soil layers, showing increased use of active zone moisture. In October, Salix predominantly absorbed water from the active zone (43.5% in 2021, 40.3% in 2022) and stable zone (24.1% in 2021, 20.2% in 2022), while the contribution of groundwater declined monthly.

4. Discussion

4.1. Water Consumption Characteristics of Pinus and Salix

The spatial distribution of root water uptake (RWU) can be inferred from the intersection of xylem water isotopes and soil water isotopes. During the study period, the xylem water isotopic composition of both Pinus and Salix varied across growth stages (Figure 7 and Figure 8), reflecting temporal shifts in potential water sources for RWU. Specifically, in the early growth period (May–June), both Pinus and Salix used shallow soil water, gradually incorporating deeper soil water as the season progressed, particularly from August to September when precipitation increased. During the rainy season (July–September), xylem water isotopes intersected with both shallow and deep soil water, indicating a mixed use of deep soil water and precipitation-replenished shallow water. By October, however, xylem water isotopes aligned mainly with shallow soil water, suggesting a return to shallow sources, likely due to reduced plant transpiration demand. This pattern is consistent with the principle of minimal energy consumption in RWU, as reported in previous studies [52,53]. Interannually, Salix exhibited consistent monthly intersection patterns in 2021 and 2022, indicating stable water-use strategies. In contrast, Pinus showed a downward shift in isotope intersection points in 2022 compared to 2021, reflecting an increased uptake of deep soil water and groundwater as the trees matured.
Studies have shown that the RWU patterns of vegetation are highly adaptable under varying soil moisture conditions. During the rainy season, plants primarily absorb shallow soil water recharged by recent precipitation through shallow roots. In contrast, during dry periods, deep soil water or groundwater becomes the main source, accessed via deep roots. This study further confirms that both Pinus and Salix shifted to deeper water sources during dry conditions, when shallow soil moisture was limited by low rainfall, high temperatures, and strong evaporation. These findings align with previous reports that shrubs in arid ecosystems rely heavily on deep soil water or groundwater throughout dry seasons [33,54,55,56]. The results demonstrate that Pinus and Salix can flexibly switch between shallow and deep soil water sources in response to seasonal water availability and plant demand [48,57,58].
Water table decline and capillary fringe lowering preceded the shift in root water uptake (RWU) to deeper sources, suggesting that vegetation adapts its strategies in response to hydrological changes. The root system, already established in deep soil and capillary zones, was pre-positioned to exploit deeper water as upper soils dried. Stable isotope data strongly support this relationship. As the water table dropped and surface soils dried, the isotopic signature of deep soil water aligned more closely with groundwater, indicating recharge from the lowered capillary fringe. For instance, xylem water isotopes in Salix shifted to match this deep soil and groundwater signal, demonstrating active uptake from the new capillary fringe position. Although destructive root excavation was not conducted, we infer that pre-existing root architecture enables rapid hydraulic activation of deep roots rather than short-term downward growth. This allows immediate use of capillary water as the most reliable source. It should be noted, however, that potential minor isotope fractionation in woody species may introduce some bias, despite our use of a widely adopted model.

4.2. The Difference in Water Consumption Between Exotic Artificial Vegetation and the Local Native Vegetation

The water consumption patterns of Pinus and Salix changed during the different growth stages. Previous studies have indicated that Pinus exhibits higher water requirements and transpiration rates than Salix [59,60,61]. Specifically, Pinus is able to obtain more water from deeper soil layers, likely due to a greater proportion of its root system being distributed at these depths, which provides a stable water source during dry periods. In contrast, Salix primarily relies on water from shallow and middle soil layers replenished by precipitation. Locally native vegetation, which typically adopts more conservative water-use strategies, tends to depend predominantly on shallow soil water. In comparison, exotic species often employ more expansive water-use strategies and utilize deeper soil water sources. Although the deep soil water acquisition strategy aids vegetation survival under drought conditions, intense competition for deep water can lead to progressive soil drying, which may ultimately constrain vegetation growth.
In arid regions where potential evapotranspiration significantly exceeds precipitation, limited soil water alone is often insufficient to meet vegetation demands, making groundwater a critical supplementary source [62,63]. Our findings indicate that both Pinus and Salix can utilize groundwater throughout the growing season, although the degree of dependence varies temporally and between species. The higher water requirements of Pinus partly explain its greater reliance on groundwater compared to Salix. During the dry season (May–June), groundwater accounted for 35.0% of Pinus water use versus 21.7% for Salix (Table 2). This capacity to access deeper water sources likely provides Pinus with a competitive advantage, supporting sustained productivity under prolonged drought conditions.

4.3. Implications for Vegetation Restoration Management

Desertification is one of the most serious environmental problems in arid and semiarid regions [64]. How to balance vegetation restoration and water utilization to maintain the sustainable development of vegetation ecosystems has always been a major challenge for desertification prevention and control [65]. In desert areas, large-scale afforestation with vegetation with high water demand is a common method [66,67]. However, excessive afforestation at high density can also have a negative impact on water resources, especially when vegetation water consumption is greater than the water supply [68]. The Mu Us Sandy Land—a pioneer area in China’s desert control—exhibits low and variable precipitation, poor soil water retention, and unstable groundwater levels. Under these conditions, the large-scale use of high-water-consumption vegetation must be approached cautiously. Afforestation planning should therefore integrate multiple factors, including species adaptability, cost, growth rate, and overall effectiveness, tailored to the region’s fragile ecology and climate constraints [4].
Field observations indicate that Salix facilitates continuous vegetation cover, while Pinus offers notable sand-fixing benefits despite higher initial maintenance. Pinus requires approximately seven years to enter rapid growth—a period demanding sustained water inputs that strain local resources [50]. In the case of low vegetation density, precipitation can replenish soil water more effectively, reducing water deficits during the growing season. However, soil water decreased significantly with the increase in vegetation age in the densely planted area. The higher the density, the higher the water consumption, the lower the soil water, the higher the mortality of Pinus. Studies have shown that Pinus will not consume excessive water resources when the stand density is suitable. For example, the transpiration of Pinus on sandy land does not exceed 60% of annual precipitation and 77% of evapotranspiration [30]. Thus, through rational density management and water allocation, Pinus plantations can maximize ecological benefits without compromising water sustainability, thereby enhancing the long-term effectiveness of sand-fixing forests in the region.

4.4. Limitations and Future Prospects

This study has elucidated the water-use strategies of Pinus and Salix and their relevance for vegetation restoration, yet several limitations remain. First, although the analysis of water sources, which relied on in situ monitoring and stable isotope techniques, yielded valuable insights into spatial uptake patterns, the monthly sampling scheme may miss short-term dynamics following heavy rainfall, which did not constrain transient changes in soil water isotopes and plant response. Future research could integrate numerical modeling to more accurately quantify water movement and utilization within the soil–plant system. Second, the study was conducted over a two-year period and did not encompass extreme climate events or long-term climate change scenarios. Long-term observations are needed to better understand the feedback mechanisms between climate variability and plant water-use strategies. Additionally, the effects of varying site conditions and groundwater-level fluctuations on vegetation water uptake were not thoroughly considered in this study. Subsequent work should incorporate groundwater dynamics and soil hydrological processes to evaluate the long-term effects of vegetation restoration on regional water cycles. Finally, as the current findings are based on individual plant conditions, multi-density controlled experiments are essential to provide more precise guidance for optimizing afforestation design and enhancing ecological benefits.

5. Conclusions

Understanding the water consumption patterns of typical vegetation is essential for enhancing water-use efficiency and supporting sustainable vegetation restoration in arid and semiarid regions. The results indicate that Pinus primarily extracted water from deep soil layers (60.6% from the capillary support zone and saturation zone) and shallow layers (39.4% from the active zone and stable zone), while Salix derived 45.3% and 54.7% from these respective layers. From May to June, both vegetation types predominantly utilized soil water from the capillary support zone and saturation zone. Between July and September, they mainly consumed water from the active zone and stable zone. By late October, Pinus continued to rely more on the stable zone and capillary support zone, whereas Salix still primarily used water from the stable zone and active zone. Notably, during drought periods, Pinus exhibited a greater advantage over Salix in accessing deep soil water, which provided a stable water source to sustain its growth. Seasonal variations in the soil water profile, driven by fluctuations in precipitation and groundwater levels, were identified as the main factors influencing these shifts in water uptake patterns between the two species. From the perspective of water-use strategies, Pinus may possess a competitive advantage over Salix due to its ability to exploit deeper water sources. However, it is necessary to regulate its planting density appropriately to maximize ecological benefits.

Author Contributions

Writing—original draft, M.Z.; writing—review and editing, J.F.; visualization, M.Z. and Z.X.; formal analysis, M.Z., Z.X. and D.L.; resources, M.Z. and J.F.; investigation, Z.X. and D.L.; data curation, D.L. and J.H. All authors have read and agreed to the published version of the manuscript.

Funding

This research was funded by Open Fund of the State Key Laboratory of Water Resource Protection and Utilization in Coal Mining (Grant No. GJNY-23-37-14); National Natural Science Foundation of China (42407087); General Grant of China Postdoctoral Science Foundation (2022M720535).

Data Availability Statement

The data presented in this study are available on request from the corresponding author.

Acknowledgments

The authors thank the editors and reviewers for their helpful and insightful comments, which have significantly improved this work.

Conflicts of Interest

Author Fang Jie, Lei Da and Xing Zhen-guo were employed by the company State Key Laboratory of Water Resource Protection and Utilization in Coal Mining, Beijing and National Institute of Clean-and-Low-Carbon Energy, Beijing. The remaining authors declare that the research was conducted in the absence of any commercial or financial relationships that could be construed as a potential conflict of interest.

References

  1. Sun, S.; Xiang, W.; Ouyang, S.; Hu, Y.; Peng, C. Balancing Water Yield and Water Use Efficiency Between Planted and Natural Forests: A Global Analysis. Glob. Change Biol. 2024, 30, e17561. [Google Scholar] [CrossRef]
  2. Lan, Z.; Zhang, S.; Tanveer, A.; Wu, L.; Chang, W.; Li, X.; Zhang, J.; Fan, J. Fine-scale spatial distribution of soil organic carbon and its fractions after afforestation with Pinus sylvestris and Salix psammophila in a semiarid desert of China. J. Plant Ecol. 2021, 1, 141–154. [Google Scholar]
  3. Deng, J.; Yao, J.; Zheng, X.; Gao, G. Transpiration and canopy stomatal conductance dynamics of Mongolian pine plantations in semiarid deserts, Northern China. Agric. Water Manag. 2021, 249, 106806. [Google Scholar] [CrossRef]
  4. Nan, W.; Ta, F.; Meng, X.; Dong, Z.; Xiao, N. Effects of age and density of Pinus sylvestris var. mongolica on soil moisture in the semiarid Mu Us Dunefield, northern China. For. Ecol. Manag. 2020, 473, 118313. [Google Scholar] [CrossRef]
  5. Huang, J.; Li, Y.; Fu, C.; Chen, F.; Fu, Q.; Dai, A.; Shinoda, M.; Ma, A.; Guo, W.; Li, Z.; et al. Dryland climate change: Recent progress and challenges. Rev. Geophys. 2017, 55, 719–778. [Google Scholar] [CrossRef]
  6. Huang, L.; Shao, M. Advances and perspectives on soil water research in China’s loess plateau. Earth-Sci. Rev. 2019, 199, 102962. [Google Scholar] [CrossRef]
  7. Dai, J.; Li, Y.; Wang, L. Mixed-species plantations alleviate deep soil water depletion and facilitate hydrological niche partitioning compared to pure plantations. For. Ecol. Manag. 2023, 539, 121017. [Google Scholar] [CrossRef]
  8. Blicharska, M.; Smithers, R.; Mikusiński, G.; Rönnbäck, P.; Harrison, P.; Nilsson, M.; Sutherland, W. Biodiversity’s contributions to sustainable development. Nat. Sustain. 2019, 2, 1083–1093. [Google Scholar] [CrossRef]
  9. Sun, G.; Zhou, G.; Zhang, A.; Wei, X.; McNulty, S.; Vose, J. Potential water yield reduction due to forestation across China. J. Hydrol. 2006, 328, 548–558. [Google Scholar] [CrossRef]
  10. Shao, M.; Wang, Y.; Xia, Y.; Jia, X. Soil drought and water carrying capacity for vegetation in the critical zone of the Loess Plateau: A review. Vadose Zone J. 2018, 17, 1–8. [Google Scholar] [CrossRef]
  11. Wang, L.; Wang, Q.; Wei, S.; Shao, M.; Li, Y. Soil desiccation for Loess soils on natural and regrown areas. For. Ecol. Manag. 2008, 255, 2467–2477. [Google Scholar] [CrossRef]
  12. Farley, K.; Jobbágy, E.; Jackson, R. Effects of afforestation on water yield: A global synthesis with implications for policy. Glob. Change Biol. 2005, 11, 1565–1576. [Google Scholar] [CrossRef]
  13. Zhao, M.; Wang, W.; Wang, Z.; Chen, L.; Ma, Z.; Wang, Q. Water use of Salix in the variably unsaturated zone of a semiarid desert region based on in-situ observation. J. Hydrol. 2020, 591, 125579. [Google Scholar] [CrossRef]
  14. Jiao, J.R. Implementation and policy execution of removal lands from cultivation for afforestation project in the northwestern areas. Sci. Soil Water Conserv. 2005, 3, 4–9. [Google Scholar]
  15. Shen, Y.; Yang, Q.; Jing, K.; Xu, J. Thoughts and proposals on speeding up water and soil conservation and ecological environment construction on the Loess Plateau. Sci. Technol. Rev. 2003, 4, 55–59. [Google Scholar]
  16. Wang, X.; Lu, C.; Fang, J.; Shen, Y. Implications for development of grain-for-green policy based on cropland suitability evaluation in desertification-affected north China. Land Use Policy 2007, 24, 417–424. [Google Scholar] [CrossRef]
  17. Zhang, Q.; Xu, C.Y.; Yang, T. Variability of water resource in the Yellow River basin of past 50 years, China. Water Resour. Manag. 2009, 23, 1157–1170. [Google Scholar] [CrossRef]
  18. Zhou, H.; Van Rompaey, A.; Wang, J.A. Detecting the impact of the Grain for Green program on the mean annual vegetation cover in the Shaanxi province, China using SPOT-VGT NDVI data. Land Use Policy 2009, 26, 954–960. [Google Scholar] [CrossRef]
  19. Cao, S.; Chen, L.; Shankman, D.; Wang, C.; Wang, X.; Zhang, H. Excessive reliance on afforestation in China’s arid and semi-arid regions: Lessons in ecological restoration. Earth Sci. Rev. 2011, 104, 240–245. [Google Scholar] [CrossRef]
  20. Jiao, J.; Tzanopoulos, J.; Xofis, P.; Bai, W.; Ma, X.; Mitchley, J. Can the study of natural vegetation succession assist in the control of soil erosion on abandoned croplands on the Loess Plateau, China. Restor. Ecol. 2007, 15, 391–399. [Google Scholar] [CrossRef]
  21. Oki, T.; Kanae, S. Global hydrological cycles and world water resources. Science 2006, 313, 1068–1072. [Google Scholar] [CrossRef]
  22. Knighton, J.; Kuppel, S.; Smith, A.; Soulsby, C.; Sprenger, M.; Tetzlaff, D. Using isotopes to incorporate tree water storage and mixing dynamics into a distributed ecohydrologic modelling framework. Ecohydrology 2020, 13, e2201. [Google Scholar] [CrossRef]
  23. Knighton, J.; Singh, K.; Evaristo, J. Understanding catchment-scale forest root water uptake strategies across the continental United States through inverse ecohydrological modeling. Geophys. Res. Lett. 2020, 47, e2019GL085937. [Google Scholar] [CrossRef]
  24. Good, S.; Noone, D.; Bowen, G. Hydrologic connectivity constrains partitioning of global terrestrial water fluxes. Science 2015, 349, 175–177. [Google Scholar] [CrossRef] [PubMed]
  25. Schlesinger, W.; Jasechko, S. Transpiration in the global water cycle. Agric. For. Meteorol. 2014, 189, 115–117. [Google Scholar] [CrossRef]
  26. Liu, Z.; Yu, X.; Jia, G. Water utilization characteristics of typical vegetation in the rocky mountain area of Beijing, China. Ecol. Indic. 2018, 91, 249–258. [Google Scholar] [CrossRef]
  27. Pei, Y.; Huang, L.; Shao, M.; Jia, X.; Tang, X.; Zhang, Y.; Pan, Y. Water sources used by artificial Salix psammophila in stands of different ages based on stable isotope analysis in northeastern Mu Us Sandy Land. Catena 2023, 226, 107087. [Google Scholar] [CrossRef]
  28. Zhao, Y.; Wang, L.; Knighton, J.; Evaristo, J.; Wassen, M. Contrasting adaptive strategies by Caragana korshinskii and Salix psammophila in a semiarid revegetated ecosystem. Agric. For. Meteorol. 2021, 300, 108323. [Google Scholar] [CrossRef]
  29. Yang, B.; Wen, X.; Sun, X. Seasonal variations in depth of water uptake for a subtropical coniferous plantation subjected to drought in an East Asian monsoon region. Agric. For. Meteorol. 2015, 200, 218–228. [Google Scholar] [CrossRef]
  30. Pei, Y.; Huang, L.; Shao, M.; Zhang, Y.; Pan, Y. Water use pattern and transpiration of Mongolian pine plantations inrelation to stand age on northern Loess Plateau of China. Agric. For. Meteorol. 2023, 330, 109320. [Google Scholar] [CrossRef]
  31. Zhao, M.; Wang, W.; Ma, Z.; Wang, Q.; Wang, Z.; Chen, L.; Fu, B. Soil water dynamics based on a contrastive experiment between vegetated and non-vegetated sites in a semiarid region in Northwest China. J. Hydrol. 2021, 603, 126880. [Google Scholar] [CrossRef]
  32. Huo, G.; Zhao, X.; Gao, X.; Wang, S.; Pan, Y. Seasonal water use patterns of rainfed jujube trees in stands of different ages under semiarid plantations in China. Agric. Ecosyst. Environ. 2018, 265, 392–401. [Google Scholar] [CrossRef]
  33. Wang, J.; Fu, B.; Lu, N.; Zhang, L. Seasonal variation in water uptake patterns of three plant species based on stable isotopes in the semi-arid loess plateau. Sci. Total Environ. 2017, 609, 27–37. [Google Scholar] [CrossRef] [PubMed]
  34. Eggemeyer, K.; Awada, T.; Harvey, F.; Wedin, D.; Zhou, X.; Zanner, C. Seasonal changes in depth of water uptake for encroaching trees Juniperus virginiana and Pinus ponderosa and two dominant C4 grasses in a semiarid grassland. Tree Physiol. 2009, 29, 157–169. [Google Scholar] [CrossRef]
  35. Rothfuss, Y.; Javaux, M. Reviews and syntheses: Isotopic approaches to quantify root water uptake: A review and comparison of methods. Biogeosciences 2017, 14, 2199–2224. [Google Scholar] [CrossRef]
  36. Li, L.; Liu, H.; Zhao, W.; Guo, L.; Liu, J.; Zhou, H.; Su, Y.; Yetemen, O. Application of water-stable isotopes in quantitative identification of groundwater-dependent vegetations: A soil sampling strategy. J. Hydrol. 2025, 657, 133074. [Google Scholar] [CrossRef]
  37. Zhang, C.; Ren, Y.; Yan, M.; Sang, T.; Li, H.; Chen, Y.; Zhang, S. Stable isotopes δ18O and δ2H reveal differential water uptake from intercropped maize and soybean soil profiles. Field Crops Res. 2022, 288, 108695. [Google Scholar] [CrossRef]
  38. Song, Y.; Yan, D.; Liu, T.; Lu, Y.; Jiao, R.; Wen, Y.; Qin, T.; Weng, B.; Shi, W. The suitability of isotopic methods in identifying water sources of a shallow-rooted herbaceous plant in a desert steppe. Sci. Total Environ. 2023, 902, 166072. [Google Scholar] [CrossRef]
  39. Li, Y.; Ma, Y.; Song, X.; Wang, L.; Han, D. A δ2H offset correction method for quantifying root water uptake of riparian trees. J. Hydrol. 2021, 593, 125811. [Google Scholar] [CrossRef]
  40. Tong, X.; Zhang, J.; Meng, P.; Li, J.; Zheng, N. Ecosystem water use efficiency in a warm-temperate mixed plantation in the North China. J. Hydrol. 2014, 512, 221–228. [Google Scholar] [CrossRef]
  41. Hua, F.; Wang, X.; Zheng, X.; Fisher, B.; Wang, L.; Zhu, J.; Tang, Y.; Yu, D.; Wilcove, D. Opportunities for biodiversity gains under the world’s largest reforestation programme. Nat. Commun. 2016, 7, 12717. [Google Scholar] [CrossRef]
  42. Wu, J.; Liu, W.; Chen, C. How do plants share water sources in a rubber-tea agroforestry system during the pronounced dry season? Agric. Ecosyst. Environ. 2017, 236, 69–77. [Google Scholar] [CrossRef]
  43. Brum, M.; Vadeboncoeur, M.; Ivanov, V.; Asbjornsen, H.; Saleska, S.; Alves, L.; Penha, D.; Dias, L.; Aragão, L.; Barros, F.; et al. Hydrological niche segregation defines forest structure and drought tolerance strategies in a seasonal Amazon forest. J. Ecol. 2019, 107, 318–333. [Google Scholar] [CrossRef]
  44. Zhang, S.; Wang, X.; Huang, Z.; Bao, Y.; Jiang, J.; Liu, Z. Quercus acutissima exhibits more adaptable water uptake patterns in response to seasonal changes compared to Pinus massoniana. For. Ecosyst. 2025, 12, 100255. [Google Scholar] [CrossRef]
  45. Ma, L.; Ma, J.; Yan, P.; Tian, F.; Peñuelas, J.; Rao, M.; Fu, Y.; Hu, Z. Planted Forests in China Have Higher Drought Risk Than Natural Forests. Glob. Change Biol. 2025, 31, e70055. [Google Scholar] [CrossRef] [PubMed]
  46. Chen, Y.; Zha, T.; Zhang, H.; Zhao, L.; Wang, A.; Cui, Q.; Song, J.; Zhang, H.; Yu, Y.; Wang, D. Typical Plantation Water Use Strategies Are Determined by Environmental Conditions and Plant Eco-Physiology in Beijing, China. Forests 2023, 14, 2277. [Google Scholar] [CrossRef]
  47. Pei, Y.; Huang, L.; Shao, M.; Wang, J.; Zhang, Y. Patterns and drivers of seasonal water sources of artificial sand-fixing plants in the northeastern Mu Us Sandy Land. Pedosphere 2023, 34, 63–77. [Google Scholar] [CrossRef]
  48. Gao, X.; Zhao, X.; Li, H.; Guo, L.; Lv, T.; Wu, P. Exotic shrub species (Caragana korshinskii) is more resistant to extreme natural drought than native species (Artemisia gmelinii) in a semiarid revegetated ecosystem. Agric. For. Meteorol. 2018, 263, 207–216. [Google Scholar] [CrossRef]
  49. Tong, Y.; Liu, J.; Han, X.; Zhang, T.; Dong, Y.; Wu, M.; Qin, S.; Wei, Y.; Chen, Z.; Zhou, Y. Radial and seasonal variation of sap flow and its response to meteorological factors in sandy Pinus sylvestris var. mongolica plantations in the Three North Shelterbelt of China. Agric. For. Meteorol. 2023, 328, 109239. [Google Scholar] [CrossRef]
  50. Chen, B.; Liu, S.; Yu, J.; Huang, Y.; Yu, S.; Liu, H.; Zhang, T.; Liu, X.; Jin, G.; Chen, W.; et al. Stand Biomass of Pinus sylvestris var. mongolica Plantations Benefits from High Density Monocultures in the Boreal Zone. For. Ecosyst. 2024, 11, 100222. [Google Scholar] [CrossRef]
  51. Stock, B.; Semmens, B. MixSIAR GUI User Manual. Version 3.1. 2013. Available online: https://CRAN.R-project.org/package=MixSIAR (accessed on 10 August 2025).
  52. Adiku, S.; Rose, C.; Braddock, R.; Lafontaine, H. On the simulation of root water extraction: Examination of a minimum energy hypothesis. Soil Sci. 2000, 165, 226–236. [Google Scholar] [CrossRef]
  53. Hasselquist, N.; Allen, M. Increasing demands on limited water resources: Consequences for two endangered plants in Amargosa Valley, USA. Am. J. Bot. 2009, 96, 620–626. [Google Scholar] [CrossRef] [PubMed]
  54. Song, L.; Zhu, J.; Li, M.; Zhang, J.; Lv, L. Sources of water used by Pinus sylvestris var. mongolica trees based on stable isotope measurements in a semiarid sandy region of Northeast China. Agric. Water Manag. 2016, 164, 281–290. [Google Scholar] [CrossRef]
  55. Song, L.; Zhu, J.; Li, M.; Zhang, J. Water use patterns of Pinus sylvestris var. mongolica trees of different ages in a semiarid sandy lands of Northeast China. Environ. Exp. Bot. 2016, 129, 94–107. [Google Scholar] [CrossRef]
  56. Brinkmann, N.; Seeger, S.; Weiler, M.; Buchmann, N.; Eugster, W.; Kahmen, A. Employing stable isotopes to determine the residence times of soil water and the temporal origin of water taken up by Fagus sylvatica and Picea abies in a temperate forest. New Phytol. 2018, 219, 1300–1313. [Google Scholar] [CrossRef]
  57. Huang, L.; Zhang, Z. Stable isotopic analysis on water utilization of two xerophytic shrubs in a revegetated desert area: Tengger Desert, China. Water 2015, 7, 1030–1045. [Google Scholar] [CrossRef]
  58. Wang, L.; Mu, Y.; Zhang, Q.; Zhang, X. Groundwater use by plants in a semi-arid coal-mining area at the Mu Us Desert frontier. Environ. Earth Sci. 2013, 69, 1015–1024. [Google Scholar]
  59. Huang, J.; Zhou, Y.; Wenninger, J.; Ma, H.; Zhang, J.; Zhang, D. How water use of Salix psammophila bush depends on groundwater depth in a semi-desert area. Environ. Earth Sci. 2016, 75, 1–13. [Google Scholar] [CrossRef]
  60. Pei, Y.; Huang, L.; Shao, M.; Zhang, Y. Responses of Amygdalus pedunculata Pall. to water stress in sandy and loamy soils. J. Arid Land 2020, 12, 791–805. [Google Scholar]
  61. Song, L.; Zhu, J.; Zheng, X.; Wang, K.; Lü, L.; Zhang, X.; Hao, G. Transpiration and canopy conductance dynamics of Pinus sylvestris var. mongolica in its natural range and in an introduced region in the sandy plains of Northern China. Agric. For. Meteorol. 2020, 281, 107830. [Google Scholar] [CrossRef]
  62. Karnieli, A.; Gilad, U.; Ponzet, M.; Svoray, T.; Mirzadinov, R.; Fedorina, O. Assessing land-cover change and degradation in the Central Asian deserts using satellite image processing and geostatistical methods. J. Arid Environ. 2008, 72, 2093–2105. [Google Scholar] [CrossRef]
  63. Liu, S.; Bai, J.; Jia, Z.; Jia, L. Estimation of evapotranspiration in the Mu Us Sand land of China. Hydrol. Earth Syst. Sci. 2010, 14, 573–584. [Google Scholar] [CrossRef]
  64. Li, X.; Zhang, Z.; Huang, L.; Wang, X. Review of the ecohydrological processes and feedback mechanisms controlling sand-binding vegetation systems in sandy desert regions of China. Chin. Sci. Bull. 2013, 58, 1483–1496. [Google Scholar] [CrossRef]
  65. Asadalla, N.; Abdullah, M.; Al-Ali, Z.; Abdullah, M. Vegetation restoration targeting approach to identify the optimum environmental conditions for the restoration of native desert plants using remote sensing and MaxEnt modeling. Restor. Ecol. 2021, 29, e13425. [Google Scholar] [CrossRef]
  66. Halik, Ü.; Aishan, T.; Betz, F.; Kurban, A.; Rouzi, A. Effectiveness and challenges of ecological engineering for desert riparian forest restoration along China’s largest inland river. Ecol. Eng. 2019, 127, 11–22. [Google Scholar] [CrossRef]
  67. Sun, Z.; Mao, Z.; Yang, L.; Liu, Z.; Han, J.; Wang, H.; He, W. Impacts of climate change and afforestation on vegetation dynamic in the Mu Us Desert, China. Ecol. Indic. 2021, 129, 108020. [Google Scholar] [CrossRef]
  68. Luo, L.; Zhuang, Y.; Zhao, W.; Duan, Q.; Wang, L. The hidden costs of desert development. Ambio 2020, 49, 1412–1422. [Google Scholar] [CrossRef]
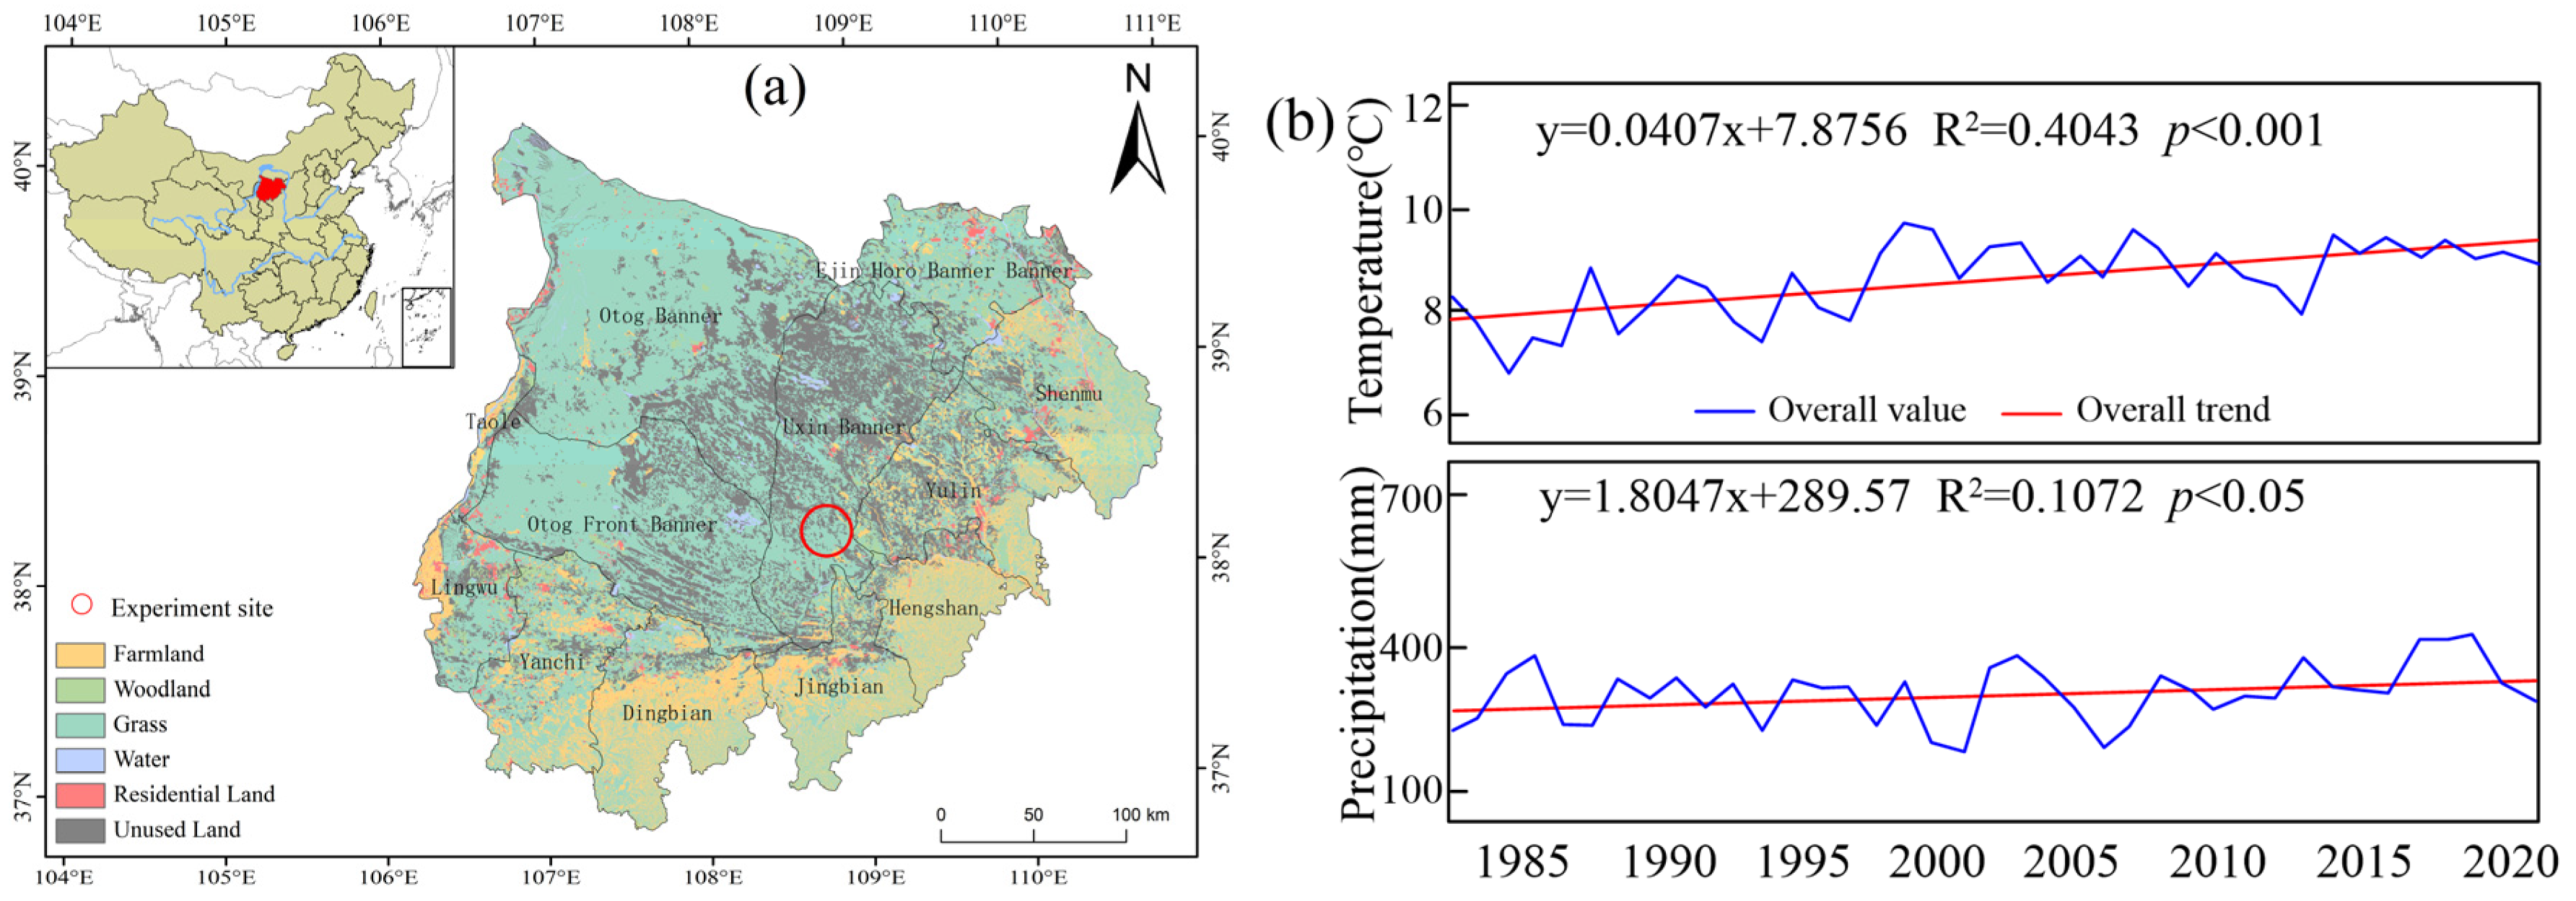
Figure 1. (a) Location of the Mu Us Sandy Land; (b) main meteorological elements trends.
Water 17 02895 g001
Figure 2. (a) In situ experiment plot layout; (b) details of the experiment plot and isotope sample collection information.
Water 17 02895 g002
Figure 3. Temporal variations in precipitation and its isotopic compositions (δ2H and δ18O).
Water 17 02895 g003
Figure 4. Relationships between the δ2H and δ18O values of precipitation from 2021 to 2022 in the study area.
Water 17 02895 g004
Figure 5. Temporal variations in water table depth and groundwater isotopic compositions (δ2H and δ18O).
Water 17 02895 g005
Figure 6. Temporal and spatial variations in the SMC in the Salix plot (top half) and Pinus plot (bottom half) in 2021 and 2022.
Water 17 02895 g006
Figure 7. Spatiotemporal distributions of δ2H (a) and δ18O (b) in the Pinus plot during the growing periods of 2021 and 2022.
Water 17 02895 g007
Figure 8. Spatiotemporal distributions of δ2H (a) and δ18O (b) in the Salix plot during the growing periods of 2021 and 2022.
Water 17 02895 g008
Table 1. The measured particle composition and hydraulic parameters of aeolian sand.
Particle CompositionHydraulic Parameters
Particle size (mm)Dry density
(g/cm3)
Residual soil moisture content (θr) (cm3/cm3)Saturated soil moisture content (θs) (cm3/cm3)a (cm−1)nKs
(cm/d)
0.05~
0.25
0.25~
0.075
0.075
~0.05
5.7%87.7%5.6%1.470.0210.3320.0362.44578
Table 2. Seasonal variations in the proportions of water consumed by Pinus from four water sources during the growing period.
YearMonthActive Zone (%)Stable Zone (%)Capillary Support Zone (%)Saturation Zone (%)
2021May9.2 ± 3.1%10.7 ± 4.0%31.6 ± 7.2%48.5 ± 5.5%
June19.4 ± 4.0%21.1 ± 1.0%20.7 ± 4.1%38.8 ± 3.3%
July28.5 ± 1.4%20.7 ± 2.5%22.9 ± 1.0%27.9 ± 2.0%
August29.9 ± 2.1%40.3 ± 1.4%19.7 ± 2.7%10.1 ± 3.4%
September19.3 ± 1.8%26.7 ± 2.6%33.3 ± 3.1%20.7 ± 2.1%
October20.0 ± 2.5%27.6 ± 1.5%32.9 ± 1.8%19.5 ± 1.3%
Annual average21.1 ± 3.7%24.5 ± 2.8%26.9 ± 4.5%27.5 ± 3.5%
2022May3.1 ± 2.6%10.1 ± 5.1%26.7 ± 3.6%60.1 ± 3.8%
June18.2 ± 3.3%17.2 ± 3.6%7.3 ± 2.3%57.3 ± 4.2%
July17.9 ± 1.8%13.3 ± 3.3%18.8 ± 2.1%50.0 ± 1.7%
August22.2 ± 1.4%20.3 ± 1.3%27.2 ± 3.0%30.3 ± 1.1%
September21.4 ± 2.0%22.1 ± 2.2%28.4 ± 1.5%28.1 ± 2.4%
October12.3 ± 2.1%20.0 ± 2.1%37.4 ± 1.8%30.3 ± 1.0%
Annual average15.9 ± 3.4%17.2 ± 3.2%24.3 ± 3.6%42.6 ± 3.2%
Two-year average18.5 ± 3.8%20.9 ± 3.1%25.6 ± 3.7%35.0 ± 3.4%
Table 3. Seasonal variations in the proportions of water consumed by Salix from four water sources during the growing period.
YearMonthActive Zone (%)Stable Zone (%)Capillary Support Zone (%)Saturation Zone (%)
2021May17.7 ± 4.7%29.9 ± 6.1%23.1 ± 2.8%29.3 ± 1.5%
June18.4 ± 1.1%32.6 ± 2.7%24.6 ± 1.7%24.4 ± 1.6%
July21.0 ± 5.4%29.5 ± 1.9%25.9 ± 3.3%23.6 ± 0.8%
August28.3 ± 1.7%25.8 ± 2.4%21.4 ± 1.6%24.5 ± 1.1%
September32.2 ± 3.8%22.9 ± 5.1%25.2 ± 1.6%19.7 ± 1.2%
October43.5 ± 2.9%24.1 ± 2.4%20.3 ± 2.0%12.1 ± 1.6%
Annual average26.9 ± 3.3%27.4 ± 3.7%23.4 ± 2.9%22.3 ± 1.5%
2022May18.1 ± 5.0%17.8 ± 3.0%23.0 ± 1.8%41.1 ± 2.3%
June38.2 ± 4.1%21.3 ± 2.6%18.3 ± 2.8%22.2 ± 1.7%
July31.0 ± 1.7%31.2 ± 4.6%16.0 ± 1.7%21.8 ± 2.0%
August42.9 ± 2.2%23.8 ± 4.5%18.9 ± 2.4%14.1 ± 1.4%
September21.4 ± 3.1%24.0 ± 1.3%40.8 ± 1.0%13.8 ± 1.1%
October40.3 ± 3.7%20.2 ± 2.6%25.5 ± 1.5%14.0 ± 1.7%
Annual average32.0 ± 3.6%23.1 ± 4.1%23.7 ± 2.8%21.2 ± 2.2%
Two-year average29.4 ± 3.5%25.3 ± 4.0%23.6 ± 3.0%21.7 ± 2.4%
Disclaimer/Publisher’s Note: The statements, opinions and data contained in all publications are solely those of the individual author(s) and contributor(s) and not of MDPI and/or the editor(s). MDPI and/or the editor(s) disclaim responsibility for any injury to people or property resulting from any ideas, methods, instructions or products referred to in the content.