Abstract
In response to the increasing demand for environmentally friendly and cost-effective adsorbents in wastewater treatment, this study reports the green synthesis, characterization, and application of a magnetic epichlorohydrin Rosa canina (m-ECH-RC) nanocomposite for removing Safranin O (SO), a commonly used cationic dye in textile effluents. The synthesized material was characterized using Brunauer–Emmett–Teller (BET), Fourier transform infrared spectroscopy (FT-IR), scanning electron microscopy (SEM), X-ray diffraction (XRD), and zeta potential analyses to reveal its surface morphology, pore structure, functional groups, crystallinity, and colloidal stability. Adsorption performance was systematically tested under various conditions, including pH, adsorbent dose, contact time, ionic strength, and initial dye concentration. Kinetic analyses revealed that the adsorption process of Safranin O dye mainly obeys pseudo-second-order kinetics, but intraparticle and film diffusion also contribute to the process. As a result of the Isotherm analysis, it was found that the adsorption process conformed to the Langmuir model. Testing on real textile wastewater samples demonstrated a removal efficiency of 75.09% under optimized conditions. Reusability experiments further revealed that the material maintained high adsorption–desorption performance for up to five cycles, emphasizing its potential for practical use. These findings suggest that m-ECH-RC is a viable and sustainable adsorbent for treating dye-laden industrial effluents.
1. Introduction
The rapid increase in agricultural and industrial production to meet human needs has brought various environmental problems that threaten the ecological balance. We face environmental pollution in air, water, and soil, especially in densely populated areas and those with dense industrial facilities [1,2,3,4]. Wastewater from the textile industry accounts for approximately 10 per cent of the total pollutants in global water resources. Dyes are among the primary pollutants in wastewater [5,6].
The textile industry uses approximately 10,000 dyes for various colouring purposes every year. Approximately 25% of the dyes are used for colouring, while the remaining amount is released as waste [3]. Industrial wastewater containing synthetic dyes reduces light penetration in rivers, lakes, and streams, leading to decreased oxygen levels. Consequently, the availability of food resources for aquatic organisms diminishes, disrupting the balance of aquatic ecosystems and adversely affecting aquatic life [7]. With the increasing production and widespread use of organic substances, the discharge of residues into the environment has increased, resulting in increasingly complex compositions and making dye wastewater treatment more challenging [8,9,10].
Dyes are divided into different categories according to their chemical composition (anthraquinone, xanthenes, etc.) or ionic charge (anionic, neutral, cationic) [11]. SO, a cationic dye, is one of the most popular red dyes widely used in various fields such as food colouring, cotton dye, fibre, household yarn, silk, lining and bed linen [12]. SO is found in industrial discharge waters and, when released into the aquatic environment, reduces photosynthetic activity by reducing light transmittance, negatively affects aquatic organisms and microorganisms, and threatens human health if not treated appropriately [13,14]. Therefore, removing dyes from wastewater is vital for the protection of aquatic ecosystems and environmental sustainability.
Numerous methods, such as filtration [15], ion exchange [16], adsorption [17], biosorption [18], and electrochemical [19,20], reverse osmosis, flocculation [21], membrane filtration [22], and photocatalysis [23,24], are used to remove dyes from the aquatic environment. These technologies are widely utilised due to their established status, ease of use, and numerous practical applications. In many different processing technologies, adsorption is typically thought to be better than competing technologies in terms of cost, versatility, compact design, ease of use, and sensitivity to harmful pollutants [25,26]. Different adsorbents, such as polymer-based adsorbents [27], modified graphite [28], agricultural wastes [29], organic solid wastes [30,31], and hybrid materials, have been used to remove impurities from aqueous solutions. High surface area, mechanical and physical stability, and above all a large number of binding groups are characteristics of effective adsorbent materials. The ease of recovery is another important feature of a prospective sorbent [26].
In this study, the usability of Rosa canina (RC), an organic waste in the environment, as an adsorbent in removing SO dye from wastewater by the adsorption method was investigated by making it magnetic. BET, FT-IR, SEM, XRD, and zeta potential characterized m-ECH-RC. The optimum conditions for the adsorption of SO were determined in the batch system with the characterized magnetic RC. The determined conditions were applied to real wastewater, and adsorption and desorption studies were carried out.
2. Materials and Methods
2.1. Chemicals
The study included chemicals from Sigma Aldrich in the United States, including FeCl2.4H2O, FeCl3.6H2O, NH4OH, CH3COOH, chitosan, epichlorohydrin, HCl, NaOH, and Safranin O. There was no purification of the compounds.
2.2. Apparatus
The concentrations of the SO dye solutions used in the tests were measured using a UV-Vis spectrophotometer (GenesysTM 10S UV-Vis, Thermo Scientific, USA). A Labconco Water Pro PS model pure water device was used to obtain the pure water used in the experiments.
2.3. Preparation of m-ECH-RC Nanocomposite
In this study, RC seed powder was used as the material for preparing magnetic adsorbents. RC was obtained from a local market. After separation from the fruit, the seeds were washed and dried at 40 °C. The adsorbents were prepared by grinding and passing through a 150-µm sieve to ensure uniform particle sizes.
RC (0.5 g) was added to 30 mL of FeCl3.6H2O and FeCl2.4H2O (2:1 molar concentration ratio) solution and stirred for one hour (25 °C). Then, the prepared mixture was titrated with a 26% NH4OH solution. Black precipitates were obtained in this part. The resulting precipitates were washed until the solution had a neutral pH and dried at 70 °C. Fe3O4/RC was passed through a 150 µm sieve to equalize the particle sizes [32].
A 1.5/0.5 g ratio of chitosan–Fe3O4/RC was added to 50 mL of a 5% acetic acid solution and stirred at room temperature for 24 h. The chitosan-Fe3O4/RC mixture was added to 1 L of a 0.5 mol L−1 NaOH solution. The resulting beads were washed with pure water until the pH reached neutrality. The resulting beads were in a water bath with 90 mL of 1% epichlorohydrin at 40 °C for 4 h. After that, the beads were cleaned with purified water and dried at 30 °C [33]. The preparation scheme of m-ECH-RC nanocomposite is given in Figure 1.
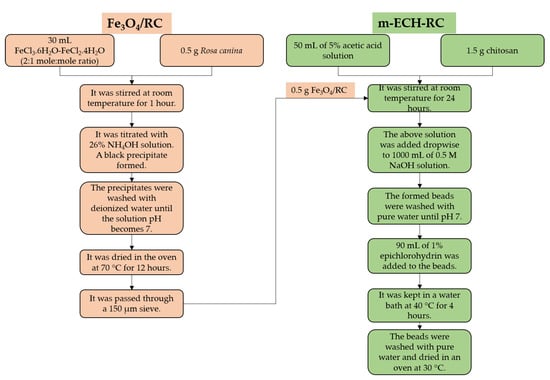
Figure 1.
Preparation steps of m-ECH-RC nanocomposite.
2.4. Characterization Studies
A BET (Quantachrome/IQ-Chemi) device was used to measure the mean pore radius and total pore volume of the nanocomposite. Both before and after adsorption, FT-IR analysis (Thermo Scientific, Waltham, MA, USA, Nicolet 6700) was performed to identify the molecular composition of the m-ECH-RC nanocomposite. SEM (FEI Model Quanta 450 FEG, Hillsboro, OR, USA) was used to visualize the size and surface morphology of the nanocomposite material. An X-ray diffractometer (Rigaku SmartLab) was used to perform XRD investigations in the 5–60° (2θ) reading range. Nanoparticles were subjected to m-ECH-RC particle size measurements utilizing a Zetasizer/Nano ZSP particle size and zeta potential measuring instrument.
2.5. Adsorption Studies
The appropriate adsorption conditions were investigated with the prepared nanocomposite. To ensure maximum dye adsorption, various parameters, including pH, adsorbent amount, contact time, initial adsorbate concentration, salt effect, and adsorption–desorption cycle, were examined in a batch system, and the optimum conditions were determined. Additionally, these optimal adsorption conditions were investigated using real wastewater.
Adsorption capacity was calculated using the following equation [34]:
The percentage of dye removal:
: Adsorption capacity (mg g−1)
: Initial concentration of adsorbate (mg L−1)
: Concentration of adsorbate at equilibrium time (mg L−1)
: Volume of dye (L)
: Amount of adsorbent (g)
The rate constants of the adsorption steps were calculated using pseudo-first-order pseudo-second-order, and intraparticle diffusion kinetic models. Langmuir, Freundlich, and D-R isotherm models were used in isotherm studies [35,36].
Pseudo-first-order kinetic model;
Pseudo-second-order kinetic model;
Intraparticle diffusion kinetic model;
Langmuir isotherm model;
Freundlich isotherm model;
D-R isotherm model;
where is the maximum amount of dye adsorbed on the adsorbent at equilibrium (mg g−1), is the maximum adsorption capacity (mg g−1), is the amount of adsorbed substance per unit adsorbent at time t (mg g−1), is the pseudo-first-order adsorption rate constant (min−1), is the pseudo-second-order adsorption rate constant (g mg−1 min−1), is the Freundlich constant related to adsorption capacity (L mg−1), is the constant depending on the adsorption of the adsorbate (L mg−1), is the diffusion constant (intraparticle) (mg g−1 min−1), is an experimental constant that depends on the adsorbent structure and temperature, is the constant indicating the layer thickness of the adsorption process, is the concentration of the substance remaining in the solution after adsorption (mg L−1), is time (min), is the D-R constant (L mg−1), and is Polanyi potential (KJ mol−1).
3. Results
3.1. Characterization of m-ECH-RC Nanocomposite
The characterization of the m-ECH-RC nanocomposite material used in the study was performed using BET, FT-IR, SEM, XRD, and zeta potential techniques.
3.1.1. m-ECH-RC Nanocomposite BET Analysis
The BET surface area of m-ECH-RC was found to be 4.92 m2 g−1 before adsorption and ~0 m2 g−1 after adsorption. It can be said that the surface was filled or covered after adsorption. The measured pore radius was calculated as 29.07 Å before adsorption and 486.39 Å after adsorption. An increase in the pore radius was observed after adsorption. After adsorption, small and medium-sized pores were filled, leaving only the wide channels in the measurement. The total pore volume was 0.28 cc g−1 before adsorption and 7.15 10−3 cc g−1 after adsorption. The pore volume decreased significantly after adsorption. This shows that the pores were partially filled during adsorption, and the void volume decreased. This volume decreases when the adsorbed substances occupy the pores, indicating effective adsorption (Table 1).

Table 1.
BET analysis results of m-ECH-RC.
3.1.2. m-ECH-RC Nanocomposite FT-IR Analysis
Figure 2 shows the coaxial FT-IR spectra of m-ECH-RC before adsorption (a) and after adsorption with SO (b). The characteristic functional groups of the starting materials chitosan, RC, epichlorohydrin, and the Fe3O4 nanocomposite along with peak assignments for the nanocomposite and the changes following SO dye adsorption are detailed in Table 2. In the m-ECH-RC nanocomposite, the broad absorption bands observed at 3360 cm−1 and 3289 cm−1 are attributed to the overlapping O−H stretching vibrations from polyphenols and flavonols in RC and the N−H stretching vibrations of chitosan, respectively [37,38,39,40]. The N−H stretching band appears as a weak shoulder, partially obscured by the more intense O−H peak. After the SO dye was adsorbed, a very slight shift was observed in the peaks at 3354 cm−1 and 3288 cm−1. This shift is believed to be caused by hydrogen bonding between the amine (−NH2) and nitrogen atoms in the SO structure and the hydroxyl (−OH) and amine (−NH) groups of chitosan and the hydroxyl (−OH) groups of the polyphenols in RC with the SO dye molecule (Figure 3).
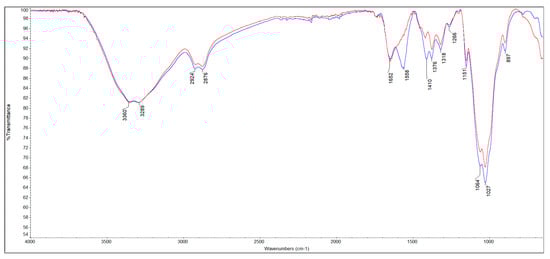
Figure 2.
FT-IR spectra of m-ECH-RC before adsorption (blue line), after adsorption (red line).
Table 2.
FT-IR analysis values (cm−1) of m-ECH-RC before and after adsorption and observed changes.
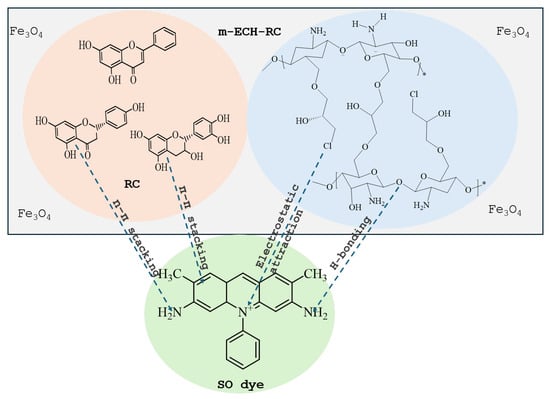
Figure 3.
Interaction mechanism of ECH-RC with SO.
Additionally, the aromatic −C=C− stretching peak, characteristic of RC, was initially observed at 1652 cm−1 and subsequently shifted to 1646 cm−1 after adsorption. This red shift is indicative of a π-π stacking interaction between the aromatic rings of the polyphenols and flavonoids present in the RC component and the aromatic rings within the SO dye molecule [38]. A N−H bending vibration peak, initially detected at 1558 cm−1, shifted to a higher wavenumber of 1592 cm−1 following adsorption of the SO dye [38]. This spectral shift was accompanied by a noticeable decrease in peak intensity. These changes are attributed to the formation of hydrogen bonds between the dye molecule and the nanocomposite, thus providing evidence for a successful adsorption process. After the adsorption of SO dye, the C−H bending peaks at 1410 cm−1 and 1376 cm−1, along with the C−O stretching peaks at 1064 cm−1 and 1027 cm−1, were observed to shift and decrease in intensity. This spectral evidence confirms the successful adsorption of the dye onto the m-ECH-RC nanocomposite.
3.1.3. m-ECH-RC Nanocomposite SEM Analysis
Scanning electron microscopy photomicrographs of m-ECH-RC taken before and after adsorption are given in Figure 4. As shown in Figure 4a, the biosorbent surface exhibits a highly porous structure. When looking at the SEM photomicrographs of the nanocomposite after adsorption in Figure 4b, it is clearly seen that large parts of the m-ECH-RC binding sites are covered with dye molecules.
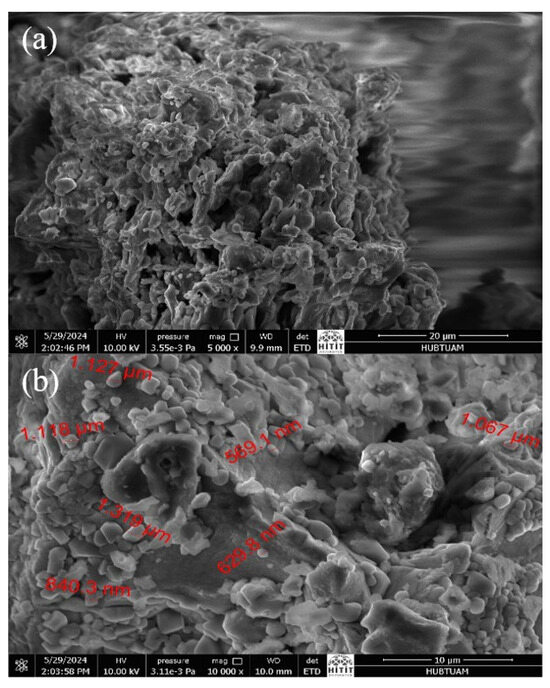
Figure 4.
SEM photomicrographs of m-ECH-RC (a) before adsorption, (b) after adsorption.
3.1.4. m-ECH-RC Nanocomposite XRD Analysis
Figure 5 shows the XRD patterns of m-ECH-RC before and after adsorption with SO. A prominent diffraction peak was observed at 2θ = 20.29°, which corresponds to chitosan crystallinity [41]. Also, a reflection at 2θ = 35.30° was observed, which can be associated with magnetite nanoparticles [42]. Other characteristic peaks of Fe3O4 were not observed at high angles. This is because the amorphous carbon layer attenuates the diffraction signal of the Fe3O4 core [43]. The intensity decreases and slight peak shifts observed in these diffraction peaks after the adsorption process further revealed that there was a disruption in the crystalline order of the composite, and the structure acquired a more amorphous character. Therefore, the XRD results indicate the presence of Fe3O4 phases, but cannot be considered definitive evidence of crystalline Fe3O4 formation.
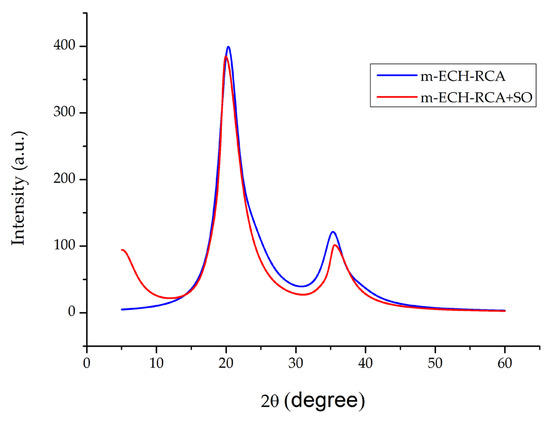
Figure 5.
XRD pattern of m-ECH-RC before adsorption and after adsorption with SO.
3.1.5. Zeta Potential
The zeta potential value of m-ECH-RC before adsorption was found to be −2.74 mV (±6.96 mV). This indicates that the adsorbent surface has a slight negative charge. After adsorption with m-ECH-RC, the zeta potential of SO is 0.561 (±7.05 mV) (Figure 6). This change can be explained by the partial neutralization of the surface charge as a result of the electrostatic interactions between the SO dye molecules with cationic structure and the negatively charged functional groups (−OH, NH2) on the surface, and the increase observed in the zeta potential after adsorption indicates that the charge structure of the surface has changed, causing the adsorbate to bind to the surface and become charge-neutral or partially positive [44]. Based on the zetasizer results, the particle size of m-ECH-RC is 847.5 nm, with a polydispersity index of 0.663. After adsorption of SO with m-ECH-RC, the particle size increased to 1172 nm, and the polydispersity index rose to 0.832. The increase in particle size shows that the adsorption of SO onto m-ECH-RC was successful.
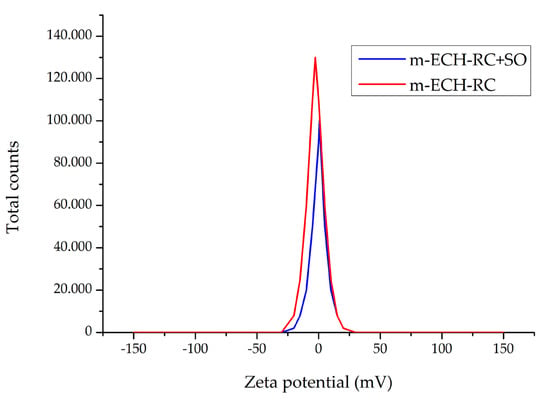
Figure 6.
Change in zeta potential of m-ECH-RC before and after adsorption.
3.2. Batch System Adsorption Studies
This section looked at the ideal circumstances for SO dye adsorption onto the m-ECH-RC nanocomposite. First, the batch system was employed to investigate the effects of pH, adsorbent quantity, salt presence, contact time, and adsorbate concentration.
As pH changes, so does the adsorbent’s adsorption capacity. The adsorption capability of m-ECH-RC was investigated in this study by varying the pH of the dye solution from 2 to 8. The adsorption capacity rose when the pH of the SO dye solution was raised from 2 to 6, as seen in Figure 7. The capacity did not significantly alter above pH 6. Since the SO dye used in the experiment had an initial pH of 5.3, this value was determined to be the ideal pH, and no further pH adjustments were made for the following parameters.
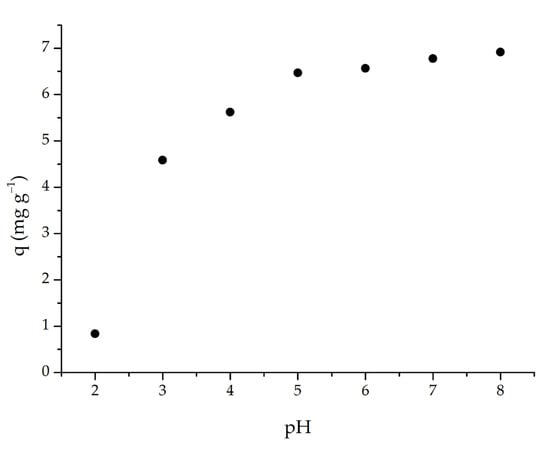
Figure 7.
pH effect on the adsorption of SO with m-ECH-RC (adsorption conditions; 25 mL 25 mg L−1 SO, 0.1 g m-ECH-RC, 60 min contact time).
To examine the effect of adsorbent amount on adsorption efficiency, the m-ECH-RC range was tested between 0.05 and 0.2 g. Figure 8 shows the experimental data. The graph indicates that as the amount of m-ECH-RC increases from 0.08 g to 0.15 g, the removal percentage increases from 55% to 95.12%. Beyond 0.15 g, the removal rate stays relatively stable. This improvement in SO dye removal is due to the increased surface area available for adsorption as the amount of m-ECH-RC grows. These results suggest that 0.15 g of m-ECH-RC is the optimal dosage, which was used in subsequent studies.
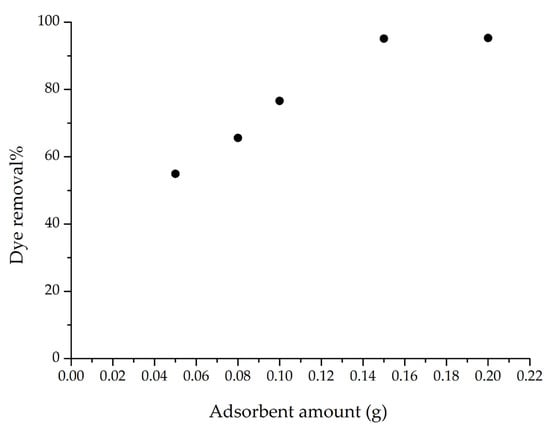
Figure 8.
Adsorbent amount on the adsorption of SO with m-ECH-RC (adsorption conditions; 25 mL 25 mg L−1 SO, original pH of SO (pH = 5.3), 60 min contact time).
Considering real wastewater conditions, the effect of salt on dye adsorption using m-ECH-RC nanocomposite is a crucial factor. This is because surface complexation and ion exchange mechanisms may vary depending on the pH and ionic strength of the medium. The results of the adsorption study conducted at different salt concentrations are shown in Figure 9. In the presence of NaCl at concentrations between 0.01–0.10 mol L−1, the adsorption capacity (q) decreased only slightly, remaining around 7.6–7.7 mg g−1. When a mixture of NaCl and CaCl2 was used within the same concentration range, q values decreased to approximately 6.6–6.8 mg g−1 and were around 0.9–1.1 mg g−1 (about 12–15%) lower than those in NaCl alone; the decline was slightly more noticeable at higher salt concentrations. The observation that the capacity remained nearly constant in the NaCl medium suggests that electrostatic attraction is not the only factor in SO removal. Instead, physical adsorption processes, such as van der Waals forces, hydrogen bonding, hydrophobic interactions, and surface-based interactions play a significant role [45]. Conversely, the presence of Ca2+ ions in the mixture increases the ionic strength of the solution, leading to compression of the double layer and weakening electrostatic attraction between the dye and the surface. These ions compete with or temporarily neutralise negatively charged active surface regions, reducing available binding sites and decreasing diffusion and contact area within the solution. Consequently, the capacity is systematically lower in the NaCl+CaCl2 medium.
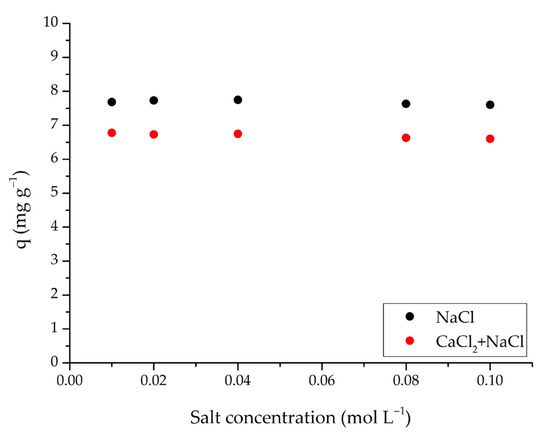
Figure 9.
Effect of salt concentration on the adsorption of SO dye by m-ECH-RC (adsorption conditions; 25 mL 25 mg L−1 SO, original pH of SO (pH = 5.3), 0.15 g m-ECH-RC, 60 min contact time).
The adsorption of SO dye with m-ECH-RC nanocomposite was studied over a mixing time of 15–90 min. According to the results of this study (Figure 10), the adsorption capacity initially increased with longer mixing times. It is observed that the capacity is fixed as the adsorption reaches equilibrium at the 60th minute.
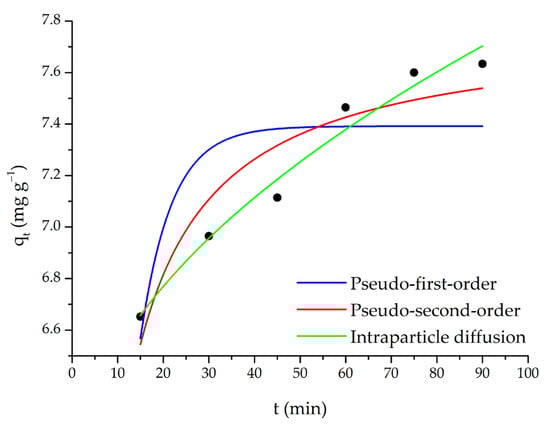
Figure 10.
Pseudo-first-order, pseudo-second-order, and intraparticle diffusion kinetic models (adsorption conditions; 25 mL 25 mg L−1 SO, original pH of SO (pH = 5.3), 0.15 g m-ECH-RC).
The initial dye concentration significantly affects the amount of dye removed from the aqueous solution. SO adsorption initially increases with rising SO concentration and then reaches saturation (Figure 11). Therefore, the maximum adsorption capacity is attained at the optimal amount of adsorbent. Beyond this point, the adsorption capacity remains constant.
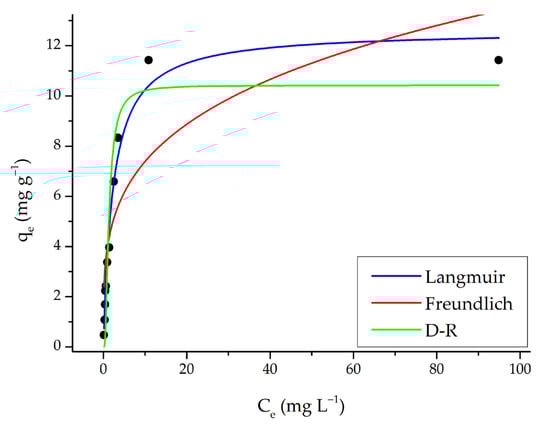
Figure 11.
Langmuir, Freundlich, and D-R isotherm models (adsorption conditions; 25 mL, original pH of SO (pH = 5.3), 0.15 g m-ECH-RC, 60 min contact time).
3.3. Kinetic Calculations
For this purpose, experimental results from contact time were applied to the data. The validity of the theoretical model, as represented by the model equation, was assessed through nonlinear fitting regression analysis, and the results are presented in Figure 10 and Table 3.
Table 3.
Fitting parameters of pseudo-first-order, pseudo-second-order, and intraparticle diffusion kinetic models.
Pseudo-first-order, pseudo-second-order, and intraparticle diffusion models were evaluated to explain the adsorption kinetics of SO dye (Figure 10, Table 3). The results showed that the pseudo-first-order model showed a poor fit to the experimental data, with a low correlation coefficient (R2 = 0.613) and a high error value (χ2 = 0.0745). Furthermore, the calculated equilibrium capacity (qe = 7.39 mg g−1) showed a significant deviation from the experimental data, demonstrating that this model is inadequate to explain the adsorption process. The pseudo-second-order model was found to have a higher fit coefficient (R2 = 0.878) and a lower error value (χ2 = 0.0236) than the pseudo-first-order model. Additionally, the calculated qe (7.78 mg g−1) value was found to be closer to the experimental results. This indicates that the adsorption mechanism largely conforms to pseudo-second-order kinetics and that the process bears the characteristics of chemical adsorption (chemisorption), such as electron sharing or exchange. When the intraparticle diffusion model was evaluated, the correlation coefficient was found to be relatively high (R2 = 0.974) and the error value was low (χ2 = 0.00499). This result demonstrates that intraparticle diffusion is an influential step in the adsorption process. However, the non-zero calculated C (5.94 mg g−1) value indicates that adsorption is not limited to intraparticle diffusion alone and that the boundary layer (film diffusion) resistance also plays an important role.
Overall, the pseudo-second-order model appears to be more suitable for the adsorption of SO dye, with both intraparticle and film diffusion contributing to the process. This finding suggests that the adsorption mechanism is complex, with both chemical interactions and mass transfer processes operating simultaneously.
3.4. Isotherm Calculations
Experimental data obtained from concentration experiments were evaluated with isotherm models widely used in the literature to explain the adsorption mechanism; in this context, nonlinear fit analyses were performed on the isotherm models, and the results are presented in Figure 11 and Table 4.
Table 4.
Fitting parameters of Langmuir, Freundlich, and D-R isotherm models.
Experimental data obtained from concentration experiments were evaluated with isotherm models widely used in the literature to explain the adsorption mechanism; in this context, nonlinear fit analyses were performed on the isotherm models, and the results are presented in Figure 11 and Table 4. The Langmuir model assumes that the surface exhibits homogeneous and monolayer adsorption properties. The correlation coefficient (R2 = 0.977) listed in the table is quite high, indicating that the experimental data fit the model very well. The maximum adsorption capacity (qmax = 12.6 mg g−1) shows that the SO dye binds strongly to the adsorbent surface until saturation is reached. Additionally, the low χ2 value (0.369) supports the model’s good fit to the data. Therefore, it can be concluded that adsorption occurs in accordance with a monolayer and homogeneous surface. The Freundlich model is suitable for heterogeneous surfaces and multilayer adsorption. According to the results in the table, the correlation coefficient (R2 = 0.719) for the Freundlich model is lower than that for the Langmuir model. Furthermore, the χ2 value (4.51) is higher, indicating a weaker fit to the Freundlich model. The Freundlich constant n = 3.77, with a value of n > 1, indicates favorable adsorption and the presence of heterogeneous binding sites on the adsorbent surface. However, the overall fit is weaker than that for the Langmuir model. When the average adsorption energy derived from the β parameter (2.24 L mg−1) is examined, values of ε < 8 kJ mol−1 generally indicate physical adsorption, whereas values between 8 and 16 kJ mol−1 suggest ion exchange [46]. This low value implies that adsorption mainly occurs through physical mechanisms (van der Waals or electrostatic interactions). Additionally, an χ2 value of 1.66 is considered acceptable.
3.5. Real Wastewater Application
To evaluate the adsorption efficiency of SO dye using the m-ECH- RC nanocomposite in real wastewater conditions, effluent water from a textile factory in Çorum was utilized. The wastewater was prepared with a dye concentration of 25 mg L−1, and the adsorption study was performed under optimal conditions (original solution pH, 0.05 g of adsorbent, and 30 min of mixing). The removal efficiency of SO dye in this real wastewater was determined to be 75.09%. These results suggest that the m-ECH-RC nanocomposite is highly effective at removing SO in actual wastewater scenarios.
3.6. Desorption and Reusability
The desorption and reusability of m-ECH-RC nanocomposites were tested through multiple cycles. Reusability is a key factor for an adsorbent. Besides having high adsorption efficiency, the ability to desorb is also crucial. High desorption efficiency means the dye can be removed from the adsorbent surface and recovered, which is also crucial for achieving cost savings. For this purpose, the desorption process was carried out by contacting the adsorbent with 0.1 mol L−1 NaOH solution for 60 min in each cycle. Figure 12 displays the results of 10 adsorption–desorption cycles of the m-ECH-RC adsorbent for SO dye. It is observed that both adsorption and desorption efficiencies remained high (90–100%) during the first five cycles. This indicates that m-ECH-RC exhibits good reusability, with its chemical structure remaining stable during the initial cycles. However, as the cycle number increases, a significant decline in both efficiencies occurs, especially after the 7th cycle. By the end of the 10th cycle, the adsorption efficiency dropped to around 50%, while the desorption efficiency stayed between 55% and 60%. This decline may result from a reduction in the number of active sites on the adsorbent surface, structural deterioration, or incomplete regeneration during the recovery process. In conclusion, while the m-ECH-RC adsorbent shows potential for multiple uses, its high efficiency appears to be limited to a few reuse cycles.
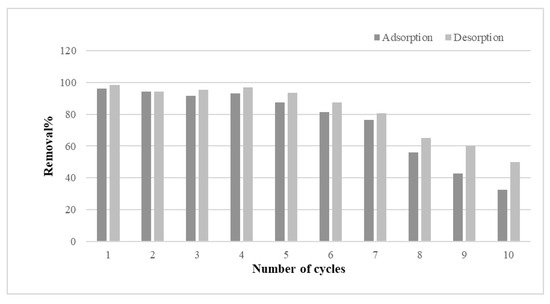
Figure 12.
Adsorption–desorption cycle of SO dye with m-ECH-RC.
4. Discussion
In this study, a Rosa canina-based magnetic epichlorohydrin–chitosan (m-ECH-RC) nanocomposite was successfully synthesized and characterized using BET, FT-IR, SEM, XRD, and zeta potential analyses. Experiments demonstrated that this nanocomposite is an effective and environmentally friendly adsorbent for the removal of Safranin O dye from water. The most excellent SO adsorption capacity of 7.946 mg g−1 was demonstrated by the m-ECH-RC nanocomposite under ideal batch conditions (pH 5.3, 0.15 g adsorbent dose, 60 min contact time). Kinetic studies revealed that the adsorption process primarily follows pseudo-second-order kinetics, but intraparticle and film diffusion also contribute to the mechanism. Isotherm analyses indicated that the process conformed to the Langmuir model, demonstrating homogeneous, monolayer adsorption. In real wastewater applications, the nanocomposite achieved a removal efficiency of 75.09%, confirming its effectiveness in complex effluent matrices beyond synthetic laboratory solutions. Reusability assessments over ten adsorption–desorption cycles revealed that the adsorbent maintained high efficiency (over 90%) during the first five cycles but gradually declined in performance after the seventh cycle, ultimately retaining about 50% efficiency in the tenth cycle. These results indicate that while the material is reusable, regeneration efficiency diminishes over time, potentially due to loss of active sites or structural fatigue.
Collectively, the findings support the m-ECH-RC nanocomposite as a sustainable, low-cost, and efficient adsorbent for dye-laden wastewater treatment. The use of agricultural waste material (RC) also highlights the circularity of the approach, contributing to resource recovery and waste minimization. From a policy and practice stand-point, the integration of such adsorbents into decentralized or pre-treatment stages of industrial effluent management may offer viable, scalable alternatives for addressing dye pollution in low-resource settings.
Author Contributions
Conceptualization, B.A. and İ.T.S.; methodology, T.C. and İ.T.S.; software, İ.T.S. and B.A.; validation, T.C., İ.T.S. and B.A.; formal analysis, İ.T.S.; investigation, İ.T.S., B.A. and T.C.; resources, B.A.; data curation, İ.T.S. and B.A.; writing—original draft preparation, İ.T.S. and B.A.; writing—review and editing, İ.T.S. and B.A.; visualization, İ.T.S.; supervision, İ.T.S.; project administration, B.A. and İ.T.S.; and funding acquisition, B.A. and İ.T.S. All authors have read and agreed to the published version of the manuscript.
Funding
This research was funded by the Scientific Research Projects Department of Hitit University, grant number FEF19004.23.003.
Data Availability Statement
Data are contained within the article.
Conflicts of Interest
The authors declare no conflicts of interest. All authors declare that the research was conducted in the absence of any commercial or financial relationships that could be construed as a potential conflict of interest.
Abbreviations
The following abbreviations are used in this manuscript:
| m-ECH-RC | Magnetic epichlorohydrin Rosa canina |
| SO | Safranin O |
| RC | Rosa canina |
| BET | Brunauer–Emmett–Teller |
| FT-IR | Fourier transform infrared spectroscopy |
| SEM | Scanning electron microscopy |
| XRD | X-ray diffraction |
References
- Wu, J.; Yao, J.; Zhu, X.; Zuo, D.; Zhang, H.; Jiang, S.; Li, H. Synthesis and characterization of zwitterionic hydrogels with Ag@gC3N4 for adsorption-photocatalytic removal of methylene blue and methyl orange dyes. Adsorption 2025, 31, 14. [Google Scholar] [CrossRef]
- Liu, R.; Ji, W.; Wang, W.; Li, Y.; Yin, L.; Song, Y.; He, G. Innovative amorphous calcium carbonate for superior anionic dye adsorption towards near-zero discharge. Sep. Purif. Technol. 2025, 361, 131349. [Google Scholar] [CrossRef]
- Jassim, N.J.; Younis, F.H.; Alshamkhani, M.T. Adsorption of Safranin-O Dye onto Almond Shell Sustainable Activated Carbon: Identifying Key Process Factors and Their Effects. Eng. Rep. 2025, 7, e13121. [Google Scholar] [CrossRef]
- Hettige, A.I.; Mowjood, M.I.M. Reduction of colour in treated wastewater from textile ındustry using sawdusts as bio-sorbents. Trop. Agric. Res. 2015, 26, 666–676. [Google Scholar] [CrossRef]
- Niinimaki, K.; Peters, G.; Dahlbo, H.; Perry, P.; Rissanen, T.; Gwilt, A. The environmental price of fast fashion. Nat. Rev. Earth Environ. 2020, 1, 189–200. [Google Scholar] [CrossRef]
- Su, X.; Wang, X.; Ge, Z.; Bao, Z.; Lin, L.; Chen, Y.; Pillai, S.C. KOH-activated biochar and chitosan composites for efficient adsorption of industrial dye pollutants. Chem. Eng. J. 2024, 486, 150387. [Google Scholar] [CrossRef]
- Al-Tohamy, R.; Ali, S.S.; Li, F.; Okasha, K.M.; Mahmoud, Y.A.G.; Elsamahy, T.; Jiao, H.; Fu, Y.; Sun, J. A critical review on the treatment of dye-containing wastewater: Ecotoxicological and health concerns of textile dyes and possible remediation approaches for environmental safety. Ecotoxicol. Environ. Saf. 2022, 231, 113160. [Google Scholar] [CrossRef]
- Zhao, J.; Li, W.; Shi, Y.; Zheng, X.; Feng, Q.; Low, S.C.; Liu, Z. Biomimetic heat-localized and solar absorption-enhanced hollow structural nanofibrous membrane for clean water production from saline water and dye wastewater. J. Colloid Interface Sci. 2025, 678, 1112–1124. [Google Scholar] [CrossRef]
- Deng, X.; Wu, W.; Tian, S.; He, Y.; Wang, S.; Zheng, B.; Tang, L. Composite adsorbents of aminated chitosan@ ZIF-8 MOF for simultaneous efficient removal of Cu (II) and Congo Red: Batch experiments and DFT calculations. Chem. Eng. J. 2024, 479, 147634. [Google Scholar] [CrossRef]
- Rao, R.; Huang, Y.; Zhang, H.; Hu, C.; Dong, X.; Fang, W.; Ling, Q. A simple melamine-assisted cellulose pyrolysis synthesis of magnetic and mesoporous N-doped carbon composites with excellent adsorption of Congo red. Sep. Purif. Technol. 2024, 347, 127678. [Google Scholar] [CrossRef]
- Hussain, N.A.; Jasim, L.S. Synthesis and characterization of kappa (κ)-carrageenan-grafted poly (acrylic acid-co-itaconic acid)/ multi-walled carbon nanotube (κC-g-poly (AAC-co-IA)/MWCNT) composite for removing safranin-o dye from aqueous solution. Process Saf. Environ. Prot. 2025, 195, 106828. [Google Scholar] [CrossRef]
- Ozdemir, N.C.; Saleh, M.; Bilici, Z.; Arslan, H.; Dizge, N. Preparation of leonardite powder-embedded calcium alginate beads and adsorption of Safranin-O dye. Water Pract. Technol. 2023, 18, 1711–1726. [Google Scholar] [CrossRef]
- Phuong, D.T.M.; Loc, N.X. Rice Straw Biochar and Magnetic Rice Straw Biochar form Safranin O Adsorption from Aqueous Solution. Water 2022, 14, 186. [Google Scholar] [CrossRef]
- Verma, A.K.; Dash, R.R.; Bhunia, P.A. review on chemical coagulation/flocculation technologies for removal of colour from textile wastewaters. J. Environ. Manag. 2012, 93, 154–168. [Google Scholar] [CrossRef] [PubMed]
- Rashidi, H.R.; Sulaiman, N.M.N.; Hashim, N.A.; Hassan, C.R.C.; Ramli, M.R. Synthetic reactive dye wastewater treatment by using nano-membrane filtration. Desalin. Water Treat. 2015, 55, 86–95. [Google Scholar] [CrossRef]
- Yang, Z.; Asoh, T.A.; Uyama, H. Removal of cationic or anionic dyes from water using ion exchange cellulose monoliths as adsorbents. Bull. Chem. Soc. Jpn. 2019, 92, 1453–1461. [Google Scholar] [CrossRef]
- Tan, K.B.; Vakili, M.; Horri, B.A.; Poh, P.E.; Abdullah, A.Z.; Salamatinia, B. Adsorption of dyes by nanomaterials: Recent developments and adsorption mechanisms. Sep. Purif. Technol. 2015, 150, 229–242. [Google Scholar] [CrossRef]
- Asgher, M. Biosorption of reactive dyes: A review. Water Air Soil Pollut. 2012, 223, 2417–2435. [Google Scholar] [CrossRef]
- Sanroman, M.A.; Pazos, M.; Ricart, M.T.; Cameselle, C. Electrochemical decolourisation of structurally different dyes. Chemosphere 2004, 57, 233–239. [Google Scholar] [CrossRef]
- Qiu, Z.; Chen, C.; Zeng, X.; Shen, G.; Ye, Q.; Fu, H. Redox-copolymer-enhanced electrochemical catalysis membrane for efficient water decontamination. Chem. Eng. J. 2025, 505, 159383. [Google Scholar] [CrossRef]
- Ali, A.; Akram, A.; Siddique, A.B.; Amin, H.M.A.; Zohra, L.; Abbas, A.; Sher, M.; Hussain, M.A.; Haseeb, M.T.; Imran, M. A model batch and column study for Cd(II) uptake using citric acid cross-linked Salvia spinosa hydrogel: Optimization through Box-Behnken design. J. Ind. Eng. Chem. 2025, 151, 746–761. [Google Scholar] [CrossRef]
- Farid-ul-Haq, M.; Ali, A.; Hussain, M.A.; Abbas, A.; Kausar, F.; Amin, H.M.A.; Sher, M.; Hussain, S.Z.; Hussain, I. Chemical modification of a polysaccharide from Artemisia vulgaris engenders a supersorbent for the removal of Cd2+ from spiked high-hardness groundwater. Desalin. Water Treat. 2021, 212, 129–142. [Google Scholar] [CrossRef]
- Gharbi, A.H.; Laouini, S.E.; Hemmami, H.; Bouafia, A.; Gherbi, M.T.; Amor, I.B.; Hasan, G.G.; Abdullah, M.M.S.; Trzepiecinski, T.; Abdullah, J.A.A. Eco-friendly synthesis of Al2O3 nanoparticles: Comprehensive characterization properties, mechanics, and photocatalytic dye adsorption study. Coatings 2024, 14, 848. [Google Scholar] [CrossRef]
- Zhao, C.; Liu, B.; Chang, H.; Xie, F.; Wu, R.; Zhou, S.; Zhu, X.; Liang, H.; Zhu, J. Triboelectric pulse promotes self-cleaning, catalysis ofnano-confined domain lamellar membranes for effectivewater decontamination. Adv. Funct. Mater. 2025, 35, 2418565. [Google Scholar] [CrossRef]
- Tzvetkov, G.; Kaneva, N.; Spassov, T. Room-temperature fabrication of core-shell nano-ZnO/pollen grain biocomposite for adsorptive removal of organic dye from water. Appl. Surf. Sci. 2017, 400, 481–491. [Google Scholar] [CrossRef]
- Tunali Akar, S.; Balk, Y.; Sayin, F.; Akar, T. Magnetically functionalized alunite as a recyclable and ecofriendly adsorbent for efficient removal of Pb2+. J. Water Process Eng. 2022, 48, 102867. [Google Scholar] [CrossRef]
- Mohamad, N.; Salleha, N.M.; Mahmud, H.N.M.E. Synthesis, characterization and analysis of conducting polymercomposites toward dye adsorption. Int. J. Polym. Anal. Charact. 2024, 29, 127–145. [Google Scholar] [CrossRef]
- Xin, Y.; Bai, Y.; Wu, X.; Zhang, D.; Ao, W.; Fang, M.; Huang, Z.; Yao, Y. Adsorption performance of modified graphite from synthetic dyes solutions. Materials 2024, 29, 4349. [Google Scholar] [CrossRef]
- Alam, Z.; Bari, N.; Kawsari, S. Statistical optimization of Methylene Blue dye removal from a synthetic textile wastewater using indigenous adsorbents. Environ. Sustain. Indic. 2022, 14, 100176. [Google Scholar] [CrossRef]
- Chakraborty, T.K.; Ghosh, S.; Islam, S.; Nice, S.; Islam, K.R.; Netema, B.N.; Rahman, S.; Habib, A.; Zaman, S.; Ghosh, G.C.; et al. Removal of hazardous textile dye from simulated wastewater by municipal organic solid waste charcoal using machine learning approaches: Kinetics, isotherm, and thermodynamics. Heliyon 2023, 9, e18856. [Google Scholar] [CrossRef]
- Chandra, T.C.; Mima, M.M.; Sudaryanto, Y.; Ismadji, S. Adsorption of basic dye onto activated carbon prepared from durian shell: Studies of adsorption equilibrium and kinetics. Chem. Eng. J. 2007, 127, 121–129. [Google Scholar] [CrossRef]
- Mirizadeh, S.; Solisio, C.; Converti, A.; Casazza, A.A. Efficient removal of tetracycline, ciprofloxacin, and amoxicillin by novel magnetic chitosan/microalgae biocomposites. Sep. Purif. Technol. 2024, 329, 125115. [Google Scholar] [CrossRef]
- Ngah, W.S.W.; Hanafiah, M.A.K.M.; Yong, S.S. Adsorption of humic acid from aqueous solutions on crosslinked chitosan–epichlorohydrin beads: Kinetics and isotherm studies. Colloids Surf. B Biointerfaces 2008, 65, 18–24. [Google Scholar] [CrossRef]
- Rashtbari, Y.; Arfaeinia, H.; Ahmadi, S.; Asl, F.B.; Afshin, S.; Poureshgh, Y.; Fazlzadeh, M. Potential of using green adsorbent of humic acid removal from aqueous solutions: Equilibrium, kinetics, thermodynamic and regeneration studies. J. Environ. Anal. Chem. 2020, 102, 5373–5390. [Google Scholar] [CrossRef]
- Salem, M.A.; Salem, I.A.; Zaki, H.M.; El-Sawy, A.M. Elimination of Safranin-O and a binary mixture of Safranin-O and methylene blue from water by adsorption on magnetite/Ag nanocomposite. Egypt. J. Pet. 2022, 31, 39–49. [Google Scholar] [CrossRef]
- Acelas, N.İ.; Lopera, S.M.; Porras, J.; Torres-Palma, R.A. Evaluating the removal of the antibiotic cephalexin from aqueous solutions using an adsorbent obtained from palm oil fiber. Molecules 2021, 26, 3340. [Google Scholar] [CrossRef] [PubMed]
- Alikhani, N.; Hekmati, M.; Karmakar, B.; Veisi, H. Green synthesis of gold nanoparticles (Au NPs) using Rosa canina fruit extractand evaluation of its catalytic activity in the degradation of organic dye pollutants of water. Inorg. Chem. Commun. 2022, 139, 109351. [Google Scholar] [CrossRef]
- Huang, J.; Zhang, Y. Methyl orange uptake from aqueous solutions using chitosan-modified with epichlorohydrin and copper (II) Schiff base. Int. J. Biol. Macromol. 2025, 310, 142408. [Google Scholar] [CrossRef]
- Ouerghemmi, S.; Sebei, H.; Siracusa, L.; Ruberto, G.; Saija, A.; Cimino, F.; Cristani, M. Comparative study of phenolic composition and antioxidant activity of leaf extracts from three wild Rosa species grown in different Tunisia regions: Rosa canina L., Rosa moschata Herrm. and Rosa sempervirens L. Ind. Crops Prod. 2016, 94, 167–177. [Google Scholar] [CrossRef]
- Ieri, F.; Innocenti, M.; Possieri, L.; Gallori, S.; Mulinacci, N. Phenolic composition of “bud extracts” of Ribes nigrum L., Rosa canina L. and Tilia tomentosa M. J. Pharm. Biomed. Anal. 2015, 115, 1–9. [Google Scholar] [CrossRef]
- Zhao, X.; Wang, X.; Lou, T. Preparation of fibrous chitosan/sodium alginate composite foams for the adsorption of cationic and anionic dyes. J. Hazard. Mater. 2021, 403, 124054. [Google Scholar] [CrossRef]
- Jafari, H.; Mahdavinia, G.R.; Kazemi, B.; Ehrlich, H.; Joseph, Y.; Rahimi-Nasrabadi, M. Highly efficient sunitinib release from pH-responsive mHPMC@Chitosan core-shell nanoparticles. Carbohydr. Polym. 2021, 258, 117719. [Google Scholar] [CrossRef]
- Chen, X.; Zhou, Y.; Han, H.; Wang, X.; Zhou, L.; Yi, Z.; Fu, Z.; Wu, X.; Li, G.; Zeng, L. Optical and magnetic properties of small-size core–shell Fe3O4@C nanoparticles. Mater. Today Chem. 2021, 22, 100556. [Google Scholar] [CrossRef]
- Chen, J.; Li, L.; Shi, G.; Yan, Y.; Wang, Q.; Yu, Z.; Yan, L.; Yu, Y. Adsorption of chlorinated hydrocarbons by different kinds of soils: Kinetics, influencing factors, mechanism. J. Hazard. Mater. 2025, 18, 100638. [Google Scholar] [CrossRef]
- Zhang, Y.; Zhu, C.; Liu, F.; Yuan, Y.; Wu, H.; Li, A. Effects of ionic strength on removal of toxic pollutants from aqueous media with multifarious adsorbents: A review. Sci. Total Environ. 2019, 646, 265–279. [Google Scholar] [CrossRef]
- Li, X.; Zeng, L.; Zhu, L.; Jiang, H.; Liu, C.; Dai, Y. Strong adsorption of tetracycline on carbon blacks: An in-depth study of the adsorption mechanism. J. Water Process Eng. 2025, 70, 106784. [Google Scholar] [CrossRef]


Disclaimer/Publisher’s Note: The statements, opinions and data contained in all publications are solely those of the individual author(s) and contributor(s) and not of MDPI and/or the editor(s). MDPI and/or the editor(s) disclaim responsibility for any injury to people or property resulting from any ideas, methods, instructions or products referred to in the content. |
© 2025 by the authors. Licensee MDPI, Basel, Switzerland. This article is an open access article distributed under the terms and conditions of the Creative Commons Attribution (CC BY) license (https://creativecommons.org/licenses/by/4.0/).