Article

Spatial Structure and Optimal Sampling Intervals of Soil Moisture at Different Depths in a Typical Karst Demonstration Zone

1
School of Geography and Tourism, Huizhou University, Huizhou 516007, China
2
Institute of Urban and Sustainable Development, City University of Macau, Macau 999078, China
3
Institute of Karst Geology, Chinese Academy of Geological Science, Guilin 541004, China
*
Author to whom correspondence should be addressed.
Water 2025, 17(19), 2891; https://doi.org/10.3390/w17192891
Submission received: 29 August 2025 / Revised: 1 October 2025 / Accepted: 1 October 2025 / Published: 4 October 2025
(This article belongs to the Section Soil and Water)

Abstract

Related studies analyzing the spatial structure of soil moisture from both horizontal and vertical directions, as well as the spacing interval distances of soil moisture sampling points in typical karst demonstration zones, are relatively rare. This study applied classical statistics, geostatistics, and “3S” technology to analyze the spatial structure, influencing factors, and spacing interval distances of soil moisture sampling points in the Guohua Demonstration Zone. The results showed that Moran’s I indices of soil moisture at different soil depths in the Guohua Demonstration Zone presented positive spatial correlation, and the spatial distribution of soil moisture at different soil depths showed a distinct spatial clustering pattern, with few spatially isolated zones. The spatial autocorrelation distance for soil moisture at 5 cm and 10 cm soil depths was 2400 m, while the autocorrelation distances for soil moisture at 20 cm and 30 cm soil depths were 2200 m and 2000 m, respectively. The spatial range value for soil moisture at a soil depth of 20 cm in the Guohua Demonstration Zone was the largest (Range = 6318.0 m), while the spatial range value for soil moisture at a soil depth of 30 cm was the smallest (Range = 646.0 m). The minimum value (threshold: 646.0 m) between the spatial autocorrelation distance and the spatial range of soil moisture at different soil depths in the Guohua Demonstration Zone could serve as an appropriate spacing interval distance of soil moisture sampling points. Soil moisture at different soil depths in the Guohua Demonstration Zone was primarily influenced by rock desertification, vegetation cover, soil layer thickness, and elevation. The synergistic effect of “rocky desertification + vegetation”, “rocky desertification + soil thickness”, and “vegetation + soil thickness” had a greater influence on soil moisture. Through high-density soil moisture sampling points in typical karst areas, the study results strengthened the application research on soil moisture in typical karst areas, providing scientific references for studies on the spatial structure, influencing factors, and appropriate spacing interval distance of soil moisture sampling points in karst areas.

1. Introduction

The spatial structure and spatial heterogeneity of soil moisture are crucial for studying the spatial distribution characteristics of soil moisture in terrestrial ecosystems [1,2,3,4,5], exploring the gas exchange mechanisms of atmospheric photosynthesis [6], and optimizing agricultural management [7,8,9]. The acquisition of soil moisture values is a critical step in studying the spatial distribution, spatial structure, and influencing factors of soil moisture. The measurement and spatial mapping of soil moisture have become one of the primary research areas in soil moisture studies [10,11,12]. The application of soil moisture spatial variability is increasingly widespread [13,14,15,16,17], playing a significant role in exploring the spatial distribution patterns and influencing factors of soil moisture [18]. Interpolation methods combined with neural network technology, hydrological models, and clustering methods have been widely applied in estimating soil moisture [19,20]. Emerging technologies have made new progress in obtaining soil moisture values, such as using satellite data and crop models to invert soil moisture [21], using ESA CCI products with ANN for spatial interpolation of soil moisture [22], and employing remote sensing image fusion technology from different sensors to estimate soil moisture [23,24]. With the widespread application of downscaling and machine learning methods in the field of soil moisture interpolation [25,26,27,28,29,30], it is now possible to effectively assess high-precision data on soil moisture at different soil depths [31] and map the spatial distribution of soil moisture [32,33]. In addition to the spatial measurement of soil moisture, the spatial distribution and spatial structure of soil moisture have also attracted significant attention from scholars [34,35,36,37,38]. Related studies have provided scientifically validated analytical tools, including the Global Moran’s I, Local Spatial Autocorrelation (LISA), and semivariogram analysis. These tools have established a reliable methodological foundation for investigating the spatial autocorrelation and variability of soil moisture in this study. These mature and operationally feasible methods ensure the scientific rigor of this study, thereby enhancing the reliability of the research findings.
Previous studies have primarily focused on the spatial distribution and spatial structure of soil moisture in non-karst areas at the horizontal level. Research on the spatial heterogeneity of soil moisture should not only be limited to horizontal variations but also focus on vertical differentiation. The water-holding capacity of soil varies with soil depth, which is the primary cause of vertical spatial heterogeneity in soil moisture [39]. Relatedstudies on the spatial heterogeneity of soil moisture in typical karst demonstration zones, combined with high-density soil moisture sampling points in both horizontal and vertical directions, are relatively rare. Although soil moisture inversion methods based on remote sensing technology have become relatively mature, the results of remote sensing inversion of soil moisture still need to be validated using monitoring data.
Additionally, how to appropriately determine the suitable spacing distance for soil moisture sampling points in typical karst areas remains an unsolved scientific issue [40]. High-density soil moisture sampling points are advantageous for precise research. However, if the density of soil moisture sampling points is too high, it will inevitably lead to significant consumption of human, material, and financial resources. Low-density soil moisture sampling points are more economical in terms of human, material, and financial resources. However, suppose the density of soil moisture sampling points is too low. In that case, it will not be easy to ensure the research precision of soil moisture or other soil physical and chemical indicators.
This study aims to address the following scientific questions: Selecting a typical karst area with a total area of only 2.71 km2, conducting high-density soil moisture sampling points, combining remote sensing technology with methods such as spatial autocorrelation and spatial interpolation in geographic information spatial structures, and conducting a comprehensive study of the spatial patterns and influencing factors of soil moisture in the Guohua Demonstration Zone from both horizontal and vertical perspectives. This study aims to reveal the appropriate spacing interval distances of soil moisture sampling points in typical karst areas. So, this study took soil moisture in the typical karst area of the Guohua Demonstration Zone in Pingguo County, Guangxi, as the research object. Combining soil moisture sampling points and field monitoring, the study applied classical statistics, geostatistics, and “3S” technology to explore the spatial autocorrelation and spatial structure of soil moisture in typical karst areas with high spatial variability. The study investigated the spacing interval distances of soil moisture sampling points and controlling factors influencing the spatial structure of soil moisture in karst areas, providing a scientific basis for agricultural production guidance and ensuring the sustainable utilization of soil resources in typical karst areas.

2. Materials and Methods

2.1. Site Description

Guohua Demonstration Zone (23°22′28.7″–23°23′40.7″ N, 107°22′40.8″–107°23′56.9″ E) is located in the western part of Guangxi Zhuang Autonomous Region, China, covering an area of approximately 2.71 km2 (Figure 1). Guohua Demonstration Zone has a subtropical humid monsoon climate, with an annual average temperature of 21 °C and an annual average precipitation of 1322.3 mm, with most of the rainfall concentrated between June and September. Guohua Demonstration Zone is characterized by typical karst peak clusters and depressions as its primary landform, with elevations ranging from 176.4 to 535.0 m. The soil in the Guohua Demonstration Zone can be classified as “Loamic Haplic Calcisol” according to the WRBSR soil classification system [41,42], with parent rock mainly consisting of Late Carboniferous (C3) and Early Permian (P1q) dolomitic limestone. The soil layer thickness ranges from 0 to 120 cm, with thicker soil in depressions and thinner soil or varying degrees of bedrock exposure on peaks. The vegetation in the Guohua Demonstration Zone is primarily composed of Alchornea trewioides, Vitex negundo Linn, Cipadessa cinerascens, Neyraudia reynaudiana, Gramineae, and Microstenium vagans.

2.2. Experimental Design and Field Sampling

This study utilized base maps such as the administrative boundary map of the Guohua Demonstration Zone, Digital Elevation Model (DEM), land use map, and soil map as a foundation, overlaying Landsat 8 remote sensing images from August 2024 to achieve geospatial localization of soil moisture. Factors such as crop types, growth conditions, and vegetation within agricultural areas changed with the seasons. The field monitoring of soil moisture in the Guohua Demonstration Zone was also scheduled for August, ensuring consistency between the field monitoring month of soil moisture sampling points and the imaging month of remote sensing images. From August 23 to 25, the Guohua Demonstration Zone experienced moderate rainfall with southeast winds at force 2–3 and an average daily sunshine duration of approximately 6 h. From August 26 to 28, skies were clear with south winds at force 2. After grouping personnel on the morning of the 28th, the research area was divided into smaller sections for measurements
This study used stratified random sampling for the spatial layout of soil sampling points. Given the study area’s small size of only 2.71 km2—a typical karst depression landscape—villages were compact and situated in depressions, with houses scattered sporadically. The soil type is uniform, characterized as Loamic Haplic Calcisol influenced by a subtropical monsoon climate. To effectively implement stratified random sampling, key environmental attributes recorded at each sampling point within the study area were categorized into distinct strata. The stratification criteria for soil sampling points in this study primarily encompassed: geological conditions, elevation, slope gradient, soil depth, vegetation cover, and degree of rock desertification. These six environmental factors showed significant influence on the physicochemical properties of soil, including composition, texture, water-holding capacity, and soil moisture mobility. Given the study’s focus on spatial autocorrelation, sample allocation within each stratum was proportional to the stratum’s area to ensure adequate representation of variability [43,44]. Accordingly, sampling within each defined stratum was conducted to select specific sampling locations. Soil moisture sampling points were arranged to avoid roads, water bodies, and buildings; during field monitoring, if access was difficult due to steep terrain, the location of soil moisture sampling points was adjusted within a radius of 5 to 50 m. Soil moisture sampling points that could not be adjusted were discarded. Therefore, within the study area, a total of 191 soil moisture sampling points were collected at different depths from 0 to 30 cm (Figure 1). The average spacing interval distance between soil moisture sampling points was approximately 120 m, with a soil moisture sampling density of 70 points per square kilometer. Except for plots where the soil depth was less than 30 cm, each soil moisture sampling point was taken from a soil profile deeper than 30 cm. The 0–30 cm soil layer was divided into four sublayers: 0–5 cm, 5–10 cm, 10–20 cm, and 20–30 cm. Volumetric soil moisture content (abbreviated as soil moisture) was measured using an Australian-made portable time-domain reflectometer (TRASE TDR) and a dual-electrode probe. The calibrated TDR was used to monitor soil moisture at different soil depths three times, and the average value of soil moisture was taken as the basic data source for this study.

2.3. Statistical Analysis

To identify the primary environmental factors influencing soil moisture, descriptive statistical analysis was conducted using SPSS software (version 23.0), including mean, maximum, minimum, coefficient of variation (CV), standard deviation (SD), and skewness. The normality of the dataset was assessed using the Kolmogorov–Smirnov (K-S) test, combined with skewness and kurtosis values. For data that did not meet the criteria for normal distribution, a logarithmic transformation was applied. Analysis of variance (ANOVA) was used to calculate the differential effects of different geological backgrounds, altitudes, slopes, soil thicknesses, vegetation coverages, and karst desertification levels on soil moisture.

2.4. Spatial Autocorrelation Analysis

Global spatial autocorrelation and local spatial autocorrelation are two different measures of spatial dependence. Moran’s I was a standard statistical method used in spatial autocorrelation, with values ranging from −1 to 1. It is a weighted correlation coefficient used to detect deviations from spatial randomness. Generally, Moran’s I is used to determine whether adjacent areas are more similar than expected under the null hypothesis. For example, global Moran’s I, which indicates whether spatial autocorrelation is present or absent overall, can be defined as
I = N i j W i j × i j W i j ( X i X ¯ ) ( X j X ¯ ) i ( X i X ¯ ) 2
where I is the global Moran’s I, N is the number of soil samples, X is one kind of soil indicators, X ¯ is the mean value of X, and Wij is the weight matrix.
Spatial association Local indicators (LISAs) measure the degree of spatial autocorrelation at each specific location using local Moran’s I. LISA is typically used to assess clustering within each spatial unit by calculating the local Moran’s I for each unit and evaluating the statistical significance (Ii) at each specific location. Local Moran’s I can be defined as
I i = N i Z i j W i j × Z j
where Ii is the spatial correlation index (LISA), Wij is the weight matrix, Z is the deviation of each soil indicator variable from the mean, and N is the number of soil samples.

2.5. Semivariogram Analysis and Kriging Interpolation

The semivariogram is a mathematical model used in geostatistics to describe the spatial structure of regionalized variables. Its parameters primarily describe the spatial correlation and variability of regionalized variables at specific spatial scales. The formula for the semivariogram is as follows:
γ ( h ) = 1 2 N ( h ) i = 1 N ( h ) [ D N ( x i + h ) D N ( x i ) ] 2
where γ(h) is the semivariances function, h is the sample spacing (lag distance), N(ℎ) is the number of paired observations separated by distance h, DN(xi + h) is the grayscale value of the pixel located at position (xi + h), and DN(xi) is the grayscale value of the pixel located at position xi.
Assume that the estimated value of a certain variable at n sample points within the area is denoted as Z x 0 , and its formula is as follows:
Z x 0 = i = 1 n λ i Z x i
where λi is the weighted coefficient related to the position of Z(xi). To ensure that the estimate is optimal, it must satisfy the conditions of unbiasedness and minimum variance, expressed as
E Z x 0 Z x 0 = 0
σ 2 Z x 0 Z x 0 = min
From the above equations, using the Lagrange multiplier method, a matrix relationship between λi and the semivariance can be derived:
r 11 r 12 r 1 n 1 r 21 r 22 r 2 n 1 r n 1 r n 2 r n n 1 1 1 1 0 λ 1 λ 2 λ n ϕ = r 10 r 20 r n 0   1
where rij represents the semivariance at spacing of x i x j , and ϕ is the Lagrange multiplier. By solving the set of equations and determining the value of ϕ , the optimal estimate Z*(x0) at the point x0 can be obtained.
Based on the fitting results of the semivariance function model for soil moisture at different soil depths in the Guohua Demonstration Zone, the geostatistical module of ArcGIS 10.2 was used to obtain spatial interpolation of soil moisture at different soil depths in the Guohua Demonstration Zone, resulting in a spatial distribution map of soil moisture at different soil depths in the Guohua Demonstration Zone.

3. Results

3.1. Descriptive Statistical Analysis Results

Soil moisture at different soil depths in the Guohua Demonstration Zone ranged from 0.10% to 31.10%, with average values between 5.10% and 22.06%, and coefficient of variation (CV) values ranging from 18.30% to 67.73% (Table 1). The coefficient of variation (CV) for soil moisture at 5 cm and 20 cm soil depths was relatively high (CV > 30%), while the coefficient of variation (CV) at 30 cm soil depth was relatively low (10% < CV < 30%). Soil moisture at 5 cm and 10 cm soil depths presented a positively skewed distribution, while soil moisture at 20 cm and 30 cm soil depths presented a negatively skewed distribution. The highest kurtosis value was observed at a soil depth of 5 cm (Kurtosis > 4), followed by the 30 cm soil depth, while the remaining soil depths presented approximate normal distributions. The coefficient of variation (CV) of soil moisture at different soil depths generally decreased with increasing soil depth, indicating that surface soil moisture was more susceptible to external factors compared to deeper soil depths.

3.2. The Spatial Structure of Soil Moisture

3.2.1. The Global Spatial Autocorrelation of Soil Moisture

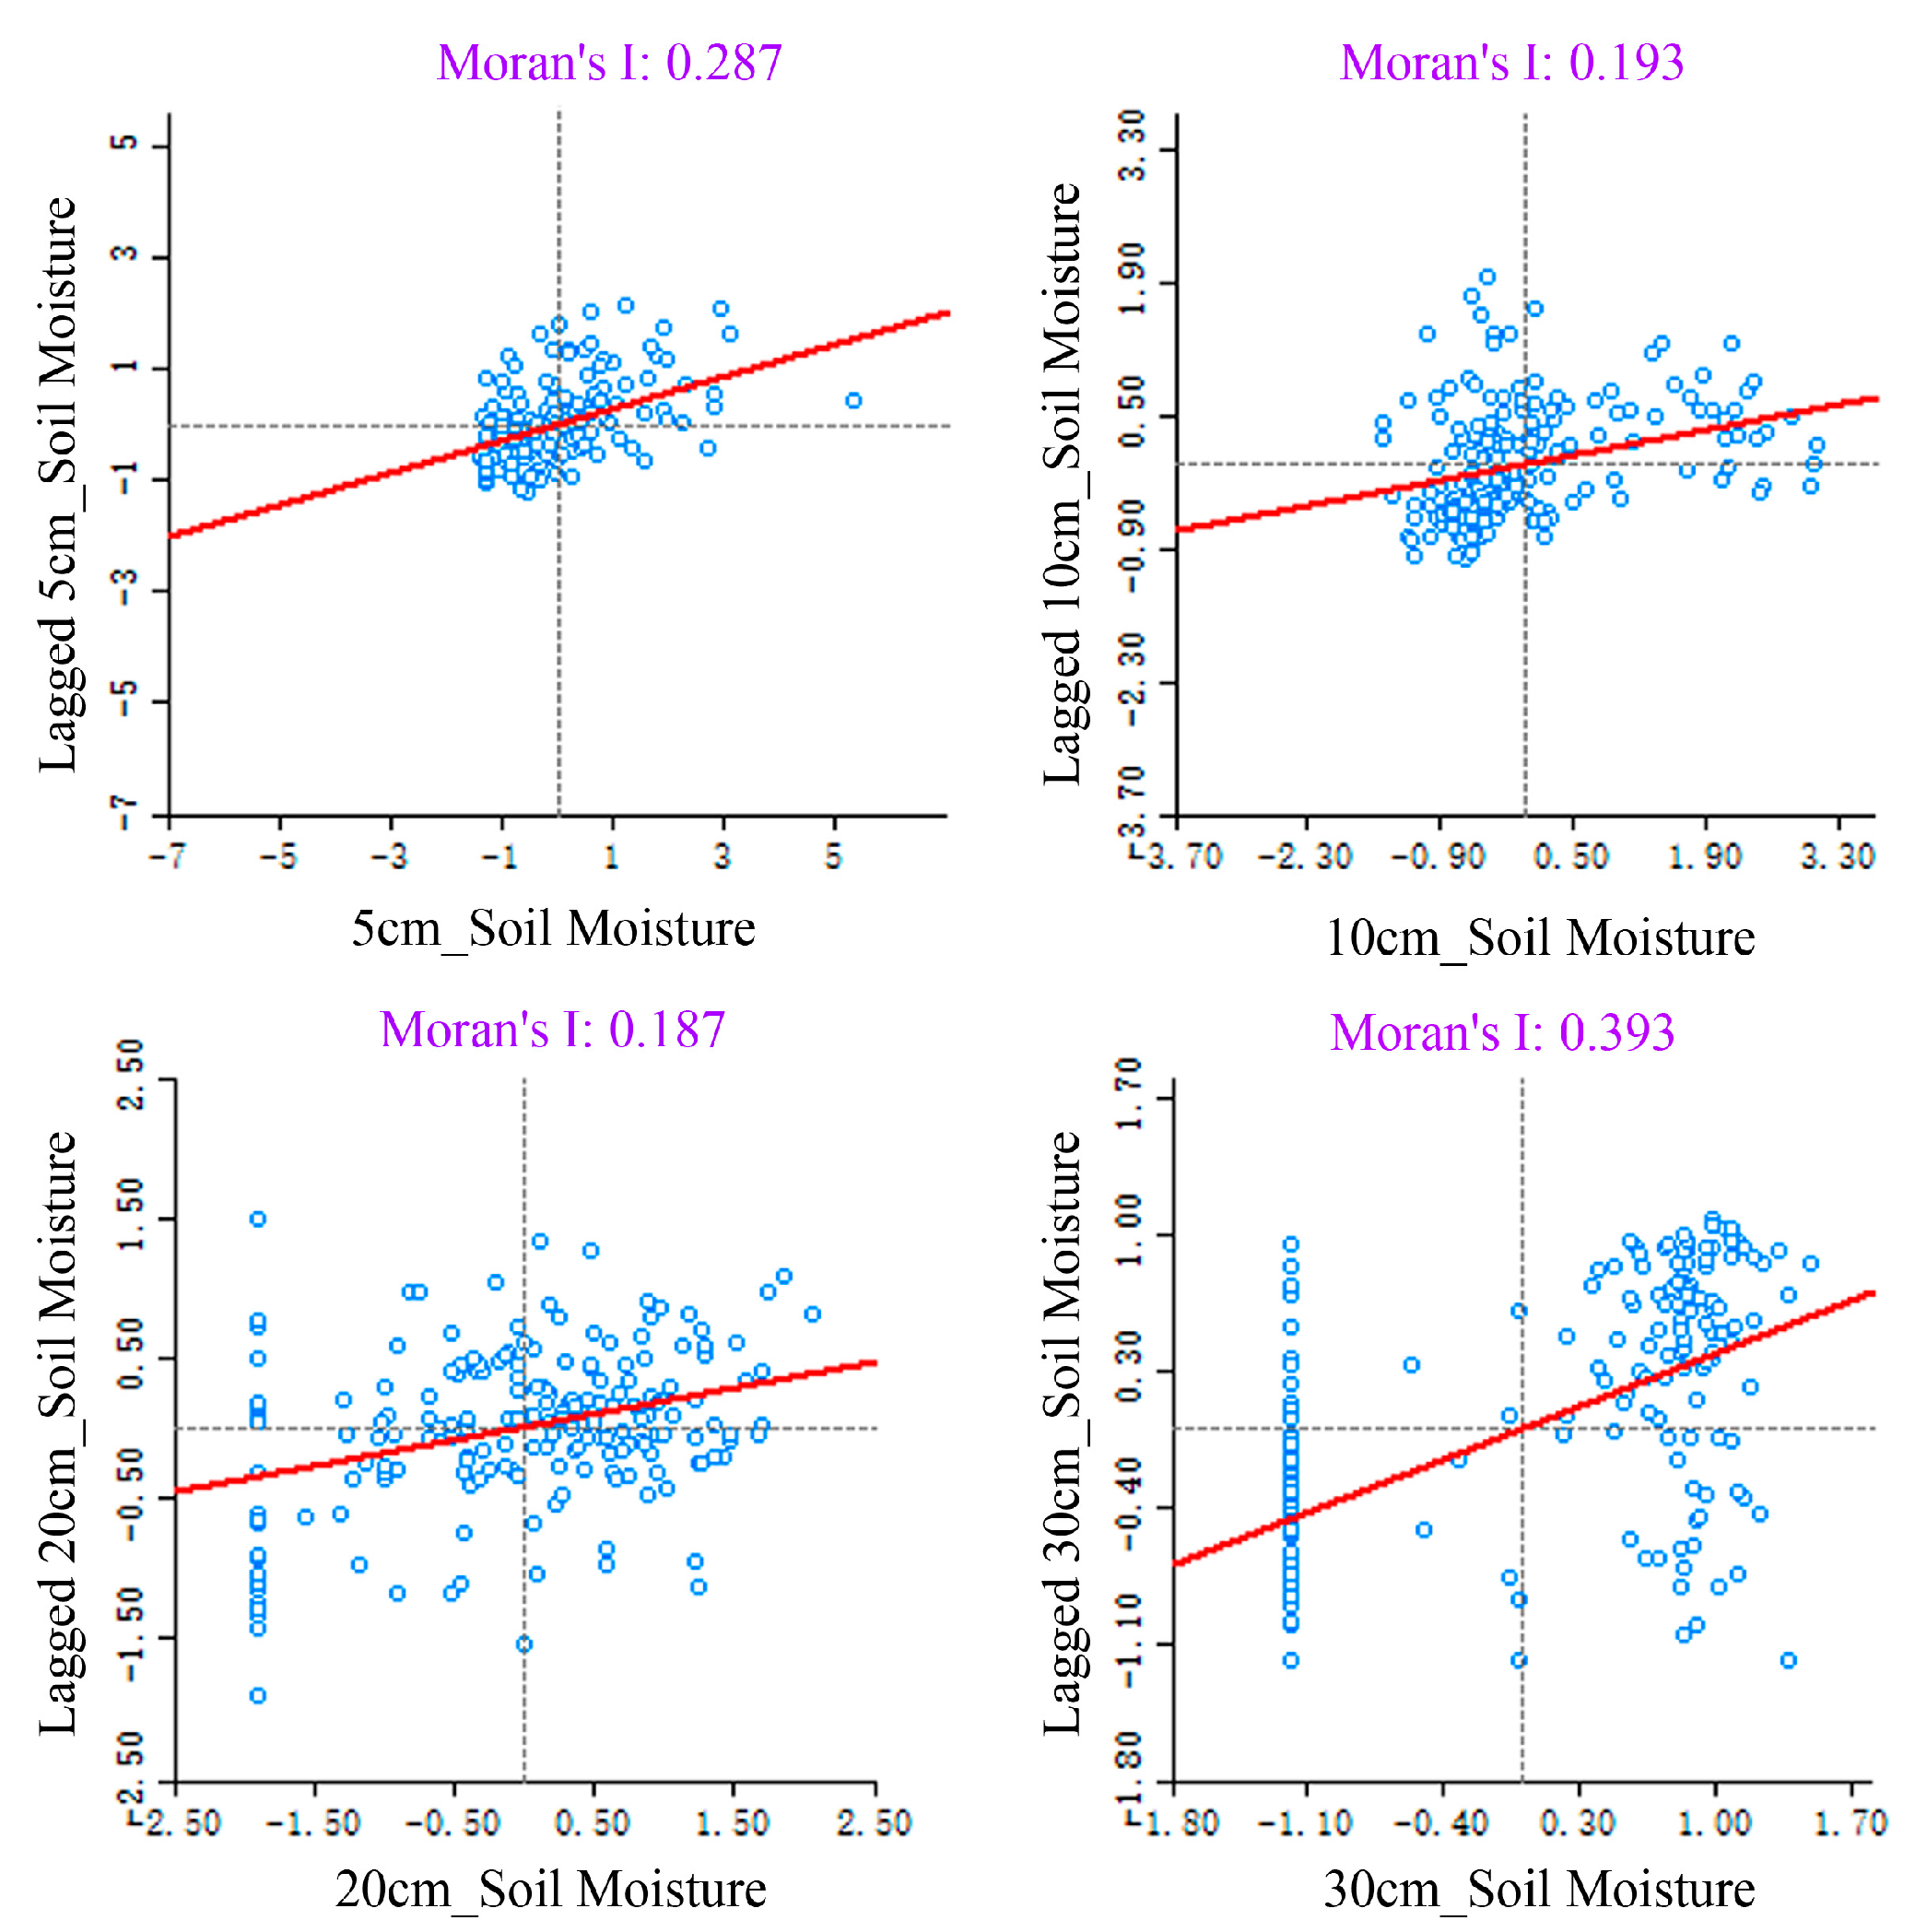
The blue circles represented the locations of various geographical elements, while the red lines indicated the spatial weights or adjacency relationships between these elements. (Figure 2). The Moran’s I indices for soil moisture at different soil depths in the Guohua Demonstration Zone mainly showed positive spatial autocorrelation (Figure 2), indicating that the spatial distribution of soil moisture at different soil depths presented overall positive spatial autocorrelation. Among these, Moran’s I index for soil moisture at a depth of 30 cm was relatively high, indicating more substantial positive spatial autocorrelation for soil moisture at this depth. In comparison, Moran’s I index for soil moisture at a depth of 20 cm was relatively low, indicating weaker positive spatial autocorrelation for soil moisture at this depth.
Soil moisture sampling points at different soil depths in the Guohua Demonstration Zone were predominantly distributed in the first and third quadrants shown in Figure 2 (belonging to the “ high-high” and “low-low” cluster types, respectively), indicating that adjacent high-value zones of soil moisture mostly surrounded high-value zones of soil moisture, while adjacent low-value zones of soil moisture mostly surrounded low-value zones of soil moisture. The clustering characteristics of high/low-value zones of soil moisture at different soil depths in the Guohua Demonstration Zone (Figure 2) showed that high/low-value zones of soil moisture at a soil depth of 5 cm were relatively concentrated. In comparison, those at the 10 cm and 30 cm soil depths were relatively dispersed. At a soil depth of 20 cm, high- and low-value zones of soil moisture showed a relatively uniform spatial distribution. Moran’s dot plots for soil moisture were sparsely distributed in the second and fourth quadrants (corresponding to the “low-high” and “high-low” clustering types, respectively), indicating that only low-value zones at a soil depth of 20 cm showed a phenomenon where adjacent high-value zones of soil moisture surrounded them. Adjacent low-value zones of soil moisture surrounded high-value zones of soil moisture.
Moran’s I values generally decreased with increasing spacing interval distances of soil moisture sampling points (Figure 3). When the spacing interval distance of soil moisture sampling points was less than 2400 m, the Moran’s I values for soil moisture at the soil depths of 5 cm and 10 cm in the Guohua Demonstration Zone were positive, presenting spatial clustering characteristics; When the spacing interval distances of soil moisture sampling points exceeded 2400 m, the Moran’s I indices for soil moisture at the soil depths of 5 cm and 10 cm in the Guohua Demonstration Zone were negative, presenting spatial isolation characteristics, indicating that the spatial autocorrelation scale for soil moisture at the soil depths of 5 cm and 10 cm was 2400 m. When the spacing interval distances of soil moisture sampling points was less than 2200 m, the Moran’s I index for soil moisture at a soil depth of 20 cm in the Guohua Demonstration Zone was positive, presenting spatial clustering characteristics; When the spacing interval distances of soil moisture sampling points exceeded 2200 m, the Moran’s I index for soil moisture at a depth of 20 cm in the Guohua Demonstration Zone was negative, presenting spatial isolation characteristics, indicating that the spatial autocorrelation scale for soil moisture at a depth of 20 cm was 2200 m. When the spacing interval distances of soil moisture sampling points was less than 2000 m, the Moran’s I index for soil moisture at a depth of 30 cm in the Guohua Demonstration Zone was positive, presenting spatial clustering characteristics; When the spacing interval distances of soil moisture sampling points exceeds 2000 m, the Moran’s I index for soil moisture at a soil depth of 30 cm in the Guohua Demonstration Zone was negative, presenting spatial isolation, indicating that the spatial autocorrelation scale for soil moisture at a 30 cm soil depth was 2000 m. It was evident that the spatial autocorrelation scale range for soil moisture at different soil depths in the Guohua Demonstration Zone was 2000–2400 m.

3.2.2. The Local Spatial Autocorrelation Analysis of Soil Moisture

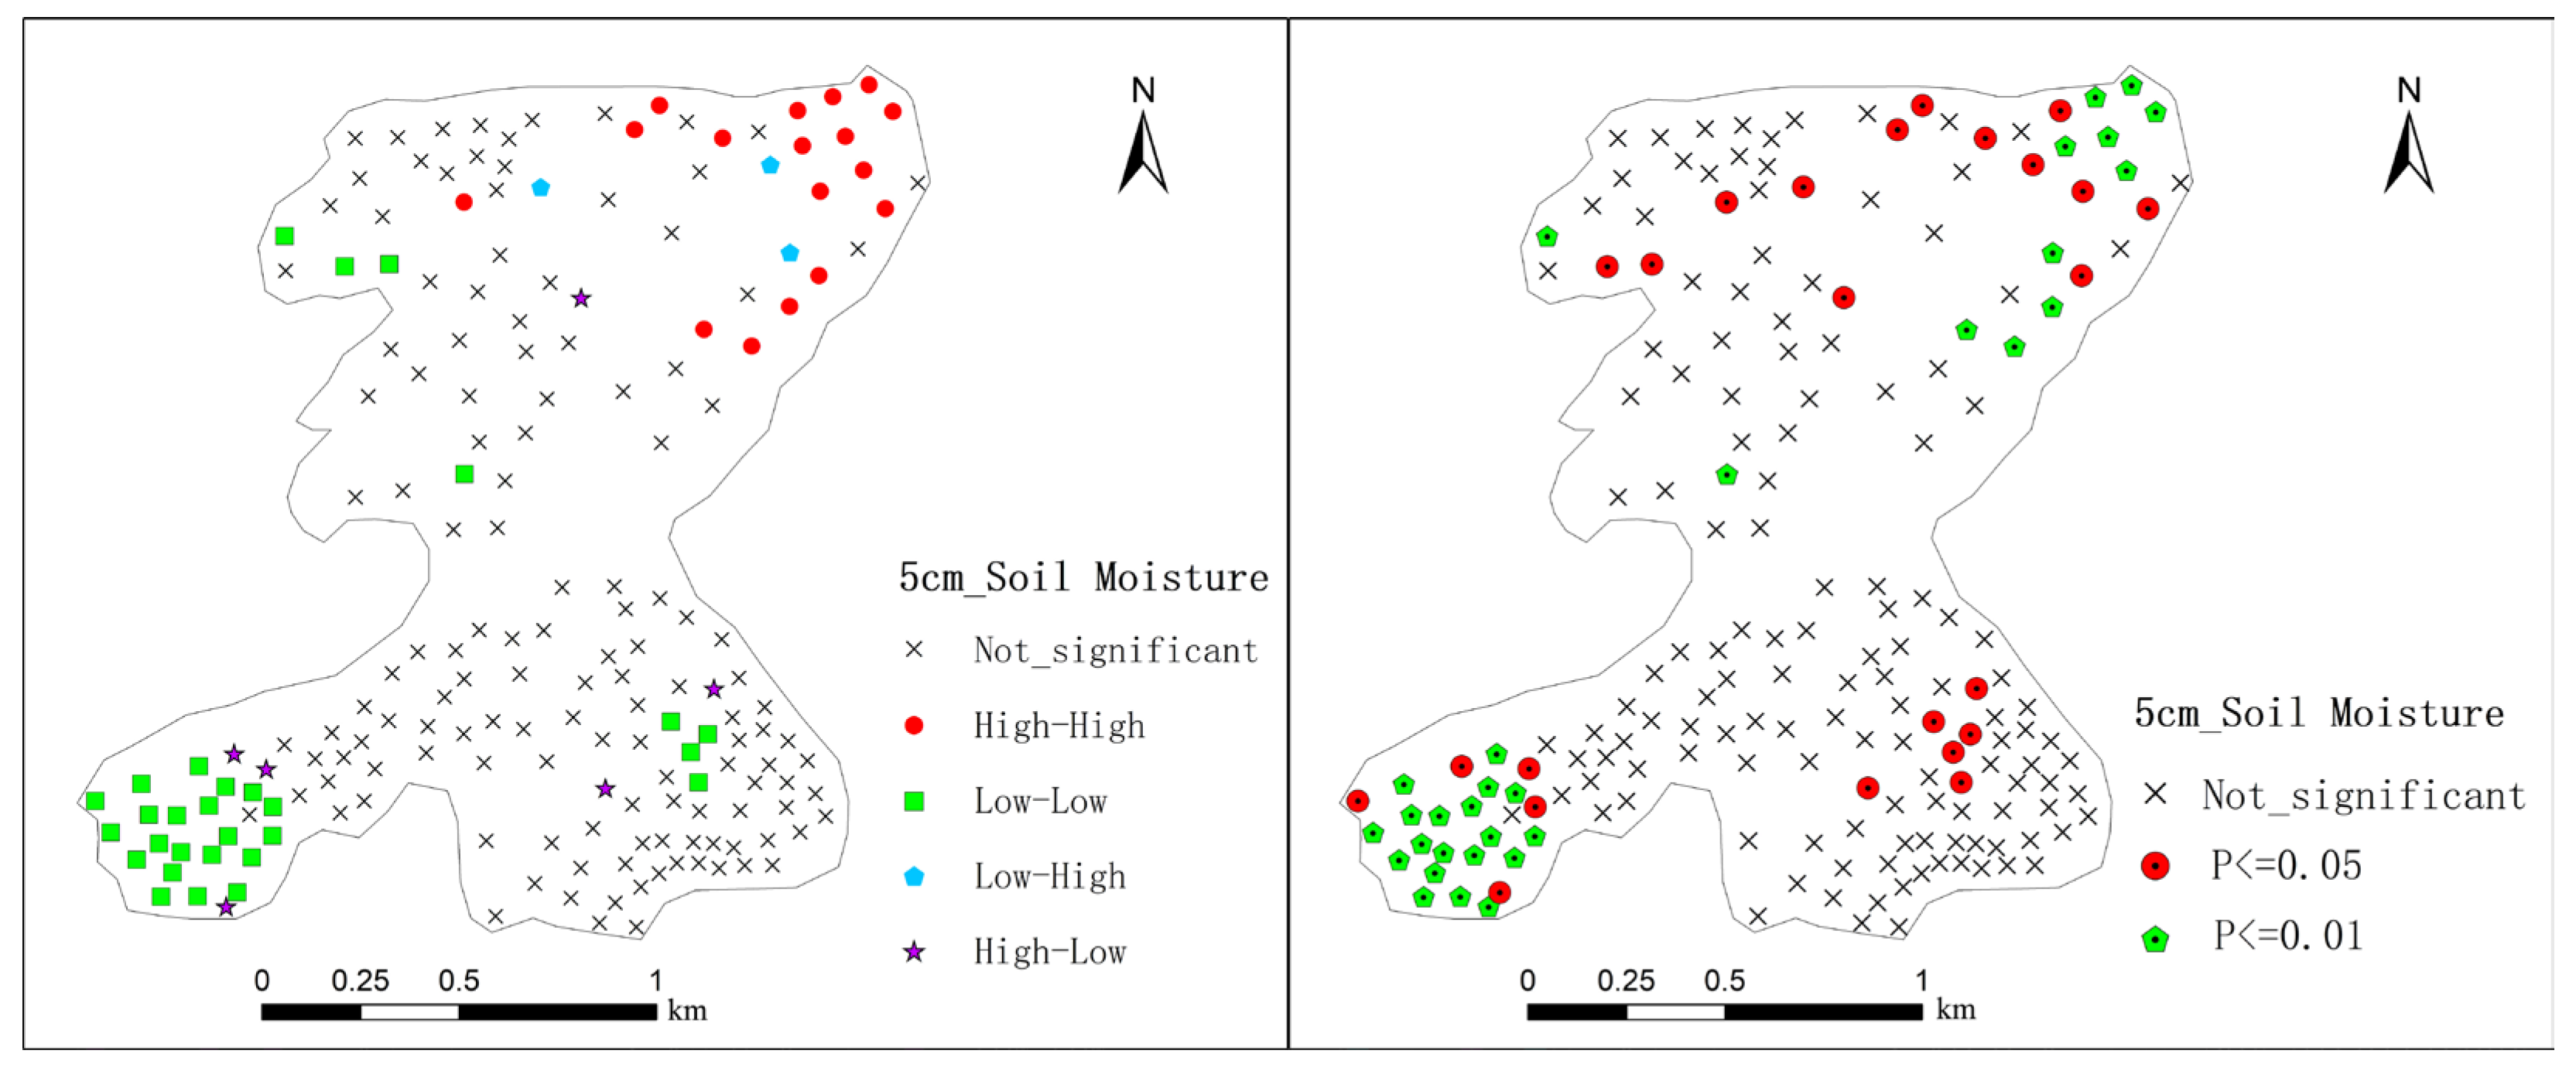
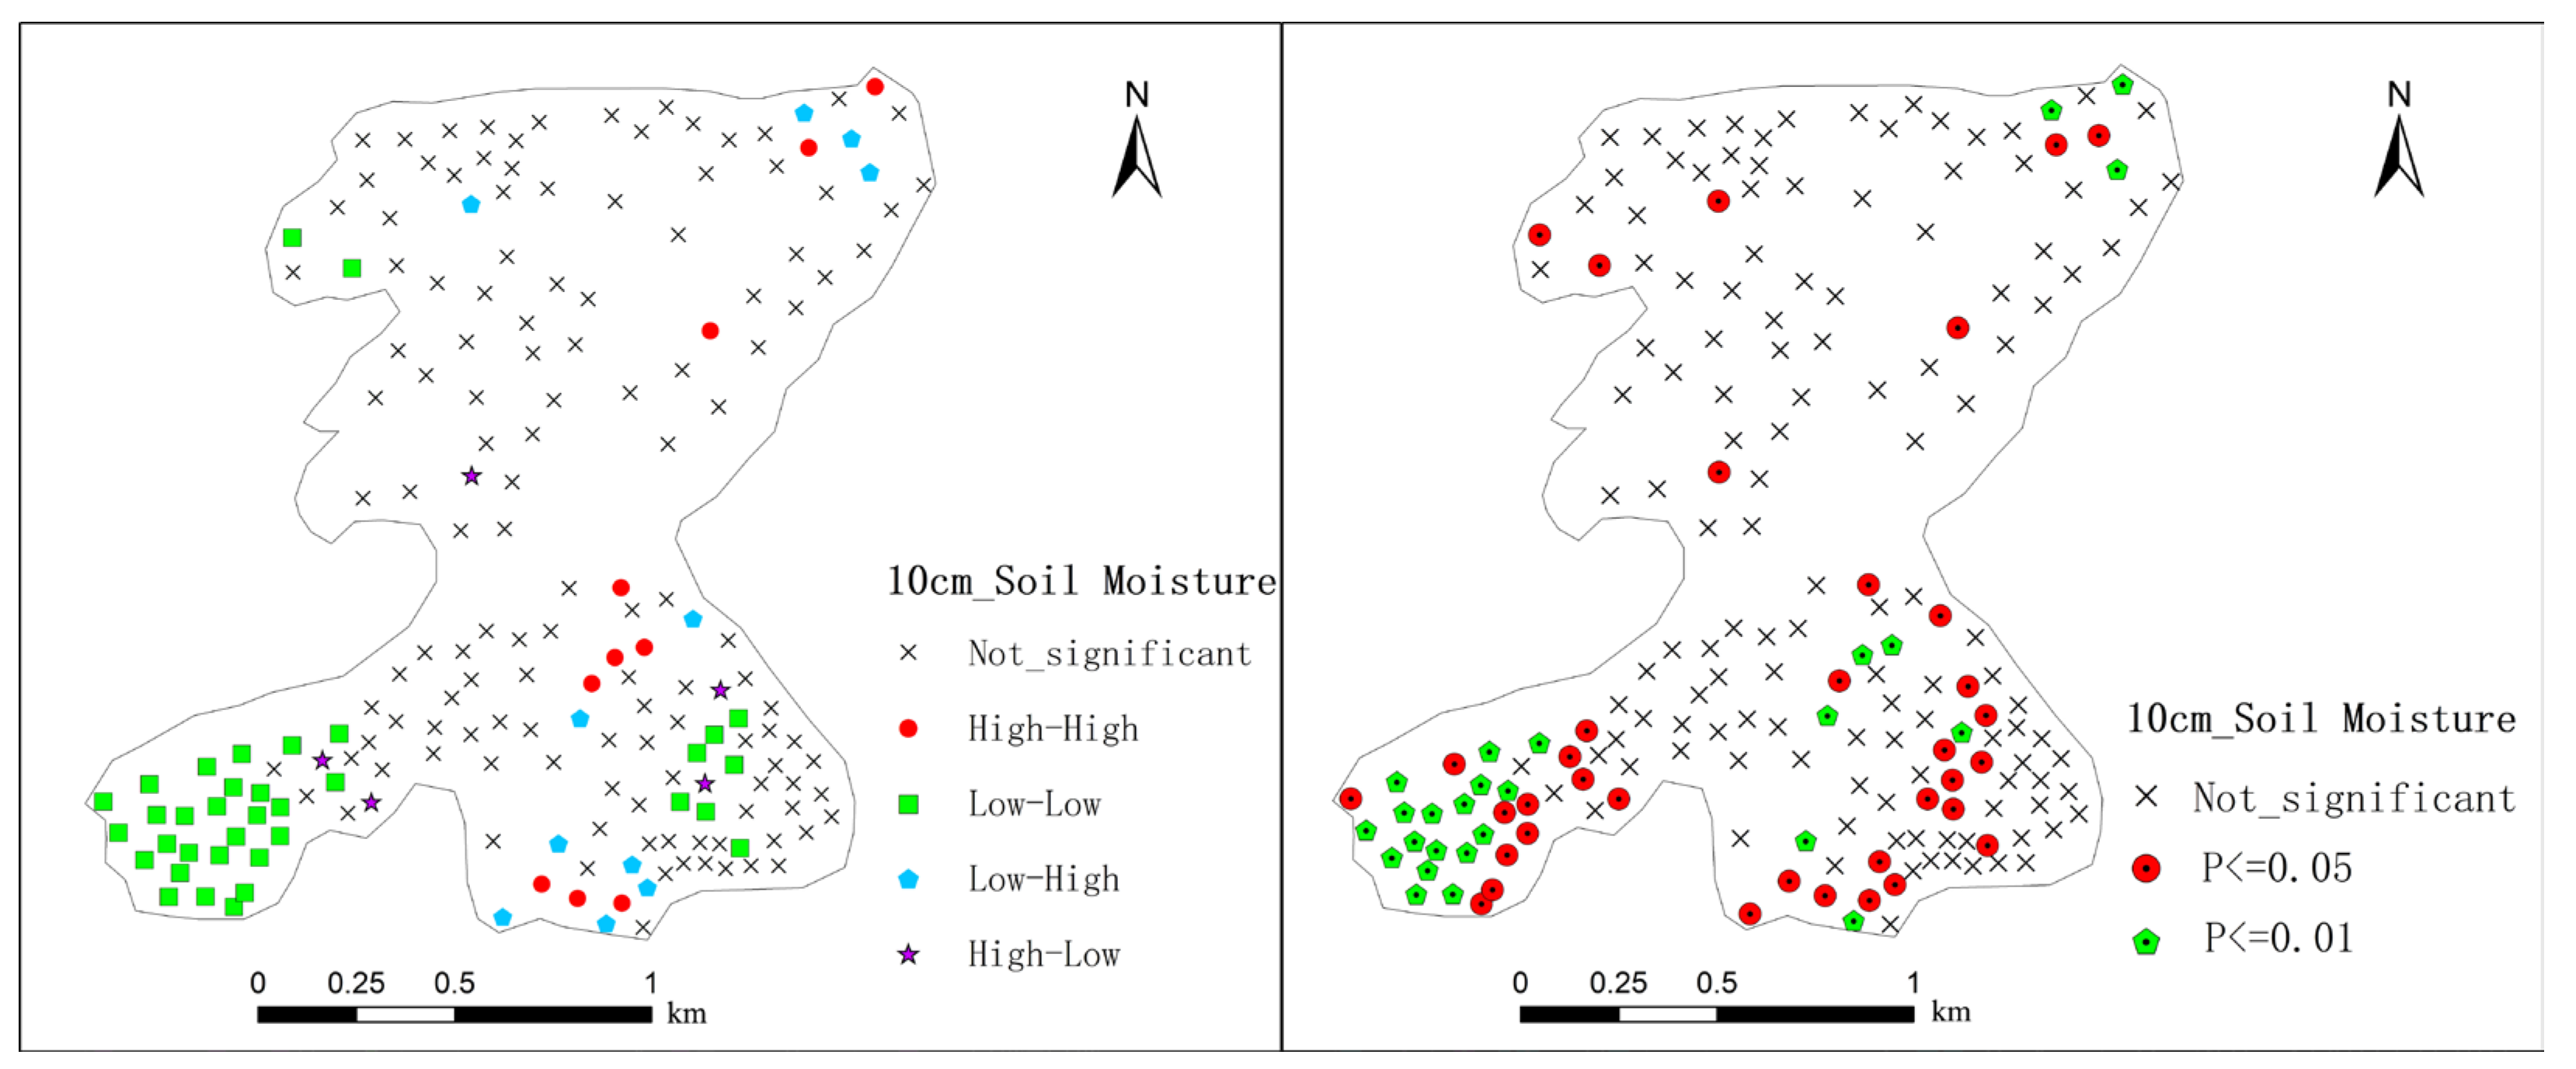
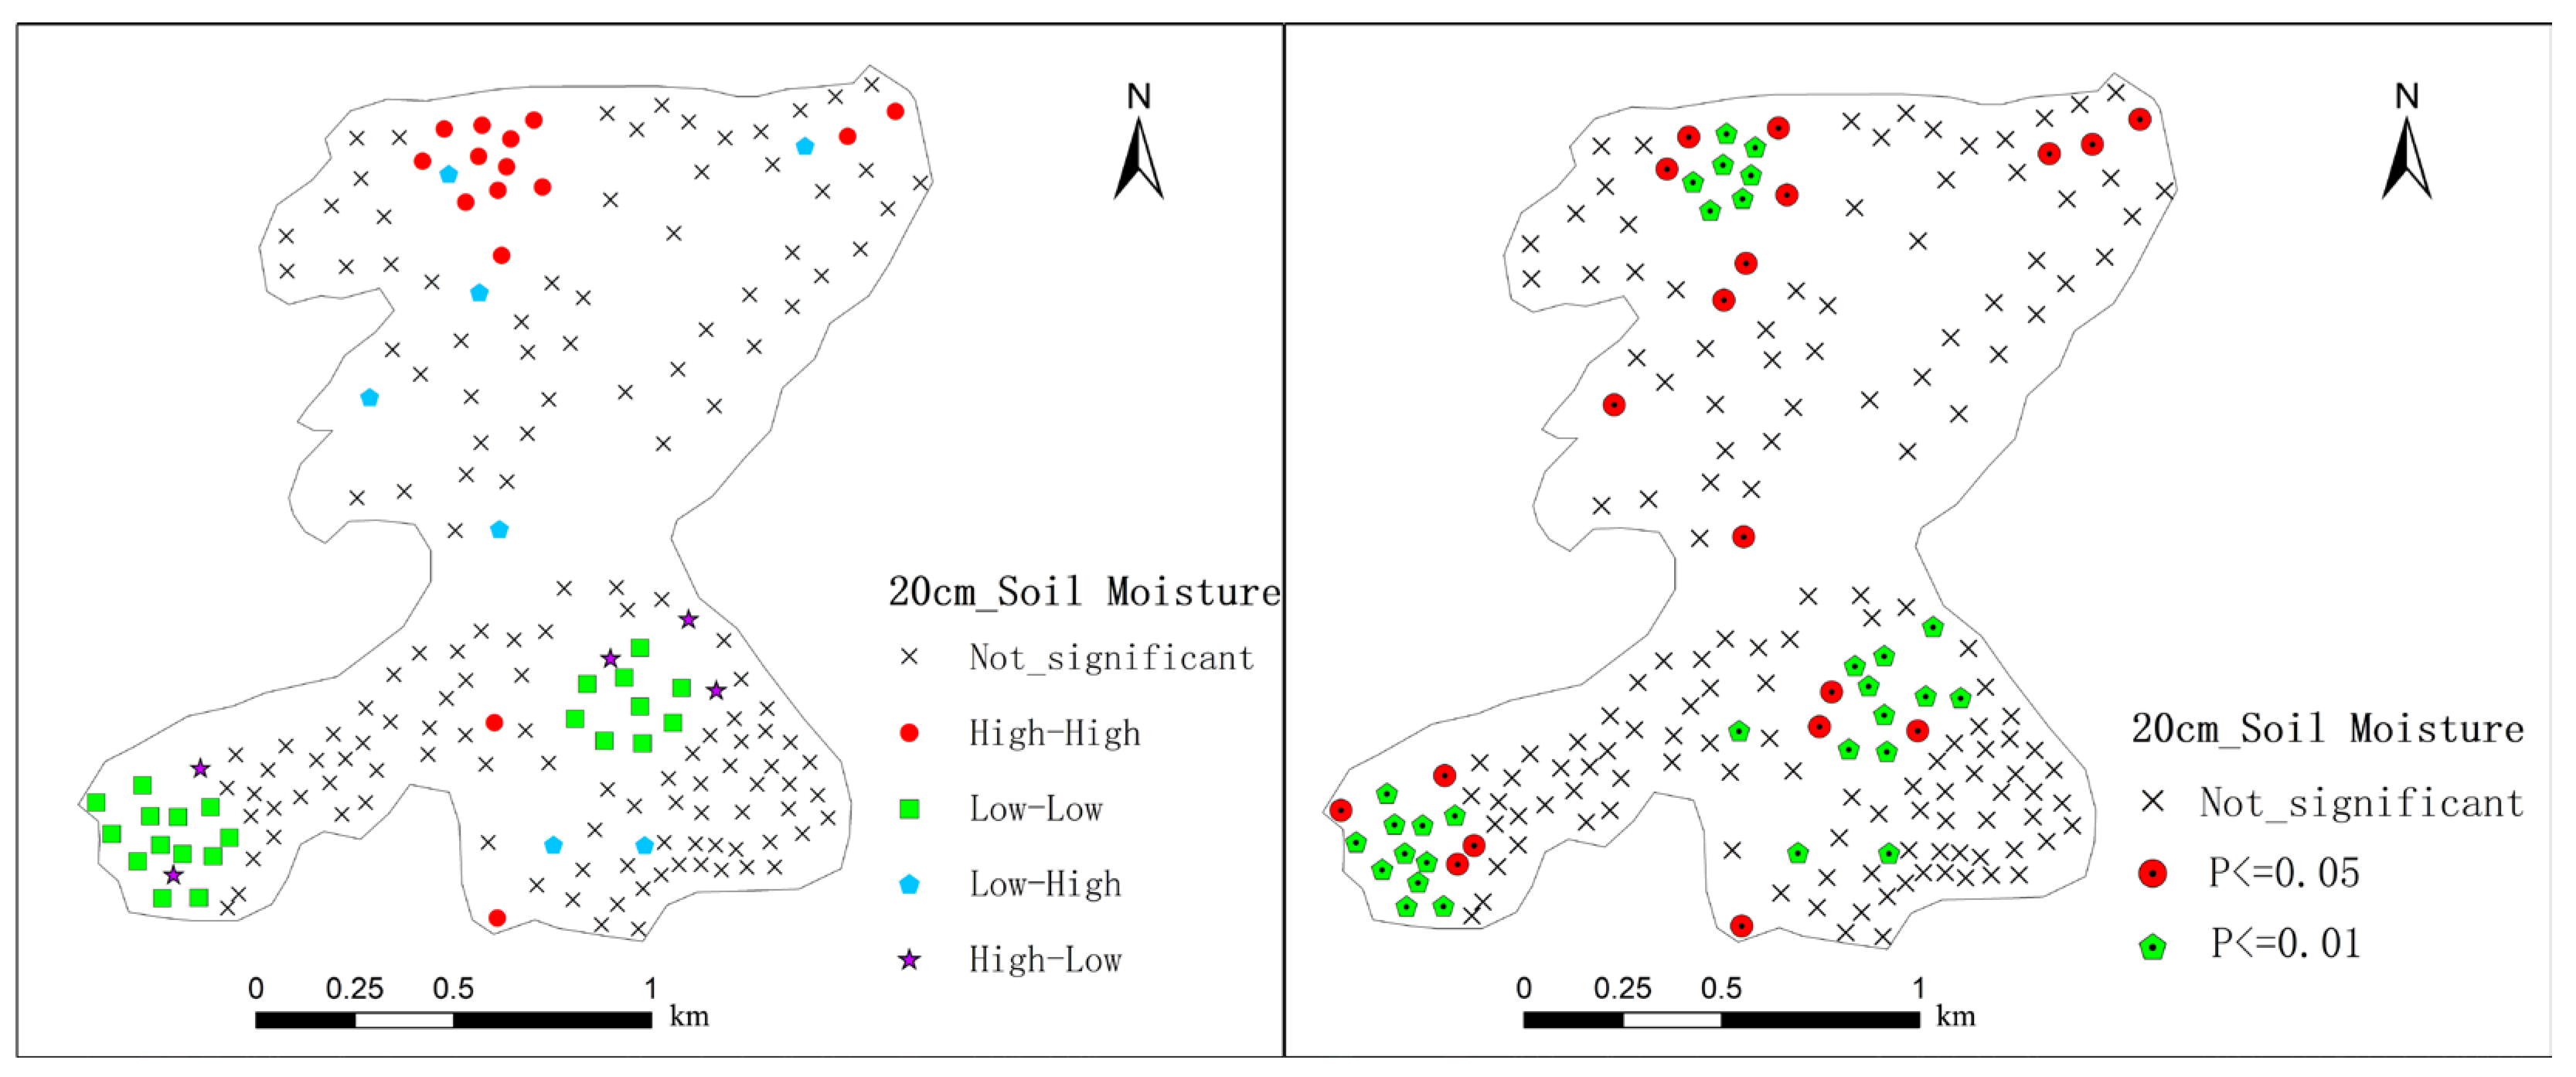
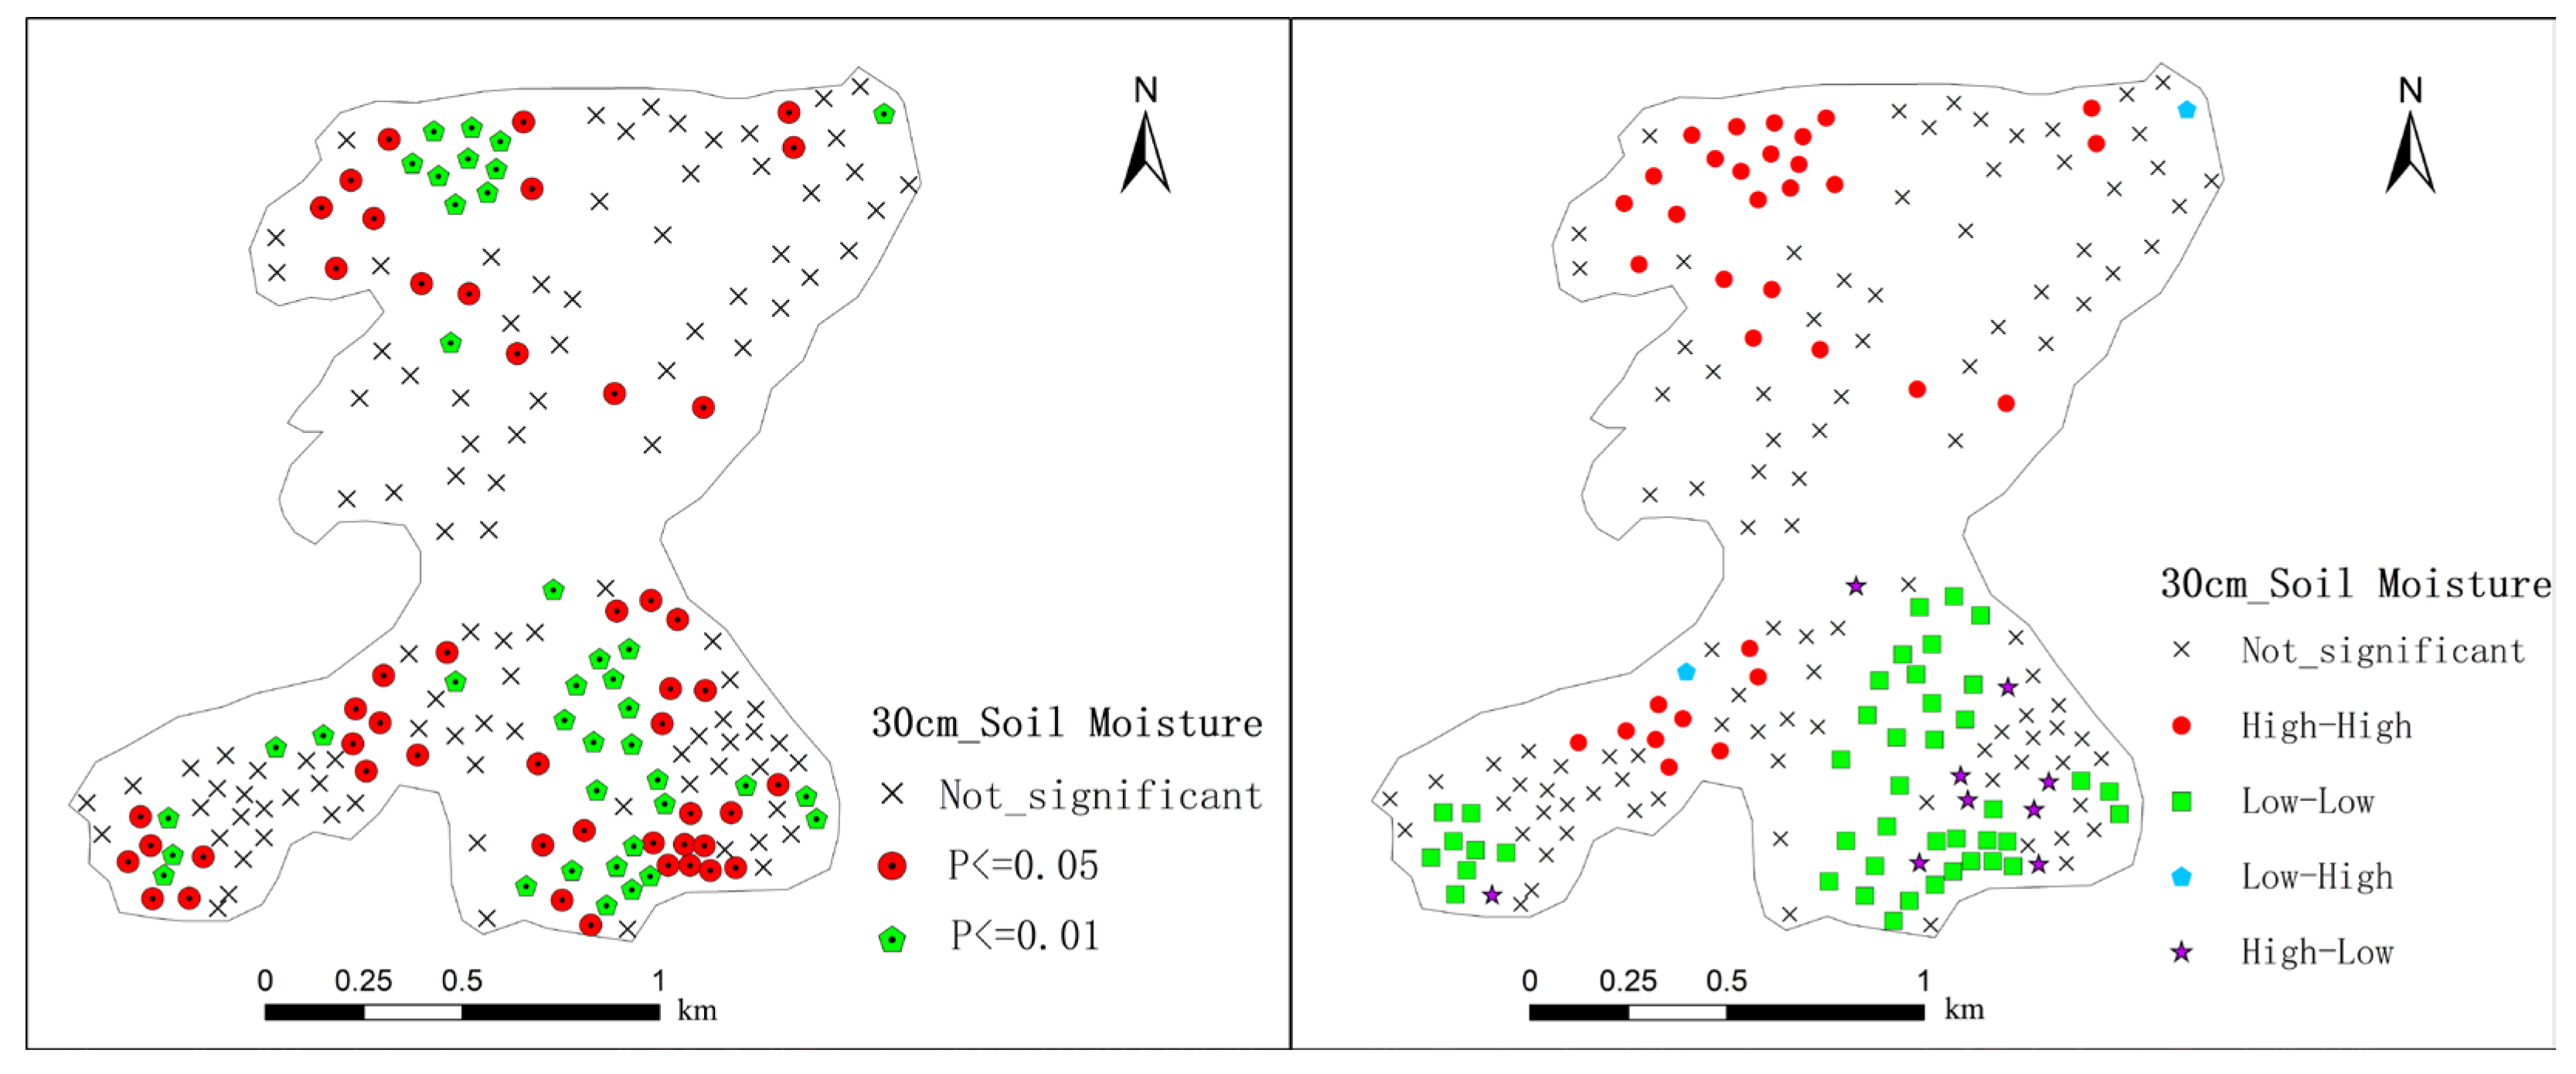
The spatial distribution of soil moisture at different soil depths in the Guohua Demonstration Zone presented distinct spatial clustering zones, with fewer isolated zones (Figure 4, Figure 5, Figure 6 and Figure 7). Among these, “high-low” spatial isolated zones were located adjacent to spatial aggregation zones, while “low-high” spatial isolated zones coexisted with “high-high” spatial aggregation zones. As soil depth changed, spatial aggregation zones of soil moisture at different soil depths showed not only aggregation trends but also a certain degree of complexity.

3.2.3. The Semivariogram Model Analysis of Soil Moisture

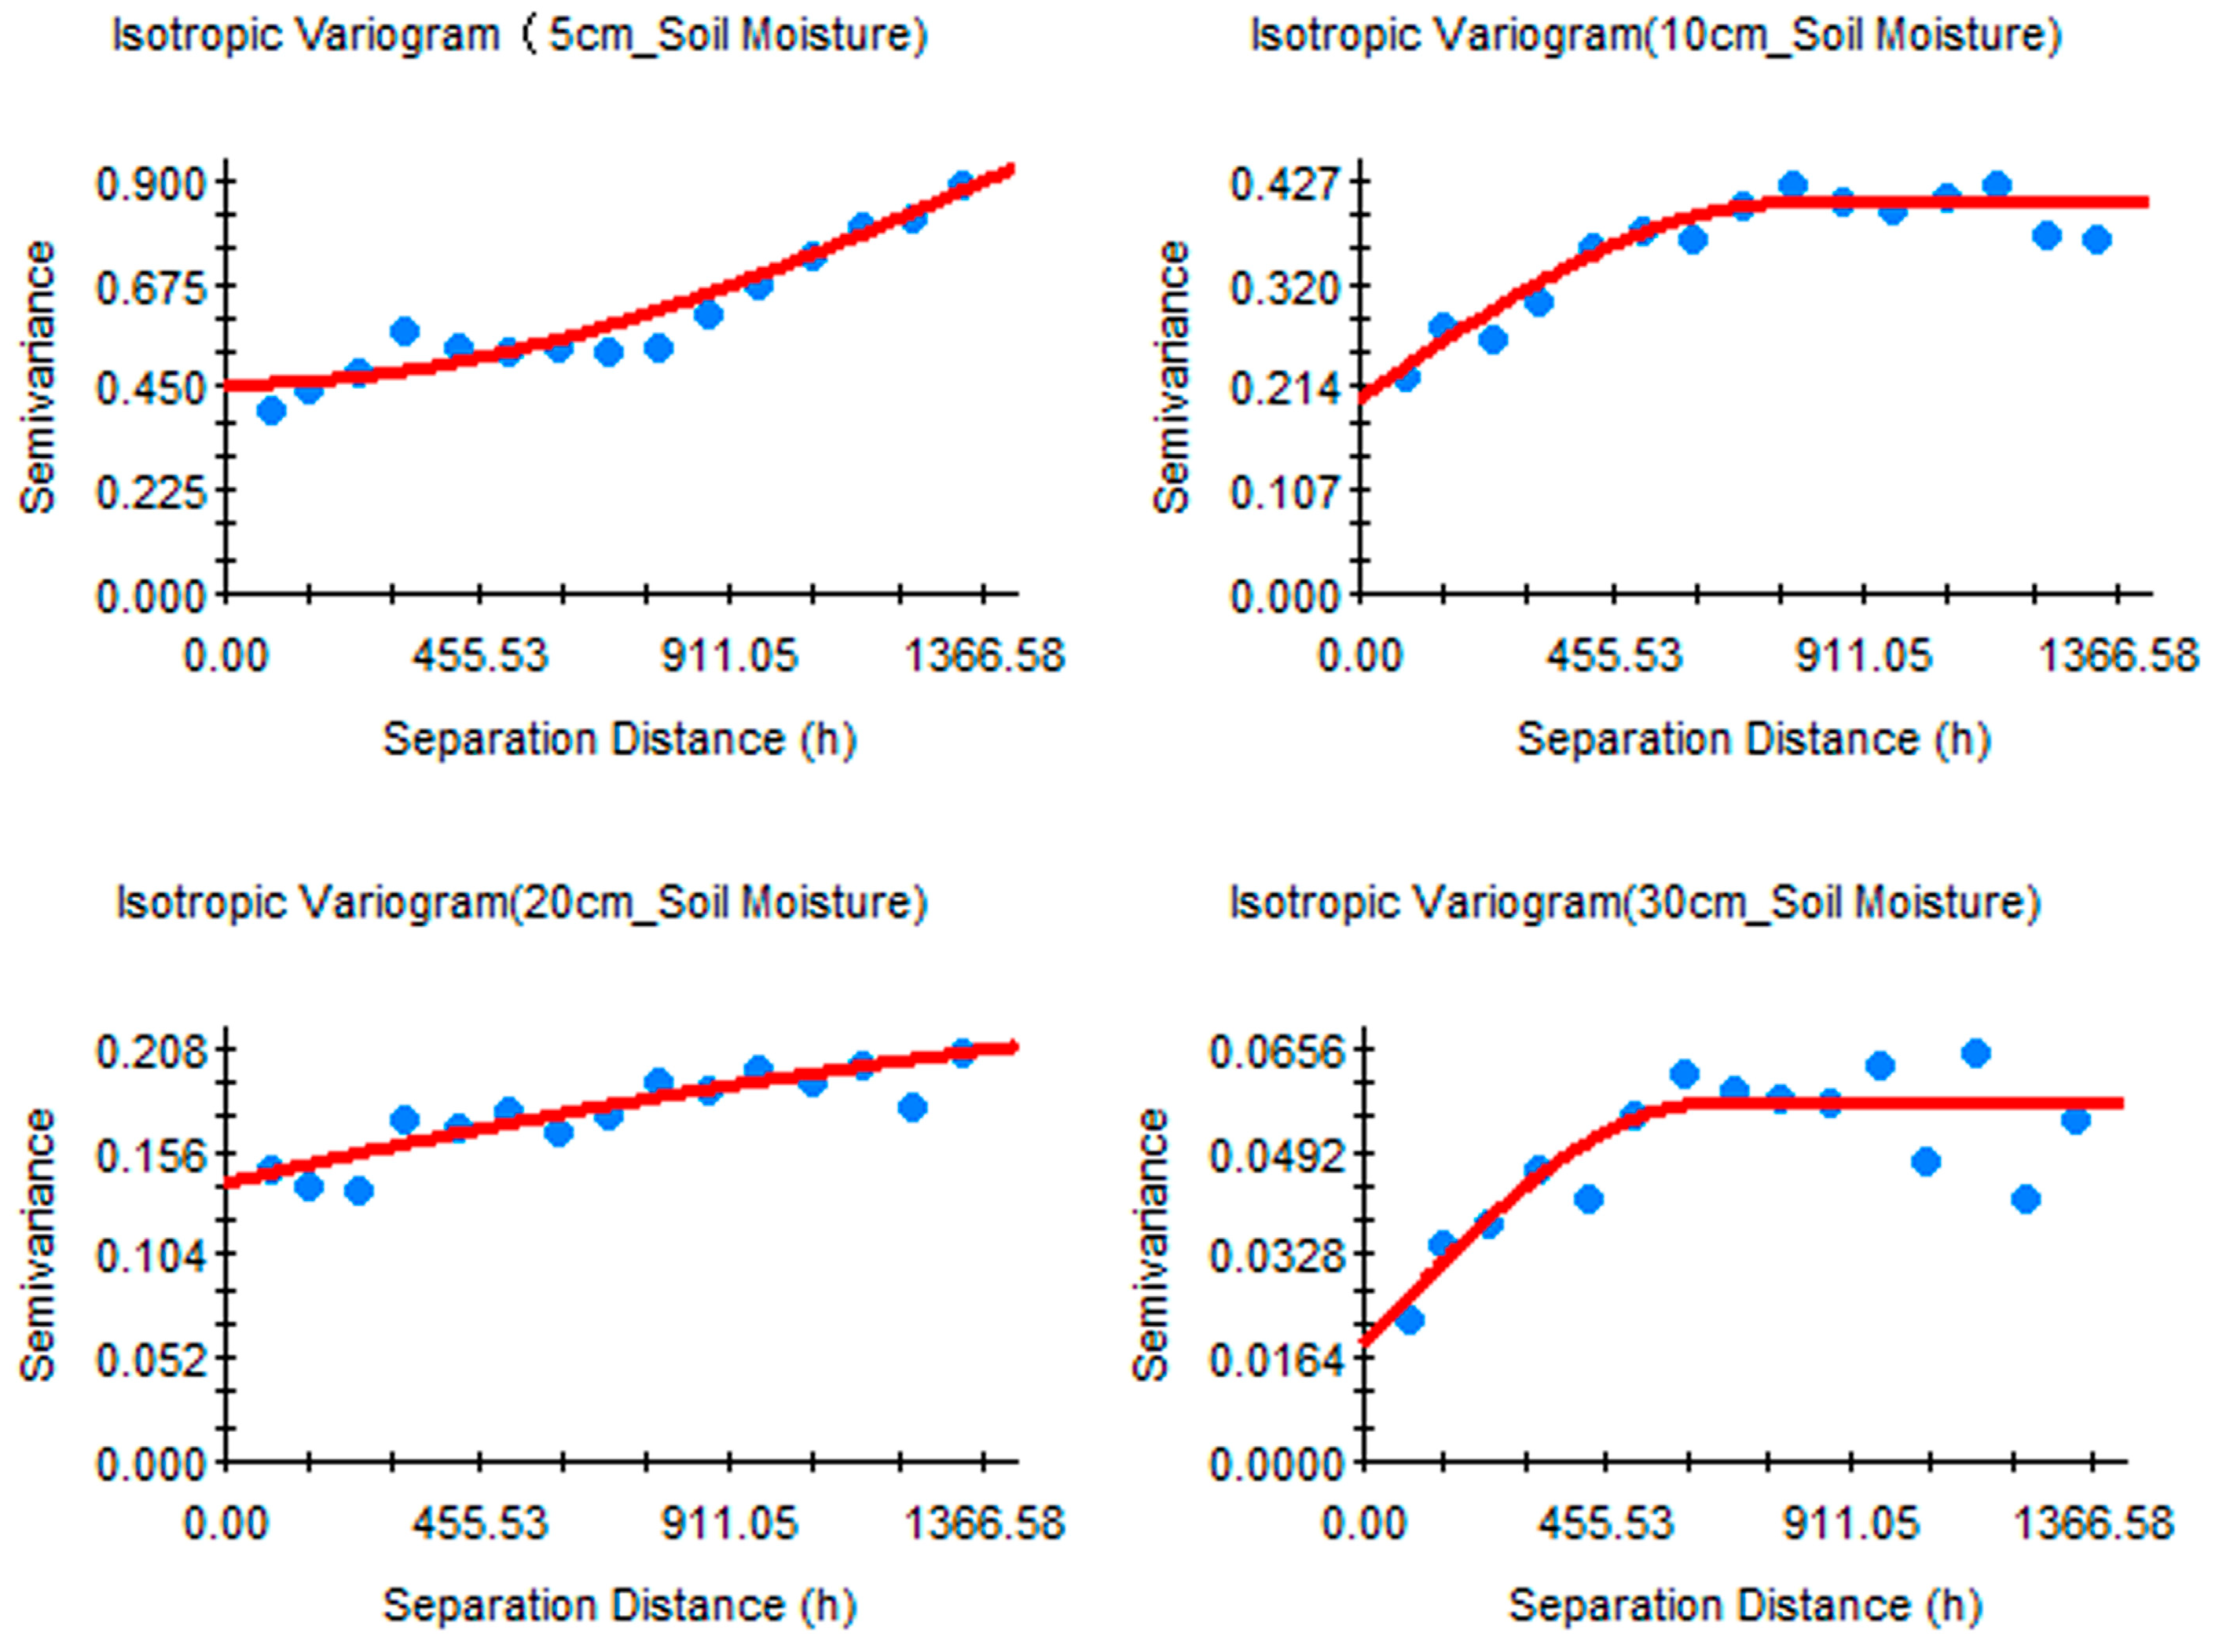
The soil moisture at different soil depths in the Guohua Demonstration Zone was suitable for their respective optimal semivariance function models (Table 2). The coefficient of determination (R2) of the soil moisture fitting models at different soil depths ranged from 0.74 to 0.91, indicating that the semivariance function models for soil moisture at different soil depths fitted well (Figure 8). The blue circles in Figure 8 represented the actual observed soil moisture, and the red lines represented the fitting results of the theoretical models. The C0/(C0 + C) ratio for soil moisture at different soil depths in the Guohua Demonstration Zone ranged from 25% to 75%, indicating that soil moisture at different soil depths in the Guohua Demonstration Zone presented moderate spatial autocorrelation. In terms of the range of spatial correlation (Table 2), the spatial range value for soil moisture at a depth of 20 cm was the largest (Range = 6318.0 m), indicating the most extensive range of spatial correlation; the spatial range value for soil moisture at a depth of 30 cm was the smallest (Range = 646.0 m), indicating the smallest range of spatial correlation.
For soil layers at depths of 5 cm or 10 cm, soil moisture was primarily influenced by short-term precipitation and evaporation. At the shallow surface layer at a depth of 20 cm, soil points with a relatively high grade of rocky desertification, resulting in extremely poor water-holding capacity [45]. Soil moisture rapidly evaporated or infiltrated downward through fissures, causing these locations to become exceptionally dry. Conversely, in solution gullies, channels, and pits between rocks, soil accumulated to form relatively deep layers with stronger water-holding capacity and higher moisture levels. However, soil distribution within rock crevices and pits was highly random and fragmented [46]. Consequently, at a depth of 20 cm, soil sampling points might span multiple soil patches separated by exposed rock. These patches showed vastly differing moisture conditions (ranging from near saturation to near complete dryness), resulting in a large spatial variability value (6318 m). This indicated that a considerable distance was required to encompass all possible conditions from extremely wet to extremely dry. At a depth of 30 cm or deeper, soil moisture was primarily controlled not by short-term precipitation and evaporation, but by the deeper karst fissure network. At these depths, moisture movement was primarily directed vertically downward into dominant fissures rather than exhibiting substantial horizontal variation. Consequently, soil moisture in layers 30 cm or deeper predominantly showed the homogenizing effect of deep soil water convergence into subterranean karst conduits, resulting in a significantly reduced spatial variability range.

3.2.4. Spatial Distribution of Soil Moisture

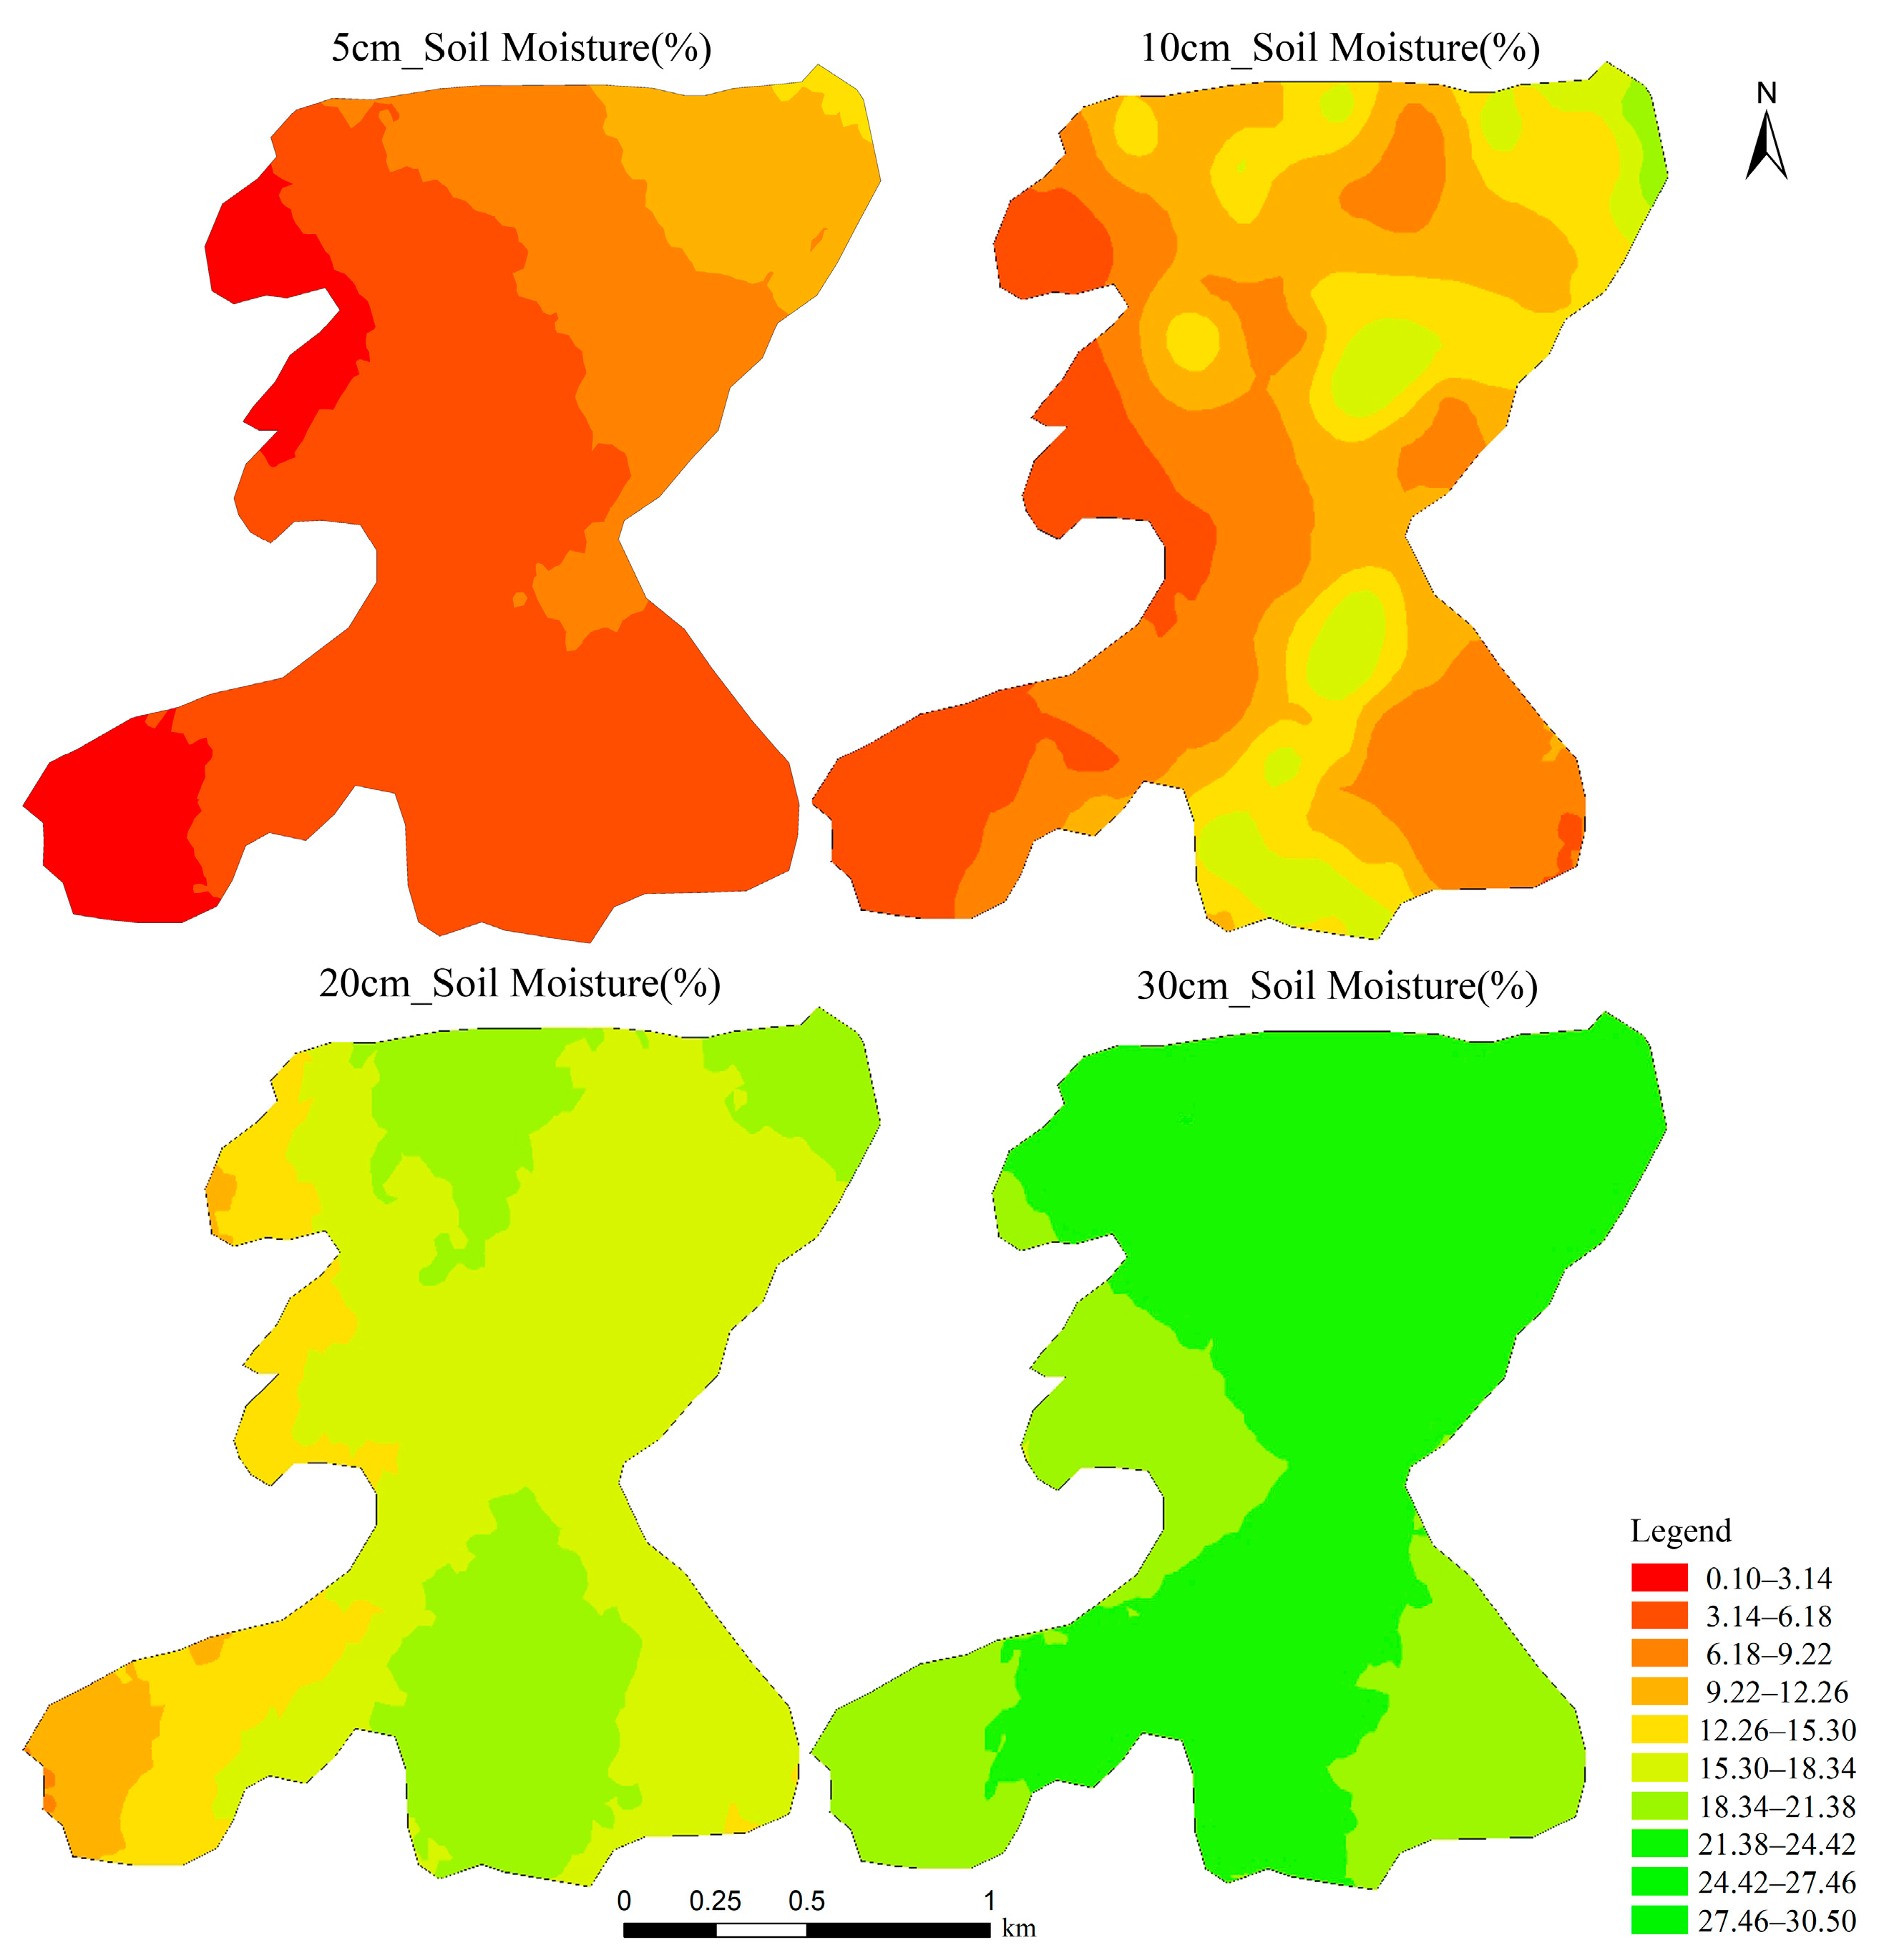
The spatial distribution of soil moisture at different soil depths in the Guohua Demonstration Zone presented heterogeneity, primarily manifesting as arc-shaped and patchy patterns (Figure 9). The overall spatial aggregation characteristics of soil moisture at different soil depths were as follows: high-value zones were observed in the northeastern part. In contrast, low-value zones were distributed in the southwestern part. From the perspective of aggregation centers, the spatial dispersion of soil moisture at different soil depths was relatively large, and the structural integrity of high-value and low-value aggregation centers was poor, with no completely closed aggregation centers.
The higher levels of soil moisture in the northeastern part of the Guohua Demonstration Zone were primarily attributed to the relatively low-lying terrain and the exposure of surface karst springs. The relatively higher levels of soil moisture in the central and south-central parts were closely associated with the construction of elevated water tanks and rainwater collection ponds. Overall, soil moisture values in the Guohua Demonstration Zone increased with soil depth. This phenomenon was primarily related to the shallow surface soil layer and its relatively weak water retention capacity, making it more susceptible to evaporation and downward seepage. In contrast, deeper soil layers presented stronger water storage and retention capabilities.

3.3. Main Controlling Factors of the Spatial Variations in Soil Moisture

From a geological perspective of the Guohua Demonstration Zone (Table 3), the average values of soil moisture under the Lower Permian geological background were relatively higher than those under the Upper Carboniferous geological background. As the values of altitude and slope increased (Table 4 and Table 5), the average values of soil moisture at different soil depths decreased. The average values of soil moisture at different soil depths increased with the increase in karstification degree (Table 6). Increases in soil depth and vegetation coverage had a significant impact on soil moisture at different soil depths (Table 7 and Table 8), but no obvious patterns of change were observed.
Soil moisture was primarily influenced by rock desertification, vegetation cover, soil depth, and elevation (Table 9).
(a)
The transition from non-rock desertification to mild rock desertification showed that as rock desertification occurred and progressed, vegetation cover and soil depth tended to decrease, and the water-holding capacity of vegetation and soil tended to decline, leading to an overall decrease in soil moisture; However, with the emergence of moderate or severe rock desertification, values of soil moisture at different soil depths were generally higher than those at other levels of rock desertification. In areas with moderate or severe rock desertification, soil depth distribution was uneven. Therefore, in areas with less soil, soil typically accumulated in small depressions, erosion pits, and caves, where it possessed greater water storage capacity and lower evaporation rates.
(b)
Soil moisture values varied significantly at different soil depths, primarily due to the impact of vegetation cover on soil water storage capacity. Therefore, in areas with vegetation cover of more than 20%, soil moisture values increased with increasing values of vegetation coverage, and presented distinct layering characteristics as soil depth changed. However, in areas with vegetation coverage of 0–20%, soil moisture was relatively high because these soil moisture sampling points were primarily located near villages where residents pumped the groundwater for irrigation, resulting in surface spring water overflow phenomena.
(c)
Soil moisture values increased with soil depth because soil moisture at the soil surface was prone to evaporation and downward penetration. In contrast, deeper soil layers had relatively stronger water-holding capacity. Since soil moisture evaporation primarily occurred at the soil surface, the average evaporation rate of soil moisture tended to decrease with increasing soil depth, making it easier for soil moisture to be retained in the soil.
(d)
Elevation had a particular influence on soil moisture, as water—particularly soil moisture in soils at higher elevations—tended to flow toward lower-lying areas of slopes via surface runoff or subsurface runoff due to gravitational forces. This process accumulated water in the soils of low-lying areas.
Based on the statistical method of the synergistic effect between factors affecting soil indicators [47,48,49,50,51,52], the interaction between various factors affecting soil moisture in the Guohua Demonstration Zone was obtained (Table 10). The synergistic effect of “rocky desertification + vegetation”, “rocky desertification + soil thickness”, and “vegetation + soil thickness” had a greater influence on soil moisture.

4. Discussion

Since the parent material of the study area’s soil is carbonate-dominated limestone, the inherent permeability of limestone itself exerts a certain influence on the overall water retention capacity encompassing both rock and soil [53,54]. The Guohua Demonstration Zone is a characteristic ecological industry demonstration area mainly planting pitaya, which has formed a mature ecological industry model and has produced a wide range of radiation effects in the southwestern region of China. There were currently no comparable studies on soil moisture in the Guohua Demonstration Zone, making it impossible to directly compare the soil moisture results from this study with those from previous research. From a methodological perspective, this study integrated image processing technologies [55], downscaling methods [56,57], and multi-source data [58] to design a novel soil moisture sampling methodology featuring high-density and multi-depth soil moisture sampling points. This methodology was supported by multi-source data and “3S” technologies, enabling the accurate spatial distribution and environmental information of soil moisture sampling points to be identified.
To ensure the accuracy of soil moisture research, determining an appropriate spacing interval distance of soil moisture sampling points should consider not only the statistical characteristics of soil moisture but also its spatial structure. Compared to classical statistical methods, spatial autocorrelation and geostatistical methods could determine the spatial arrangement, shape, and layout of soil moisture sampling points, providing valuable guidance for the design of spacing interval distances of soil moisture sampling points. The actual spacing interval distances of soil moisture sampling points (approximately 120 m) were not only smaller than that of the minimum spatial autocorrelation distance (2000.0 m) but also smaller than that of the minimum spatial range value (646.0 m), indicating that the number of soil moisture sampling points in this study was excessive. According to geostatistical theory, the spatial range value to some extent determines the spacing interval distances of soil moisture sampling points, and the soil moisture sampling points should avoid redundancy within this range. To achieve soil moisture sampling accuracy for soil moisture at different soil depths in the Guohua Demonstration Zone while minimizing the use of human, material, and financial resources, the appropriate spacing interval distances of soil moisture sampling points at different soil depths in the Guohua Demonstration Zone could be defined as the minimum value of the spacing interval distances of soil moisture sampling points obtained from both spatial autocorrelation and geostatistical methods (threshold: 646.0 m). As long as an appropriate spacing interval distance of soil moisture sampling points was ensured within a small range, high precision could also be achieved over a larger range.

5. Conclusions

By employing classical statistics, geostatistics, and “3S” technologies, combined with soil moisture sampling points and field monitoring, this study investigated the spatial autocorrelation, spatial structure, and influencing factors of soil moisture in the Guohua Demonstration Zone from both horizontal and vertical perspectives. The following conclusions were drawn: positive global spatial autocorrelation existed in the spatial distribution of soil moisture at different soil depths within the Guohua Demonstration Zone; The minimum spacing interval distance of soil moisture sampling points for both spatial autocorrelation and geostatistical analysis of soil moisture at different soil depths in the Guohua Demonstration Zone was 646.0 m (threshold), which was the appropriate spacing interval distance of soil moisture sampling points at different soil depths in the Guohua Demonstration Zone; Soil moisture at different soil depths in the Guohua Demonstration Zone were primarily influenced by soil erosion, vegetation cover, soil depth, and elevation. The synergistic effect of “rocky desertification + vegetation”, “rocky desertification + soil thickness”, and “vegetation + soil thickness” had a greater influence on soil moisture.
This study identified rock desertification, vegetation cover, soil thickness, and elevation as the primary influencing factors; however, it provided a limited explanation of the mechanisms through which these factors quantitatively influenced soil moisture. Future research could utilize more complex models, such as process-based hydrological models or machine learning methods, to quantify these relationships. Due to constraints on time, effort, and funding, this study was unable to investigate seasonal and interannual variations in soil moisture. Further research will be conducted to employ more advanced research methods and indicate additional spatial patterns and geographical significance.

Author Contributions

Conceptualization, Z.J. and H.Y.; Methodology, H.Y.; Validation, B.X., X.L. and Z.J.; Investigation, H.Y.; Resources, H.Y.; Data curation, H.Y. and X.L.; Writing—original draft preparation, H.Y.; Writing—review and editing, H.Y. and T.W.; Visualization, H.Y. and B.X.; Supervision, Y.W.; Project administration, H.Y.; funding acquisition, B.X. All authors have read and agreed to the published version of the manuscript.

Funding

This research was funded by the Guangdong Provincial Department of Education Characteristic Innovation Project, grant number 2024KTSCX092, and Huizhou Science and Technology Project, grant number 2022CQ010026.

Data Availability Statement

The authors confirm that the data supporting the findings of this study are available within the article. Further inquiries can be directed to the corresponding author.

Conflicts of Interest

The authors declare no conflicts of interest.

Abbreviations

The following abbreviations are used in this manuscript:
3SGIS, RS, and GPS
GISGeography information systems
RSRemote sensing
GPSGlobal positioning systems

References

  1. Humphrey, V.; Berg, A.; Ciais, P.; Gentine, P.; Jung, M.; Reichstein, M.; Seneviratne, S.I.; Frankenberg, C. Soil Moisture–Atmosphere Feedback Dominates Land Carbon Uptake Variability. Nature 2021, 592, 65–69. [Google Scholar] [CrossRef]
  2. Li, J.; Niu, Z.; Guo, Z.; Li, J.; Ye, S.; Hua, D. Improving Soil Water Dynamics and Crop Productivity through Conservation Tillage in Arid Regions. Sci. Rep. 2025, 15, 25242. [Google Scholar] [CrossRef]
  3. Niu, N.; Fan, J.; Yang, Z. The Spatial and Temporal Variations Evaluation of Water Conservation in Guizhou Province Based on InVEST Model. Sci. Rep. 2025, 15, 22413. [Google Scholar] [CrossRef]
  4. Radolinski, J.; Vremec, M.; Wachter, H.; Birk, S.; Brüggemann, N.; Herndl, M.; Kahmen, A.; Nelson, D.B.; Kübert, A.; Schaumberger, A.; et al. Drought in a Warmer, CO2-Rich Climate Restricts Grassland Water Use and Soil Water Mixing. Science 2025, 387, 290–296. [Google Scholar] [CrossRef] [PubMed]
  5. Zhang, J.; Ren, F.; Zhang, R.; Ding, L.; Li, F.; Li, X.; Zhong, T.; Yin, M.; Du, L.; Yang, R.; et al. Effects of Crushed Wheat Straw with Plastic Film Mulch on Soil Hydrothermal Properties and Water Use Efficiency of Sunflower in the Northwestern Arid Region of China. Sci. Rep. 2025, 15, 23066. [Google Scholar] [CrossRef]
  6. Heydari, L.; Bayat, H.; Sarmadian, F. Spatial Relationships between the van Genuchten Soil-Water Retention Curve Parameters and Photosynthetic Gas Exchange Variables in a Wheat Field. Soil Tillage Res. 2023, 234, 105850. [Google Scholar] [CrossRef]
  7. Yu, J.; Zheng, W.; Xu, L.; Meng, F.; Li, J.; Zhangzhong, L. TPE-CatBoost: An Adaptive Model for Soil Moisture Spatial Estimation in the Main Maize-Producing Areas of China with Multiple Environment Covariates. J. Hydrol. 2022, 613, 128465. [Google Scholar] [CrossRef]
  8. Wu, F.; Guo, S.; Huang, W.; Han, Y.; Wang, Z.; Feng, L.; Wang, G.; Li, X.; Lei, Y.; Zhi, X.; et al. Soil Water Movement May Regulate Soil Water Consumption and Improve Cotton Yields under Different Cotton Cropping Systems. Ind. Crops Prod. 2024, 211, 118278. [Google Scholar] [CrossRef]
  9. Xin, M.; Wu, F.; Wang, G.; Li, X.-F.; Li, Y.; Han, Y.; Yang, B.; Dong, H.; Guo, S.; Feng, L. Water Dynamics and Competition in Cotton Populations: Assessing Soil Moisture Utilization and Yield Patterns under Different Planting Densities Using Advanced Spatial Monitoring and Analysis. Ind. Crops Prod. 2025, 224, 120333. [Google Scholar] [CrossRef]
  10. Orouskhani, E.; Sahoo, S.R.; Agyeman, B.T.; Bo, S.; Liu, J. Impact of Sensor Placement in Soil Water Estimation. IFAC Pap. 2022, 55, 340–345. [Google Scholar] [CrossRef]
  11. Gélinas, M.; Jutras, S. Gamma Radiation for the Estimation of Mineral Soil Water Content in a Boreal Forest. Can. J. Soil Sci. 2024, 104, 191–203. [Google Scholar] [CrossRef]
  12. Zhang, M.; Zhang, D.; Jin, Y.; Wan, X.; Ge, Y. Evolution of Soil Moisture Mapping from Statistical Models to Integrated Mechanistic and Geoscience-Aware Approaches. Inf. Geogr. 2025, 1, 100005. [Google Scholar] [CrossRef]
  13. Dash, S.K.; Sinha, R. Space-Time Dynamics of Soil Moisture and Groundwater in an Agriculture-Dominated Critical Zone Observatory (CZO) in the Ganga Basin, India. Sci. Total Environ. 2022, 851, 158231. [Google Scholar] [CrossRef]
  14. Luo, P.; Song, Y.; Huang, X.; Ma, H.; Liu, J.; Yao, Y.; Meng, L. Identifying Determinants of Spatio-Temporal Disparities in Soil Moisture of the Northern Hemisphere Using a Geographically Optimal Zones-Based Heterogeneity Model. ISPRS J. Photogramm. Remote Sens. 2022, 185, 111–128. [Google Scholar] [CrossRef]
  15. Hodges, B.; Tagert, M.L.; Paz, J.O.; Meng, Q. Assessing In-Field Soil Moisture Variability in the Active Root Zone Using Granular Matrix Sensors. Agric. Water Manag. 2023, 282, 108268. [Google Scholar] [CrossRef]
  16. Lin, S.; Wei, K.; Wang, Q.; Deng, M.; Su, L.; Shao, F.; Jiang, Z. Spatiotemporal Variability of Soil Physical Properties and Water, Salt, Nitrogen, and Phosphorus Contents for Farm Level. Can. J. Soil Sci. 2023, 103, 406–427. [Google Scholar] [CrossRef]
  17. Molenaar, R.E.; Kleidorfer, M.; Kohl, B.; Teuling, A.J.; Achleitner, S. Does Afforestation Increase Soil Water Buffering? A Demonstrator Study on Soil Moisture Variability in the Alpine Geroldsbach Catchment, Austria. J. Hydrol. 2024, 643, 131984. [Google Scholar] [CrossRef]
  18. Zhang, Z.; Yin, H.; Chang, J.; Xue, J. Spatial Variability of Surface Soil Water Content and Its Influencing Factors on Shady and Sunny Slopes of an Alpine Meadow on the Qinghai–Tibetan Plateau. Glob. Ecol. Conserv. 2022, 34, e02035. [Google Scholar] [CrossRef]
  19. Li, J.; Ren, J.; Fan, X.; Zhou, P.; Pu, Y.; Zhang, F. Estimation of Unfrozen Water Content in Frozen Soils Based on Data Interpolation and Constrained Monotonic Neural Network. Cold Reg. Sci. Technol. 2024, 218, 104094. [Google Scholar] [CrossRef]
  20. Owens, P.R.; Mancini, M.; Winzeler, E.H.; Read, Q.; Sun, N.; Blackstock, J.; Libohova, Z. Simulating Water Dynamics Related to Pedogenesis across Space and Time: Implications for Four-Dimensional Digital Soil Mapping. Geoderma 2024, 447, 116911. [Google Scholar] [CrossRef]
  21. Alkassem, M.; Buis, S.; Coulouma, G.; Jacob, F.; Lagacherie, P.; Prévot, L. Estimating Soil Available Water Capacity within a Mediterranean Vineyard Watershed Using Satellite Imagery and Crop Model Inversion. Geoderma 2022, 425, 116081. [Google Scholar] [CrossRef]
  22. Zhang, L.; Liu, Y.; Ren, L.; Teuling, A.J.; Zhang, X.; Jiang, S.; Yang, X.; Wei, L.; Zhong, F.; Zheng, L. Reconstruction of ESA CCI Satellite-Derived Soil Moisture Using an Artificial Neural Network Technology. Sci. Total Environ. 2021, 782, 146602. [Google Scholar] [CrossRef]
  23. Tang, F.; Ma, T.; Tang, J.; Yang, Q.; Xue, J.; Zhu, C.; Wang, C. Space-Time Dynamics and Potential Drivers of Soil Moisture and Soil Nutrients Variation in a Coal Mining Area of Semi-Arid, China. Ecol. Indic. 2023, 157, 111242. [Google Scholar] [CrossRef]
  24. Rawat, K.S.; Sehgal, V.K.; Singh, S.K.; Ray, S.S. Soil Moisture Estimation Using Triangular Method at Higher Resolution from MODIS Products. Phys. Chem. Earth Parts ABC 2022, 126, 103051. [Google Scholar] [CrossRef]
  25. Xu, M.; Yao, N.; Yang, H.; Xu, J.; Hu, A.; de Goncalves, L.G.G.; Liu, G. Downscaling SMAP Soil Moisture Using a Wide & Deep Learning Method over the Continental United States. J. Hydrol. 2022, 609, 127784. [Google Scholar] [CrossRef]
  26. Xu, M.; Yang, H.; Hu, A.; Heng, L.; Li, L.; Yao, N.; Liu, G. A Deep Learning Approach for SMAP Soil Moisture Downscaling Informed by Thermal Inertia Theory. Int. J. Appl. Earth Obs. Geoinf. 2025, 136, 104370. [Google Scholar] [CrossRef]
  27. Zhao, H.; Li, J.; Yuan, Q.; Lin, L.; Yue, L.; Xu, H. Downscaling of Soil Moisture Products Using Deep Learning: Comparison and Analysis on Tibetan Plateau. J. Hydrol. 2022, 607, 127570. [Google Scholar] [CrossRef]
  28. Zheng, M.; Liu, Z.; Li, J.; Xu, Z.; Sun, J. Downscaling Soil Moisture in Regions with High Soil Heterogeneity: The Solution Based on Ensemble Learning with Sequential and Parallel Learner. Sci. Total Environ. 2024, 950, 175260. [Google Scholar] [CrossRef]
  29. Zhu, Z.; Bo, Y.; Sun, T.; Zhang, X.; Sun, M.; Shen, A.; Zhang, Y.; Tang, J.; Cao, M.; Wang, C. A Downscaling-and-Fusion Framework for Generating Spatio-Temporally Complete and Fine Resolution Remotely Sensed Surface Soil Moisture. Agric. For. Meteorol. 2024, 352, 110044. [Google Scholar] [CrossRef]
  30. Koujani, S.R.; Hosseini, S.A.; Sharafati, A. Soil Moisture Downscaling in the State of Oklahoma: Employing Advanced Machine Learning. J. Atmos. Sol. Terr. Phys. 2025, 268, 106454. [Google Scholar] [CrossRef]
  31. Zhang, M.; Ge, Y.; Ma, Y.; Jin, Y.; Chen, Y.; Liu, S. Downscaling Multilayer Soil Moisture Using Parameterized Depth Profiles Associated with Environmental Factors. J. Hydrol. 2025, 661, 133544. [Google Scholar] [CrossRef]
  32. Tunçay, T.; Alaboz, P.; Dengiz, O.; Başkan, O. Application of Regression Kriging and Machine Learning Methods to Estimate Soil Moisture Constants in a Semi-Arid Terrestrial Area. Comput. Electron. Agric. 2023, 212, 108118. [Google Scholar] [CrossRef]
  33. Zhang, M.; Ge, Y.; Heuvelink, G.B.M.; Ma, Y. High Resolution Soil Moisture Mapping in 3D Space and Time Using Machine Learning and Depth Functions. Geoderma 2024, 452, 117117. [Google Scholar] [CrossRef]
  34. Anand, A.; Singh, P.; Srivastava, P.K.; Gupta, M. Chapter 19—GIS-Based Analysis for Soil Moisture Estimation via Kriging with External Drift. In Agricultural Water Management; Srivastava, P.K., Gupta, M., Tsakiris, G., Quinn, N.W., Eds.; Academic Press: Cambridge, MA, USA, 2021; pp. 391–408. ISBN 978-0-12-812362-1. [Google Scholar]
  35. Campos Mantovanelli, B.; Petry, M.T.; Broetto Weiler, E.; Carlesso, R. Geostatistical Interpolation Based Ternary Diagrams for Estimating Water Retention Properties in Soils in the Center-South Regions of Brazil. Soil Tillage Res. 2021, 209, 104973. [Google Scholar] [CrossRef]
  36. Yan, P.; Lin, K.; Wang, Y.; Zheng, Y.; Gao, X.; Tu, X.; Bai, C. Spatial Interpolation of Red Bed Soil Moisture in Nanxiong Basin, South China. J. Contam. Hydrol. 2021, 242, 103860. [Google Scholar] [CrossRef]
  37. Gao, Y.; Yang, P. Temporal and Spatial Distribution of Soil Water Repellency in Grassland Soils and Its Relation to Soil Moisture, Hydrophobic Matter, and Particle Size. Sci. Total Environ. 2023, 904, 166700. [Google Scholar] [CrossRef]
  38. Anjum, M.; Siddique, N.; Younis, H.; Faiz, Y.; Shafique, M.A.; Mahnoor, A.; Sajid, A.; Altaf, M. Heavy Metals and Radionuclides in Islamabad’s Industrial Area: A Comprehensive Analysis of Soil and Water Pollution, Source Apportionment and Health Effects Using Statistical and Geospatial Tools. J. Trace Elem. Miner. 2024, 8, 100127. [Google Scholar] [CrossRef]
  39. Pérez-de-los-Reyes, C.; Sánchez-Ormeño, M.; Bravo Martín-Consuegra, S.; García-Pradas, J.; Pérez-de-los-Reyes, M.L.; Ramírez, A.; Ortíz-Villajos, J.Á.A.; García Navarro, F.J.; Jiménez-Ballesta, R. The Influence of Depth on the Water Retention Properties of Vineyard Soils. Agric. Water Manag. 2022, 261, 107384. [Google Scholar] [CrossRef]
  40. Jin, J.; Zhang, B.; Mao, X. Improved Stratified Sampling Strategy for Estimating Mean Soil Moisture Based on Auxiliary Variable Spatial Autocorrelation. Soil Tillage Res. 2022, 215, 105212. [Google Scholar] [CrossRef]
  41. Hasanova, S.A. Construction of a Diagnostic Algorithm for Soil Identification According to the International Soil Classification System Wrb. Adv. Inf. Syst. 2024, 8, 100–106. [Google Scholar] [CrossRef]
  42. Shi, X.Z.; Yu, D.S.; Xu, S.X.; Warner, E.D.; Wang, H.J.; Sun, W.X.; Zhao, Y.C.; Gong, Z.T. Cross-Reference for Relating Genetic Soil Classification of China with WRB at Different Scales. Geoderma 2010, 155, 344–350. [Google Scholar] [CrossRef]
  43. Shao, S.; Zhang, H.; Fan, M.; Su, B.; Wu, J.; Zhang, M.; Yang, L.; Gao, C. Spatial Variability-Based Sample Size Allocation for Stratified Sampling. CATENA 2021, 206, 105509. [Google Scholar] [CrossRef]
  44. Dong, S.; Chen, Z.; Gao, B.; Guo, H.; Sun, D.; Pan, Y. Stratified Even Sampling Method for Accuracy Assessment of Land Use/Land Cover Classification: A Case Study of Beijing, China. Int. J. Remote Sens. 2020, 41, 6427–6443. [Google Scholar] [CrossRef]
  45. Li, G.; Rubinato, M.; Wan, L.; Wu, B.; Luo, J.; Fang, J.; Zhou, J. Preliminary Characterization of Underground Hydrological Processes under Multiple Rainfall Conditions and Rocky Desertification Degrees in Karst Regions of Southwest China. Water 2020, 12, 594. [Google Scholar] [CrossRef]
  46. Yang, Q.; Zhang, F.; Jiang, Z.; Li, W.; Zhang, J.; Zeng, F.; Li, H. Relationship between Soil Depth and Terrain Attributes in Karst Region in Southwest China. J. Soils Sediments 2014, 14, 1568–1576. [Google Scholar] [CrossRef]
  47. Qi-yong, Y.; Zhong-cheng, J.; Wen-jun, L.; Hui, L. Prediction of Soil Organic Matter in Peak-Cluster Depression Region Using Kriging and Terrain Indices. Soil Tillage Res. 2014, 144, 126–132. [Google Scholar] [CrossRef]
  48. Bu, R.; Han, S.; Cheng, W.; Wu, Y.; Tang, S.; Li, M.; Wang, H.; Ge, Z.; Wu, J. Deciphering the Role of Particulate Organic Matter in Soil Nitrogen Transformation in Rice–Rapeseed and Rice–Wheat Rotation Systems. Appl. Soil Ecol. 2024, 193, 105146. [Google Scholar] [CrossRef]
  49. Zhang, R.; Xie, Y.; Xue, T.; Liu, S.; Tian, F.; Ji, X.; Pan, S. Quantify the Environmental Factors Interaction Affecting Soil Cd/as Accumulation in Farmland Using Collaborative Filtering Model Combining Global Spatial and Local Property Graph. Environ. Geochem. Health 2025, 47, 376. [Google Scholar] [CrossRef] [PubMed]
  50. Zhang, C.; Lei, S.; Wu, H.; Liao, L.; Wang, X.; Zhang, L.; Liu, G.; Wang, G.; Fang, L.; Song, Z. Simplified Microbial Network Reduced Microbial Structure Stability and Soil Functionality in Alpine Grassland along a Natural Aridity Gradient. Soil Biol. Biochem. 2024, 191, 109366. [Google Scholar] [CrossRef]
  51. Li, H.; Tang, B.; Lehmann, A.; Rongstock, R.; Zhu, Y.; Rillig, M.C. The Dissimilarity between Multiple Management Practices Drives the Impact on Soil Properties and Functions. Soil Ecol. Lett. 2025, 7, 240278. [Google Scholar] [CrossRef]
  52. Abdullah, B.; Niazi, M.B.K.; Jahan, Z.; Shah, T.; Malik, U.S.; Beig, B.; Mahmood, A.; Shah, G.A.; Iqbal, Z. Zinc-Coated Urea with Gelatin-Enhanced Zinc Biofortification, Apparent Nitrogen Recovery, and Ryegrass Production. J. Soil Sci. Plant Nutr. 2024, 24, 1460–1473. [Google Scholar] [CrossRef]
  53. Teng, T.; Chen, Y.; Wang, Y.; Qiao, X. In Situ Nuclear Magnetic Resonance Observation of Pore Fractures and Permeability Evolution in Rock and Coal under Triaxial Compression. J. Energy Eng. 2025, 151, 04025036. [Google Scholar] [CrossRef]
  54. Cao, Z.; Zhang, S.; Du, F.; Ma, D.; Li, Z.; Huang, C.; Wang, W. Water Inrush Mechanism and Variable Mass Seepage of Karst Collapse Columns Based on a Nonlinear Coupling Mechanical Model. Mine Water Environ. 2025, 44, 259–274. [Google Scholar] [CrossRef]
  55. Tong, C.; Ye, Y.; Zhao, T.; Bao, H.; Wang, H. Soil Moisture Disaggregation via Coupling Geographically Weighted Regression and Radiative Transfer Model. J. Hydrol. 2024, 634, 131053. [Google Scholar] [CrossRef]
  56. Qu, Y.; Zhu, Z.; Montzka, C.; Chai, L.; Liu, S.; Ge, Y.; Liu, J.; Lu, Z.; He, X.; Zheng, J.; et al. Inter-Comparison of Several Soil Moisture Downscaling Methods over the Qinghai-Tibet Plateau, China. J. Hydrol. 2021, 592, 125616. [Google Scholar] [CrossRef]
  57. Shangguan, Y.; Tong, C.; Shi, Z.; Wang, H.; Deng, X. Comparison of Different Downscaling Schemes for Obtaining Regional High-Resolution Soil Moisture Data. Int. J. Appl. Earth Obs. Geoinf. 2025, 141, 104652. [Google Scholar] [CrossRef]
  58. Wang, J.; Li, X.; Zhang, Z.; Li, X.; Han, Y.; Feng, L.; Yang, B.; Wang, G.; Lei, Y.; Xiong, S.; et al. Application of Image Technology to Simulate Optimal Frequency of Automatic Collection of Volumetric Soil Water Content Data. Agric. Water Manag. 2022, 269, 107674. [Google Scholar] [CrossRef]
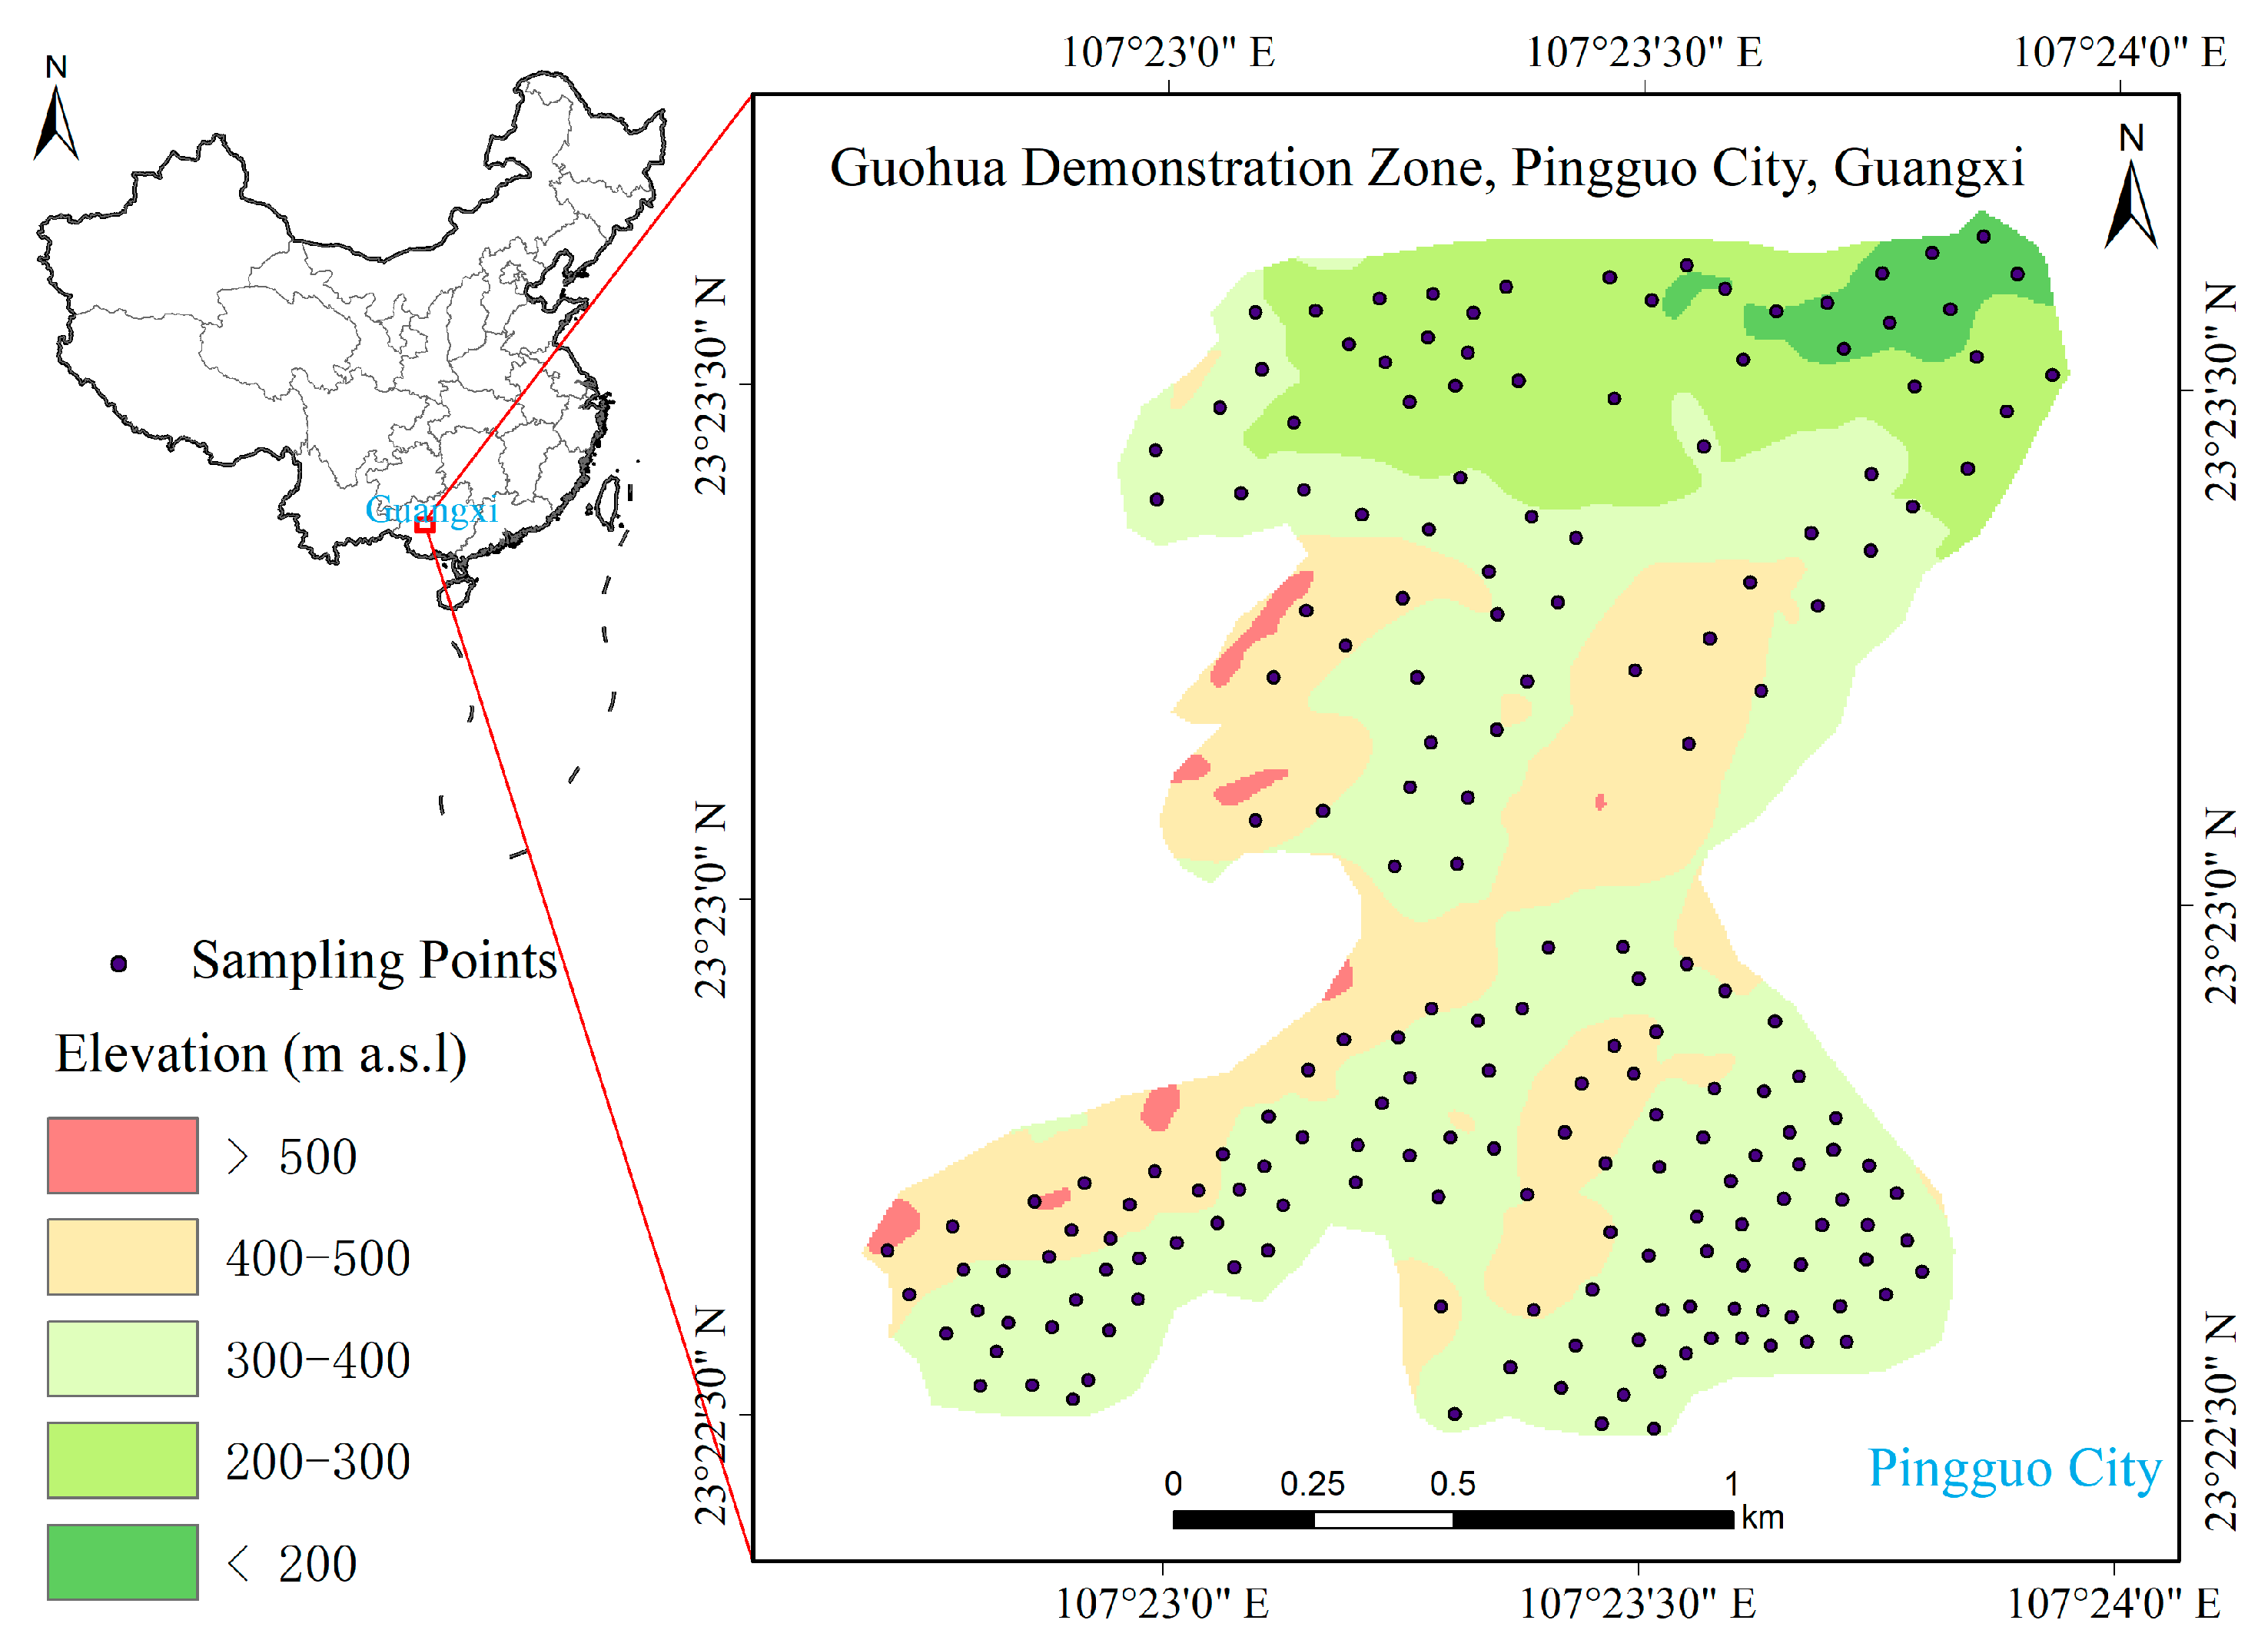
Figure 1. Location of the Guohua Demonstration Zone and soil moisture sampling points.
Water 17 02891 g001
Figure 2. Moran’s scattered point diagram of soil moisture in different soil depths.
Water 17 02891 g002
Figure 3. Interval distance and Moran’s I indices of soil moisture.
Water 17 02891 g003
Figure 4. Spatial correlation and Lisa’s significant level of 5 cm soil moisture.
Water 17 02891 g004
Figure 5. Spatial correlation and Lisa’s significant level of 10 cm soil moisture.
Water 17 02891 g005
Figure 6. Spatial correlation and Lisa’s significant level of 20 cm soil moisture.
Water 17 02891 g006
Figure 7. Spatial correlation and Lisa’s significant level of 30 cm soil moisture.
Water 17 02891 g007
Figure 8. The fitting results of the semivariogram functions for soil moisture at different depths.
Water 17 02891 g008
Figure 9. The spatial distribution maps of soil moisture at various depths.
Water 17 02891 g009
Table 1. Characteristic values of soil moisture.
Soil Depth (cm)Minimum
(%)
Maximum
(%)
Mean
(%)
Variance CoefficientStandard DeviationKurtosisSkewness
50.1023.405.1067.733.454.171.52
100.6029.109.6265.766.331.351.47
202.7031.1016.8735.756.03−0.60−0.06
306.9030.0022.0618.304.042.69−1.39
Table 2. The semivariogram models and related parameters of soil moisture.
Soil Depth (cm)ModelDetermining Coefficient (R2)Nugget
(C0)
Sill (C0 + C)Nugget/Sill
Ratio (%)
Range (m)
5Gaussian0.900.461.7825.843701.39
10Spherical0.910.200.4148.78776.00
20Exponential0.790.140.2850.006318.00
30Spherical0.740.020.0633.33646.00
Table 3. Average values of soil moisture from different geological backgrounds (unit: %).
Soil Depth (cm)Upper Carboniferous (C3)Lower Permian (P1q)
54.125.87
108.8410.05
2016.3617.28
3022.7621.49
Table 4. Average values of soil moisture from different heights (unit: %).
Soil Depth (cm)176.4–260.5 (m)260.5–327.7 (m)327.7–379.5 (m)379.5–432.8 (m)432.8–535.0 (m)
58.135.134.524.204.52
1013.487.668.586.4310.29
2019.5515.6616.2016.8814.69
3023.1321.9621.7521.8420.79
Table 5. Average values of soil moisture from different slopes (unit: %).
Soil Depth (cm)0–10 (°)10–20 (°)20–30 (°)30–40 (°)>40 (°)
56.034.755.395.233.70
1010.868.8210.818.798.46
2017.3714.8016.3913.3412.52
3021.7822.4321.6122.5520.33
Table 6. Average values of soil moisture from different soil thicknesses (unit: %).
Soil Depth (cm)0–15 (cm)15–30 (cm)30–45 (cm)>45 (cm)
54.624.275.036.84
1014.7910.207.9611.17
2017.7315.0919.45
3021.3822.96
Table 7. Average values of soil moisture from different vegetation coverage(unit: %).
Soil Depth (cm)0–20 (%)20–40 (%)40–60 (%)60–80 (%)80–100 (%)
55.804.504.675.695.70
1015.709.848.3710.969.73
2022.6017.5615.9817.6123.10
3020.6122.0222.2825.80
Table 8. Average values of soil moisture from different grades of rocky desertification(unit: %).
Soil Depth (cm)No Rocky
Desertification
Mild Rocky
Desertification
Moderate Rocky
Desertification
Fierce Rocky
Desertification
55.434.604.3910.80
1010.018.4410.0915.85
2017.0316.0517.4820.60
3021.8521.6523.1121.20
Table 9. Variance values of soil moisture under different influence factors.
Soil Depth (cm)Geological BackgroundAltitude (m)Slope (°)Soil Thickness (cm)Vegetation Coverage (%)Rocky Desertification
51.5312.6160.7541.3060.6139.182
100.7327.4741.4018.0907.98410.615
200.4233.3684.1074.82310.5533.866
300.8060.6940.7851.2484.8720.669
Mean0.8733.5381.7623.8676.0066.083
Rank645321
Table 10. Synergistic effect values of soil moisture under different influence factors.
Soil Depth (cm)Geological BackgroundAltitude (m)Slope (°)Soil Thickness (cm)Vegetation Coverage (%)Rocky Desertification
Geological background0.7623.0891.5383.3765.2435.310
Altitude (m) 12.5176.23413.68121.24921.522
Slope (°) 3.1056.81410.58310.718
Soil thickness (cm) 14.95423.22523.523
Vegetation coverage (%) 36.07236.534
Rocky desertification 37.003
Disclaimer/Publisher’s Note: The statements, opinions and data contained in all publications are solely those of the individual author(s) and contributor(s) and not of MDPI and/or the editor(s). MDPI and/or the editor(s) disclaim responsibility for any injury to people or property resulting from any ideas, methods, instructions or products referred to in the content.