Article

Artificial Water Bodies in Post-Industrial and Urban Landscapes—A Case Study on Assessing Their Potential in Blue–Green Urban Infrastructure

by
Mariola Krodkiewska
1,
Bartosz Łozowski
1,*,
Edyta Sierka
1,
Aleksandra Nadgórska-Socha
1,
Andrzej Woźnica
2,
Barbara Feist
3 and
Agnieszka Babczyńska
1,*
1
Institute of Biology, Biotechnology and Environmental Protection, Faculty of Natural Sciences, University of Silesia in Katowice, Bankowa 9 Str., 40-007 Katowice, Poland
2
Silesian Water Centre, Faculty of Natural Sciences, University of Silesia in Katowice, 40-007 Katowice, Poland
3
Institute of Chemistry, Faculty of Science and Technology, University of Silesia in Katowice, Szkolna 9 Str., 40-007 Katowice, Poland
*
Authors to whom correspondence should be addressed.
Water 2025, 17(19), 2862; https://doi.org/10.3390/w17192862
Submission received: 2 August 2025 / Revised: 20 September 2025 / Accepted: 26 September 2025 / Published: 30 September 2025

Abstract

Anthropogenic ponds have the potential to shape the post-industrial landscape and mitigate the effects of climate change, particularly in urban heat island-threatened areas. However, decisions regarding their inclusion in blue–green infrastructure networks require balancing costs and benefits while considering potential pollution risks. The objectives of this study are: (i) to develop an efficient decision-making framework based on standard aquatic science tools; (ii) to apply this framework to a specific artificial pond in the Upper Silesian Industrial Region, Poland, in order to optimize actions based on resources, advantages, limitations, and informativeness of the data. Eighteen methods, grouped into five categories, including historical document analyses, hydroacoustic and modeling methods, multiparametric water quality measurements, and ecotoxicological tests, were used. Optimization-focused analysis indicated that investigating historical documents should precede further testing, as it enables decision-makers to select the most effective methods to assess the pond’s value for blue–green infrastructure. In this case, the tests based on metal pollution, bathymetry, and biodiversity appeared sufficient. The presented approach offers a straightforward screening method for assessing reservoirs in post-industrial areas.

1. Introduction

According to the UN report World Urbanization Prospects: The 2018 Revision, by 2050, over 70% of the global population will live in urban areas [1]. The expansion of this process intensifies the Urban Heat Island (UHI) effect [2], reducing space for vegetation and evapotranspiration [3] and lowering life quality. One of the proposed solutions to this issue is the use of natural potential, particularly the preservation of existing water bodies, which can provide ecosystem services and improve urban living conditions, e.g., by reducing ambient temperatures by 0.9 °C to 1.57 °C [4], regardless of their origin [5]. Anthropogenic reservoirs, often affected by secondary contamination of water and sediments as a result of industrial activity [6], can become important components of blue–green infrastructure [7]. Regardless of their history, such reservoirs located in post-industrial areas may offer, in line with the 2030 Agenda for Sustainable Development (Goal 11.7), universal access to safe, inclusive, and accessible blue–green spaces for all urban residents [8], while delivering economic, environmental, and social value [9,10,11]. However, in order to be repurposed for recreational use, it is necessary to first identify existing environmental and health-related risks [12]. Regions within industrial districts, where intensive extraction of hard coal and sand for mine backfilling was historically conducted [13,14,15], are particularly important for identifying the environmental potential of anthropogenic water bodies. Such activities have led, either directly or indirectly, to the formation of reservoirs that, according to the definition proposed by Stoddard et al. [16], should be managed in a way that enables the attainment of the “best achievable potential” and supports a diversity of functions. For the standardization of restoration practices, Pierzchała et al. [17] proposed an algorithm to support the reclamation of reservoirs formed in subsidence basins through the use of submerged aquatic vegetation. To a lesser extent, biotic indicators have been used to assess the ecological status of natural and artificial water bodies, following European Union and national monitoring principles [18]. The ecological status of reservoirs and the criteria for their use by urban residents are determined by biological parameters, which serve as reliable indicators of disturbances in aquatic habitats [10].
The most important indicators are organism groups that regulate reservoir productivity, namely phytoplankton—identified as a key biological quality element in the EU Water Framework Directive (WFD; 2000/60/EC) [19]—and macrophytes, particularly submerged species [20,21], which serve as indicators of ongoing processes such as eutrophication. Local diversity and abundance of benthic macroinvertebrates are also crucial indicators of ecological disturbances in aquatic ecosystems [22,23], as are ecotoxicological biomarkers and standardised biotests [24,25,26,27]. In addition to biological indicators, the values of physicochemical and hydromorphological parameters, used in environmental monitoring by legal regulations [21], provide essential insights into the extent to which these reservoirs can be utilized as components of blue–green infrastructure by various stakeholder groups.
Therefore, it is important to determine which of these parameters allow for a responsible and informed definition of the scope of activities that can be carried out by urban residents in and around reservoirs formed as a result of multi-phase industrial activity?
The article aimed to identify general and site-specific parameters of anthropogenic water bodies that enable assessment of their potential and scope of use by residents within sustainable urban planning strategies, using the Hubertus IV reservoir as a case study. The following parameters were taken into account for the Hubertus reservoir: the history of the reservoir, its morphometry, heavy metal content in sediments and fish, sediment toxicity based on seed germination and root elongation tests of radish, as well as selected biological elements used in biomonitoring (phytoplankton, macrophytes, macroinvertebrates). Our research is an attempt to develop a framework for water reservoir management. This approach, but using different parameters and tools, has been applied, for example, to dam reservoirs in recent years by Dausa et al. (2021) in Germany and Absalon et al. (2020) in Poland [28,29]. The holistic descriptive and modeling approaches with high implementation barriers require advanced tools and are based on theoretical assumptions. There is still a need to develop an effective, universal, and relatively easy-to-implement management strategy for anthropogenic reservoirs, which is useful in decision-making and takes into account cost optimization of actions, to integrate such reservoirs into the blue–green infrastructure network. This paper proposes such an approach.

2. Materials and Methods

2.1. Study Area

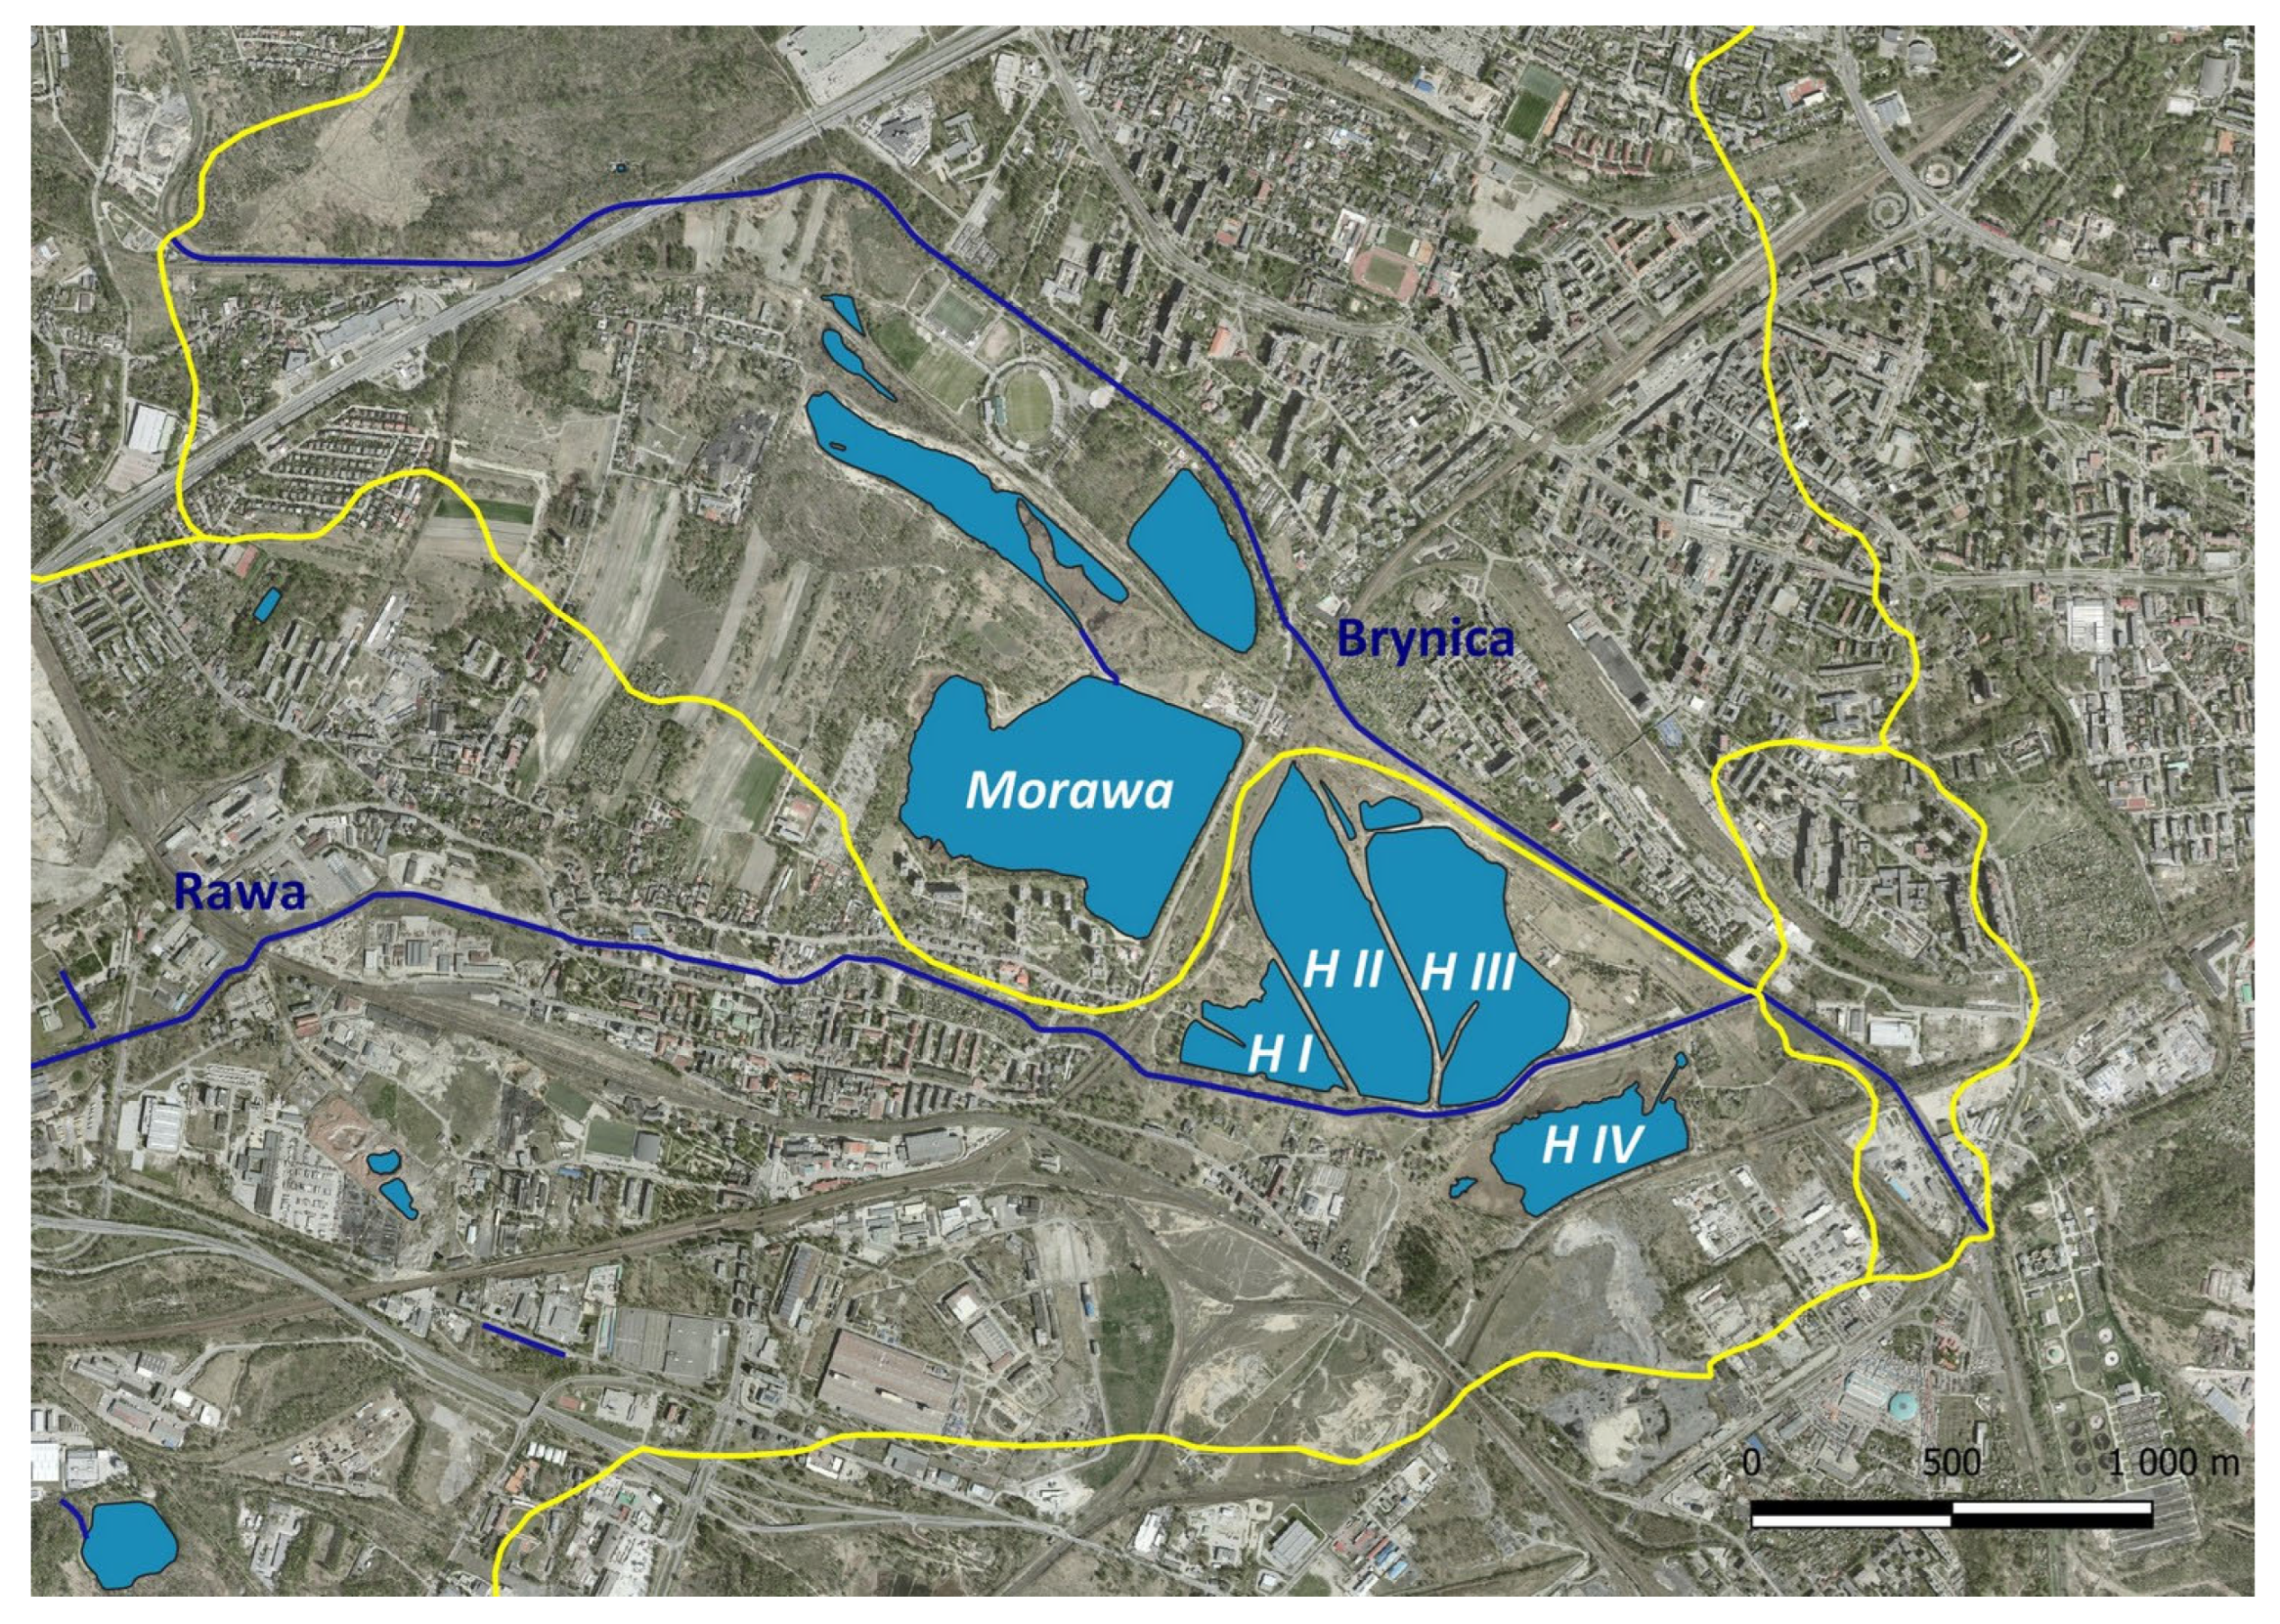
The object of this study was the Hubertus IV reservoir (also recognized as Ewald) [30] in the Silesian Voivodeship, southern Poland (Figure 1). The Hubertus IV reservoir is situated within the catchment area of the Rawa River, near its watershed and its confluence with the Brynica River, a right-bank tributary of the Przemsza River, which in turn is a left-bank tributary of the longest Polish river Vistula (Figure 2). The analysis of data available in the national Internet hydroportal showed that the reservoir basin and adjacent excavation areas constitute a buffer for water in the event of a flood (Figure 1C).
To describe the reservoir’s history and the pressures it has faced, a variety of sources were utilized. These included studies on the reservoir area conducted as part of student research; work commissioned by municipal and regional authorities, including local government units and management of nearby industrial plants; and online resources. Additionally, results from public consultations concerning the area provided valuable guidance, serving as a unique source of unwritten information embedded in the community’s “social memory”.
Study plots (SP) were located in clearings used by anglers, allowing direct access to the reservoir waters (Figure 3). They were selected and characterized based on a local visit and analysis of public orthophotomaps.
SP1 (Lat N 50.26125; Lon E 19.12653) located on the eastern side of the reservoir, where the earthwork slope is 40% (possibility of strong surface runoff). At the water level, the shores are overgrown with a Phragmitetum australis (Gams 1927) Schmale 1939 community, accompanied by Myriophyllum sp., Lemna minor L. This site indicates high eutrophication—locally visible cyanobacterial blooms, mainly Anabaena sp. Three study plots (SP2-SP4) were designated on the southern shore of the reservoir. SP2 (Lat N 50.26037; Lon E 19.12532; high fishing pressure, near the deepest point of the reservoir) and SP3 (Lat N 50.25992; Lon E 19.12348 moderate fishing pressure) have a low shoreline covered by a Phragmitetum australis. SP4 (Lat N 50.25951; Lon E 19.12224) covers a large-area reed bed (Phragmitetum australis). Due to the bird populations in this zone, it is the most valuable for the spontaneous formation of ecosystems.

2.2. Reservoir Depth and Topography of the Reservoir Direct Catchment Area

The numerical model of the reservoir was developed based on data from hydroacoustic measurements obtained using Lowrance Elite Ti2 sets with an active imaging transducer with frequencies 83/200 kHz and 455/800 kHz. The digital terrain model (DTM) of the direct catchment area of the reservoir was obtained from the Polish Central Geodetic and Cartographic Resource and analyzed. The collected sonar data were processed by the kriging method to create a bathymetry map and merged with DTM images to create terrain profiles using the Golden Software Surfer 23.

2.3. Physicochemical Parameters of Water Across the Entire Surface of the Reservoir and at Study Plots

Measurement of oxygen saturation, specific conductivity, chlorophyll-a, and phycocyanin concentrations was carried out using multi-parameter Xylem YSI EXO2 (Yellow Springs, OH, USA) probes equipped with a Global Positioning System (GPS). In total, 47 (about one per 2000 m2) measurements were performed on a grid at a depth of 0.5 m. Geostatistical methods were used to analyze data and create maps of the variability of reservoir parameters using Golden Software Surfer 23. The data were collected on 25 March 2022, from the water surface at the beginning of the growing season. At the peak of the growing season (11 July 2022), measurements were made from the study plots in the coastal zone using the Xylem YSI EXO2 probe for: oxygen concentration and saturation, specific conductivity, total dissolved solids (TDS), and pH.

2.4. Heavy Metals in Sediment and Fish Samples

For Cd, Zn, Pb concentrations measurements, 0.5 g of the air-dried sediment samples, sieved through a 0.2 mm sieve, were mineralized in 5 mL 65% HNO3 (room temperature overnight and then 8 h at 150 °C), filtered, and diluted with deionized water to 25 mL [31,32].
For fish tissue metal concentration, the common rudd (Scardinius erythrophthalmus) and the crucian carp (Carassius carassius) were selected as abundantly present in anthropogenic reservoirs and highly tolerant to multiple stressors interactions [33,34]. Fish of both species feed in the immediate vicinity or in bottom sediments. Ten dead individuals of each species were obtained from anglers at the sediment sample plots. The fish were initially washed with tap water and then rinsed twice with distilled water. The muscles and gills were dissected, dried at 105 °C and acid-digested using a microwave-assisted wet digestion system (ETHOS 1, Milestone Srl, Sorisole, Italy) following the manufacturer’s protocol, using 65% HNO3 and H2O2 in a 4:1 volume ratio.
The levels of the metals in samples from sediments and fish were measured in the filtered extracts after mineralization using inductively coupled plasma-atomic emission spectroscopy (SPECTRO Analytical Instruments GmbH, Kleve, Germany) with analyses conducted in triplicate.

2.5. Pollution Indexes Calculation

To standardize the assessment of pollution levels of the study plots, Contamination Factor (CF) and Permissible Level Factor (CFp) based on Cd, Zn and Pb were calculated as follows, respectively:
CF = Cs/Cb,
where Cs is the mean metal concentration in the sample and Cb is the global background metal level in control or unpolluted sites [35,36,37] and
CFp = Cs/Cp,
where Cp is the permissible metal concentration according to local regulations for category III of land type [38].
Based on CF and CFp values, respective Pollution Load Indexes, PLI and PLIp, were calculated as follows:
Pollution Load Index
PLI = (CF1 × CF2 × … × CFn)1/n;
Pollution Load Index for specific land categories
PLIp = (CFp1 × CFp2 × … × CFpn)

2.6. Seed Germination and Root Elongation Test

The sediment samples were collected at four sampling points. The sediments were dried until a constant dry weight was reached, then crushed and sieved using a 2 mm mesh sieve. Fifty grams of each sample were then saturated with tap water seasoned overnight. The control sample was prepared analogously from commercially available garden soil. The sediment samples were placed in flat plastic containers to enable undisturbed vertical growth of the roots. Ten randomly selected seeds of radish (Raphanus sativus L. var. sativus) were placed in each container and incubated at 25 °C in darkness for 72 h. After that time, the germinated seeds were counted, and the roots were photographed.

2.7. Phytoplankton

The phytoplankton samples were collected at four study plots on 11 July 2022. Ten liters of water were skimmed off from the top layer of the reservoir. The samples were concentrated using a plankton net with a mesh diameter of 10 µm to 100 mL and fixed in a 4% formalin solution. In the laboratory, a qualitative analysis was carried out following the PN-EN 15204:2006 standard [39] to determine the species composition of phytoplankton, using sedimentation for 12 h at room temperature in the Utermöhl chamber.
Phytoplankton biomass in each sample was calculated based on biovolume (cell volume, according to HELCOM) in 10 fields of view. The total biomass was the biovolume of all identified units of phytoplankton expressed in mg L−1. The phytoplankton individuals were identified using an inverted microscope. Phytoplankton taxonomic diversity indices were evaluated using the Shannon–Wiener diversity index.

2.8. Macrophytes (Rushes and Submerged Vegetation)

Macrophyte vegetation research was conducted in July 2022, when optimum vegetation development was achieved according to the methodology of Grulich and Vydrová [40]. The study plots at the reservoir were divided into zones according to their depth: 0–1 m, 1–2 m, and >2 m [38,39]. In each zone, there were two research plots of 1 m2.

2.9. Macroinvertebrates

Benthic macroinvertebrates were collected from four study plots in July 2022. At all plots, sediments were gathered from the nearshore zone at depths of up to 1 m using a hydrobiological frame (frame area of 300 cm2). A single sample was created by combining material from ten frame samples, covering a total collection area of 3000 cm2 of the bottom. In the field, the sediments were pooled in containers and preserved in 80% ethanol. In the laboratory, the samples were sieved through a 500 μm mesh sieve. The macroinvertebrates were separated from the sediment under a dissecting microscope, identified to the lowest possible taxonomic level and then counted and weighed to the nearest 0.001 g.
Macroinvertebrate indicators were based on taxa richness and community composition, using the following measures: density, biomass, diversity (Shannon–Wiener index H’), and dominance expressed as a percentage of each taxon to the total number of macroinvertebrates. The diversity index was calculated using MVSP 3.13.p (Kovach Computing Services).

2.10. Software Used and Statistical Analyses

For GIS analyses (map generation, sections, and spatial measurements), QGIS 3.34 Prizren software was used. Root lengths were measured from the images using ImageJ 1.54 software. Statistical analyses were conducted using TIBCO Software Inc., Palo Alto, CA, USA (2017) STATISTICA 13.3 (data analysis software system). Due to the nature of the data, the first, second (median), and third quartiles were used as descriptive statistics. Non-parametric ANOVA, Kruskal–Wallis H test, and a post hoc analysis (p-value < 0.05) were applied to compare site data.

3. Results

3.1. Information Obtained from Historical Sources

The Hubertus IV was created in a sand excavation site in 1928, exploited since 1901 to backfill the voids left by the extraction of underground coal deposits. Later, it served as a sedimentation basin for water discharged from the KWK Mysłowice coal mine. Due to the high ion content, causing the conductivity of 16,500 µS cm−1 it was referred to as the “Salt Pond”. Following the cessation of coal mining activities, it is solely replenished by rainwater. From 1834 until 2008, the area around Hubertus IV reservoir was strongly impacted by the operations of the Non-Ferrous Smelting Plant “Szopienice” in Katowice. This plant emitted heavy metals, especially Pb, Zn, and Cd causing a strong pollution of the area.

3.2. Bathymetry of the Reservoir and Topography of the Direct Catchment Area

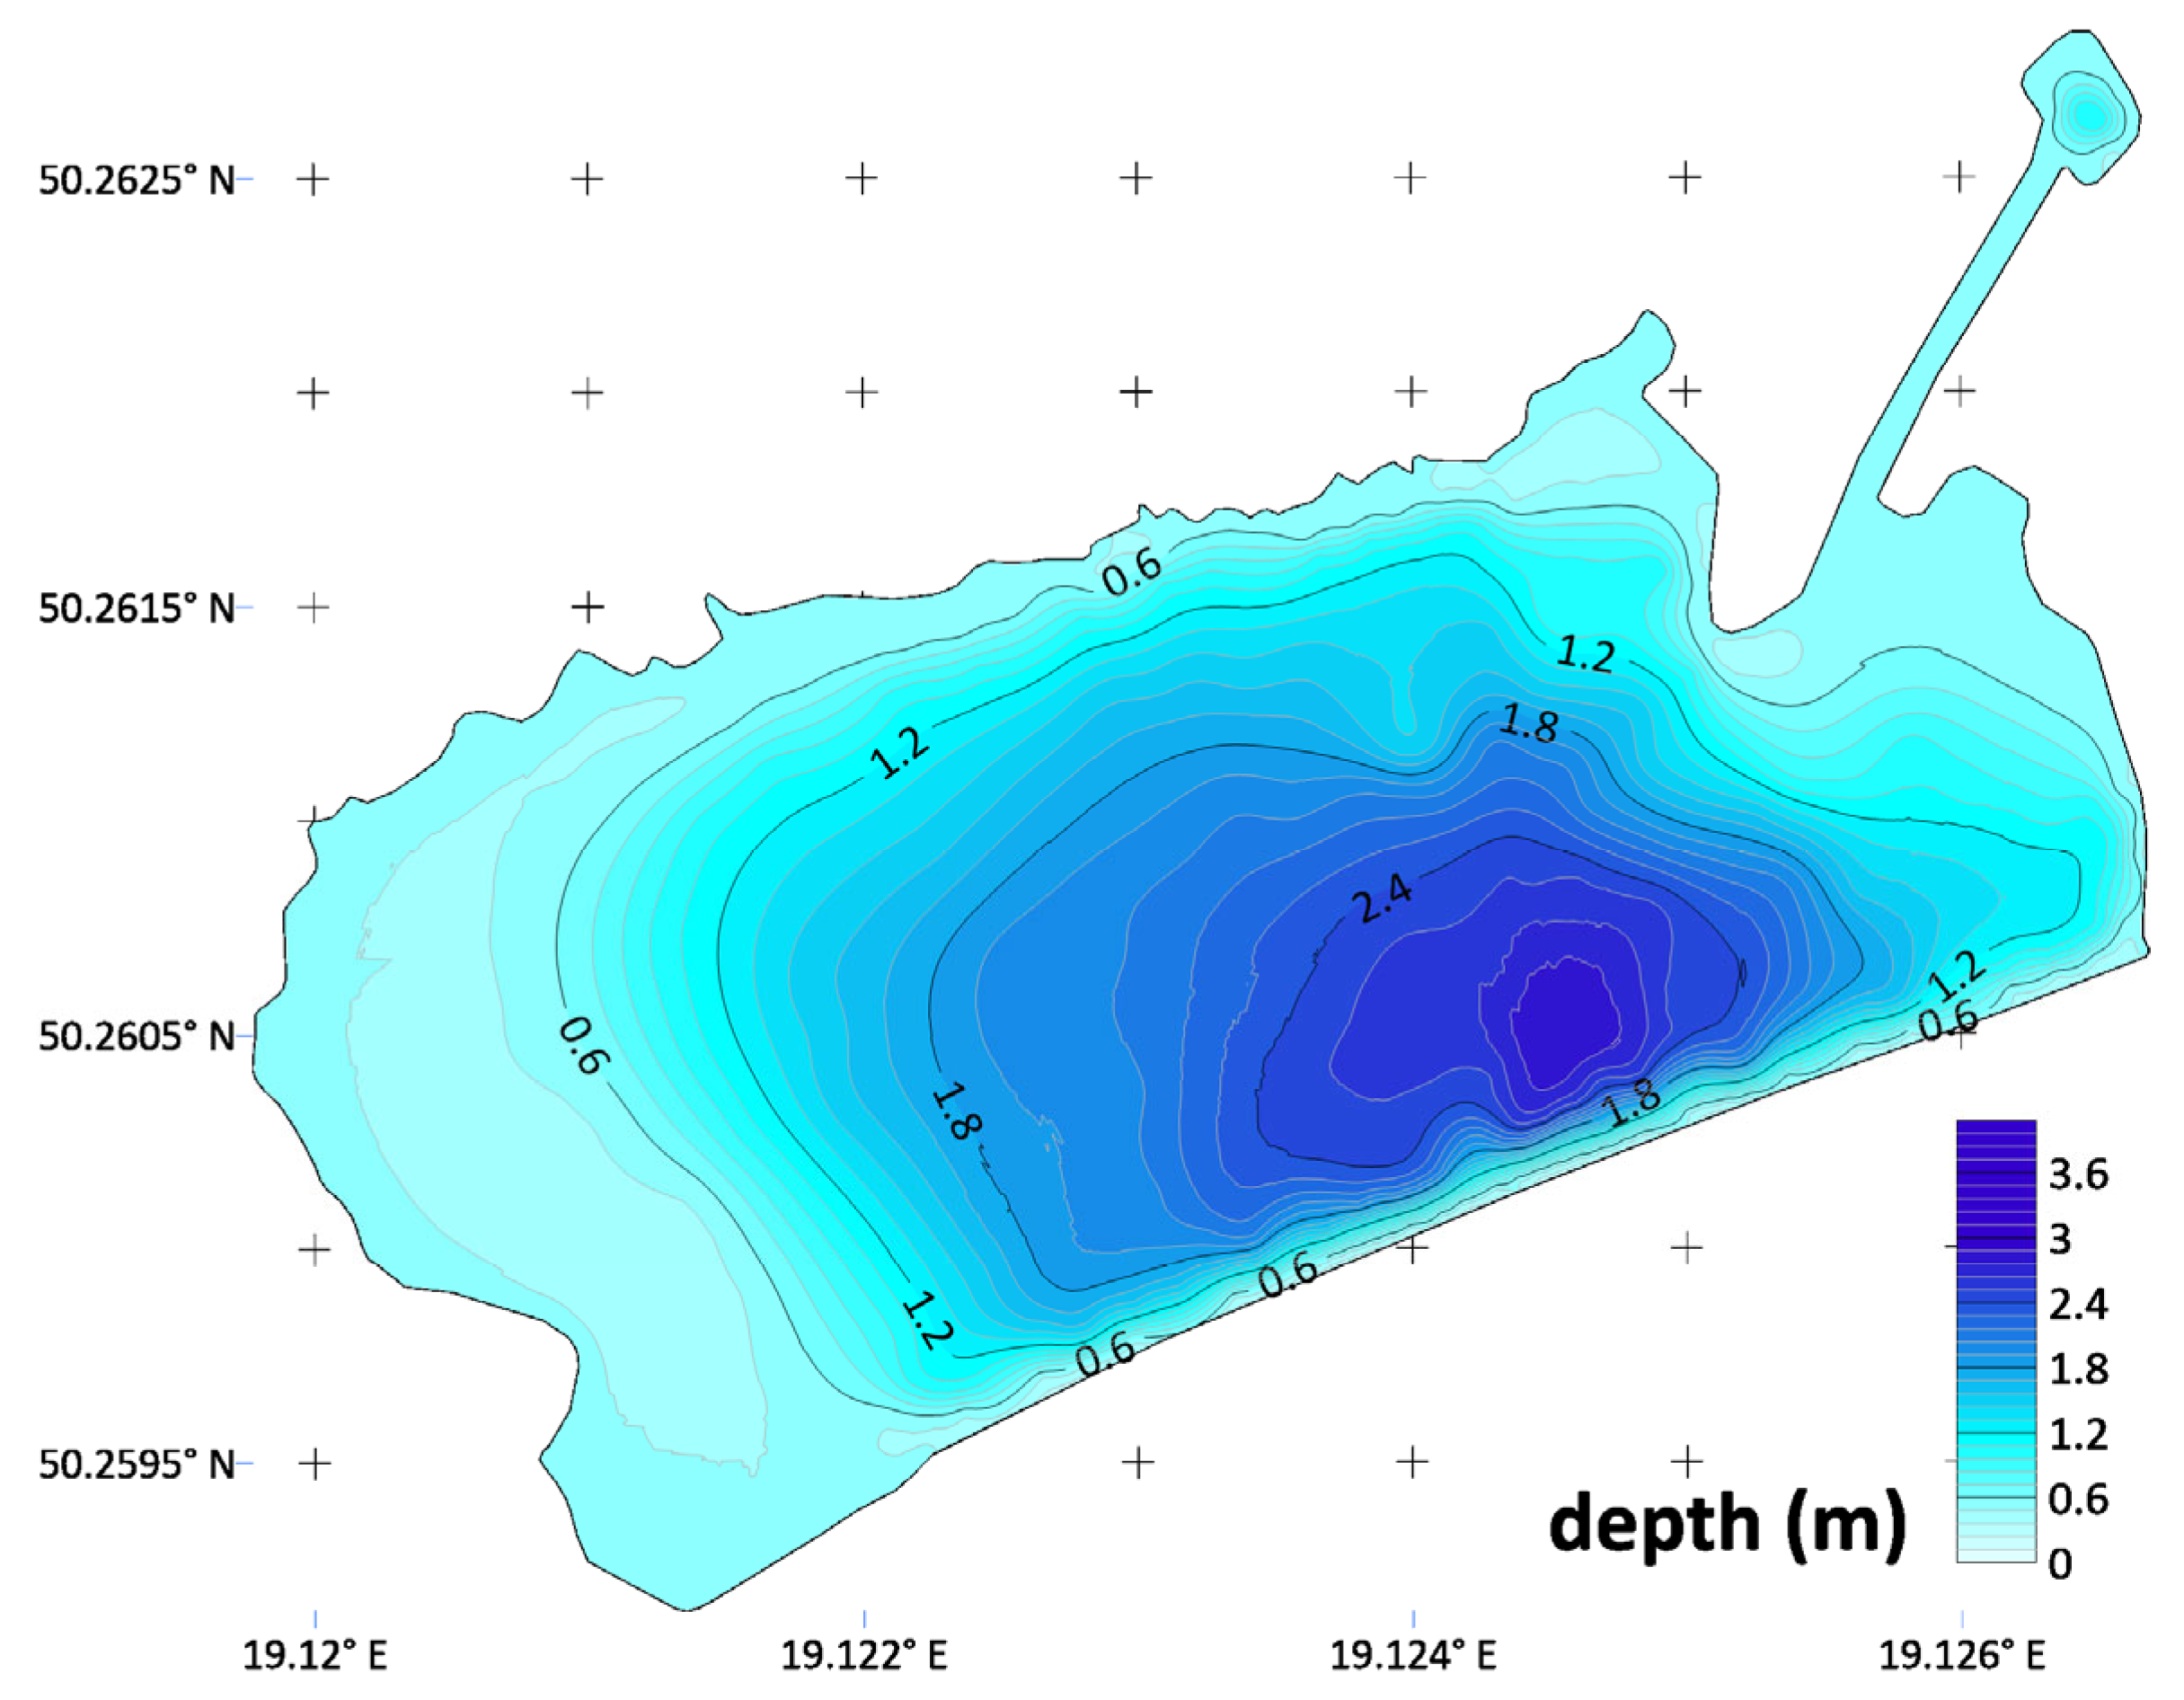
The Hubertus IV reservoir is a shallow water body with a maximum depth of 2.9 m and an average depth of 1.2 m, where over 90% of its area does not exceed a depth of 2 m (Figure 4). The open water area of the reservoir is 8.96 ha, with a capacity of about 103,261 m3. At the edges of the reservoir, particularly on the western and northern sides, the depth does not exceed 0.5 m (Figure 4, compare to Figure 1C—see flood risk zone, the area marked in blue coincides with the wetland area). The deepest area of the reservoir is located near SP2.
The terrain analysis of the reservoir’s direct catchment area, as shown in Figure 5A, indicates a high potential for intense surface runoff during rainfall. The embankments of the railway lines surrounding the reservoir on two sides cause water to flow rapidly into the reservoir (Figure 5B): cross-section “a” shows a railway embankment at a marker distance of 1000 m, while cross-sections “b” and “c” show embankments at marker distances of 540 m and 490 m, respectively. In the latter two cases, the reservoir’s shore is less than 50 m from the embankment.

3.3. Physicochemical Parameters

3.3.1. Specific Conductivity

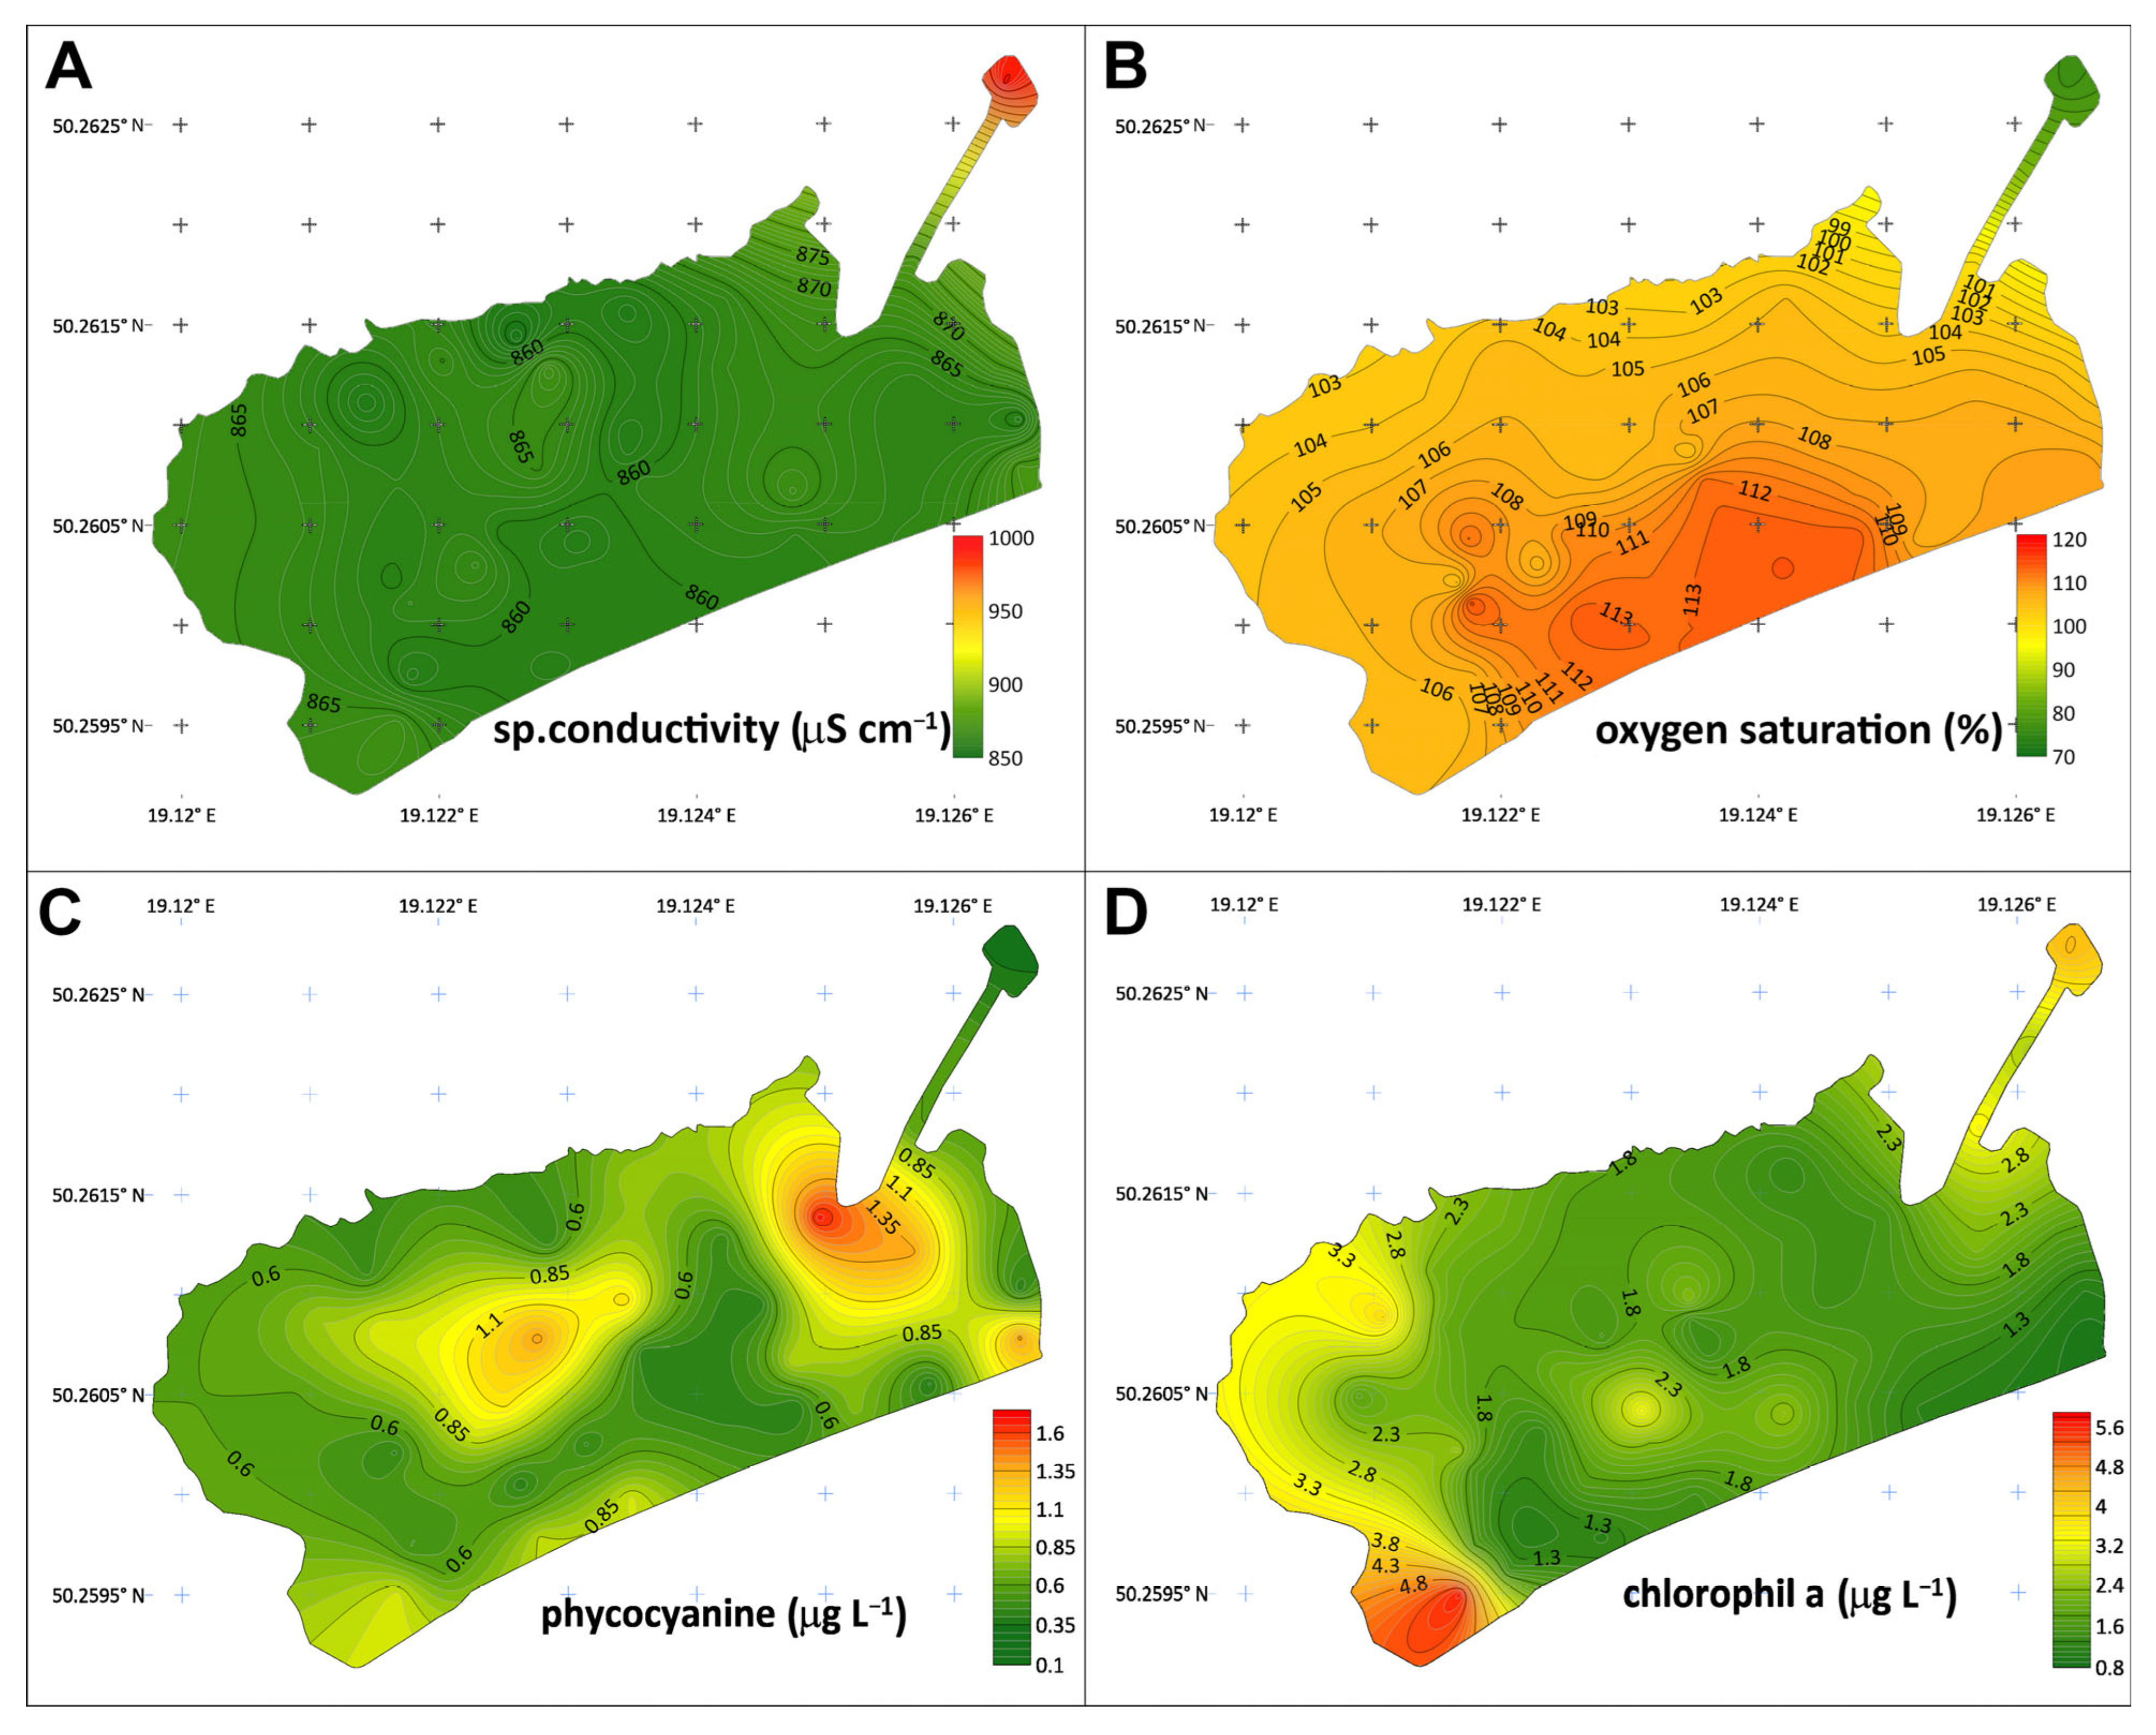
The conductivity of the reservoir waters, measured at the surface, was uniform and ranged between 850–880 µS cm−1. Higher values were recorded in the outflow channel, reaching up to 1000 µS cm−1 (Figure 6A). Values measured at shoreline SPs were similar, lower than those in the reservoir area, ranging from 685–690 µS cm−1 (Table 1).

3.3.2. Total Dissolved Solids (TDS)

TDS constituted an average of 55% of the specific conductivity value, indicating a high proportion of ions in the total dissolved substances. The values for the four study plots were very similar and ranged from 377–380 mg L−1 (Table 1).

3.3.3. Oxygen Saturation

The spatial distribution of obtained values indicated supersaturation in the deeper area of the reservoir, reaching up to 120%, while in the remaining area, it ranged between 100–110%. In the outflow channel, the saturation levels were between 70–90% (Figure 6B). at four study plots, the highest saturation was recorded at SP3 and SP1 (Table 1). The lowest concentration was observed at site SP4.

3.3.4. Phycocyanin

The analysis of the spatial distribution of the phycocyanin values indicates two areas with increased phycocyanin concentrations: in the central part of the reservoir (1.3 µg L−1) and near the reservoir’s outlet (1.7 µg L−1). In other reservoir areas, the values ranged between 0.2 and 0.6 µg L−1 (Figure 6C).

3.3.5. Chlorophyll-a

The analysis of the spatial distribution of chlorophyll-a indicates that the highest values were observed in the southern corner of the reservoir, reaching a maximum of 5.8 µg L−1. High concentrations compared to other parts of the reservoir are maintained on the western shore and in the outflow channel (up to 3.5 µg L−1). In the central part of the reservoir, values range between 0.8 and 2 µg L−1, except for the deeper area where the values are slightly higher (up to 3 µg L−1) (Figure 6D).

3.3.6. pH

pH values at SP1-3 were similar, equal to, respectively, 8, and 7.9. Values close to neutral pH were recorded at SP4 (Table 1).

3.4. Phytoplankton Analysis

A total of 68 species of phytoplankton were identified, including Chlorophyta (34%), Cyanobacteria (16%), Euglenophyta (11%), Dinophyta (15%), and others (7%). The phytoplankton abundance in samples ranged from 7.2 × 10³ to 86.7 × 10³ individuals L−1. Cyanobacteria and Bacillariophyta were not codominant, contributing to more than 20% of total phytoplankton abundance. The highest biomass of phytoplankton was found in SP3 (Table 2). The presence of algae such as Spirogyra sp. and cyanobacteria, e.g., Anabaena sp., is also noticeable.

3.5. Macrophyte Structure

Due to the shallow depth of the reservoir, submerged macrophytes dominate the vegetation across all study plots, forming communities belonging to the Lemnetea (R.Tx. 1955) and Potametea classes (Tx. And Prsg. 1942). The most frequently recorded are Ceratophyllum demersum L. and Myriophyllum spicatum L. as well as Najas marina L., Potamogeton crispus L., P. natans L. and Lemna minor L.
The entire shoreline and areas with moist habitats are covered by monoculture reed beds (reed swamp) Phragmitetum australis, both in water up to about 0.5 m deep and in places where the water level is not visible on the surface. Reed canary grass (Phalaris arundinacea L.) occasionally accompanies the reed beds, especially in areas with low water levels. This type of vegetation covers a significant area of approximately 9 hectares, exceeding the surface area of the reservoir’s open water. The most numerous representatives of macrophytes occurred at SP4 with species indicating eutrophication of the habitat, e.g., Lemna minor L., Ceratophyllum demersum L. The highest Shannon index value was recorded at SP3, while the lowest was observed at SP2 (Table 2).

3.6. Benthic Macroinvertebrates

In total, macroinvertebrates from 20 families and one subclass (Oligochaeta) were identified, with the number of taxa ranging from 7 to 13 at different plots. Macroinvertebrate densities ranged from 525 individuals m−2 (SP4) to 3962 individuals m−2 (SP3). The biomass of the benthic fauna was similar across most plots, except at SP2, where macroinvertebrate biomass was approximately three times higher than at the other plots. The diversity of the benthic fauna, as indicated by the Shannon–Wiener index, varied significantly, with the highest value at SP4 (2.07) and the lowest at SP3 (0.676) (Table 2).
Chironomidae larvae dominated the fauna at all plots, comprising between 41.9% and 83.8% of the total macroinvertebrate population. At site SP1, there was also a high share of mayfly larvae from the family Caenidae and the invasive snail species Potamopyrgus antipodarum (Table 2).

3.7. Germination and Root Elongation Tests

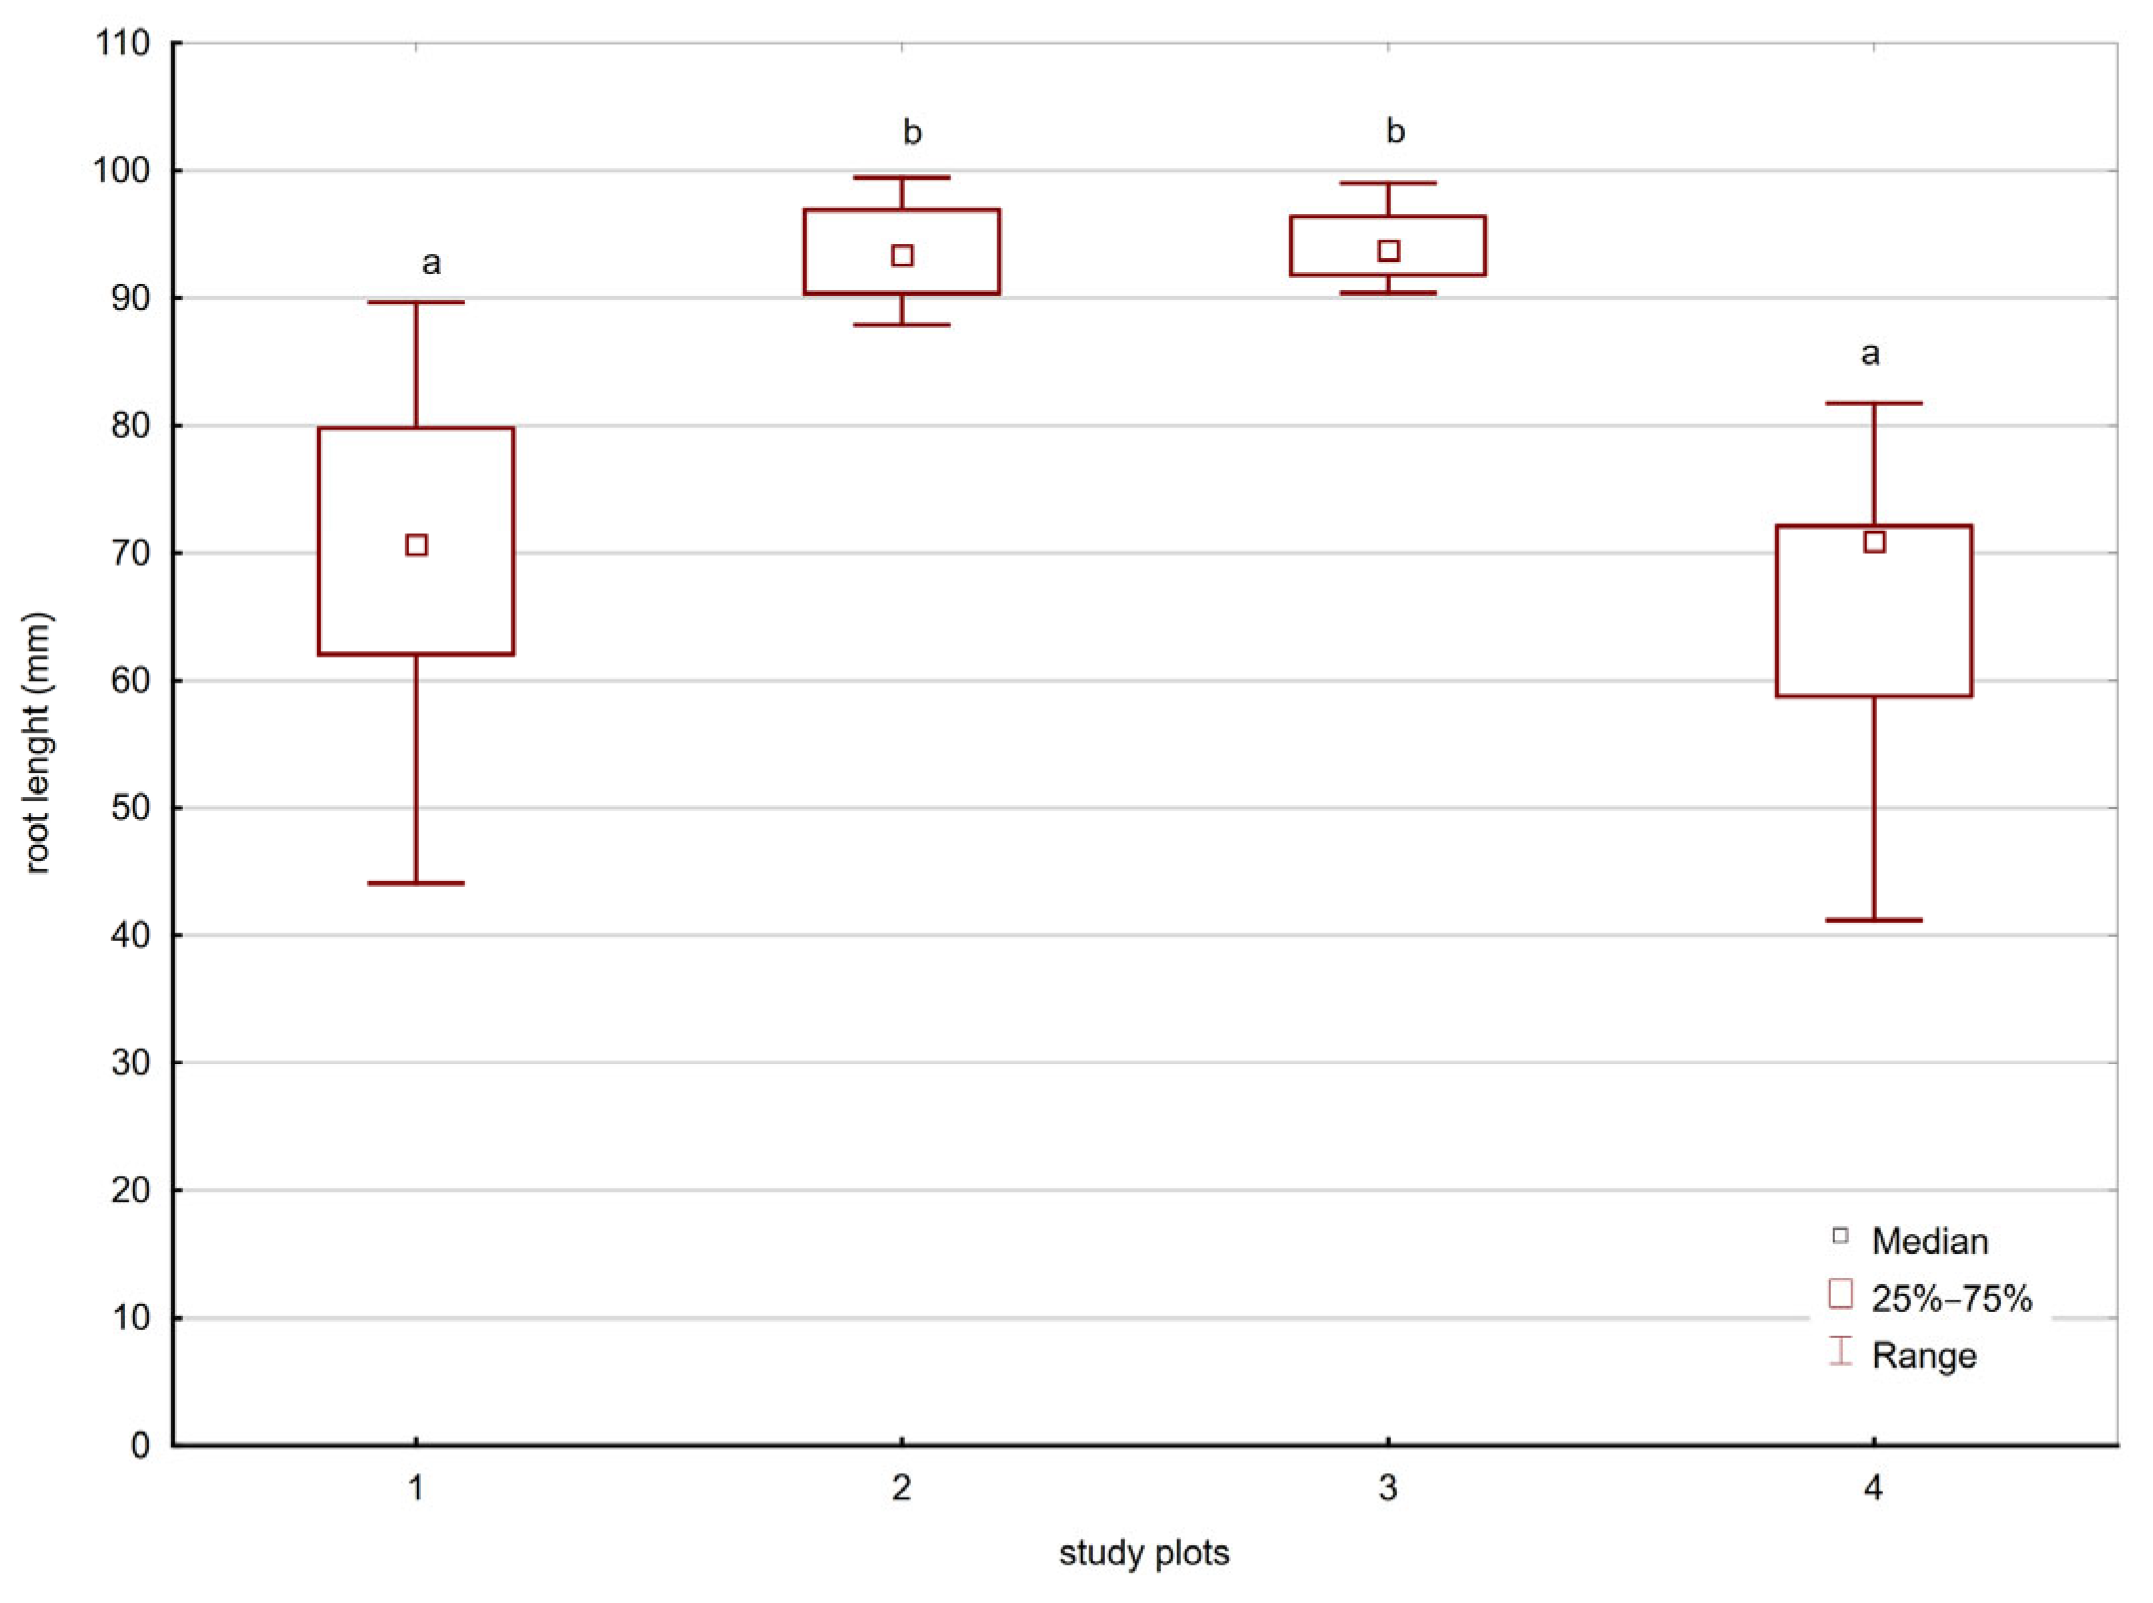
The seeds placed on sediments from all four measurement points showed a 100% germination rate. Median root length values ranged between 77.7–93.7 mm and were pairwise homogenous: SP2 with SP3 and SP1 with SP4. Additionally, roots growing in sediments from SP2 and SP3 were significantly longer than those from SP1 and SP4 (Figure 7).

3.8. Metal Concentration and Pollution Indexes

Cd, Zn, and Pb were detected in the sediments collected from all study plots. For all the metals, the median concentration values in SP1 and SP4 were significantly higher than those measured in SP2 and SP3. The same pattern was found for the indexes calculated based on either global background (CF, PLI) or permissive values for locally specific land categories (CFp, PLIp) (Table 3).

3.9. Metal Concentrations in Fish Tissues

The concentration of zinc in the muscles of S. erythrophthalmus was almost twice as high as in the muscles of C. carassius and median amounted to 51.0 and 25.9 mg kg−1 dry mass, respectively. Also, the concentration of Zn in the gills was higher in S. erythrophthalmus than in C. carassius and median was 487.5 and 189.0 mg kg−1 dry mass, respectively. The Zn concentration in gills was over 9-fold higher than in the muscles in both fish species. The concentrations of Cd and Pb were below the detection threshold for both species and tissues.

4. Discussion

Climate change in the study area is evident, based on data from a meteorological station located 7 km from the reservoir. The average annual air temperature in 1961–2018 was 8.3 °C, 0.5 °C higher than in 1931–1960 and 0.6 °C higher than in 1881–1930 (Institute of Meteorology and Water Management, public data). In this context, maintaining water bodies, even those with limited biodiversity, can be valuable. The following paragraphs analyze the spectrum of methods and indicators used in assessing the ecological status of water reservoirs, used in the decision-making process, with particular emphasis on their potential contribution in blue–green infrastructure, using the Hubertus IV reservoir as an example. The aim of the analysis is to optimize resources and goals that are expected to be obtained in specific urban and infrastructural conditions. This approach does not need to strictly reflect the principles of water monitoring, as the primary goal is to enable an assessment that takes into account the available financial, infrastructural, human, and time resources.

4.1. Historical Information Data

The analysis of the Hubertus IV reservoir’s potential as part of blue–green infrastructure in a post-industrial area began with a historical investigation of the reservoir and the anthropogenic pressures it has faced. The impact was extreme due to the excavation and processing of zinc and lead ores. The severity is highlighted by over a thousand cases of lead poisoning in children in the 1970s in the Szopienice district of Katowice, where Hubertus IV is located. This area had extreme concentrations of lead and zinc [40]. Since then, heavy industry has been phased out, and affected environments have either undergone spontaneous secondary succession or been reclaimed for urban development. In this case, the assessment focused on metal-related potential toxicity and environmental threats. This historical information alone provides such a precise picture of pressures that it is clear what the main problem is and how to direct further research. If research funding are limited, this analysis can categorize the reservoir as contaminated with heavy metals. Conducting a routine set of tests, without knowing the historical background, can lead to an underestimation of this possible risk. For instance, limiting the tests to the assessment of the water and in-shore sediment quality, or flora and fauna surveys would give a misleading impression that the reservoir is suitable for thorough reclamation. However, potential reclamation in reservoirs with a post-mining history, without this knowledge, could trigger an ecological bombshell, in this case related to heavy metals.

4.2. Hydrogeomorphological Information Data

Morphometric parameters allow for assessing water resources, reservoir conditions, and the direction and scale of changes in both the water surface and bottom. The reservoir bottom’s morphology is shaped by the original topography before flooding and by sand exploitation. The gentle slopes on the northwest side promote the development of wetlands and associated vegetation. The lack of water flow leads to the accumulation of chemicals and prolonged water retention.
In the studied reservoir, depth diversity plays a crucial role in shaping thermal and oxygen conditions, directly impacting biological life. Shallower areas heat up and cool down more quickly, favoring the growth of aquatic vegetation and plankton. However, the small, deeper area is thermally unstable and does not support the balanced functioning of the reservoir. Water heating is a common issue in small reservoirs in this area, leading to phytoplankton blooms and periodic oxygen depletion [41]. The reservoir’s shallowness allows wind to mix the water, aerating it but also mobilizing bottom sediment particles, reducing transparency and releasing nutrients and xenobiotics. The combination of shallow depth and large surface area can lead to rapid water level fluctuations, especially during droughts or heavy rainfall. These fluctuations significantly impact the water ecosystem and affect the reservoir’s suitability for recreational and retention purposes.
In summary, the morphology of the post-exploitation reservoir highlights the need for ongoing monitoring of water conditions and quality to ensure sustainable functioning. For reservoirs of importance to the local community or for hydrological reasons, a more detailed analysis of potential hydrological and biological scenarios can be achieved through hydrological and ecosystem in silico modeling. Such models have already been implemented for Upper Silesian Anthropogenic Lake District (USALD) reservoirs [42].

4.3. Water Parameters Data

Water parameters analysis in our study, i.e., pH, dissolved oxygen (DO), electrolytic conductivity (EC), and total dissolved solids (TDS), are important for both aquatic ecosystems and human water use [43].
The water pH, which can result from natural and anthropogenic factors [44], plays a crucial role in determining the chemical properties, affecting the bioavailability and toxicity of various compounds [45,46]. The pH values recorded during our study in the Hubertus IV reservoir at most sites reflect natural processes occurring during the vegetation period (photosynthesis). The exception is the site SP4, where the highest chlorophyll-a concentration was recorded and the pH was the lowest. This suggests the dominance of respiratory processes in organisms containing this pigment, as confirmed by the lowest oxygen concentration in this area. It should be noted that this zone is cut off by reed beds near a shoreline slope, lacks wind exposure, and is shaded, hindering both photosynthesis and water flow. This area of the reservoir is expected to require special attention in the future.
Dissolved oxygen (DO), which is used as an indicator in assessing impacts in urban environments [47], at both low (below 4–5 mg L−1) and high concentrations can threaten the functioning of the biocenosis, e.g., long-term levels above 115–120% saturation can lead to significant mortality of aquatic animals [48]. Conversely, under hypoxic conditions, the rate of uptake of some xenobiotics can increase [49]. Our study showed that in the littoral zone of Hubertus IV reservoir, DO did not fall below 6 mg L−1, suggesting that conditions are not harmful to aquatic organisms with lower oxygen requirements.
The water salinity we studied is another serious threat to biodiversity, ecosystem functioning and freshwater ecosystem services worldwide [50,51]. As EC and TDS values (salinity indices) are correlated [52], only EC is often measured due to the ease of measurement, and because TDS analysis is more complex and costly [53]. During our study, EC values did not exceed 900 µS cm−1, and values up to 1000 µS cm−1 were only recorded in the reservoir outflow channel, indicating that currently in Hubertus IV reservoir, water salinity is not a threat, as it was previously when the reservoir was used as a settling pond for saline mine water.

4.4. Biological Parameters Data

4.4.1. Chlorophyll-a

Chlorophyll-a serves as an indicator of algal presence in water. Algal blooms in freshwater are typically a result of eutrophication, caused by excess nutrients, primarily phosphates and nitrogen. These can come from fertilizers used in agriculture, recreational activities, and household cleaning products containing phosphorus. In the analyzed reservoir, nutrient sources may be linked to surface runoff, which collects continuously supplied nutrients and washed out from wet areas outside the direct excavation zone. The chlorophyll-a values recorded in the reservoir suggest a need for close monitoring of this parameter due to the potential for phytoplankton blooms, especially given how easily the shallow waters can heat up [54].

4.4.2. Phycocyanin

Phycocyanin serves as an indicator of cyanobacteria presence in surface waters. Cyanobacterial blooms are typically triggered by eutrophic conditions resulting from anthropogenic nutrient input, such as sewage or other polluted sources. Cyanobacteria can produce toxic compounds that threaten other organisms. In the analyzed reservoir, phycocyanin concentration was uniform, with only minor differences. This parameter requires vigilance, especially in summer and autumn, with a bloom alert typically issued when concentrations reach around 30 µg L−1 [55].

4.4.3. Macrophytes

The macrophyte species in the Hubertus IV reservoir are typical of anthropogenic water bodies receiving nutrient inputs from the catchment area. The dominance of Phragmites australis indicates upwelling, periodic oxygen deficits, and nutrient inflows. Ceratophyllum demersum L., a free-floating species, absorbs inorganic phosphorus directly from the water, competing with phytoplankton. The presence of Najas marina L., a facultative halophyte, further confirms the high salinity pressure in the reservoir [56].
The extensive occurrence of Phragmites australis (Cav.) Trin. ex Steud. signals ongoing shallowing due to the accumulation of slowly decomposing biomass. Reed beds provide habitat for birds and fish and serve as a buffer against rainwater inflows. The area of the reed bed, along with a part of the water surface and terrain at SP4, is considered the most valuable site for spontaneous ecosystem formation driven by succession processes.

4.4.4. Benthic Macroinvertebrates

The diversity of the benthic fauna, expressed in terms of the number of taxa, was relatively low compared to urban ponds in other parts of the world. Similarly, low diversity of benthic fauna has been observed in both protected [57] and unprotected [58] urban ponds within the USALD region. At all studied plots, the benthic fauna was dominated by the Chironomidae, a group of invertebrates known for their tolerance to environmental pressures. This group is commonly found in abundance in other urban reservoirs [59,60]. Additionally, the highly invasive Potamopyrgus antipodarum was present in the study pond, a species that colonizes various urban water bodies, including anthropogenic ponds in the USALD region [61]. Our findings suggest that, in terms of the benthic macroinvertebrate community, the Hubertus IV reservoir is not markedly different from other urban water bodies [62]. Therefore, it can be concluded that benthic fauna may not be a definitive indicator of environmental conditions in this context.

4.5. Toxicity Data

4.5.1. Metals in Sediments

The concentrations of Zn, Pb, and Cd in the sediments are high enough to classify them in European Union as dredging spoil containing hazardous substances [63]. According to Polish legislation [64], waste disposed of in landfills for hazardous substances must not exceed concentration limits of 50, 10, and 1 mg kg−1 dry weight for Zn, Pb, and Cd, respectively. Given this, it is advisable to retain the reservoir as part of blue–green infrastructure without disturbing the sediments.

4.5.2. Pollution Indexes

While the Pollution Load Index (PLI) is a standard tool useful for general comparisons of polluted soils, the Pollution Load Index for specific land categories (PLIp) can be more appropriate in areas where certain metals are naturally present. Thus, we decided to compare the measured metal concentrations to the permissible levels established for areas of unmanaged greenery, not classified as forests or wooded and shrubby land, and for ecological land, which is defined as ecosystem fragments important for biodiversity conservation. This comparison is based on the Ordinance of the Polish Minister of Environment [39], concerning the assessment of pollution of the earth’s surface in Poland.

4.5.3. Root Elongation

Germination and root elongation tests are simple, cost-effective, and reliable methods for assessing the toxicity of media such as soil, sediment, or water to plants and for analyzing the quality of anthropogenically altered, or degraded environments to determine their potential for restoration, as well as for assessing the effectiveness of remediation of polluted sites [65]. In this study, the test indicated the risk of eutrophication and determined the area of the reservoir that can be the weakest link from this point of view.

4.6. Decision Support Overview for Post-Industrial Reservoirs Analysis

It must be stressed that a polluted pond still has the potential to retain water and mitigate heat effects. However, potential pollutants may justify failure of reclamation actions. The presented analysis examines various methods, tests, and tools that provide numerous indicators that must be the starting point for actions related to identifying the purpose and future of post-industrial reservoirs and support decision-making. Reclamation efforts may not meet expectations, may not be necessary, or may not be efficient. An efficient reclamation depends on multiple factors, including the range of work necessary to be performed and their costs, and ecological consequences of these actions. For example, if sediments cover the bottom, their excess may be removed. However, if these sediments accumulate pollutants, such as heavy metals, intervention may re-mobilize contaminants, disturbing the ecological balance that has developed alongside the pond. Therefore, the costs and risks of reclamation may be reduced or even entirely avoided if adequate preliminary analysis is conducted.
Table 4 presents groups of data along with methods of obtaining them, useful in anthropogenic landscape management. The methods are presented in such a way as to indicate their disadvantages, advantages and resources necessary for their application. The study conducted on the Hubertus IV reservoir demonstrates the specific relevance—or limited applicability—of certain routinely employed monitoring methods. Based on this list, it is possible to optimize the decision-making process concerning the maintenance or reclamation of an anthropogenic reservoir, e.g., for recreational purposes. As the first data group set—historical and documentation-based data were indicated, because in the most favorable variant they may be sufficient for the first, resource-saving screening decision regarding a reservoir being part of the anthropogenic lake district. Taking into account historical analyses, the sample reservoir was subjected to pressure related to heavy metals. Therefore, we included data groups related to toxicology. However, if historical analyses indicate other specific pressures, then they should be included in the analyses, abandoning those that are not adequate according to historical realities (the lower part of Table 4).

5. Conclusions

Analyses of historical documents are recommended as the first step for decision-making. This step enables taking up optimized actions, based on the analysis of available resources thanks to the knowledge of the advantages, disadvantages, and informativeness of the data. In the analyzed example, historical analyses are recommended to be completed with bathymetric parameters.
In the case of Hubertus IV, the analysis revealed that salinity, metal pollution, and eutrophication are the weakest links of the reservoir. They are consistent with the history of the reservoir. However, macroinvertebrates proved to be an inconclusive indicator, despite their common use in monitoring the ecological state of surface waters. Therefore, it is not necessary to consider this indicator in similar situations at the initial recognition stage. In the case of other reservoirs, it may be necessary to conduct additional specific measurements due to the land use history or the presence of neighboring objects (e.g., old waste dumps, arable fields).
The analysis indicates that an alternative approach, such as the one presented here, enables preliminary screening by selecting appropriate and historically relevant parameters. It can also be applied to other anthropogenic reservoirs. Using only selected parameters shortens the decision-making process and simplifies the process by reducing costs and resource requirements, and allows for the inclusion of key analyses relevant to environmental risk. However, it is important to recognize that incomplete historical documentation may limit this approach, as it may not capture all relevant pressures and may also draw attention to pressures with negligible impact. Consulting “social memory” enables access to insights that might be absent from formal records, thereby enriching the assessment process.

Author Contributions

Conceptualization, M.K., B.Ł., E.S. and A.B.; methodology, M.K., B.Ł., E.S., A.N.-S., A.W., B.F. and A.B.; software, B.Ł. and A.W.; validation, M.K., B.Ł., E.S. and A.B.; formal analysis, M.K., B.Ł., E.S. and A.B.; investigation, M.K., B.Ł., E.S. and A.B.; resources, B.Ł. and A.W.; data curation, M.K., B.Ł., E.S., A.N.-S., A.W., B.F. and A.B.; writing—original draft preparation, M.K., B.Ł., E.S. and A.B.; writing—review and editing, M.K., B.Ł. and A.B.; visualization, M.K., B.Ł., E.S., A.W. and A.B.; supervision, M.K., B.Ł. and A.B.; project administration, B.Ł., A.N.-S. and A.W.; funding acquisition, A.N.-S. and A.W. All authors have read and agreed to the published version of the manuscript.

Funding

This research received no external funding.

Data Availability Statement

The raw data supporting the conclusions of this article will be made available by the corresponding authors on request.

Acknowledgments

The research activities were co-financed by the funds granted under the Research Excellence Initiative 2021–2023 of the University of Silesia in Katowice.

Conflicts of Interest

The authors declare no conflicts of interest.

References

  1. United Nations Department of Economic and Social Affairs, Population Division. World Urbanization Prospects: The 2018 Revision; United Nations: New York, NY, USA, 2018. [Google Scholar]
  2. Mohajerani, A.; Bakaric, J.; Jeffrey-Bailey, T. The urban heat island effect, its causes, and mitigation, with reference to the thermal properties of asphalt concrete. J. Environ. Manag. 2017, 197, 522–538. [Google Scholar] [CrossRef] [PubMed]
  3. Stone, B.; Hess, J.J.; Frumkin, H. Urban form and extreme heat events: Are sprawling cities more vulnerable to climate change than compact cities? Environ. Health Perspect. 2010, 118, 1425–1428. [Google Scholar] [CrossRef] [PubMed]
  4. Sierka, E.; Pierzchała, Ł. Role of reservoirs of urban heat island effect mitigation in human settlements: Moderate climate zone. J. Water Land Dev. 2022, 2022, 112–118. [Google Scholar] [CrossRef]
  5. Sun, Q.H.; Horton, R.M.; Bader, A.D.; Jones, B.; Zhou, L.; Li, T.T. Projections of temperature-related non-accidental mortality in Nanjing, China. Biomed. Environ. Sci. 2019, 32, 134–139. [Google Scholar] [CrossRef]
  6. Rzętała, M.; Jaguś, A. New lake district in Europe: Origin and hydrochemical characteristics. Water Environ. J. 2012, 26, 108–117. [Google Scholar] [CrossRef]
  7. Kuś, S.; Sierka, E.; Jelonek, I.; Jelonek, Z. Synthetic analysis of thematic studies towards determining the recreational potential of anthropogenic reservoirs. Environ. Ecol. Res. 2022, 10, 355–369. [Google Scholar] [CrossRef]
  8. Biela, M.; Sierka, E. Using plants of novel ecosystems as resources to create green roofs in cities’ adaptation to the climate change process. Stud. Ecol. Bioethicae 2023, 21, 53–61. [Google Scholar] [CrossRef]
  9. Costanza, R.; Perrings, C.; Cleveland, C.J. The Development of Ecological Economics; Edward Elgar Publishing Company: Cheltenham, UK, 1997. [Google Scholar]
  10. Sierka, E.; Stalmachová, B.; Molenda, T.; Chmura, D.; Pierzchała, Ł. Environmental and Socio-Economic Importance of Mining Subsidance Reservoirs; Praha Technical Literature BEN: Prague, Czech Republic, 2012. [Google Scholar]
  11. Woźniak, G.; Sieka, E.; Wheeler, A. Urban and Industrial Habitats: How Important They Are for Ecosystem Services; Hufnagel, L., Ed.; Ecosystem Services and Global Ecology; IntechOpen: London, UK, 2018; pp. 169–194. [Google Scholar] [CrossRef]
  12. Pierzchała, Ł. Assessment of the possibility of using remote sensing methods for measuring eutrophication of inland water reservoirs. Inż. Ekol. 2020, 21, 27–32. [Google Scholar] [CrossRef]
  13. Klusáček, P.; Alexandrescu, F.; Osman, R.; Malý, J.; Kunc, J.; Dvořák, P.; Frantál, B.; Havlíček, M.; Krejčí, T.; Martinát, S.; et al. Good governance as a strategic choice in brownfield regeneration: Regional dynamics from the Czech Republic. Land Use Policy 2018, 73, 29–39. [Google Scholar] [CrossRef]
  14. Siikamäki, J.; Wernstedt, K. Turning brownfields into greenspaces: Examining incentives and barriers to revitalization. J. Health Politics Policy Law 2008, 33, 559–593. [Google Scholar] [CrossRef]
  15. Dulias, R. Landscape planning in areas of sand extraction in the Silesian Upland, Poland. Landsc. Urban Plan. 2010, 95, 91–104. [Google Scholar] [CrossRef]
  16. Stoddard, J.L.; Larsen, D.P.; Hawkins, C.P.; Johnson, R.K.; Norris, R.H. Setting expectations for the ecological condition of streams: The concept of reference condition. Ecol. Appl. 2006, 16, 1267–1276. [Google Scholar] [CrossRef] [PubMed]
  17. Pierzchała, Ł.; Sierka, E.; Trząski, L.; Bondaruk, J.; Czuber, B. Evaluation of the suitability of anthropogenic reservoirs in urban space for ecological restoration using submerged plants (Upper Silesia, Poland). Appl. Ecol. Environ. Res. 2016, 14, 277–296. [Google Scholar] [CrossRef]
  18. Ciecierska, H.; Kolada, A. ESMI: A macrophyte index for assessing the ecological status of lakes. Environ. Monit. Assess. 2014, 186, 5501–5517. [Google Scholar] [CrossRef]
  19. European Commission. Directive of the European Parliament and of the Council 2000/60/EC. Establishing a Framework for Community Action in the Field of Water Policy. Off. J. Eur. Parliam. 2000, L327. [Google Scholar]
  20. Barko, J.W.; Adams, M.S.; Clesceri, N.L. Management of submersed aquatic vegetation. J. Aquat. Plant Manag. 1986, 24, 1–10. [Google Scholar]
  21. Van Geest, G.J. Macrophyte Succession in Floodplain Lakes: Spatio-Temporal Patterns in Relation to Hydrology, Lake Morphology and Management; Wageningen University and Research: Wageningen, The Netherlands, 2005. [Google Scholar]
  22. Sumudumali, R.G.I.; Jayawardana, J.M.C.K. A review of biological monitoring of aquatic ecosystems approaches: With special reference to macroinvertebrates and pesticide pollution. Environ. Manag. 2021, 67, 263–276. [Google Scholar] [CrossRef]
  23. Tachet, H.; Richoux, P.; Bournaud, M.; Usseglio-Polatera, P. Invertébrés D’eau Douce: Systématique, Biologie, Écologie; CNRS Editions: Paris, France, 2010. [Google Scholar]
  24. Remon, E.; Bouchardon, J.-L.; Le Guédard, M.; Bessoule, J.-J.; Conord, C.; Faure, O. Are plants useful as accumulation indicators of metal bioavailability? Environ. Pollut. 2013, 175, 1–7. [Google Scholar] [CrossRef]
  25. Hook, S.E.; Gallagher, E.P.; Batley, G.E. The role of biomarkers in the assessment of aquatic ecosystem health. Integr. Environ. Assess. Manag. 2014, 10, 327–341. [Google Scholar] [CrossRef]
  26. Palma, P.; Ledo, L.; Alvarenga, P. Ecotoxicological endpoints: Are they useful tools to support ecological status assessment in strongly modified water bodies? Sci. Total Environ. 2016, 541, 119–129. [Google Scholar] [CrossRef]
  27. Łaszczyca, P.; Nakonieczny, M.; Kostecki, M. Ecotoxicological biotests as tools for continuous monitoring of water quality in dam reservoir. Arch. Environ. Prot. 2023, 49, 25–38. [Google Scholar] [CrossRef]
  28. Daus, M.; Koberger, K.; Koca, K.; Beckers, F.; Fernández, J.E.; Weisbrod, B.; Dietrich, D.; Gerbersdorf, S.U.; Glaser, R.; Haun, S.; et al. Interdisciplinary Reservoir Management—A Tool for Sustainable Water Resources Management. Sustainability 2021, 13, 4498. [Google Scholar] [CrossRef]
  29. Absalon, D.; Matysik, M.; Woźnica, A.; Łozowski, B.; Jarosz, W.; Ulańczyk, R.; Babczyńska, A.; Pasierbiński, A. Multi-Faceted Environmental Analysis to Improve the Quality of Anthropogenic Water Reservoirs (Paprocany Reservoir Case Study). Sensors 2020, 20, 2626. [Google Scholar] [CrossRef] [PubMed]
  30. Machowski, R.; Rzetala, M.A.; Rzetala, M.; Solarski, M. Anthropogenic enrichment of the chemical composition of bottom sediments of water bodies in the neighborhood of a non-ferrous metal smelter (Silesian Upland, Southern Poland). Sci. Rep. 2019, 9, 51027. [Google Scholar] [CrossRef]
  31. Zheljazkov, V.D.; Jeliazkova, E.A.; Kovacheva, N.; Dzhurmanski, A. Metal uptake by medicinal plant species grown in soils contaminated by a smelter. Environ. Exp. Bot. 2008, 64, 207–216. [Google Scholar] [CrossRef]
  32. Wójcik, M.; Sugier, P.; Siebielec, G. Metal accumulation strategies in plants spontaneously inhabiting Zn-Pb waste deposits. Sci. Total Environ. 2014, 487, 313–322. [Google Scholar] [CrossRef]
  33. Prychepa, M.; Hrynevych, N.; Martseniuk, V.; Potrokhov, O.; Vodianitskyi, O.; Khomiak, O.; Rud, O.; Kytsokon, L.; Sliusarenko, A.; Dunaievska, O.; et al. Rudd (Scardinius erythrophthalmus L., 1758) as a bioindicator of anthropogenic pollution in freshwater bodies. Ukr. J. Ecol. 2021, 11, 253–260. [Google Scholar]
  34. Sula, E.; Aliko, V.; Barceló, D.; Faggio, C. Combined effects of moderate hypoxia, pesticides and PCBs upon crucian carp fish (Carassius carassius) from a freshwater lake: An in situ ecophysiological approach. Aquat. Toxicol. 2020, 228, 105644. [Google Scholar] [CrossRef]
  35. Ballabio, C.; Jones, A.; Panagos, P. Cadmium in topsoils of the European Union—An analysis based on LUCAS topsoil database. Sci. Total Environ. 2023, 912, 168710. [Google Scholar] [CrossRef]
  36. Noulas, C.; Tziouvalekas, M.; Karyotis, T. Zinc in soils, water, and food crops. J. Trace Elem. Med. Biol. 2018, 49, 252–260. [Google Scholar] [CrossRef]
  37. Oorts, K.; Smolders, E.; Lanno, R.; Chowdhury, M.J. Bioavailability and ecotoxicity of lead in soil: Implications for setting ecological soil quality standards. Environ. Toxicol. Chem. 2021, 40, 1950–1963. [Google Scholar] [CrossRef]
  38. Journal of Laws of the Republic of Poland. Dz.U. 2016 poz. 1395. 2016. Available online: https://isap.sejm.gov.pl/isap.nsf/DocDetails.xsp?id=wdu20160001395 (accessed on 2 April 2025).
  39. PN EN 15204: 2006; Water Quality-Guidance Standard on the Enumeration of Phytoplankton Using Inverted Microscopy (UTERMHL TECHNIQUE). Polish Committee for Standardization: Warsaw, Poland, 2013.
  40. Grulich, V.; Vydrová, A. Metodika Odběru a Zpracování Vzorku Makrofyt Stojatých Vod; Masaryk Water Research Institute: Prague, Czech Republic, 2006. [Google Scholar]
  41. Schaumburg, J.; Schranz, C.; Hofmann, G.; Stelzer, D.; Schneider, S.; Schmedtje, U. Macrophytes and phytobenthos as indicators of ecological status in German lakes—A contribution to the implementation of the Water Framework Directive. Limnologica 2004, 34, 302–314. [Google Scholar] [CrossRef]
  42. Godzik, S.; Kubiesa, P.; Staszewski, T.; Szdzuj, J. Ecological problems of the Katowice administrative district. In Biomarkers: A Pragmatic Basis for Remediation of Severe Pollution in Eastern Europe; Springer: Dordrecht, The Netherlands, 1999; pp. 49–73. [Google Scholar] [CrossRef]
  43. Rzętała, M. Anthropogenic Water Reservoirs in Poland. In Springer Water; Springer: Cham, Switzerland, 2021; pp. 59–89. [Google Scholar] [CrossRef]
  44. Ulańczyk, R.; Łozowski, B.; Woźnica, A.; Absalon, D.; Kolada, A. Water Quality and Ecosystem Modelling: Practical Application on Lakes and Reservoirs. In Springer Water; Springer: Cham, Switzerland, 2021; pp. 173–189. [Google Scholar] [CrossRef]
  45. Reid, A.J.; Carlson, A.K.; Creed, I.F.; Eliason, E.J.; Gell, P.A.; Johnson, P.T.J.; Kidd, K.A.; MacCormack, T.J.; Olden, J.D.; Ormerod, S.J.; et al. Emerging threats and persistent conservation challenges for freshwater biodiversity. Biol. Rev. 2019, 94, 849–873. [Google Scholar] [CrossRef] [PubMed]
  46. Feng, Z.; Su, B.; Xiao, D.-D.; Ye, L.-Y. Study on pH value and its variation characteristics of the main rivers into Dianchi lake under the anthropogenic and natural processes, Yunnan, China. J. Inf. Optim. Sci. 2017, 38, 1197–1210. [Google Scholar] [CrossRef]
  47. Dewangan, S.K.; Toppo, D.N.; Kujur, A. Investigating the impact of pH levels on water quality: An experimental approach. Int. J. Res. Appl. Sci. Eng. Technol. 2023, 11, 756–759. [Google Scholar] [CrossRef]
  48. Pinheiro, J.P.S.; Windsor, F.M.; Wilson, R.W.; Tyler, C.R. Global variation in freshwater physico-chemistry and its influence on chemical toxicity in aquatic wildlife. Biol. Rev. 2021, 96, 1528–1546. [Google Scholar] [CrossRef]
  49. Kannel, P.R.; Lee, S.; Lee, Y.S.; Kanel, S.R.; Khan, S.P. Application of water quality indices and dissolved oxygen as indicators for river water classification and urban impact assessment. Environ. Monit. Assess. 2007, 132, 93–110. [Google Scholar] [CrossRef]
  50. Geist, D.R.; Linley, T.J.; Cullinan, V.; Deng, Z. The effects of total dissolved gas on chum salmon fry survival, growth, gas bubble disease, and seawater tolerance. N. Am. J. Fish. Manag. 2013, 33, 200–215. [Google Scholar] [CrossRef]
  51. Schiedek, D.; Sundelin, B.; Readman, J.W.; Macdonald, R.W. Interactions between climate change and contaminants. Mar. Pollut. Bull. 2007, 54, 1845–1856. [Google Scholar] [CrossRef]
  52. Iglesias, M.C.A. A review of recent advances and future challenges in freshwater salinization. Limnetica 2020, 39, 185–211. [Google Scholar] [CrossRef]
  53. Cunillera-Montcusí, D.; Beklioğlu, M.; Cañedo-Argüelles, M.; Jeppesen, E.; Ptacnik, R.; Amorim, C.A.; Arnott, S.E.; Berger, S.A.; Brucet, S.; Dugan, H.A.; et al. Freshwater salinisation: A research agenda for a saltier world. Trends Ecol. Evol. 2022, 37, 440–453. [Google Scholar] [CrossRef]
  54. World Health Organization. Guidelines on Recreational Water Quality: Coastal and Fresh Waters; World Health Organization: Geneva, Switzerland, 2021; Volume 1.
  55. Ahn, C.Y.; Joung, S.H.; Yoon, S.K.; Oh, H.M. Alternative alert system for cyanobacterial bloom, using phycocyanin as a level determinant. J. Microbiol. 2007, 45, 98–104. [Google Scholar] [PubMed]
  56. Sierka, E.; Bujok, M.; Stalmachova, B.; Horaczek, T. Fluorescence parameters of chlorophyll a halophytes as a response to salinity of post-mining subsidence reservoirs. J. Water Land Dev. 2022, 2022, 164–170. [Google Scholar] [CrossRef]
  57. Cieplok, A.; Krodkiewska, M.; Franiel, I.; Starzak, R.; Sowa, M.; Spyra, A. The role of habitat protection in maintaining the diversity of aquatic fauna in rural and industrial areas. Water 2022, 14, 3983. [Google Scholar] [CrossRef]
  58. Krodkiewska, M.; Strzelec, M.; Spyra, A.; Lewin, I. The impact of environmental factors on benthos communities and freshwater gastropod diversity in urban sinkhole ponds in roadside and forest contexts. Landsc. Res. 2019, 44, 477–492. [Google Scholar] [CrossRef]
  59. Mackintosh, T.J.; Davis, J.A.; Thompson, R.M. The influence of urbanisation on macroinvertebrate biodiversity in constructed stormwater wetlands. Sci. Total Environ. 2015, 536, 527–537. [Google Scholar] [CrossRef]
  60. Hill, M.J.; Biggs, J.; Thornhill, I.; Briers, R.A.; Gledhill, D.G.; White, J.C.; Wood, P.J.; Hassall, C. Urban ponds as an aquatic biodiversity resource in modified landscapes. Glob. Change Biol. 2017, 23, 986–999. [Google Scholar] [CrossRef]
  61. Cieplok, A.; Spyra, A.; Czerniawski, R. Globally invasive Potamopyrgus antipodarum (Gray, 1843)—An indicator of the degraded water systems in relation to native aquatic invertebrates. Ecol. Indic. 2023, 156, 111194. [Google Scholar] [CrossRef]
  62. Hill, M.J.; Ryves, D.B.; White, J.C.; Wood, P.J. Macroinvertebrate diversity in urban and rural ponds: Implications for freshwater biodiversity conservation. Biol. Conserv. 2016, 201, 50–59. [Google Scholar] [CrossRef]
  63. European Council. Consolidated Text: Commission Decision of 3 May 2000 Replacing Decision 94/3/EC Establishing a List of Wastes Pursuant to Article 1(a) of Council Directive 75/442/EEC on Waste and Council Decision 94/904/EC Establishing a List of Hazardous Waste. 2003. Available online: https://eur-lex.europa.eu/legal-content/EN/TXT/?uri=CELEX:02000D0532-20231206 (accessed on 2 April 2025).
  64. Journal of Laws of the Republic of Poland. Dz.U. 2015 poz. 1277. 2015. Available online: https://isap.sejm.gov.pl/isap.nsf/DocDetails.xsp?id=WDU20150001277 (accessed on 2 April 2025).
  65. Baud-Grasset, F.; Baud-Grasset, S.; Safferman, S.I. Evaluation of the bioremediation of a contaminated soil with phytotoxicity tests. Chemosphere 1993, 26, 1365–1374. [Google Scholar] [CrossRef]
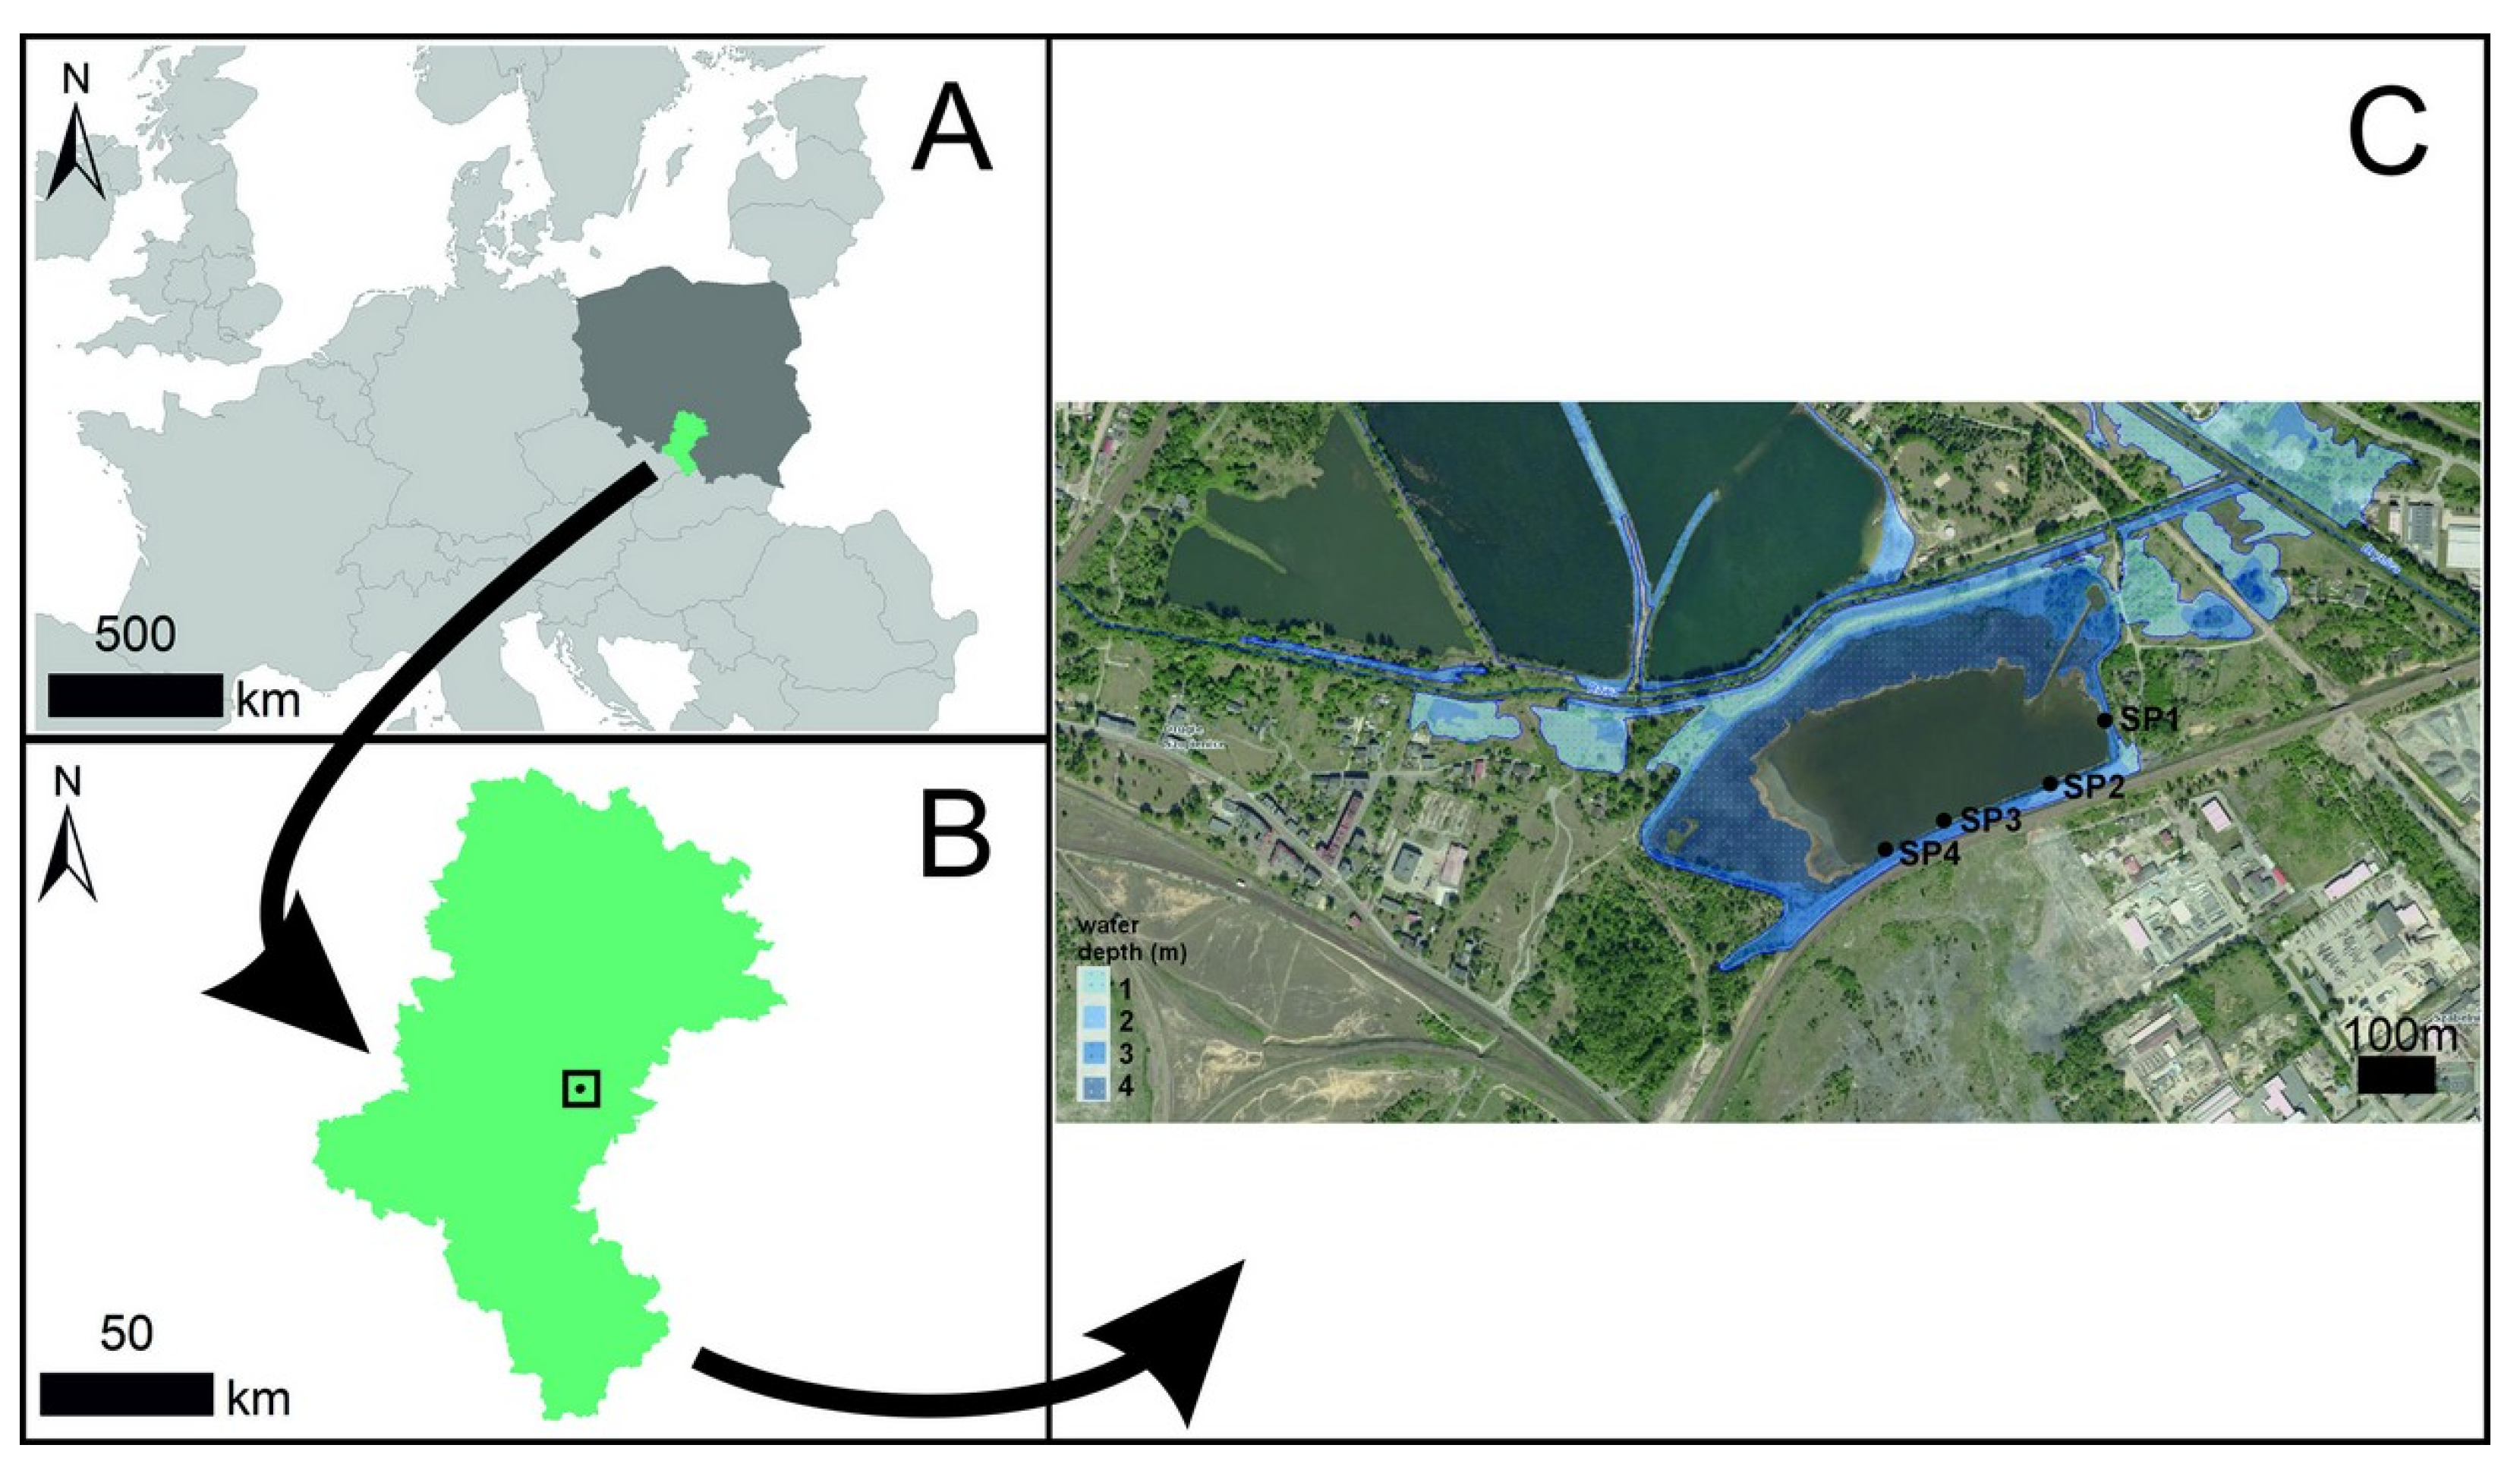
Figure 1. Location of: (A) Silesian Voivodeship in the context of Poland and Central Europe; (B) the study area within the Silesia Voivodeship; (C) the Hubertus IV reservoir and study plots SP1-SP4, with the assessment of the flood risk zone in the sand excavation area on the orthophotomap background (data and background: IT system for country protection https://wody.isok.gov.pl/imap_kzgw/ (accessed on 9 August 2024)).
Water 17 02862 g001
Figure 2. Municipal-industrial fragments of catchment area of Rawa and Brynica rivers near the Hubertus I-IV reservoirs on an orthophotomap. The yellow line indicates the boundaries of the catchment areas based on LIDAR measurements (data and background: IT country system for geospatial information https://polska.geoportal2.pl/ (accessed on 9 August 2024)).
Water 17 02862 g002
Figure 3. Photographs of the study plots (SP): (A) SP 1; (B) SP 2; (C) SP 3; (D) SP 4.
Water 17 02862 g003
Figure 4. Bathymetry of the Hubertus IV reservoir based on data from hydroacoustic measurements data sampling on 25 March 2022.
Water 17 02862 g004
Figure 5. Terrain analysis of the direct catchment area of the Hubertus IV reservoir: (A) Digital Terrain Model (DTM) of the direct catchment area with cross-sections (a, b and c) presented in figure section B; (B) elevation profile of the terrain around the reservoir along the sections marked as a, b and c on figure section A.
Water 17 02862 g005
Figure 6. Spatial distribution of physicochemical parameters in the Hubertus IV reservoir based on measurements with a multi-parameter probe on 25 March 2022: (A) specific conductivity; (B) oxygen saturation, (C) phycocyanin concentrations; (D) chlorophyll-a concentration.
Water 17 02862 g006
Figure 7. Raphanus sativus root length grown on the sediments from the study plots SP1, SP2, SP3 and SP4. Different letters (a, b) denote heterogenous groups. Non-parametric ANOVA and Kruskal–Wallis H test with post hoc analysis (p < 0.05).
Water 17 02862 g007
Table 1. Values of physicochemical parameters at the study plots based on measurements with a multi-parameter probe on 11 July 2022.
Study PlotsOxygen Concentration (mg L−1)Oxygen Saturation (%)Specific Conductivity (uS cm−1)TDS (mg L−1)pH
18.33976853778.1
27.74916853778.0
38.12986873777.9
46.63726903807.3
Table 2. Characteristics of the phytoplankton, macrophytes and benthic fauna at the study plots of Hubertus IV reservoir based on 11 July 2022 sampling.
Study Plot PhytoplanktonMacrophytesBenthic Macroinvertebrates
Number of TaxaShannon–Wiener IndexBiomass (mg L−1)Number of TaxaPlant Cover (%)Shannon–Wiener IndexTotal Density (Individuals m−2)Biomass (g m−2)Shannon–Wiener IndexNumber of Taxa Dominant Taxa
1511.4971211.73301.16912873.0311.70910Chironomidae, Caenidae, Potamopyrgus antipodarum (invasive species)
2280.979895.74401.09414739.4141.29512Chironomidae
3461.3252578.34301.61339623.6400.6767Chironomidae
4321.0272277.66301.2715252.8952.07013Chironomidae
Table 3. Median of metal concentration and pollution indices in the study plots.
Study Plots1234
metal concentration (mg kg dry mass−1)Cd2.650.550.403.85
Zn573.20103.3581.30607.85
Pb70.4529.4020.2091.75
CFpCd0.230.060.040.42
Zn0.480.100.200.65
Pb0.120.060.040.18
CFCd7.191.721.2512.97
Zn8.741.883.5711.74
Pb3.051.470.894.59
PLIp0.240.070.070.37
PLI1.970.570.543.03
Table 4. Decision support overview for post-industrial reservoirs analysis: information categories, methods, methods’ advantages, disadvantages, and required resources.
MethodAdvantagesDisadvantagesRequired Resources
Historical informative data groups
(irreplaceable, it is a starting point for rational decisions regarding further research of the reservoir)
Analysis of available documents regarding the reservoir (including maps, official studies, reports, literature)possibility to determine historical pressures and adapt the scope of further research accordingly to the situation of the reservoir, the ability to eliminate unnecessary tests and focus resources on essential analysespotential lack of documentation or difficulty in obtaining it, problems with data being up-to-dateDigitized analog data, including historical data, requiring a time-consuming process of selecting the information contained within them.
Hydro- and geomorphological informative data groups
Document and map analysisease to obtain informationpotential lack of current data, digitalization of analog maps may be necessaryDigitized data based on collected documentation materials, which do not require financial investment but may be time-consuming to access.
Bathymetric measurements, measurements of water inflows and outflowshigh accuracy of research, up-to-date dataresearch requiring floating equipment (may be remote in some applications) and access to specialized software, experience in field requiredResults obtained based on data analysis with expected accuracy, dependent on the available floating research equipment, reservoir size, and the nature of the reservoir.
Mathematical water flow modelingenable modeling of scenarios related to various water supply to the reservoir, combined with chemical and biological models, they enable the representation of the entire ecosystemmodel calibration and testing requiredResults of time-consuming modeling analyses using licensed/non-licensed (free) software, along with their verification and validation. Specialized knowledge is required.
Physicochemical water parameters informative data groups
Physicochemical probe measurements, chlorophyll-a and phycocyanin measurements using multiparameter probesthe possibility of conducting ad hoc—patrol monitoring, depending on the need, measurement can be performed from: a shore, a pier or a floating object unaccredited measurements, probe calibration requiredResults of water property analysis obtained in real-time, in situ (in the field) using specialized probes by a technician, some probes associated with high costs of purchasing probes, which can be reduced through rental.
Remote sensing (chlorophyll-a) measurementenables obtaining quantitative data on a local, regional, and global scale, characterized by the repeatability of observationsthe need to calibrate and adapt the model to local conditions, limited application possibilities in reservoirs with aquatic plants, chlorophyll contained in vascular plants significantly interferes or prevents the measurement of chlorophyll in phytoplankton biomass, dependent on weather conditions (cloud cover over the reservoir prevents measurement), in the case of inland waters, high biological and optical complexity makes its application difficultResults of a multi-step, time-consuming research procedure as well as standardization, which are associated with high costs.
Laboratory measurementspossibility of accreditation of tests, high accuracy (however, not necessary in preliminary and screening tests), possibility of testing unusual parametersthe need to secure, store and transport of samples, the duration of the test may be longResults of parameters of water and other elements of the reservoir, such as sediment, obtained through laboratory analyses.
Biological informative data groups
Phytoplankton laboratory measurementit is possible to obtain precise information about trophy statusrequires direct field samplingResults of studies conducted both in the field and in the laboratory throughout the entire growing season, with the involvement of a specialist and laboratory infrastructure.
Macrophytes analysisallows obtaining information on the trophy of the reservoir water and coastal zone, the potential to block surface runoff, and the possibility of creating habitats for birds and fishrequires expertise and direct field sampling from the reservoir area and the coastal zoneResults of time-consuming studies conducted throughout the entire growing season with the involvement of a specialist, utilizing citizen science data.
Benthic macroinvertebrates analysisprovides information on the condition of the tank and the food base, including for fishrequires expertise and long-term study Results of time-consuming, full-season studies conducted using field and laboratory equipment, with the involvement of a specialist.
eDNA analysisrelatively simple and quick method of species identification, enables obtaining information about biodiversity, does not cause any disruption to the ecosystemrisk of sample contamination, does not provide information about population structure, size, sex ratio, age, individuals condition, potential for false positives and negatives, leading to potential misinterpretations of data, the degradation of eDNA in water, especially in warm and turbid waters, lack of standardized protocols and methodologies can result in variations in results, lack of standardized protocols, large datasets demand advanced bioinformatics skills and resources for proper handling and interpretationResults of multi-stage studies conducted using specialized equipment in a molecular laboratory, involving a specialist and the use of costly reagents.
Mathematical ecosystem modeling based on biological parametersenable the prediction of phenomena in the reservoircomprehensive reservoir testing required to calibrate and test the modelVerified and validated results of time-consuming mathematical modeling analyses based on previously collected biological data. The analysis must be conducted using licensed software by a specialist. An alternative is free software.
Toxicological informative data groups
Metals in sediments (or in other environmental samples like soil or water) measurementrelatively easily available material, relatively accessible laboratories and methodsno significant disadvantages of the methodResults of standard analyses of environmental samples conducted by environmental laboratories.
Metals in tissues measurementrelatively easily available material, relatively accessible laboratories and methodsrequires a precise selection of objects (plant or animal species and their tissues or fragments) so that the results obtained are representative of the analyzed environment, this may require the involvement of specialists in ecotoxicology or environmental toxicology, potential need for bioethical approvalsResults of standard analyses of environmental samples, such as animal organs, which require additional manual procedures for sample preparation.
Pollution indexesif based on data collected using time- and money-effective methods (as metal concentrations or other effective data) and referred to the standard or in any other normalized reference data, they provide very valuable information for the decision-making processno significant disadvantages of the methodResults of time-consuming analyses based on historical data and reference studies, along with their rapid interpretation using basic computational software.
Certified biotests for environmental toxicologytests based on toxicity parameters specific for standardized model species/forms of plants and animals within relatively short time provide information on acute toxicity of environmental samples, if exact contents of potentially toxic substances or chemicals are not necessaryusually require well-qualified personnel, working exclusively on this task, capable of competent interpretation of markers of changes in model individuals, occurring under the influence of potentially polluted/harmful environmental samplesResults of costly certified biotests conducted according to the manufacturer’s instructions or alternative non-certified tests; time-consuming single measurements, with a methodology requiring repetitions.
Non-certified toxicity tests (e.g., Phytotoxkit-like tests)germination and root elongation tests do not need certified seeds, if include unpolluted reference samples tests are easy for interpretation and do not require much individual working time, substrate toxicity demonstrated by a simple and rapid reaction of plant bioindicatorsthe plant may not be sensitive to a given type of toxic substance or the concentrations may be too low for it to react noticeably, potential possibility of hormesisResults of rapid toxicity test analyses that do not require advanced equipment but adhere to testing procedures developed using free software.
Other specific informative data groups
Other specific measurements due to the land use history or neighboring objects (e.g., old waste dumps, arable fields). This situation requires starting the process of decision making from the first step recommended, i.e., historical analysis of the area which is irreplaceable in this proposed analysis.
Disclaimer/Publisher’s Note: The statements, opinions and data contained in all publications are solely those of the individual author(s) and contributor(s) and not of MDPI and/or the editor(s). MDPI and/or the editor(s) disclaim responsibility for any injury to people or property resulting from any ideas, methods, instructions or products referred to in the content.