Abstract
The Three Gorges Reservoir, serving as a crucial ecological barrier for the middle-lower Yangtze River basin, faces substantial threats to watershed ecosystems from sediment-associated heavy metal, threatening aquatic ecosystems and human health via bioaccumulation. Leveraging the legislative framework of the Yangtze River Protection Law, this study analyzed sediment cores (0–65 cm) collected from 12 representative sites in the Three Gorges Reservoir using 2020 Air–Space–Ground integrated monitoring data from the Changjiang Water Resources Commission. Concentrations of nine heavy metals (Cd, Cu, Pb, Fe, Mn, Cr, As, Hg, and Zn) were quantified to characterize spatial and vertical distribution patterns. Source apportionment was conducted through correlation analysis and principal component analysis (PCA). Contamination severity and ecological risks were assessed via geo-accumulation index (Igeo), potential ecological risk index (RI), and acute toxicity metrics. The findings indicated substantial spatial heterogeneity in sediment heavy-metal concentrations, with the coefficients of variation (CV) for Hg and Cd reaching 214.46% and 116.76%, respectively. Cu and Pb showed surface enrichment, while Cd exhibited distinct vertical accumulation. Source apportionment indicated geogenic dominance for most metals, with anthropogenic contributions specifically linked to Cd and Hg enrichment. Among the metals assessed, Cd emerged as the primary ecological risk driver, with localized strong risk levels (Ei > 320), particularly at FP and SS sites. These findings establish a scientific foundation for precision pollution control and ecological restoration strategies targeting reservoir sediments.
1. Introduction
The Three Gorges Reservoir serves as both a pivotal ecological barrier [1,2], abundant in natural resources and species diversity within China’s southwestern region [3], and a critical ecologically sensitive area safeguarding flood control security, water quality, and ecological equilibrium in the middle-lower Yangtze River [4]. Its prominent ecological functional status has consequently heightened widespread concern regarding the ecological integrity of the reservoir environment [2,5,6]. However, the reservoir’s distinctive cyclical and substantial water-level fluctuations induce markedly diminished flow velocity, protracted hydraulic retention time, and substantially enhanced sedimentation of suspended solids and particulate matter [5,7]. This process culminates in the formation of extensive sediment accumulation areas within reservoir bays, low-velocity regions, and drawdown zones [8].
The drawdown zone plays a dual role during cyclical water-level fluctuations [7,9]. During low-water phases, contaminants including heavy metals—from mining, industrial/urban discharges, agricultural runoff, intensive navigation, and sediment/bound pollutants from upstream inflows—undergo sedimentation and enrichment, establishing the zone as a pollution sink [10]. Conversely, during high-water phases, inundation exposes sediments to alternating desiccation–wetting cycles and dramatic redox fluctuations, which facilitate contaminants’ liberation back into the water column via desorption and dissolution, thereby transforming the sediments into a potential pollution source [7]. Furthermore, high-intensity seasonal dry–wet cycles and summer rainfall erosion markedly alter the physicochemical properties of drawdown zone sediments [5,11]. These alterations profoundly influence pollutant bioavailability, migration, and release behaviors. Consequently, sediments serve as critical pollutant sinks and sources, exerting a governing influence on the migration and transformation dynamics of contaminants [12,13].
With the accelerated development of the Yangtze River Economic Belt [14], heavy-metal contamination in aquatic environments has escalated significantly [15], particularly concerning heavy metals in sediments, which have emerged as a prominent research focus in environmental protection studies [5]. Heavy metals enriched in sediments pose severe threats to the reservoir’s ecological integrity due to their persistence, bioaccumulation potential, and inherent toxicity. Through biomagnification within food chains, they not only exert direct toxicity on benthic organisms and destabilize aquatic ecosystem structure but may also jeopardize aquatic biodiversity both within the reservoir and downstream regions [16]. Crucially, the mechanisms of desorption, dissolution, and rainfall erosion within the drawdown zone can directly facilitate the transport of mobilized heavy metals into the water column, thereby posing latent risks to regional ecological security and human health, while creating persistent and direct hazards for the security of downstream drinking water sources and water resource utilization [5,17,18].
In recent years, several approaches have been developed for assessing the environmental impact of heavy metals in sediments, including the geo-accumulation index (Igeo), potential ecological risk index (RI), and sediment quality guidelines (SQGs) [19,20]. Driven by evolving contemporary water governance philosophies and Yangtze River Economic Belt’s development, substantial research efforts have yielded significant advances into ecological risk assessment of heavy metals in the Three Gorges Reservoir. Liang et al. identified Hg, Cd, and As in Changshou Lake as moderately to heavily polluted [21]. Herath et al. demonstrated that Pb, Cd, and Zn pose significant threats to the ecosystem of Three Gorges Reservoir [22]. Recent studies confirm Cd-dominated ecological risks around coal gangue dumps in Three Gorges Reservoir despite all coal mines being closed in 2020 [23]. Furthermore, integrated assessments—incorporating species sensitivity distribution models, entropy water quality indices, and human health risk evaluation—have quantified the latent ecological threats posed by heavy metals [24,25]. Collectively, these studies provide a theoretical foundation for environmental management in reservoir areas.
Notably, nearly half of China’s priority control zones for heavy metals reside within the Yangtze River Economic Belt, according to environmental protection plan covering the Yangtze River Economic Belt. In 2020, the Yangtze River Protection Law was formally enacted [26,27,28], underscoring the critical importance and urgency of basin-wide ecological conservation and restoration, encompassing the Three Gorges Reservoir [28]. However, a critical review of recent literature reveals a scarcity of comprehensive ecological risk assessments for the Three Gorges Reservoir, particularly studies providing comparative data before and after the Yangtze River Protection Law was enacted, which precludes a robust evaluation of the law’s efficacy and a mechanistic understanding of recent pollution dynamics.
To precisely quantify contamination and ecological risks of heavy metals in Three Gorges Reservoir sediments by (1) analyzing their spatial distribution characteristics, (2) apportioning their potential sources, and (3) conducting a comprehensive ecological risk assessment, this study was initiated during the inaugural year of the Yangtze River Protection Law’s enactment. Utilizing nine-metal (Cd, Cu, Pb, Fe, Mn, Cr, As, Hg, Zn) concentration data from shallow surficial sediments (0–65 cm depth) within the Air–Space-Ground integrated project conducted by Changjiang Water Resources Commission, spatial distribution characteristics of sediment-bound metals were analyzed, and principal component analysis (PCA) and correlation analysis were employed for preliminary source apportionment, while geo-accumulation index (Igeo), potential ecological risk index (RI), and sediment quality guidelines (SQGs) assessments were applied to quantified ecological risks. These integrated approaches provide reference frameworks and empirical support for sediment heavy-metal pollution mitigation, establishing scientific foundations for precision pollution control, formulation of ecological restoration strategies, and sustainable environmental management under long-term operational safety of the Three Gorges Project.
2. Materials and Methods
2.1. Study Area
As the largest artificial reservoir in the world [29], the Three Gorges Reservoir extends 660 km longitudinally across 26 counties/cities in Chongqing and Hubei Province [30,31], approximately between 29°16′ N to 31°25′ N, 106°50′ E to 110°51′ E. The reservoir area encompasses approximately 57,600 km2, and experiences a subtropical monsoon climate with abundant precipitation [32,33]. Conducive thermal-humid conditions foster prolific algal and aquatic vegetation growth. Since impoundment, hydrological alterations—extended hydraulic retention and attenuated flow velocities—have thereby elevated eutrophication risk [34], while the water quality directly governs aquatic environmental security of the middle-lower Yangtze River reaches [18]. Functioning as a distinctive semi-natural–semi-artificial water body, the Three Gorges Reservoir differs markedly from natural lakes and marine systems in water depth, hydrological characteristics, and ecosystem structure, serving as a critical platform for studying eco-environmental impacts of large-scale hydraulic engineering [35].
Field sampling for this investigation was conducted during autumn 2020, focused on the Yangtze mainstem and tributaries from Badong County to the Three Gorges Dam. Twelve monitoring stations were established at the following locations: Miao River (MR), Xiangxi River (XR), Zhaxi River (ZR), Quyuan Town (QT), Xietan (XT), Shennong Stream (SS), Puzhuang River (PR), Badong (BD), Fanjiaping (FP), Guandukou (GK), Guizhou (GZ), and Qinggang River (QR). The site configurations are detailed in Figure 1.
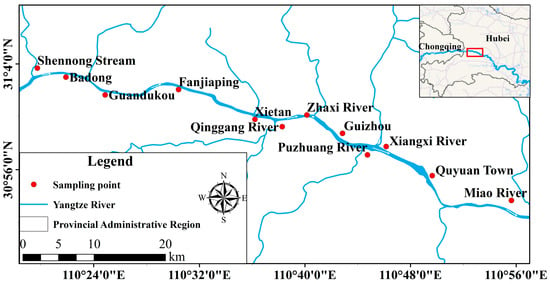
Figure 1.
The locations of the 12 sampling sites of sediment sampling in Hubei, China.
2.2. Sample Collection and Analytical Procedures
The selection of the 12 representative sampling sites was informed by the ‘Air-Space-Ground integrated monitoring’ program conducted by the Changjiang Water Resources Commission in 2020. This program employed a multi-platform approach, encompassing satellite remote sensing, unmanned aerial vehicle photography, and in situ multi-spectral water quality monitoring buoys, to establish a three-dimensional environmental monitoring network across the Three Gorges Reservoir. Concurrently with sediment sampling, surface water samples were collected at each site for laboratory analysis of parameters including temperature (Temp.), electrical conductivity (EC), dissolved oxygen (DO), pH, turbidity (Turb.), total organic carbon (TOC), total nitrogen (TN), and total phosphorus (TP). These laboratory measurements were used to calibrate and validate the data obtained from the in-situ sensors, ensuring data accuracy and reliability for subsequent correlation analysis with sediment properties.
Sediment cores were collected at each transect using a column sample deployed via winch from the hydrological survey vessel. At each sampling transect, 65-cm-deep sediment cores were retrieved, with stratified subsamples collected at 5 cm intervals. Samples were sealed in polyethylene sample bags to exclude air and stored at 4 °C immediately upon collection.
Collected sediments were air dried, subsequently pulverized, sieved through a 100-mesh nylon sieve, and stored in polyethylene bags. Prior to analysis, the samples were microwave digested. Heavy metal concentrations were quantified using inductively coupled plasma optical emission spectrometry (iCAP6300 Duo, Thermo Fisher Scientific, Waltham, MA, USA) and atomic fluorescence spectrometry (AFS-930, Jitian Instrument Co., Beijing, China). The entire process, from sampling preservation, transportation to laboratory testing, strictly implemented the quality control measures stipulated in the Specifications for Water Environmental Monitoring (SL 219-2013) [36] to ensure data quality and reliability. Corresponding detection methodologies and limits are detailed in Table 1.

Table 1.
Analytical methods and standards for target heavy metals.
2.3. Heavy Metal Contamination Assessment Methods
2.3.1. Geo-Accumulation Index (Igeo)
The Geo-accumulation Index, initially proposed by the Müller in 1969 [19], has been extensively employed for assessing heavy-metal contamination in sediments [40,41,42,43,44]. In this study, background values of heavy metals in Three Gorges Reservoir soils served as the reference values [45] (Table 2). The Igeo is calculated using the Formula (1), where Ci is the measured concentration of the target metal, CB is the reference value, and K is a correction factor (K = 1.5). The resulting Igeo values were classified into seven contamination grades, corresponding to uncontaminated to extremely contaminated (Table 3).

Table 2.
Background Values of Soil Heavy Metals in the Three Gorges Reservoir.

Table 3.
Classification of pollution level based on Igeo.
2.3.2. Potential Ecological Risk Index (RI)
The Potential Ecological Risk Index (RI) proposed by Håkanson is extensively employed to quantify the composite ecological risk of heavy metals in aquatic ecosystems [20,46,47,48,49]. The calculation formula refers to Formula (2), where Ei is the potential ecological risk index for a specific metal, Ti is the response toxicity coefficient (Table 4), Ci is the measured concentration of the target metal, and CB is the reference value required for calculation (Table 2).

Table 4.
Toxicity Coefficients, and Ecotoxicity Thresholds of Soil Heavy Metals.
The Risk Index (RI) quantifies the cumulative potential ecological risk of heavy metals, calculated as the sum of individual ecological risk factors (Formula (3)). Following Håkanson’s methodology [20], the cumulative toxicity coefficient for the eight target metals in this study was 93. Consequently, the threshold value for the low ecological risk category was determined to be 100 following rounding, with subsequent risk level threshold doubling relative to the preceding category incrementally. Corresponding Ei and RI values are presented in Table 5.

Table 5.
Classification of pollution level based on potential ecological risk.
2.3.3. Sediment Quality Guidelines (SQGs)
Sediment quality guidelines (SQGs) enable rapid identification of priority areas through potential acute toxicity assessment [50,51]. When contaminant concentrations are below Threshold Effect Level (TEL), they are considered unlikely to have adverse effects on sediment, and when concentrations exceed Probable Effect Level (PEL), adverse biological effects may occur frequently [52,53]. Concentration values that lie between the TEL and the PEL indicate that sediment organisms suffer from occasional adverse effects [52,53]. The PEL serves as the threshold for high-risk contamination requiring urgent remediation [54]. Corresponding TEL and PEL values are provided in Table 4. The sum of the toxic units (∑TUs) could be used to estimate the potential acute toxicity of the contaminants in a sample (Formula (4)), where TUs is the toxic unit for individual metals, Ci is the measured heavy-metal concentration, and PELi is the probable effect concentration. Heavy-metal toxicity classification criteria are detailed in Table 6.

Table 6.
Classification of pollution level based on sediment quality guidelines.
2.4. Sample Analysis and Data Processing
Descriptive statistical analyses of sediment heavy metal concentrations and mass fractions were conducted using average, max, min function in Microsoft Excel 365. Graphical plotting was performed using OriginPro 2024. Multivariate statistical analyses were performed in RStudio 4.3.2. Specifically, correlation analysis was conducted using the cor and pheatmap package, and principal component analysis (PCA) was performed using the pca package after Z-score normalized. Spatial distributions were visualized using ArcGIS 10.8.
3. Results
3.1. Hydrochemical Characteristics and Spatial Distribution of Heavy Metals in the Study Area
3.1.1. Hydrochemical Characteristics of Study Area
Water physicochemical parameters in the study area are summarized in Table 7. Monitoring data from 12 sites indicate consistently neutral to weakly alkaline conditions, with pH ranging from 7.69 at FP to 8.84 at QR, a median of 7.8, and SD of 0.31. Limited spatial variability suggests dominance of natural buffering processes, with no localized acidification. EC ranges from 307.3 to 343.9 μS·cm−1 (mean: 333.7 μS·cm−1), reflecting moderate ionic concentrations with minimal longitudinal variation. No significant downstream conductivity decrease was observed, indicating negligible dilution effects. These patterns imply hydrogeochemical processes governed by carbonate weathering [55], with ionic composition controlled by lithological and climatic factors.

Table 7.
Physicochemical parameters of water samples at sampling sites.
DO levels were generally favorable (5.96–8.27 mg·L−1), though slightly reduced at SS (5.96 mg·L−1), BD (6.10 mg·L−1), and GK (6.17 mg·L−1), potentially associated with localized increases in water depth or accumulation of oxygen-consuming organic matter. Significant Turb. heterogeneity was observed: MR (110 NTU), XT (112.9 NTU), and GZ (87.7 NTU) constituted high-turbidity zones, likely influenced by nearshore sediment input or runoff disturbances. Conversely, lower turbidity at XR (10.3 NTU) and ZR (16 NTU) indicated superior water clarity. Nutrient concentrations remained stable for TOC (2.36–3.34 mg·L−1), TN (1.37–1.95 mg·L−1), and TP (0.05–0.12 mg·L−1). QR exhibited distinctively low TN (1.37 mg·L−1) and TP (0.07 mg·L−1), potentially due to isolation from agricultural non-point source pollution. Notably, elevated turbidity sites such as MR and XT showed no anomalous TOC/TN ratios, suggesting that turbidity predominantly originated from inorganic suspended particles rather than organic detritus.
Based on the above analysis, the physicochemical characteristics of water bodies in the study area demonstrate pronounced homogeneity, featuring weak alkalinity and moderate ionic concentrations characteristic of natural river systems. Limited indications of mining activities or industrial point-source pollution was detected. Water quality variations primarily arise from sediment inputs and localized oxygen-consuming processes. Although limited non-point source pollution exists within the watershed, anthropogenic inputs remain insufficient to trigger eutrophication.
3.1.2. Statistical Characteristics of Sedimentary Metal Concentrations
Statistical analysis of eight heavy metal concentrations in 0–65 cm sediment horizons across 12 sampling sites is presented in Table 8. The results indicate that Cd and Hg exhibit the most pronounced anthropogenic contamination. Cd concentrations ranged from 0.18 to 5.76 mg·kg−1, with a max-min ratio of 32.0 and coefficient of variation (CV) of 116.76%. Hg concentrations varied between 0 and 0.26 mg·kg−1, demonstrating the highest spatial heterogeneity (CV = 214.46%) across the study area, suggesting intensive point-source inputs. Significant spatial fluctuations were observed for Cu, Pb, and As, with CV values of 45.25% and 41.90%, respectively, indicating moderate anthropogenic perturbation. Fe, Cr, Mn, and Zn exhibited relative homogeneity (CV ≈ 30%), implying predominant natural origins. The mean Fe concentration (20,362.06 ± 5686.36 mg·kg−1) aligns with fluvial sediment geochemical backgrounds. Mn (751.60 ± 234.43 mg·kg−1) and Cr (60.49 ± 17.01 mg·kg−1) concentrations corresponded to regional sedimentary rock weathering baselines [56], showing no marked anthropogenic enrichment.

Table 8.
Statistical Characteristics of Sediment Heavy-Metal Concentrations.
3.1.3. Vertical Distribution Patterns of Heavy Metals in Sediments
To characterize depth-dependent distribution patterns of nine heavy metals, sediment profiles (0–65 cm) were stratified into the following three horizons: surface (0–20 cm), intermediate (25–40 cm), and deep layers (45–65 cm) [57]. Concentration frequency distributions across strata were statistically analyzed and visualized via violin plots (Figure 2). Results revealed that mean concentrations of Cd and Hg substantially exceeded their interquartile ranges (IQR). Outliers (defined as >Q3 + 1.5IQR or <Q1 − 1.5IQR) constituted 13.9% and 17.5% of observations, respectively, exclusively above the IQR, exhibiting markedly right-skewness indicative of frequent extreme values from point-source pollution. Conversely, Pb, Fe, Mn, Cr, and As displayed quasi-normal distributions characterized by high congruence between medians and means, with outlier proportions <1%, reflecting stable diffusion governed by geological processes.
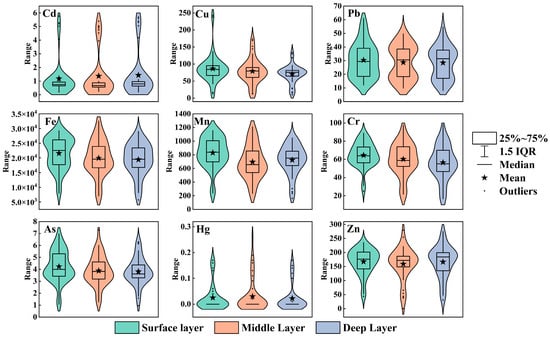
Figure 2.
Depth-Stratified heavy-metal concentration frequency in the sediment.
Vertical maximum-concentration frequencies quantified aggregation effects and historical contamination. As in Figure 3, Vertical profiling revealed the maxima occurred predominantly in surface sediments for Cu, Pb, Fe, Mn, and Zn, suggesting recent anthropogenic influence or inherent surface enrichment. Conversely, Cd exhibited maximal peak deep-layer accumulation frequency, suggesting historical contamination or downward migration via soluble complexation and porewater transport, demonstrating pronounced vertical accumulation effects, which were consistent with a recent study [58]. Spatially, MR and GK showed intense surface enrichment, signifying active contemporary inputs. XR and ZR exhibited marked deep-layer accumulation, potentially influenced by legacy pollution or deep groundwater infiltration. Given differential ecological risks and toxicological effects among contaminants, further investigation integrating source apportionment and ecological risk assessment is warranted.
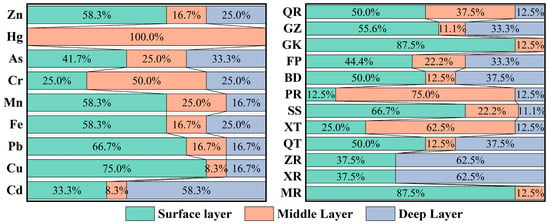
Figure 3.
Percentage of sites with maximum heavy-metal concentration stratified by depth interval.
3.2. Source Apportionment of Heavy Metals in Sediments
3.2.1. Correlation Analysis Between Sediment Metals and Water Physicochemical Properties
Correlation analysis between sediment heavy metals and physicochemical factors (Figure 4) revealed similar environmental response for Fe, Mn, and Zn. These elements showed significant positive correlations with DO and Temp., but negative correlations with EC. This pattern indicates the following redox conditions as a primary control mechanism: elevated DO promotes precipitation of Fe/Mn/Zn oxides or insoluble salts, while increased EC potentially inhibits dissolved-phase migration through competitive ion adsorption or soluble complex formation. TOC correlated positively exclusively with Fe, Mn, and Zn. Conversely, Cd and Hg exhibited inverse Temp. dependencies, implying that warming potentially enhances their release via accelerated desorption kinetics or organic matter mineralization. The positive Cd-EC correlation reflects saline inputs from sources like industrial effluents [59]. Most metals (excluding Cd, Hg, and Zn) correlated negative with turbidity, indicating adsorption onto suspended particulates in turbid waters [60]. Weak correlations for Cu, Pb, Cr, and As with physicochemical parameters suggest governance by unmonitored factors, requiring further investigation through isotopic tracing or speciation analysis. No significant TN/TP-metal correlations were observed, implying limited nutrient cycling influence on metal transport.
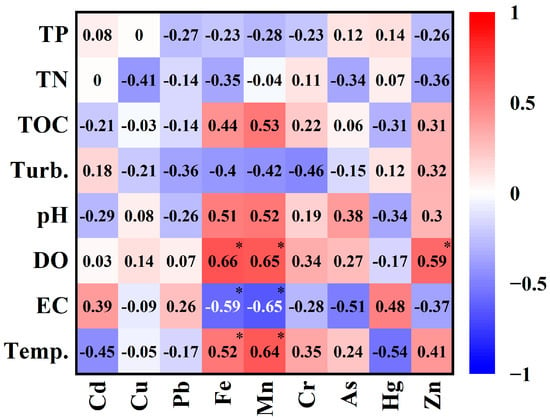
Figure 4.
Correlation between sediment metals and water physicochemical properties. * indicate p < 0.05.
3.2.2. Inter-Element Correlation Analysis
Inter-element correlation analysis of sediment heavy metals (Figure 5) revealed distinct source groups and coupled environmental behaviors. A robust positive correlation (r = 0.95) between Cd and Hg indicated high homology from anthropogenic sources such as industrial metallurgy or e-waste dismantling [59,61]. Strong geochemical paragenesis among Fe, Mn, Cr, and Zn reflected migration governed by coprecipitation with Fe-Mn oxides and surface adsorption, confirming dominant natural diagenetic contributions [62,63]. Significant Cu-As covariation suggested mining or industrial inputs. Notably, weak negative correlations between Cd/Hg and Fe/Mn pairs revealed antagonistic effects between anthropogenic contamination and natural geochemical processes. Minimal correlations among other elements demonstrated clear source differentiation without substantial cross-influence mechanisms.
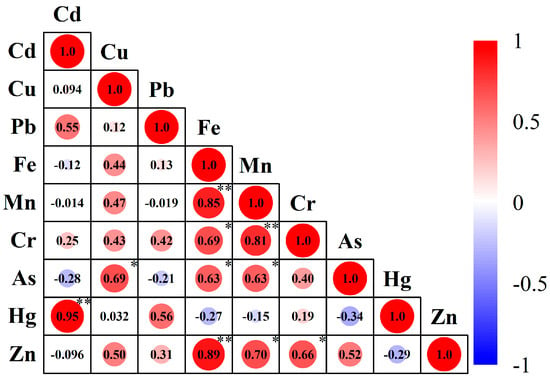
Figure 5.
Inter-element Correlation. * and ** indicate p < 0.05 and p < 0.01, respectively.
3.2.3. Principal Component Analysis and Source Identification
Principal Component Analysis (PCA) was employed to identify potential heavy metal sources in sediments [46], with loadings detailed in Table 9 and Figure 6. The suitability of the data for PCA was statistically validated. The Kaiser-Meyer-Olkin measure yielded a value of 0.708, indicating adequate sampling adequacy, and Bartlett’s test of sphericity was highly significant (p = 5.06 × 10−145), confirming sufficient correlation among variables. The analysis was performed on standardized data to account for scale differences. Two principal components (PC1 = 4.21, PC2 = 2.63) with eigenvalues >1 cumulatively explained 76% of variance (PC1 = 46.76%, PC2 = 29.24%), indicating robust source identification. Source apportionment revealed the following: PC1 was dominated by Fe (0.929), Mn (0.90), Zn (0.885), Cr (0.792), As (0.77), and Cu (0.672). The Fe/Mn loading ratio (1.03) approached natural sedimentary values, indicating control by Fe-Mn oxide coprecipitation—a signature process of natural weathering governed by geological backgrounds [62,63]. High As loading (0.77) suggested adsorption coupling with iron oxides. PC2 exhibited dominance by Cd (0.929), Hg (0.927), and Pb (0.791). The minimal Cd-Hg loading differential (0.002) confirmed homologous origins from anthropogenic sources like electronic industry emissions.

Table 9.
Principal component analysis results (rotated component matrix and total variance interpretation).
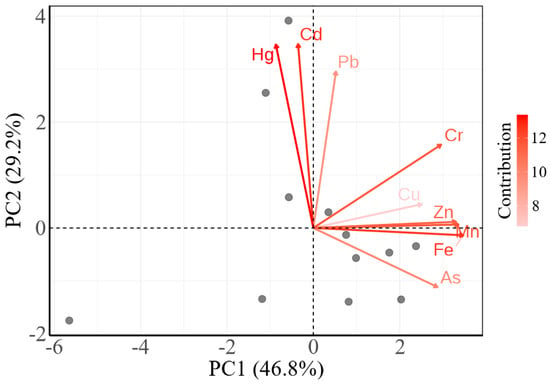
Figure 6.
Principal component analysis of heavy metals.
3.3. Ecological Risk Assessment of Heavy Metal in Sediments
3.3.1. Geo-Accumulation Index (Igeo) Assessment
Analysis of Igeo values for seven heavy metals (Cd, Cu, Pb, Cr, As, Hg, Zn) across 12 sampling sites revealed significant spatial heterogeneity (Figure 7 and Figure 8). Cd exhibited the most severe pollution, with nearly 92% of samples reaching moderate contamination or higher, demonstrating basin-wide pollution. Excluding GZ (mean Igeo = 0.50), all sites showed mean values corresponding to moderate contamination. Peak values were observed at FP (4.71 ± 0.09) and SS (3.80 ± 1.18), classified as heavily-to-extremely contaminated and heavily contaminated, respectively. Hg primarily reflected natural background levels due to frequent non-detects. However, consecutive Igeo > 1.2 values at 15–25 cm in SS and Igeo = 1.91 at 10 cm in FP indicated extreme spatial heterogeneity, which is consistent with buried contaminants from historical point sources. Mean Igeo ranges for Cu (−1.15 to 1.81) and Zn (−1.06 to 1.05) indicated predominantly low contamination. Pb showed 36.5% low contamination data with remaining values uncontaminated, while Cr and As consistently exhibited Igeo < 0, confirming natural origins. Spatially, uncontaminated data were clustered in GZ, reflecting minimal anthropogenic disturbance. Conversely, SS and FP exhibited significantly elevated Cd and Hg contamination, requiring priority remediation. Vertically, Cd contamination generally intensified with depth, indicating cumulative distribution in sediment columns. Other metals showed lower vertical vertical variability in Igeo, suggesting homogeneous natural sourcing.
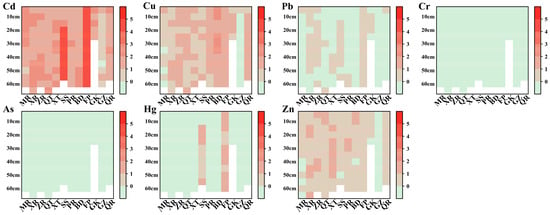
Figure 7.
Index geo-accumulation (Igeo) values for heavy metals in sediments.
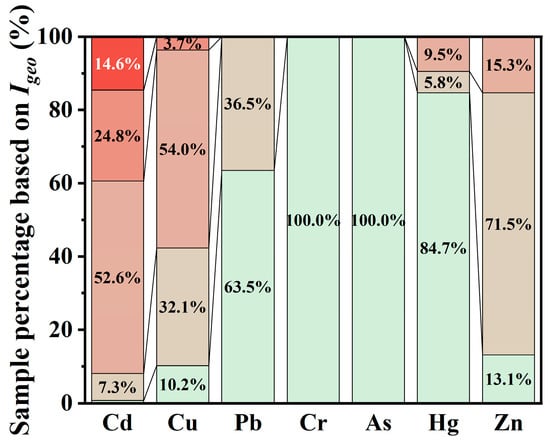
Figure 8.
Statistical results for the Igeo value of each heavy metal.
3.3.2. Potential Ecological Risk Index (RI) Assessment
Comprehensive Ei data across 12 sediment sampling sites (Figure 9 and Table 10) revealed extreme heterogeneity in RI value (range: 0.00773–1289.55; CV = 217%), indicating pronounced spatial contamination disparities. The risk contribution hierarchy was as follows: Cd (mean 337.6) ≫ Hg (mean 24.3) > As (mean 6.8) > Cu (mean 6.2) > Pb (mean 5.9) > Zn (mean 2.4) > Cr (mean 1.6). Risk gradation distribution indicated the following: low ecological risk constituted 61.4% (94/153) of data, predominantly from Cu, Pb, Cr, Zn; moderate ecological risk accounted for 10.5% (16/153), primarily As and Hg; considerable ecological risk comprised 4.6% (7/153), concentrated in As and Hg; very high ecological risk represented 23.5% (36/153), exclusively contributed by Cd and Hg (Cd accounting for 97.2%).
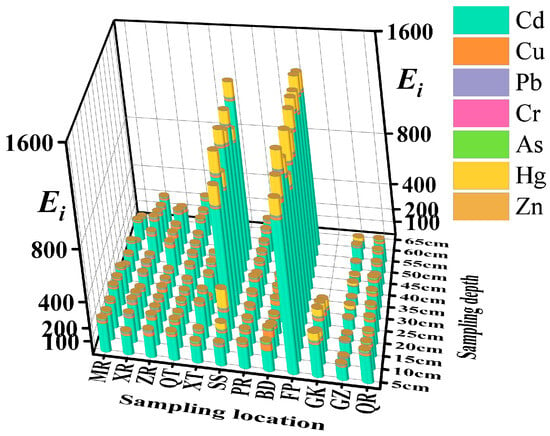
Figure 9.
Ei values for heavy metals in sediments.

Table 10.
Statistical results of Ei of each heavy metal and RI of each site.
Cd served as the primary basin-wide risk driver, with contamination detected across all sites. Overall, 98.7% of sampling locations exceeded considerable risk levels (RI > 80), and 45.1% reached very ecological high risk. FP (mean RI = 1187.2) exhibited higher contamination than SS (mean RI = 928.6), reflecting both extensive distribution and localized anthropogenic inputs. Hg displayed the most pronounced point-source characteristics; only 17.6% of samples showed ecological risk, yet 59.3% (16/27) of these exceeded considerable or higher ecological risk, exemplified by RI = 147.8 at 20-cm depth in SS and RI = 226.1 at 30-cm in FP. Spatially, elevated Cd and Hg concentrations coincided with historical industrial zones and navigation hubs, indicating point-source inputs from industrial emissions, coal combustion, or Hg-containing waste disposal. Cu presented a single moderate ecological risk point at 5–10 cm depth in BD. Pb, Cr, As, and Zn consistently demonstrated low ecological risk across all samples.
Vertical distributions showed increasing RI values of Cd with depth in surface sediments at SS and FP, persistently exceeding 900 within the 20–55 cm stratum. Similarly, positive RI-depth correlations occurred for Cd at XR and XT, indicating historical industrial emissions or burial diagenesis as contamination sources. Conversely, Cu contamination exhibited a decreasing trend with depth at MR, QT, PR, BD, and GZ; Pb showed analogous declines at MR, ZR, XT, BD, and QR; Zn followed this vertical attenuation pattern at MR, QT, BD, GK, GZ, and QR. This consistent surface enrichment implicates atmospheric deposition and surface runoff as primary input pathways.
Spatial distribution of comprehensive potential ecological risk revealed that 10 of 11 depth-stratified samples at GZ exhibited RI < 100, whereas SS and FP demonstrated elevated risks with localized high ecological risk zones. These areas constitute both pollution accumulation hotspots and focal points for Cd-associated ecological risks, demonstrating anthropogenic activities as the dominant cause of Cd enrichment, with significant contributions from the geological background as well.
3.3.3. Sediment Quality Guidelines (SQGs) Assessment
Assessment of vertical mean concentrations using sediment quality guidelines methodology (Figure 10) indicated generally low biological toxicity effects across 12 sampling sites. Mean toxic units (TUs) decreased in the following order: Cu (0.74) > Zn (0.60) > Cr (0.38) > Cd (0.31) > Pb (0.26) > As (0.10) > Hg (0.04). Comparative analysis with TEL revealed Cd concentration at FP, and Cu concentration at BD reached 1.25 times and 1.30 times TEL. Both metals fell within the TEL-PEL risk range, suggesting potential occasional toxic effects. Concentrations of Cd and Cu at all other sites remained below TEL, indicating no significant risk. Pb, Cr, As, Hg, and Zn consistently remained below TEL across all sites, demonstrating the unlikelihood of adverse effects. Among heavy metals, Cd contributed minimally to the TUs across sampling sites, despite elevated Igeo value. The higher PEL value than background value of Cd would lead to underestimation of its toxicity in TU assessment. Thus, an integrated framework should be established to accurately and comprehensively evaluate ecosystem risks from heavy metals.
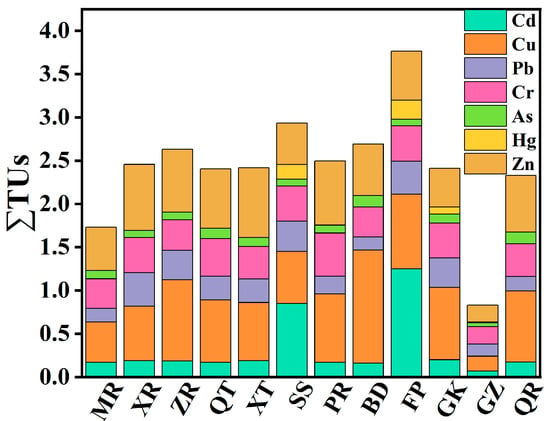
Figure 10.
SQGs assessment for heavy metals in sediments.
Comprehensive biological toxicity assessment through summation of ΣTUs (Figure 11) revealed values ranging from 0.83 to 3.76. All sites exhibited ΣTUs < 4, classified as uncontaminated. GZ (ΣTUs = 0.83) represented the cleanest site within the study area, with all elements <0.2 × TEL. Although FP reached the maximum ΣTUs (3.76), natural geochemical buffering prevented synergistic effects from exceeding critical thresholds, maintaining low biological toxicity. In summary, localized Cd and Cu exceedances in sediments induced no systemic toxic effects. However, specific ecological risks at FP and SS necessitate prioritized monitoring.
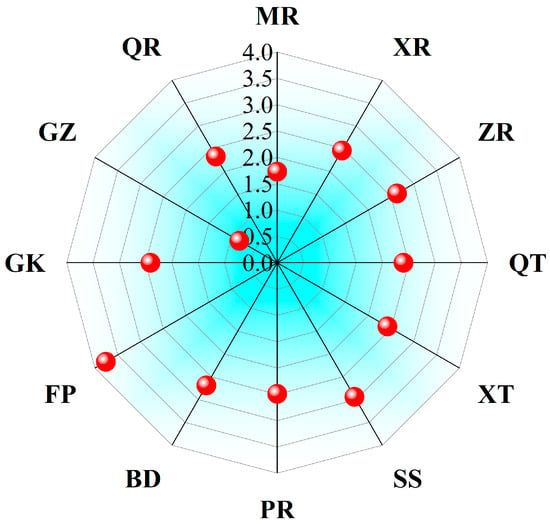
Figure 11.
Statistical results of SQGs of each site.
4. Discussion
This study systematically investigated heavy-metal contamination characteristics and ecological risks in sediments of the Three Gorges Reservoir. Spatial and vertical distribution analyses revealed significant heterogeneity in metal concentrations, with CV exceeding 50% only for Cd (116.76%) and Hg (214.46%). Cd and Hg exhibited distinctly right-skewed distributions, reflecting frequent extreme values from point-source pollution. Surface enrichment was revealed for Cu and Pb, whereas Cd displayed significant cumulative effects along vertical profiles within specific depth interval, which is consistent with observations from Lake Jangseong, South Korea [64]. Intensive surface accumulation was identified at MR and GK, while deep-layer enrichment dominated at XR and ZR, reflecting the temporal differences in pollution sources.
The distinct correlation patterns reveal fundamentally different biogeochemical behaviors between the metal groups. Fe/Mn/Zn correlations with TOC/DO suggest redox-driven diagenesis [65], likely through Fe-Mn oxide coprecipitation [66]. Their negative EC correlation indicates reduced solubility at high ionic strength. Conversely, Cd and Hg’s positive EC correlation suggests formation of soluble complexes in high-ion environments, while their negative temperature dependence may indicate temperature-dependent adsorption processes. These contrasting behaviors highlight how different environmental parameters selectively control metal fate and transport in reservoir systems.
Integration of correlation analysis and PCA source apportionment revealed geogenic processes as the predominant origin for Fe, Mn, and Zn. Conversely, for Cd and Hg, the minimal loading differentials (0.002) in PCA, coupled with their elevated coefficients of variation (116.76% and 214.46%, respectively) and marked spatial heterogeneity, strongly support anthropogenic origins rather than natural weathering processes. The identified anthropogenic signatures align with regional industrial activities, specifically suggesting contributions from electronic manufacturing emissions, coal combustion, and mining operations.
Ecological risk assessment revealed the following Igeo accumulation hierarchy: Cd > Cu > Zn > Pb > Hg > Cr > As. Approximately 92% of Cd data indicated moderate or higher contamination, with FP and SS exhibiting heavily-to-extremely contaminated and heavily contamination, while GZ showed minimal anthropogenic disturbance. Parallel findings were revealed by the potential ecological risk index methodology as follows: Cd exceeded considerable risk levels at 98.7% of sampling locations, with the maximum at FP and SS, demonstrating pronounced spatial heterogeneity and point-source characteristics. Sediment quality guidelines assessment indicated localized risks of occasional toxic effects for Cd and Cu, though systemic biological toxicity effects were absent.
Our findings regarding Cd as the primary ecological risk driver are consistent with a growing body of global research on large reservoir sediments. For instance, studies on the Halda river in Bangladesh [67] and a review in India [68] have similarly identified Cd, often derived from industrial and mining activities, as the metal of utmost concern, with concentrations and risk indices closely aligned with those reported here. This consensus underscores Cd’s persistent bioavailability and potent toxicity in aquatic sediments worldwide. Cd poses long-term risks through sustained release at sediment-water interfaces, whereas Hg’s bio-accumulative potential and methylated toxicity facilitate food-chain magnification, threatening aquatic ecosystems and human health [69]. Considering the strong correlation between Cd and Hg and the characteristics of anthropogenic sources, this necessitates stringent controls on industrial wastewater discharge, coal combustion emissions, and mining effluents to mitigate Cd and Hg contamination.
A methodological consideration merits attention in our risk assessment. The use of regional soil background values, while a practice adopted by other studies in similar contexts [70,71,72], may introduce uncertainty when applied to aquatic sediments. To enhance the accuracy and regional specificity of future ecological risk evaluations, some researchers have proposed the use of local geochemical background values combined with the local enrichment factor method, utilizing Fe-normalized element concentrations as a global reference to achieve dual normalization and improve assessment accuracy [73]. However, this method depends on rigorous field sampling and the integration of multidisciplinary expertise in fluvial geomorphology, sedimentology, and geochemistry [73].
Lastly, while this study focused on spatial and vertical distribution, the question of lateral heterogeneity across the width of the reservoir remains an important aspect of the contaminant’s three-dimensional distribution. The concentration may differ substantially from mid-channel to bank areas due to variations in flow velocity, sediment composition, and proximity to pollution sources [74,75]. Additionally, numerous studies have highlighted the significant temporal variations across years [76,77]. Future studies should therefore combine lateral mapping with temporal monitoring to better understand how hydrodynamics, seasonal changes, and human activities jointly influence metal distribution in large reservoirs.
5. Conclusions
In summary, among nine heavy metals investigated, Cd exhibited basin-wide contamination, exceeding environmental benchmarks across all sampling sites. Both Cd and Hg demonstrated distinct point-source characteristics, indicating predominant anthropogenic origins linked to industrial activities. GZ maintained superior environmental integrity, while FP and SS presented significant ecological risks. Future environmental management requires targeted and efficient interventions in these high-risk zones to mitigate ecological threats from Cd and Hg, ensuring long-term regional ecological security.
Author Contributions
Conceptualization, H.Y. and B.W.; methodology, B.Q.; software, H.Y.; validation, B.W., K.Z. and C.P.; formal analysis, K.Z. and C.P.; investigation, H.Y.; resources, J.Y.; data curation, H.Y.; writing—original draft preparation, H.Y.; writing—review and editing, J.Y.; visualization, H.Y.; supervision, B.Q.; project administration, B.Q.; funding acquisition, B.Q. All authors have read and agreed to the published version of the manuscript.
Funding
This research was funded by National Key R&D Program of China, grant number 2016YFA0600901.
Data Availability Statement
The data are available from the author on reasonable request.
Acknowledgments
We appreciated the editor and the anonymous reviewers for their constructive comments that improved the quality of the original manuscript.
Conflicts of Interest
The authors declare no conflicts of interest.
References
- Xu, D.; Gao, B.; Wan, X.; Peng, W.; Zhang, B. Influence of catastrophic flood on microplastics organization in surface water of the three gorges reservoir, China. Water Res. 2022, 211, 118018. [Google Scholar] [CrossRef]
- Yang, Y.; Chen, T.; Liu, X.; Wang, S.; Wang, K.; Xiao, R.; Chen, X.; Zhang, T. Ecological risk assessment and environment carrying capacity of soil pesticide residues in vegetable ecosystem in the three gorges reservoir area. J. Hazard. Mater. 2022, 435, 128987. [Google Scholar] [CrossRef]
- Guo, J.; Xie, Y.; Guan, A.; Qi, W.; Cao, X.; Peng, J.; Liu, H.; Wu, X.; Li, C.; Wang, D.; et al. Dam construction reshapes sedimentary pollutant distribution along the yangtze river by regulating sediment composition. Environ. Pollut. 2023, 316, 120659. [Google Scholar] [CrossRef] [PubMed]
- Liu, S.; Liao, Q.; Xiao, M.; Zhao, D.; Huang, C. Spatial and temporal variations of habitat quality and its response of landscape dynamic in the three gorges reservoir area, China. Int. J. Environ. Res. Public Health 2022, 19, 3594. [Google Scholar] [CrossRef]
- Gao, L.; Gao, B.; Xu, D.; Peng, W.; Lu, J. Multiple assessments of trace metals in sediments and their response to the water level fluctuation in the three gorges reservoir, China. Sci. Total Environ. 2019, 648, 197–205. [Google Scholar] [CrossRef]
- Chen, Z.; Zhou, Z.; Peng, X.; Xiang, H.; Xiang, S.; Jiang, Z. Effects of wet and dry seasons on the aquatic bacterial community structure of the three gorges reservoir. World J. Microbiol. Biotechnol. 2013, 29, 841–853. [Google Scholar] [CrossRef]
- Zhang, S.; Li, X.; He, D.; Zhang, D.; Zhao, Z.; Si, H.; Wang, F. Per- and poly-fluoroalkyl substances in sediments from the water-level-fluctuation zone of the three gorges reservoir, China: Contamination characteristics, source apportionment, and mass inventory and loadings. Environ. Pollut. 2022, 299, 118895. [Google Scholar] [CrossRef]
- Schenk, L.; Bragg, H. Sediment transport, turbidity, and dissolved oxygen responses to annual streambed drawdowns for downstream fish passage in a flood control reservoir. J. Environ. Manag. 2021, 295, 113068. [Google Scholar] [CrossRef]
- Chen, Y.; Gao, B.; Xu, D.; Sun, K.; Li, Y. Catchment-wide flooding significantly altered microplastics organization in the hydro-fluctuation belt of the reservoir. iScience 2022, 25, 104401. [Google Scholar] [CrossRef] [PubMed]
- Li, Y.; Cheng, X.; Liu, K.; Yu, Y.; Zhou, Y. A new method for identifying potential hazardous areas of heavy metal pollution in sediments. Water Res. 2022, 224, 119065. [Google Scholar] [CrossRef] [PubMed]
- Jiang, T.; Wang, D.; Wei, S.; Yan, J.; Liang, J.; Chen, X.; Liu, J.; Wang, Q.; Lu, S.; Gao, J.; et al. Influences of the alternation of wet-dry periods on the variability of chromophoric dissolved organic matter in the water level fluctuation zone of the three gorges reservoir area, China. Sci. Total Environ. 2018, 636, 249–259. [Google Scholar] [CrossRef]
- Labianca, C.; De Gisi, S.; Todaro, F.; Notarnicola, M.; Bortone, I. A review of the in-situ capping amendments and modeling approaches for the remediation of contaminated marine sediments. Sci. Total Environ. 2022, 806, 151257. [Google Scholar] [CrossRef]
- Dhineka, K.; Kaviarasan, T.; Sambandam, M.; Hoehn, D.P.; Sivyer, D.; Bakir, A.; Marigoudar, S.R.; Mishra, P. Coastal lagoon’s dual role as a sink and source for microplastics: A case study from India. Mar. Pollut. Bull. 2025, 211, 117480. [Google Scholar] [CrossRef]
- Zhang, X.; Huang, Y. Spatial evolution, influencing factors and spillover effects of logistics resilience in the Yangtze River Economic Belt. PLoS ONE 2024, 19, e0303639. [Google Scholar] [CrossRef] [PubMed]
- Tang, S.; Yang, K.; Liu, F.; Peng, M.; Li, K.; Yang, Z.; Liu, X.; Guo, F.; Ma, H. Overview of heavy metal pollution and health risk assessment of urban soils in Yangtze River Economic Belt, China. Environ. Geochem. Health 2022, 44, 4455–4497. [Google Scholar] [CrossRef]
- Zhao, X.; Gao, B.; Xu, D.; Gao, L.; Yin, S. Heavy metal pollution in sediments of the largest reservoir (three gorges reservoir) in China: A review. Environ. Sci. Pollut. Res. 2017, 24, 20844–20858. [Google Scholar] [CrossRef]
- Zhang, X.; Zhu, B. Changes of riparian soil-plant system phosphorus responding to hydrological alternations of three gorges reservoir. Sci. Rep. 2025, 15, 5629. [Google Scholar] [CrossRef] [PubMed]
- Holbach, A.; Wang, L.; Chen, H.; Hu, W.; Schleicher, N.; Zheng, B.; Norra, S. Water mass interaction in the confluence zone of the daning river and the yangtze river—A driving force for algal growth in the three gorges reservoir. Environ. Sci. Pollut. Res. 2013, 20, 7027–7037. [Google Scholar] [CrossRef]
- Muller, G. Index of geoaccumulation in sediments of the Rhine River. GeoJournal 1969, 2, 109–118. [Google Scholar]
- Hakanson, L. An ecological risk index for aquatic pollution control: A sedimentological approach. Water Res. 1980, 14, 975–1001. [Google Scholar] [CrossRef]
- Liang, A.; Wang, Y.; Guo, H.; Bo, L.; Zhang, S.; Bai, Y. Assessment of pollution and identification of sources of heavy metals in the sediments of changshou lake in a branch of the three gorges reservoir. Environ. Sci. Pollut. Res. 2015, 22, 16067–16076. [Google Scholar] [CrossRef]
- Herath, I.K.; Wu, S.; Ma, M.; Ping, H. Heavy metal toxicity, ecological risk assessment, and pollution sources in a hydropower reservoir. Environ. Sci. Pollut. Res. 2022, 29, 32929–32946. [Google Scholar] [CrossRef] [PubMed]
- Zhang, M.; Cheng, L.; Yue, Z.; Peng, L.; Xiao, L. Assessment of heavy metal(oid) pollution and related health risks in agricultural soils surrounding a coal gangue dump from an abandoned coal mine in Chongqing, Southwest China. Sci. Rep. 2024, 14, 18667. [Google Scholar] [CrossRef] [PubMed]
- Li, Y.; Zhang, J.; Song, N.; Wang, Y.; Yu, J.; He, L.; Yang, R.; Yang, L.; He, D. Assessment of health risk and identification of pollution sources of heavy metals in water in Chongqing’s wastewater treatment plants based on ICP-MS. Environ. Pollut. 2025, 373, 126193. [Google Scholar] [CrossRef] [PubMed]
- Zhang, J.; Liu, Z.; Tian, B.; Li, J.; Luo, J.; Wang, X.; Ai, S.; Wang, X. Assessment of soil heavy metal pollution in provinces of China based on different soil types: From normalization to soil quality criteria and ecological risk assessment. J. Hazard. Mater. 2023, 441, 129891. [Google Scholar] [CrossRef]
- Zhang, Y.; Yi, L.; Xie, B.; Li, J.; Xiao, J.; Xie, J.; Liu, Z. Analysis of ecological quality changes and influencing factors in Xiangjiang river basin. Sci. Rep. 2023, 13, 4375. [Google Scholar] [CrossRef]
- Li, R.; Jin, W. The role of the Yangtze River protection law in the emergence of adaptive water governance in China. Ecol. Soc. 2023, 28, art32. [Google Scholar] [CrossRef]
- Liu, D. Overall ideas and solutions for formulation of water-related laws and regulations in the Yangtze River basin in the new era. China Water Res. 2025, 28, 7–12. [Google Scholar]
- Wang, K.; Pang, Y.; Gao, C.; Chen, L.; Jiang, X.; Li, P.; He, C.; Shi, Q.; He, D. Hydrological management affected dissolved organic matter chemistry and organic carbon burial in the three gorges reservoir. Water Res. 2021, 199, 117195. [Google Scholar] [CrossRef]
- Chen, X.; Luo, Z.; Wang, Z.; Zhang, W.; Wang, T.; Su, X.; Zeng, C.; Li, Z. Trade-offs between grain supply and soil conservation in the grain for green program under changing climate: A case study in the three gorges reservoir region. Sci. Total Environ. 2024, 945, 173786. [Google Scholar] [CrossRef]
- Tang, Q.; Bao, Y.; He, X.; Zhou, H.; Cao, Z.; Gao, P.; Zhong, R.; Hu, Y.; Zhang, X. Sedimentation and associated trace metal enrichment in the riparian zone of the three gorges reservoir, China. Sci. Total Environ. 2014, 479–480, 258–266. [Google Scholar] [CrossRef]
- Naz, F.; Arif, M.; Xue, T.; Chen, Y.; Khan, S.U.; Li, C. Bacterial communities and soil functionality in artificially remediated vegetation of the three gorges reservoir zone. Front. Plant Sci. 2025, 16, 1550306. [Google Scholar] [CrossRef]
- Jiang, W.; Li, W.; Zhou, J.; Wang, P.; Xiao, H. Drone-based investigation of natural restoration of vegetation in the water level fluctuation zone of cascade reservoirs in Jinsha River. Sci. Rep. 2022, 12, 12895. [Google Scholar] [CrossRef]
- Zhe, S.; Li, W.; Wan, Y.; Wang, L.; Du, H.; Xiao, Y.; Yang, S. Dynamic response of fish community to hydrologic regime alteration in the upper reaches of the Yangtze River. Environ. Monit. Assess. 2025, 197, 636. [Google Scholar] [CrossRef]
- Wang, S.; Li, H.; Wei, X.; Zhu, N.; Sun, P.; Xia, L.; Tang, C.; Han, Q.; Zhang, G.; Liu, C.; et al. Dam construction as an important anthropogenic activity disturbing soil organic carbon in affected watersheds. Environ. Sci. Technol. 2020, 54, 7932–7941. [Google Scholar] [CrossRef]
- SL 219-2013; Regulation for Water Environmental Monitoring. Ministry of Water Resources of the People’s Republic of China: Beijing, China, 2013.
- HJ 803-2016; Soil and Sediment—Determination of Aqua Regia Extracts of 12 Metal Elements—Inductively Coupled Plasma Mass Spectrometry. Ministry of Ecology and Environment of the People’s Republic of China: Beijing, China, 2016.
- Chen, W.; Fan, X.; Guo, C.; Song, X.; Liu, Y.; Xv, N. Determination of iron content in high purity rare earth by inductively coupled plasma-tandem mass spectrometry. Fenxi Huaxue 2019, 47, 403–409. [Google Scholar]
- HJ 680-2013; Soil and Sediment—Determination of Mercury, Arsenic, Selenium, Bismuth, Antimony—Microwave Dissolution/Atomic Fluorescence Spectrometry. Ministry of Ecology and Environment of the People’s Republic of China: Beijing, China, 2013.
- Akoto, O.; Yakubu, S.; Ofori, L.A.; Bortey-Sam, N.; Boadi, N.O.; Horgah, J.; Sackey, L.N.A. Multivariate studies and heavy metal pollution in soil from gold mining area. Heliyon 2023, 9, e12661. [Google Scholar] [CrossRef] [PubMed]
- Duncan, A.E.; de Vries, N.; Nyarko, K.B. Assessment of heavy metal pollution in the sediments of the river pra and its tributaries. Water Air Soil Pollut. 2018, 229, 272. [Google Scholar] [CrossRef] [PubMed]
- Hossain, M.B.; Masum, Z.; Rahman, M.S.; Yu, J.; Noman, M.A.; Jolly, Y.N.; Begum, B.A.; Paray, B.A.; Arai, T. Heavy metal accumulation and phytoremediation potentiality of some selected mangrove species from the world’s largest mangrove forest. Biology 2022, 11, 1144. [Google Scholar] [CrossRef] [PubMed]
- Qin, Y.; Zhang, F.; Xue, S.; Ma, T.; Yu, L. Heavy metal pollution and source contributions in agricultural soils developed from Karst Landform in the Southwestern Region of China. Toxics 2022, 10, 568. [Google Scholar] [CrossRef]
- Rozanski, S.L.; Kwasowski, W.; Castejon, J.M.P.; Hardy, A. Heavy metal content and mobility in urban soils of public playgrounds and sport facility areas, Poland. Chemosphere 2018, 212, 456–466. [Google Scholar] [CrossRef]
- Tang, J.; Zhong, Y.; Wang, L. Background value of soil heavy metal in the three gorges reservoir district. Chin. J. Eco-Agric. 2008, 16, 848–852. [Google Scholar] [CrossRef]
- Ebrahimi-Khusfi, Z.; Zandifar, S.; Ebrahimi-Khusfi, M.; Tavakoli, V. Heavy metal mapping, source identification, and ecological risk assessment in the International Hamoun wetland, Sistan region, Iran. Environ. Sci. Pollut. Res. 2023, 30, 29321–29335. [Google Scholar] [CrossRef]
- Jin, X.; Liu, J.; Wang, L.; Yu, X.; Wang, J.; Jin, Y.; Qiu, S.; Liu, J.; Zhao, Y.; Sun, S. Distribution characteristics and ecological risk assessment of heavy metal pollution in seawater near the Yellow River Estuary of Laizhou Bay. Mar. Environ. Res. 2025, 203, 106776. [Google Scholar] [CrossRef]
- Qian, L.; Shi, Y.; Xu, Q.; Zhou, X.; Li, X.; Shao, X.; Xu, C.; Liang, R. A prospective ecological risk assessment method based on exposure and ecological scenarios (ERA-EES) to determine soil ecological risks around metal mining areas. Sci. Total Environ. 2023, 901, 166371. [Google Scholar] [CrossRef]
- Pan, L.; Ma, J.; Hu, Y.; Su, B.; Fang, G.; Wang, Y.; Wang, Z.; Wang, L.; Xiang, B. Assessments of levels, potential ecological risk, and human health risk of heavy metals in the soils from a typical county in Shanxi province, China. Environ. Sci. Pollut. Res. 2016, 23, 19330–19340. [Google Scholar] [CrossRef]
- How, C.M.; Kuo, Y.; Huang, M.; Liao, V.H. Assessing the ecological risk and ecotoxicity of the microbially mediated restoration of heavy metal-contaminated river sediment. Sci. Total Environ. 2023, 858, 159732. [Google Scholar] [CrossRef]
- Costa-Boddeker, S.; Thuyen, L.X.; Hoelzmann, P.; de Stigter, H.C.; van Gaever, P.; Huy, H.D.; Schwalb, A. The hidden threat of heavy metal pollution in high sedimentation and highly dynamic environment: Assessment of metal accumulation rates in the Thi Vai Estuary, Southern Vietnam. Environ. Pollut. 2018, 242, 348–356. [Google Scholar] [CrossRef]
- Ekoko Eric, B.; Etutu, M.E.M.M.; Adama, A.; Salomon Betrant, B.; Esue, M.F.; Mengu, E.E.J.; Njeck Rexon, A.J. Trace metal geochemistry sediments from the Dibamba River, SW Cameroon: Implication for heavy metal assessment and origin. Heliyon 2023, 9, e18866. [Google Scholar] [CrossRef] [PubMed]
- El-Said, G.F.; Draz, S.E.O.; El-Sadaawy, M.M.; Moneer, A.A. Sedimentology, geochemistry, pollution status and ecological risk assessment of some heavy metals in surficial sediments of an Egyptian lagoon connecting to the Mediterranean Sea. J. Environ. Sci. Health Part A Toxic/Hazard. Subst. Environ. Eng. 2014, 49, 1029–1044. [Google Scholar] [CrossRef] [PubMed]
- Yao, X.; Luo, K.; Niu, Y.; Li, Y.; Ren, B. Ecological risk from toxic metals in sediments of the Yangtze, Yellow, Pearl, and Liaohe Rivers, China. Bull. Environ. Contam. Toxicol. 2021, 107, 140–146. [Google Scholar] [CrossRef] [PubMed]
- Hu, H.; Wei, R.; Zerizghi, T.; Du, C.; Zhao, C.; Wang, Z.; Zhang, J.; Tan, Q.; Guo, Q. Control mechanisms of water chemistry based on long-term analyses of the Yangtze River. Sci. Total Environ. 2023, 892, 164713. [Google Scholar] [CrossRef]
- Wei, X.; Wang, S.; Ji, H.; Shi, Z. Strontium isotopes reveal weathering processes in lateritic covers in southern China with implications for paleogeographic reconstructions. PLoS ONE 2018, 13, e0191780. [Google Scholar] [CrossRef]
- Zhong, Q.; Chen, H.; Liu, L.; He, Y.; Zhu, D.; Jiang, L.; Zhan, W.; Hu, J. Water table drawdown shapes the depth-dependent variations in prokaryotic diversity and structure in Zoige Peatlands. FEMS Microbiol. Ecol. 2017, 93, fix049. [Google Scholar] [CrossRef]
- Wang, L.; Mao, X.; Song, X.; Wei, X.; Yu, H.; Xie, S.; Zhang, L.; Tang, W. Non-negligible ecological risks of urban wetlands caused by cd and hg on the Qinghai-Tibet Plateau, China. Toxics 2023, 11, 654. [Google Scholar] [CrossRef]
- Dolezalova Weissmannova, H.; Mihocova, S.; Chovanec, P.; Pavlovsky, J. Potential ecological risk and human health risk assessment of heavy metal pollution in industrial affected soils by coal mining and metallurgy in Ostrava, Czech Republic. Int. J. Environ. Res. Public Health 2019, 16, 4495. [Google Scholar] [CrossRef]
- Yao, Q.; Wang, X.; Jian, H.; Chen, H.; Yu, Z. Behavior of suspended particles in the changjiang estuary: Size distribution and trace metal contamination. Mar. Pollut. Bull. 2016, 103, 159–167. [Google Scholar] [CrossRef]
- Parvez, S.M.; Huda, M.M.; Rahman, M.; Jahan, F.; Fujimura, M.; Hasan, S.S.; Hares, A.; Islam, Z.; Raqib, R.; Knibbs, L.D.; et al. Hormonal, liver, and renal function associated with electronic waste (e-waste) exposure in Dhaka, Bangladesh. Toxicology 2024, 505, 153833. [Google Scholar] [CrossRef]
- Mimba, M.E.; Ohba, T.; Nguemhe Fils, S.C.; Nforba, M.T.; Numanami, N.; Bafon, T.G.; Aka, F.T.; Suh, C.E. Regional geochemical baseline concentration of potentially toxic trace metals in the mineralized Lom Basin, East Cameroon: A tool for contamination assessment. Geochem. Trans. 2018, 19, 11. [Google Scholar] [CrossRef] [PubMed]
- Hussain, S.M.; Anbalagan, S.; Kumar, K.S.; Neelavannan, K.; Pradhap, D.; Radhakrishnan, K.; Godson, P.S.; Krishnakumar, S. A baseline study on elemental concentration and potential ecological risk status of the surface sediments of Ashtamudi Lake, south west coast of India. Mar. Pollut. Bull. 2020, 158, 111410. [Google Scholar] [CrossRef] [PubMed]
- Kang, T.; Yang, H.J.; Han, J.H.; Han, Y.; Kim, M.; Kim, J.; Hwang, S.H.; Na, E.H.; Chang, Y. Identifying pollution sources of sediment in lake Jangseong, Republic of Korea, through an extensive survey: Internal disturbances of past aquaculture sedimentation. Environ. Pollut. 2022, 306, 119403. [Google Scholar] [CrossRef]
- Liu, C.; Guo, H.; Yan, S.; Wang, Y. Control of paleoclimate and paleoweathering on chromium contents in a non-ultramafic aquifer hosting high chromium groundwater. Environ. Geochem. Health 2024, 46, 316. [Google Scholar] [CrossRef]
- Ma, Y.; Yang, C.; Liu, Z.; Han, C.; Qin, Y. Arsenic mobilization across the sediment-water interface of the three gorges reservoir as a function of water depth using DGT and HR-peepers, a preliminary study. Ecotoxicol. Environ. Saf. 2024, 276, 116276. [Google Scholar] [CrossRef] [PubMed]
- Islam, M.A.; Das, B.; Quraishi, S.B.; Khan, R.; Naher, K.; Hossain, S.M.; Karmaker, S.; Latif, S.A.; Hossen, M.B. Heavy metal contamination and ecological risk assessment in water and sediments of the Halda River, Bangladesh: A natural fish breeding ground. Mar. Pollut. Bull. 2020, 160, 111649. [Google Scholar] [CrossRef]
- Kumar, V.; Sharma, A.; Kaur, P.; Singh Sidhu, G.P.; Bali, A.S.; Bhardwaj, R.; Thukral, A.K.; Cerda, A. Pollution assessment of heavy metals in soils of India and ecological risk assessment: A state-of-the-art. Chemosphere 2019, 216, 449–462. [Google Scholar] [CrossRef] [PubMed]
- Raj, D.; Maiti, S.K. Sources, bioaccumulation, health risks and remediation of potentially toxic metal(loid)s (As, Cd, Cr, Pb And Hg): An epitomised review. Environ. Monit. Assess. 2020, 192, 108. [Google Scholar] [CrossRef]
- Zhang, Z.; Yu, N.; Liu, D.; Zhang, Y. Assessment and source analysis of heavy metal contamination in water and surface sediment in Dongping Lake, China. Chemosphere 2022, 307, 136016. [Google Scholar] [CrossRef] [PubMed]
- Sun, W.; Yang, K.; Li, R.; Chen, T.; Xia, L.; Sun, X.; Wang, Z. Distribution characteristics and ecological risk assessment of heavy metals in sediments of shahe reservoir. Sci. Rep. 2022, 12, 16239. [Google Scholar] [CrossRef]
- Wang, F.; Yu, Z.; Zhang, Y.; Ni, R.; Li, Z.; Li, S.; Song, N.; Liu, J.; Zong, H.; Jiao, W.; et al. Source-risk and uncertainty assessment of trace metals in surface sediments of a human-dominated seaward catchment in Eastern China. J. Hazard. Mater. 2024, 480, 135960. [Google Scholar] [CrossRef]
- Matys Grygar, T.; Popelka, J. Revisiting geochemical methods of distinguishing natural concentrations and pollution by risk elements in fluvial sediments. J. Geochem. Explor. 2016, 170, 39–57. [Google Scholar] [CrossRef]
- de Souza, V.B.; Hollas, C.E.; Bortoli, M.; Manosso, F.C.; de Souza, D.Z. Heavy metal contamination in soils of a decommissioned landfill southern brazil: Ecological and health risk assessment. Chemosphere 2023, 339, 139689. [Google Scholar] [CrossRef] [PubMed]
- Tnoumi, A.; Angelone, M.; Armiento, G.; Caprioli, R.; Crovato, C.; De Cassan, M.; Montereali, M.R.; Nardi, E.; Parrella, L.; Proposito, M.; et al. Heavy metal content and potential ecological risk assessment of sediments from Khnifiss Lagoon National Park (Morocco). Environ. Monit. Assess. 2022, 194, 356. [Google Scholar] [CrossRef] [PubMed]
- Ota, Y.; Suzuki, A.; Yamaoka, K.; Nagao, M.; Tanaka, Y.; Irizuki, T.; Fujiwara, O.; Yoshioka, K.; Kawagata, S.; Kawano, S.; et al. Geochemical distribution of heavy metal elements and potential ecological risk assessment of matsushima bay sediments during 2012–2016. Sci. Total Environ. 2021, 751, 141825. [Google Scholar] [CrossRef]
- Wei, Y.; Ding, D.; Qu, K.; Sun, J.; Cui, Z. Ecological risk assessment of heavy metal pollutants and total petroleum hydrocarbons in sediments of the Bohai sea, China. Mar. Pollut. Bull. 2022, 184, 114218. [Google Scholar] [CrossRef] [PubMed]
Disclaimer/Publisher’s Note: The statements, opinions and data contained in all publications are solely those of the individual author(s) and contributor(s) and not of MDPI and/or the editor(s). MDPI and/or the editor(s) disclaim responsibility for any injury to people or property resulting from any ideas, methods, instructions or products referred to in the content. |
© 2025 by the authors. Licensee MDPI, Basel, Switzerland. This article is an open access article distributed under the terms and conditions of the Creative Commons Attribution (CC BY) license (https://creativecommons.org/licenses/by/4.0/).
