Article

Study on Natural Background Levels and Mechanisms of Groundwater Contamination in an Overexploited Aquifer Region: A Case Study of Xingtai City, North China Plain

1
Hebei Key Laboratory of Geological Resources and Environment Monitoring and Protection, Shijiazhuang 050021, China
2
Hebei Geo-Environmental Monitoring, Shijiazhuang 050021, China
3
Institute of Hydrogeology and Environmental Geology, Chinese Academy of Geological Sciences, Shijiazhuang 050061, China
*
Authors to whom correspondence should be addressed.
Water 2025, 17(19), 2836; https://doi.org/10.3390/w17192836
Submission received: 20 August 2025 / Revised: 25 September 2025 / Accepted: 25 September 2025 / Published: 27 September 2025

Abstract

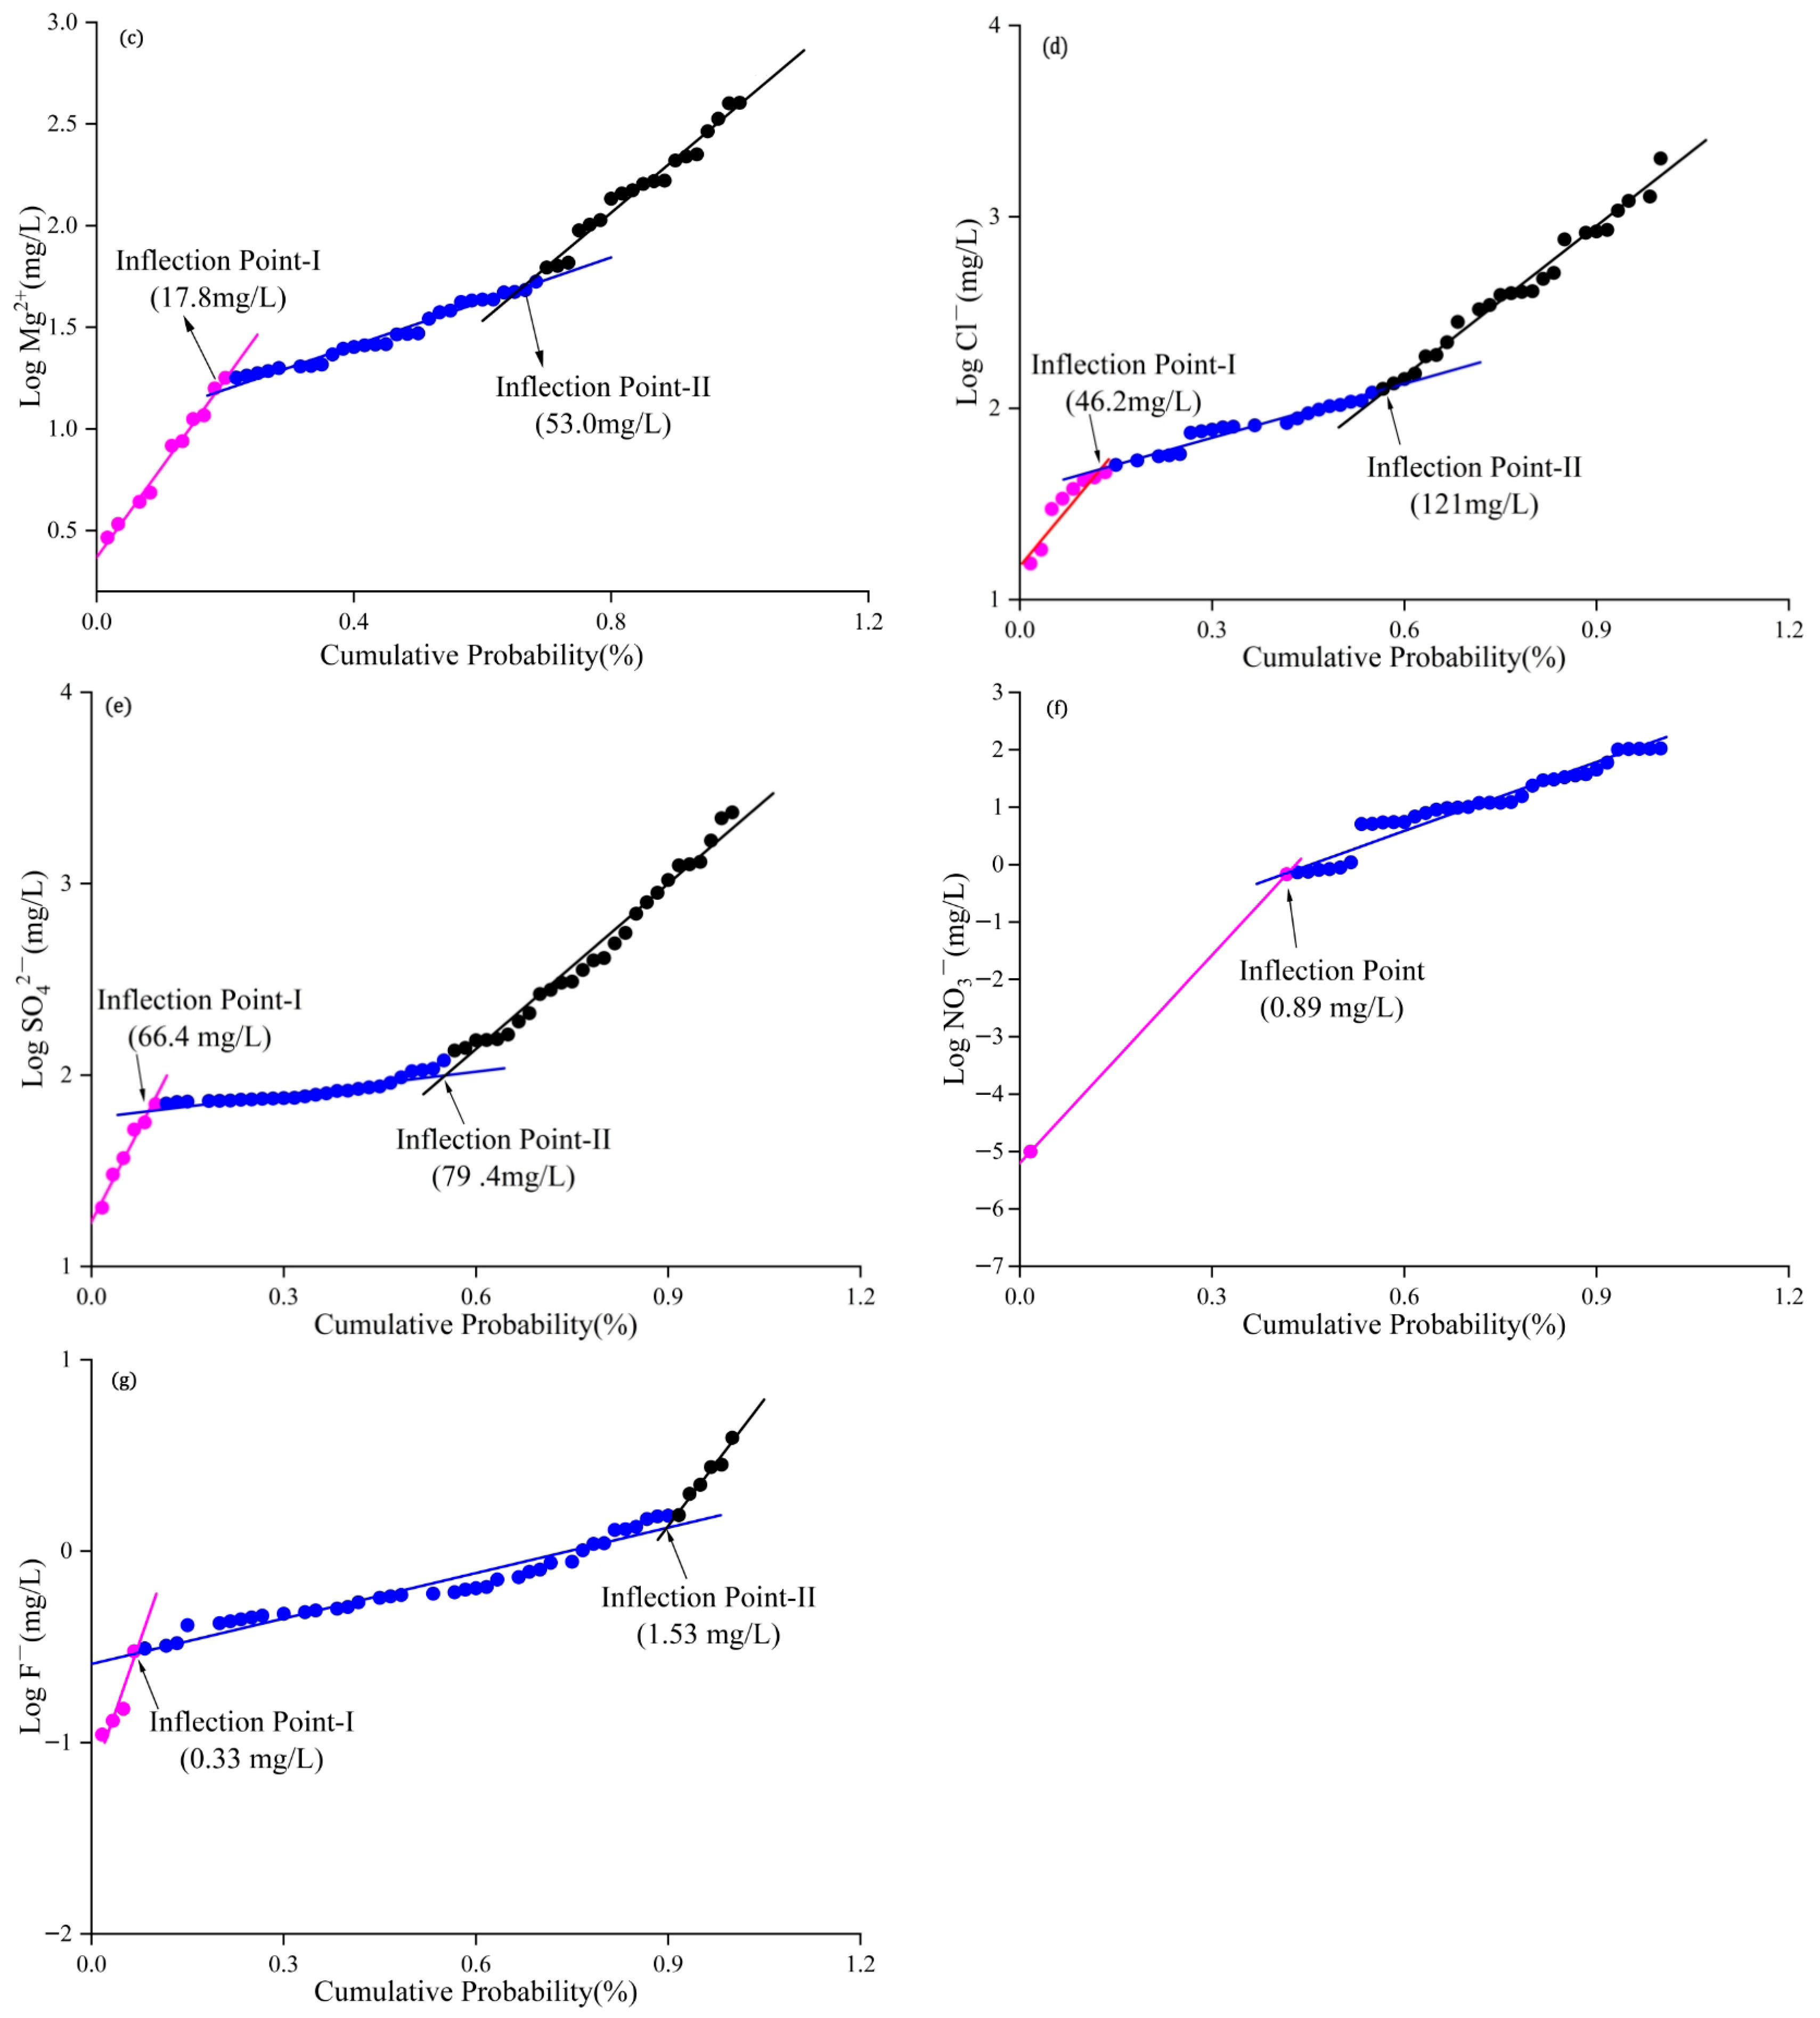
This study investigates the groundwater over-exploitation zone in Xingtai City, North China Plain, to address two critical gaps in the current understanding of groundwater chemistry: the lack of established natural background levels (NBLs) and the ambiguous mechanisms of groundwater contamination. Sixty shallow-groundwater samples were collected and analyzed using a combination of Piper diagrams, cumulative-probability statistics, contamination-index methods, and multivariate statistical techniques to determine NBLs and threshold values (TVs) for major chemical constituents and to clarify the contamination mechanisms. The results indicate that the groundwater is weakly alkaline, with the most prevalent water types being HCO3–Na and SO4·Cl–Na. The NBLs for Na+, Ca2+, Mg2+, Cl, S O 4 2 and N O 3 are 32.3 mg/L, 34.1 mg/L, 17.8 mg/L, 46.2 mg/L, 66.4 mg/L and 0.886 mg/L, respectively, and the corresponding TVs are 116 mg/L, 54.6 mg/L, 33.9 mg/L, 248 mg/L, 258 mg/L and 44.7 mg/L. Based on the TVs, 56.7% of the sampling sites are identified as anthropogenically contaminated. Principal component analysis reveals that groundwater over-extraction, industrial activities and water–rock interaction are the dominant drivers of groundwater contamination, whereas intensive abstraction, agricultural fertilization and domestic sewage discharge exert additional influence. The findings provide a scientific basis for pollution control and sustainable utilization of groundwater in over-exploited regions.

1. Introduction

Natural background levels (NBLs) of groundwater are fundamental for scientifically identifying contamination and establishing water-quality protection standards [1]. They not only reflect the intrinsic concentrations of chemical constituents under undisturbed hydrogeological conditions, but also serve as critical thresholds for distinguishing natural geochemical processes from anthropogenic impacts [2]. However, groundwater chemistry is influenced by a complex interplay of factors, including geological settings, climate, land use, and human activities [3]. Under the influence of intensive anthropogenic pressures, groundwater is currently threatened by diffuse agricultural pollution, as well as point sources such as industrial effluents and domestic sewage [4]. Accurate delineation of regional NBLs is essential for safeguarding drinking-water security and supporting the sustainable use of water resources.
In recent years, substantial advancements have been made globally in the determination of groundwater NBLs and the characterization of contamination. Urresti-Estala et al. [5] employed statistical, iterative and distribution-function methods to establish NBLs in Milan, Italy, and the Guadalhorce River basin, Spain, respectively. Their research revealed that industrial wastewater discharge and agricultural fertilizer application are primary factors causing concentrations to exceed NBLs and triggering contamination. Zhou et al. [6] demonstrated that agricultural activities are the primary driver of elevated NBLs and subsequent contamination in the Xi’an alluvial plain. Furthermore, numerous studies have investigated contamination mechanisms and controlling factors: in rapidly urbanizing areas, groundwater quality deterioration is mainly attributed to domestic sewage, industrial wastewater and chemical fertilizers [7,8], whereas in coastal zones, seawater intrusion, water–rock interactions, sewage discharge and agricultural pollution dominate [9,10]. Evidently, differing anthropogenic patterns and geological backgrounds among regions lead to distinct contamination mechanisms. With increasing groundwater abstraction, extensive cone-of-depression has formed in many areas, altering both hydraulic and hydrochemical regimes [11] and exacerbating groundwater quality degradation. Nevertheless, investigations into NBLs and contamination mechanisms in over-exploited zones remain scarce, constraining effective groundwater protection in such regions.
Consequently, this study selects Xingtai City in the North China Plain as the study area. Xingtai hosts the largest groundwater depression cone in China and represents a critical agricultural and industrial base. Groundwater over-extraction and quality deterioration are severe in this region. The aquifer system is subject to both naturally elevated geochemical backgrounds and anthropogenic contamination. The NBL characteristics and contamination mechanisms in this region may thus differ markedly from those reported elsewhere. This study employs cumulative probability methods, contamination index methods, and multivariate statistical techniques to determine NBLs, elucidates hydrochemical signatures driven jointly by natural and anthropogenic factors, and clarifies the mechanisms of water-quality deterioration. The results provide a scientific basis for rational groundwater development and contamination control in over-exploited regions.

2. Materials and Methods

2.1. Study Area

The study area is situated in the central-eastern part of Xingtai City, Hebei Province, China, covering a total area of 12,414 km2, 70.8% of which is the plain region. Xingtai has a north-temperate continental semi-arid monsoon climate with four distinct seasons. The multi-year mean air temperature is 13.5 °C. Precipitation is concentrated mainly in July and August, with a multi-year mean of 519.7 mm, whereas the multi-year mean evaporation is 1953 mm [12].

2.2. Geological and Hydrogeological Setting

Xingtai city is located in the North China Platform in terms of regional geology. The western part is the Taihang Mountains, while the eastern part is the North China Plain. The aquifer system comprises primarily porous and karstic aquifer. Porous aquifer is dominant in the central and eastern plains, while karstic aquifer is primarily found in the western mountainous area; the present study focuses on the porous aquifer in the central and eastern plains. Carbonate rocks are widely distributed in the area. The regional groundwater flow direction is from west to east. Recharge sources include atmospheric precipitation, surface-water infiltration and irrigation return flow; discharge is dominated by artificial abstraction.

2.3. Sampling and Analytical Procedures

In May 2024, 60 shallow-groundwater samples were collected (Figure 1). Polyethylene bottles (500 mL) were used for sampling. All bottles were first rinsed with distilled water and then conditioned by rinsing three times with groundwater at the sampling point to ensure sample integrity. A submersible pump was employed for purging and sampling. A 1-inch submersible pump was used for well purging and sampling at a pumping rate of 1–3 L/min, with a purge volume of 100 L. Each well was purged until field pH and EC stabilized before sample collection. Each sample was split into two aliquots: one aliquot for cation analysis (Na+, K+, Ca2+ and Mg2+) was acidified on site with ultrapure nitric acid to pH < 2; the second aliquot for anion analysis (Cl, S O 4 2 , F and N O 3 ) was left unacidified. All bottles were filled without headspace, stored in the dark at 4 °C and analyzed within one week of collection.
Field pH was measured with a portable multi-parameter analyzer (Hach-HQ40D, Hach Company, Shanghai). Cations (K+, Na+, Ca2+ and Mg2+) were determined by atomic absorption spectrophotometry (AA240FS/GTA120, Agilent Technologies, Santa Clara, CA, USA). Anions (Cl, S O 4 2 , F and N O 3 ) were analyzed by ion chromatography (CIC-D180, Qingdao Shenghan Chromatography Technology Co., Ltd., Qingdao, China). H C O 3 was measured by hydrochloric-acid titration. Total hardness (TH) was determined by EDTA titration, and total dissolved solids (TDS) by the drying-gravimetric method.
Following analysis, charge-balance errors for cations and anions were calculated and constrained to <5% to ensure data reliability.

2.4. Methodology

2.4.1. Determination of Hydrochemical Facies

The Piper trilinear diagram is commonly employed to portray the overall hydrochemical type of individual water samples; however, it does not directly provide the relative proportions of the different facies encountered within a dataset [13]. Consequently, it is used in conjunction with the Kurlov formula, in which anions and cations are ranked according to their milliequivalent percentages, and only those ions exceeding 25% of the total anionic or cationic charge participate in the classification [14]. This combined approach enables both the identification of the prevailing hydrochemical facies and the quantification of their areal frequencies.

2.4.2. Calculation of NBLs

Cumulative-probability plots, widely accepted for partitioning hydrochemical datasets into distinct populations [15], allow an intuitive delineation of the NBLs for single or multiple constituents.
Let the cumulative distribution function be F(X), where F(X) = Pr (X ≤ x). For a discrete random variable X, F(x) is expressed as
F ( X ) = k = 1 n P r ( X = x k )
in which xk denotes the largest value in X that does not exceed x, thereby defining the upper bound for cumulative-probability evaluation.
The first inflection point on the cumulative-probability curve separates the first, geogenic population from subsequent populations [16]; the abscissa of this inflection is adopted as the NBLs for the constituent under consideration.

2.4.3. Calculation of TVs

Given that hydrogeological settings and the intensity of anthropogenic pressures vary across regions, the groundwater-quality criteria required for each area also differ accordingly. Consequently, the natural background level (NBL) of each hydrochemical constituent is compared with the Grade-III groundwater quality standard of China or the corresponding guideline value recommended by the World Health Organization, which are adopted as the reference value (REF). The TVs is then calculated using the BRIDGE methodology [17], as expressed by the following equations:
TV = (REF + NBL)/2    If   NBL < REF
TV = NBL    If    NBL > REF
Establishing the TVs for groundwater hydrochemistry enables a more accurate assessment of the contamination status. Any constituent whose concentration exceeds its respective TV can be defined as water-quality pollution resulting from anthropogenic activities.

2.4.4. Determination of Pollution Load

The contamination percentage (%) for each well was calculated using the pollution index proposed by Pacheco and van der Weijden [18] and subsequently refined by Soumya et al. [19].
P e r c e n t a g e   o f   P o l l u t i o n   I n d e x   ( P P I ) = [ C l ] + [ S O 4 2 ] + [ N O 3 ] [ C l ] + [ S O 4 2 ] + [ N O 3 ] + [ H C O 3 ] × 100
In the equation, all ionic concentrations are expressed in meq·L−1. By examining the relationship between the pollution load and the relevant ionic ratios, the provenance of contaminants can be inferred.

2.4.5. Identification of Controlling Factors Using Principal Component Analysis (PCA)

PCA is a multivariate statistical technique that employs an orthogonal linear transformation to reduce the dimensionality of a complex, correlated dataset into a smaller set of uncorrelated principal components. These components capture the dominant structures and patterns within the data and thereby facilitate the identification of the principal factors governing groundwater contamination [20]. In recent years, PCA has been widely applied to the identification of pollution sources in soil and water environmental pollution [21].

3. Results and Discussion

3.1. Hydrochemical Characteristics of Groundwater

Table 1 summarizes the descriptive statistics for twelve parameters: pH, K+, Na+, Ca2+, Mg2+, H C O 3 , Cl, S O 4 2 , N O 3 , F, TH and TDS. The pH values range from 6.78 to 8.47, with a mean of 7.84, indicating weakly alkaline conditions; none of the samples exceed the permissible limit. The mean TH and TDS are 533 mg/L and 1271 mg/L, respectively. Notably, 40.0% of the samples exceed the standard for TH, and 33.3% exceed the standard for TDS.
Among cations, the mean concentrations decrease in the order Na+ (285 mg/L) > Ca2+ (86.7 mg/L) > Mg2+ (74.7 mg/L) > K+ (2.21 mg/L); with exceedance rate for Na+ is 38.3%. For anions, the order is H C O 3 (405 mg/L) > S O 4 2 (344 mg/L) > Cl (301 mg/L) > N O 3 (16.0 mg/L), with exceedance rates of 33.3% for Cl, 31.7% for S O 4 2 and 8.33% for N O 3 . The elevated concentrations and high coefficients of variation for both anions and cations reflect strong anthropogenic impacts [23] and pronounced spatial heterogeneity in geological background and human activities.

3.2. Hydrochemical Facies

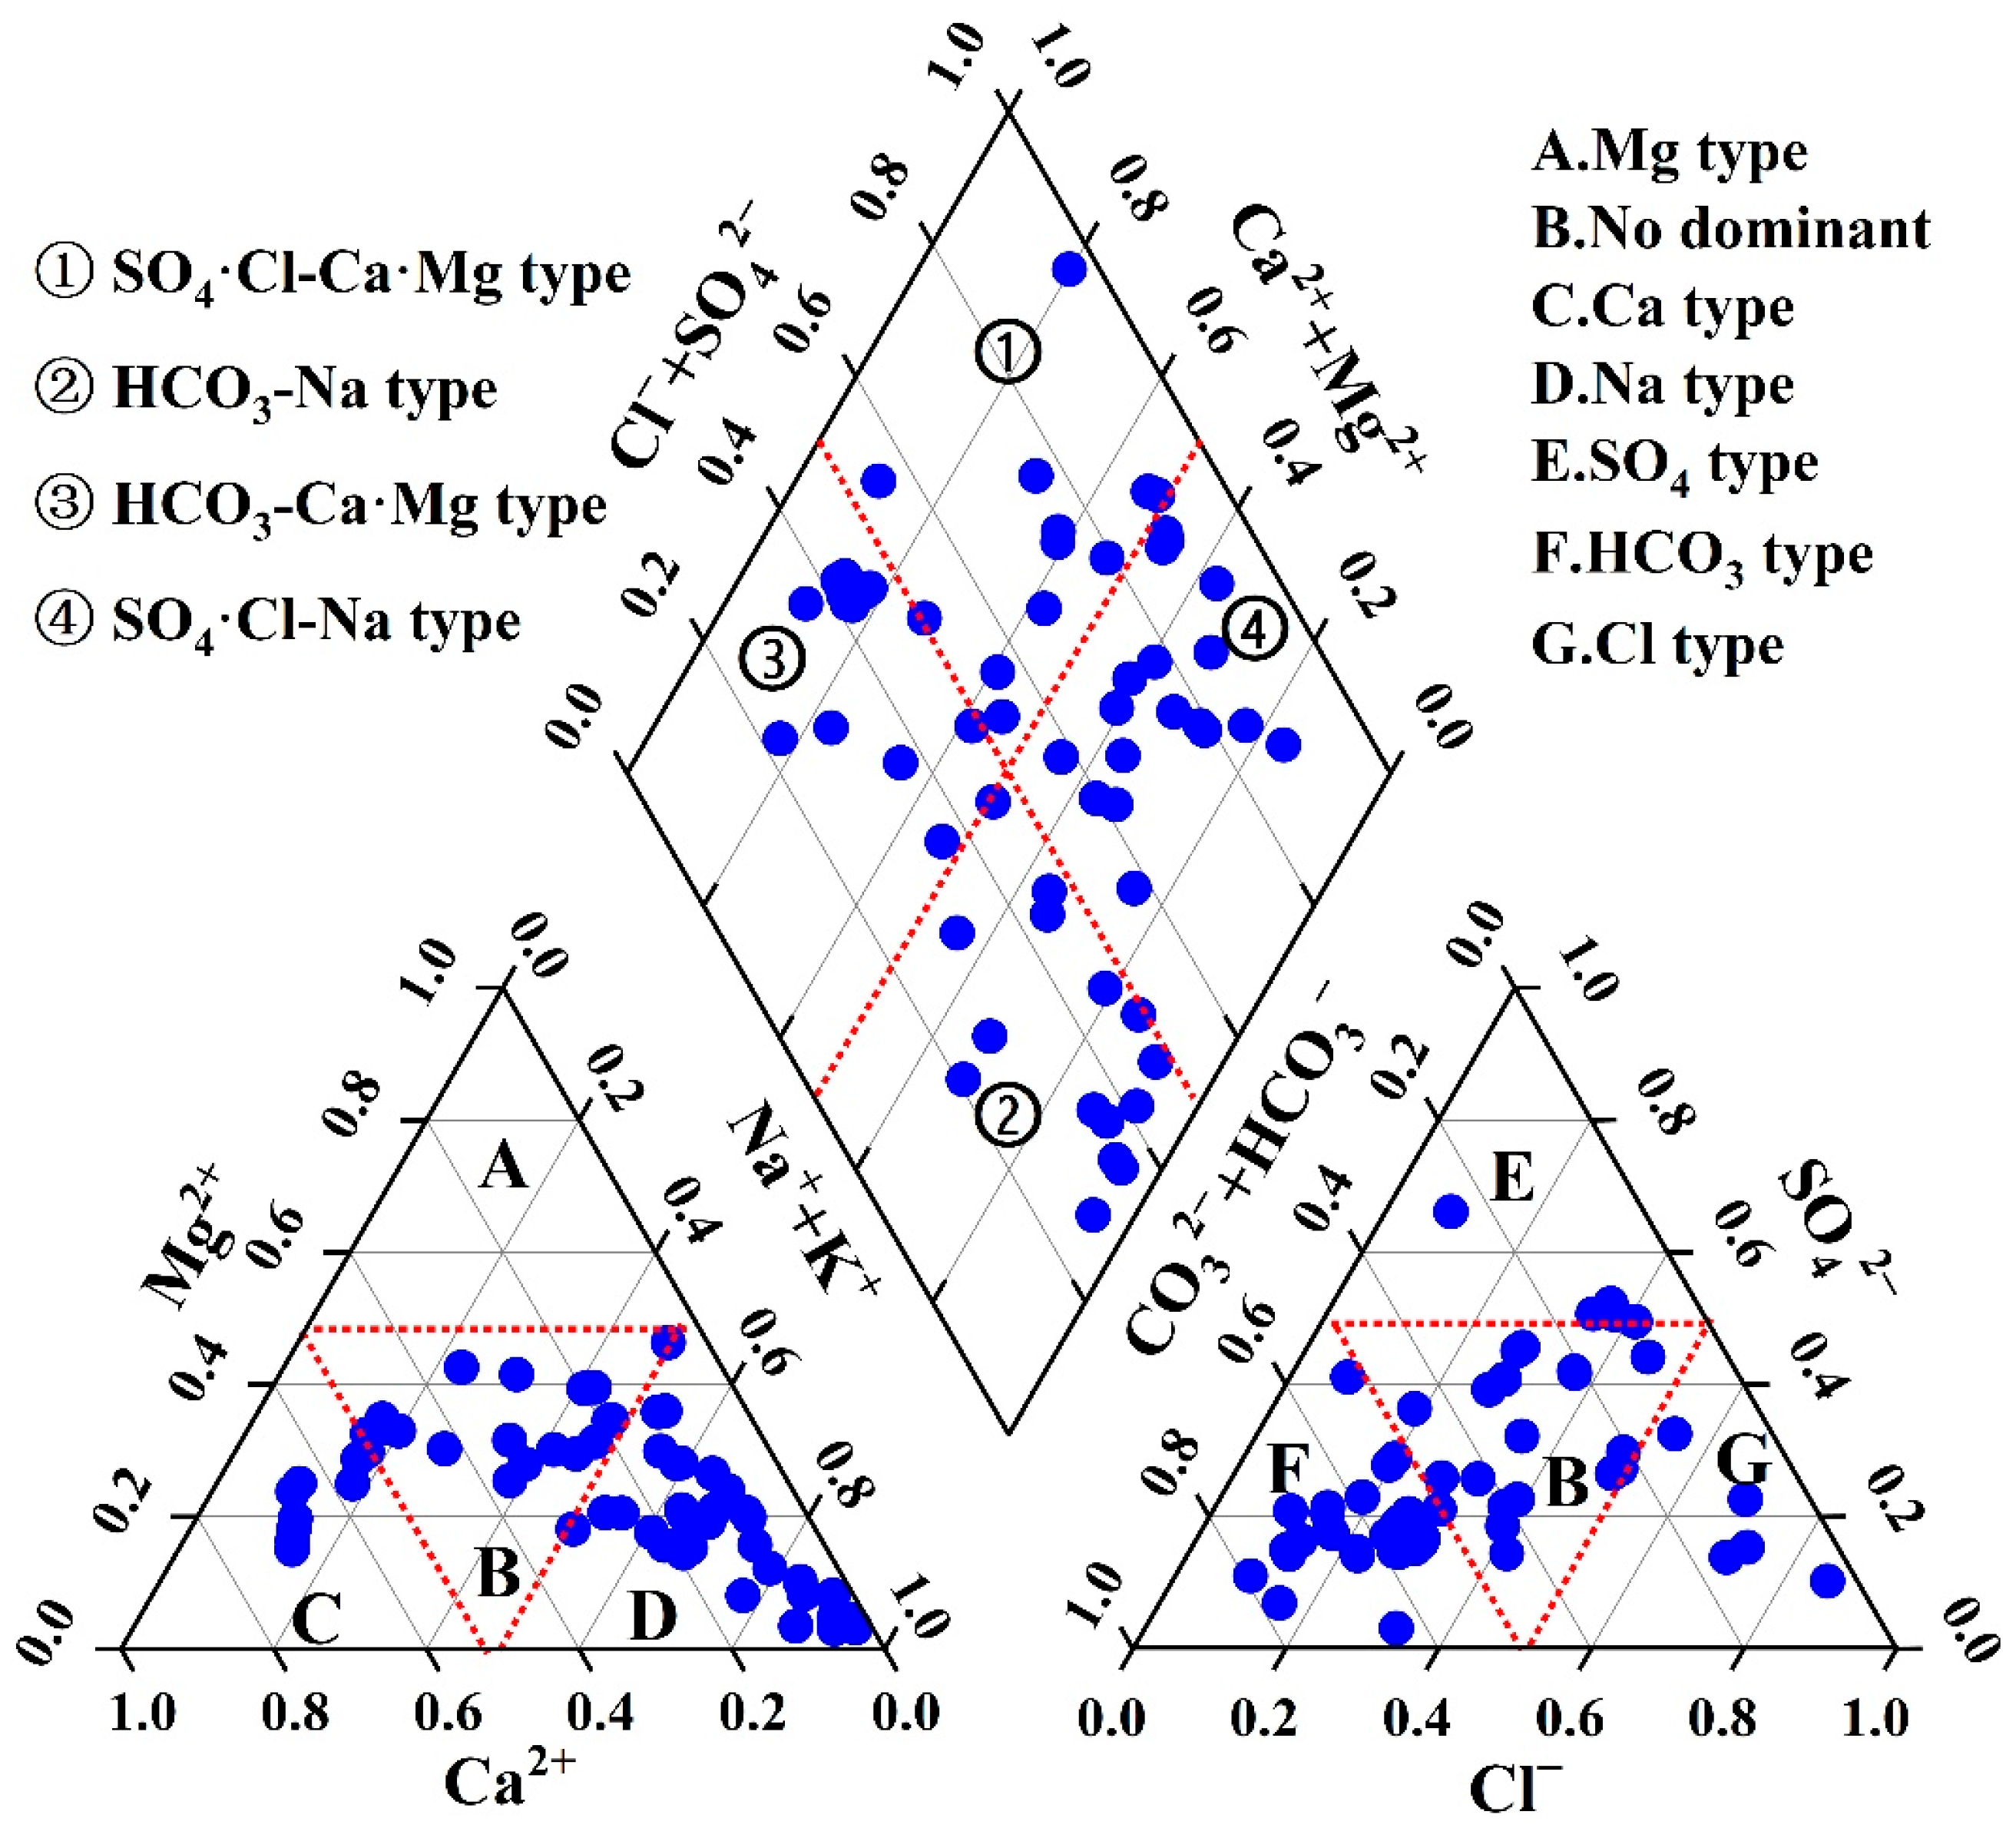
A Piper diagram was constructed to classify the hydrochemical types of the study area. The results show that Na+ dominates among cations (field D), and H C O 3 dominates among anions (field F) (Figure 2).
Application of the Kurlov classification further indicates that the 60 samples represent 20 distinct hydrochemical facies, attesting to the complexity of the groundwater chemistry. The predominant types—HCO3–Na, SO4·Cl–Na·Ca, SO4·Cl–Na, HCO3·Cl–Na and HCO3·Cl–Ca·Mg—account for 15.0%, 10.0%, 8.3%, 8.3% and 8.3% of the samples, respectively. The predominance of Na+ and H C O 3 is generally associated with aquifers rich in carbonate and silicate minerals [24]. Conversely, the occurrence of the SO4·Cl–Na·Ca facies suggests that the influence of industrial effluents or agricultural activities [25].

3.3. Controlling Factors and Sources of Major Ions

3.3.1. Controlling Factors

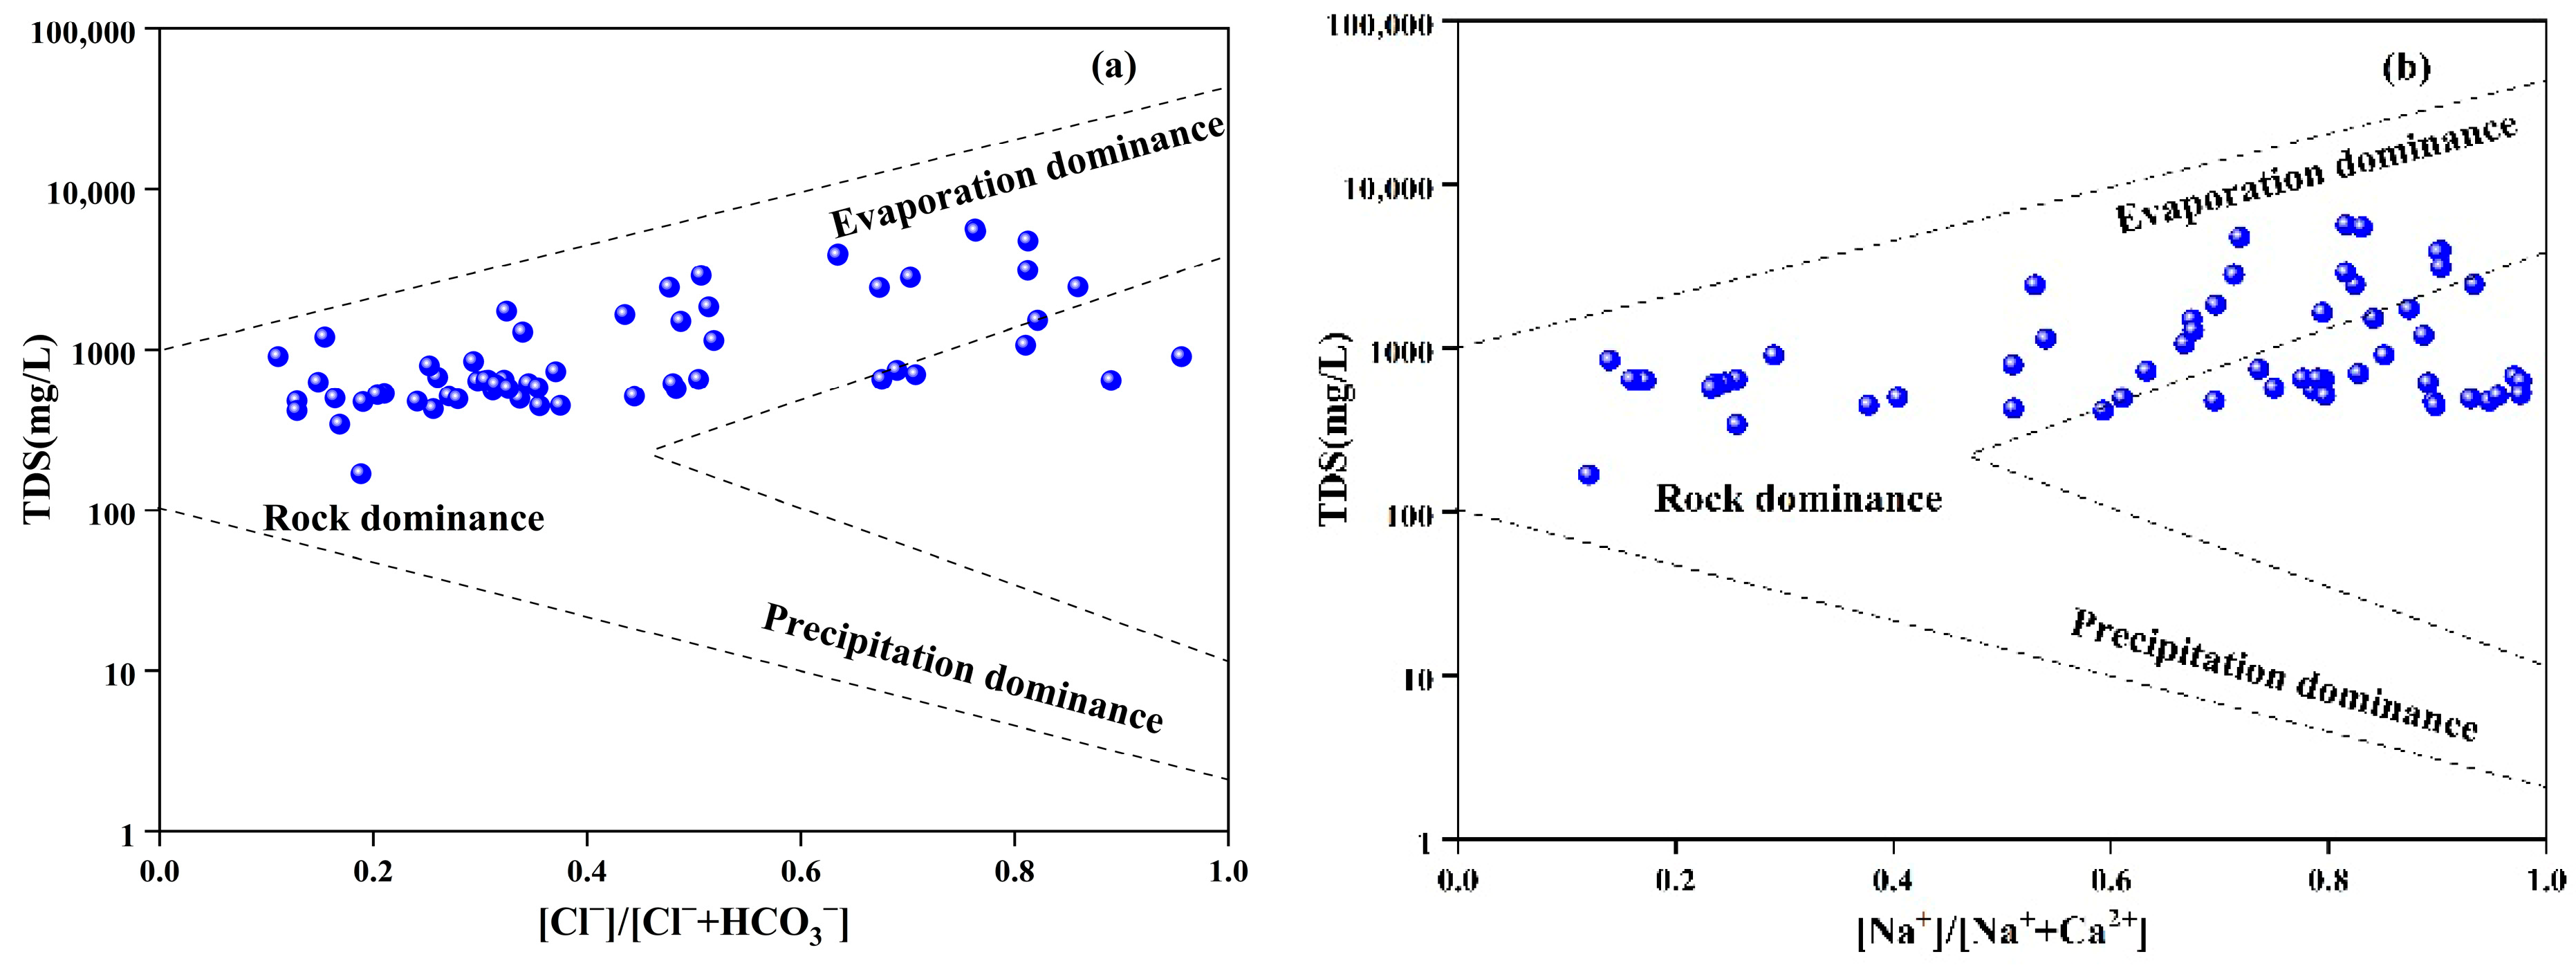
The evolution of groundwater chemistry is primarily governed by rock weathering, precipitation, and evaporation processes [26]. Gibbs diagrams were employed to identify the dominant processes in the study area. Figure 3a,b shows that most samples cluster in the rock-weathering and evaporation–concentration fields, indicating that these two factors are the primary controls on regional groundwater chemistry. A subset of samples plots outside the Gibbs envelope, suggesting additional influence from anthropogenic activities such as agriculture or industry [27].

3.3.2. Ion Sources

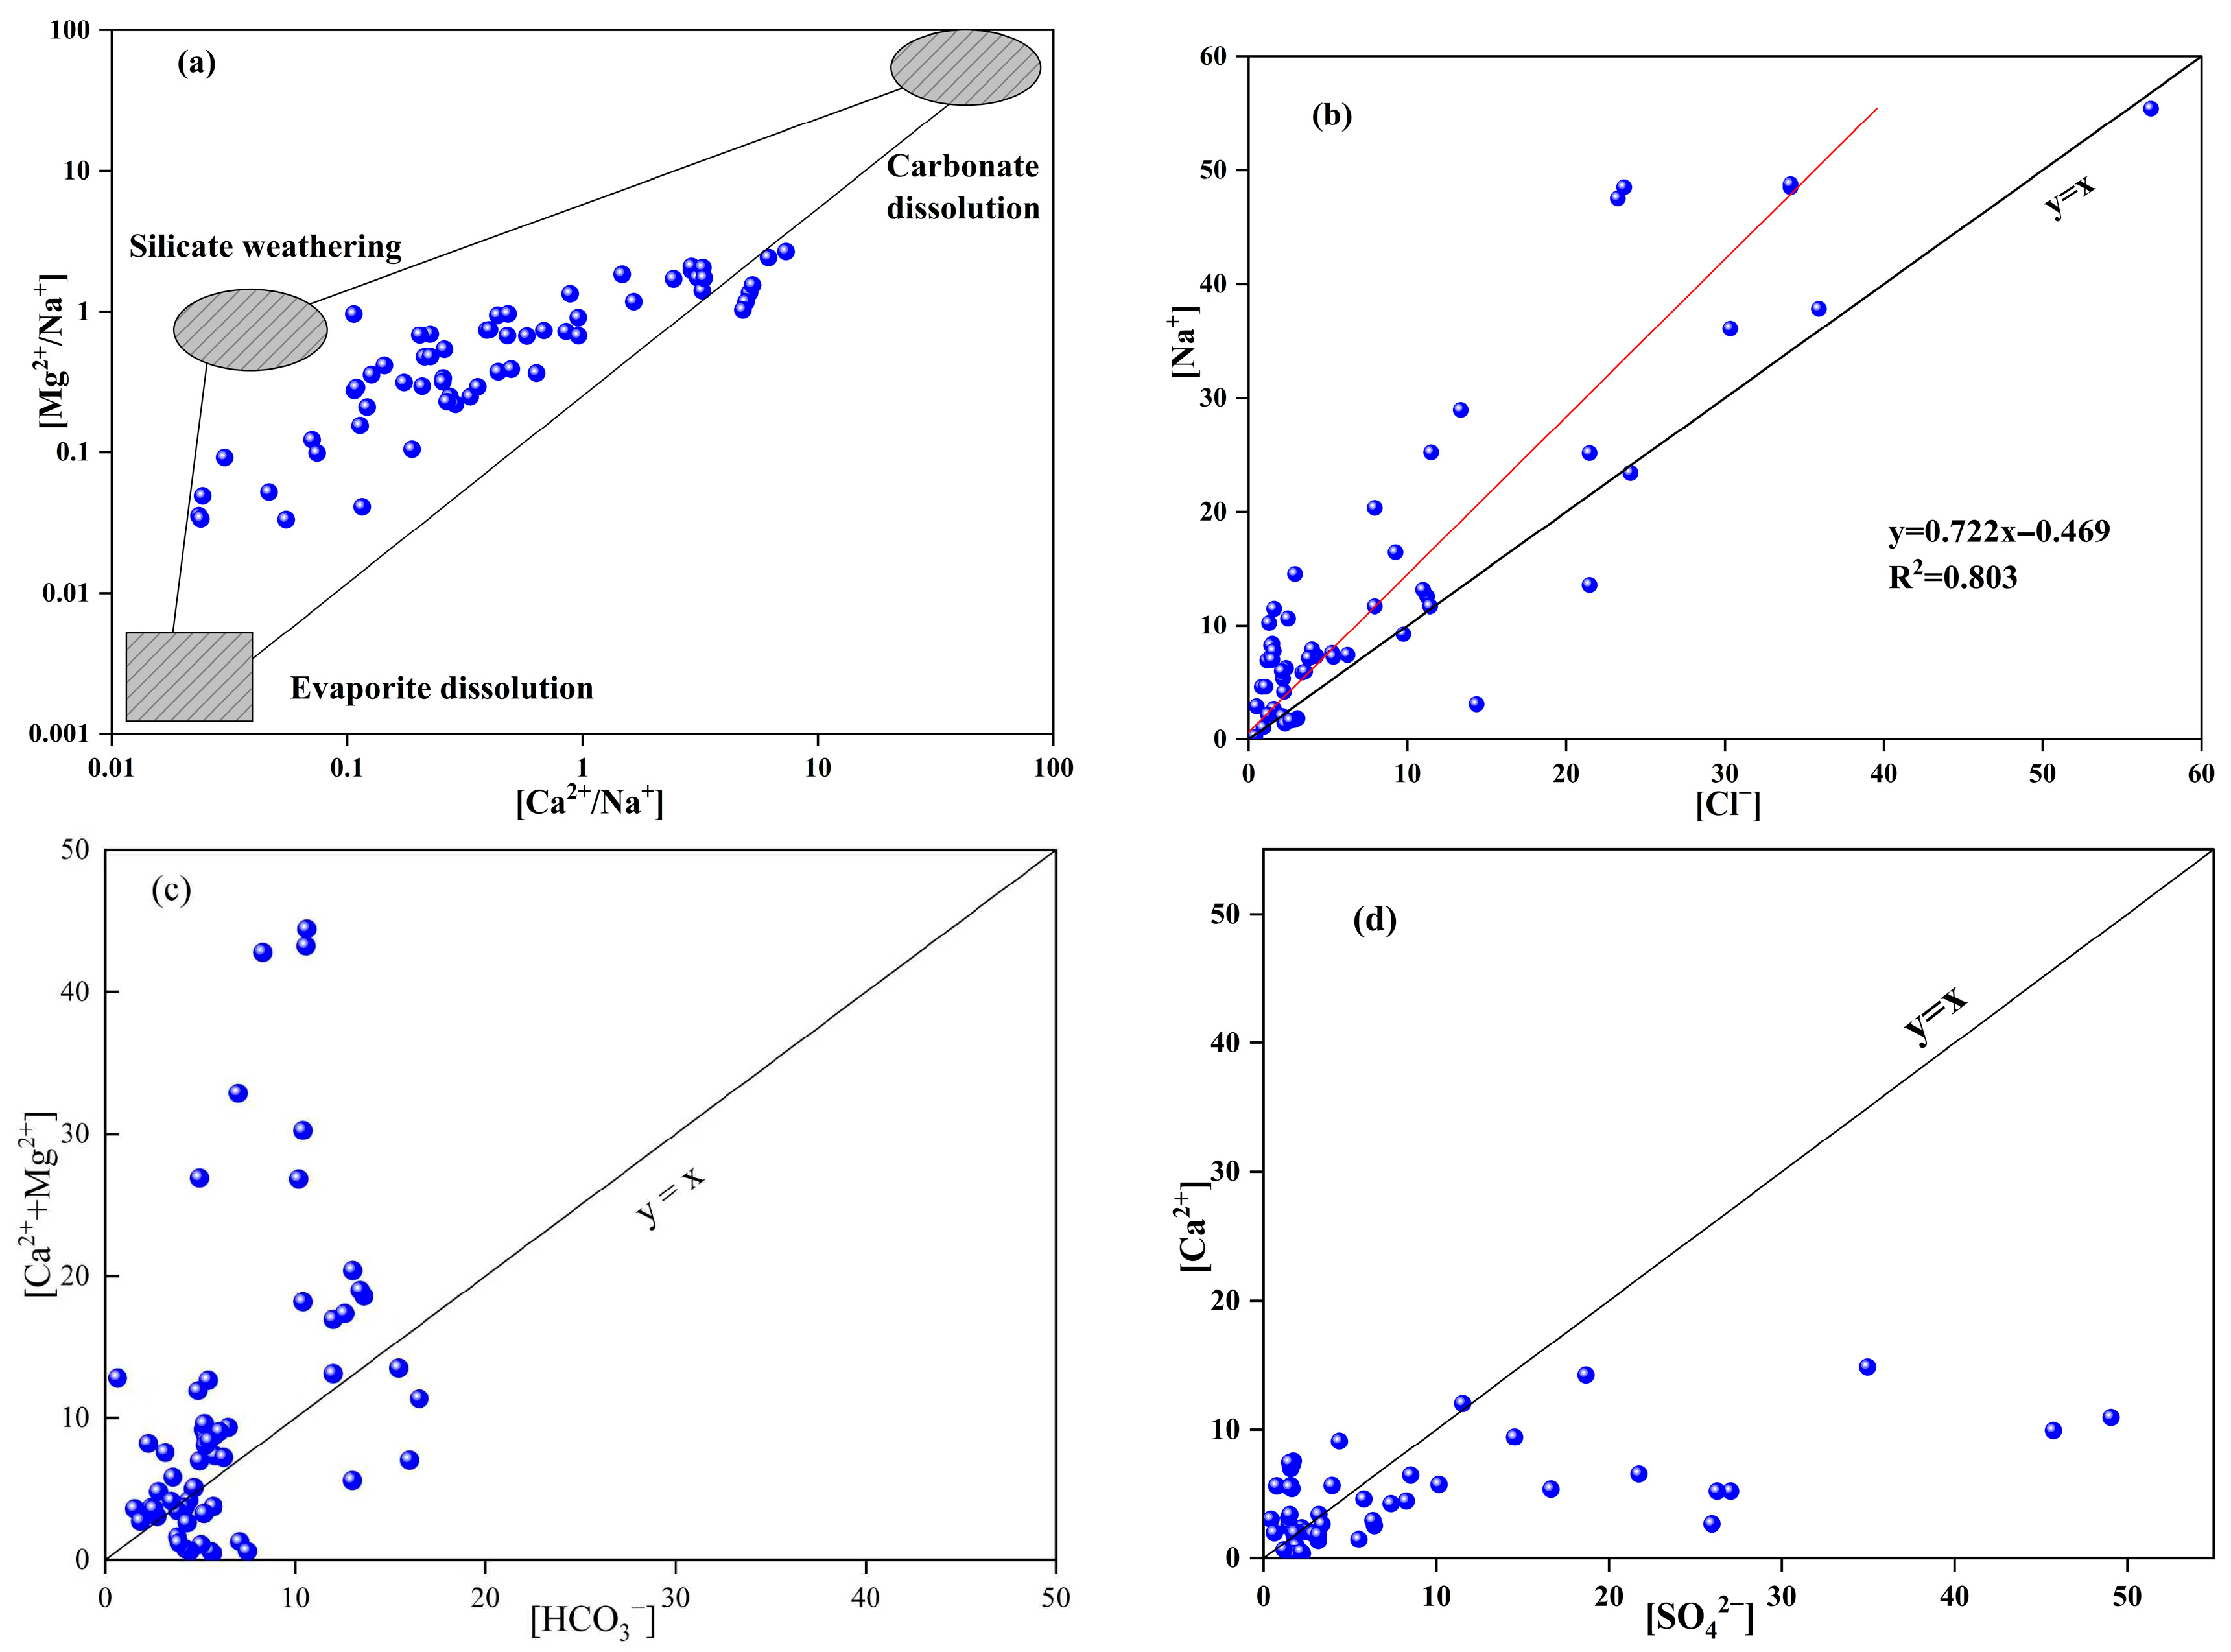
The ion ratio method is commonly used to identify the sources of ionic components in the aqueous environment. Na-normalized molar ratios are used to constrain the lithological end-members governing groundwater composition [28]. Published values indicate that silicate weathering yields Ca2+/Na+ and Mg2+/Na+ molar ratios of 0.35 ± 0.15 and 0.24 ± 0.12, respectively; carbonate weathering yields 50 ± 20 and 20 ± 8; and evaporite dissolution yields 0.17 ± 0.09 and 0.02 ± 0.01 [29]. Figure 4a shows that the majority of samples fall within the silicate and carbonate end-member ranges, with only a few approaching the evaporite field, implying that groundwater chemistry is mainly controlled by silicate and carbonate weathering, whereas evaporite dissolution plays a minor role.
The Na+/Cl molar ratio was calculated to further constrain the origin of Na+ and Cl. In Figure 4b, Na+ and Cl exhibit a strong positive correlation (R2 = 0.803), and 86.7% of the samples plot above the 1:1 line. These findings suggest a common source for Na+ and Cl, most likely halite dissolution, while the excess Na+ (points above the 1:1 line) may also originate from silicate weathering or domestic sewage [30].
In natural waters, Ca2+ and Mg2+ are derived mainly from the dissolution of carbonate rocks, silicate minerals and evaporites, whereas H C O 3 predominantly originates from carbonate dissolution and is less affected by anthropogenic inputs [31]. If carbonate dissolution is dominant, the molar ratio of [Ca2+ + Mg2+]/[ H C O 3 ] should approximate 1:1; when evaporites participate, [Ca2+]/[ S O 4 2 ] tends toward 1:1 [32]. Figure 4c indicates that 80.0% of the samples plot above the 1:1 line for [Ca2+ + Mg2+]/[ H C O 3 ], implying that silicate weathering also contributes to Ca2+ and Mg2+ in addition to carbonate dissolution [33]. Figure 4d shows that most samples cluster around the 1:1 line for [Ca2+]/[ S O 4 2 ], confirming the involvement of evaporite (e.g., gypsum) dissolution; however, 78.3% of the samples plot below the 1:1 line, suggesting that the excess S O 4 2 is derived from other sources, such as industrial effluent discharge [34].

3.4. NBLs and TVs of Groundwater Chemical Components in Overexploited Areas

3.4.1. Analysis of NBLs and TVs

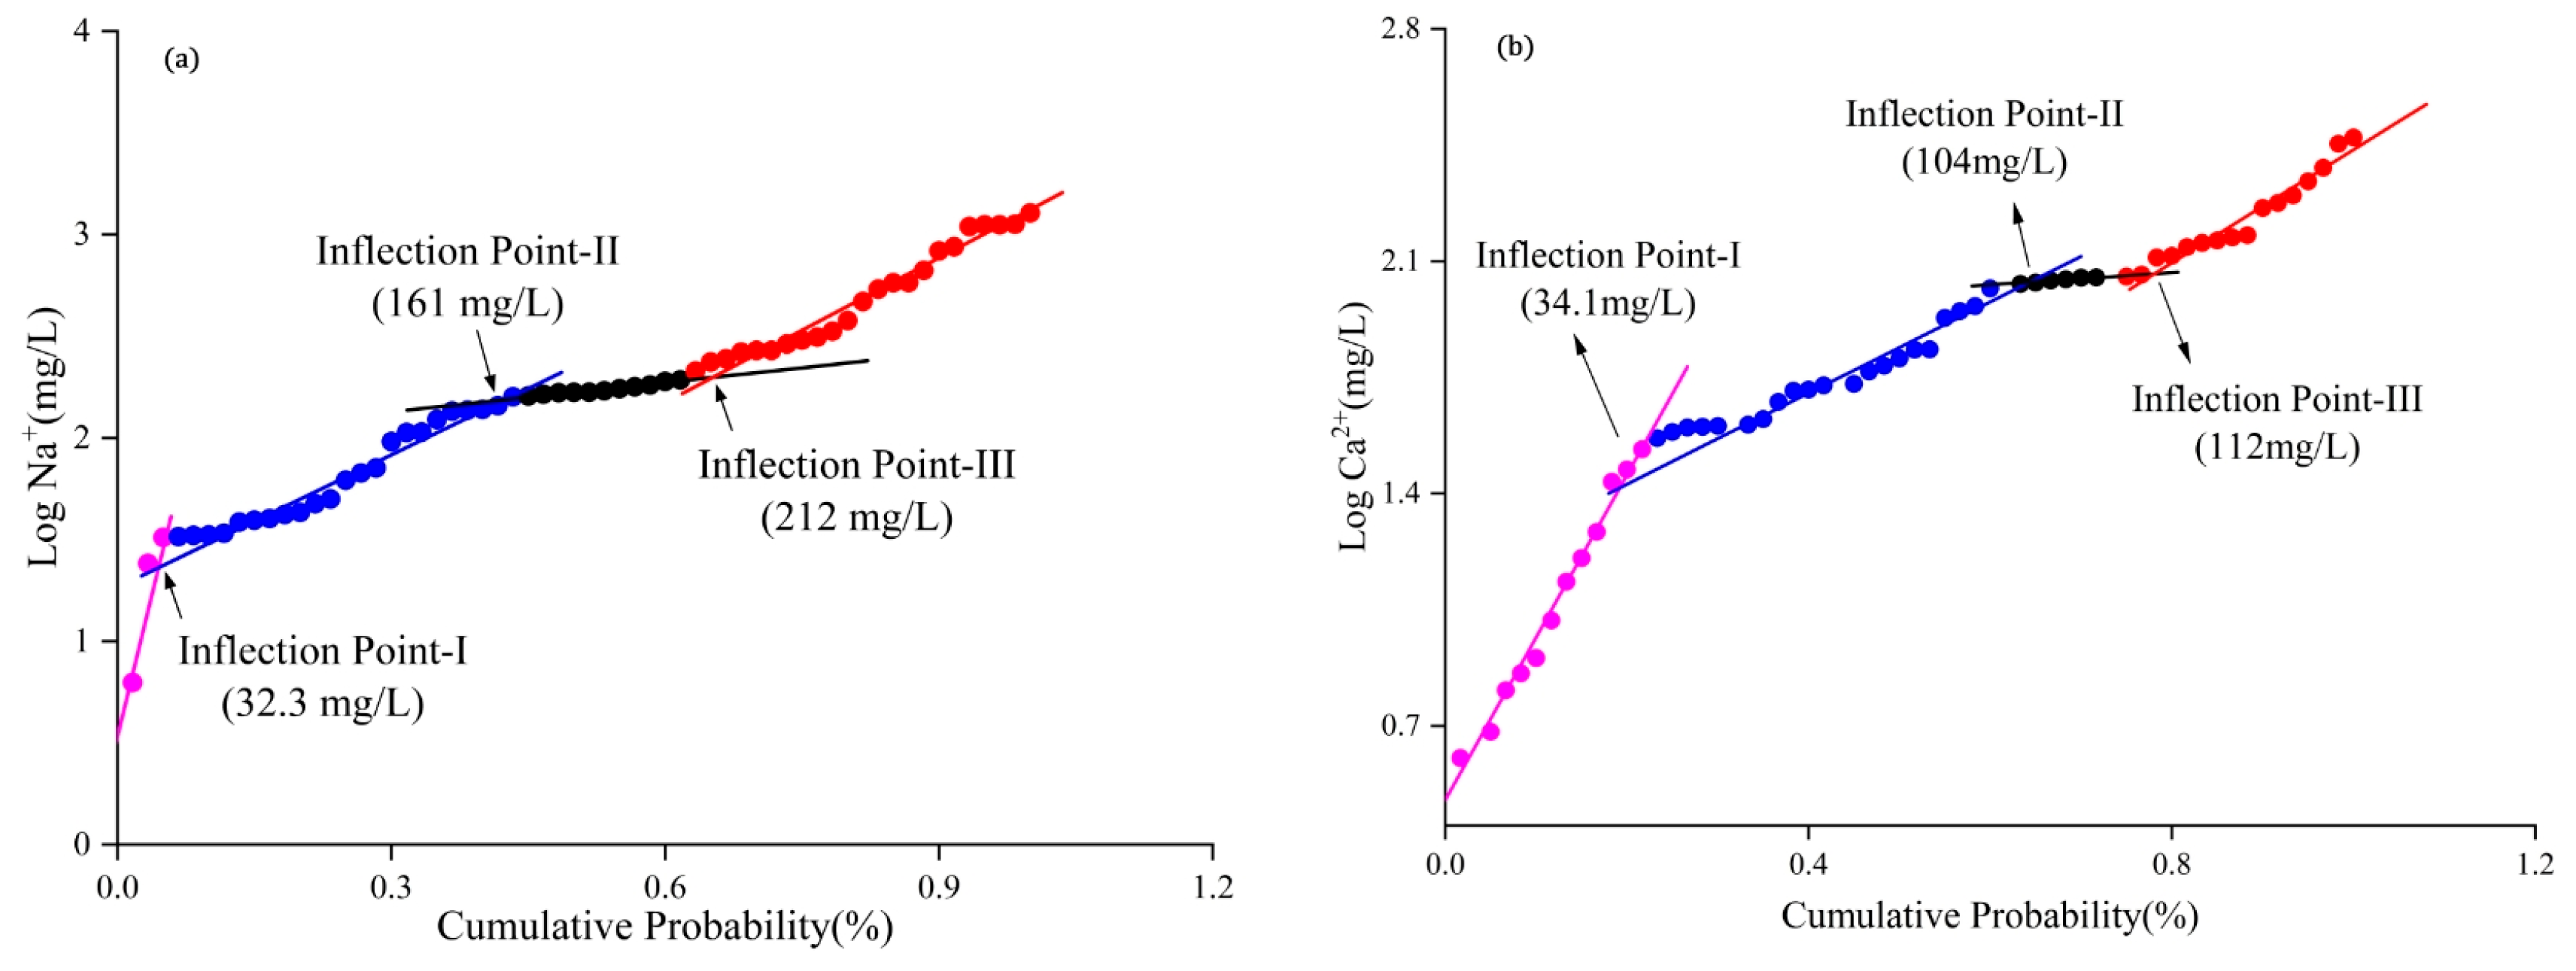
Cumulative-probability diagrams were constructed for Na+, Ca2+, Mg2+, Cl, S O 4 2 , F and N O 3 using the regional hydrochemical dataset. As shown in Figure 5, the abscissa of the first inflection point on each curve was adopted as the NBLs. The derived NBLs are 32.3 mg/L for Na+, 34.1 mg/L for Ca2+, 17.8 mg/L for Mg2+, 46.2 mg/L for Cl, 66.4 mg/L for S O 4 2 , 0.89 mg/L for N O 3 and 0.33 mg/L for F. Based on these, NBLs and TVs were subsequently calculated using Equations (2) and (3) in Section 2.4.3.
Table 2 indicates that all constituents exhibit concentrations above their respective TVs. Over 50% of sampling sites exceed the TVs for Na+, Ca2+ and Mg2+, demonstrating pronounced anthropogenic impacts on groundwater quality.
The cumulative-probability curves further reveal that Mg2+, Cl, S O 4 2 and F display two inflection points, whereas Na+ and Ca2+ display three. The varying numbers of inflection points suggest that multiple, distinct anthropogenic sources, including groundwater over-extraction, agricultural fertilization, and industrial or domestic sewage discharge, are superimposed on the natural background [35].

3.4.2. Comparative Analysis of Groundwater Chemical NBLs in Different Regions

The NBLs of Ca2+ and Mg2+ in the study area (34.1 mg/L and 17.8 mg/L, respectively) are obviously lower than those reported in the Xi’an alluvial plain (76–80 mg/L and 43–184 mg/L) and Slovenia (110 mg/L and 25.9 mg/L) (Table 3). This difference can be attributed to the predominant carbonate rock composition of the unconfined aquifers in the latter two regions, which typically results in elevated concentrations of Ca2+ and Mg2+. Additionally, the NBLs of N O 3 in the study area (0.89 mg/L) is substantially lower than that observed in Milan, Italy (12 mg/L) and Rajasthan, India (26 mg/L). This lower NBLs of N O 3 is likely due to the limited application of fertilizers in the study area compared to the extensive agricultural activities in the latter regions, which have been shown to increase N O 3 background levels. Furthermore, the NBLs of S O 4 2 in the study area and the Xi’an alluvial plain are higher than those in other regions, likely due to the high degree of industrialization in these areas.

3.5. Contamination Characteristics and Controlling Factors in the Over-Exploited Zone

3.5.1. Contamination Characteristics

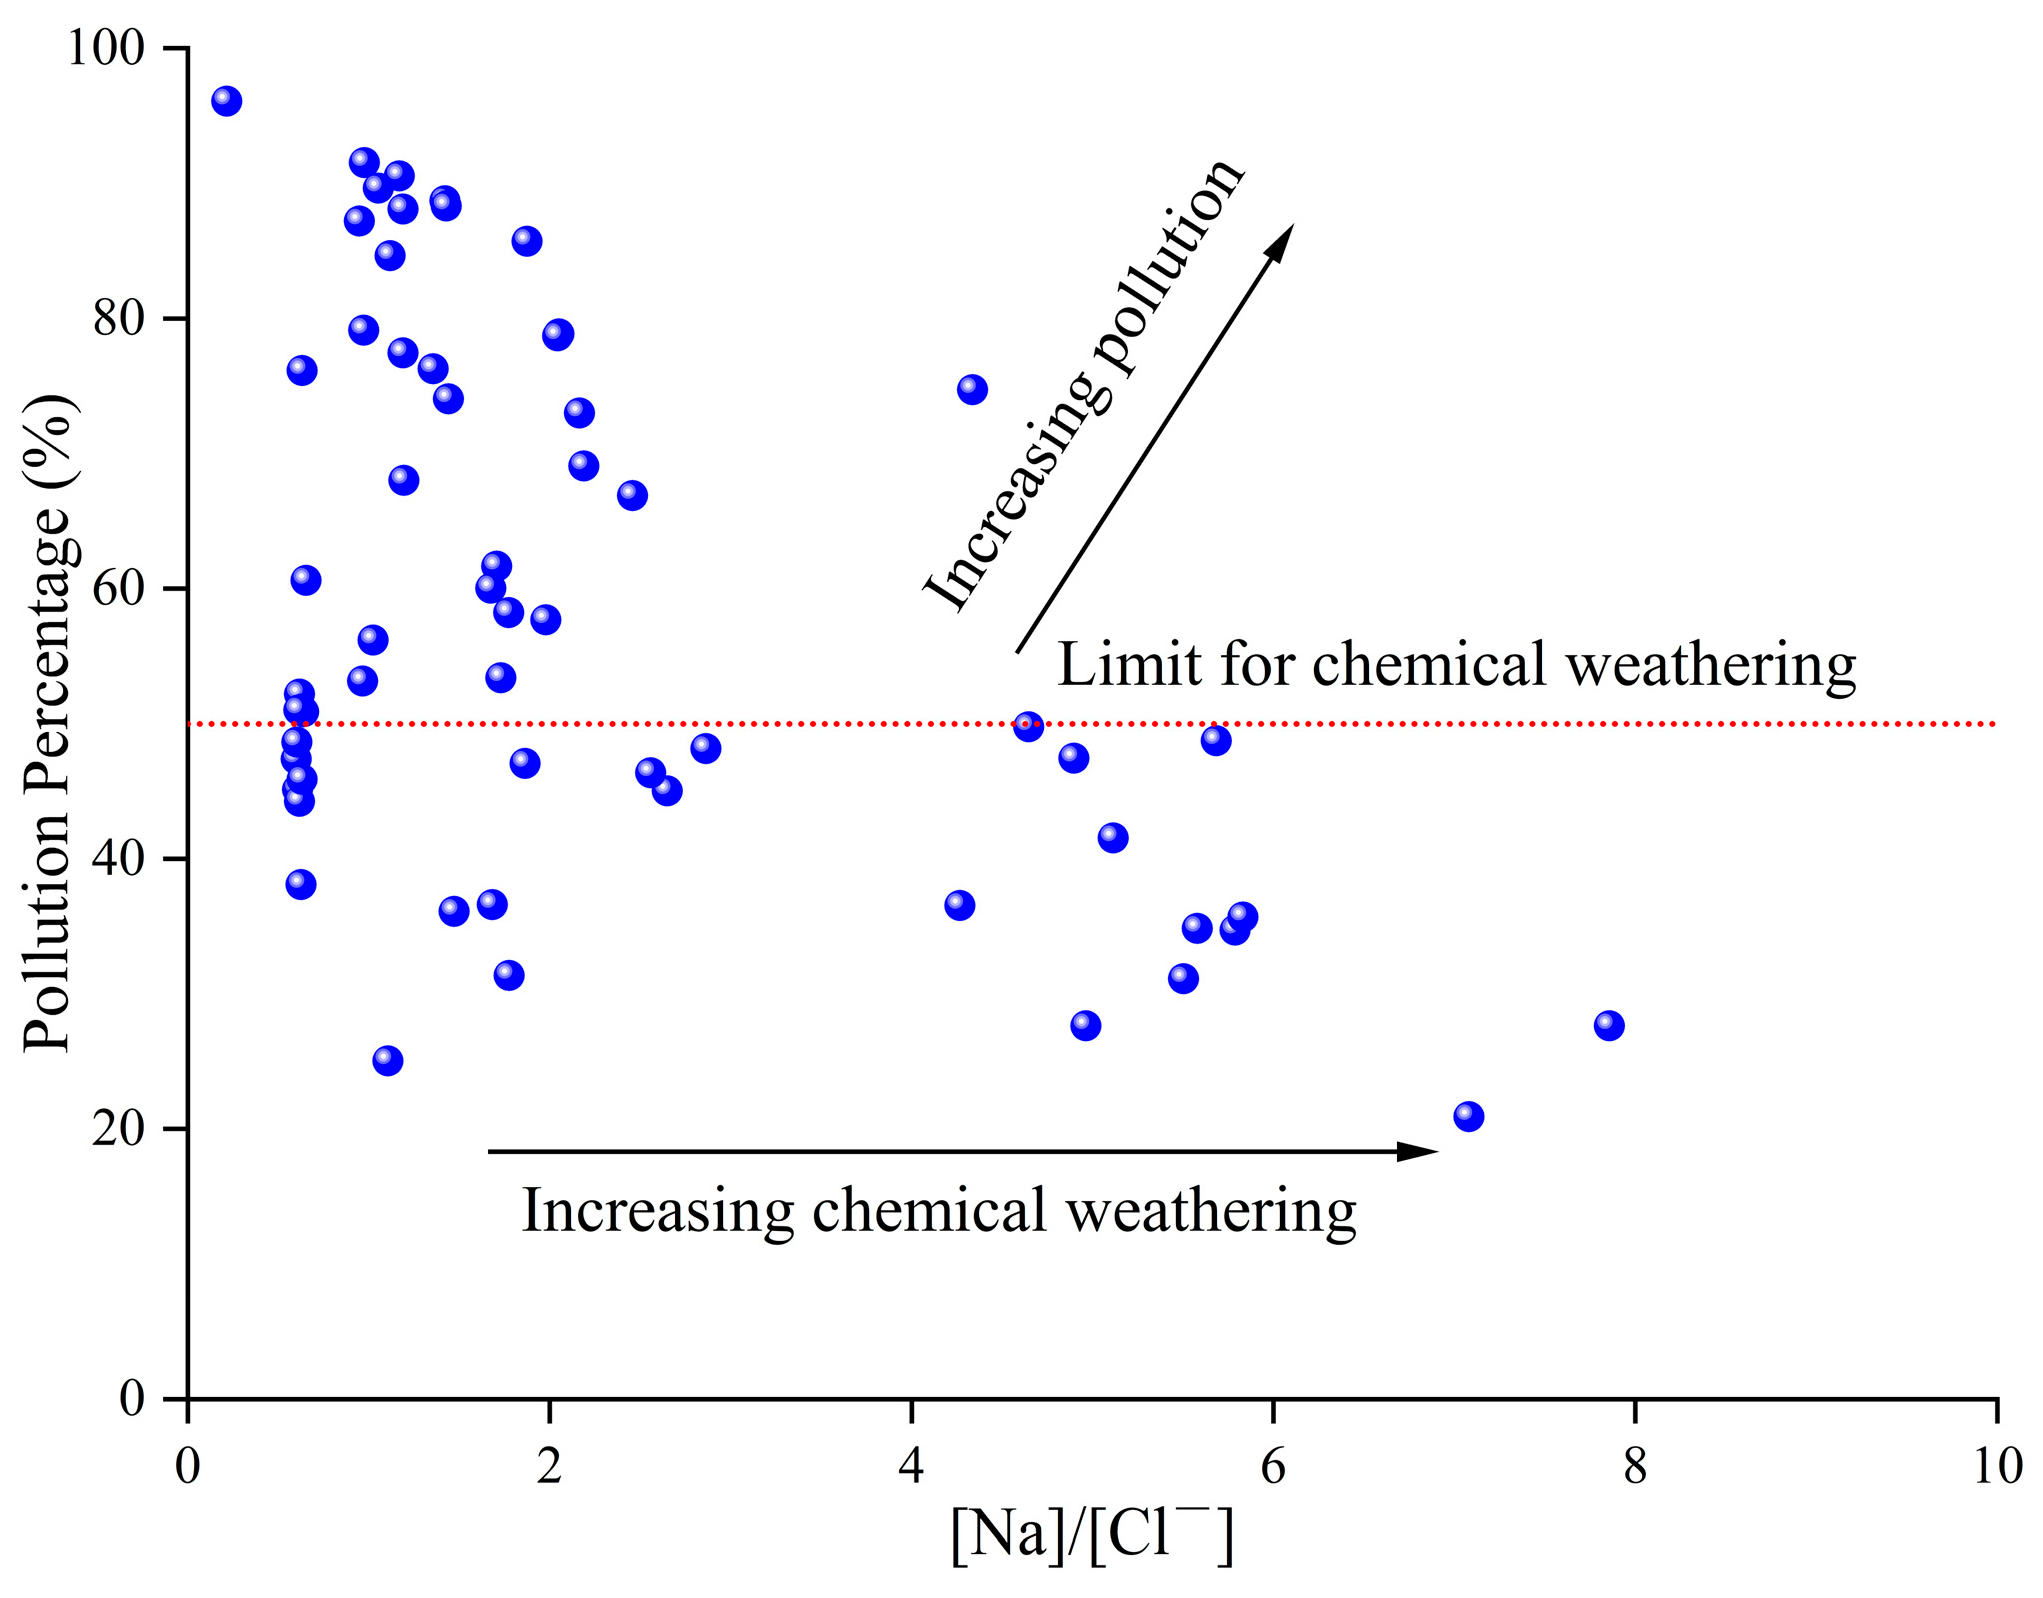
The contamination percentage at each sampling site was calculated using Equation (4) and interpreted in conjunction with the Na+/Cl molar ratio to distinguish between chemical weathering and anthropogenic impacts. Sites with contamination percentages < 50% are considered to be controlled primarily by chemical weathering, whereas those >50% are deemed anthropogenically contaminated. Figure 6 shows that 56.7% of the samples exhibit contamination percentages above 50%, signifying substantial anthropogenic influence.
Combined with the evidence presented in Section 3.3.2, it is concluded that groundwater in the study area is severely affected by intensive abstraction and other human activities. Owing to persistent over-extraction, the regional flow field has been altered, lengthening flow paths and residence times and enhancing mineral dissolution. Consequently, carbonates and silicates within the aquifer are extensively leached, leading to concentrations of Na+, Ca2+, Mg2+, Cland F that exceed the calculated TVs [37]. As demonstrated in Section 3.3.2, S O 4 2 originates from both evaporite dissolution and industrial effluent discharge; the latter is the principal anthropogenic contributor to S O 4 2 concentrations above the threshold. Furthermore, because abstracted groundwater is predominantly used for agricultural irrigation and domestic supply [38], irrigation return flows enriched in nitrogen fertilizers [39] and direct discharge of domestic sewage are responsible for N O 3 contamination, with 11.7% of the sampling sites exceeding the N O 3 threshold.

3.5.2. Controlling Factors of Groundwater Contamination

To elucidate the principal drivers governing groundwater quality deterioration, eleven hydrochemical variables (K+, Na+, Ca2+, Mg2+, Cl, SO42−, H C O 3 , N O 3 , TDS, TH and pH) were subjected to PCA. Prior to modeling, the Kaiser–Meyer–Olkin (KMO) measure and Bartlett’s test of sphericity were applied to verify the suitability of the dataset. The KMO value was 0.632 and Bartlett’s test value was 1 110 (p < 0.001), confirming the adequacy of the data for PCA. Three principal components with eigenvalues > 1 were extracted, together accounting for 51.8%, 18.9% and 14.6% of the total variance (Table 4).
Principal component 1 (PC1) exhibits an eigenvalue of 6.65 and explains 51.8% of the variance. It displays strong positive loadings on S O 4 2 , Mg2+, Cl, TDS, TH, K+, Na+ and Ca2+. As discussed in Section 3.3.2, S O 4 2 is derived primarily from evaporite dissolution and industrial effluents, whereas Na+, Ca2+, Mg2+, Cl, TH and TDS are closely linked to rock weathering and water–rock interaction. Consequently, PC1 is interpreted as the combined influence of water–rock interaction and industrial wastewater discharge.
Principal component 2 (PC2) has an eigenvalue of 1.61 and contributes 18.9% of the variance. It exhibits a strong association with pH and H C O 3 , and a moderate correlation with Mg2+, Ca2+, TDS, and TH. Previous studies have shown that carbonate dissolution tends to depress pH [40]. In the present dataset, pH decreases with increasing concentrations of H C O 3 , Mg2+, Ca2+, TDS and TH, a pattern attributable to intensive groundwater abstraction. Over the past decades, persistent over-exploitation has created a pronounced cone of depression in the study area [41]. The consequent thickening of the unsaturated zone has shifted the hydrochemical regime toward more oxidizing conditions, promoting the oxidation of sulfide minerals, thereby elevating sulfate and TH concentrations while lowering pH [42]. Thus, PC2 is ascribed to the impacts of severe groundwater over-extraction.
Principal component 3 (PC3) possesses an eigenvalue of 1.14 and explains 14.6% of the variance. It is strongly positively loaded on NO3 and moderately correlated with Na+ and Cl. Nitrate in groundwater typically originates from agricultural fertilizers, domestic sewage, industrial effluents, manure and atmospheric deposition [43]. Given that the majority of samples were collected from farmland and villages, agricultural fertilization and domestic wastewater are identified as the principal sources of nitrate. Moreover, domestic sewage is characterized by elevated Na+ and Cl concentrations. Accordingly, PC3 represents the influence of agricultural fertilization and domestic sewage.

4. Limitations and Future Directions

Although this study determined the NBLs and TVs of hydrochemical constituents in an over-exploited aquifer and identified the dominant contamination processes, several limitations remain. First, the temporal variability of groundwater contamination was not addressed, and a systematic analysis of the dynamic evolution of pollution is lacking. Second, source apportionment of dissolved ions relied solely on hydrochemical approaches, yielding only qualitative insights; the specific contributions of individual sources remain unquantified. Furthermore, while PCA elucidated the controlling factors, the relative importance of each factor was not quantitatively assessed.
In view of the above research deficiencies, future research could be carried out in the following directions: (1) implement multi-temporal, high-density sampling campaigns, employ time-series analyses to capture pollution dynamics, and integrate geostatistical interpolation with GIS to refine spatial sampling networks and delineate contamination patterns at finer scales; (2) combine stable-isotope tracers with multivariate statistical techniques to quantitatively apportion ion provenance and to discriminate the contributions of natural versus anthropogenic sources, thereby providing a dynamic and comprehensive scientific basis for groundwater protection.

5. Conclusions

Based on 60 shallow-groundwater samples and the combined application of hydrochemical and multivariate statistical techniques, this study determined the NBLs and TVs of major chemical constituents in a groundwater over-exploitation zone and identified the principal drivers of contamination. The dominant hydrochemical facies are HCO3–Na and SO4·Cl–Na, indicating pronounced anthropogenic influence. Using the established NBLs and TVs, 56.7% of the samples were identified as anthropogenically contaminated, underscoring the necessity of defining NBLs prior to contamination assessment.
The study demonstrates that groundwater over-extraction, industrial activities, water–rock interaction, agricultural fertilization and domestic sewage are the key factors controlling groundwater quality in the over-exploited region. These findings provide a scientific basis for pollution control in such areas. Nevertheless, the temporal dynamics of contamination and the quantitative contributions of individual sources remain inadequately resolved. Future investigations should adopt multi-temporal, high-resolution sampling strategies and integrate isotope tracers to elucidate spatio-temporal pollution evolution and to quantify source-specific contributions, thereby furnishing more comprehensive support for groundwater management and protection.

Author Contributions

Conceptualization, M.W., B.G., H.L., L.Z. and Z.Y.; Methodology, Q.W., Y.L. (Yan Li), B.G. and C.M.; Software, Q.W., Y.L. (Yang Liu) and L.Z.; Validation, Y.L. (Yan Li), L.Z. and Z.Y.; Formal analysis, Y.L. (Yang Liu); Investigation, Q.W., M.W., Y.L. (Yan Li), B.G., H.L., Y.L. (Yang Liu), L.Z. and C.M.; Resources, L.Z.; Data curation, M.W.; Writing—original draft, Q.W.; Writing—review & editing, Z.Y.; Supervision, L.Z. and Z.Y.; Project administration, Z.Y.; Funding acquisition, Z.Y. All authors have read and agreed to the published version of the manuscript.

Funding

This work was supported by the Hebei Key Laboratory of Geological Resources and Environment Monitoring and Protection (Grant No. JCYKT202305), Hebei Provincial Water Resources Science and Technology Program Project (Grant No. 2024-23), Hebei Provincial Project (Grant No. 13000024P00329410255J) and the Report on Investigation and Assessment of Groundwater Environment Status of Prefecture-level centralized Drinking water source in Hebei Province.

Data Availability Statement

The data presented in this study are available on request from the corresponding author. (the data are not publicly available due to privacy restrictions.)

Acknowledgments

The authors gratefully acknowledge the editor and anonymous reviewers for their valuable comments on this manuscript. The authors also appreciate the financial support from the different organizations.

Conflicts of Interest

The authors declare no conflicts of interest.

References

  1. Rahman, A.; Tiwari, K.K.; Mondal, N.C. Assessment of hydrochemical backgrounds and threshold values of groundwater in a part of desert area, Rajasthan, India. Environ. Pollut. 2020, 266, 115150. [Google Scholar] [CrossRef] [PubMed]
  2. De, C.M.; Crosta, G.B.; Frattini, P. Hydrogeochemical characterization and natural background levels in urbanized areas: Milan Metropolitan area (Northern Italy). J. Hydrol. 2017, 547, 455–473. [Google Scholar] [CrossRef]
  3. Kuang, X.; Liu, J.; Scanlon, B.R.; Jiao, J.J.; Jasechko, S.; Lancia, M.; Zheng, C. The changing nature of groundwater in the global water cycle. Science 2024, 383, eadf0630. [Google Scholar] [CrossRef] [PubMed]
  4. Davis, G.B.; Salama, R.B. Modeling point sources of groundwater contamination: A review and case study. In Contamination of Groundwaters; CRC Press: Boca Raton, FL, USA, 2020. [Google Scholar]
  5. Urresti-Estala, B.; Carrasco-Cantos, F.; Vadillo-Pérez, I.; Jiménez-Gavilán, P. Determination of background levels on water quality of groundwater bodies: A methodological proposal applied to a Mediterranean river basin (Guadalhorce River, Málaga, southern Spain). J. Environ. Manag. 2013, 117, 121–130. [Google Scholar] [CrossRef]
  6. Zhou, Y.; Wu, J.; Gao, X.; Guo, W.; Chen, W. Hydrochemical background levels and threshold values of phreatic groundwater in the greater Xi’an region, China: Spatiotemporal distribution, influencing factors and implication to water quality management. Expo. Health 2022, 15, 757–771. [Google Scholar] [CrossRef]
  7. Ijioma, U.D. Delineating the impact of urbanization on the hydrochemistry and quality of groundwater wells in Aba, Nigeria. J. Contam. Hydrol. 2021, 240, 103792. [Google Scholar] [CrossRef]
  8. Ren, C.; Zhang, Q. Groundwater chemical characteristics and controlling factors in a region of Northern China with intensive human activity. Int. J. Environ. Res. Public Health 2020, 17, 9126. [Google Scholar] [CrossRef]
  9. Huang, G.; Sun, J.; Zhang, Y.; Chen, Z.; Liu, F. Impact of anthropogenic and natural processes on the evolution of groundwater chemistry in a rapidly urbanized coastal area, South China. Sci. Total Environ. 2013, 463–464, 209–221. [Google Scholar] [CrossRef]
  10. Qin, R.; Wu, Y.; Xu, Z.; Xie, D.; Zhang, C. Assessing the impact of natural and anthropogenic activities on groundwater quality in coastal alluvial aquifers of the lower Liaohe River Plain, NE China. Appl. Geochem. 2013, 31, 142–158. [Google Scholar] [CrossRef]
  11. Wang, L.; Zhang, Q.; Wang, H. Rapid urbanization has changed the driving factors of groundwater chemical evolution in the large groundwater depression funnel area of Northern China. Water 2023, 15, 2917. [Google Scholar] [CrossRef]
  12. Zhinan, Z.; Lirong, W.; Congmei, W.; Xiaoqing, H. Risk Distribution Characteristics of Rainstorm and Flood Disaster Based on Flood Area Model in the Xiaoma River Basin of Xingtai. J. Arid Meteorol. 2021, 39, 486. [Google Scholar]
  13. Amadi, A.N.; Olasehinde, P.I.; Nwadioha, I.J.; Okunlola, I.A.; Shaibu, I.; Nwakife, C.N. Comparative assessment of groundwater suitability for irrigation and drinking purposes in Agbara and Ota area of Southwestern Nigeria. Int. J. Sci. Glob. Sustain. 2016, 2, 1–12. [Google Scholar] [CrossRef]
  14. Bu, J.; Liu, W.; Pan, Z.; Ling, K. Comparative study of hydrochemical classification based on different hierarchical cluster analysis methods. Int. J. Environ. Res. Public Health 2020, 17, 9515. [Google Scholar] [CrossRef] [PubMed]
  15. Runnells, D.D.; Dupon, D.P.; Jones, R.L.; Cline, D.J. Determination of background chemistry of water at mining and milling sites, Salt Lake Valley, Utah, USA. In Proceedings of the 9th International Symposium on Water-Rock Interaction, Taupo, New Zealand, 30 March–3 April 1998; A A Balkema: Rotterdam, The Netherlands, 1998. [Google Scholar]
  16. Reimann, C.; Filzmoser, P.; Garrett, R.G. Background and threshold: Critical comparison of methods of determination. Sci. Total Environ. 2005, 346, 1–16. [Google Scholar] [CrossRef] [PubMed]
  17. Nayak, A.; Matta, G.; Uniyal, D.P.; Kumar, A.; Kumar, P.; Pant, G. Assessment of potentially toxic elements in groundwater through interpolation, pollution indices, and chemometric techniques in dehradun in uttarakhand state. Environ. Sci. Pollut. Res. 2024, 31, 36241–36263. [Google Scholar] [CrossRef] [PubMed]
  18. Pacheco, F.; Weijden, C.H. Contributions of water-rock interactions to the composition of groundwater in areas with a sizeable anthropogenic input: A case study of the waters of the Fundo area, Central Portugal. Water Resour. Res. 1996, 32, 3553–3570. [Google Scholar] [CrossRef]
  19. Soumya, B.S.; Sekhar, M.; Riotte, J.; Banerjee, A.; Braun, J.J. Characterization of groundwater chemistry under the influence of lithologic and anthropogenic factors along a climatic gradient in upper Cauvery basin, South India. Environ. Earth Sci. 2013, 69, 2311–2335. [Google Scholar] [CrossRef]
  20. Yeater, K.M.; Duke, S.E.; Riedell, W.E. Multivariate analysis: Greater insights into complex systems. Agron. J. 2015, 107, 799–810. [Google Scholar] [CrossRef]
  21. Onjia, A.; Huang, X.; Trujillo González, J.M.; Egbueri, J.C. Chemometric approach to distribution, source apportionment, ecological and health risk of trace pollutants. Front. Environ. Sci. 2022, 10, 1107465. [Google Scholar] [CrossRef]
  22. GB/T 14848-2017; Standard for Groundwater Quality. Ministry of Natural Resources of the People’s Republic of China: Beijing, China, 2017.
  23. Nganje, T.N.; Hursthouse, A.S.; Edet, A.; Stirling, D.; Adamu, C.I. Hydrochemistry of surface water and groundwater in the shale bedrock, cross river basin and niger delta region, nigeria. Appl. Water Sci. 2017, 7, 961–985. [Google Scholar] [CrossRef]
  24. Liang, Z.; Chen, J.; Jiang, T.; Li, K.; Gao, L.; Wang, Z.; Xie, Z. Identification of the dominant hydrogeochemical processes and characterization of potential contaminants in groundwater in Qingyuan, China, by multivariate statistical analysis. RSC Adv. 2018, 8, 33243–33255. [Google Scholar] [CrossRef]
  25. Chen, J.; Huang, Q.; Lin, Y.; Fang, Y.; Qian, H.; Liu, R.; Ma, H. Hydrogeochemical characteristics and quality assessment of groundwater in an irrigated region, Northwest China. Water 2019, 11, 96. [Google Scholar] [CrossRef]
  26. Herojeet, R.; Dewangan, R.K.; Naik, P.K.; Verma, J.R. Probabilistic modelling is superior to deterministic approaches in the human health risk assessment: An example from a tribal stretch in Central India. Sci. Rep. 2023, 13, 19351. [Google Scholar] [CrossRef] [PubMed]
  27. Liu, F.; Song, X.; Yang, L.; Han, D.; Zhang, Y.; Ma, Y.; Bu, H. The role of anthropogenic and natural factors in shaping the geochemical evolution of groundwater in the Subei Lake basin, Ordos energy base, Northwestern China. Sci. Total Environ. 2015, 538, 327–340. [Google Scholar] [CrossRef] [PubMed]
  28. Gaillardet, J.; Dupre, B.; Louvat, P.; Allegre, C.J. Global silicate weathering and CO2 consumption rates deduced from the chemistry of large rivers. Chem. Geol. 1999, 159, 3–30. [Google Scholar] [CrossRef]
  29. Liu, S.T.; Zhang, D.; Li, Y.H.; Yang, J.M.; Jia, B.J. Water sources and factors controlling on hydro-chemical compositions in the Yiluo River basin. Environ. Sci. 2020, 41, 1184–1196. [Google Scholar]
  30. Yusuf, M.A.; Abiye, T.A.; Ibrahim, K.O.; Abubakar, H.O. Hydrogeochemical and salinity appraisal of surficial lens of freshwater aquifer along Lagos coastal belt, South West, Nigeria. Heliyon 2021, 7, e08231. [Google Scholar] [CrossRef]
  31. Sheikhy, N.T.; Ramli, M.F.; Aris, A.Z.; Sulaiman, W.N.A.; Juahir, H.; Fakharian, K. Identification of the hydrogeochemical processes in groundwater using classic integrated geochemical methods and geostatistical techniques, in Amol-Babol Plain, Iran. Sci. World J. 2014, 2014, 419058. [Google Scholar] [CrossRef]
  32. Zhan, H.; Wu, Q.; Liu, B.; Zhou, G. Exploration of hydrogeochemical characterization and assessment of organic pollution characteristics of shallow groundwater near a chemical plant that discharged sewage illegally. Sustainability 2022, 14, 660. [Google Scholar] [CrossRef]
  33. Wang, L.; Yang, N.; Zhao, Y.; Zhang, Q. Research on the features and driving factors of shallow groundwater quality in arid areas, Northwest China. Water 2025, 17, 934. [Google Scholar] [CrossRef]
  34. Yuan, B.; Hao, Y.; Guo, Z.; Hu, Y.; Li, J.; Meng, J.; Wang, F. Hydrogeochemical disparities and constraints of water produced from various coal seams in the Baode Block, Ordos Basin, China. ACS Omega 2024, 9, 4905–4919. [Google Scholar] [CrossRef] [PubMed]
  35. Edmunds, W.M.; Doherty, P.; Griffiths, K.; Shand, P.; Peach, D. Baseline Report Series: The Chalk of Dorset; The Environment Agency: London, UK, 2002.
  36. Serianz, L.; Cerar, S.; Šraj, M. Hydrogeochemical characterization and determination of natural background levels (NBL) in groundwater within the main lithological units in Slovenia. Environ. Earth Sci. 2020, 79, 373. [Google Scholar] [CrossRef]
  37. Morris, B.L.; Lawrence, A.R.; Chilton, P.J.; Adams, B.; Calow, R.C.; Klinck, B.A. Groundwater and Its Susceptibility to Degradation: A Global Assessment of the Problem and Options for Management; The United Nations Environment Programme (UNEP): Nairobi, Kenya, 2003. [Google Scholar]
  38. Cao, R.J.; Jiang, R.G.; Zhao, Y.; Xie, J.C.; Yu, X. Spatiotemporal characteristics of groundwater depth in Xingtai City on the North China Plain: Changing patterns, causes and prediction. Appl. Ecol. Environ. Res. 2020, 18, 6605–6622. [Google Scholar] [CrossRef]
  39. Zhang, L.; Dong, D.; Lv, S.; Zhang, J.; Yan, M.; Han, G.; Li, H. Hydrochemical characterization and quality assessment of groundwater in the southern plain of Hebei Province, China. Water 2023, 15, 3791. [Google Scholar] [CrossRef]
  40. Wang, Z.; Shimabukuro, M.; Kishida, R.; Yokoi, T.; Kawashita, M. Effects of pH on the microarchitecture of carbonate apatite granules fabricated through a dissolution–precipitation reaction. Front. Bioeng. Biotechnol. 2024, 12, 1396275. [Google Scholar] [CrossRef]
  41. Zhang, Q.; Wang, H.; Wang, Y.; Yang, M.; Zhu, L. Groundwater quality assessment and pollution source apportionment in an intensely exploited region of northern China. Environ. Sci. Pollut. Res. 2017, 24, 16639–16650. [Google Scholar] [CrossRef]
  42. Zhang, Q.; Liu, W.; Sun, H.; Wang, H.; Wang, L.; Zhang, J.; Xu, Z. Cascade reservoir regulations on nitrogen source and transformation in the Tibetan Plateau river: Constraints from high frequency data of Lancang river. J. Hydrol. 2025, 650, 132563. [Google Scholar] [CrossRef]
  43. Gibert, O.; Assal, A.; Devlin, J.F. Performance of a field-scale biological permeable reactive barrier for in-situ remediation of nitrate-contaminated groundwater. Sci. Total Environ. 2018, 643, 1295–1306. [Google Scholar] [CrossRef]
Figure 1. Distribution map of groundwater monitoring sites.
Water 17 02836 g001
Figure 2. Groundwater hydrochemical type map.
Water 17 02836 g002
Figure 3. Gibbs diagrams for groundwater in this region (a) TDS VS [Cl ]/[Cl + HCO3] and (b) TDS VS [Na+]/[Na+ + Ca2+].
Water 17 02836 g003
Figure 4. Relationships between major ions for groundwater samples in the study (a) [Ca2+]/[Na+] VS [Mg2+]/[Na+], (b) [Na+] VS [Cl], (c) [ H C O 3 ] VS [Ca2+ + Mg2+], (d) [Ca2+] VS [ S O 4 2 ].
Water 17 02836 g004
Figure 5. Cumulative probability plot of Na+ (a), Ca2+ (b), Mg2+ (c), Cl (d), S O 4 2 (e), N O 3 (f) and F (g) concentrations in groundwater.
Water 17 02836 g005aWater 17 02836 g005b
Figure 6. Relationship between Pollution Percentage and [Na+/Cl] Ratio.
Water 17 02836 g006
Table 1. Statistical table of groundwater chemical indicators.
ParametersRange (mg/L)Average (mg/L)CV (%)Standard *Over Standard Rate (%)
pH6.78–8.477.845.466.5–8.50
K+0.420–15.42.21137-3.3
Na+6.26–127528511220038.3
Ca2+4.01–29786.778.8-46.7
Mg2+2.92–40274.7127-33.3
H C O 3 40.2–100840558.2--
Cl15.4–201730113225033.3
S O 4 2 20.3–235534414925031.7
N O 3 0–10616.018388.68.3
F0.11–3.910.8483.1123.3
TH24.0–220253397.145040.0
TDS169–5659127199.6100033.3
Note: * refers to the Class III water quality standard in the “Groundwater Quality Standard” [22]. The dash (-) indicates the absence of a standard. CV = coefficient of variation.
Table 2. Statistics of natural background values and threshold characteristics of groundwater hydrochemical components.
ParametersStandard (mg/L)NBLsTVsExceeding the TVs PointsPercentage Occupied (%)
Na+20032.31164066.7
Ca2+7534.154.63355.0
Mg2+5017.833.93050.0
Cl45046.22482033.3
S O 4 2 45066.42581931.7
N O 3 88.60.8944.7711.7
F10.330.672338.3
Table 3. Statistical Analysis of NBLs in Different Regions (mg/L).
RegionNa+Ca2+Mg2+Cl S O 4 2 N O 3 F
Study area32.334.117.846.266.40.890.33
Xi’an alluvial plain [6]101–12176.1–80.043–18440.0–73.6340–696--
Milan area, Italy [2]25.2--29.34412-
Rajasthan, India [1]158--24228260.35
Slovenia [36]1211025.930.8266.3-
Table 4. Loadings of 11 selected variables on VARIMAX rotated factors in this area.
ParametersPC1PC2PC3
S O 4 2 0.9410.2050.108
Mg2+0.9120.3080.091
TDS0.8600.396−0.006
Cl0.8500.0730.496
K+0.836−0.306−0.026
Ca2+0.8280.395−0.165
TH0.8170.3690.261
Na+0.6690.2910.579
H C O 3 0.2410.855−0.133
pH−0.223−0.712−0.467
N O 3 −0.165−0.0840.897
Eigenvalue6.651.611.14
Contribution rate (%)51.818.914.6
Cumulative contribution rate (%)51.870.785.3
Disclaimer/Publisher’s Note: The statements, opinions and data contained in all publications are solely those of the individual author(s) and contributor(s) and not of MDPI and/or the editor(s). MDPI and/or the editor(s) disclaim responsibility for any injury to people or property resulting from any ideas, methods, instructions or products referred to in the content.