Article

Sources and Transport of Dissolved Organic Matter (DOM) in Surface and Groundwater Within a Dominated Greenhouse Agriculture Catchment: Insights from Multi-Tracer

1
Institute of Surface-Earth System Science, School of Earth System Science, Tianjin University, Tianjin 300072, China
2
Center of Eco-Environmental Monitoring and Scientific Research, Administration of Ecology and Environment of Haihe River Basin and Beihai Sea Area, Ministry of Ecology and Environment, Tianjin 300170, China
*
Authors to whom correspondence should be addressed.
Water 2025, 17(18), 2681; https://doi.org/10.3390/w17182681
Submission received: 28 July 2025 / Revised: 29 August 2025 / Accepted: 5 September 2025 / Published: 10 September 2025

Abstract

Intensive greenhouse agriculture significantly alters dissolved organic matter (DOM) dynamics in aquatic ecosystems, but related research remains scarce. To address this knowledge gap, this study employed an integrated approach combining Excitation–Emission Matrix Parallel Factor Analysis (EEM-PARAFAC), Two-Dimensional Correlation Spectroscopy (2D-COS), and Self-Organizing Map (SOM) analyses with hydrochemical and stable water isotopes (δ18O and δD) to investigate the dynamic characteristics of DOM in surface water and groundwater in an intensive greenhouse agriculture catchment (XER) in northern China. Water chemistry and isotope results consistently demonstrated mixing between surface water and groundwater, which was attributed to irrigation pumping. Four fluorescent components were identified via EEM-PARAFAC (C1 and C4 are humic components, while C2 and C3 are tryptophan components), with microbial decomposition of organic fertilizers and domestic wastewater discharge being important sources. Compared with tryptophan components, terrestrial humic substances in groundwater preferentially change in the parallel river direction, while microbial humic substances are more sensitive in the vertical direction, as confirmed by 2D-COS. SOM analysis validated the EEM-PARAFAC results through component plane visualization, demonstrating both DOM inter-component relationships and their correlations with inorganic ions. These results provide critical scientific support for developing sustainable water resource management strategies and optimizing organic fertilizer use in greenhouse agricultural systems, with important practical implications for protecting groundwater quality in intensively cultivated catchments.

Graphical Abstract

1. Introduction

China’s agricultural sector is transitioning from traditional extensive farming to modern intensive systems, with facility-based agriculture becoming the predominant model for high-value crop production [1]. While this shift has significantly boosted agricultural productivity, particularly through year-round greenhouse cultivation of vegetables, fruits, and ornamental plants [2,3], it has also introduced environmental challenges. Intensive greenhouse practices characterized by excessive fertilizer application (e.g., poultry/pig manure and nitrogen fertilizers) and groundwater overexploitation for irrigation have substantially altered aquatic ecosystems near cultivation areas [4,5]. Compared to groundwater, surface water systems are particularly vulnerable to anthropogenic disturbances from agricultural inputs [6]. However, shallow groundwater and surface water form an interconnected hydrological system with continuous quality and quantity exchange [7,8]. Excessive groundwater extraction creates hydraulic gradients that enhance pollutants from surface water leaching into shallow aquifers [9], potentially degrading groundwater quality in intensive greenhouse farming regions [10].
Dissolved organic matter (DOM), the most environmentally reactive fraction of natural organic matter (NOM), comprises a complex mixture of allochthonous and autochthonous organic compounds in aquatic systems [11,12]. At the catchment scale, DOM serves as a dynamic indicator of surface–groundwater interactions [13] and plays a crucial role in mediating the transport and bioavailability of nutrients (N, P), heavy metals, and organic pollutants [4,14,15]. In natural aquifers, the detailed impact of DOM depends not only on its concentration [6] but also on its source and composition [16,17], and it is significantly influenced by hydrological seasonality [18]. During high-flow periods, rainfall-induced soil erosion mobilizes terrestrial organic matter through surface runoff into rivers, making humic substances the predominant DOM source [19,20]. In contrast, baseflow conditions lead to groundwater-derived DOM, which exhibits lower aromaticity but higher microbial and protein-like signatures [21,22]. Notably, agricultural practices have altered DOM dynamics at the catchment scale, including concentrations, biodegradability, and total export flux [21,23,24]. In greenhouse agricultural systems, irrigation practices including groundwater extraction and return flow may modify DOM characteristics in both surface water and shallow groundwater through enhanced soil erosion and organic fertilizer transport [4,25]. While existing research has thoroughly documented DOM concentration variations in agricultural catchments, the dynamic response of DOM properties to agricultural-induced alterations in surface–groundwater interactions remains insufficiently characterized [25]. This study specifically aims to bridge this critical research gap.
Absorbance and fluorescence spectroscopy remain powerful and cost-effective tools for characterizing DOM sources in aquatic systems, despite the availability of various characterization methods [26]. Excitation–emission matrix (EEM) fluorescence spectroscopy coupled with parallel factor analysis (PARAFAC) effectively resolves complex fluorophore mixtures into distinct components, enabling robust DOM source discrimination [6,27]. While EEM-PARAFAC is particularly sensitive to land use and hydrological influences [26], it typically treats DOM components as static variables rather than dynamic, interacting systems. Self-organizing maps (SOM), as an unsupervised neural network, effectively characterize DOM component distributions and sources [28,29,30]. SOM combined with EEM-PARAFAC can clearly show changes in the overall fluorescence characteristics of all samples rather than examining isolated fluorophores [31,32]. Two-dimensional correlation spectroscopy (2D-COS) can enhance spectral resolution and detect subtle DOM transformations under environmental perturbations (flow direction and geographic latitude) [7,33]. However, few studies have applied EEM-PARAFAC combined with 2D-COS technology to characterize DOM and to reveal the transformation processes of different DOM components in natural water environments [34,35,36]. Therefore, integrating multiple technical methods (EEM-PARAFAC-SOM-2D-COS) can facilitate more comprehensive, in-depth, and complementary exploration and analysis of the sources and dynamic transformation of DOM components from surface water to shallow groundwater in small agricultural catchments.
Stable water isotopes (δ18O and δD) serve as powerful natural tracers for identifying water sources and circulation mechanisms due to their distinct isotopic signatures resulting from various hydrological and geochemical processes [37,38]. Notably, current hydrological process research mainly focuses on inorganic parameters, whereas organic indicators, despite their potential application value, remain under-explored [39]. Combining geochemical information identified by water chemistry, δ18O, and δD with organic indicators may provide new insights into the origin and transformation of DOM [38,40].
Intensive greenhouse agriculture has a significant impact on surrounding water quality [4,5]. This study employed a systematic sampling approach during winter (minimizing the effects of rainfall and terrestrial inputs) in greenhouse-dominated agricultural catchments to investigate DOM dynamics under key agricultural practices, including organic fertilizer application and irrigation pumping. Our research objectives were to conduct the following: (1) hydrochemical and stable isotope analyses to elucidate surface–groundwater interactions; (2) determining of DOM sources and composition through EEM-PARAFAC analysis; (3) 2D-COS analysis of groundwater DOM fluorescence component variations using river orientation as a perturbation factor; and (4) establishing of DOM-hydrogeochemical relationships via SOM clustering analysis and Pearson’s correlation analysis. By integrating multiple analytical approaches, this study provides a scientific foundation for the protection of sustainable water resources in greenhouse-intensive catchments.

2. Materials and Methods

2.1. Study Area

The Xier River catchment (XER), located in central Shandong Province, is a 105.56 km2 tributary catchment within the Mi River Basin (118.36–119.8° N, 36.11.5–37.8° E, 3847.5 km2) (Figure 1a). This intensive agricultural region features predominantly farmland with year-round greenhouse cultivation of vegetables, flowers, and fruits. Characterized by a warm-temperate semi-humid monsoon climate, the area exhibits distinct seasonal variations, with an average annual temperature of 12 °C. The dry season typically extends from December to March, followed by the flood season from June to August. Land use patterns and topographic features of both basins are presented in Figure 1a–c.

2.2. Field Sampling and Pretreatment

To investigate the characteristics of DOM under the influence of surface–groundwater interactions while minimizing interference from rapid hydrological variations such as rainfall events, we conducted a comprehensive water sampling campaign during the winter of 2023 (From 8th to 12th December). A total of 12 surface water (S-) and 22 groundwater (G-) samples were collected from the Mi River, Xier River, their tributaries (Kanglang River and Fengshou River), and adjacent villages (Figure 1d). Groundwater sampling covered densely populated areas and different agricultural zones (vegetables, flowers, and fruit fields; Table 1). Notably, the groundwater samples G1–G5 were collected parallel to the river direction (PR), while samples G6–G10 were collected perpendicular to the river direction (VR). In addition, based on the well depths obtained from field surveys (Table S1), groundwater was classified into deep groundwater (G4 and G22) and shallow groundwater (other sites). Surface water collection employed an extendable-pole bucket and stainless steel sampler with a bottom check valve, while groundwater was obtained through well pumping. All samples were collected in triplicate, uniformly mixed, and divided into unfiltered (plastic bottles) and filtered (0.45 μm membrane into 100 mL HDPE bottles) portions. Strict preservation protocols were followed, including overflow filling, Parafilm sealing, and light-protected cold storage during transport.

2.3. Analysis of Hydrochemical Indicators

Water quality parameters (temperature [T], pH, dissolved oxygen [DO], and electrical conductivity [EC]) were measured in situ using a calibrated EXO2 multiparameter probe (YSI, New York, NY, USA), with readings recorded after 5-min stabilization (Table 1). Laboratory analyses were completed within 7 days. Major ions (K+, Na+, Ca2+, Mg2+, Cl, NO3, and SO42−) were quantified by ion chromatography (Metrohm ECO IC, Herisau, Switzerland, Model: 940), while HCO3 concentrations were determined via 0.02 M HCl titration. Stable isotope ratios (δ18O and δD) were analyzed using a Picarro L2140-i water isotope analyzer (Santa Clara, CA, USA), reported in δ-notation (‰) relative to V-SMOW (±0.1‰ for δ18O; ±0.8‰ for δD). DOC measurements employed an OI Analytical 1080 TOC analyzer (College Station, TX, USA) following acidification (0.5 M HCl) and high-purity oxygen purging to remove DIC, ensuring accurate non-purgeable organic carbon (NPOC) determination [18]. All analyses were performed in triplicate, with means calculated after outlier exclusion (±2% relative standard deviation).

2.4. Analysis of DOM

The DOM’s UV-visible absorption spectra (200–800 nm, 1 nm resolution) were measured using a Shimadzu UV-2700 spectrophotometer with 1 cm quartz cuvettes. Milli-Q water (18.2 MΩ·cm resistivity) served as the reference blank, and all sample spectra were corrected by subtracting the corresponding blank spectrum. Three-dimensional excitation–emission matrices (3D-EEMs) were acquired on a Hitachi F-4700 fluorescence spectrophotometer (Tokyo, Japan) with the following parameters: excitation (Ex) 220–480 nm, emission (Em) 280–550 nm (5 nm intervals for both), 2.5 nm slit widths, and 12,000 nm min−1 scanning speed [16,41].

2.5. Data Analysis Methods of DOM

2.5.1. EEM-PARAFAC and Optical Indices Analysis

The raw EEM spectra were preprocessed to remove optical interferences prior to modeling. The methods described by Zepp et al. [42] were used to remove most of the Rayleigh and Raman scattering effects from the dataset (subtracting the Milli-Q blank spectrum). The inner-filter effect was corrected using measured absorbance at 254 nm (<0.3). All spectra were normalized to Raman units (R.U.) based on the integrated Raman scatter peak (Ex = 350 nm) of Milli-Q water [43]. PARAFAC modeling was conducted using the DOMFluor toolbox in MATLAB R2025a [44] and validated by split-half analysis [45]. The components identification was performed using OpenFluor (http://www.openfluor.org (accessed on 26 June 2025)) by spectral matching against reference libraries (fitting coefficient = 0.95) [46]. For each component, the maximum fluorescence intensity (Fmax, R.U.) was determined from peak Ex/Em wavelengths, and relative abundances were calculated as the ratio of individual Fmax to total fluorescence intensity.
Four fluorescence indices (FI, β:α, BIX, HIX) were derived from EEM spectra to characterize DOM composition [12,47]. Complementary UV-visible absorption parameters included SUVA254 (aromaticity indicator) and E2:E3 ratio (molecular weight proxy) [12,48]. Detailed formulations and interpretations of these indices are provided in Table S3.

2.5.2. 2D-COS Analysis

The 2D-COS has become an essential analytical tool for examining dynamic interactions and sequential responses among DOM components under environmental perturbations (e.g., temperature, pH gradients, or metal concentrations) [49,50]. Heterogeneous 2D-COS (hetero-2DCOS) extends this capability by enabling comparative analysis of spectral responses across different techniques under identical perturbation conditions, thereby providing enhanced characterization of system dynamics [33,51]. While synchronous correlation maps identify co-varying components, asynchronous maps reveal response sequences [52,53]. In this study, we implemented hetero-2DCOS analysis using 2Dshige v13 software (Kansai-Gakuin University, Nishinomiya, Japan) to process PARAFAC Ex load data, with groundwater sampling orientations (PR and VR to Xier River flow) serving as defined perturbations [7,33]. The analysis characterized DOM component dynamics relative to river orientation and established response sequences through Noda’s rule [54]. Detailed methodological specifications are available in Zhu et al. [55].

2.5.3. SOM Analysis

SOM is an unsupervised neural network that projects high-dimensional data (e.g., 3D-EEM) onto a low-dimensional grid through a nonlinear transformation [31,56]. This method preserves topological relationships while enabling pattern classification, feature extraction, and dimensionality reduction, with minimal quantification error. The SOM algorithm operates through iterative weight initialization and adjustment based on input vectors and neighborhood interactions, with similarity quantification achieved via best-matching unit (BMU) distance metrics [57]. Spatially proximate neurons represent similar samples, with relationships refined through continuous learning. In this study, we implemented SOM analysis using MATLAB’s somtoolbox, constructing a 6 × 6 neuron grid (Figure S1a) sized according to the heuristic equation 5 n (where n = 34 sampling points), followed by K-means clustering optimization [58]. Our SOM analysis incorporated five distinct parameter categories: conventional water quality indices, hydrochemical parameters, DOM components, spectral indices, and stable water isotope data. The U-matrix (unified distance matrix) visually represents sample similarity relationships through spatial distances between adjacent map units, employing an Euclidean distance-based color gradient scheme: warm hues (e.g., yellow to red) delineate cluster boundaries corresponding to larger inter-neuron distances; cool tones (e.g., blue) indicate regions of high sample similarity with minimal topological separation [31].

2.6. Statistical Analysis

Geospatial analysis was conducted using ArcGIS 10.2 for sampling location mapping and Kriging interpolation. All statistical analyses were performed with Microsoft Office 2021, while Pearson’s correlation analysis was carried out using Origin 2024, examining relationships among DOC, DOM components, optical indices (FI, β:α, HIX, BIX, SUVA254, E2:E3), and stable water isotopes (δ18O and δD).

3. Results and Discussion

3.1. Surface–Groundwater Interaction Based on Water Chemistry and Isotopes (δD and δ18O)

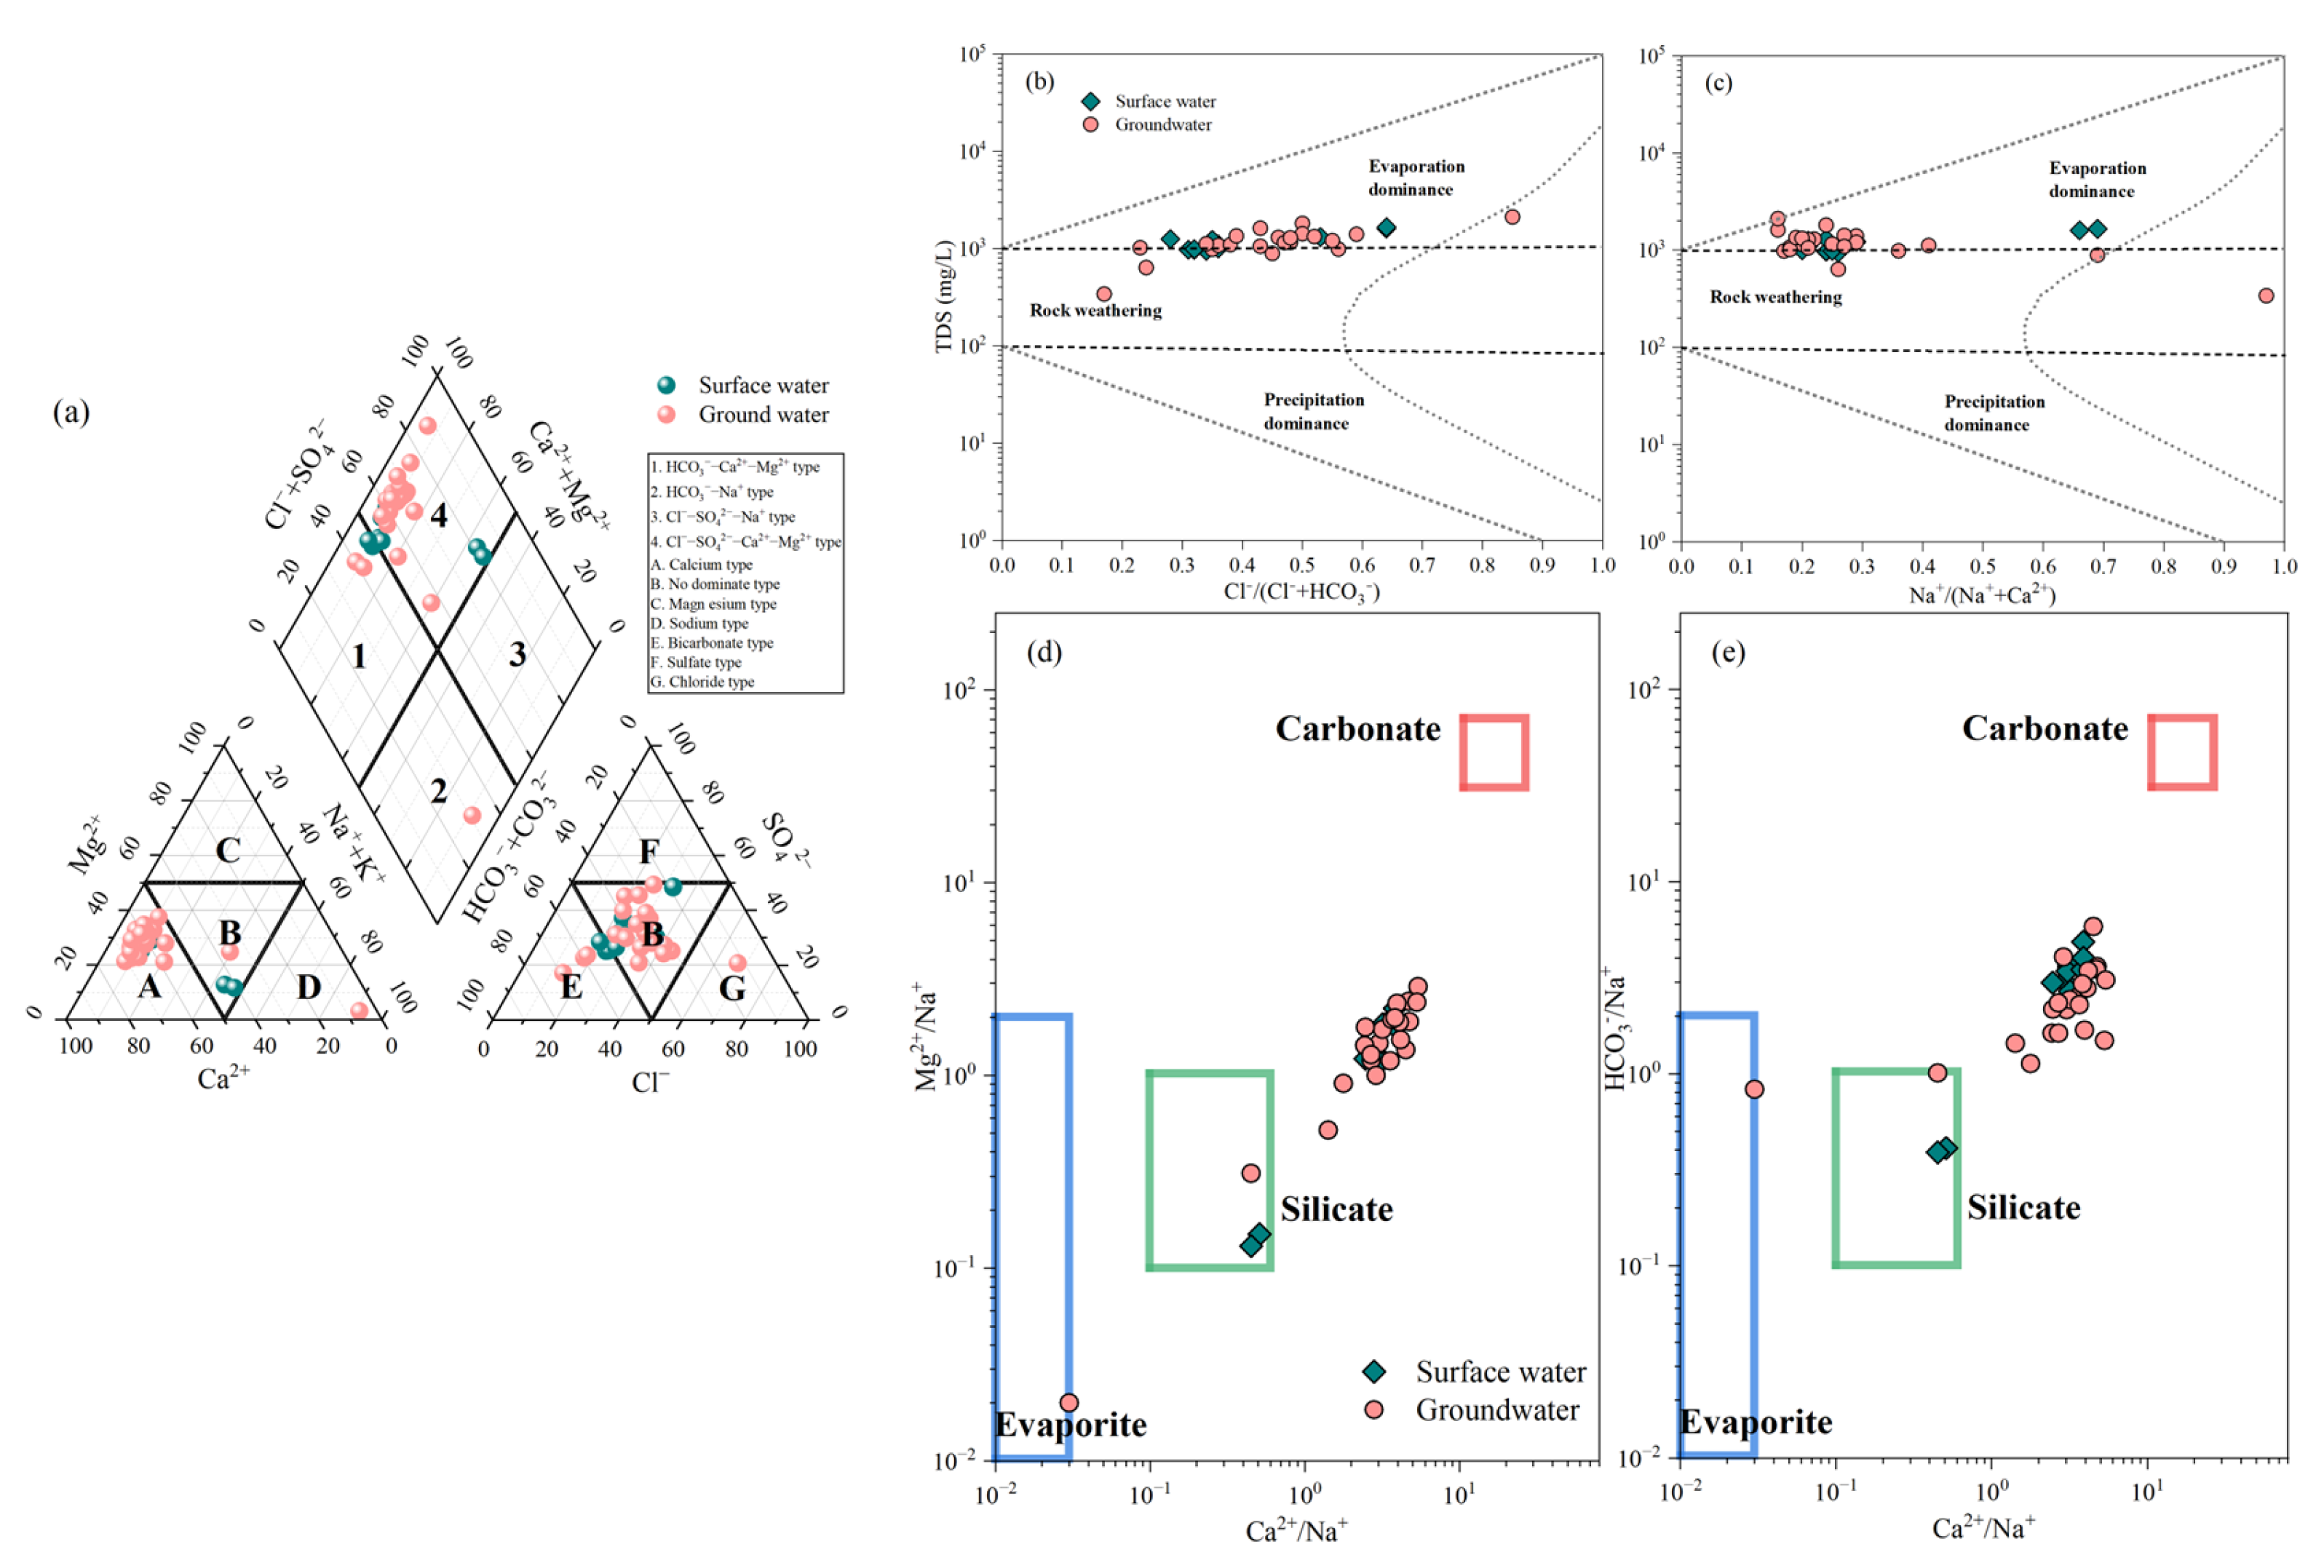
Hydrochemical characterization revealed a striking convergence between surface water and groundwater compositions in the study area, as evidenced by their comparable total dissolved solids (TDS) concentrations (surface water: 1166 ± 356 mg/L, n = 12; groundwater: 1196 ± 589 mg/L, n = 22) (Table S2). Generally speaking, the TDS in groundwater substantially exceeds surface water due to prolonged water–rock interactions [59,60], suggesting significant hydraulic connectivity potentially mediated by intensive irrigation practices in the study area [25]. The aqueous matrices exhibited distinct ionic fingerprints: surface waters were characterized by dominant K+-HCO3-SO42− assemblages, while groundwaters showed marked enrichment in Na+-NO3-Cl-Ca2+-Mg2+ components (Table S2). Notably, high concentrations of Cl and NO3 in groundwater are particularly diagnostic and can serve as reliable water chemical tracers for non-point source pollution from greenhouse agriculture [9]. In this study, the observed DOC depletion in groundwater, especially at deep monitoring points G4 and G22 (Table S1), reflects progressive attenuation of organic compounds along flow paths through adsorption processes [23,61]. Piper trilinear analysis classified the waters primarily as Ca-Mg-HCO3 and Cl-SO4 types (Figure 2a), indicating dynamic recharge conditions in shallow aquifers that are likely enhanced by irrigation return flows [62]. Gibbs diagram analysis confirmed evaporation as the dominant process controlling water chemistry (Figure 2b,c), while cation ratio plots (Ca2+/Na+ vs. Mg2+ vs. HCO3/Na+) revealed dual contributions from silicate and carbonate weathering (Figure 2d,e) [63]. All in all, these collective hydrochemical signatures (Figure 2) demonstrate how anthropogenic perturbations, particularly irrigation activities, can alter natural hydrogeochemical regimes by modifying hydrodynamic conditions and solute transport pathways [59,60], ultimately leading to the observed convergence between surface and groundwater chemistries [38].
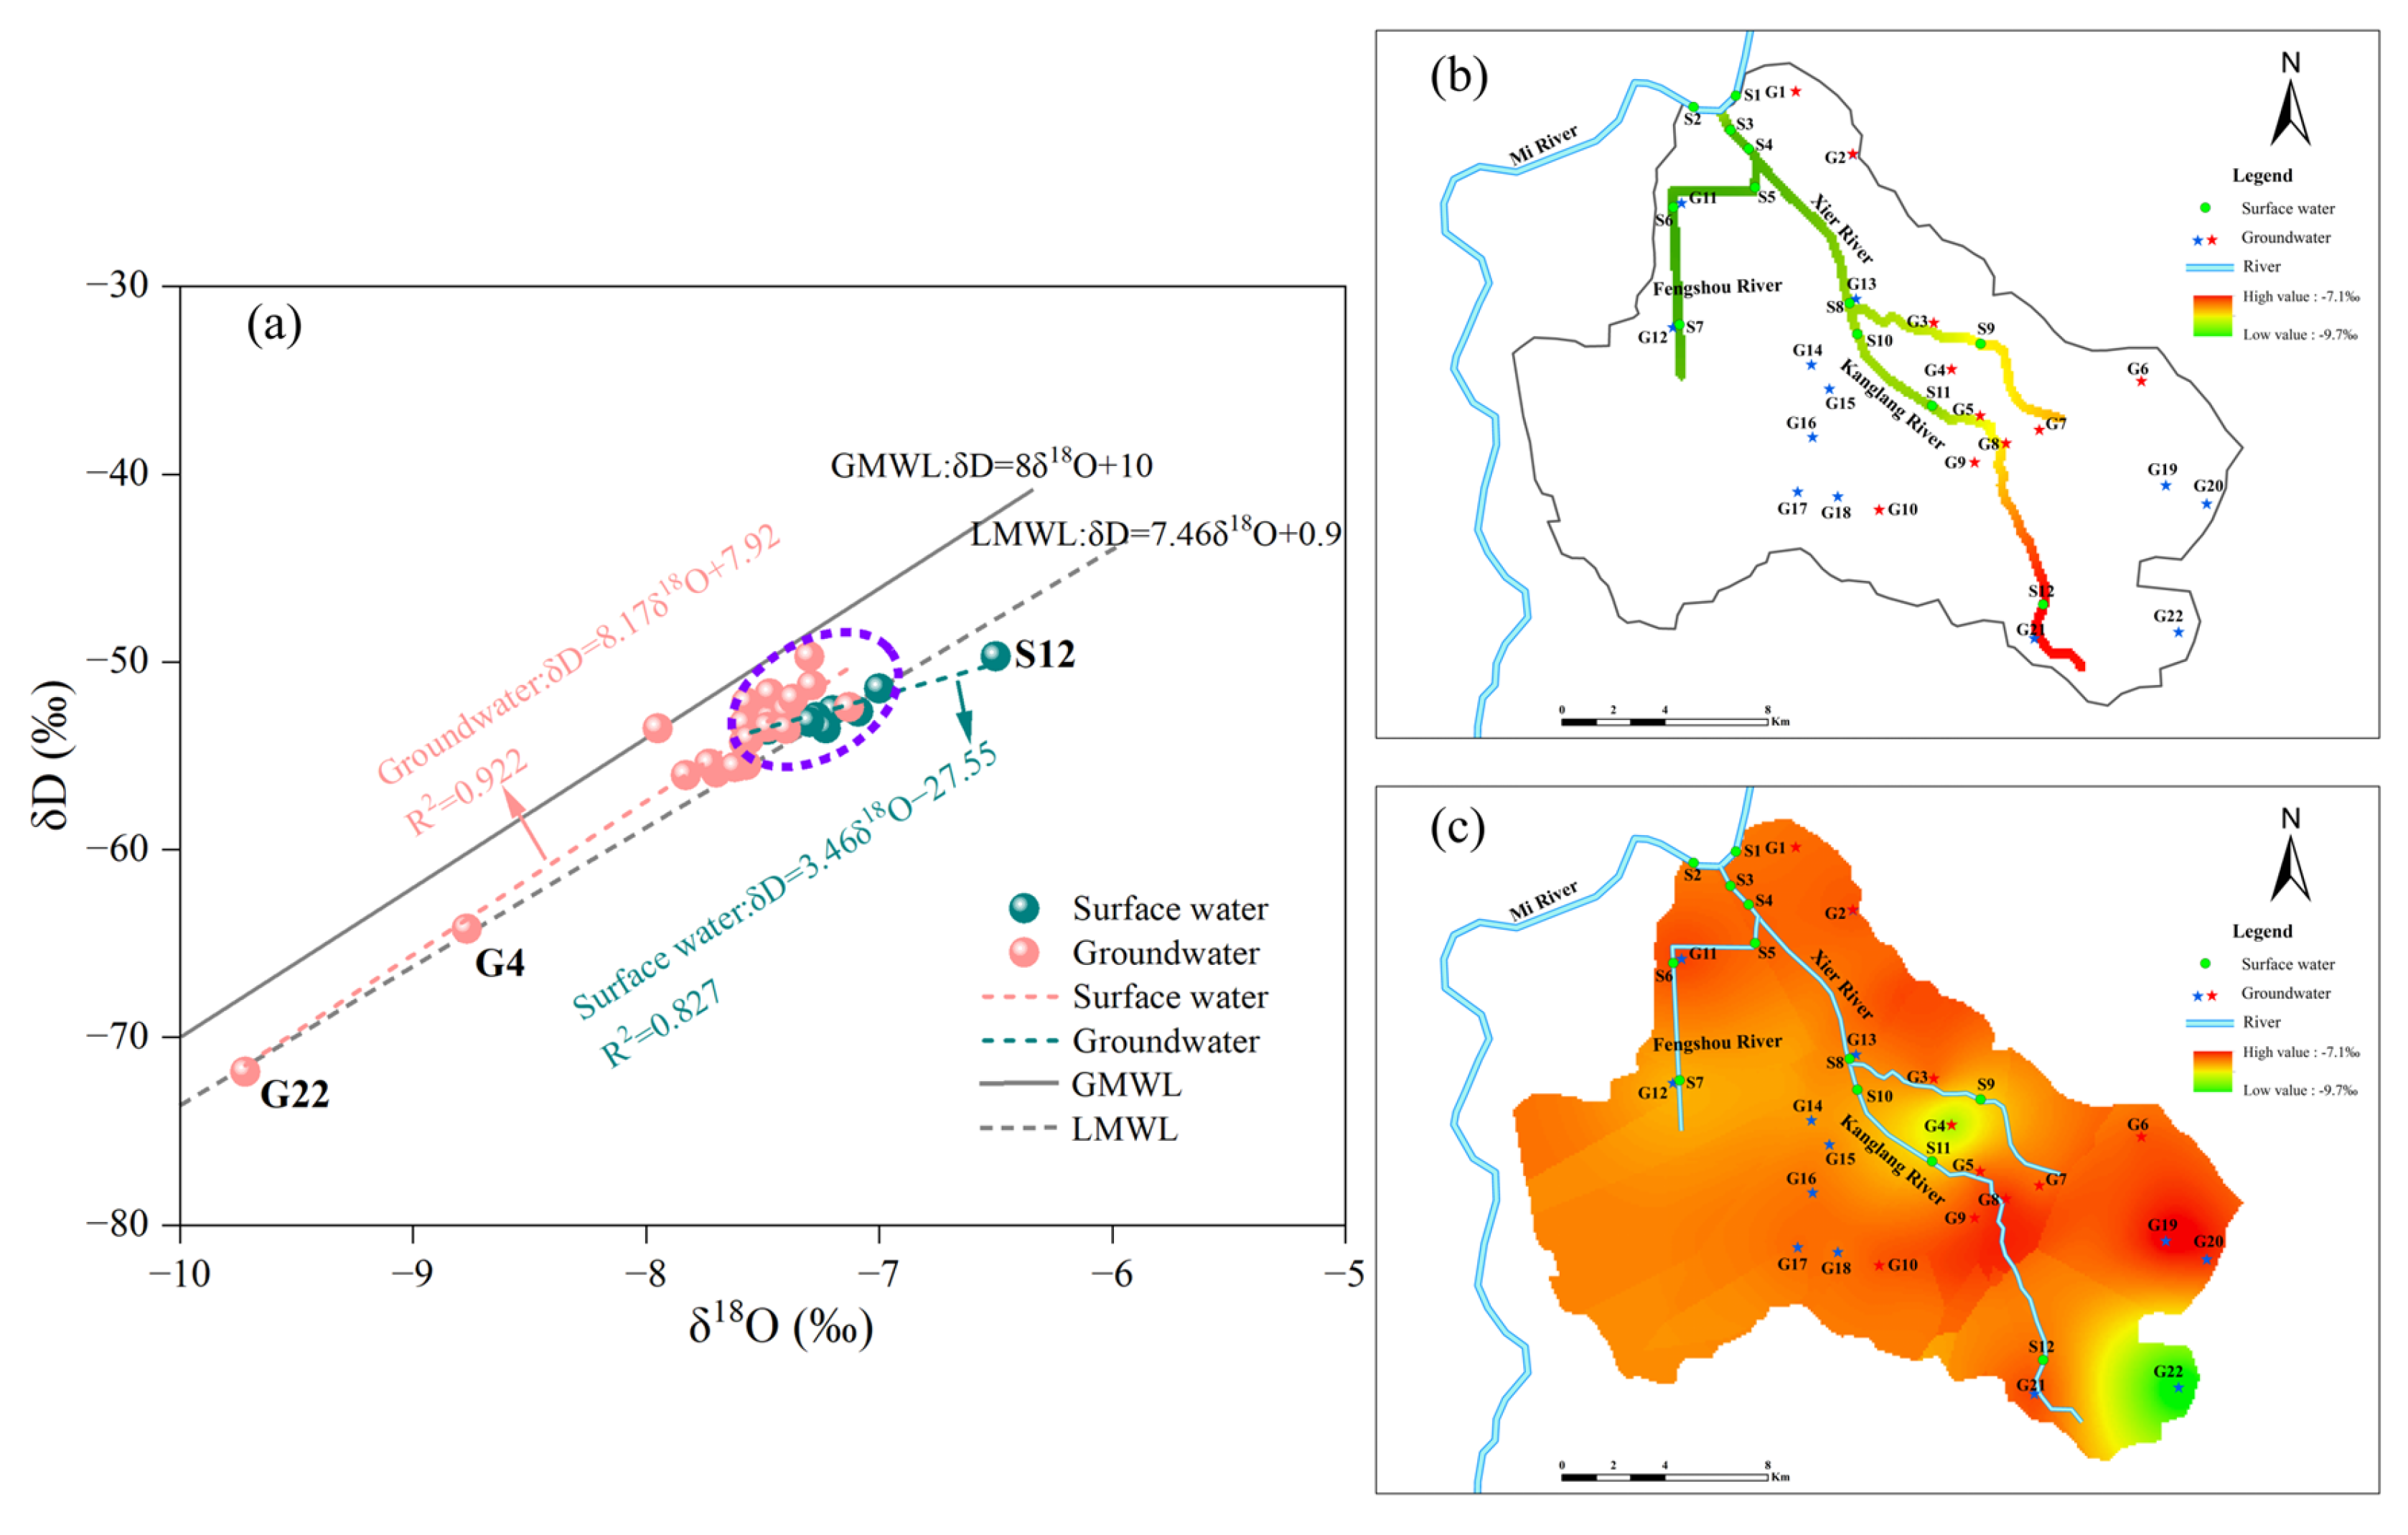
Stable water isotopes (δ18O and δD) serve as effective natural tracers in hydrological studies, revealing distinct spatiotemporal variations across water cycle components [37,38]. Our measurements showed δ18O values ranging from −9.2‰ to −6.5‰ and δD values from −71.8‰ to −49.7‰, plotted near both the Global and Local Meteoric Water Lines (GMWL and LMWL) (Figure 3a), confirming their precipitation origin. The significant isotopic overlap observed between surface water and groundwater samples (purple elliptical region) indicates intensive mixing processes within the XER [61,64], primarily driven by two mechanisms: groundwater recharges to surface water during low-precipitation periods [23] and irrigation returns flow from agricultural pumping activities [65]. The pronounced evaporation effect on surface water is evidenced by the rightward shift of several sampling points (particularly S2) from the GMWL and LMWL (Figure 2a) [61]. Spatial analysis revealed downstream depletion of δ18O in surface water (Figure 3b), contrasting with groundwater’s generally uniform isotopic distribution (Figure 3c), suggesting elevation-dependent fractionation. Notably, the deep groundwater sites G4 (vegetable field, 70 m) and G22 (residential area, 150 m) exhibited anomalously depleted δ18O values (Table S1), which align with previous reports of more depleted isotopic signatures in deeper aquifers (Figure 3a) [64]. These findings collectively highlight the complex interplay between natural hydrological processes and anthropogenic influences in the XER.

3.2. Variations in DOM Components and Optical Indices Characteristics

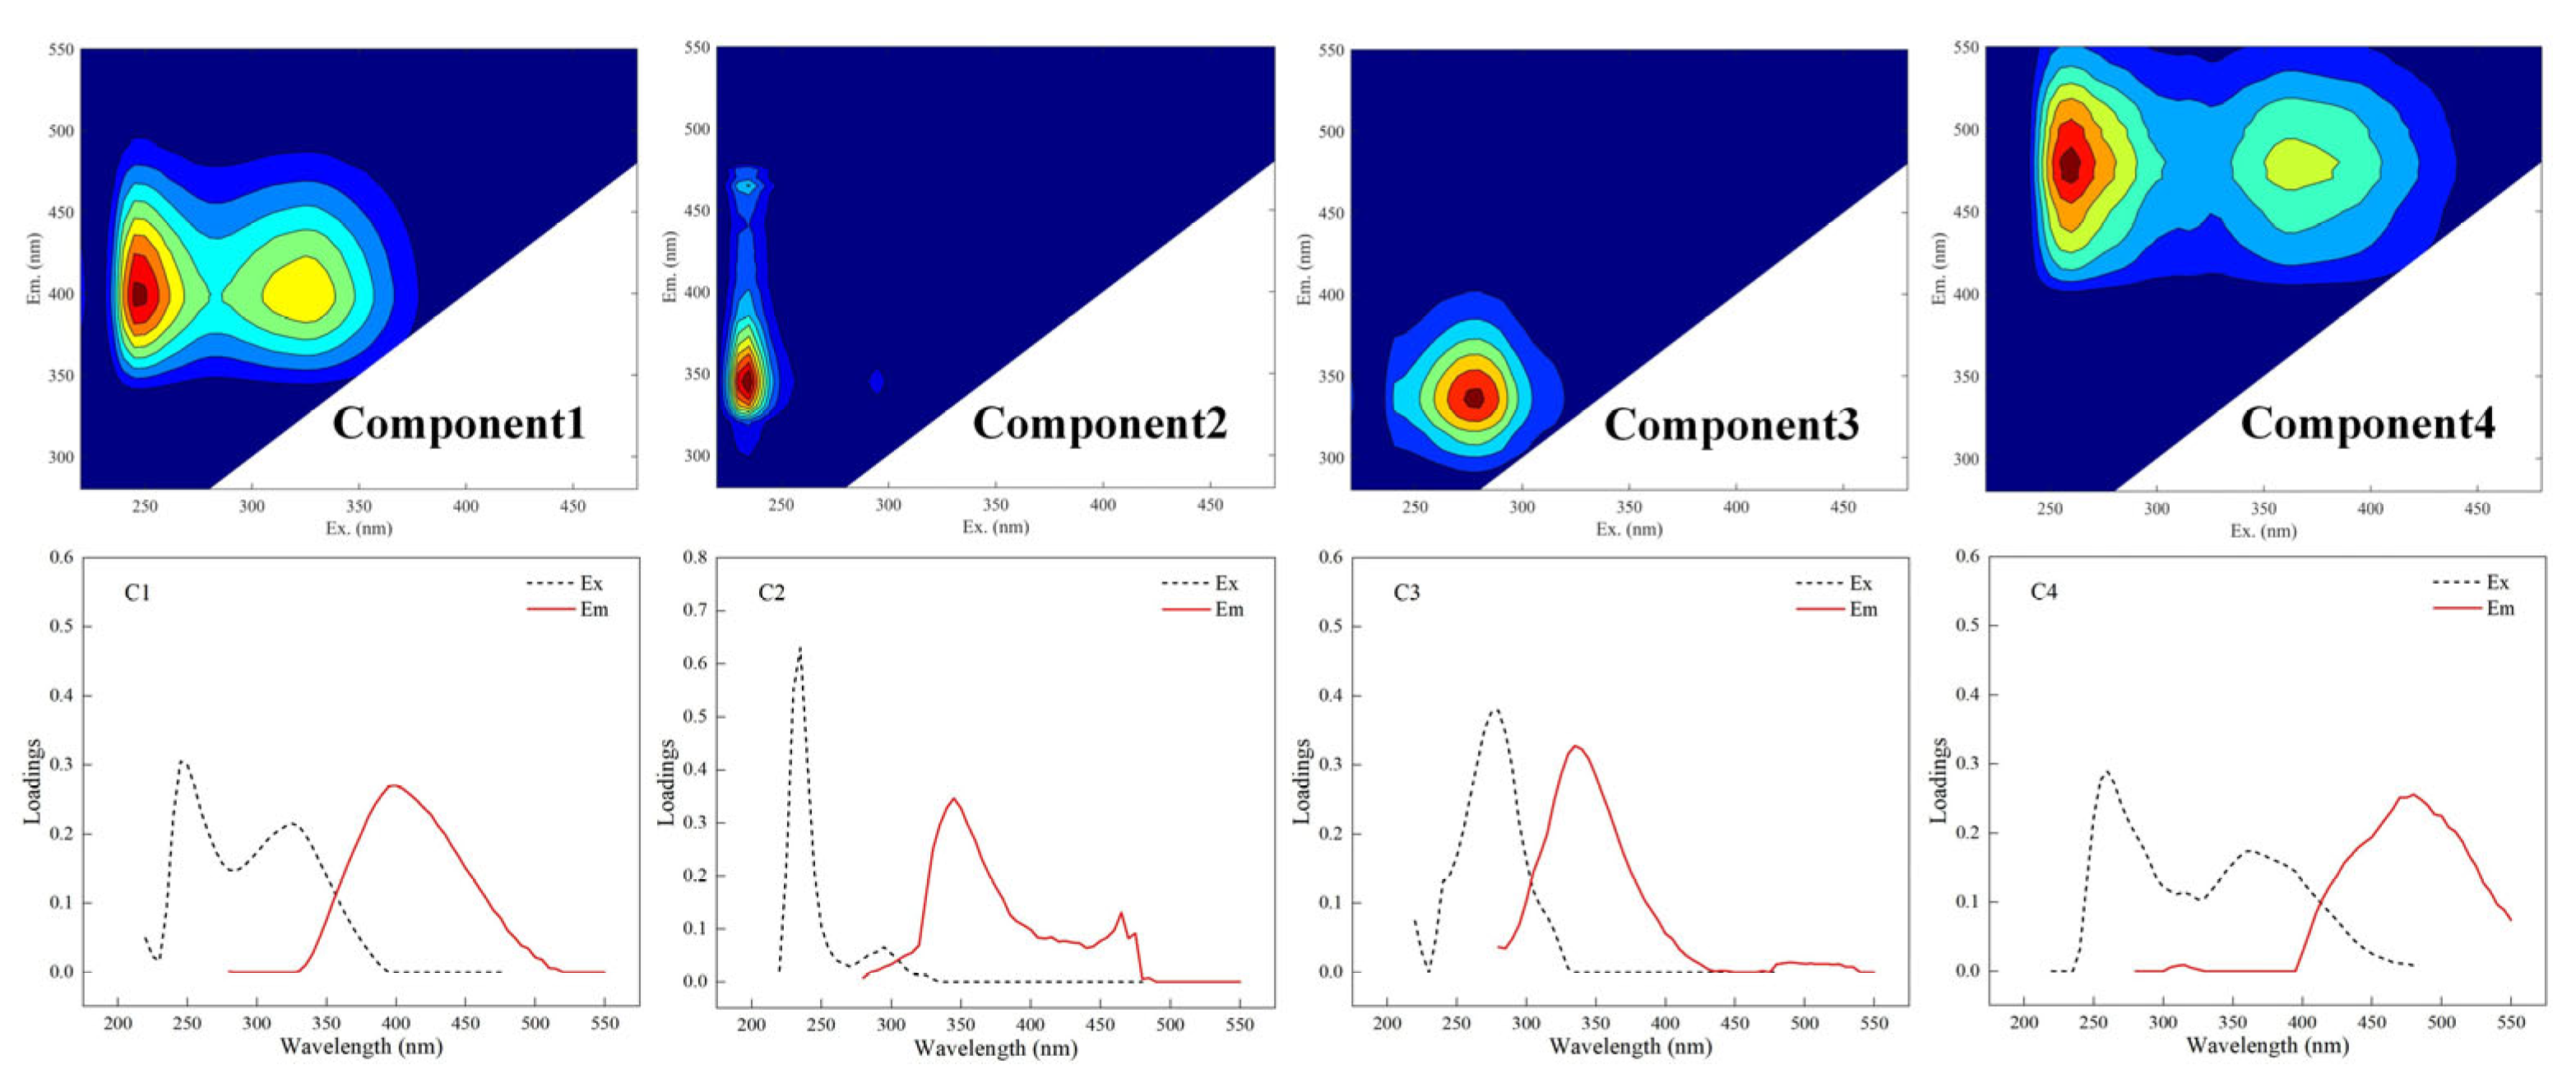
This study identified four DOM components using EEM-PARAFAC analysis (Figure 4, Table 1), classified into two categories: (1) humic-like substances (C1 and C4) and (2) protein-like substances (C2 and C3). C1 displays maximum excitation/emission wavelengths at 245(325)/400 nm, representing a microbial humic substance typically found in groundwater [22,67]. This low molecular weight component originates from biological activity [68] and shows sensitivity to agricultural influences [9]. In contrast, C4 in surface water is a terrestrial humic component characterized by high molecular weight and aromaticity, strongly associated with agricultural land use [7,68]. Yang et al. [64] indicated that the relatively high abundance of C4 may be associated with terrestrial organic matter brought by monsoon season rainfall, while the non-monsoon season sees greater C1 production. C2 and C3 both exhibit Ex/Em peaks typical of tryptophan-like proteins, yet demonstrate different origins. While C2 primarily indicates domestic wastewater input [18], C3 reflects microbial metabolic activity in groundwater systems [13]. Studies demonstrate strong correlations between tryptophan-like proteins and biodegradable organic loads, such as BOD and COD in wastewater. In contrast, humic-like substances, which are less readily biodegradable, influence the formation and long-term persistence of disinfection byproducts [7,13,26]. Therefore, distinguishing between these two components holds significant importance for water quality monitoring and assessment.
Table 1. The Ex and Em of DOM components (C1–C4) in XER water samples identified by EEM-PARAFAC analysis.
ComponentMaximum Ex(nm)Maximum
Em(nm)
DescriptionPrevious StudiesNumber of Matches b
C1245 (325) a400Microbial humic-likeC2 [68]
C2 [9]
94
C2235345Tryptophan-like, produced by human activitiesC2 [7]
C3 [18]
14
C3275335Tryptophan-like, produced by microbial metabolismC4 [68]
C3 [13]
96
C4260 (365)480Terrestrial humic-like C4 [7]
C1 [68]
80
Note: a Ex wavelengths in parentheses represent secondary peaks. b http://www.openfluor.org (conducted on 26 June 2025).
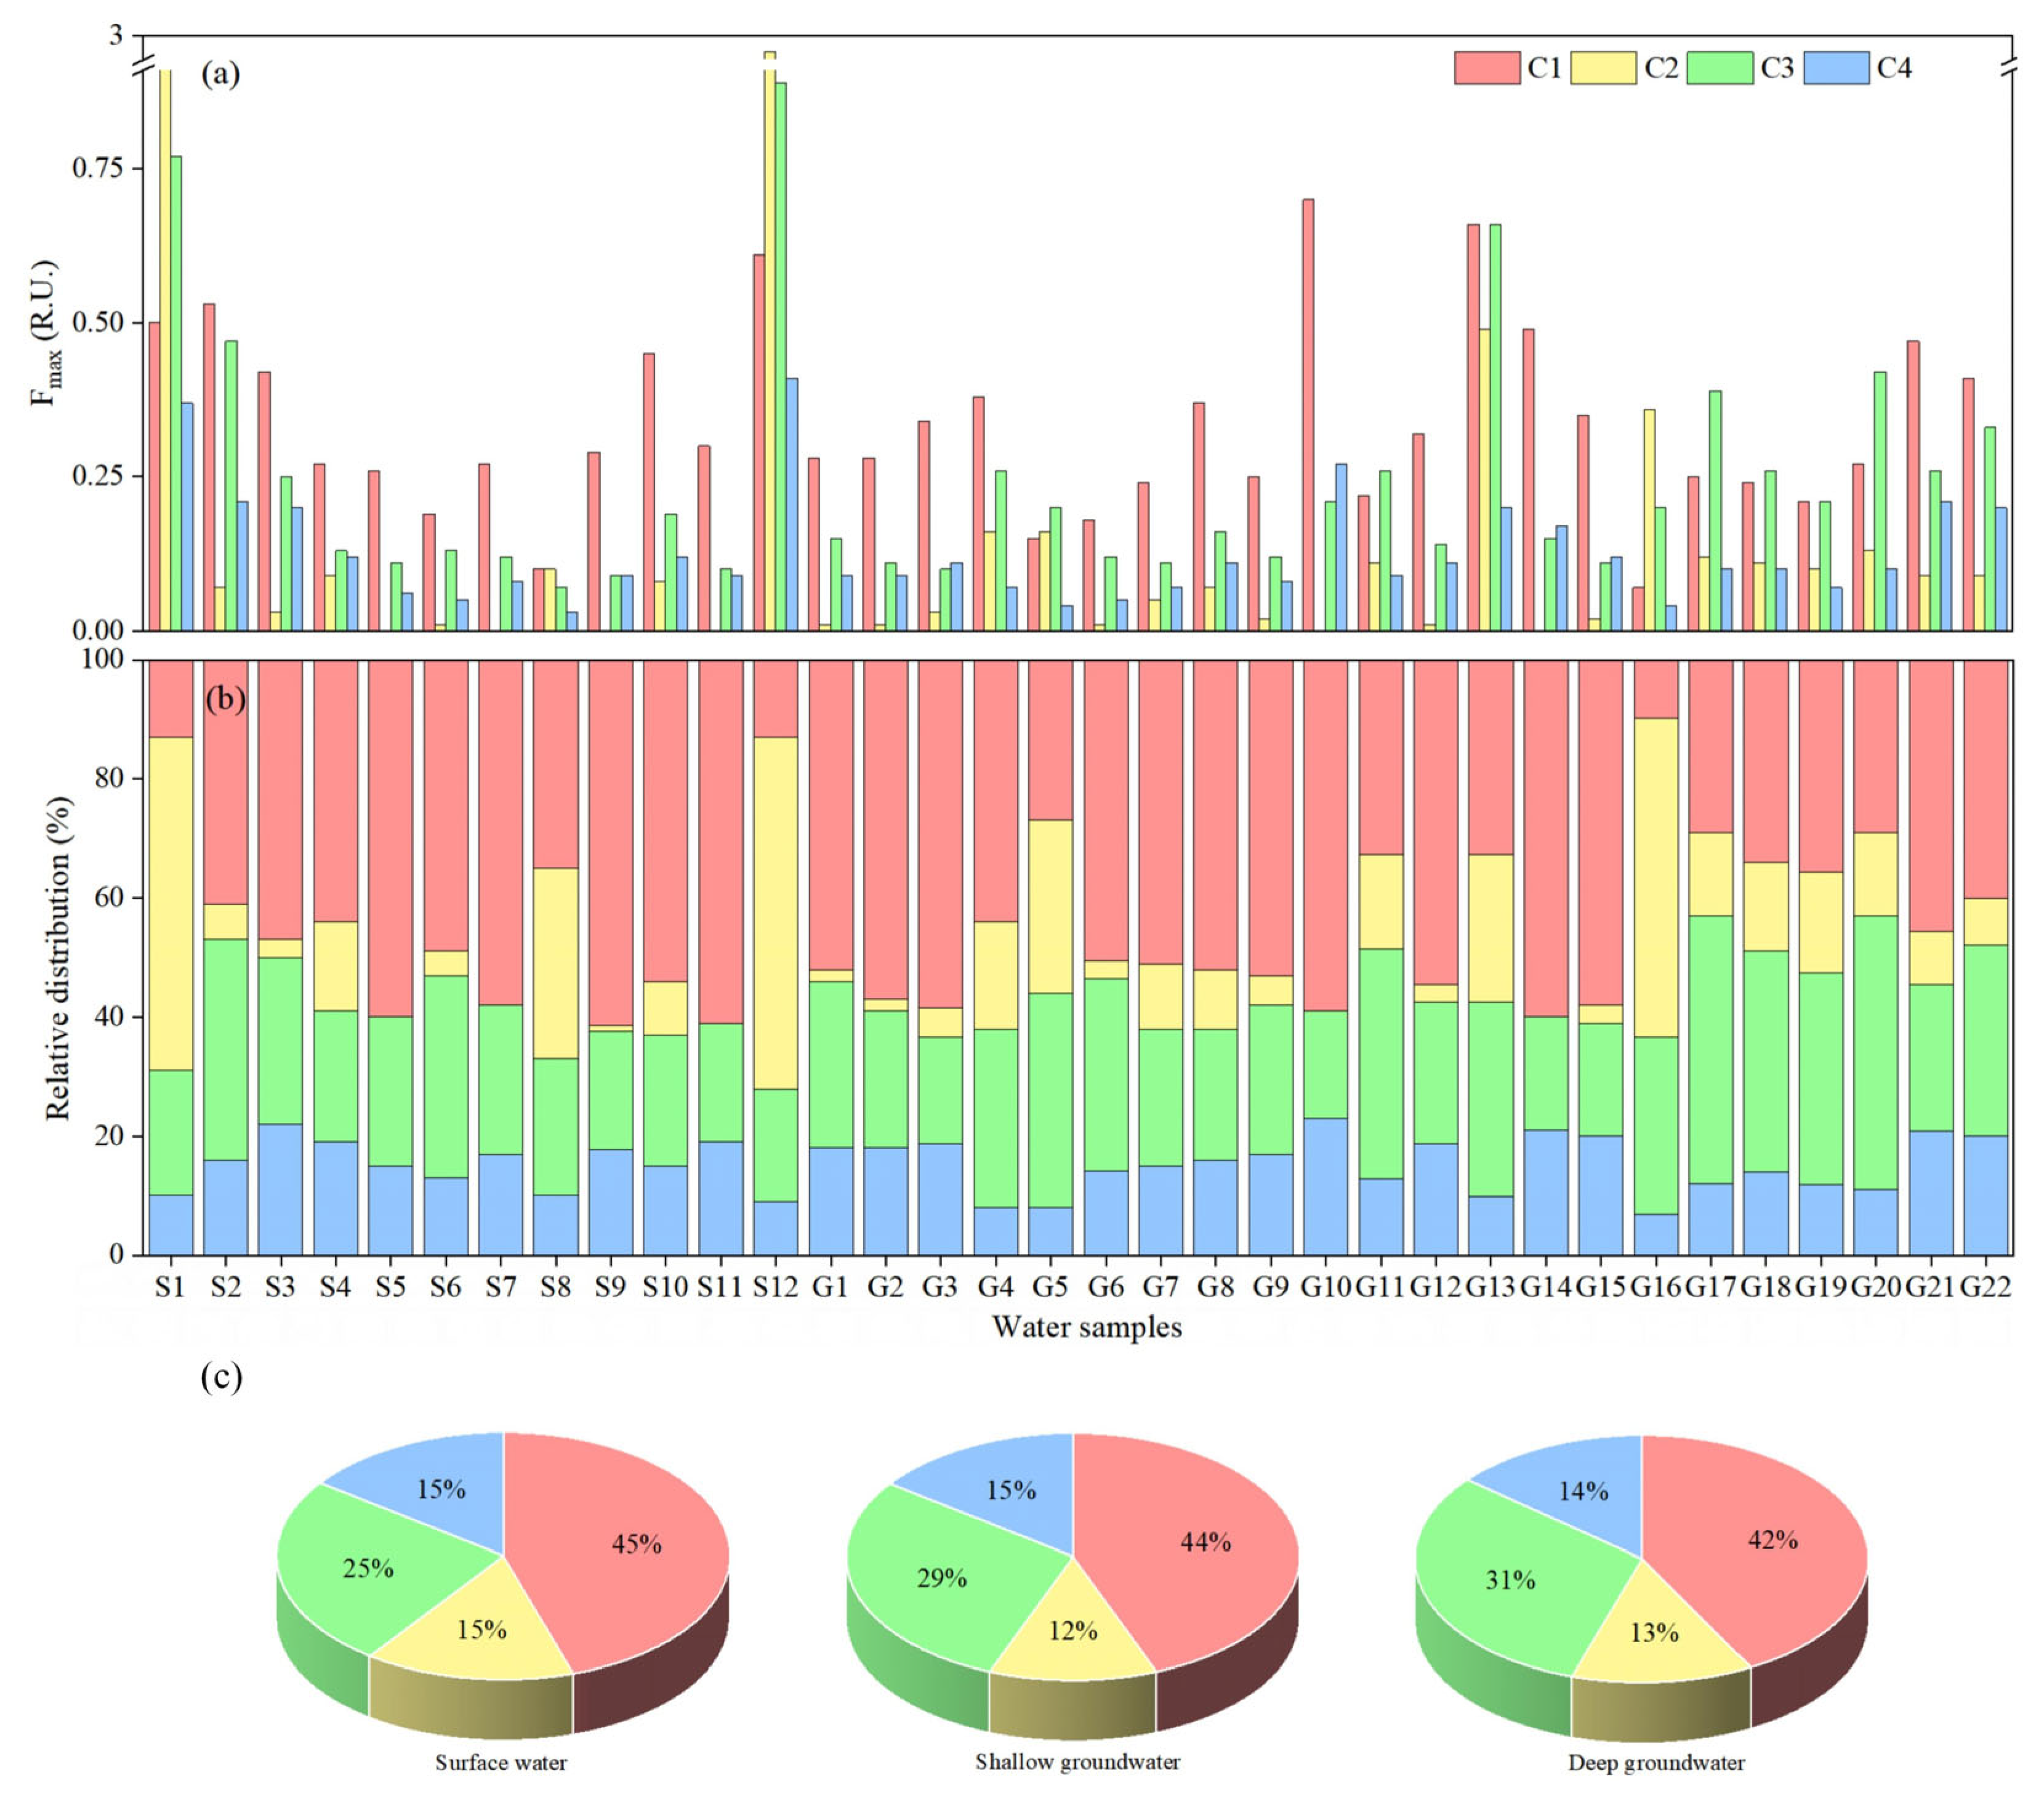
The PARAFAC model quantified the maximum fluorescence intensities (Fmax, R.U.) of four DOM components in surface water and groundwater systems [4,43]. Component abundance varied significantly among sampling sites (Figure 5a). S1 and S12 showed exceptionally high levels of tryptophan-like components (C2 and C3) despite not exhibiting the highest DOC concentrations, a pattern potentially linked to localized material inputs (Table S1). Groundwater samples from flower cultivation areas (G10, G13, G14, Table S1) contained relatively high concentrations of C1, likely derived from microbial degradation of organic fertilizers (chicken/pig manure) used in these greenhouses [69]. Harjung et al. [70] demonstrated through regional chromatographic modeling that microbial processing of bioavailable organic matter plays a pivotal role in DOM transformation during its subsurface transport. Their findings indicate that groundwater-infiltrating DOM predominantly comprises hydrophilic low-molecular-weight compounds enriched with microbial metabolic byproducts. Relative abundance analysis (Figure 5b) showed a significant increase in C2 concentration in G16 (residential area), suggesting the input of untreated sewage rich in tryptophan-like compounds [71].
As shown in Figure 5c, the relative abundance of fluorescence components in both surface water and groundwater (shallow and deep) follows the order C1 > C3 > C4 ≥ C2. Specifically, C1 exhibits significantly higher abundance in surface water compared to groundwater, with particularly pronounced differences observed in deep aquifers. This distribution pattern is strongly associated with intensive organic fertilizer application in agricultural regions, as microbial degradation of these fertilizers generates substantial quantities of C1 [25,38]. In addition, pumped irrigation further introduces C1 from groundwater into rivers, causing mixing of DOM components between surface water and groundwater (e.g., at sites S5–S7 on the Fengshou River). Notably, C1 in surface water can also enter shallow aquifers through vertical infiltration. C3, a tryptophan-like component indicative of microbial DOM degradation [23], dominates in groundwater, likely due to enhanced organic matter breakdown—especially in deep aquifers during non-monsoon periods [64,68]. In contrast, C2 (anthropogenically influenced tryptophan-like material) is more prevalent in surface water. The lower C4 levels in deep groundwater suggest either removal in shallow aquifers or isolation from surface inputs [23,38]. In the intensively farmed arid regions of northwestern China, irrigation return flows promote the downward migration and shallow aquifer (<50 m) accumulation of terrestrial humics [25]. Notably, some humic substances, such as fulvic acid, have been shown to resist degradation, which makes it possible to use them as stable tracers for exogenous DOM inputs [13,68].
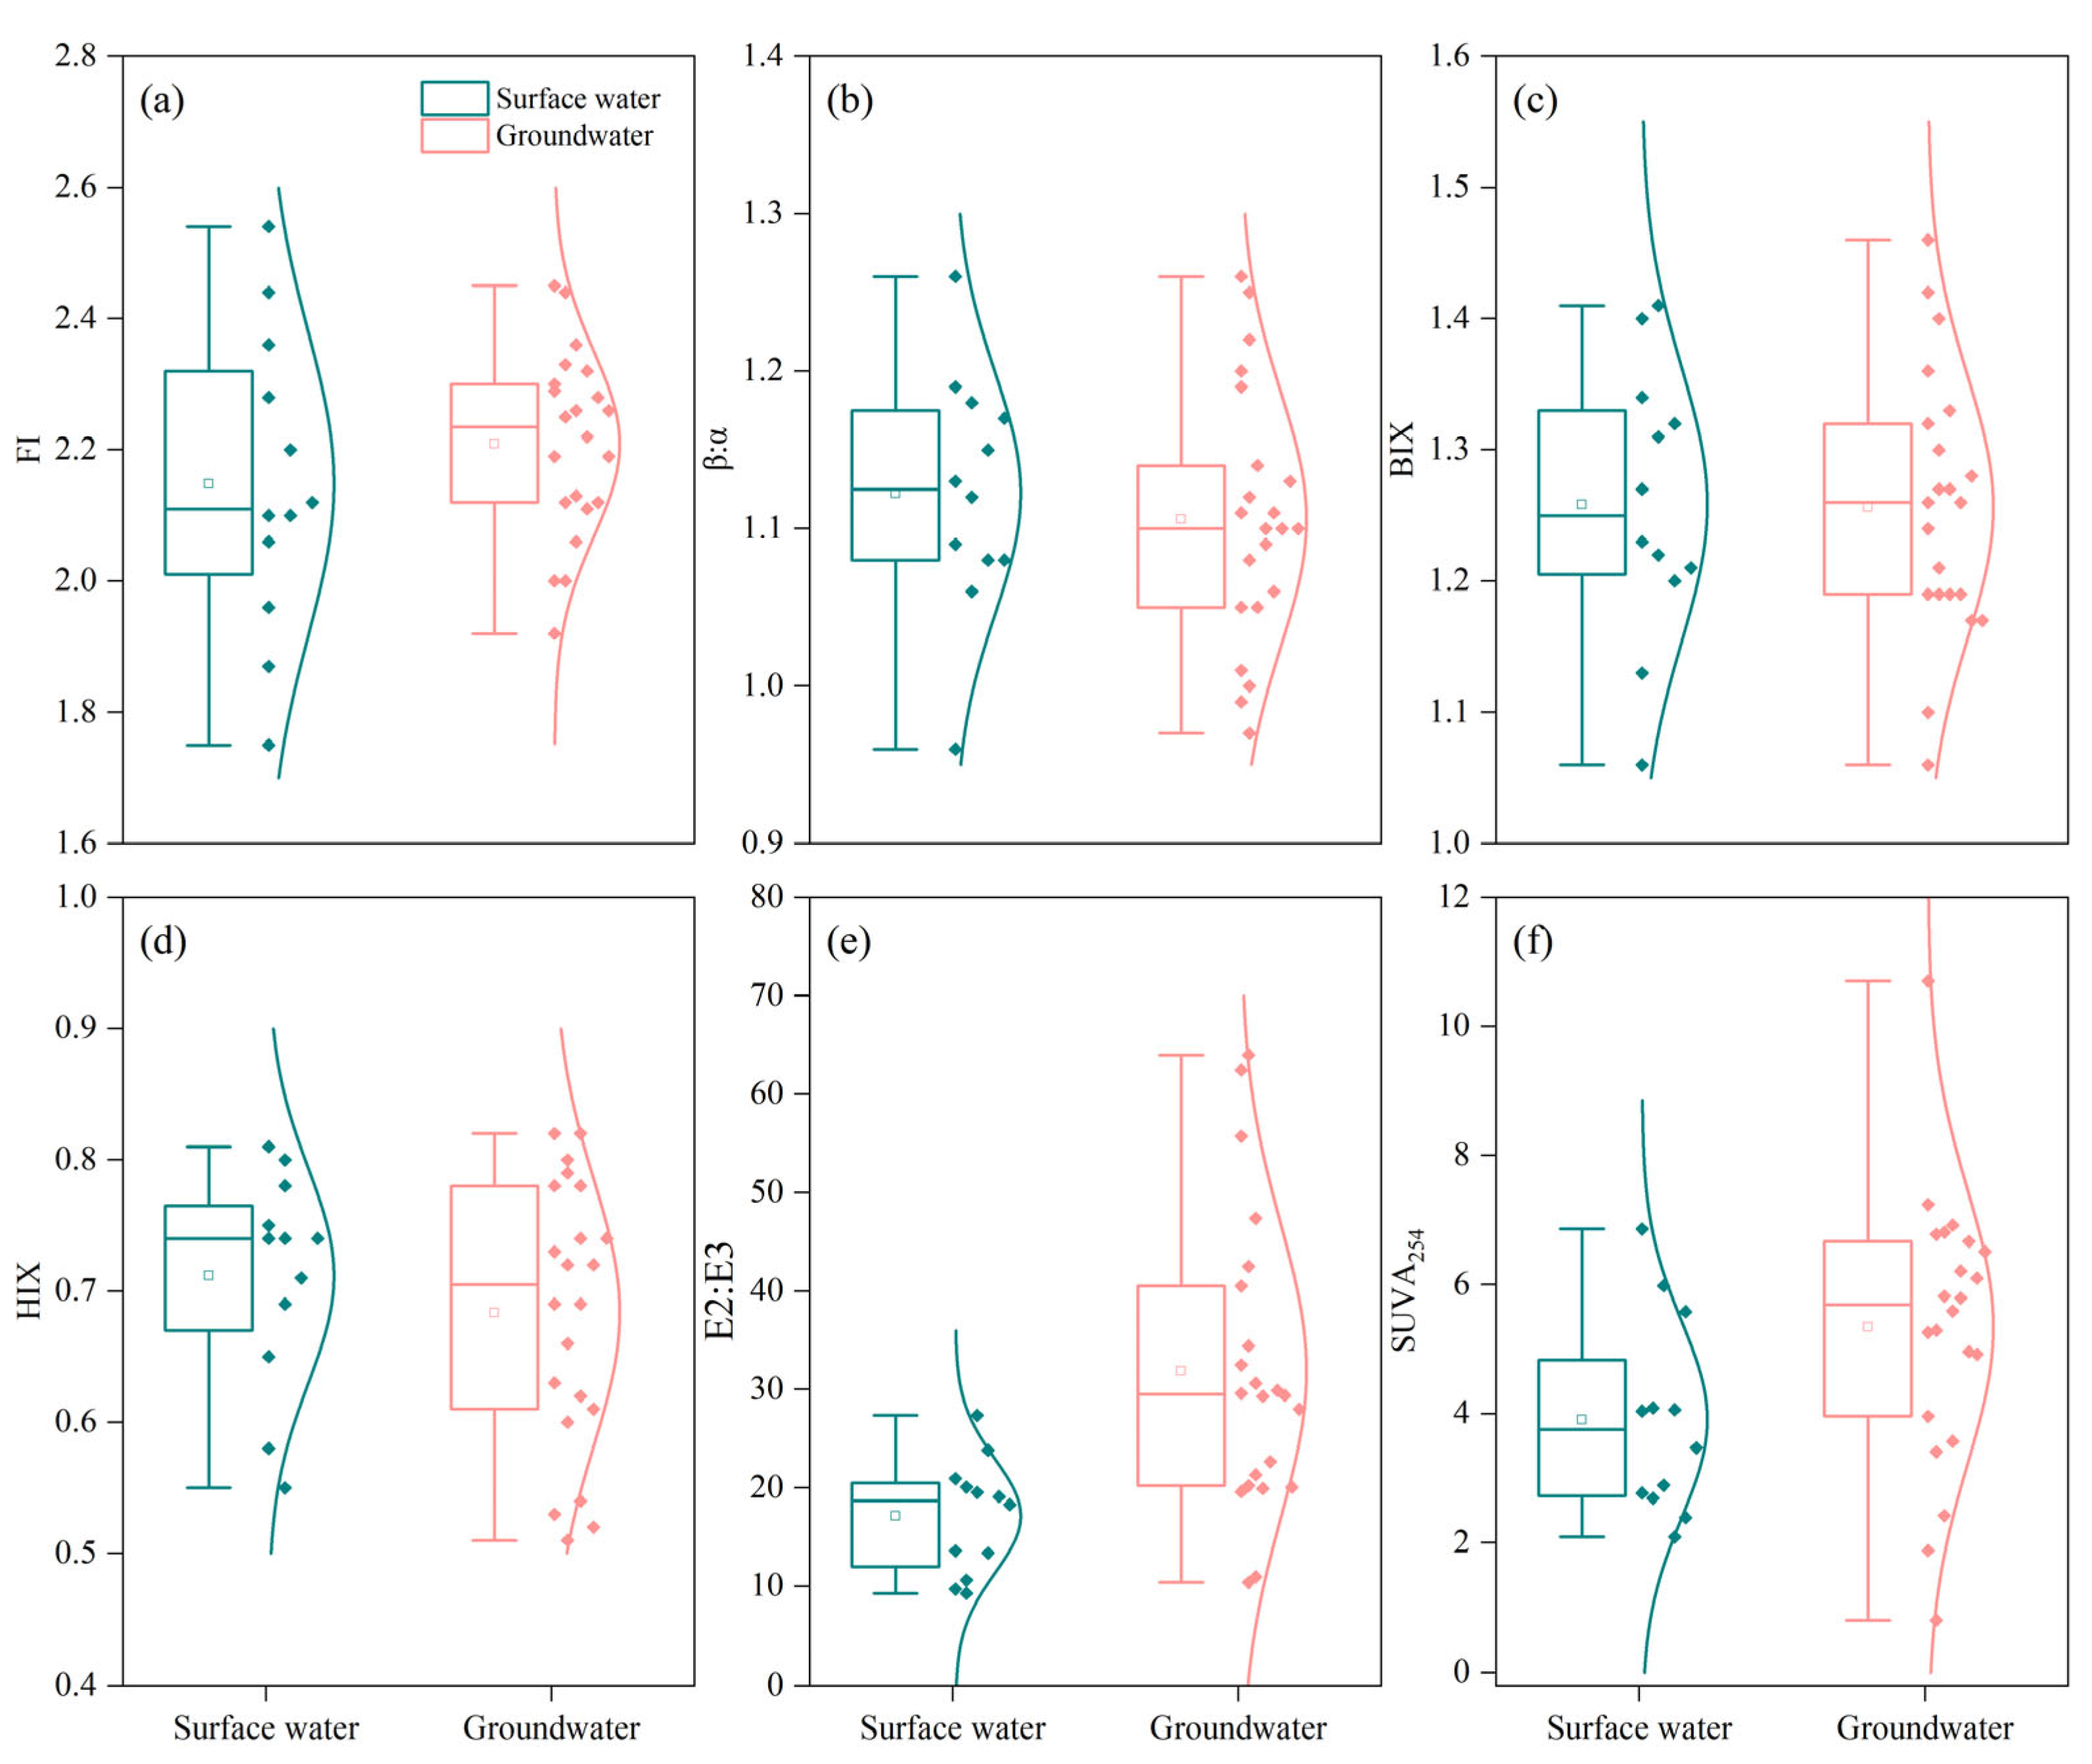
Comparative analysis of spectral indices between surface water and groundwater (Figure 6) revealed distinct DOM characteristics. FI>1.9 in both water types indicated predominant microbial origins (Table S3) [4], consistent with reduced external inputs during winter’s low rainfall and flow conditions. Wang et al. [22] found that FI values in groundwater ranged from 1.28 to 1.65, indicating that groundwater systems in summer contain more DOM of terrestrial origin than DOM of microbial origin. The comparable β:α ranges (0.96/0.97–1.26/1.26) reflected similarly constrained biological decomposition under low temperatures, aligning with Du et al. [72] observation of less fresh winter DOM. BIX (>0.8) and HIX (<4) values demonstrated strong microbial influence and limited humification [9], further supported by regional parameter distribution patterns (Figure S2, Table S3). Notably, Yang et al. [64] found that low HIX values in surface water may be attributed to the mixing of groundwater with surface water, which contains fresher, microbially derived, and insufficiently humified organic matter originating from domestic sewage and other wastewater inputs. UV spectral analysis provided additional compositional insights [12]. Groundwater exhibited greater E2:E3 variability than surface water, indicating smaller DOM molecular weights resulting from preferential adsorption of humic substances by aquifer minerals and biodegradation [13,70]. Higher SUVA254 in groundwater (~6 vs. surface water’s ~4) confirmed greater aromaticity, likely due to microbial activity-driven humification of aquifer sediments [68]. Studies have found that winter water bodies exhibit higher aromaticity and double bonds compared to summer water bodies, with significantly enhanced resistance to degradation [72].

3.3. DOM Components Variation Sequences

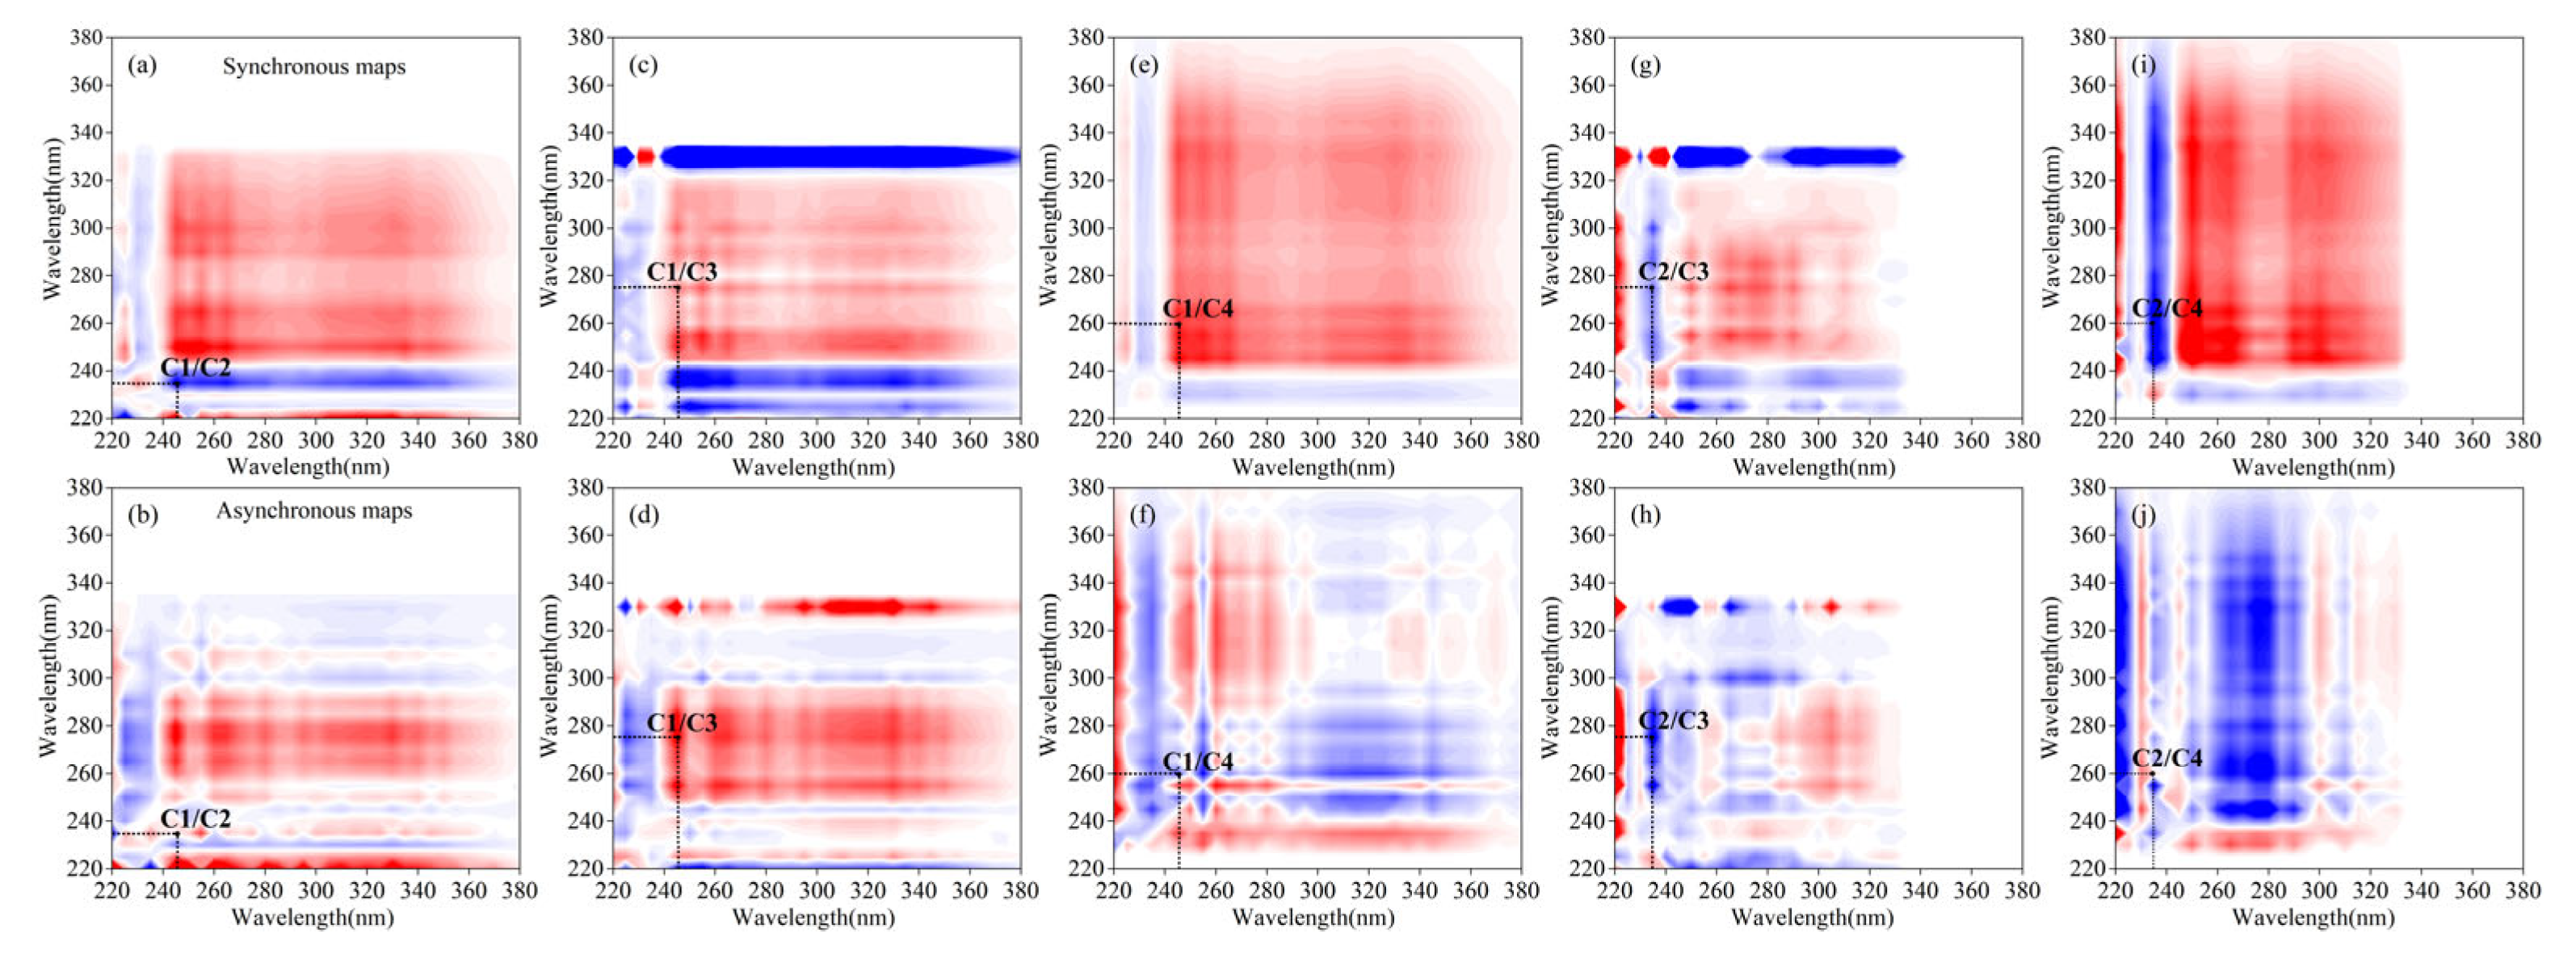
While traditional methods like PARAFAC can characterize the static distribution of DOM components, they lack the capability to resolve changes in fluorescence signatures under external perturbations (e.g., river supply gradients) [7]. To address this limitation, we employed hetero-2DCOS to track the sensitivity and sequential variations of fluorescence components along both PR and VR river flow directions, aiming to reveal the key impacts of hydrological processes on DOM transformation under agricultural practices [7,33]. In the PR direction (Figure 7), synchronous and asynchronous 2D-COS revealed two key transformation sequences [54]: (1) C1→C3 (positive correlation) and C2→C3 and C4→C2 (negative correlation), and (2) C2→C1 and C4→C1 (inverse synchronous-asynchronous correlation patterns). These results establish the complete variability sequence as C4→C2→C1→C3 (Table 2), indicating preferential transformation of terrestrial humic substances over tryptophan-like and microbial humus, consistent with Ding et al. [7]. Xing et al. [61] showed that accelerated groundwater flow caused by irrigation pumping may lead to phase separation between sediment-adsorbed and dissolved components, thereby promoting the migration of DOM in aquifer sediments, particularly terrestrial humic substances [73]. Studies have shown that compared to complex terrestrial humic substances, relatively simple microbial humic substances are preferentially produced and stored in aquatic ecosystems [74]. Notably, the preferential migration of terrestrial humic substances along the PR may promote the transport of adsorbed pollutants and influence the formation of disinfection byproducts in downstream water bodies [75].
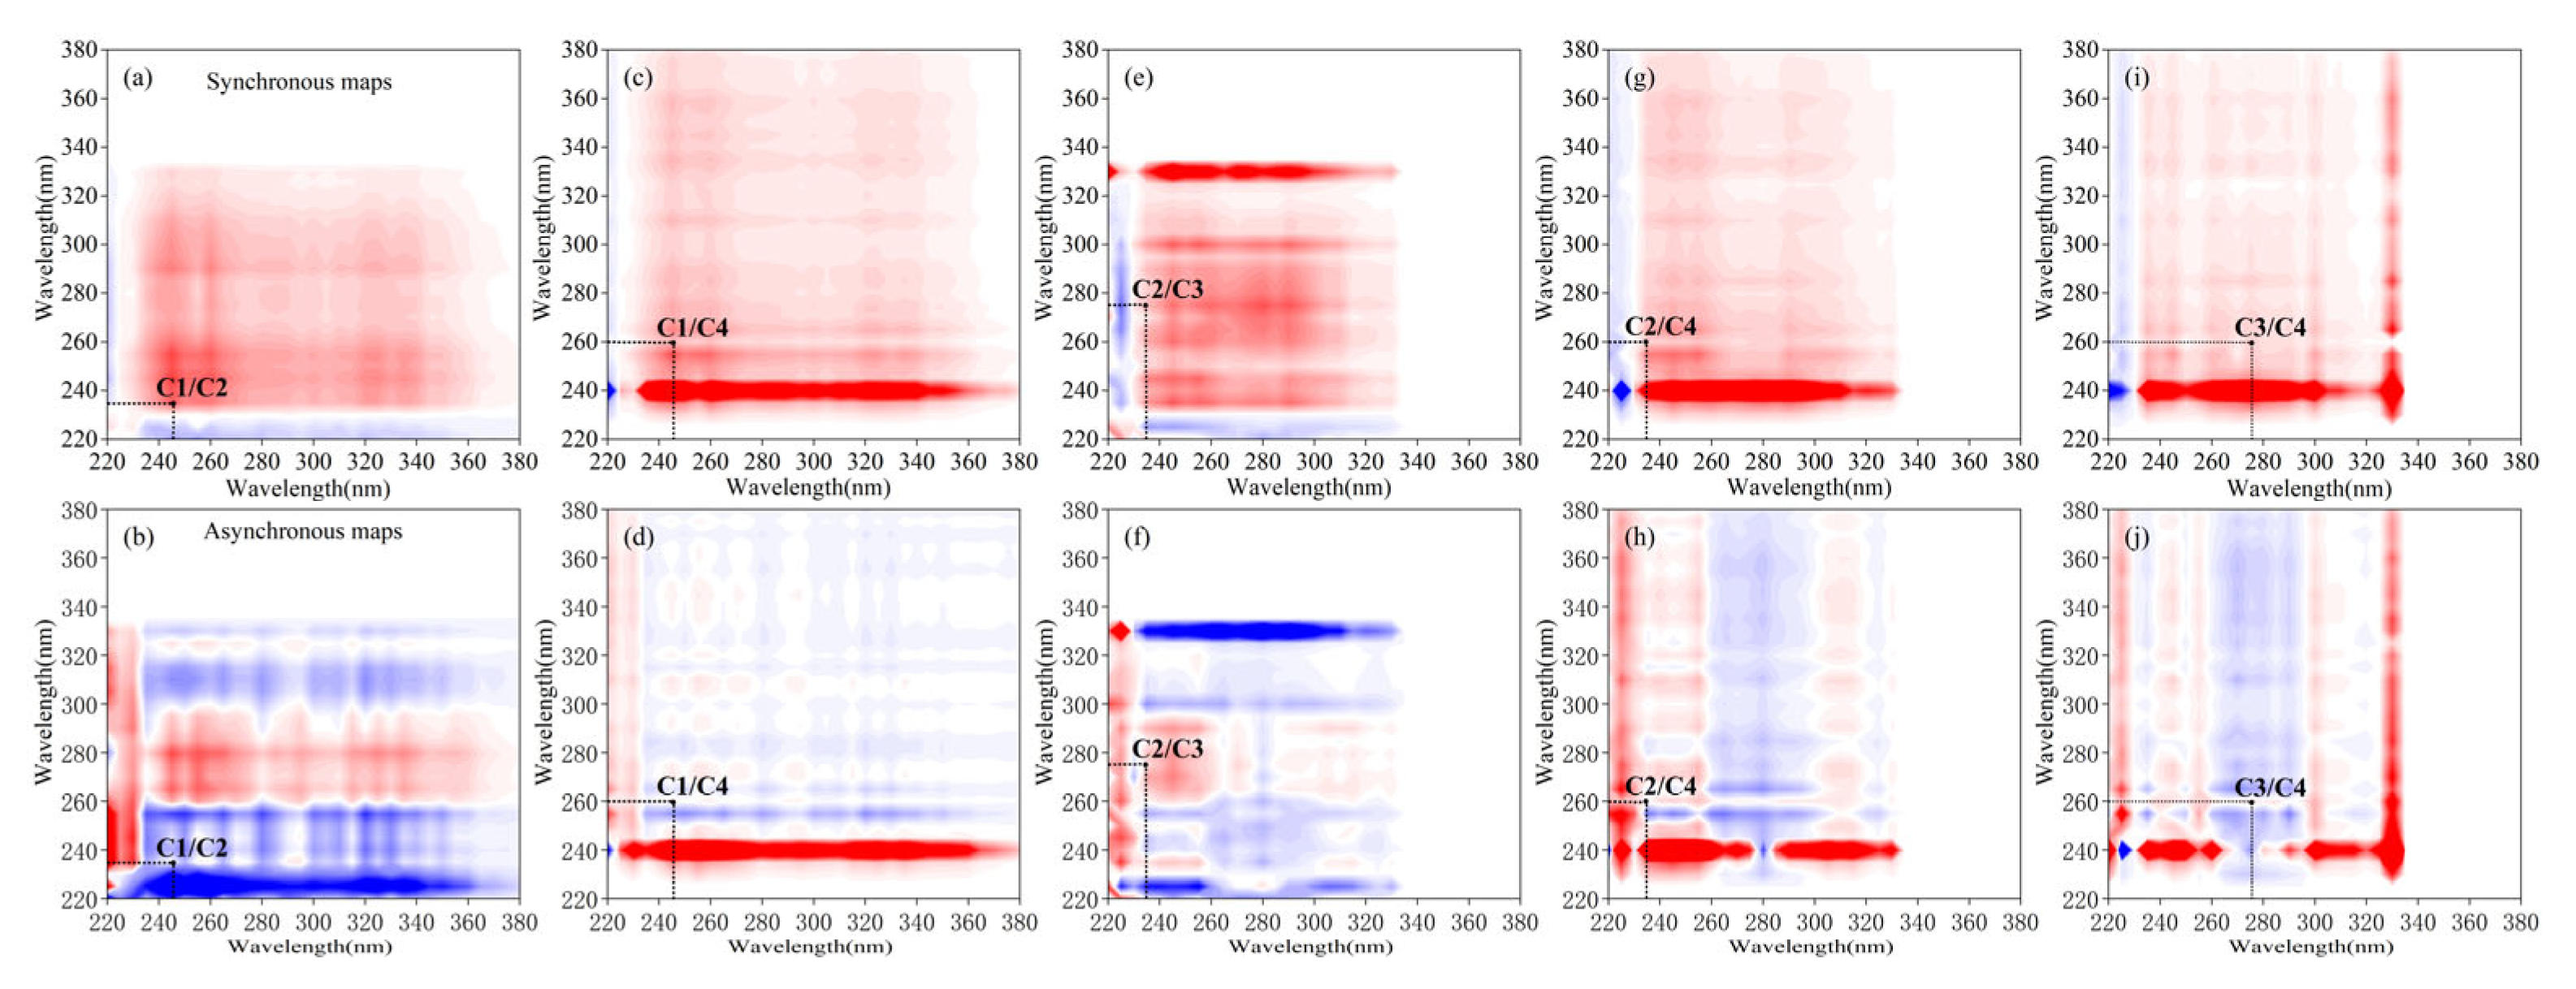
According to Noda’s rule [54], the variability order of DOM components in the VR direction can also be determined as C1→C2→C3→C4 (Figure 8, Table 2). This indicates that protein- and microbial-related components in the VR direction are more prone to transformation due to their higher mobility and biodegradation potential [7,76,77]. Previous 2D-COS studies on the dynamics of DOM composition in groundwater around landfills demonstrated that rapid fluctuations in humic and protein-like components resulted from leachate-derived nutrients stimulating microbial activity, consequently elevating microbial byproduct concentrations (particularly proteinaceous substances) in groundwater [78]. Similarly, in our study area, intensive organic fertilizer application in agricultural zones has created optimal conditions for enhanced microbial metabolism in groundwater, potentially explaining the observed changes in fluorescent components. Therefore, optimizing fertilization timing and dosage in this catchment is essential to minimize the release of bioavailable organic matter and reduce groundwater pollution risks [4,26]. The above research results highlight the necessity of incorporating hydrological flow paths into pollution management strategies for small agricultural catchments, and have significant implications for ecological and water quality management [7].

3.4. Classification and Visualization

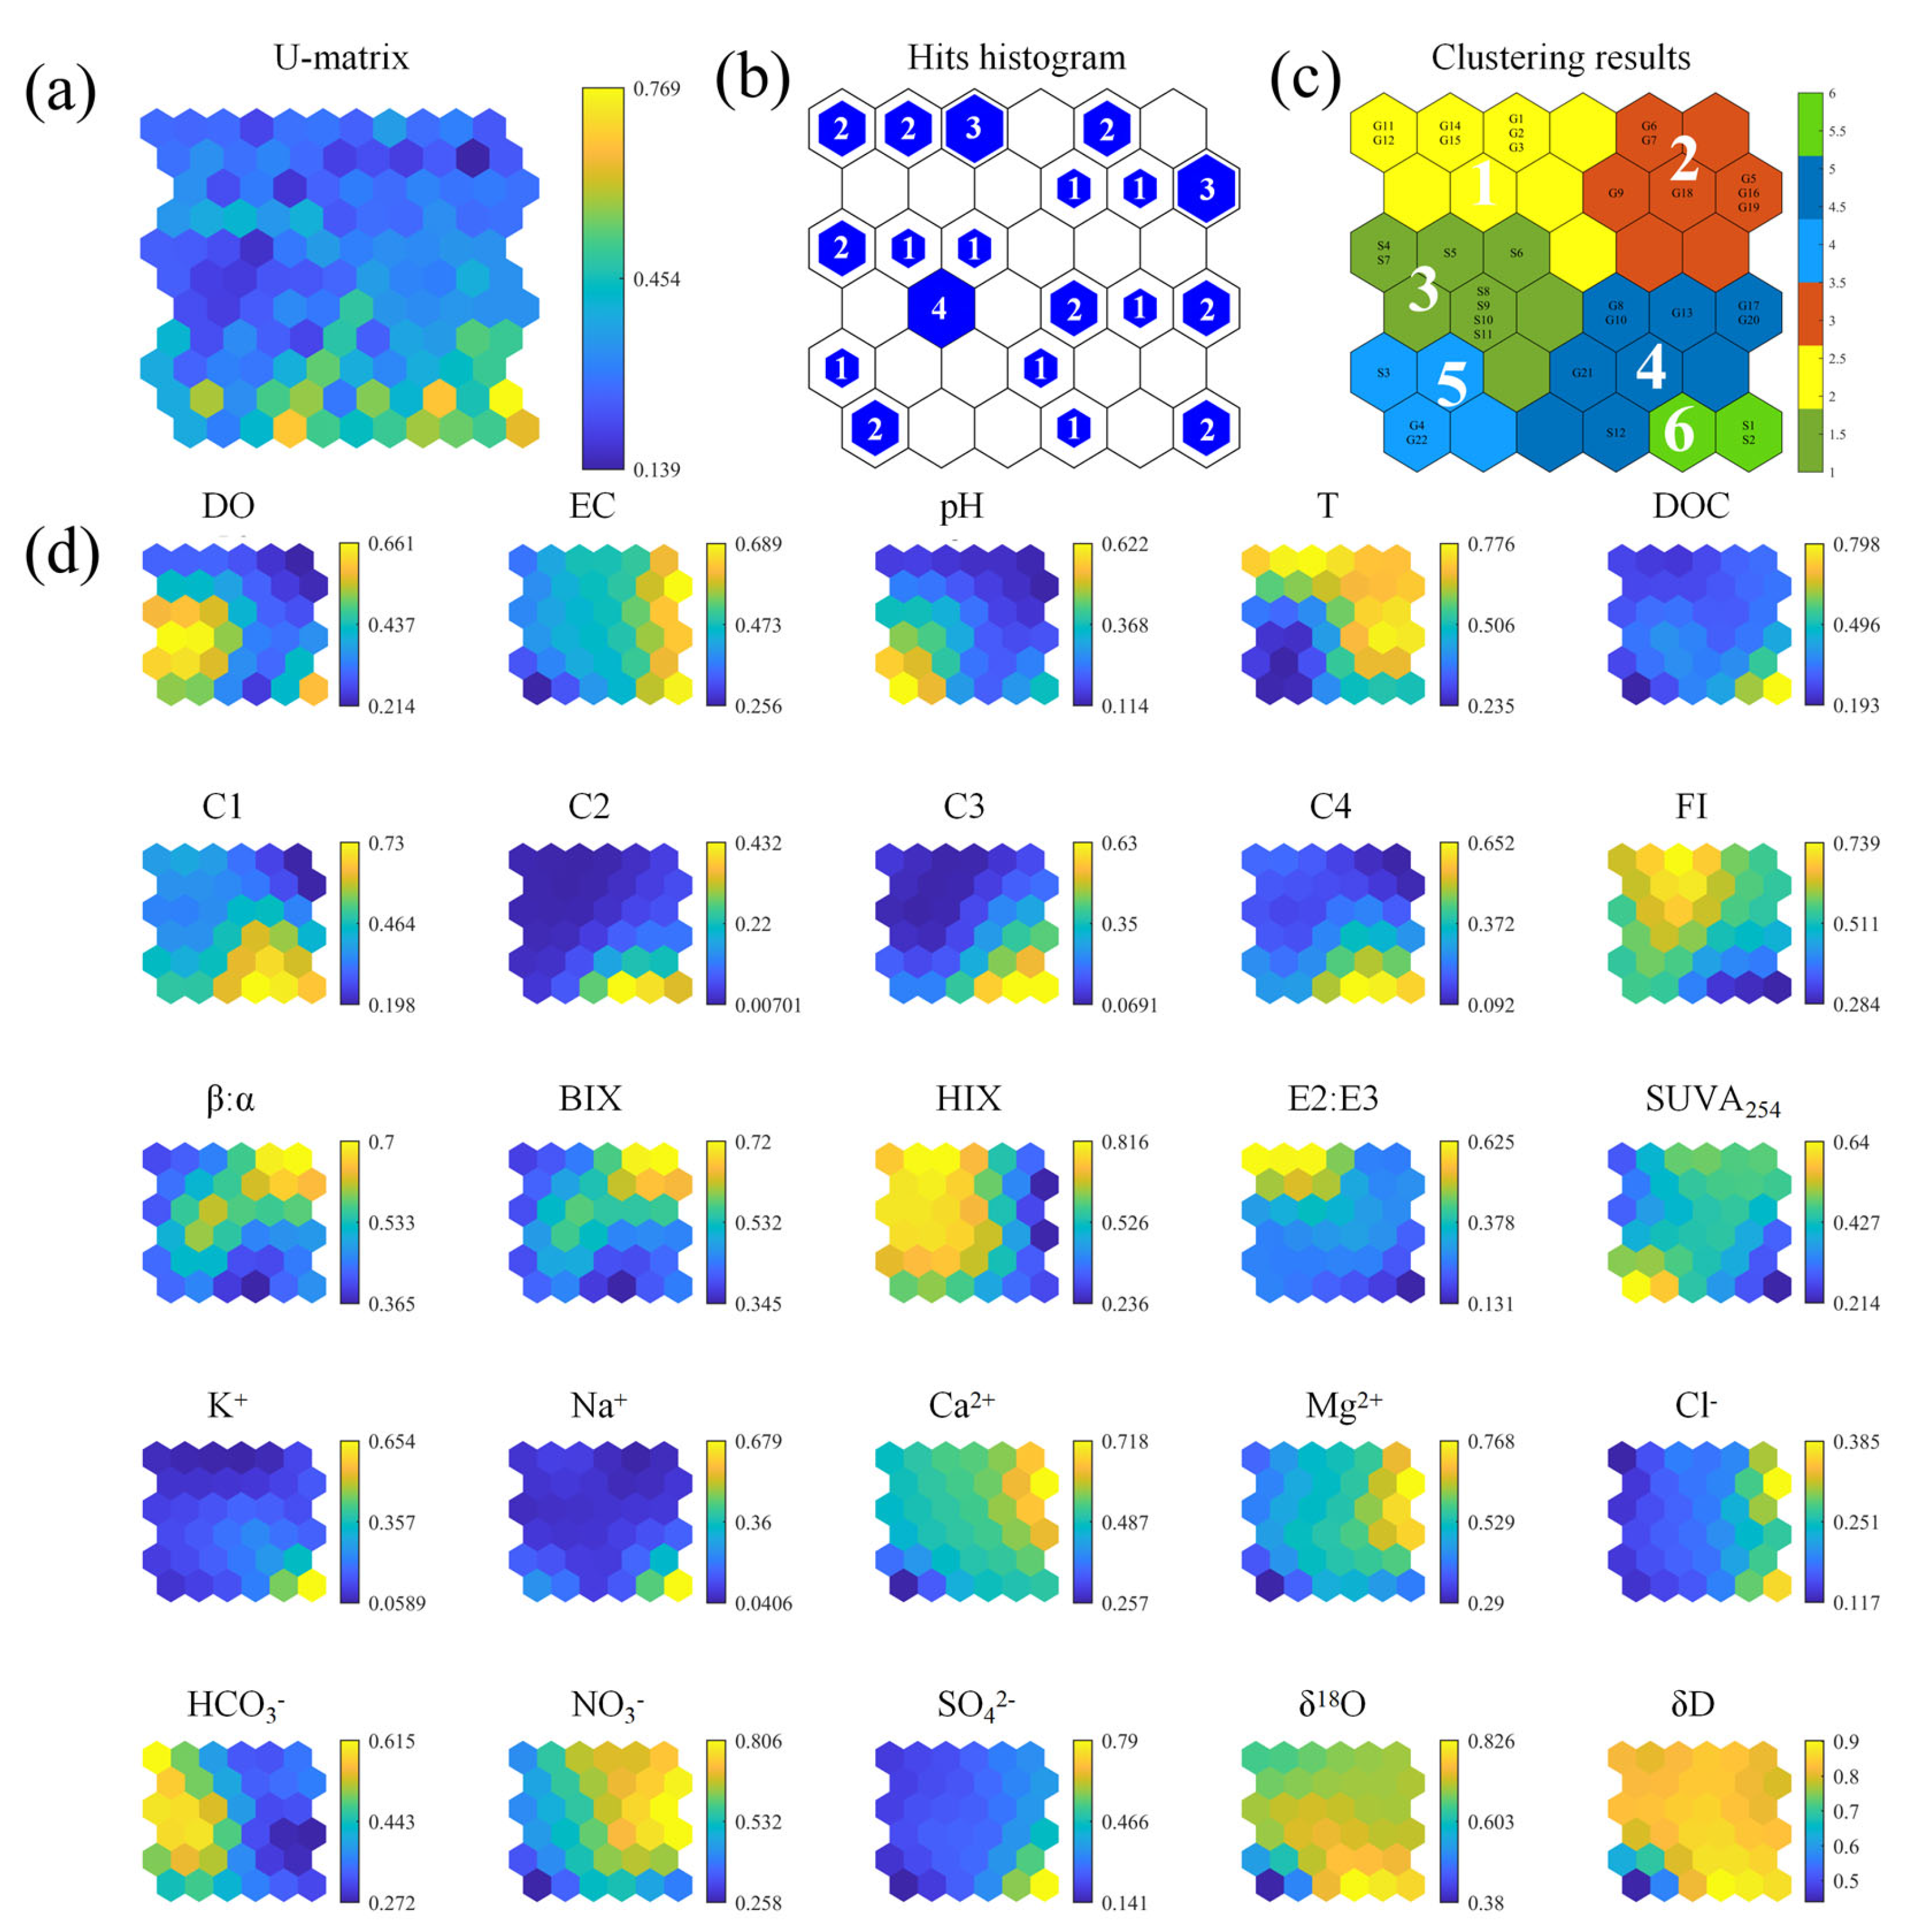
Kohonen’s SOM, an artificial neural network algorithm, enables visualization of geometric correlations in fluorescence component data without prior assumptions [57]. As demonstrated in Figure 9a, the SOM network revealed significant dissimilarity between upper and lower neuron clusters [56], effectively differentiating sample characteristics. For enhanced sample distribution analysis, Figure 9b presents the hit histogram quantifying the frequency at which each neuron emerged as the winning neuron for water samples [32]. Neurons with higher hit counts correspond to water samples with similar characteristics (Figure S1b) [79]. Our results demonstrated that surface water exhibited peak representation (4 hits) and groundwater samples showed secondary prominence (3 hits). K-means clustering of neurons yielded six distinct clusters (Clusters 1–6, Figure 9c), with complete sample distribution mapping [80]. Groundwater samples predominantly occupied the upper-right SOM region (Clusters 1, 2, 4), while surface water samples concentrated in the lower-left area (Clusters 3, 5, 6). Interestingly, both the G4 and G22 deep groundwater samples were assigned to Cluster 5, while the S12 sample, which exhibits strong evaporation, was assigned to Cluster 4. This suggests that the groundwater in these clusters has a fairly direct connection to surface sources [70], although this was not captured in the present study. Building upon the analytical results presented in Section 3.2, which identified potential surface water–groundwater mixing at the Fengshou River (sites S5–S7), we hypothesize that comparable hydrological interactions may exist at other sampling locations within Cluster 3. However, additional investigation is required to verify. Previous studies have shown that combining DOM fluorescence with SOM can serve as a rapid monitoring tool for identifying sensitive recharge areas of surface–groundwater interactions affected by human activities [70]. Cluster 6 (S1 and S2) grouping reflects DOC concentration patterns (Table S1), where downstream sample S2 showed reduced DOC relative to upstream S1, indicating dilution effects at the Xier-Mi River confluence. In a previous study, Zhou et al. [30] classified SOM clusters based on differences in precipitation dilution of nitrogen concentrations before and after the rainy season.
Figure 9d displays the SOM component plane analysis of 25 parameters following network training, revealing consistent color patterns that indicate positive correlations between parameters [32]. Our analysis demonstrates three key findings: (1) C2 and C3 show parallel color gradients (intensity increasing from top-left to bottom-right), confirming their strong positive correlation. Figure 10’s correlation coefficients quantitatively confirm this intuitive observation, and both belong to the tryptophan components (Table 1). (2) C1 and C4 exhibited distinct gradient patterns corresponding to their different origins (microbial degradation vs. terrestrial input). (3) C2/C3 displayed correlated patterns with Cl (extremes at upper-left/lower-right), implicating human activities (e.g., domestic wastewater) as their common source [71]. In addition, concordant β:α and HIX gradients (upper-right extremes) confirmed the microbial origin of DOM components.

3.5. Results of Pearson’s Correlation Analysis

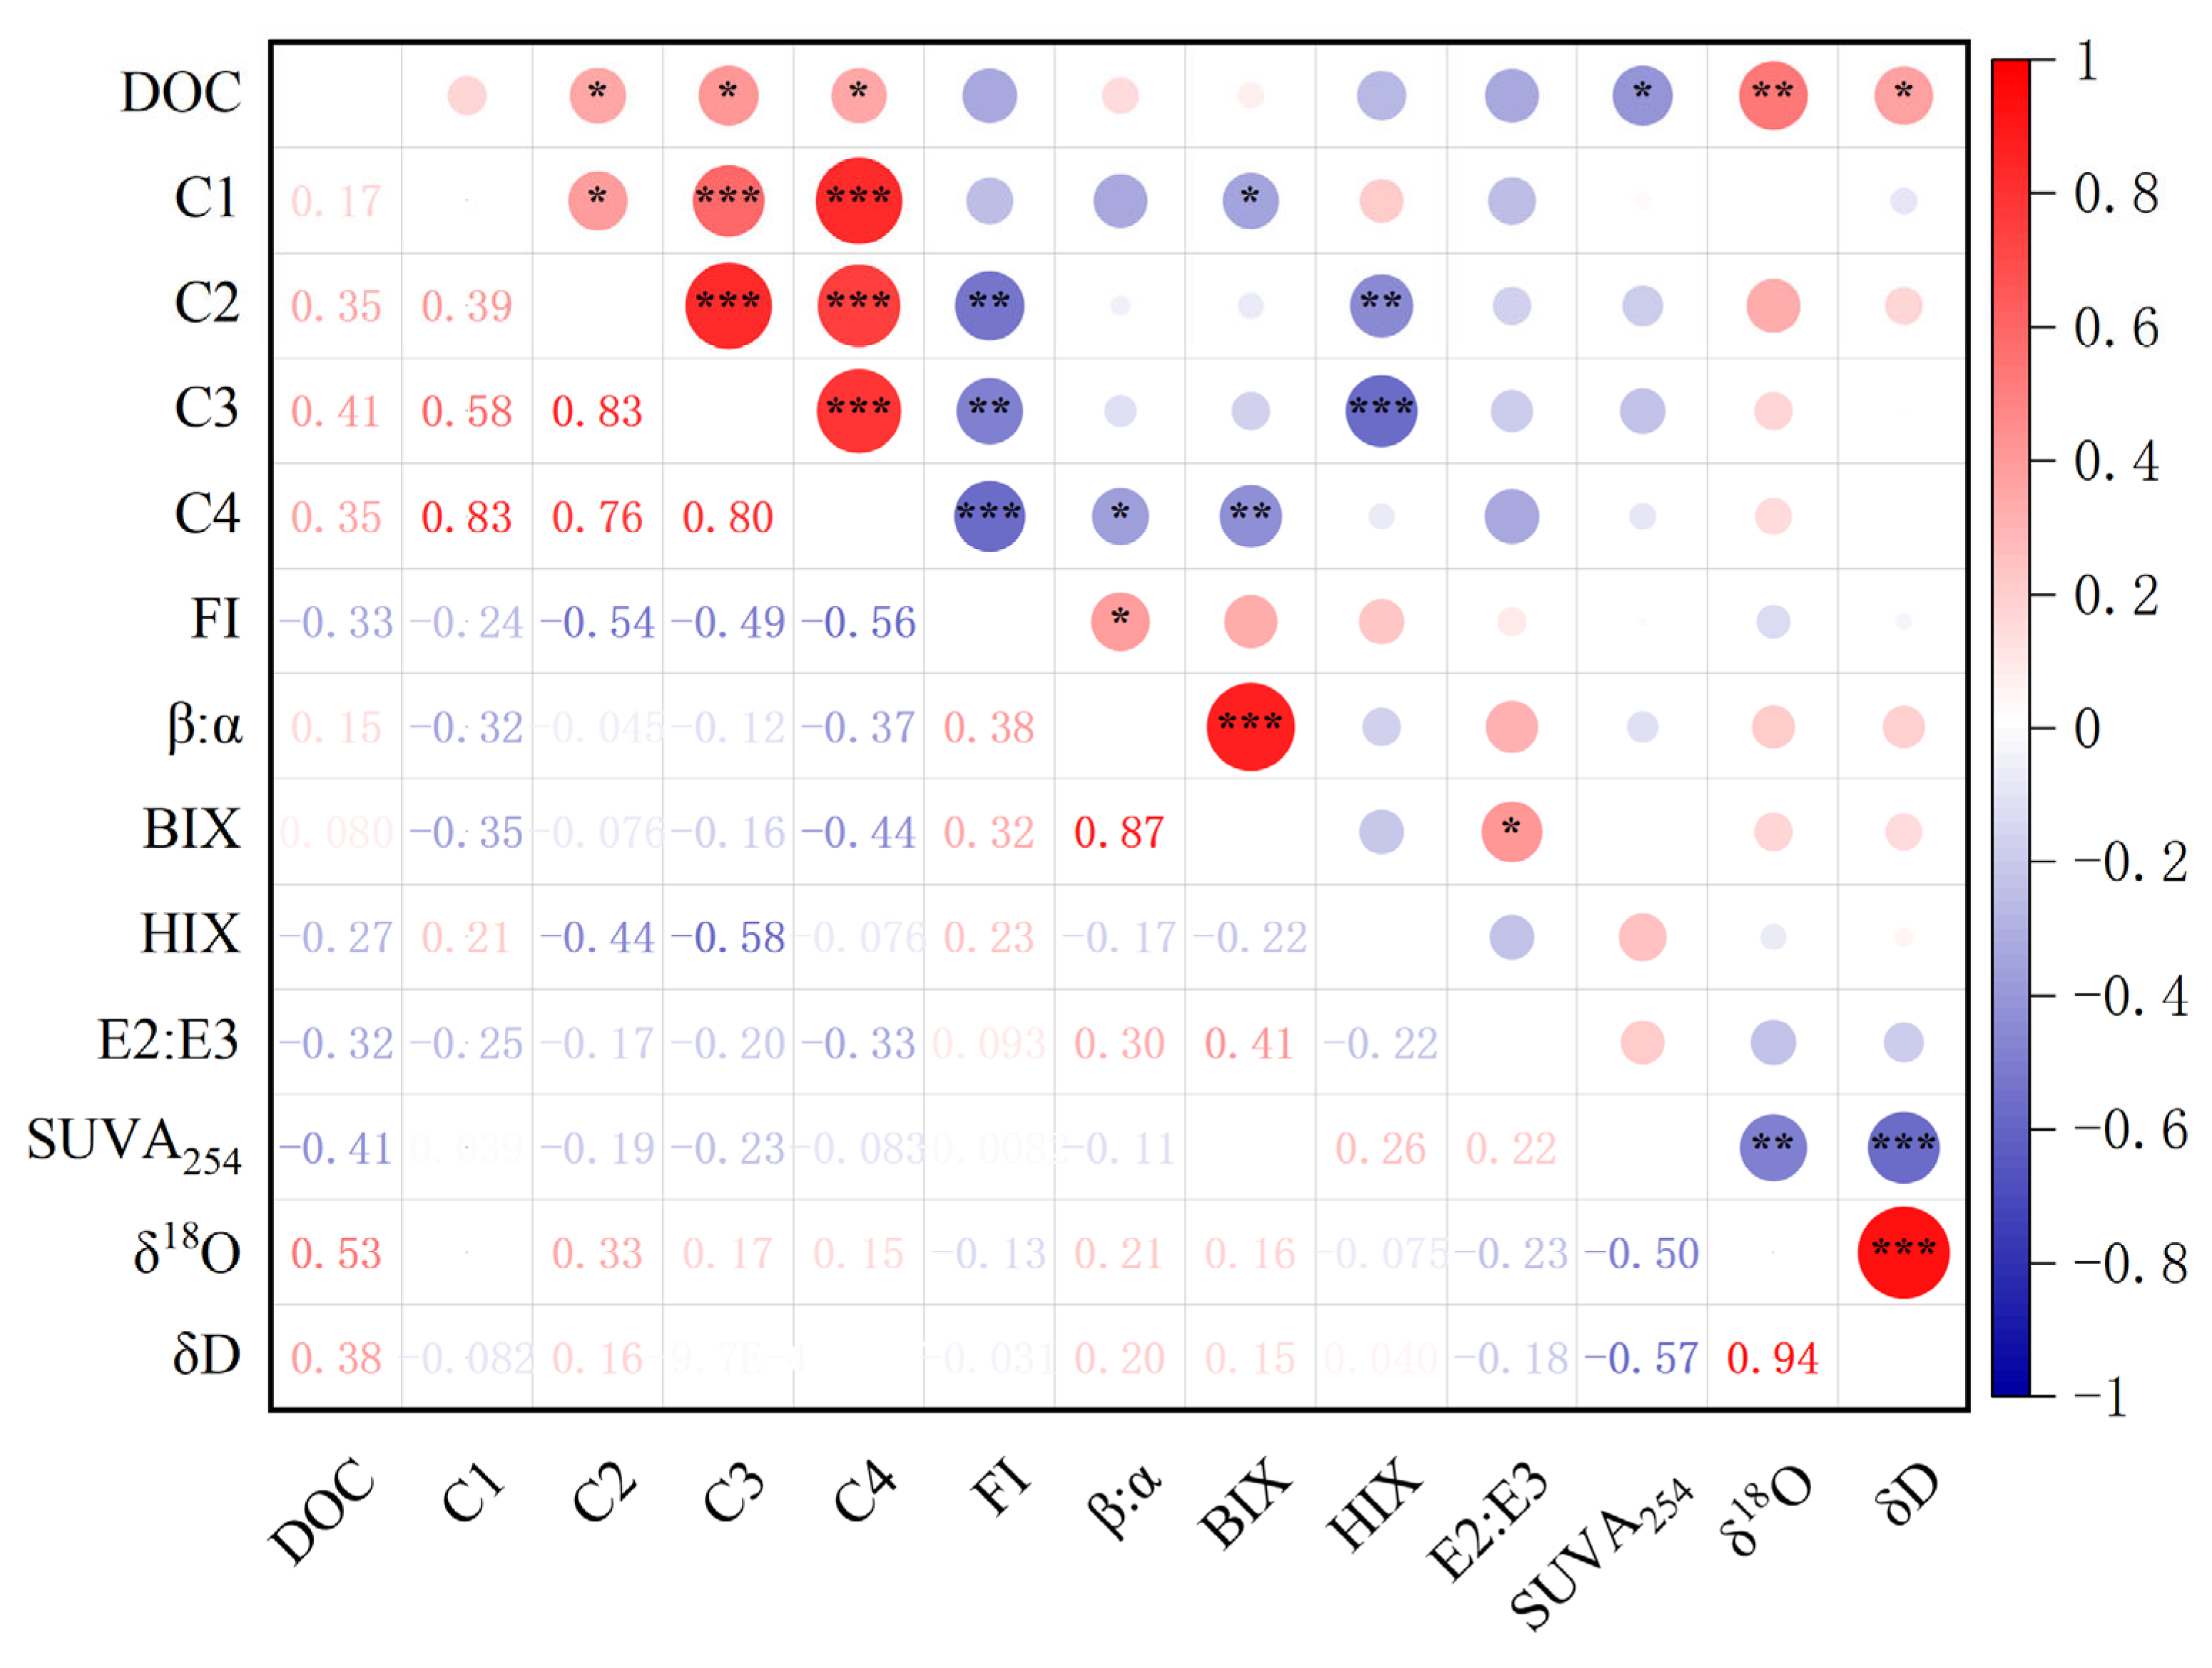
Figure 10 presents the Pearson’s correlation analysis among DOM content, PARAFAC components, spectral indices, and stable water isotopes. DOC content was positively correlated with all four fluorescent components and δD (p < 0.05) and showed a stronger correlation with δ18O (p < 0.01). Xing et al. [61] demonstrated a positive correlation between δ18O values and DOC, suggesting that groundwater DOM composition is significantly influenced by mixing with surface water-derived DOM. Our findings further indicate that this mixing process is likely enhanced by irrigation pumping activities, which facilitate increased hydraulic connectivity between surface water and groundwater systems in the study area. While isotopic signatures partially reflect DOM content variations, their utility for tracing recharge source influences on DOM dynamics requires further investigation. Although δ18O and δD generally showed weak correlations with DOM components and most spectral indices, they displayed significant negative correlations with SUVA254 (p < 0.01 and p < 0.001, respectively), suggesting their potential utility as indicators of DOM aromaticity. Strong inter-component relationships were observed, with C1, C2, and C3 showing highly significant positive correlations with C4 (p < 0.001). The particularly strong positive correlation (p < 0.001) of C1 and C3 supports their shared microbial degradation/metabolism origin [73]. In addition, according to Yang et al. [81], some tryptophan compounds may also leach from agricultural fertilizers, which may be the same source as microbial humus. The β:α index was significantly positively correlated with BIX (p < 0.001), which is consistent with the conclusions drawn from SOM (Figure 9).

3.6. Environmental Implications

Groundwater is an important source of drinking water in water-scarce northern China [82]. In recent years, the development of greenhouse agriculture has inevitably altered the microenvironment of surrounding water bodies, particularly during winter, as winter cultivation of vegetables, fruits, and flowers offers higher economic profitability for producers [3]. A portion of the groundwater extracted for irrigation, which is not fully utilized, carries organic and nitrogen fertilizers into rivers, exacerbating water eutrophication. Another portion flows back into the shallow aquifer, thereby increasing the DOM content in groundwater [4]. Numerous studies have shown that DOM in water bodies contains various functional groups that can potentially bind to pollutants (such as toxic metals and organic pollutants), thereby significantly altering their mobility, bioavailability, and toxicity [10]. In this study, two tryptophan-containing proteins were identified that are precursors of disinfection byproducts (DBPs), which pose a potential threat to drinking water quality and human health [75]. The study results emphasize the importance of agricultural practices (irrigation pumping and organic fertilizer application) on the sources, migration pathways, and environmental behavior of DOM in water bodies surrounding intensive greenhouse agriculture, which is crucial for the effective prevention, monitoring, and management of water quality in agricultural catchments [8,83]. Notably, while this study provides insights into DOM characteristics under winter conditions, future work should incorporate multi-seasonal sampling to fully capture its annual cycle.

4. Conclusions

This study demonstrates that intensive groundwater extraction for irrigation in XER is a key driver of surface–groundwater mixing, significantly influencing DOM dynamics in the greenhouse agricultural catchment during winter. DOM composition was primarily characterized by humic substances from terrestrial inputs and microbial degradation of organic fertilizers, alongside tryptophan compounds derived from domestic sewage and microbial metabolism. Microbial activities strongly dominated the DOM characteristics with limited humification in winter conditions. Notably, humic substances exhibited greater sensitivity to parallel river flow directions, while tryptophan-based proteins showed higher mobility perpendicular to river flow. The integration of SOM with PARAFAC analysis revealed a positive correlation between tryptophan proteins and Cl, confirming their common origin from domestic wastewater discharge. These findings highlight the value of combining DOM parameters with traditional geochemical indicators and complementary analytical methods to elucidate DOM sources, migration pathways, and environmental impacts, thereby providing a robust theoretical foundation for water quality monitoring and management in agricultural catchments.

Supplementary Materials

The following supporting information can be downloaded at: https://www.mdpi.com/article/10.3390/w17182681/s1, Figure S1: (1) Neuron numbers in the SOM and (b) the sample distribution map of SOM analysis; Figure S2: Distribution patterns of DOM fluorescence parameters (FI vs HIX and BIX vs HIX) in different water samples. Table S1: Geographic location, land use, and water quality information of sampling points within the study area; Table S2: Water chemistry information of sampling points in the study area; Table S3: Optical measurement and the corresponding DOM characterization used in this study.

Author Contributions

H.W.: Investigation, data curation, methodology, formal analysis, visualization, writing—original draft. S.S.: Data curation, investigation, writing—review and editing. W.X.: Conceptualization, supervision, writing—review and editing. F.-J.Y.: Conceptualization, methodology, funding acquisition, formal analysis, investigation, supervision, writing—review and editing. All authors have read and agreed to the published version of the manuscript.

Funding

This research was funded by the Key Technologies Research and Development Program of China [2024YFD1701102].

Institutional Review Board Statement

Not applicable.

Informed Consent Statement

Not applicable.

Data Availability Statement

The datasets generated and/or analysed during the current study are available from the corresponding author on reasonable request.

Acknowledgments

The authors thank the editor and anonymous reviewers for their valuable comments and suggestions on this paper.

Conflicts of Interest

The authors declare that they have no known competing financial interests or personal relationships that could have appeared to influence the work reported in this paper.

References

  1. Wang, X.Z.; Dou, Z.X.; Shi, X.J.; Zou, C.Q.; Liu, D.Y.; Wang, Z.Y.; Guan, X.L.; Sun, Y.X.; Wu, G.; Zhang, B.G.; et al. Innovative management programme reduces environmental impacts in Chinese vegetable production. Nat. Food 2020, 2, 47–53. [Google Scholar] [CrossRef]
  2. Ni, B.; Zhang, W.; Xu, X.C.; Wang, L.G.; Bol, R.; Wang, K.Y.; Hu, Z.J.; Zhang, H.X.; Meng, F.Q. Exponential relationship between N2O emission and fertilizer nitrogen input and mechanisms for improving fertilizer nitrogen efficiency under intensive plastic-shed vegetable production in China: A systematic analysis. Agric. Ecosyst. Environ. 2021, 312, 107353. [Google Scholar] [CrossRef]
  3. Ti, C.P.; Luo, Y.X.; Yan, X.Y. Characteristics of nitrogen balance in open-air and greenhouse vegetable cropping systems of China. Environ. Sci. Pollut. Res. 2015, 22, 18508–18518. [Google Scholar] [CrossRef] [PubMed]
  4. Ma, Y.; Liu, Z.-H.; Xi, B.-D.; He, X.-S.; Li, Q.-L.; Qi, Y.-J.; Jin, M.-Y.; Guo, Y. Characteristics of groundwater pollution in a vegetable cultivation area of typical facility agriculture in a developed city. Ecol. Indic. 2019, 105, 709–716. [Google Scholar] [CrossRef]
  5. Wang, X.Z.; Zou, C.Q.; Gao, X.P.; Guan, X.L.; Zhang, Y.Q.; Shi, X.J.; Chen, X.P. Nitrate leaching from open-field and greenhouse vegetable systems in China: A meta-analysis. Environ. Sci. Pollut. Res. 2018, 25, 31007–31016. [Google Scholar] [CrossRef] [PubMed]
  6. Tang, J.F.; Li, X.H.; Cao, C.L.; Lin, M.X.; Qiu, Q.L.L.; Xu, Y.Y.; Ren, Y. Compositional variety of dissolved organic matter and its correlation with water quality in peri-urban and urban river watersheds. Ecol. Indic. 2019, 104, 459–469. [Google Scholar] [CrossRef]
  7. Ding, H.Y.; Zheng, M.X.; Yan, L.; Zhang, X.Y.; Liu, L.; Sun, Y.Y.; Su, J.; Xi, B.D.; Yu, H.B. Spectral and molecular insights into the variations of dissolved organic matter in shallow groundwater impacted by surface water recharge. Water Res. 2025, 273, 122978. [Google Scholar] [CrossRef]
  8. Tong, H.; Gao, R.Z.; Yue, C.; Xie, L.M.; Duan, L.M.; Zhu, Y.; Wang, G.Q. Hydrochemical evolution and nitrate sources, migration, and transformation in surface water and groundwater of a typical tributary of the Yellow River. J. Environ. Manag. 2025, 390, 126218. [Google Scholar] [CrossRef]
  9. Yu, H.; Feng, S.B.; Qiu, H.S.; Liu, J.Y. Interaction between the hydrochemical environment, dissolved organic matter, and microbial communities in groundwater: A case study of a vegetable cultivation area in Huaibei Plain, China. Sci. Total Environ. 2023, 895, 165166. [Google Scholar] [CrossRef]
  10. Dong, L.; Zhang, J.; Guo, Z.Z.; Li, M.; Wu, H.M. Distributions and interactions of dissolved organic matter and heavy metals in shallow groundwater in Guanzhong basin of China. Environ. Res. 2022, 207, 112099. [Google Scholar] [CrossRef]
  11. Hu, J.; Kang, L.Y.; Li, Z.L.; Feng, X.H.; Liang, C.F.; Wu, Z.; Zhou, W.; Liu, X.N.; Yang, Y.H.; Chen, L.Y. Photo-produced aromatic compounds stimulate microbial degradation of dissolved organic carbon in thermokarst lakes. Nat. Commun. 2023, 14, 3681. [Google Scholar] [CrossRef]
  12. Zhang, H.Z.; Cheng, D.D.; Song, J.X.; Zhang, Y.X. Spatiotemporal fate of dissolved organic matter (DOM) in aquatic systems: Drivers, patterns and global implications. J. Hydrol. 2025, 661, 133637. [Google Scholar] [CrossRef]
  13. Zheng, Y.X.; He, W.; Li, B.H.; Hur, J.; Guo, H.M.; Li, X.M. Refractory Humic-like Substances: Tracking Environmental Impacts of Anthropogenic Groundwater Recharge. Environ. Sci. Technol. 2020, 54, 15778–15788. [Google Scholar] [CrossRef]
  14. Chen, J.Q.; Zhang, Y.W.; Guo, Y.Q.; Jiang, K.; Li, D.; Zheng, T.H. Differential Molecular Interactions of Imidacloprid with Dissolved Organic Matter in Citrus Soils with Diverse Planting Ages. Agriculture 2025, 15, 997. [Google Scholar] [CrossRef]
  15. Yao, Y.R.; Zhang, J.Y.; Ma, K.; Li, J.; Hu, X.; Wang, Y.S.; Lin, Y.S.; Fang, F.M.; Li, S.Y. Combination Mechanism of Soil Dissolved Organic Matter and Cu2+ in Vegetable Fields, Forests and Dry Farmland in Lujiang County. Agriculture 2024, 14, 684. [Google Scholar] [CrossRef]
  16. Ge, J.F.; Qi, Y.L.; Li, C.; Ma, J.F.; Yi, Y.B.; Hu, Q.Z.; Mostofa, K.M.G.; Volmer, D.A.; Li, S.-L. Fluorescence and molecular signatures of dissolved organic matter to monitor and assess its multiple sources from a polluted river in the farming-pastoral ecotone of northern China. Sci. Total Environ. 2022, 837, 154575. [Google Scholar] [CrossRef] [PubMed]
  17. Yi, Y.B.; Zhong, J.; Bao, H.Y.; Mostofa, K.M.G.; Xu, S.; Xiao, H.-Y.; Li, S.-L. The impacts of reservoirs on the sources and transport of riverine organic carbon in the karst area: A multi-tracer study. Water Res. 2021, 194, 116933. [Google Scholar] [CrossRef]
  18. Bai, Y.J.; Zhang, S.R.; Mu, E.L.; Zhao, Y.J.; Cheng, L.R.; Zhu, Y.; Yuan, Y.M.; Wang, Y.Y.; Ding, A.Z. Characterizing the spatiotemporal distribution of dissolved organic matter (DOM) in the Yongding River Basin: Insights from flow regulation. J. Environ. Manag. 2023, 325, 116476. [Google Scholar] [CrossRef]
  19. Jeon, P.; Cho, S.; Hur, J.; Mun, H.; Chae, M.; Cho, Y.; Seok, K.; Hong, S. Close Association between Stream Water Quality and Fluorescence Properties of Dissolved Organic Matter in Agriculture-Dominated Watersheds. Water 2022, 14, 2459. [Google Scholar] [CrossRef]
  20. Li, S.-L.; Zhang, H.; Yi, Y.B.; Zhang, Y.T.; Qi, Y.L.; Mostofa, K.M.G.; Guo, L.D.; He, D.; Fu, P.Q.; Liu, C.-Q. Potential impacts of climate and anthropogenic-induced changes on DOM dynamics among the major Chinese rivers. Geogr. Sustain. 2023, 4, 329–339. [Google Scholar] [CrossRef]
  21. Bellmore, R.A.; Harrison, J.A.; Needoba, J.A.; Brooks, E.S.; Kent Keller, C. Hydrologic control of dissolved organic matter concentration and quality in a semiarid artificially drained agricultural catchment. Water Resour. Res. 2015, 51, 8146–8164. [Google Scholar] [CrossRef]
  22. Wang, Y.H.; Tian, X.G.; Song, T.L.; Jiang, Z.; Zhang, G.L.; He, C.; Li, P. Linking DOM characteristics to microbial community: The potential role of DOM mineralization for arsenic release in shallow groundwater. J. Hazard. Mater. 2023, 454, 131566. [Google Scholar] [CrossRef] [PubMed]
  23. Hu, Y.; Lu, Y.H.; Edmonds, J.W.; Liu, C.K.; Wang, S.; Das, O.; Liu, J.; Zheng, C.M. Hydrological and land use control of watershed exports of dissolved organic matter in a large arid river basin in northwestern China. J. Geophys. Res. Biogeosci. 2016, 121, 466–478. [Google Scholar] [CrossRef]
  24. Wilson, H.F.; Xenopoulos, M.A. Effects of agricultural land use on the composition of fluvial dissolved organic matter. Nat. Geosci. 2008, 2, 37–41. [Google Scholar] [CrossRef]
  25. Hu, Y.; Lu, Y.H.; Edmonds, J.; Liu, C.K.; Zhang, Q.; Zheng, C.M. Irrigation alters source-composition characteristics of groundwater dissolved organic matter in a large arid river basin, Northwestern China. Sci. Total Environ. 2021, 767, 144372. [Google Scholar] [CrossRef]
  26. Zhang, Y.Z.; Liu, Y.D.; Zhou, A.G.; Zhang, L. Identification of groundwater pollution from livestock farming using fluorescence spectroscopy coupled with multivariate statistical methods. Water Res. 2021, 206, 117754. [Google Scholar] [CrossRef]
  27. Zafar, R.; Lee, Y.K.; Oh, H.; Hur, J. Tracking microplastic-derived dissolved organic matter in the adsorption of its mixtures with natural organic matter via end-member mixing analysis. Environ. Res. 2025, 283, 122144. [Google Scholar] [CrossRef]
  28. Cuss, C.W.; Guéguen, C. Relationships between molecular weight and fluorescence properties for size-fractionated dissolved organic matter from fresh and aged sources. Water Res. 2015, 68, 487–497. [Google Scholar] [CrossRef]
  29. Li, M.; Wen, Q.X.; Zhang, Y.M.; Chen, Z.Q. New insights into the transformation of effluent organic matter during Fe(II)-assisted advanced oxidation processes: Parallel factor analysis coupled with self-organizing maps. Water Res. 2022, 221, 118789. [Google Scholar] [CrossRef]
  30. Zhou, B.; Li, J.N.; Sun, Q.H.; Lei, K. Monsoon-driven DOM dynamics revealed by self-organizing map and end-member mixing analysis: Spatial partitioning of autochthonous and anthropogenic sources in plain river networks. Environ. Res. 2025, 283, 122160. [Google Scholar] [CrossRef]
  31. Shi, K.; Zhao, Y.T.; Wu, C.B.; Geng, Y.T.; Zhou, S.L.; Chai, B.B. Revealing the distribution characteristics and key driving factors of dissolved organic matter in Baiyangdian Lake inflow rivers from different seasons and sources. Sci. Total Environ. 2024, 951, 175768. [Google Scholar] [CrossRef] [PubMed]
  32. Zhang, Y.X.; Liang, X.Q.; Wang, Z.B.; Xu, L.X. A novel approach combining self-organizing map and parallel factor analysis for monitoring water quality of watersheds under non-point source pollution. Sci. Rep. 2015, 5, 16079. [Google Scholar] [CrossRef] [PubMed]
  33. Jia, L.M.; Yang, Q.; Cui, H.Y. Insight into the dynamics of dissolved organic matter components under latitude change perturbation. Ecotoxicol. Environ. Saf. 2024, 269, 115734. [Google Scholar] [CrossRef] [PubMed]
  34. Cui, H.Y.; Xie, L.N.; Zhang, G.G.; Zhao, Y.; Wei, Z.M. Revealing the Inner Changes of Component Composition Derived from DOM PARAFAC Based on Two-Dimensional Correlation Spectroscopy. Molecules 2022, 27, 7316. [Google Scholar] [CrossRef]
  35. Lin, Z.Y.; Lee, K.H.; Lim, J.Y.; Kim, J.H.; Eun, B.J.; Lee, S.J.; Park, J.Y.; Oh, H.S.; Oh, J.-M. Revealing spatial-temporal impact of industrial effluent towards DOM in Riverine employing PARAFAC and MW-2D COS. J. Environ. Chem. Eng. 2024, 12, 113412. [Google Scholar] [CrossRef]
  36. Zhang, X.L.; Nie, L.; Gao, H.J.; Yu, H.B.; Liu, D.P. Applying second derivative synchronous fluorescence spectroscopy combined with Gaussian band fitting to trace variations of DOM fractions along an urban river. Ecol. Indic. 2023, 146, 109872. [Google Scholar] [CrossRef]
  37. Wang, J.J.; Liang, X.; Ma, B.; Liu, Y.F.; Jin, M.G.; Knappett, P.S.K.; Liu, Y.L. Using isotopes and hydrogeochemistry to characterize groundwater flow systems within intensively pumped aquifers in an arid inland basin, Northwest China. J. Hydrol. 2021, 595, 126048. [Google Scholar] [CrossRef]
  38. Yi, B.; Liu, J.T.; He, W.; Lü, X.L.; Cao, X.; Chen, X.R.; Zeng, X.J.; Zhang, Y.X. Optical variations of dissolved organic matter due to surface water—Groundwater interaction in alpine and arid Datonghe watershed. Sci. Total Environ. 2023, 864, 161036. [Google Scholar] [CrossRef]
  39. Martinez, J.L.; Raiber, M.; Cox, M.E. Assessment of groundwater–surface water interaction using long-term hydrochemical data and isotope hydrology: Headwaters of the Condamine River, Southeast Queensland, Australia. Sci. Total Environ. 2015, 536, 499–516. [Google Scholar] [CrossRef]
  40. Zhang, S.R.; Bai, Y.J.; Wen, X.; Ding, A.Z.; Zhi, J.H. Seasonal and downstream alterations of dissolved organic matter and dissolved inorganic ions in a human-impacted mountainous tributary of the Yellow River, China. Environ. Sci. Pollut. Res. 2018, 25, 17967–17979. [Google Scholar] [CrossRef]
  41. Hudson, N.; Baker, A.; Reynolds, D. Fluorescence analysis of dissolved organic matter in natural, waste and polluted waters—A review. River Res. Appl. 2007, 23, 631–649. [Google Scholar] [CrossRef]
  42. Zepp, R.G.; Sheldon, W.M.; Moran, M.A. Dissolved organic fluorophores in southeastern US coastal waters: Correction method for eliminating Rayleigh and Raman scattering peaks in excitation–emission matrices. Mar. Chem. 2004, 89, 15–36. [Google Scholar] [CrossRef]
  43. Huo, P.; Gao, P.C. Seasonal changes of dissolved CO2 and its linkage with optical characteristics of DOM in groundwater in agricultural areas. J. Hydrol. 2024, 643, 131927. [Google Scholar] [CrossRef]
  44. Stedmon, C.A.; Bro, R. Characterizing dissolved organic matter fluorescence with parallel factor analysis: A tutorial. Limnol. Oceanogr. Methods 2008, 6, 572–579. [Google Scholar] [CrossRef]
  45. Zhang, Y.X.; Zhang, H.Z.; Song, J.X.; Cheng, D.D. More sensitive signatures of DOM are stimulated by socioeconomic-related anthropogenic influences in a typical loess watershed. J. Hydrol. 2025, 657, 133106. [Google Scholar] [CrossRef]
  46. Murphy, K.R.; Stedmon, C.A.; Wenig, P.; Bro, R. OpenFluor-an online spectral library of auto-fluorescence by organic compounds in the environment. Anal. Methods 2014, 6, 658–661. [Google Scholar] [CrossRef]
  47. Ni, M.F.; Jiang, S.H.; Li, S.Y. Spectroscopic indices trace spatiotemporal variability of dissolved organic matter in a river system with Karst characteristic. J. Hydrol. 2020, 590, 125570. [Google Scholar] [CrossRef]
  48. Li, P.H.; Hur, J. Utilization of UV-Vis spectroscopy and related data analyses for dissolved organic matter (DOM) studies: A review. Crit. Rev. Environ. Sci. Technol. 2017, 47, 131–154. [Google Scholar] [CrossRef]
  49. Chen, W.; Teng, C.-Y.; Qian, C.; Yu, H.-Q. Characterizing Properties and Environmental Behaviors of Dissolved Organic Matter Using Two-Dimensional Correlation Spectroscopic Analysis. Environ. Sci. Technol. 2019, 53, 4683–4694. [Google Scholar] [CrossRef]
  50. Liu, M.X.; Han, X.K.; Liu, C.-Q.; Guo, L.D.; Ding, H.; Lang, Y.C. Differences in the spectroscopic characteristics of wetland dissolved organic matter binding with Fe3+, Cu2+, Cd2+, Cr3+ and Zn2+. Sci. Total Environ. 2021, 800, 149476. [Google Scholar] [CrossRef]
  51. Li, K.; Yang, S.P.; Wang, H.Y.; Wu, Z.B.; Liang, Y.S.; Gong, X.M.; Peng, X.; Qin, P.F. Molecular spectra and docking simulations investigated the binding mechanisms of tetracycline onto E. coli extracellular polymeric substances. Talanta 2024, 276, 126231. [Google Scholar] [CrossRef]
  52. Li, W.J.; Liu, G.B.; Lei, M.; Zhou, Y.Y.; Cui, H.J.; Du, H.H. Spectral fingerprints of DOM-tungsten interactions: Linking molecular binding to conformational changes. J. Hazard. Mater. 2025, 483, 136649. [Google Scholar] [CrossRef]
  53. Noda, I. Two-dimensional correlation spectroscopy (2DCOS) analysis of polynomials. J. Mol. Struct. 2016, 1124, 53–60. [Google Scholar] [CrossRef]
  54. Noda, I. Frontiers of Two-Dimensional Correlation Spectroscopy. Part 1. New concepts and noteworthy developments. J. Mol. Struct. 2014, 1069, 3–22. [Google Scholar] [CrossRef]
  55. Zhu, G.; Wu, X.; Ge, J.P.; Liu, F.; Zhao, W.G.; Wu, C. Influence of mining activities on groundwater hydrochemistry and heavy metal migration using a self-organizing map (SOM). J. Clean. Prod. 2020, 257, 120664. [Google Scholar] [CrossRef]
  56. Yan, C.X.; Liu, H.H.; Sheng, Y.R.; Huang, X.; Nie, M.H.; Huang, Q.; Baalousha, M. Fluorescence characterization of fractionated dissolved organic matter in the five tributaries of Poyang Lake, China. Sci. Total Environ. 2018, 637–638, 1311–1320. [Google Scholar] [CrossRef] [PubMed]
  57. Cuss, C.W.; Guéguen, C. Analysis of dissolved organic matter fluorescence using self-organizing maps: Mini-review and tutorial. Anal. Methods 2016, 8, 716–725. [Google Scholar] [CrossRef]
  58. Zhou, P.; Huang, J.L.; Pontius, R.G.; Hong, H.S. New insight into the correlations between land use and water quality in a coastal watershed of China: Does point source pollution weaken it? Sci. Total Environ. 2016, 543, 591–600. [Google Scholar] [CrossRef]
  59. Deng, Y.D.; Lu, Y.; Du, X.Q.; Ye, X.Y.; Feng, J. Identifying spatial patterns and driving factors of anthropogenic impacts on the groundwater environment based on groundwater chemical kinetics. J. Clean. Prod. 2025, 486, 144436. [Google Scholar] [CrossRef]
  60. Li, P.Y.; Wu, J.H.; Qian, H. Assessment of groundwater quality for irrigation purposes and identification of hydrogeochemical evolution mechanisms in Pengyang County, China. Environ. Earth Sci. 2012, 69, 2211–2225. [Google Scholar] [CrossRef]
  61. Xing, S.P.; Zhang, C.R.; Guo, H.M.; Sheng, Y.Z.; Liu, X.Y. Hydrologic changes induced by groundwater abstraction lead to arsenic mobilization in shallow aquifers. J. Hazard. Mater. 2024, 480, 136133. [Google Scholar] [CrossRef] [PubMed]
  62. Chen, K.; Liu, Q.M.; Peng, W.H.; Liu, X.H. Source apportionment and natural background levels of major ions in shallow groundwater using multivariate statistical method: A case study in Huaibei Plain, China. J. Environ. Manag. 2022, 301, 113806. [Google Scholar] [CrossRef] [PubMed]
  63. Hagedorn, B.; Whittier, R.B. Solute sources and water mixing in a flashy mountainous stream (Pahsimeroi River, U.S. Rocky Mountains): Implications on chemical weathering rate and groundwater–surface water interaction. Chem. Geol. 2015, 391, 123–137. [Google Scholar] [CrossRef]
  64. Yang, Y.J.; Yuan, X.F.; Deng, Y.M.; Xie, X.J.; Gan, Y.Q.; Wang, Y.X. Seasonal dynamics of dissolved organic matter in high arsenic shallow groundwater systems. J. Hydrol. 2020, 589, 125120. [Google Scholar] [CrossRef]
  65. Tian, Y.; Zheng, Y.; Wu, B.; Wu, X.; Liu, J.; Zheng, C.M. Modeling surface water-groundwater interaction in arid and semi-arid regions with intensive agriculture. Environ. Model. Softw. 2015, 63, 170–184. [Google Scholar] [CrossRef]
  66. Liu, J.R.; Song, X.F.; Yuan, G.F.; Sun, X.M.; Liu, X.; Wang, S.Q. Characteristics of δ18O in precipitation over Eastern Monsoon China and the water vapor sources. Chin. Sci. Bull. 2009, 55, 200–211. [Google Scholar] [CrossRef]
  67. Du, Y.; Deng, Y.M.; Ma, T.; Xu, Y.; Tao, Y.Q.; Huang, Y.W.; Liu, R.; Wang, Y.X. Enrichment of Geogenic Ammonium in Quaternary Alluvial–Lacustrine Aquifer Systems: Evidence from Carbon Isotopes and DOM Characteristics. Environ. Sci. Technol. 2020, 54, 6104–6114. [Google Scholar] [CrossRef]
  68. Zeng, X.J.; Zheng, Y.X.; Chen, X.R.; Cao, X.; He, W.; Jiang, B.; Li, B.H.; Guo, H.M. Molecular Responses of Dissolved Organic Matter to Anthropogenic Groundwater Recharge: Characteristics, Transformations, and Sensitive Molecules. Environ. Sci. Technol. 2023, 57, 7789–7799. [Google Scholar] [CrossRef]
  69. Singh, S.; Dutta, S.; Inamdar, S. Land application of poultry manure and its influence on spectrofluorometric characteristics of dissolved organic matter. Agric. Ecosyst. Environ. 2014, 193, 25–36. [Google Scholar] [CrossRef]
  70. Harjung, A.; Schweichhart, J.; Rasch, G.; Griebler, C. Large-scale study on groundwater dissolved organic matter reveals a strong heterogeneity and a complex microbial footprint. Sci. Total Environ. 2023, 854, 158542. [Google Scholar] [CrossRef]
  71. Wang, X.; Zhang, M.; Liu, L.L.; Wang, Z.P.; Lin, K.F. Using EEM-PARAFAC to identify and trace the pollution sources of surface water with receptor models in Taihu Lake Basin, China. J. Environ. Manag. 2022, 321, 115925. [Google Scholar] [CrossRef]
  72. Du, C.; Chang, Z.B.; Tang, W.Z.; Hao, Z.N.; Zhang, M.Y.; Zhang, X.Y.; Liu, M.X.; Zhang, H. Molecular insights into the seasonal variation of fluorescent dissolved organic matter in a hydrologically isolated aquatic continuum. J. Hydrol. 2025, 661, 133620. [Google Scholar] [CrossRef]
  73. Graham, P.W.; Baker, A.; Andersen, M.S. Dissolved Organic Carbon Mobilisation in a Groundwater System Stressed by Pumping. Sci. Rep. 2015, 5, 18487. [Google Scholar] [CrossRef] [PubMed]
  74. Shi, J.H.; Zhao, Y.; Wei, D.; Zhang, D.Y.; Wei, Z.M.; Wu, J.Q. Insight into transformation of dissolved organic matter in the Heilongjiang River. Environ. Sci. Pollut. Res. 2018, 26, 3340–3349. [Google Scholar] [CrossRef] [PubMed]
  75. Xue, C.H.; Yu, Y.; Huang, X. Comparison of Organic Matter Properties and Disinfection By-Product Formation between the Typical Groundwater and Surface Water. Water 2022, 14, 1418. [Google Scholar] [CrossRef]
  76. Ding, H.Y.; Su, J.; Sun, Y.Y.; Yu, H.B.; Zheng, M.X.; Xi, B.D. Insight into spatial variations of DOM fractions and its interactions with microbial communities of shallow groundwater in a mesoscale lowland river watershed. Water Res. 2024, 258, 121797. [Google Scholar] [CrossRef]
  77. Wilson, G.J.L.; Lu, C.; Lapworth, D.J.; Kumar, A.; Ghosh, A.; Niasar, V.J.; Krause, S.; Polya, D.A.; Gooddy, D.C.; Richards, L.A. Spatial and seasonal controls on dissolved organic matter composition in shallow aquifers under the rapidly developing city of Patna, India. Sci. Total Environ. 2023, 903, 166208. [Google Scholar] [CrossRef]
  78. Ma, Y.; Liu, Z.-H.; Xi, B.-D.; Li, W.-T.; Xu, Y.-Q.; Zhao, H.-Z.; Chen, Z.-Q.; He, X.-S.; Xing, B. Molecular structure and evolution characteristics of dissolved organic matter in groundwater near landfill: Implications of the identification of leachate leakage. Sci. Total Environ. 2021, 787, 147649. [Google Scholar] [CrossRef]
  79. Cuss, C.W.; Shi, Y.X.; McConnell, S.M.; Guéguen, C. Changes in the fluorescence composition of multiple DOM sources over pH gradients assessed by combining parallel factor analysis and self-organizing maps. J. Geophys. Res. Biogeosci. 2014, 119, 1850–1860. [Google Scholar] [CrossRef]
  80. Jin, X.C.; Chen, X.Q.; Gao, L.M.; Wu, Y.F.; Lu, H.S.; Yuan, M.H.; Cui, J.H.; Wei, F.Y. Fluorescence Analysis of River DOM Spectra Using PARAFAC in Combination with a Self-Organizing Map to Distinguish Organic Matter Sources. Int. J. Environ. Res. 2024, 18, 20. [Google Scholar] [CrossRef]
  81. Yang, X.L.; Yu, X.B.; Cheng, J.R.; Zheng, R.Y.; Wang, K.; Dai, Y.X.; Tong, N.J.; Chow, A.T. Impacts of land-use on surface waters at the watershed scale in southeastern China: Insight from fluorescence excitation-emission matrix and PARAFAC. Sci. Total Environ. 2018, 627, 647–657. [Google Scholar] [CrossRef]
  82. Qin, X.; Wang, H.S.; Gong, J.S.; Ye, Y.H.; Zhou, K.; Xu, N.Z.; Li, L.; Li, J. Multivariate Statistics and Hydrochemistry Combined to Reveal the Factors Affecting Shallow Groundwater Evolution in a Typical Area of the Huaibei Plain, China. Water 2025, 17, 962. [Google Scholar] [CrossRef]
  83. Kumar, A.; Mishra, S.; Taxak, A.K.; Pandey, R.; Yu, Z.-G. Nature rejuvenation: Long-term (1989–2016) vs short-term memory approach based appraisal of water quality of the upper part of Ganga River, India. Environ. Technol. Innov. 2020, 20, 101164. [Google Scholar] [CrossRef]
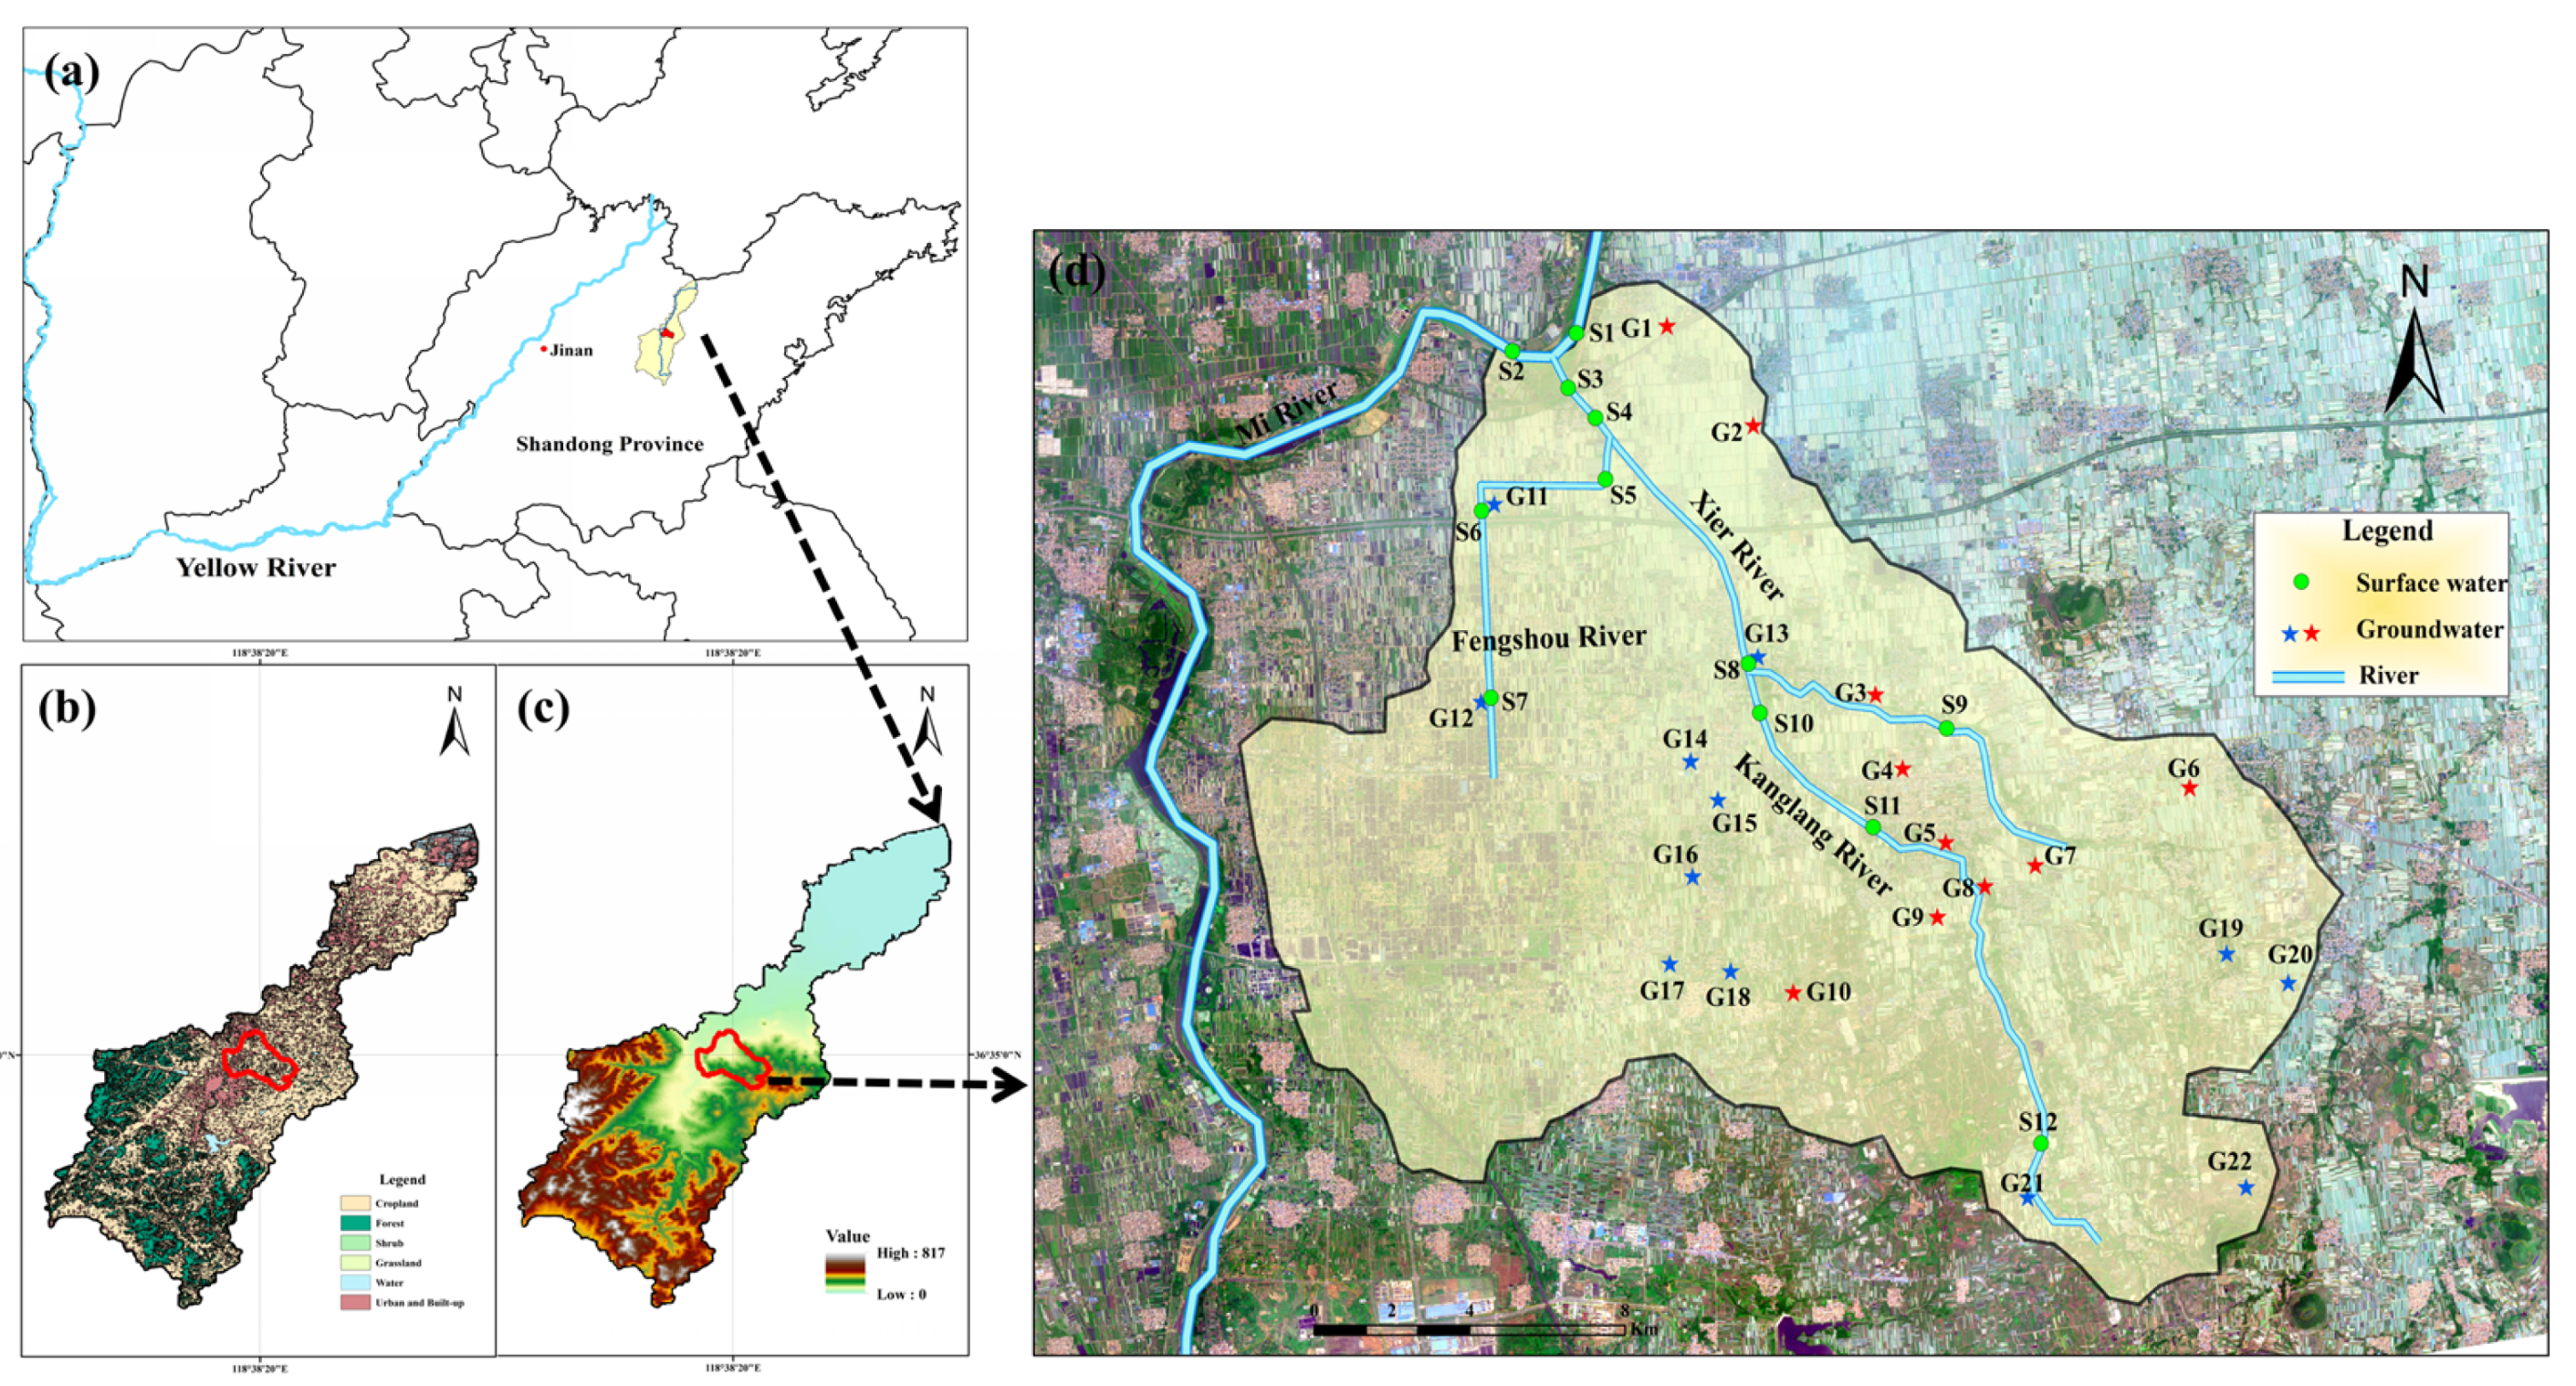
Figure 1. Map of the study sites, (a) is the location of the Mi River Basin, (b) land use, (c) topography, and the red line area is XER (d). Note: The letter “S” denotes surface water (S1–S12), and the letter “G” denotes groundwater (G1–G22). Among them, G1–G5 are parallel to the river direction, and G6–G10 are perpendicular to the river direction.
Water 17 02681 g001
Figure 2. (a) Piper diagrams, (b,c) Gibbs diagrams, and (d,e) molar ratio bivariate plots of Mg2+ and HCO3/Na+ vs. Ca2+/Na+ of surface water and groundwater.
Water 17 02681 g002
Figure 3. (a) The relationship between δD and δ18O in the study area. The spatial distribution of (b) δ18O of surface water (c) and groundwater in XER by Kriging interpolation. Note: The LMWL in this study for Eastern Monsoon China follows the established relationship: δD = 7.46 δ18O + 0.9 [66].
Water 17 02681 g003
Figure 4. The fluorescent DOM composition and loading maps identified by EEM-PARAFAC analysis.
Water 17 02681 g004
Figure 5. Comparisons of fluorescence components (C1–C4) of surface water and groundwater. (a) The PARAFAC fluorescence component loadings (Fmax, R.U.) and (b) the relative abundance (%) and (c) total relative abundance (%) pie chart.
Water 17 02681 g005
Figure 6. The optical indices of DOM in surface water and groundwater in the XER. (ad) represents the fluorescence indexs: FI, β:α, BIX and HIX, and (e,f) represents UV-visible absorption parameters: E2:E3 and SUVA254. The boxplot displays the data distribution through five key elements: maximum (top whisker), minimum (bottom whisker), upper quartile (75th percentile, box top), lower quartile (25th percentile, box bottom), and median (central line). The mean value is indicated by a central square marker. Adjacent scatter plots with trend lines illustrate sample point distributions and their variation patterns.
Water 17 02681 g006
Figure 7. The 2D-COS of PARAFAC components in the PR direction: synchronous (top: (a,c,e,g,i)) and asynchronous (bottom: (b,d,f,h,j)) maps. Red and blue contours indicate positive and negative spectral responses, respectively.
Water 17 02681 g007
Figure 8. The 2D-COS of PARAFAC components in the VR direction: synchronous (top: (a,c,e,g,i)) and asynchronous (bottom: (b,d,f,h,j)) maps. Red and blue contours indicate positive and negative spectral responses, respectively.
Water 17 02681 g008
Figure 9. SOM visualization of surface water and groundwater samples. (a) U-matrix, (b) hit histogram, (c) clustering results, and (d) component planes for SOM.
Water 17 02681 g009
Figure 10. Pearson’s correlation analysis of DOC, PARAFAC components, optical indices, and stable isotopes. Red indicates positive correlations, and blue indicates negative correlations. Asterisks indicated different significance levels: *** p-value < 0.001, ** p-value < 0.01, * p-value < 0.05.
Water 17 02681 g010
Table 2. Symbols in the hetero-2DCOS synchronous and asynchronous (in parentheses) spectra in PR and VR.
DisturbanceComponents275 (C3)260 (C4)245 (C1)235 (C2)
PR275 (C3)++(−)+(+)−(−)
260 (C4) ++(−)−(+)
245 (C1) +−(+)
235 (C2) +
VR275 (C3)++(+)+(+)+(+)
260 (C4) ++(+)+(+)
245 (C1) ++(+)
235 (C2) +
Note: + represents the positive cross peak; − represents the negative cross peak.
Disclaimer/Publisher’s Note: The statements, opinions and data contained in all publications are solely those of the individual author(s) and contributor(s) and not of MDPI and/or the editor(s). MDPI and/or the editor(s) disclaim responsibility for any injury to people or property resulting from any ideas, methods, instructions or products referred to in the content.