Article

Integrated Ecological Security Assessment: Coupling Risk, Health, and Ecosystem Services in Headwater Regions—A Case Study of the Yangtze and Yellow River Source

1
Changjiang River Scientific Research Institute, Changjiang Water Resources Commission of the Ministry of Water Resources of China, Wuhan 430010, China
2
Hubei Key Laboratory of Water Resources & Eco-Environmental Sciences, Wuhan 430010, China
3
College of Geomatics, Xi’an University of Science and Technology, Xi’an 710054, China
*
Authors to whom correspondence should be addressed.
Water 2025, 17(19), 2834; https://doi.org/10.3390/w17192834
Submission received: 25 July 2025 / Revised: 19 September 2025 / Accepted: 24 September 2025 / Published: 27 September 2025
(This article belongs to the Special Issue Wetland Conservation and Ecological Restoration, 2nd Edition)

Abstract

The Source Region of the Yangtze and Yellow Rivers (SRYY), situated on the Qinghai-Tibet Plateau, serves as a vital ecological barrier and a critical component of the global carbon cycle. However, this region faces severe ecosystem degradation driven by climate change and human activities. This study establishes an integrated ecological security assessment framework that couples ecological risk, ecosystem health, and ecosystem services to evaluate ecological dynamics in the SRYY from 2000 to 2020. Leveraging multi-source data (vegetation, hydrological, meteorological) and advanced modeling techniques (spatial statistics, geographically weighted regression), we demonstrate that: (1) The Ecological Security Index (ESI) exhibited an initial increase followed by a significant decline after 2010, falling below its 2000 level by 2020. (2) The rising Ecological Risk Index (ERI) directly weakened both the ESI and Ecosystem Service Index (ESsI), with this negative effect intensifying markedly post-2010. (3) A distinct spatial gradient pattern emerged, shifting from high-security core areas in the east to low-security zones in the west, closely aligned with terrain and elevation; conversely, areas exhibiting abrupt ESI changes showed little correlation with permafrost degradation zones. (4) Vegetation coverage emerged as the key driver of ESI spatial heterogeneity, acting as the central hub in the synergistic regulation of ecological security by climate and topographic factors.

1. Introduction

The Source Region of the Yangtze and Yellow Rivers (SRYY), located in the Qinghai-Tibet Plateau, serves as a critical ecological barrier in China and a key contributor to the global carbon cycle through permafrost, wetlands, and glaciers [1,2]. Its ecosystems are vital for basin water security and regional climate stability [3]. Climate change and human activities have driven significant ecosystem degradation in the SRYY over the past 40 years [4,5]. High-coverage meadows and wetlands have declined by 13.5–28.9% in the Yangtze source region and 13.6–23.2% in the Yellow source region [3]. Rising temperatures (0.88–1.2 °C) have accelerated glacier retreat (37.4% area loss since 1990) and reduced permafrost, impairing water retention [6,7,8]. Grassland degradation (44.5–75%) increases erosion and carbon loss [9,10], while wetland fragmentation reduces resilience [11,12]. Water retention [13] has decreased by 1.15 mm/year (~2.39 billion m3 runoff reduction), carbon sequestration by 18.7%, and sediment content has risen 12–25% [14]. Despite restoration since 2000 [15], water retention remains 23% below 1980s’ levels, with 64.5% of grasslands unrestored [16].
Ecological security assessment in the SRYY has evolved significantly. Early studies in the 2000s relied on descriptive methods, using remote sensing (e.g., MODIS images) to monitor vegetation greenness trends, often based on simple ecological indicators like NDVI to evaluate climate-driven changes in alpine grasslands [17]. By the 2010s, quantitative approaches emerged, employing statistical models (e.g., entropy weight method) and frameworks like DPSIR (consistent with PSR) to assess socioeconomic and environmental impacts on water resources, integrating causal relationships for security evaluation in river basins [18]. Recent research since 2020 has adopted integrated models, such as revised DPSIR and Ecological Security Patterns (ESP), leveraging comprehensive frameworks to analyze multidimensional risks, ecosystem health, and services in alpine grasslands, addressing dynamic processes and socioeconomic factors [19].
Current studies often focus on single dimensions (e.g., risk or services) using remote sensing and landscape indices [20,21,22,23,24], but lack comprehensive models integrating dynamic interactions. This study addresses these gaps by developing a multidimensional coupled assessment system based on ecological security theory, integrating ecological risk, ecosystem health, and ecosystem services to evaluate SRYY ecosystems from 2000 to 2020 [25,26,27,28,29].
Through an integrated assessment system encompassing risk warning, health diagnosis, and service evaluation [30,31], this study establishes an evaluation paradigm with the following characteristics:
(1)
Theoretical completeness, integrating ecological risks, system stability, and service provision capacity for a comprehensive evaluation from structure to function;
(2)
Regional adaptability, constructing an evaluation system tailored to the ecological baseline characteristics of high-altitude fragile regions, incorporating specific indicators such as water retention and permafrost degradation;
(3)
Methodological integration, utilizing spatial statistical models and geographically weighted regression to achieve multi-source data fusion and multi-scale analysis.
This framework overcomes the limitations of traditional single-dimension evaluations, providing a scientifically robust and practical ecological security assessment model for the plateau ecological barrier region.

2. Materials and Methods

2.1. Study Area

The Source Region of the Yangtze and Yellow Rivers (SRYY) (32°9′–36°7′ N, 90°32′–103°24′ E), located at the core of the Qinghai-Tibet Plateau with an average elevation of 4500 m (Figure 1), forms the heart of the “Asian Water Tower” and represents a globally critical ecological and water resource security zone [1]. Encompassing over 89% of the glacier area within the Three-River Source Region [32], the SRYY hosts the world’s highest (4500–5000 m) and most extensive alpine marsh wetland complex [33]. The permafrost-wetland symbiotic system, through seasonal freeze-thaw cycles and vegetation water uptake [34,35], stores water resources equivalent to 1.5 times the total freshwater volume of China’s lakes, thereby sustaining regional hydrological stability [36].
The Yangtze source region, comprising the Tuotuo, Dangqu, and Chumaer Rivers, forms a fan-shaped hydrological network [37], with glacial meltwater contributing 25% of the runoff, providing essential support to downstream ecosystems [38]. The Yellow source region, situated on the northern slopes of the Bayan Har Mountains, accounts for 49% of the Yellow River’s water resources [39], with alpine meadows covering 74.17% of the area. The synergistic interaction between meadow root systems and permafrost creates a unique water retention mechanism, while also serving as Asia’s largest carbon sink reservoir, significantly contributing to global carbon balance [40].
In recent years, climate change-driven extreme hydrological events, such as floods and droughts, have exacerbated ecological fragility [32]. Nevertheless, the SRYY supports the survival of high-altitude endemic species [41], constituting a global biodiversity hotspot. Its ecological functions are vital for the Yangtze and Yellow River basins and the broader East Asian hydrological cycle [42].

2.2. Data Collection and Preprocessing

The data required for this study encompass the boundary data of the source regions of the Yangtze and Yellow Rivers, as well as datasets related to vegetation, soil, meteorology, land use, digital elevation models (DEM), and landscape ecology, covering the period from 2000 to 2020. The study period was selected based on the widespread availability of consistent, high-resolution remote sensing and climate reanalysis data starting from the year 2000, which ensures the reliability and temporal consistency of the multi-source data used in this analysis. Detailed data sources and processing methods are summarized in Table 1.
All data were standardized to a 1 km raster resolution and projected to the WGS_1984_Albers coordinate system using ArcGIS Pro to facilitate subsequent calculations.

2.3. Methods

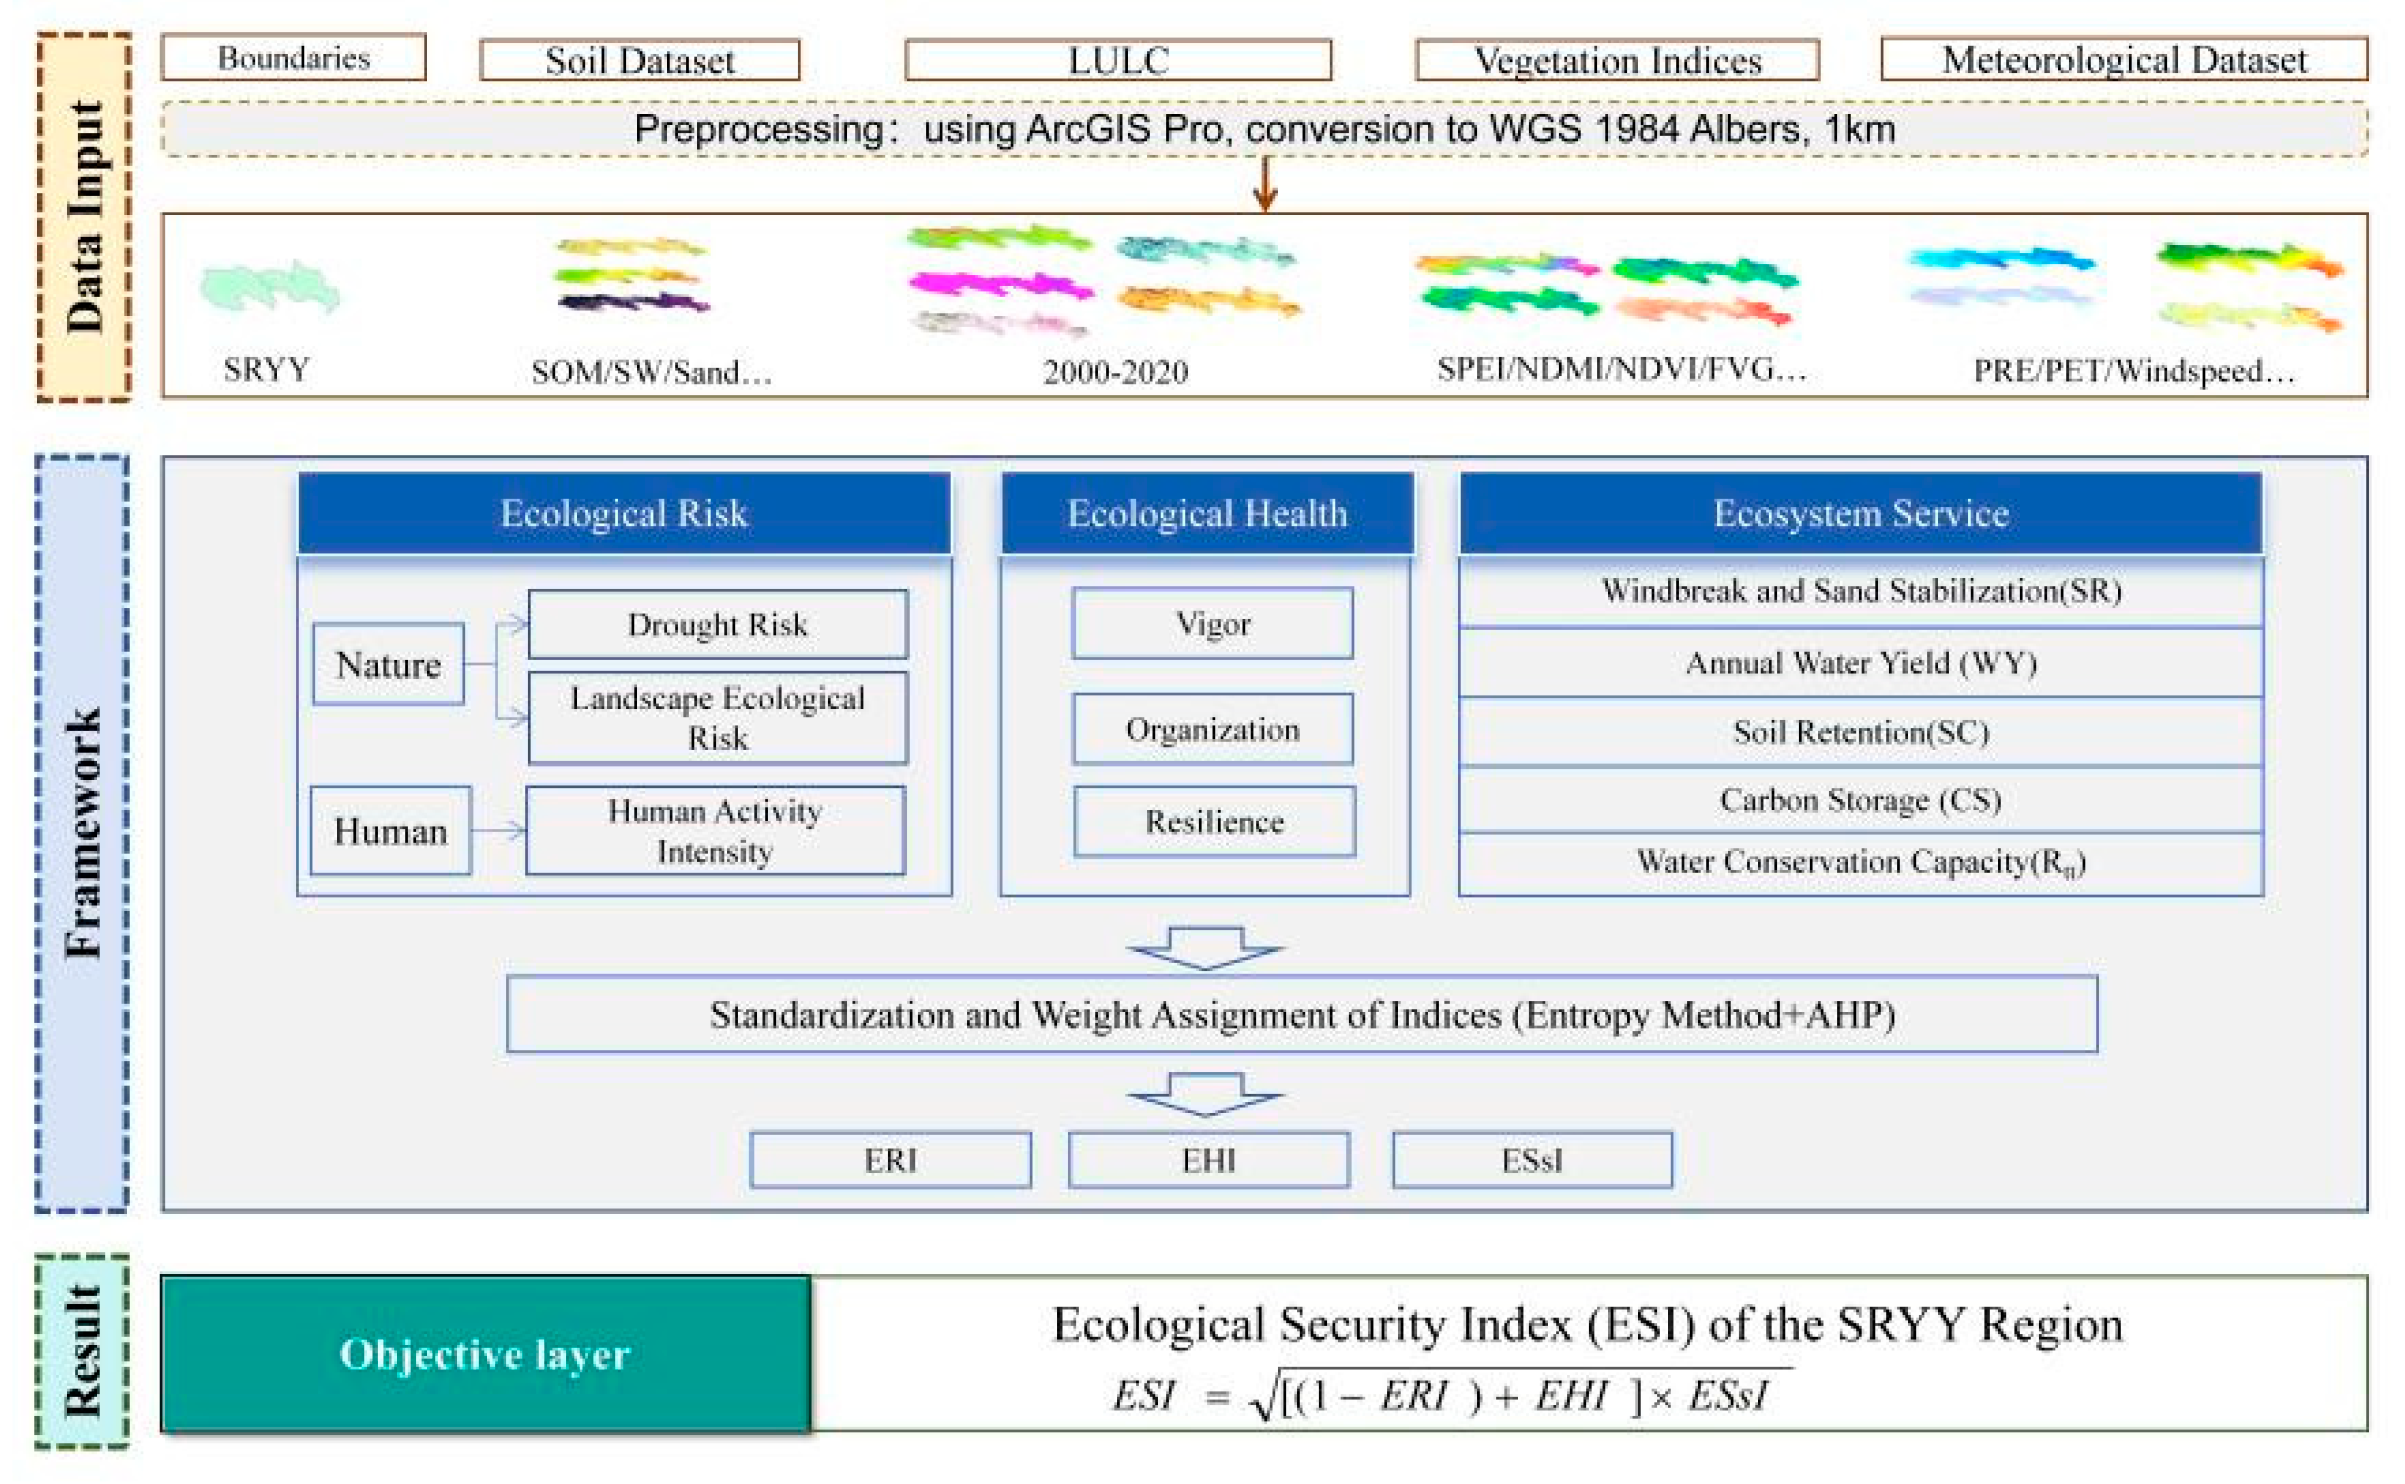
This study constructs a theoretical framework (Figure 2) for ecological security assessment based on the multidimensional characteristics of the source region’s ecosystem, encompassing “Risk-Health-Service” [4]. It proposes an ecological security evaluation index system and methodology, focusing on natural risks and human activities, vegetation vitality and resilience, and regulatory services.

2.3.1. Ecological Risk Assessment Model

The ecological risk assessment framework for the Source Region of the Yangtze and Yellow Rivers (SRYY) integrates natural risks, human activity intensity, and landscape disturbance levels to establish a comprehensive index system. Indicator selection is customized to reflect the unique environmental conditions of the SRYY. Drought risk is decomposed into three dimensions: meteorological, vegetation, and soil, represented by the Standardized Precipitation Evapotranspiration Index (SPEI), Normalized Difference Moisture Index (NDMI), and Soil Water Index (SWI), respectively [30]. These indices are normalized and aggregated with equal weights to compute the drought risk component.
Landscape pattern risk is assessed by integrating landscape fragmentation, separation, and fractal dimension indices, following the methodology outlined in previous research [44]. The specific formulas are as follows:
C i = n i A i
where Ci denotes the fragmentation index for landscape type i, Ai is the area of landscape type i, and ni is the number of patches.
N i = A 2 A i n i A i
where Ni represents the separation index, Ai is the area of landscape type i, A is the total landscape area, and ni is the number of patches of type i.
F i = 2 l n ( p i / 4 ) / l n A i
where Fi is the fractal dimension index, and Pi is the perimeter of landscape type i.
The landscape ecological risk index Ei is then calculated as a weighted sum:
E i = a C i + b N i + c F i
where a, b, and c are weights assigned to the fragmentation, separation, and fractal dimension indices, respectively, with (a + b + c = 1). Drawing on the specific conditions of the SRYY and prior research [45], weights are assigned as 0.5, 0.3, and 0.2 for Ci, Ni, and Fi, respectively.
Human activity risk is quantified using the Human Activity Intensity on Land Surfaces (HAILS) metric, calculated as follows:
H A I L S = S C L E S × 100 %
S C L E = i = 1 n S L i × C I i
where HAILS is the human activity intensity; SCLE is the construction land equivalent area, S is the total area of the region, SLi is the area of the i-th land use type, CIi is the construction land equivalent conversion coefficient for the i-th type, and n is the number of land use types within the region.
The Ecological Risk Index (ERI) for the SRYY is derived by combining drought risk, landscape pattern risk, and human activity risk, with weights determined using the entropy method.

2.3.2. Ecosystem Health Assessment Model

The ecosystem health assessment for the SRYY employs the VOR model, evaluating health across three dimensions: vigor (V), organization (O), and resilience (R). Vigor (V) reflects ecosystem metabolism and productivity, organization indicates the complexity of species composition, and resilience measures the ecosystem’s capacity to resist disturbances and maintain stability [46]. The Ecosystem Health Index (EHI) is formulated as:
E H I = V × O × R 3
where V is the ecosystem vigor, O is the ecosystem organization, and R is the ecosystem resilience.
Ecosystem vigor is typically represented by Net Primary Productivity (NPP) or the Normalized Difference Vegetation Index (NDVI) in health assessments. This study adopts NDVI data to characterize vigor [46].
Ecosystem organization (O) is assessed through landscape heterogeneity, shape, and connectivity. Spatial heterogeneity is quantified using the Shannon Diversity Index (SHDI) and Shannon Evenness Index (SHEI). Landscape connectivity is evaluated via the Interspersion and Juxtaposition Index (IJI), Division Index (DIVISION), and Contagion Index (CONTAG). The Perimeter-Area Fractal Dimension (PAFRAC) is selected to represent landscape shape. The formula [47] for organization is:
O = 0.4 × LH + 0.4 × LC + 0.2 × IC = (0.2 × SHEI + 0.2 × SHDI) + (0.1 × IJI + 0.15 × DIVISION + 0.15 × CONTAG) + 0.2 × PAFRAC
where LH denotes landscape spatial heterogeneity, LC represents landscape connectivity, and IC indicates landscape shape.
Ecosystem resilience (R) is determined based on habitat quality [48], following established research. This study utilizes the Habitat Quality module of the InVEST model to assess habitat quality in the SRYY, incorporating land use, threat factors, habitat suitability, and sensitivity to threats. The formula [47] is:
Q x j = H j ( 1 D x j 2 D x j 2 + K Z )
where Qxj is the habitat quality index of raster x in habitat type j; Hj is the ecological suitability; Z is the default parameter of the model; K is the half-saturation constant, and its value is half of the resolution of the raster data in the study area. Here, we set it to 0.5, Dxj can be calculated as follows:
D x j = r = 1 R y = 1 Y r ( W r r = 1 R W r ) r y i x y β x S j r
Dxj is the level of stress on raster x in habitat type j; R represents the number of threat factors, and Yr is the total number of rasters on the ground class layer for all threat layers; Wr is the weight of the threat factor; ry is the number of a certain threat factor; ixy is the impact of threat R on raster y in raster x habitat, and the impact of the threat source on each raster of the habitat can be based on the index of the ecological factor or linear correlation to show the spatial relationship between the threat factor and each habitat type; βx is the level at which the raster cell is protected (legal access level), taking βx = 1; Sjr is the sensitivity of habitat type y to r; irxy is generally available in linear and exponential forms, and the formulas are as follows:
i r x y = 1 d x y d r m a x
i r x y = exp ( 2.99 d x y d r m a x )
drmax represents the maximum stress distance of threat source r. Threat factors and sensitivity parameters are referenced from previous research [48].

2.3.3. Ecosystem Services Assessment Model

Considering the specific conditions of the SRYY, five ecosystem services are selected to construct the Ecosystem Service Index (ESsI): windbreak and sand stabilization, water conservation, soil retention, carbon storage, and water yield. Windbreak and sand stabilization are calculated using the Revised Wind Erosion Equation (RWEQ), while the remaining services are derived from the InVEST model (Integrated Valuation of Ecosystem Services and Trade-offs). Detailed calculation formulas are presented in Table 2, tailored to the SRYY context.
Following the calculation of the five ecosystem service functions, a combined weighting approach integrating the entropy method and the Analytic Hierarchy Process (AHP) is employed. This methodology mitigates biases inherent in purely subjective weighting while addressing the oversight of policy objectives in purely objective weighting. Ultimately, the Ecosystem Service Index (ESsI) for the Source Region of the Yangtze and Yellow Rivers (SRYY) is derived.

2.3.4. Assessment System for Ecological Security

Within the integrated ecological security assessment framework coupling ecological risk, ecosystem health, and ecosystem services, each component maintains a distinct functional role and interactive relationship. Ecological risk (ER), as a negative indicator representing the pressure dimension, exhibits a significant negative correlation with ecological security. Its intensity directly influences the ecosystem’s resistance to disturbances and recovery potential. Ecosystem health (EH), as the core indicator of the ecosystem state, reflects the integrity of ecosystem structure and function, serving as a foundational positive indicator for sustaining ecological security [31]. Ecosystem services (ESs), a critical dimension of ecological security, directly embody the ecosystem’s capacity to support human well-being, with variations in their levels reflecting dynamic changes in ecological security status [46]. Research indicates a positive coupling relationship between the Ecological Security Index (ESI) and ecosystem service provision capacity. As ESI improves, the comprehensive efficacy of ecosystem services—encompassing material provision, regulation, support, and cultural services—significantly strengthens. This relational mechanism suggests that reducing ecological risk and enhancing ecosystem health can effectively improve ecosystem service functions, thereby fostering a virtuous cycle of ecological security. Based on existing studies, the formula for calculating the Ecological Security Index is as follows.
E S I = [ ( 1 E R I ) + E H I ] × E S s I
where ESI, ERI, EHI, and ESsI represent the Ecological Security Index, Ecological Risk Index, Ecosystem Health Index, and Ecosystem Service Index, respectively.

2.3.5. Spatial Autocorrelation

A spatial autocorrelation model is employed to analyze the spatial heterogeneity characteristics of ESI in the Source Region of the Yangtze and Yellow Rivers (SRYY). Global Moran’s I is used to evaluate the overall spatial correlation. Local Moran’s I identify local clustering types, categorized into five groups: HH (high-value clustering), HL (high values surrounded by low values), LH (low values surrounded by high values), LL (low-value clustering), and NS (not significant). The formulas [30] are presented as follows:
I = n S 0 i = 1 n j = 1 n w i j ( x i x ¯ ) ( x j x ¯ ) i = 1 n ( x i x ¯ ) 2
I i = x i x ¯ S 2 j = 1 n w i j ( x j x ¯ )

2.3.6. Geographic Detector

This study adopts a 1 km grid to discretize the SRYY and applies the Geographic detector model to investigate the driving mechanisms of various factors on the spatial heterogeneity of ESI. The model assesses the explanatory power of interactions among multiple influencing factors on the spatial heterogeneity of the target variable, quantified through the q-statistic [49]. A higher q-value indicates stronger explanatory power of the factor on the target variable. The core metric of GeoDetector is the q-value, calculated via Analysis of Variance (ANOVA). The q-value represents the contribution of an influencing factor (or factor combination) to the spatial heterogeneity of the target variable, with the formula expressed as:
q = 1 h = 1 H n h var ( h ) H var ( Y )
where H is the number of regions, NH is the sample size in the h-th region, var(h) is the variance of the target variable within the h-th subregion, and var(Y) is the total variance of the target variable. A q-value closer to 1 indicates a stronger explanatory power of the factor on the target variable, while a q-value closer to 0 suggests a weaker relationship.

3. Results and Analysis

3.1. Temporal Dynamics

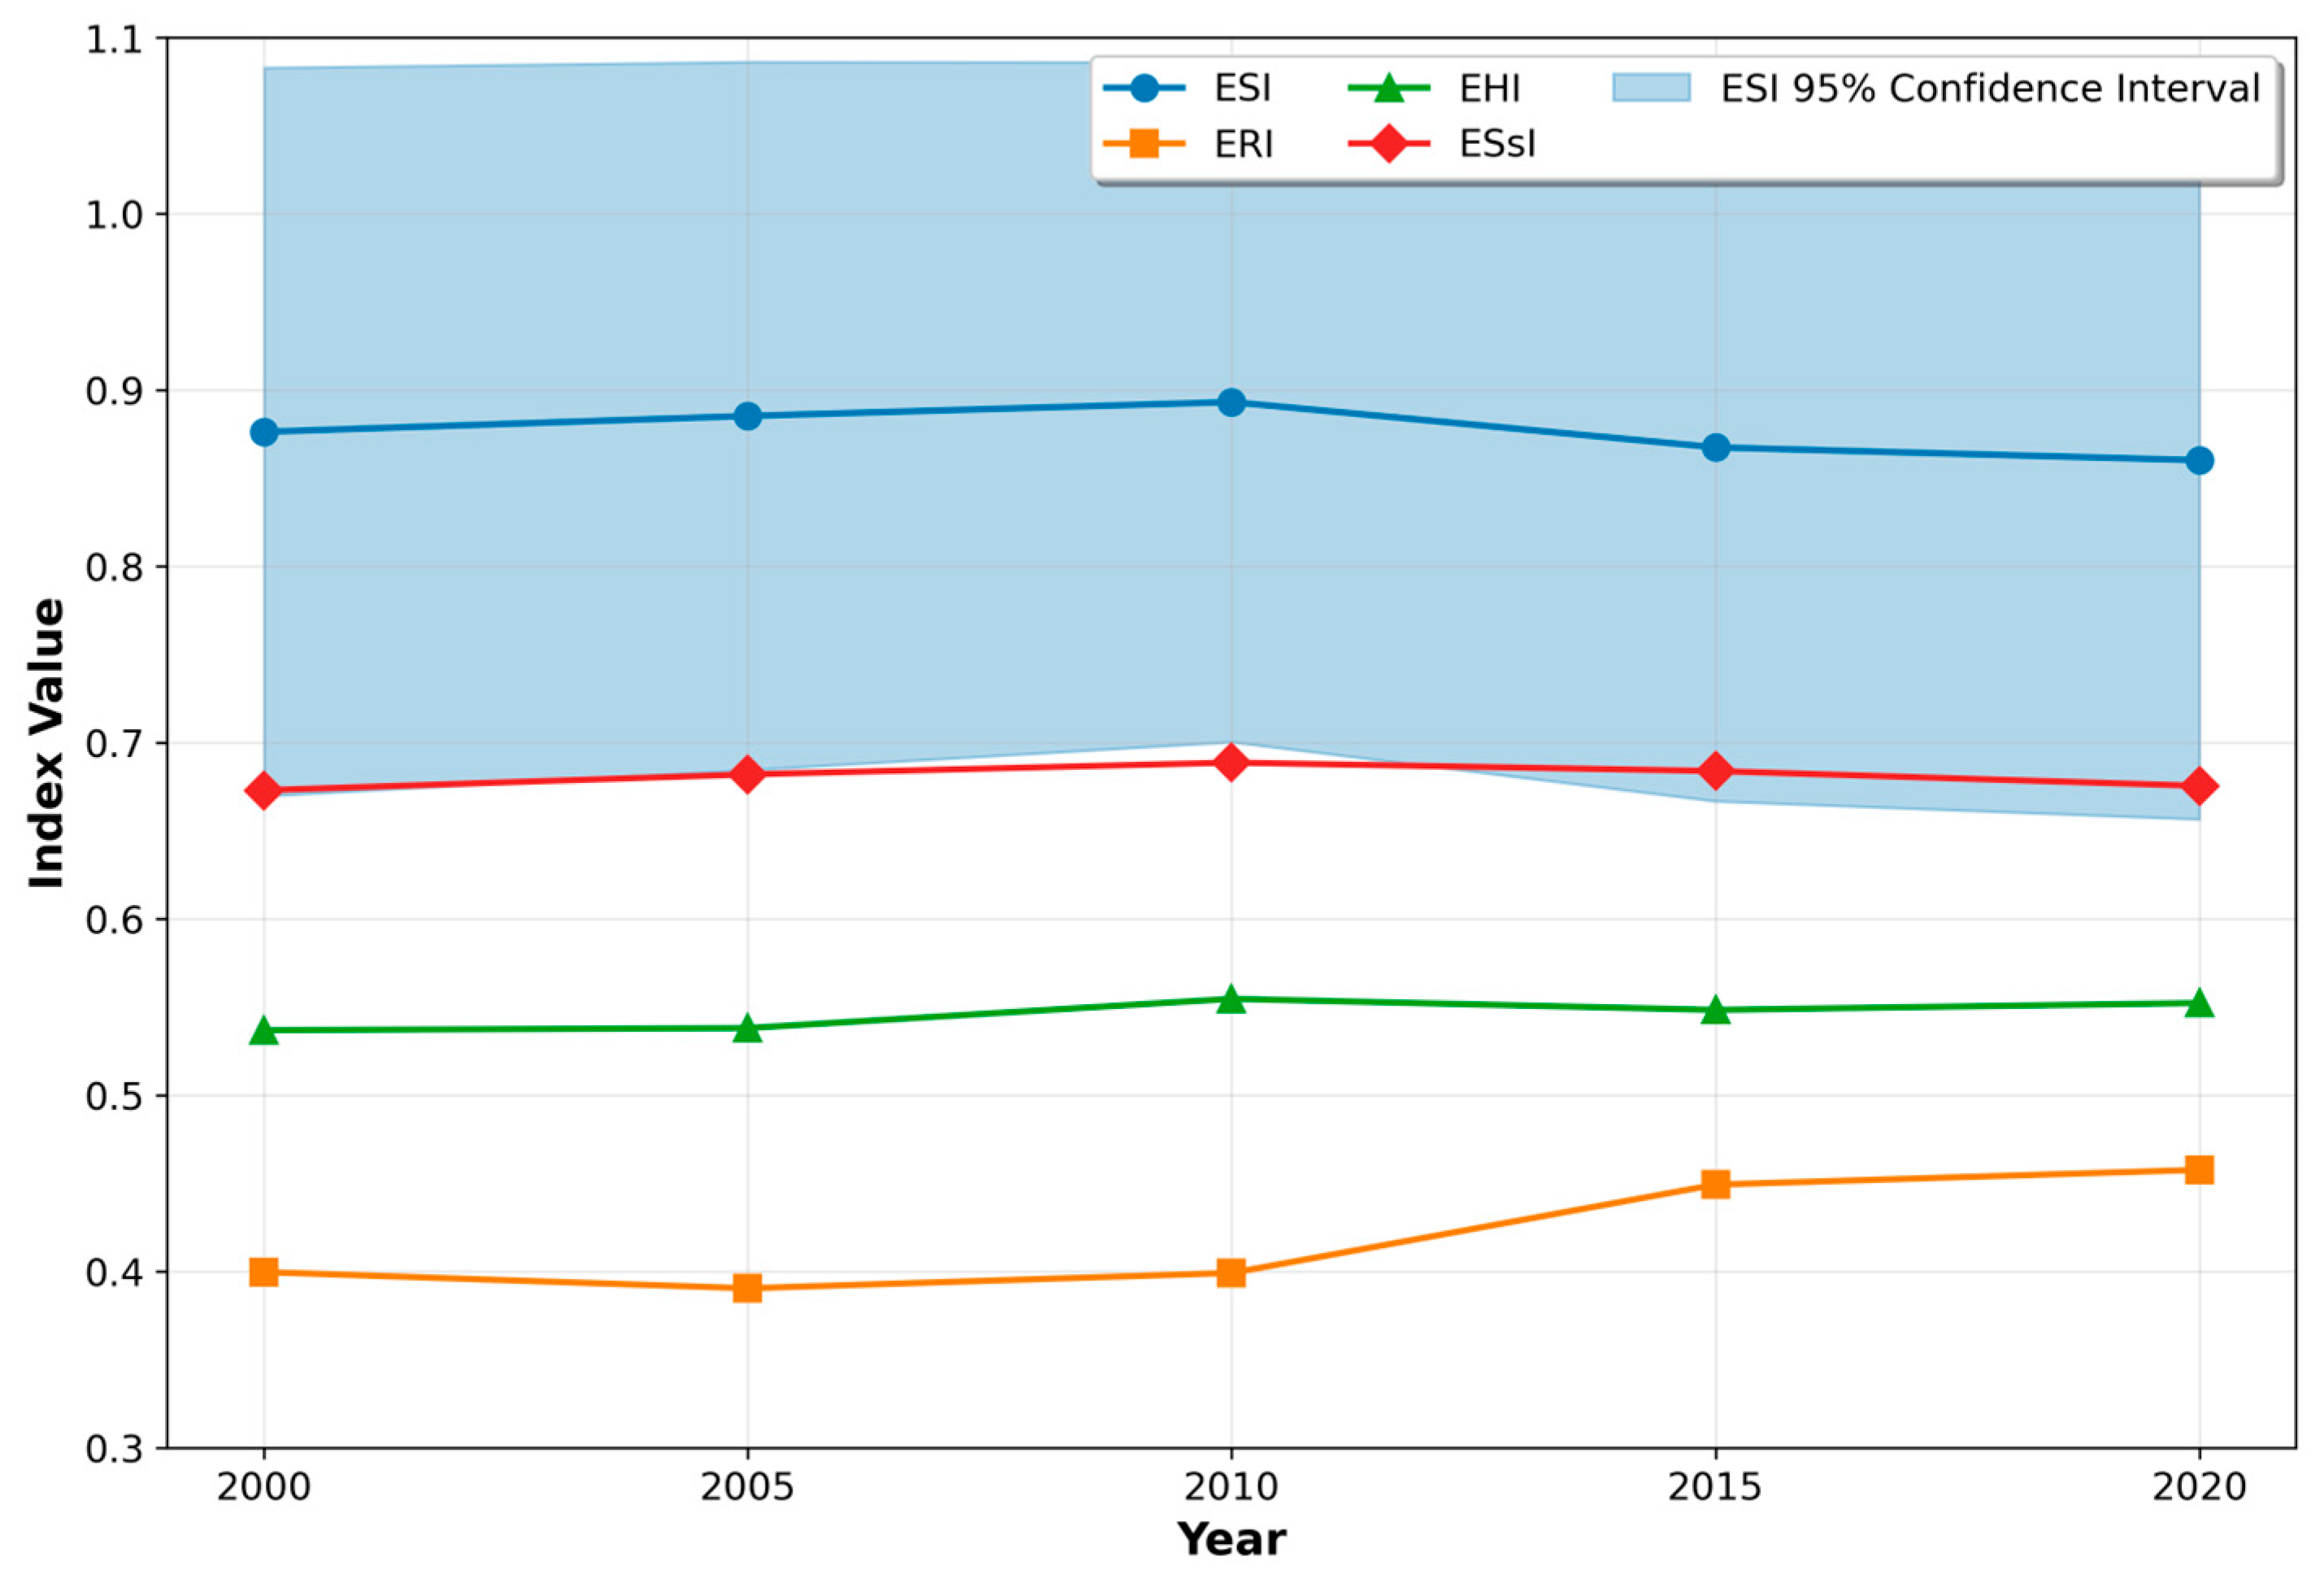
Overall, analysis of ecological indices in the Source Region of the Yangtze and Yellow Rivers (SRYY) from 2000 to 2020 reveals distinct temporal patterns (Figure 3), based on the data provided in Table S1 (see Supplementary Materials). The Ecological Security Index (ESI) exhibited a phased trajectory characterized by an initial increase followed by a decline. Specifically, ESI showed a steady rise from 0.873 in 2000 to a peak of 0.893 in 2010, subsequently transitioning to a consistent downward trend, ultimately falling to 0.860 in 2020—below its initial baseline value [46]. Correspondingly, the Ecological Risk Index (ERI) demonstrated a significant upward trajectory over the two decades, increasing from 0.40 in 2000 to 0.46 in 2020. The Ecosystem Health Index (EHI) and Ecosystem Service Supply Index (ESsI) followed evolutionary trajectories similar to ESI: both increased gradually from 2000 to 2010 (EHI: 0.537→0.555; ESsI: 0.673→0.689), followed by synchronous declines thereafter. A pronounced inverse relationship was observed between ERI and both ESI/ESsI, particularly after 2010. The rise in ERI coincided with declines in ESI and ESsI, indicating that heightened ecological risk exerted negative impacts on ecosystem health and service provision. Throughout the monitoring period, fluctuations in all indices remained minimal. This stability is attributed to synergistic effects of spatial scale and ecosystem resilience: the macro-scale study area exhibited inherent buffering capacity against external disturbances, while internal ecological regulatory mechanisms maintained index variability within stable thresholds.
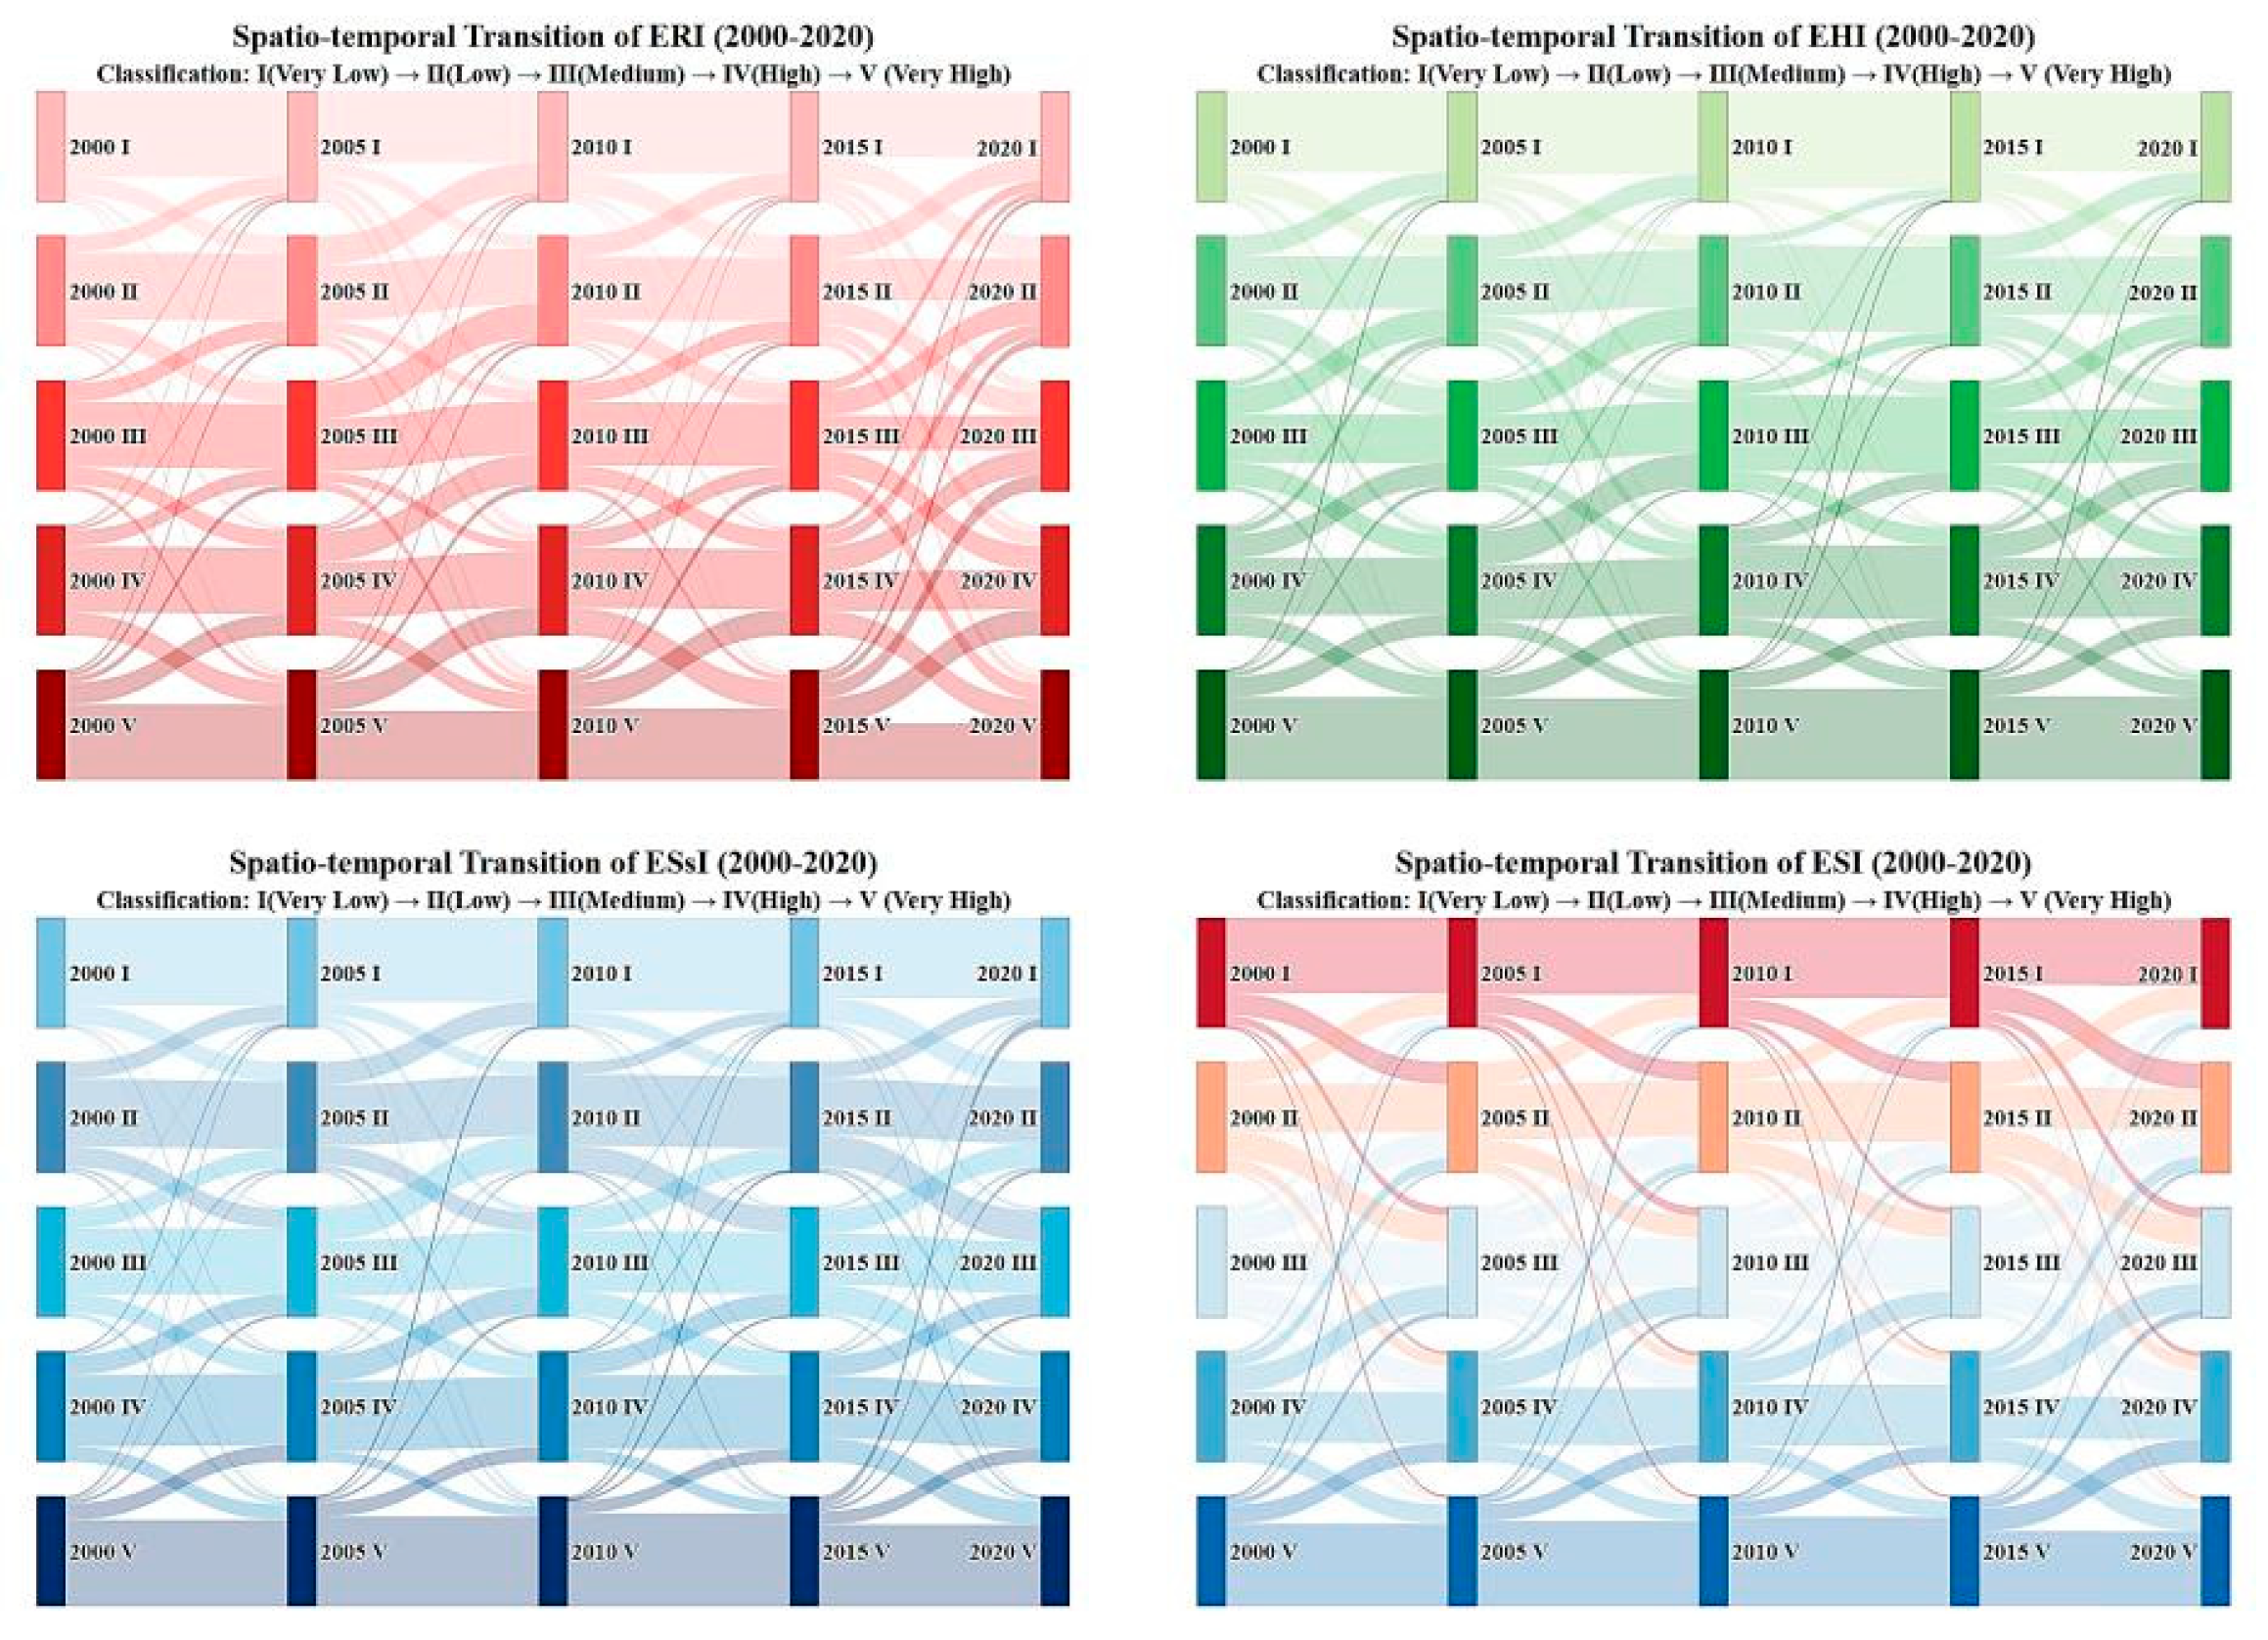
Sankey diagrams are used to visualise flows of materials and energy in many applications, to aid understanding of losses and inefficiencies, to map out production processes, and to give a sense of scale across a system [50]. Using the natural breaks method, each index was classified into five levels (I–Very Low to V–Very High). Sankey diagrams derived from transition matrices (Figure 4) further elucidate these dynamics: from 2000 to 2020, EHI markedly shifted toward higher health categories (IV and V), indicating an overall improvement in health status. At the same time, ERI predominantly transitions to higher risk categories (IV and V), reflecting increasing risk exposure in the SRYY. Approximately 60% of annual level changes occur between adjacent categories, with infrequent cross-level transitions, suggesting that ecosystem changes are characterized by gradual progression.

3.2. Spatial Distribution Analysis

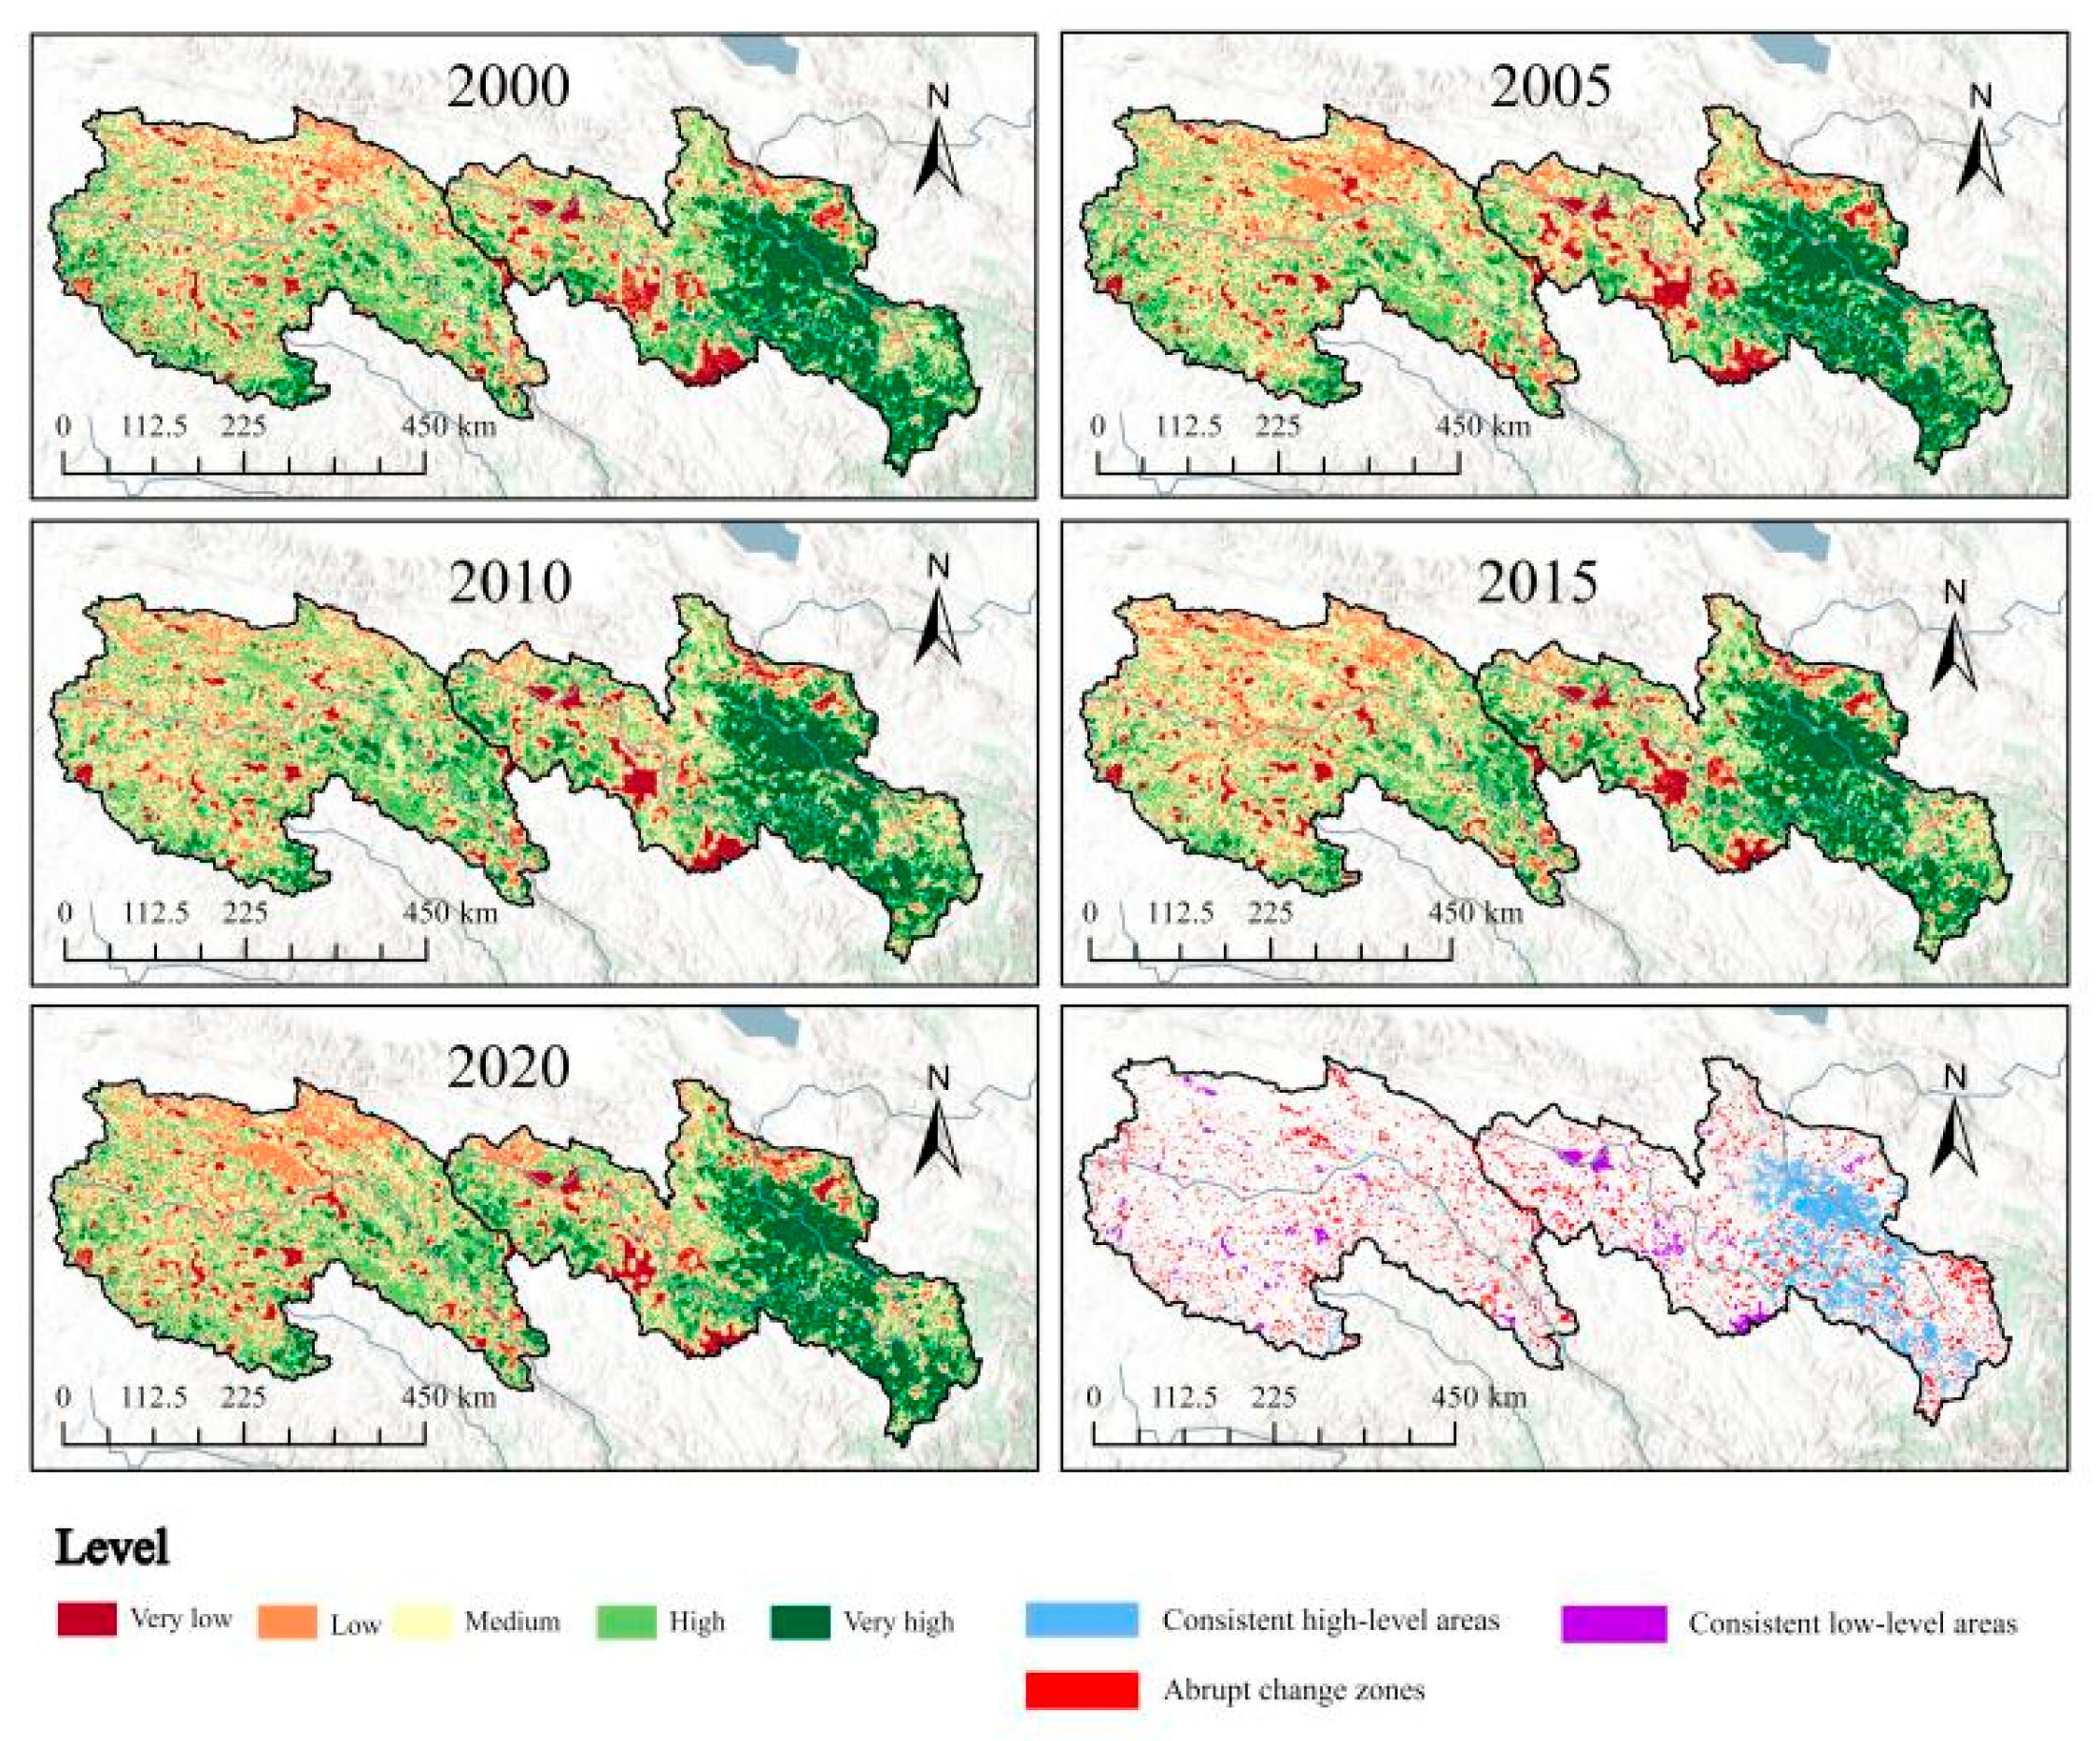
Using the natural breaks method, ecological security in the Source Region of the Yangtze and Yellow Rivers (SRYY) was classified into a five-tier system (I–Very Low to V–Very High), with spatial heterogeneity characteristics illustrated in Figure 5. Analysis reveals that areas classified as Very High (dark green) are predominantly concentrated in the eastern SRYY (Maqu County, Jiuzhi County, Aba County, Hongyuan County, Gande County, and eastern Maqên County), forming a contiguous high-security core zone. Conversely, Very Low areas (dark red) primarily occupy the complex terrain of the central-western regions (Dari County, Maduo County, Qumalai County, and Zadoi County), exhibiting patchy aggregation with Low areas (orange) in the northwest, collectively forming a low-security belt. The overall spatial pattern displays a clear meridional gradient, with ecological security levels decreasing progressively along the east-west axis, closely coupled with regional topographic gradients and elevation changes.
Compared to 2000, the ecological security index in the Source Region of the Yangtze River has generally declined. In the northern Chumar River Basin and the midstream areas of Qumalai County and Zadoi County, the ecological security index has shown a significant decrease, with a marked increase in the proportion of areas classified as Low (orange). In the Source Region of the Yellow River, however, the ecological security index has generally improved in Dari County and Shiqu County, from the river source to Maqu, with a notable reduction in the proportion of areas classified as Very Low (dark red). Nevertheless, in the northern part of Maduo County, the proportion of areas classified as Low (orange) has increased.
Temporal analysis (2000–2020) indicates that stable areas consistently maintaining Very High status (blue markers) are mainly distributed in the low-elevation river valley zones of the southern SRYY (Baima County, Maqu County, Jiuzhi County, Aba County, Hongyuan County, Gande County and eastern Maqên County). In contrast, persistently Very Low fragile areas (purple markers) exhibit strong spatial overlap with plateau lakes (Gyaring Hu and Ngoring Lake), highlighting the pronounced vulnerability of lake ecosystems within the regional ecological security pattern. These findings underscore the need to prioritize lake ecosystems for conservation efforts.
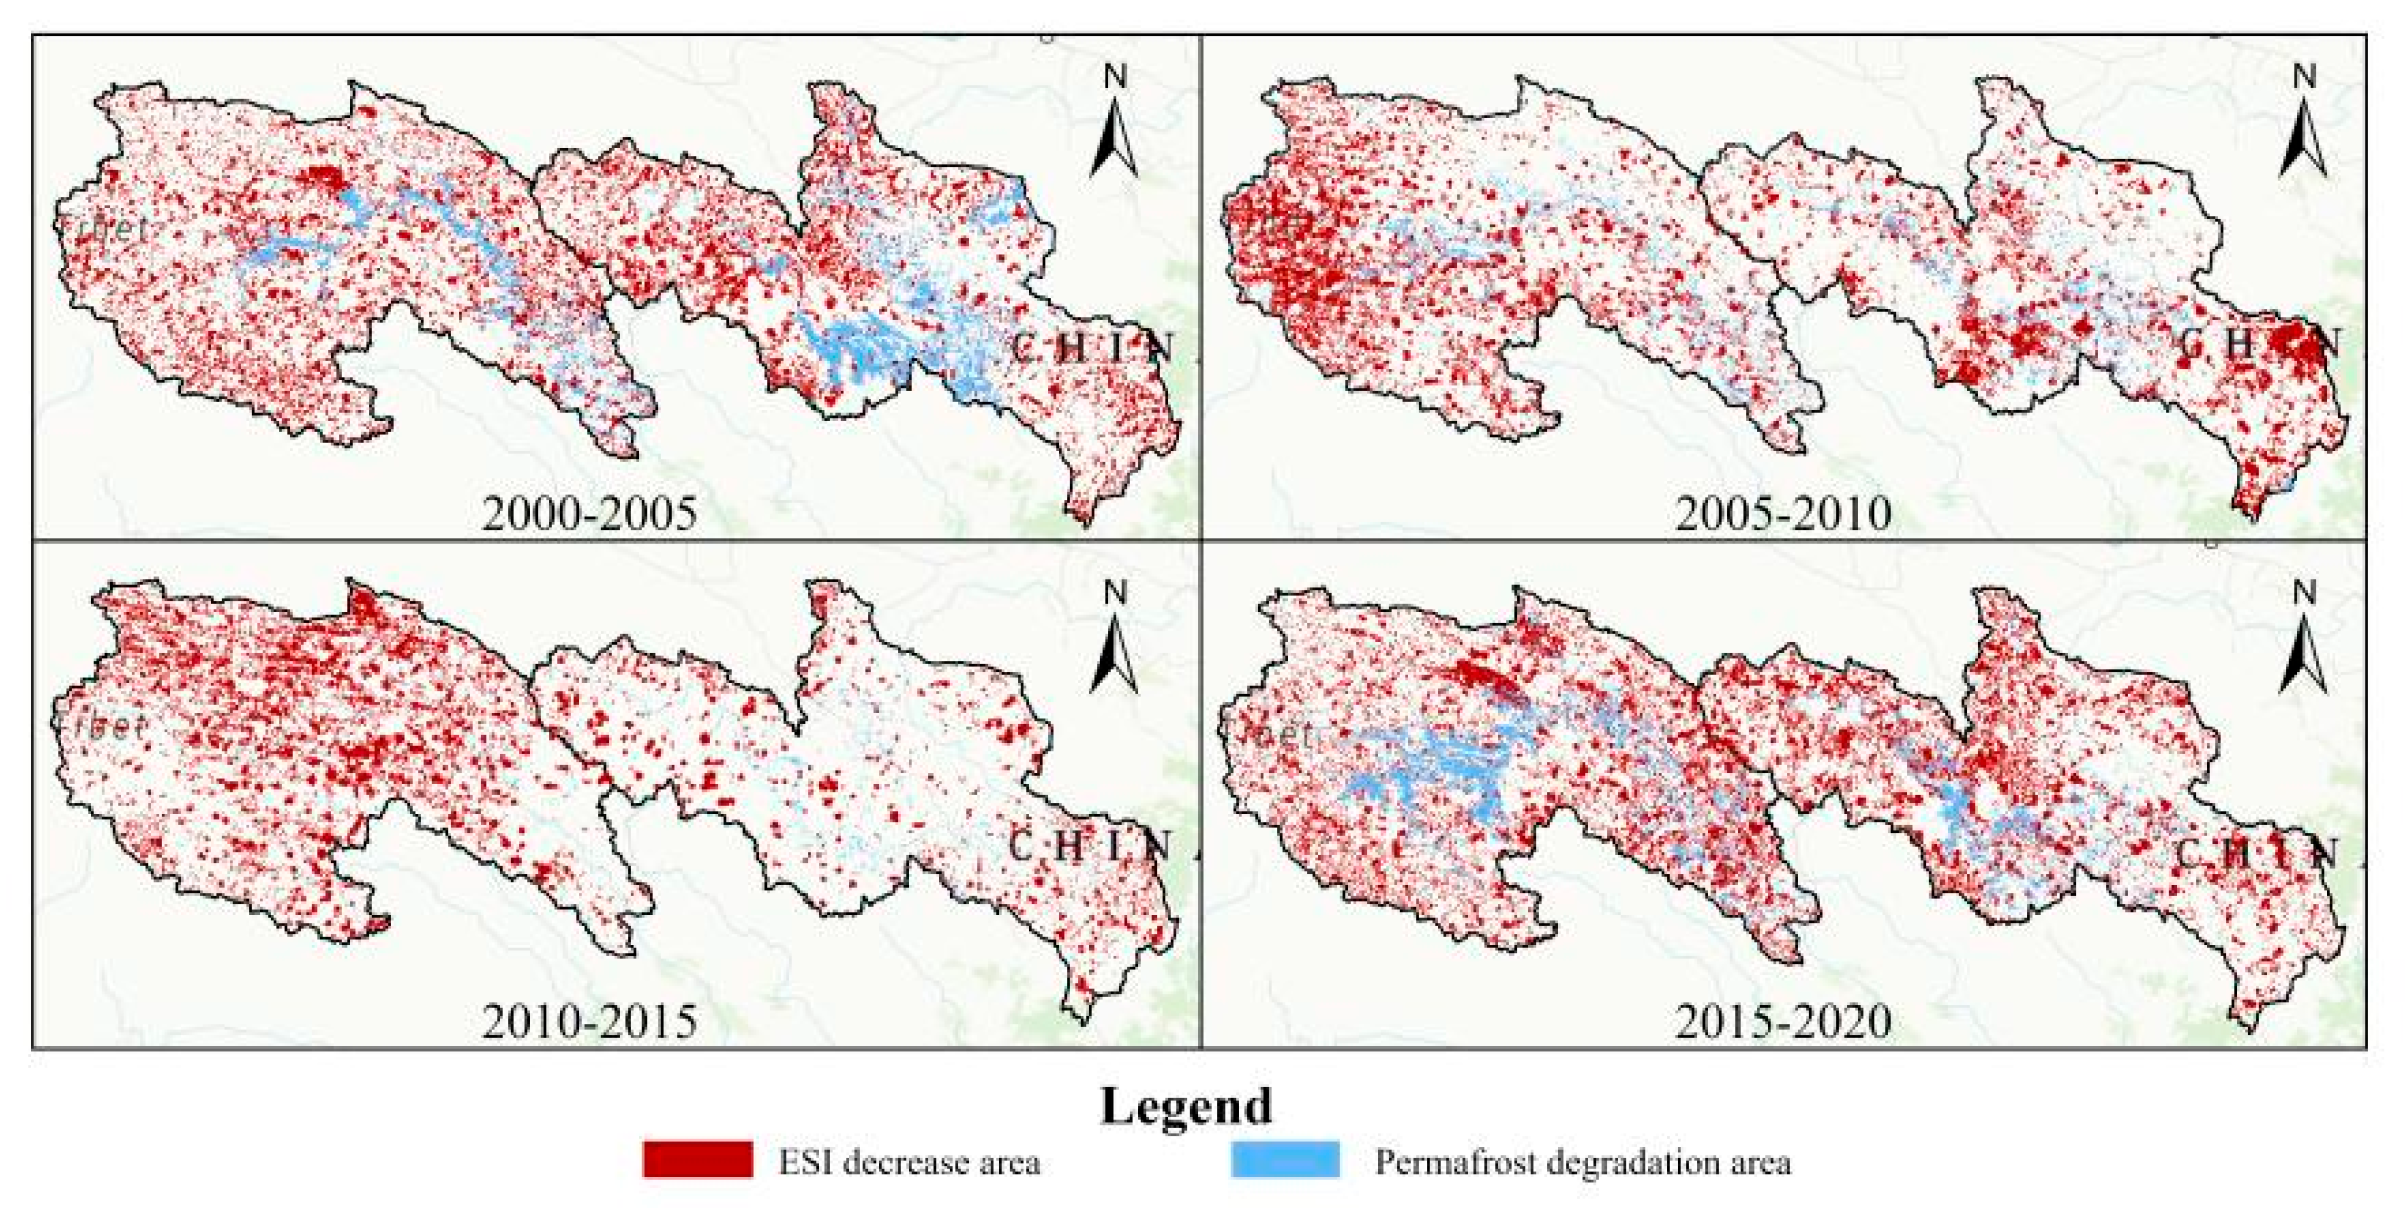
This study utilizes ecological security level data across four consecutive five-year periods (2000–2005, 2005–2010, 2010–2015, and 2015–2020). Further analysis of regions with declining ESI and corresponding permafrost degradation zones (Figure 6) reveals that Pearson and Spearman correlation coefficients between areas of significant ESI change and permafrost degradation are near zero, indicating negligible linear or monotonic relationships. This lack of correlation may stem from the composite nature of ESI, differences in spatiotemporal scales, or the dominance of other factors. For instance, ESI integrates multiple ecological indicators, and permafrost degradation’s impacts on vegetation or soil may be diluted by factors like land use changes. Additionally, ESI variations may be more strongly influenced by human activities and climatic variables than permafrost degradation.

3.3. Spatial Autocorrelation

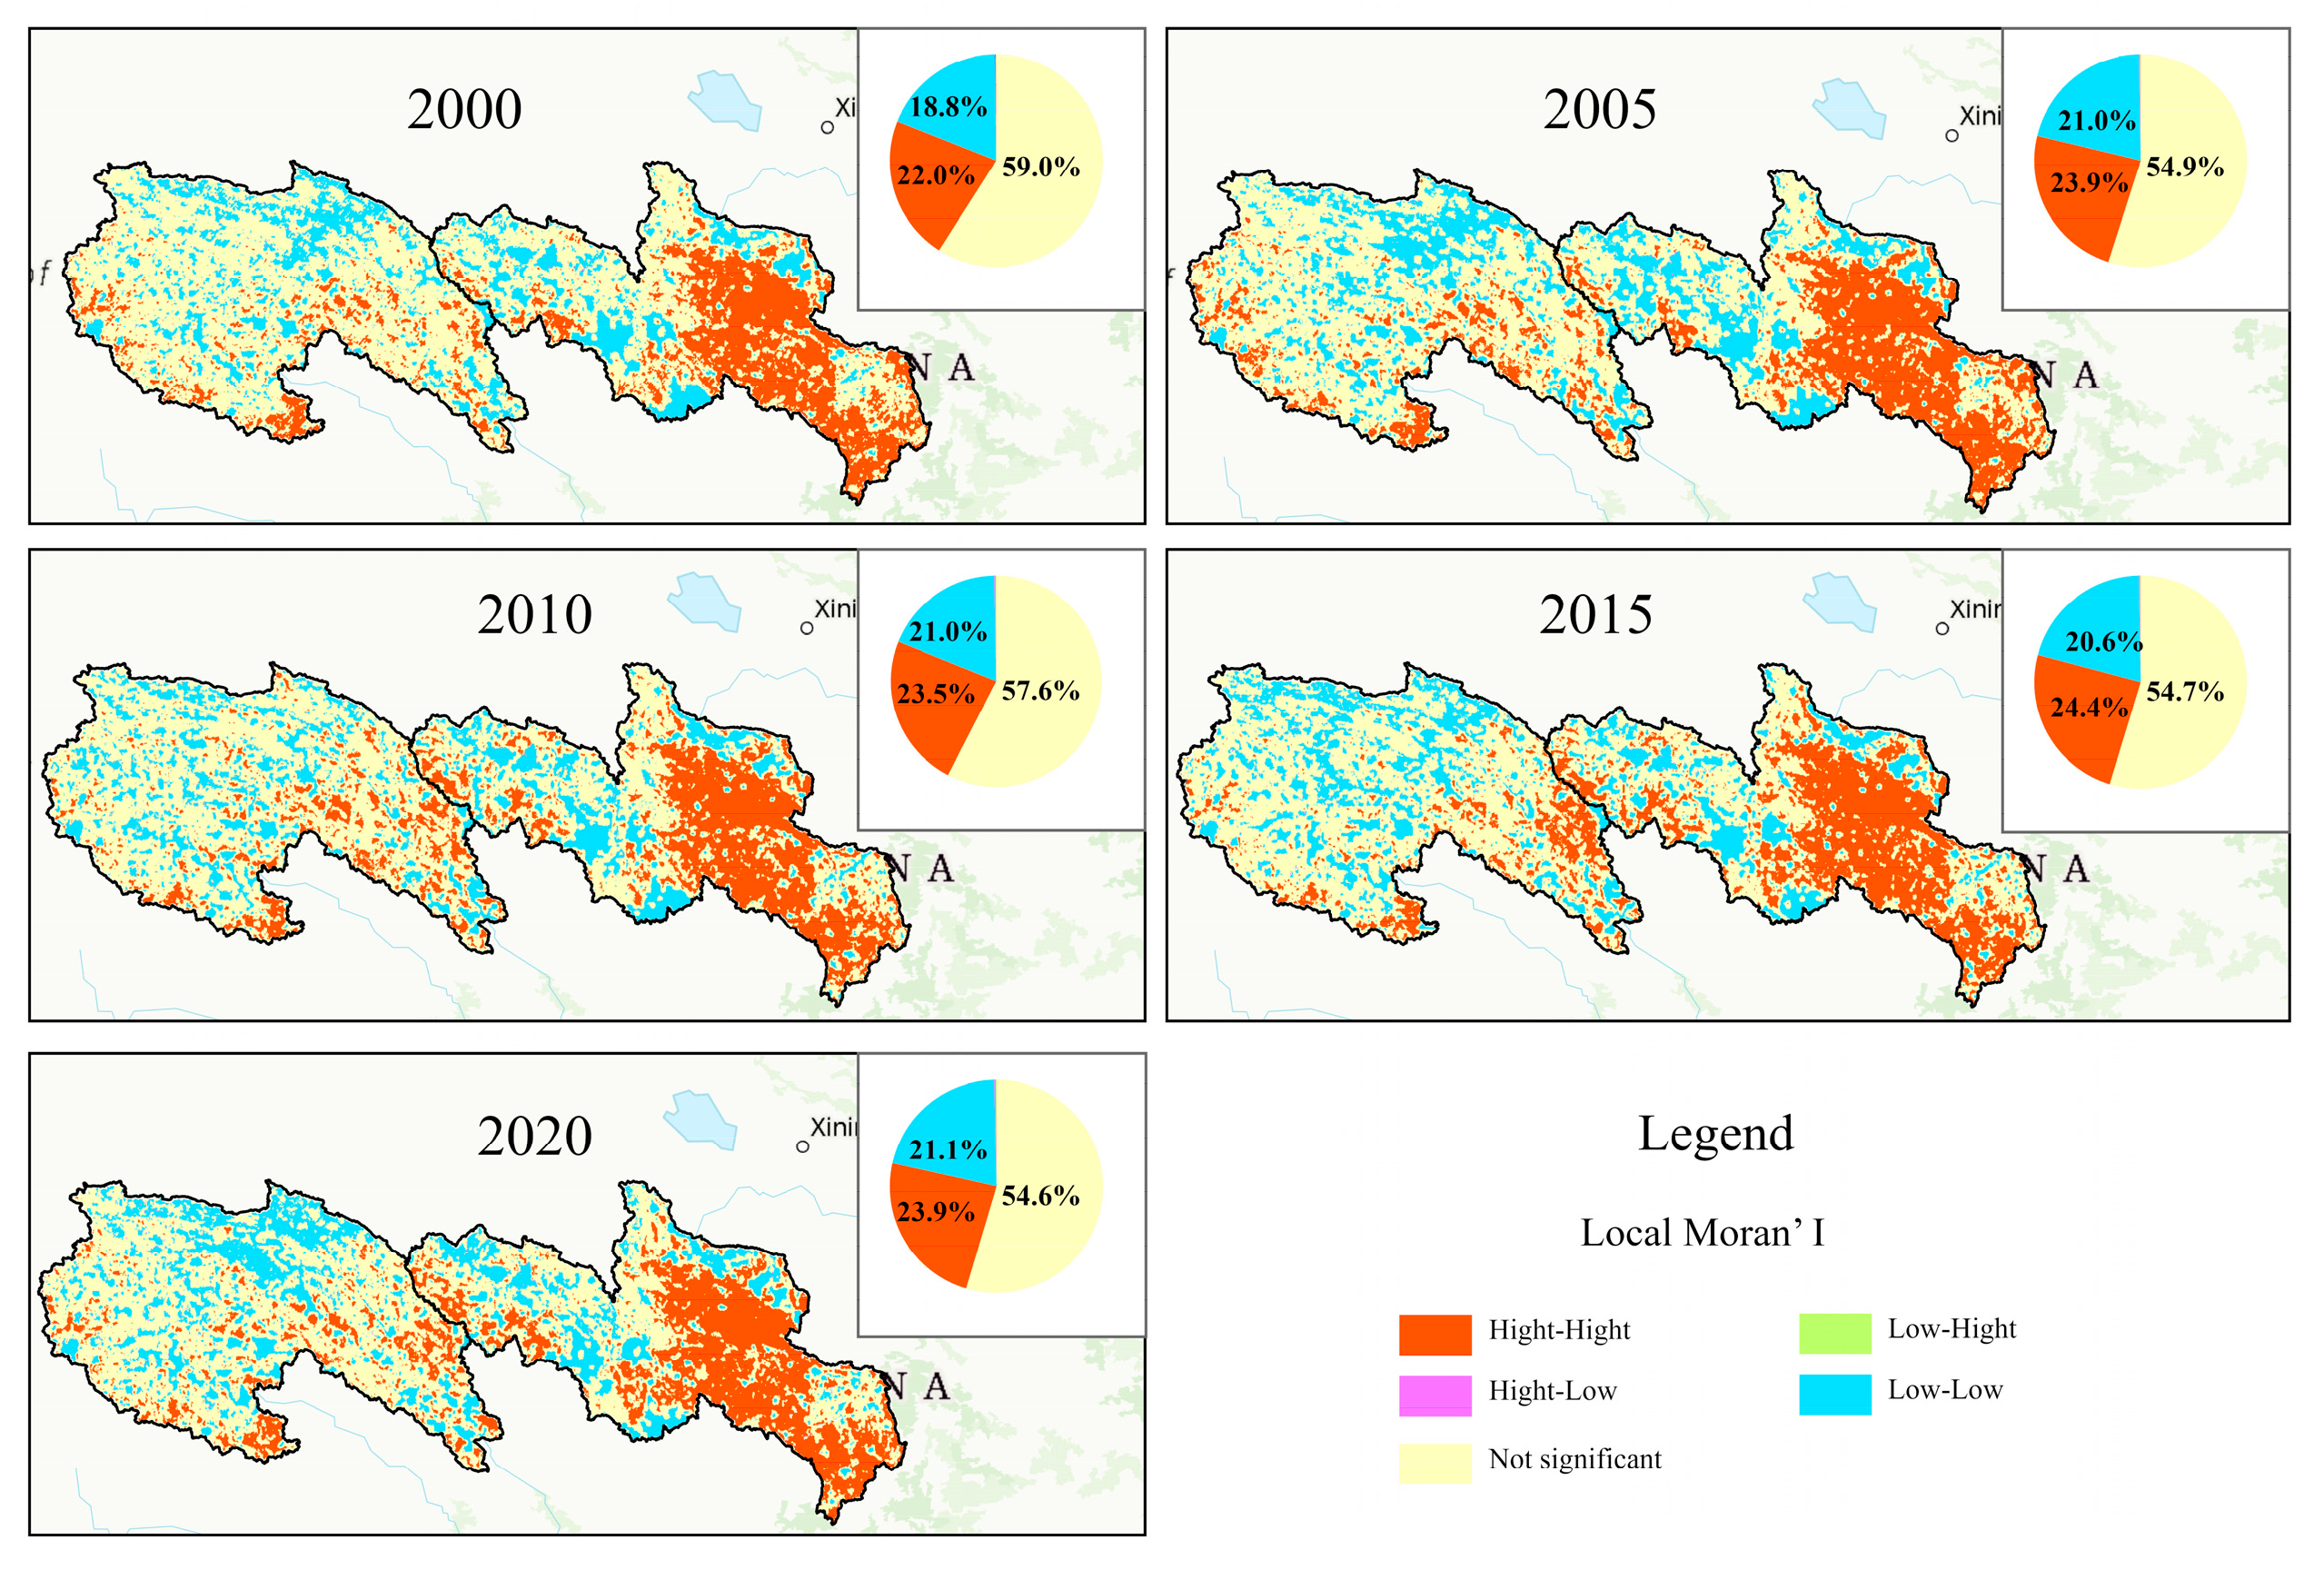
Spatial autocorrelation analysis of the Ecological Security Index (ESI) was conducted using ArcGIS Pro, employing the Spatial Autocorrelation (Global Moran’s I) and Cluster/Outlier Analysis (Anselin Local Moran’s I) tools. Global Moran’s I values for the years 2000, 2005, 2010, 2015, and 2020 were 0.85, 0.87, 0.86, 0.86, and 0.84, respectively, indicating strong spatial clustering of ESI. Both high-security and ecologically fragile areas exhibit contiguous distributions.
Through significance testing (p < 0.05), regions were classified into five spatial association patterns: High-High (HH), Low-Low (LL), High-Low (HL), Low-High (LH), and Not Significant (NS). Local Indicators of Spatial Association (LISA) analysis from 2000 to 2020 (Figure 7) shows an overall strengthening of spatial autocorrelation, with a slight increase in the proportion of HH and LL clusters and a gradual decline in NS areas. The High-High (HH) clusters are primarily concentrated in the eastern Yellow River source region (encompassing Gande County, Baima County, Maqu County, Jiuzhi County, Aba County, and Hongyuan County) and the hydrological junction of the Yangtze and Yellow River source regions (Chengduo County), maintaining a high spatial proportion (22.0–24.4%). These clusters increased steadily from 2000 to 2015, peaking in 2015. In contrast, the Low-Low (LL) clusters are predominantly located in the northern Yangtze River source region (Qumalai County) and western Yellow River source region (Maduo County), with their spatial extent expanding over time from 18.8% in 2000 to 21.1% in 2020.
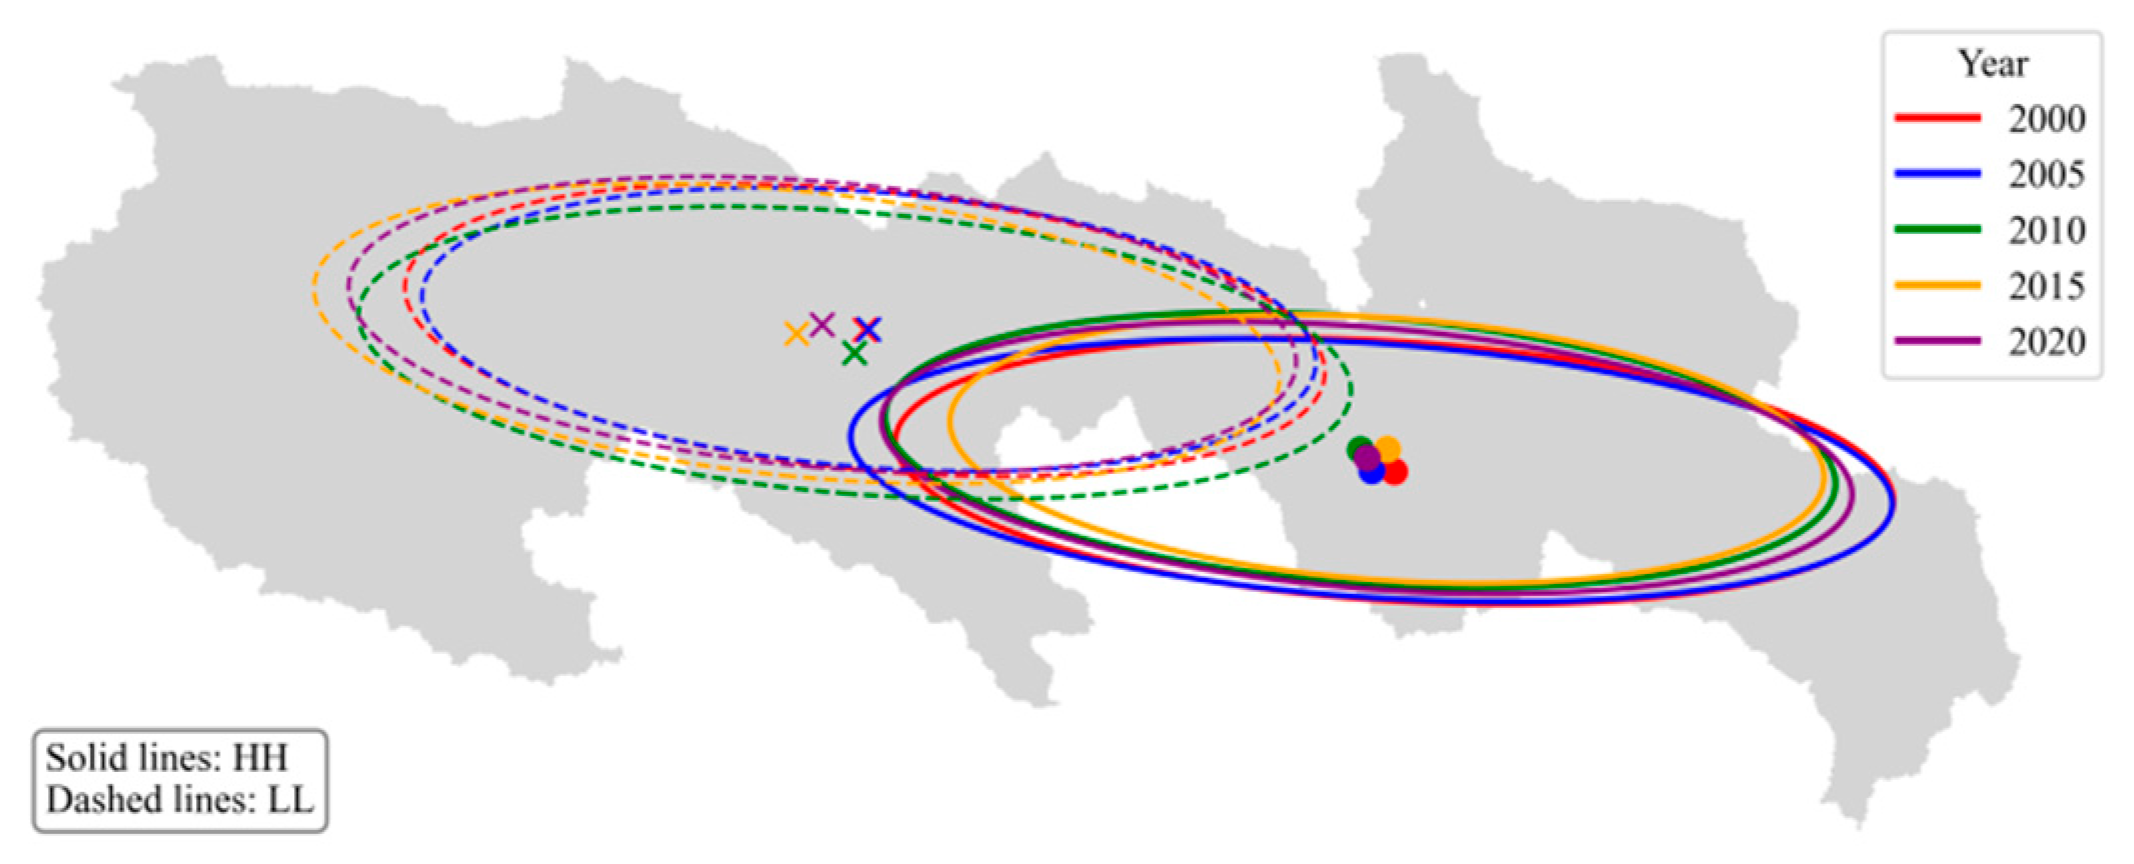
Standard deviation ellipse analysis of HH and LL clusters (Figure 8) reveals that the LL ellipse center exhibits minimal movement from 2000 to 2020, shifting slightly westward and concentrating in the central-eastern Yangtze River source region (Qumalai County, Tuotuo River basin). This region, characterized by high-altitude, cold Qinghai-Tibet Plateau conditions, has inherently fragile ecosystems with low vegetation cover and severe soil erosion, exacerbated by climate change impacts such as drought or permafrost degradation. The concentration and westward migration of LL areas may reflect the expansion of climate change or natural degradation processes into western high-altitude zones.
The HH ellipse center shows slight migration from 2000 to 2020, moving from the southeast to the northwest, concentrating in the central Yellow River source region (Maqên County). This area likely benefits from favorable natural conditions, including abundant water resources, better soil quality, and higher vegetation cover, which support ecosystem recovery and maintenance. The northwestward migration of HH clusters may be linked to the restoration of wetlands and grasslands in the central region (Chengduo County and Maduo County), bolstered by conservation policies, establishing these areas as core zones of high-value clustering.

3.4. Attribution Analysis

This study employs the Geographic Detector model to analyze the Ecological Security Index (ESI) in the Source Region of the Yangtze and Yellow Rivers (SRYY) from 2000 to 2020, using 13 independent variables across meteorological, soil, vegetation, and landscape categories (Table 3).
The selection of indicators for attributing the ecological security index in the SRYY study area using the Geodetector method is based on well-established factors from ecological and environmental studies, which emphasize their roles in driving spatial heterogeneity and ecosystem dynamics. Topographic indicators, including DEM (X1), slope (X2), and surface roughness (X3), were chosen because they critically influence water runoff, soil erosion, habitat suitability, and overall landscape stability in ecologically vulnerable regions, as demonstrated in alpine wetland assessments [51]. Vegetation indicators such as LAI (X4), FVC (X5), NAMI (X6), and NDVI (X7) were selected to capture ecosystem productivity, vegetation health, and coverage, which are pivotal for evaluating resilience and response to disturbances, with NDVI particularly noted for its strong explanatory power in reducing ecological risk through enhanced vegetation density [52]. Meteorological factors, encompassing PET (X8), precipitation (X9), temperature (X10), and SWI (X11), account for climatic drivers that regulate water balance, evapotranspiration, and growth conditions, often showing high influence in Geodetector analyses of vegetation and ecosystem changes [53]. Soil hydraulic conductivity (X12) was included to assess soil water movement, texture, and retention capacities, which underpin ecosystem resilience and are commonly integrated in multi-factor attribution models [54]. Lastly, landscape heterogeneity (X13) was chosen to evaluate spatial patterns, fragmentation, and diversity (e.g., via indices like SHDI), which affect biodiversity and ecological connectivity in land security evaluations [55]. These selections draw from Geodetector-based studies that quantify interactive effects among such indicators, ensuring a comprehensive and non-redundant framework tailored to the study area’s characteristics.
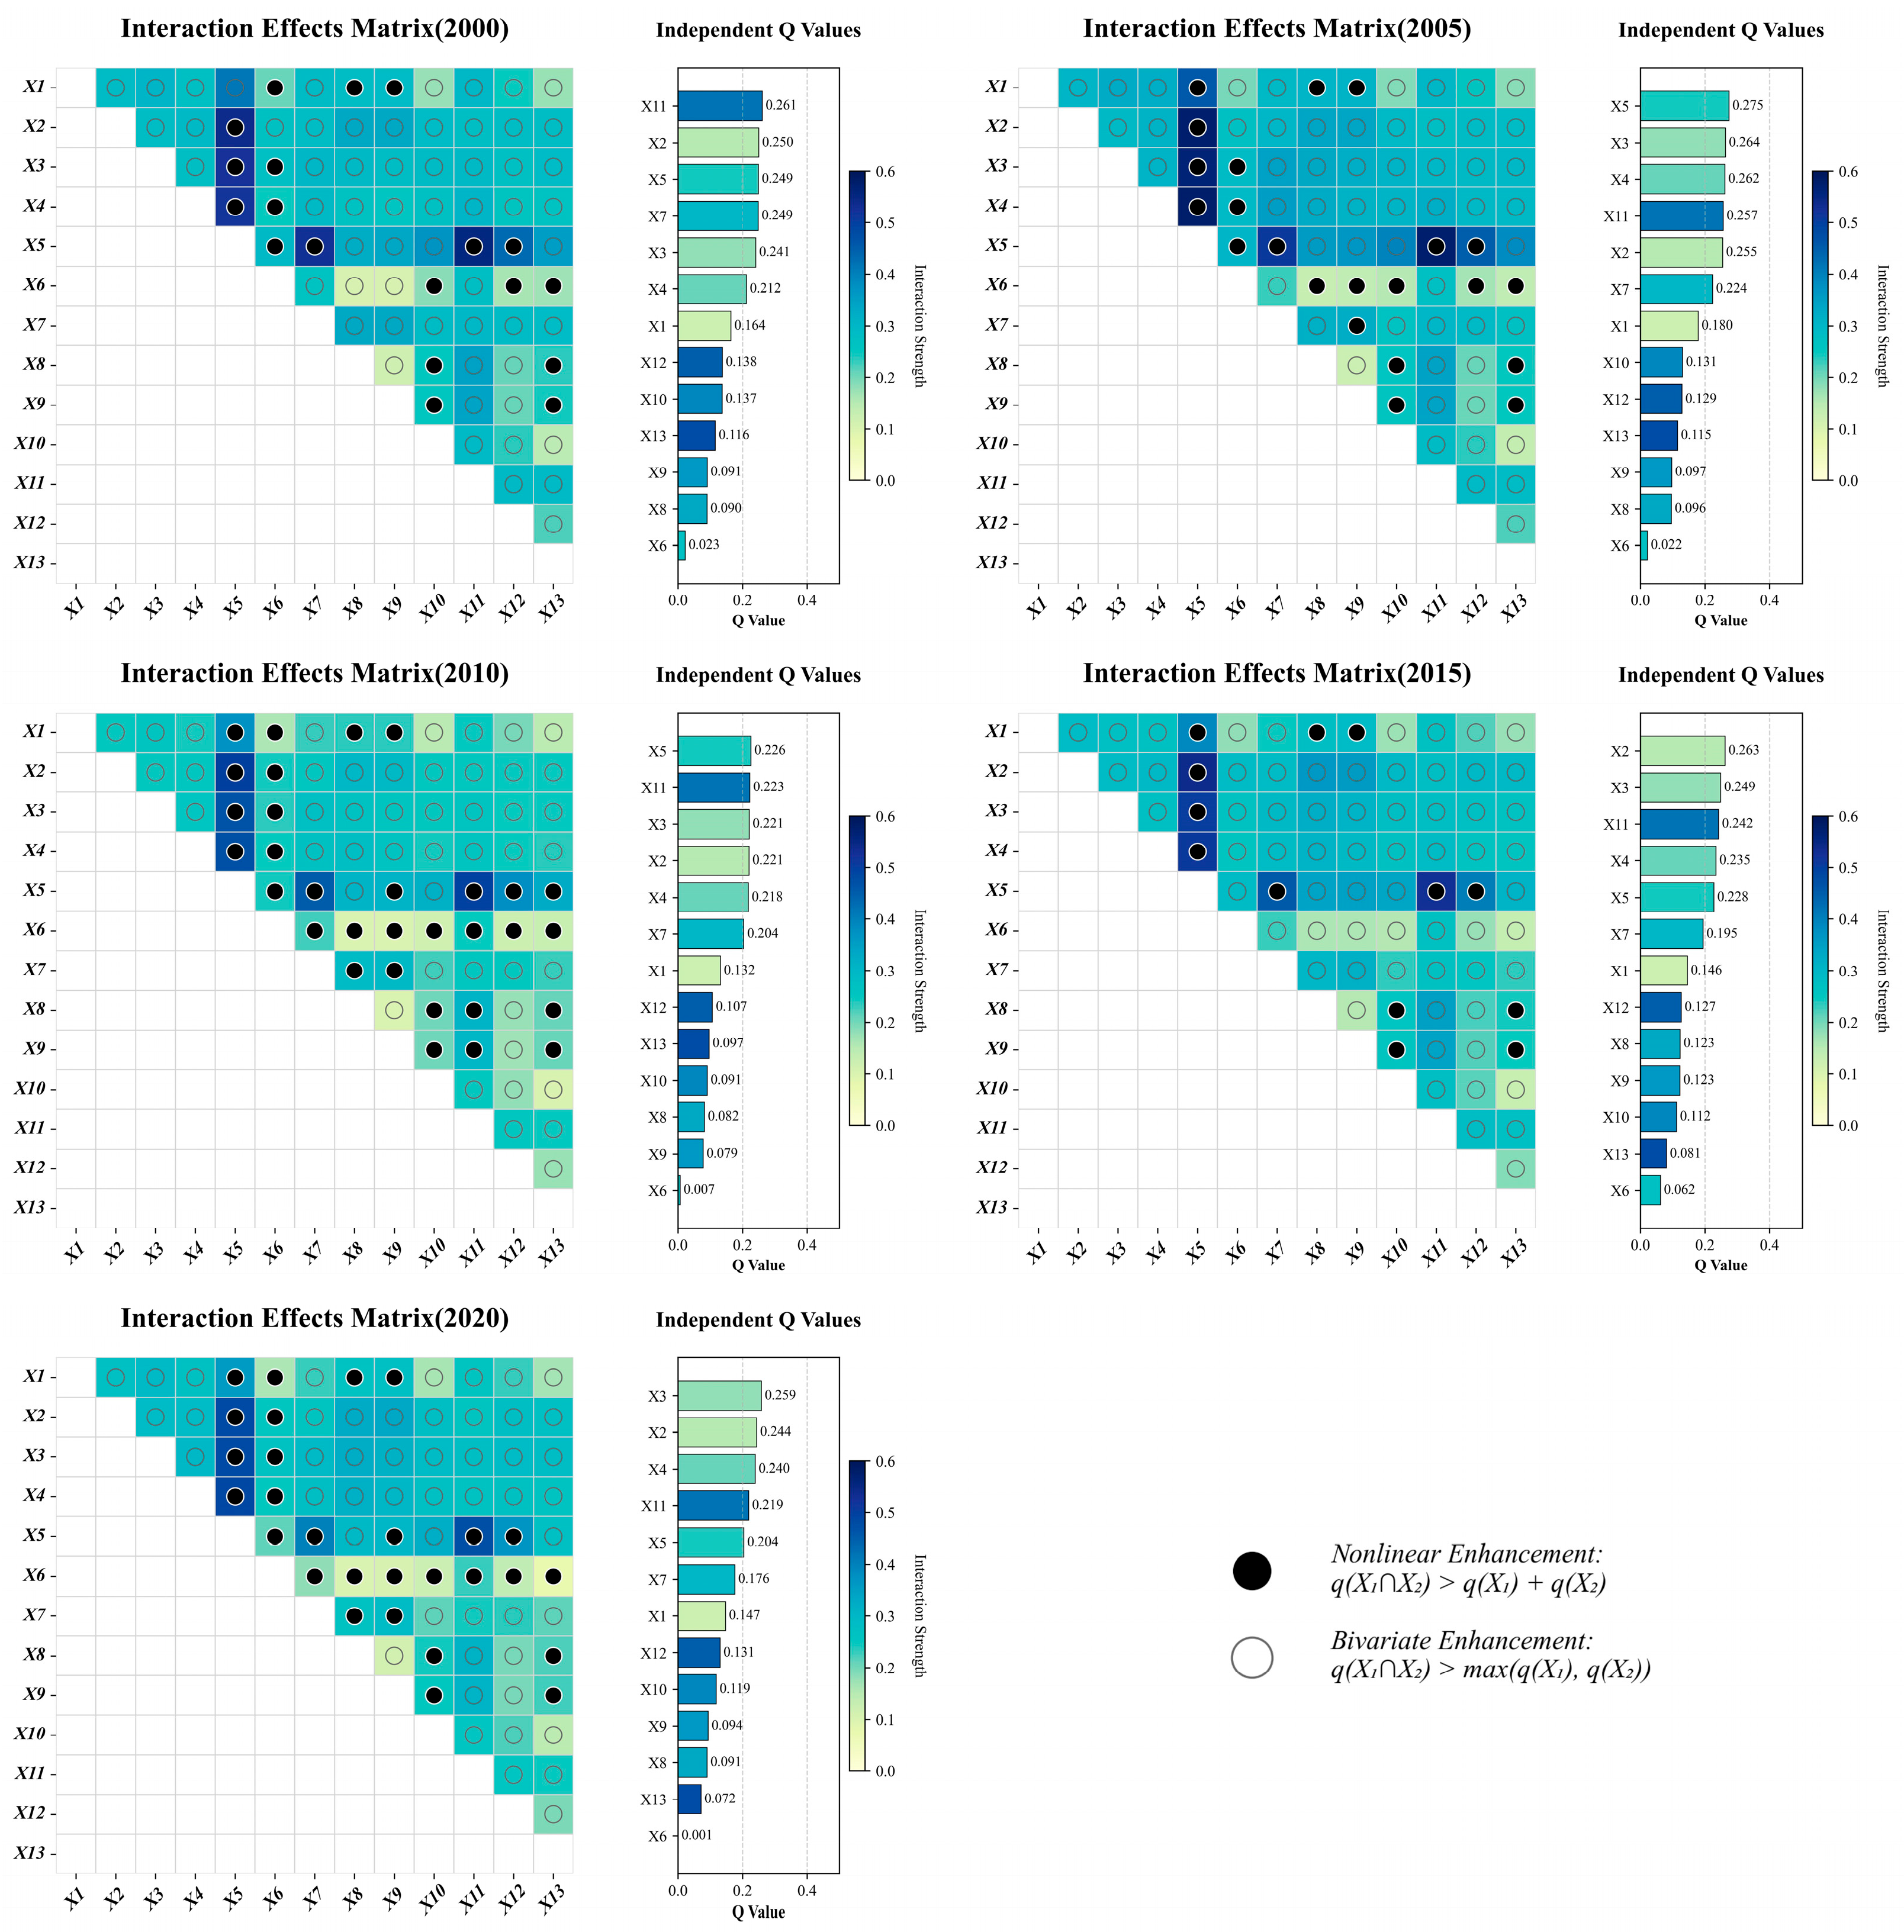
Interactive effect analysis of factors influencing the Ecological Security Index (ESI) in the Source Region of the Yangtze and Yellow Rivers (SRYY), based on the geographic detector model (Figure 9), identifies fractional vegetation cover (X5) as the central driver of spatial heterogeneity through synergistic interactions.
Analysis of the interactive effects of influencing factors on the Ecological Security Index (ESI) in the source regions of the Yangtze and Yellow Rivers, based on the geographical detector model (Figure 9), reveals that vegetation coverage (X5) exhibits significant interactions with topographic factors (slope, X2; surface roughness, X3), soil factors (soil moisture index, X11), and vegetation factors (leaf area index, X4; NDVI), with all interaction q-values exceeding 0.40 (p < 0.01). These findings establish X5 as a primary driver of ESI spatial heterogeneity. Notably, the q-values of interaction terms involving X5 are significantly higher than those of individual factor contributions, indicating that synergistic effects, mediated through nonlinear mechanisms, substantially enhance the explanatory power for ESI spatial differentiation.
Single-factor analysis demonstrates significant variations in the contributions of 13 variables to ESI spatial heterogeneity from 2000 to 2020. Slope (X2), surface roughness (X3), soil moisture index (X11), and vegetation coverage (X5) consistently exhibit high explanatory power (q > 0.2), establishing them as dominant factors. In contrast, normalized difference moisture index (NDMI, X6), potential evapotranspiration (X8), precipitation (X9), and landscape heterogeneity (X13) maintain lower contributions throughout the period, rendering them secondary factors in influencing ecological security. Notably, the q-value of NDMI (X6) remains consistently low.

4. Discussion

4.1. Spatiotemporal Variations in Ecological Security

The overall trend of ecological security in the source regions of the Yangtze and Yellow Rivers from 2000 to 2020 exhibits a pattern of initial improvement followed by deterioration, with a marked increase in ecological risk since 2010. This trajectory aligns with broader environmental changes observed across the Tibetan Plateau [56]. The improvement from 2000 to 2010 likely corresponds to the establishment of the Three-River Source Provincial Nature Reserve by the Qinghai Provincial Government in 2000 and associated conservation measures, such as grazing bans and wetland restoration projects [57,58]. However, the post-2010 decline is closely linked to intensified human activities, including infrastructure development and tourism expansion, coupled with accelerated climate warming [56]. For instance, studies indicate that post-2010 warming rates on the Tibetan Plateau reached 0.04 °C/year, leading to increased glacial meltwater and reduced ecosystem stability [59].
The significant negative correlation between the Ecological Risk Index (ERI) and both the Ecological Security Index (ESI) and Ecosystem Service Index (ESsI) suggests that rising ecological risks compromise ecosystem services by disrupting ecosystem structure [30]. The significant negative correlation between the Ecological Risk Index (ERI) and both the Ecological Security Index (ESI) and Ecosystem Service Index (ESsI) suggests that rising ecological risks compromise ecosystem services by disrupting ecosystem structure [60,61]. Additionally, intensified drought and land-use changes, such as the conversion of grasslands to farmland or built-up areas, have exacerbated this trend [58]. Although large-scale ecosystems like the source regions of the Yangtze and Yellow Rivers are often considered resilient to disturbances, prolonged external pressures, such as climate warming and human activities, may gradually erode their resilience [62], necessitating targeted conservation measures.
Spatially, ecological security exhibits a gradient decreasing from east to west, closely associated with topographic relief and elevation. The eastern lower-altitude areas (approximately 4500–5000 m) benefit from milder climates and higher vegetation coverage, resulting in greater ecological security, while the western high-altitude zones (>5400 m) experience lower security due to aridity and low temperatures. This pattern is consistent with studies suggesting that ecological differentiation in the Three-River Source region is primarily driven by topography [63]. Spatial clustering analysis further reveals a slight increase in both high-high (HH) and low-low (LL) clustering of ESI values, indicating a growing polarization of ecological security within the study area. Regions with favorable ecological conditions continue to improve, while ecologically fragile areas experience ongoing deterioration. This polarization reflects the differential responses of ESI to driving factors such as climate change, land-use change, and human activities, underscoring the need for spatially tailored management strategies to address these divergent trends.

4.2. Ecological Security Drivers

This study reveals that vegetation coverage (X5) is the core driving factor of ecological security in the source regions of the Yangtze and Yellow Rivers, synergistically interacting with soil moisture (X11), topographic factors (X2, X3), and meteorological factors (X9) to significantly influence the spatial heterogeneity of the Ecological Security Index (ESI). These findings indicate that vegetation plays a central role in mediating the combined regulatory effects of climate and topography on ecological security. This conclusion aligns with the findings of [64].
In comparison with existing studies on ecological security in the Tibetan Plateau, our results highlight both consistencies and novel insights. For instance, the identified dominance of vegetation coverage (X5) as a core driver aligns with findings from habitat quality assessments in the Qinghai-Tibet Plateau, where vegetation indices like NDVI and FVC were shown to mediate climate-topography interactions using integrated InVEST and Geodetector models, emphasizing vegetation’s role in enhancing ecosystem resilience amid warming trends [65]. However, this finding contrasts with studies such as those conducted by [55,66,67,68], which identify elevation, population, and mean annual temperature as dominant factors. This discrepancy may arise from the absence of a standardized definition of ecological security, resulting in variations in how ecological security is conceptualized across different studies. These studies often focus on a single dimension of ecological security (e.g., health, services, or risk), as defined in this study. Consequently, establishing a broadly accepted definition of ecological security remains an unresolved challenge.
Additionally, in the source regions of the Yangtze and Yellow Rivers, topographic and vegetation factors exert a greater influence on ecological security, likely due to their direct contributions to ecosystem stability, soil and water conservation, and biodiversity. Given the limited human activity and minimal landscape pattern changes in this region, the influence of landscape factors is relatively weak.
The Geodetector model is not without its limitations. The accuracy of the model’s outputs depends on the quality and resolution of the input data [69]. In data-scarce regions, such as the Sanjiangyuan Region, it can be challenging to obtain the high-quality data needed to run the model. The model also requires the discretization of continuous variables, which can lead to a loss of information. The choice of the discretization method can also have a significant impact on the results of the analysis. Despite these limitations, the Geodetector model is a powerful and versatile tool that can provide valuable insights into the complex dynamics of ecological change. Its application in the Sanjiangyuan Region and other high-altitude regions has demonstrated its potential to support more informed and effective decision-making for ecological conservation and sustainable development [70].

4.3. Limitations

This study systematically investigates the spatiotemporal evolution characteristics and primary driving factors of ecological security patterns in the source regions of the Yangtze and Yellow Rivers from 2000 to 2020, based on three dimensions: ecological risk, ecological health, and ecosystem services. During the indicator selection process, the natural characteristics of the study area were thoroughly considered, particularly in the selection of drought-related factors and driving variables tailored to regional specifics. However, due to the absence of a universally standardized evaluation framework, the construction of the indicator system retains a degree of subjectivity, which may limit the general applicability of the results.
Furthermore, the study primarily focuses on a retrospective analysis of ecological security patterns and their influencing mechanisms over the 2000–2020 period, without addressing the dynamic evolution trends or scenario predictions for future ecological security patterns. Future research could incorporate methods such as climate change simulations and land-use scenario modeling to develop forward-looking predictive models, thereby enhancing the foresight and policy relevance of ecological security assessments.
Regarding model applicability, given the relatively low human activity interference in the source regions of the Yangtze and Yellow Rivers, the adopted indicator system emphasizes natural factors such as topography, climate, soil, and vegetation. However, when applying this model to regions with high human activity intensity, it is advisable to incorporate socioeconomic variables—such as the proportion of construction land, urbanization levels, and human disturbance intensity—tailored to specific regional characteristics. This would enable a more context-specific ecological security evaluation and enhance the model’s adaptability and scalability.

5. Conclusions

This study systematically evaluated the spatiotemporal dynamics of the Ecological Security Index (ESI) in the source regions of the Yangtze and Yellow Rivers from 2000 to 2020, based on the integration of the Ecological Risk Index (ERI), Ecological Health Index (EHI), and Ecosystem Service Index (ESsI). The results indicate that:
(1)
ESI exhibited an initial increase followed by a decline, with 2010 marking a critical turning point, after which it continued to decrease, falling below the 2000 level by 2020.
(2)
The rising ERI significantly weakened both ESI and ESsI, with this effect becoming particularly pronounced after 2010.
(3)
Spatially, the Local Indicators of Spatial Association (LISA) analysis revealed a gradient of ecological security, declining from high-security core areas in the east to low-security zones in the west, closely associated with topography and elevation. Notably, no linear or monotonic relationship was observed between areas of significant ESI variation and permafrost degradation zones.
(4)
The geographical detector model identified vegetation coverage (X5) as a primary driver of ESI spatial heterogeneity, playing a central role in mediating the combined regulation of climate and topographic factors on ecological security.
These findings underscore the importance of targeted vegetation restoration and adaptive management strategies to mitigate ecological risks and enhance ecological security in this critical region.

Supplementary Materials

The following supporting information can be downloaded at: https://www.mdpi.com/article/10.3390/w17192834/s1, Table S1. Temporal Changes in the Mean Values of ERI, EHI, ESsI, and ESI in the SRYY Region from 2000 to 2020.

Author Contributions

Conceptualization, Z.L. and J.X.; methodology, Z.L.; software, Z.L. and Z.Y.; validation, Z.Y.; formal analysis, Z.Y.; writing-original draft preparation, Z.L.; writing-review and editing, J.X. and L.W.; visualization, Z.Y.; supervision, J.X. and L.W. All authors have read and agreed to the published version of the manuscript.

Funding

This study was funded by the National Key Research and Development Project (2022YFC3201704), the National Natural Science Foundation of China (U2340208, 52479029), the Research Fund of Key Laboratory of Water Management and Water Security for Yellow River Basin, Ministry of Water Resources (2023-SYSJJ-10), the Natural Science Foundation of Hubei Province (2022CFB554, 2022CFD037) and National Public Research Institutes for Basic R&D Operating Expenses Special Project (CKSF20241018/SZ), Open Foundation of the Key Laboratory of Natural Resource Coupling Process and Effects (No. ZH-2023-002).

Data Availability Statement

Research data are publicly accessible via ScienceDB (DOI: https://doi.org/10.57760/sciencedb.26017, CC0 Universal license), cited in Section 3.1.

Acknowledgments

During the preparation of this manuscript, the authors utilized ChatGPT 3.5 for language polishing purposes. The authors have thoroughly reviewed and edited the AI-generated content and assume full responsibility for the final publication’s content.

Conflicts of Interest

The authors declare no conflicts of interest.

Abbreviations

The following abbreviations are used throughout this manuscript:
ESIEcological Security Index
ERIEcological Risk Index
EHIEcosystem Health Index
ESsIEcosystem Service Index
SRYYSource Region of Yangtze and Yellow Rivers
NDVINormalized Difference Vegetation Index
HAILSHuman Activity Intensity on Land Surfaces
FVCFractional Vegetation Cover
SPEIStandardized Precipitation Evapotranspiration Index

References

  1. Immerzeel, W.W.; Van Beek, L.P.; Bierkens, M.F. Climate change will affect the Asian water towers. Science 2010, 328, 1382–1385. [Google Scholar] [CrossRef]
  2. Yao, T.; Thompson, L.; Yang, W.; Yu, W.; Gao, Y.; Guo, X.; Yang, X.; Duan, K.; Zhao, H.; Xu, B.; et al. Different glacier status with atmospheric circulations in Tibetan Plateau and surroundings. Nat. Clim. Change 2012, 2, 663–667. [Google Scholar] [CrossRef]
  3. Shen, Y.; Chen, Y. Global perspective on hydrology, water balance, and water resources management in arid basins. Hydrol. Process. Int. J. 2010, 24, 129–135. [Google Scholar] [CrossRef]
  4. Cui, L.; Zhao, Y.; Liu, J.; Han, L.; Ao, Y.; Yin, S. Landscape ecological risk assessment in Qinling Mountain. Geol. J. 2018, 53, 342–354. [Google Scholar] [CrossRef]
  5. Roveri, G.; Crespi, A.; Eisendle, F.; Rauch, S.; Corradini, P.; Steger, S.; Zebisch, M.; Strapazzon, G. Climate change and human health in Alpine environments: An interdisciplinary impact chain approach understanding today’s risks to address tomorrow’s challenges. BMJ Glob. Health 2024, 8, e014431. [Google Scholar] [CrossRef]
  6. Cheng, G.; Wu, T. Responses of permafrost to climate change and their environmental significance, Qinghai-Tibet Plateau. J. Geophys. Res. Earth Surf. 2007, 112, 1–10. [Google Scholar] [CrossRef]
  7. Yang, M.; Nelson, F.E.; Shiklomanov, N.I.; Guo, D.; Wan, G. Permafrost degradation and its environmental effects on the Tibetan Plateau: A review of recent research. Earth-Sci. Rev. 2010, 103, 31–44. [Google Scholar] [CrossRef]
  8. Kang, S.; Xu, Y.; You, Q.; Flügel, W.-A.; Pepin, N.; Yao, T. Review of climate and cryospheric change in the Tibetan Plateau. Environ. Res. Lett. 2010, 5, 015101. [Google Scholar] [CrossRef]
  9. Wang, G.; Li, Y.; Wang, Y.; Wu, Q. Effects of permafrost thawing on vegetation and soil carbon pool losses on the Qinghai–Tibet Plateau, China. Geoderma 2008, 143, 143–152. [Google Scholar] [CrossRef]
  10. Yi, S.; Zhou, Z.; Ren, S.; Xu, M.; Qin, Y.; Chen, S.; Ye, B. Effects of permafrost degradation on alpine grassland in a semi-arid basin on the Qinghai–Tibetan Plateau. Environ. Res. Lett. 2011, 6, 045403. [Google Scholar] [CrossRef]
  11. Niu, F.; Lin, Z.; Liu, H.; Lu, J. Characteristics of thermokarst lakes and their influence on permafrost in Qinghai–Tibet Plateau. Geomorphology 2011, 132, 222–233. [Google Scholar] [CrossRef]
  12. Zhang, Y.; Wang, G.; Wang, Y. Changes in alpine wetland ecosystems of the Qinghai–Tibetan plateau from 1967 to 2004. Environ. Monit. Assess. 2011, 180, 189–199. [Google Scholar] [CrossRef]
  13. Cuo, L.; Zhang, Y.; Zhu, F.; Liang, L. Characteristics and changes of streamflow on the Tibetan Plateau: A review. J. Hydrol. Reg. Stud. 2014, 2, 49–68. [Google Scholar] [CrossRef]
  14. Su, B.; Huang, J.; Zeng, X.; Gao, C.; Jiang, T. Impacts of climate change on streamflow in the upper Yangtze River basin. Clim. Change 2017, 141, 533–546. [Google Scholar] [CrossRef]
  15. Li, W.; Wu, J.; Bai, E.; Jin, C.; Wang, A.; Yuan, F.; Guan, D. Response of terrestrial carbon dynamics to snow cover change: A meta-analysis of experimental manipulation (II). Soil Biol. Biochem. 2016, 103, 388–393. [Google Scholar] [CrossRef]
  16. Yang, H.; Mu, S.; Li, J. Effects of ecological restoration projects on land use and land cover change and its influences on territorial NPP in Xinjiang, China. CATENA 2014, 115, 85–95. [Google Scholar] [CrossRef]
  17. Zhang, L.; Guo, H.; Ji, L.; Lei, L.; Wang, C.; Yan, D.; Li, B.; Li, J. Vegetation greenness trend (2000 to 2009) and the climate controls in the Qinghai-Tibetan Plateau. J. Appl. Remote Sens. 2013, 7, 073572. [Google Scholar] [CrossRef]
  18. Zhou, J.-R.; Li, X.-Q.; Yu, X.; Zhao, T.-C.; Ruan, W.-X. Exploring the ecological security evaluation of water resources in the Yangtze River Basin under the background of ecological sustainable development. Sci. Rep. 2024, 14, 15475. [Google Scholar] [CrossRef] [PubMed]
  19. Du, Z.; Ji, X.; Zhao, W.; Jiang, J.; He, Z.; Liu, H.; Gao, J.; Wang, X. Integrating revised DPSIR and ecological security patterns to assess the health of alpine grassland ecosystems on the Qinghai-Tibet Plateau. Sci. Total Environ. 2024, 957, 177833. [Google Scholar] [CrossRef]
  20. Liang, L.; Li, L.; Liu, C.; Cuo, L. Climate change in the Tibetan Plateau Three Rivers Source Region: 1960–2009. Int. J. Climatol. 2013, 33, 2900. [Google Scholar] [CrossRef]
  21. Shen, M.; Piao, S.; Jeong, S.-J.; Zhou, L.; Zeng, Z.; Ciais, P.; Chen, D.; Huang, M.; Jin, C.-S.; Li, L.Z. Evaporative cooling over the Tibetan Plateau induced by vegetation growth. Proc. Natl. Acad. Sci. USA 2015, 112, 9299–9304. [Google Scholar] [CrossRef] [PubMed]
  22. Wang, Z.; Wu, J.; Niu, B.; He, Y.; Li, J. Vegetation expansion on the Tibetan Plateau and its relationship with climate change. Remote Sens. 2020, 12, 4150. [Google Scholar] [CrossRef]
  23. Qi, Y.; Lian, X.; Wang, H.; Zhang, J.; Yang, R. Dynamic mechanism between human activities and ecosystem services: A case study of Qinghai lake watershed, China. Ecol. Indic. 2020, 117, 106528. [Google Scholar] [CrossRef]
  24. Jiang, C.; Zhang, L. Ecosystem change assessment in the Three-river Headwater Region, China: Patterns, causes, and implications. Ecol. Eng. 2016, 93, 24–36. [Google Scholar] [CrossRef]
  25. Liu, Y.; Liu, H.; Chen, Y.; Gang, C.; Shen, Y. Quantifying the contributions of climate change and human activities to vegetation dynamic in China based on multiple indices. Sci. Total Environ. 2022, 838, 156553. [Google Scholar] [CrossRef]
  26. Peng, Q.; Wang, R.; Jiang, Y.; Zhang, W.; Liu, C.; Zhou, L. Soil erosion in Qilian Mountain National Park: Dynamics and driving mechanisms. J. Hydrol. Reg. Stud. 2022, 42, 101144. [Google Scholar] [CrossRef]
  27. Xia, L.; Bi, R.; Song, X.; Lv, C. Dynamic changes in soil erosion risk and its driving mechanism: A case study in the Loess Plateau of China. Eur. J. Soil Sci. 2021, 72, 1312–1331. [Google Scholar] [CrossRef]
  28. Han, Z.; Song, W.; Deng, X.; Xu, X. Grassland ecosystem responses to climate change and human activities within the Three-River Headwaters region of China. Sci. Rep. 2018, 8, 9079. [Google Scholar] [CrossRef]
  29. Li, P.; Chen, J.; Zhao, G.; Holden, J.; Liu, B.; Chan, F.K.S.; Hu, J.; Wu, P.; Mu, X. Determining the drivers and rates of soil erosion on the Loess Plateau since 1901. Sci. Total Environ. 2022, 823, 153674. [Google Scholar] [CrossRef]
  30. Zhu, Q.; Cai, Y. Integrating ecological risk, ecosystem health, and ecosystem services for assessing regional ecological security and its driving factors: Insights from a large river basin in China. Ecol. Indic. 2023, 155, 110954. [Google Scholar] [CrossRef]
  31. Costanza, R.; De Groot, R.; Braat, L.; Kubiszewski, I.; Fioramonti, L.; Sutton, P.; Farber, S.; Grasso, M. Twenty years of ecosystem services: How far have we come and how far do we still need to go? Ecosyst. Serv. 2017, 28, 1–16. [Google Scholar] [CrossRef]
  32. Yao, T.; Bolch, T.; Chen, D.; Gao, J.; Immerzeel, W.; Piao, S.; Su, F.; Thompson, L.; Wada, Y.; Wang, L.; et al. The imbalance of the Asian water tower. Nat. Rev. Earth Environ. 2022, 3, 618–632. [Google Scholar] [CrossRef]
  33. Ma, T.; Zhao, L.; She, Y.; Hu, B.; Feng, X.; Gongbao, J.; Zhang, W.; Zhao, Z. Identifying the Driving Forces of Alpine Wetland Dynamic Changes in the Yellow River Source National Park from 2000 to 2020. Water 2023, 15, 2557. [Google Scholar] [CrossRef]
  34. Jin, X.; Jin, H.; Iwahana, G.; Marchenko, S.S.; Luo, D.; Li, X.; Liang, S. Impacts of climate-induced permafrost degradation on vegetation: A review. Adv. Clim. Change Res. 2021, 12, 29–47. [Google Scholar] [CrossRef]
  35. Schuur, E.A.; Mack, M.C. Ecological response to permafrost thaw and consequences for local and global ecosystem services. Annu. Rev. Ecol. Evol. Syst. 2018, 49, 279–301. [Google Scholar] [CrossRef]
  36. Jin, X.; Jin, H.; Luo, D.; Sheng, Y.; Wu, Q.; Wu, J.; Wang, W.; Huang, S.; Li, X.; Liang, S. Impacts of permafrost degradation on hydrology and vegetation in the source area of the Yellow River on Northeastern Qinghai-Tibet Plateau, Southwest China. Front. Earth Sci. 2022, 10, 845824. [Google Scholar] [CrossRef]
  37. Zhou, H.; Zhao, X.; Tang, Y.; Gu, S.; Zhou, L. Alpine grassland degradation and its control in the source region of the Yangtze and Yellow Rivers, China. Grassl. Sci. 2005, 51, 191–203. [Google Scholar] [CrossRef]
  38. Xia, J.; Li, Z.; Zeng, S.; He, Y.; Wang, Y. Perspectives on eco-water security and sustainable development in the Yangtze River Basin. Geosci. Lett. 2021, 8, 18. [Google Scholar] [CrossRef]
  39. Hu, Y.; Maskey, S.; Uhlenbrook, S. Trends in temperature and rainfall extremes in the Yellow River source region, China. Clim. Change 2012, 110, 403–429. [Google Scholar] [CrossRef]
  40. Hou, J.; Chen, J.; Zhang, K.; Zhou, G.; You, H.; Han, X. Temporal and Spatial Variation Characteristics of Carbon Storage in the Source Region of the Yellow River Based on InVEST and GeoSoS-FLUS Models and Its Response to Different Future Scenarios. Environ. Sci. 2022, 43, 5253–5262. [Google Scholar] [CrossRef]
  41. Wei, D.; Feng, A.; Wu, M. Analysis of the resources value of Three-River-Source National Park based on ecological civilization. Int. J. Geoheritage Parks 2020, 8, 173–184. [Google Scholar] [CrossRef]
  42. Fu, M.; Tian, J.; Ren, Y.; Li, J.; Liu, W.; Zhu, Y. Functional zoning and space management of Three-River-Source National Park. J. Geogr. Sci. 2019, 29, 2069–2084. [Google Scholar] [CrossRef]
  43. Zhang, Q.; Miao, C.; Su, J.; Gou, J.; Hu, J.; Zhao, X.; Xu, Y. A new high-resolution multi-drought-index dataset for mainland of China. Earth Syst. Sci. Data 2025, 17, 837–853. [Google Scholar] [CrossRef]
  44. Li, Y.; Qin, Q.; Wang, D.; An, W.; He, X.; Yu, T. An analysis on the spatial heterogeneity characteristics of landscape ecological risk in Qilian Mountain National Park. Front. For. Glob. Change 2024, 7, 1308154. [Google Scholar] [CrossRef]
  45. Wei, W.; Zhao, J.; Wang, X. Landscape heterogeneity of land use types in Shiyang River basin. Chin. J. Ecol. 2010, 29, 760–765. [Google Scholar]
  46. Peng, J.; Liu, Y.; Wu, J.; Lv, H.; Hu, X. Linking ecosystem services and landscape patterns to assess urban ecosystem health: A case study in Shenzhen City, China. Landsc. Urban Plan. 2015, 143, 56–68. [Google Scholar] [CrossRef]
  47. Xu, W.; He, M.; Meng, W.; Zhang, Y.; Yun, H.; Lu, Y.; Huang, Z.; Mo, X.; Hu, B.; Liu, B. Temporal-spatial change of China’s coastal ecosystems health and driving factors analysis. Sci. Total Environ. 2022, 845, 157319. [Google Scholar] [CrossRef]
  48. Jia, T.; Hu, X.; Yang, H. Spatial response of habitat quality to climate change and human activities: Taking the Qinghai-Xizang Plateau as an example. J. Soil Water Conserv. 2024, 38, 203–211. [Google Scholar] [CrossRef]
  49. Shamuxi, A.; Han, B.; Jin, X.; Wusimanjiang, P.; Abudukerimu, A.; Chen, Q.; Zhou, H.; Gong, M. Spatial pattern and driving mechanisms of dryland landscape ecological risk: Insights from an integrated geographic detector and machine learning model. Ecol. Indic. 2025, 172, 113305. [Google Scholar] [CrossRef]
  50. Lupton, R.C.; Allwood, J.M. Hybrid Sankey diagrams: Visual analysis of multidimensional data for understanding resource use. Resour. Conserv. Recycl. 2017, 124, 141–151. [Google Scholar] [CrossRef]
  51. Yang, C.; Deng, W.; Yuan, Q.; Zhang, S. Changes in landscape pattern and an ecological risk assessment of the Changshagongma Wetland Nature Reserve. Front. Ecol. Evol. 2022, 10, 843714. [Google Scholar] [CrossRef]
  52. Li, X.; Li, S.; Zhang, Y.; O’Connor, P.; Zhang, L.; Yan, J. Landscape ecological risk assessment under multiple indicators. Land 2021, 10, 739. [Google Scholar] [CrossRef]
  53. Zhang, S.; Zhou, Y.; Yu, Y.; Li, F.; Zhang, R.; Li, W. Using the geodetector method to characterize the spatiotemporal dynamics of vegetation and its interaction with environmental factors in the qinba mountains, China. Remote Sens. 2022, 14, 5794. [Google Scholar] [CrossRef]
  54. Yao, B.; Gong, X.; Li, Y.; Li, Y.; Lian, J.; Wang, X. Spatiotemporal variation and GeoDetector analysis of NDVI at the northern foothills of the Yinshan Mountains in Inner Mongolia over the past 40 years. Heliyon 2024, 10, e39309. [Google Scholar] [CrossRef] [PubMed]
  55. Zhai, G.; Ren, P.; Zhang, R.; Wang, B.; Zhang, M.; He, T.; Zhang, J. Evaluation of land ecological security and driving factors in the Lower Yellow River Flood Plain based on quality, structure and function. Sci. Rep. 2025, 15, 2674. [Google Scholar] [CrossRef]
  56. Yao, T.; Thompson, L.G.; Mosbrugger, V.; Zhang, F.; Ma, Y.; Luo, T.; Xu, B.; Yang, X.; Joswiak, D.R.; Wang, W.; et al. Third Pole Environment (TPE). Environ. Dev. 2012, 3, 52–64. [Google Scholar] [CrossRef]
  57. Hua, T.; Zhao, W.; Pereira, P. Opinionated Views on Grassland Restoration Programs on the Qinghai-Tibetan Plateau. Front. Plant Sci. 2022, 13, 861200. [Google Scholar] [CrossRef] [PubMed]
  58. Liu, J.; Xu, X.; Shao, Q. Grassland degradation in the “three-river headwaters” region, Qinghai province. J. Geogr. Sci. 2008, 18, 259–273. [Google Scholar] [CrossRef]
  59. Wang, X.; Siegert, F.; Zhou, A.-G.; Franke, J. Glacier and glacial lake changes and their relationship in the context of climate change, Central Tibetan Plateau 1972–2010. Glob. Planet. Change 2013, 111, 246–257. [Google Scholar] [CrossRef]
  60. Jiang, W.; Lv, J.; Wang, C.; Chen, Z.; Liu, Y. Marsh wetland degradation risk assessment and change analysis: A case study in the Zoige Plateau, China. Ecol. Indic. 2017, 82, 316–326. [Google Scholar] [CrossRef]
  61. Shen, G.; Yang, X.; Jin, Y.; Xu, B.; Zhou, Q. Remote sensing and evaluation of the wetland ecological degradation process of the Zoige Plateau Wetland in China. Ecol. Indic. 2019, 104, 48–58. [Google Scholar] [CrossRef]
  62. Baho, D.L.; Allen, C.R.; Garmestani, A.S.; Fried-Petersen, H.B.; Renes, S.E.; Gunderson, L.H.; Angeler, D.G. A quantitative framework for assessing ecological resilience. Ecol. Soc. 2017, 22, 1–17. [Google Scholar] [CrossRef] [PubMed]
  63. Yu, H.; Zhang, X.; Deng, Y. Spatiotemporal Evolution and Influencing Factors of Landscape Ecological Vulnerability in the Three-River-Source National Park Region. Chin. Geogr. Sci. 2022, 32, 852–866. [Google Scholar] [CrossRef]
  64. Xiao, R.; Liu, Y.; Fei, X.; Yu, W.; Zhang, Z.; Meng, Q. Ecosystem health assessment: A comprehensive and detailed analysis of the case study in coastal metropolitan region, eastern China. Ecol. Indic. 2019, 98, 363–376. [Google Scholar] [CrossRef]
  65. Jiang, F.; Liu, C.; Zhao, J.; Jiang, B.; Fan, F. Habitat quality assessment on the Qinghai-Tibet plateau across vegetation ecoregions using InVEST and Geodetector models. Front. Earth Sci. 2024, 12, 1432434. [Google Scholar] [CrossRef]
  66. Jia, W.; Wang, M.; Zhou, C.; Yang, Q. Analysis of the spatial association of geographical detector-based landslides and environmental factors in the southeastern Tibetan Plateau, China. PLoS ONE 2021, 16, e0251776. [Google Scholar] [CrossRef]
  67. Wang, G.; Peng, W.; Zhang, L.; Zhang, J. Quantifying the impacts of natural and human factors on changes in NPP using an optimal parameters-based geographical detector. Ecol. Indic. 2023, 155, 111018. [Google Scholar] [CrossRef]
  68. Xu, J.; Chen, J.; Liu, Y.; Fan, F. Identification of the geographical factors influencing the relationships between ecosystem services in the Belt and Road region from 2010 to 2030. J. Clean. Prod. 2020, 275, 124153. [Google Scholar] [CrossRef]
  69. Polasky, S.; Nelson, E.; Pennington, D.; Johnson, K.A. The Impact of Land-Use Change on Ecosystem Services, Biodiversity and Returns to Landowners: A Case Study in the State of Minnesota. Environ. Resour. Econ. 2011, 48, 219–242. [Google Scholar] [CrossRef]
  70. Dybas, C.L. Where Have All the Caribou Gone? Population viability analysis may offer answers. BioScience 2012, 62, 862–866. [Google Scholar] [CrossRef]
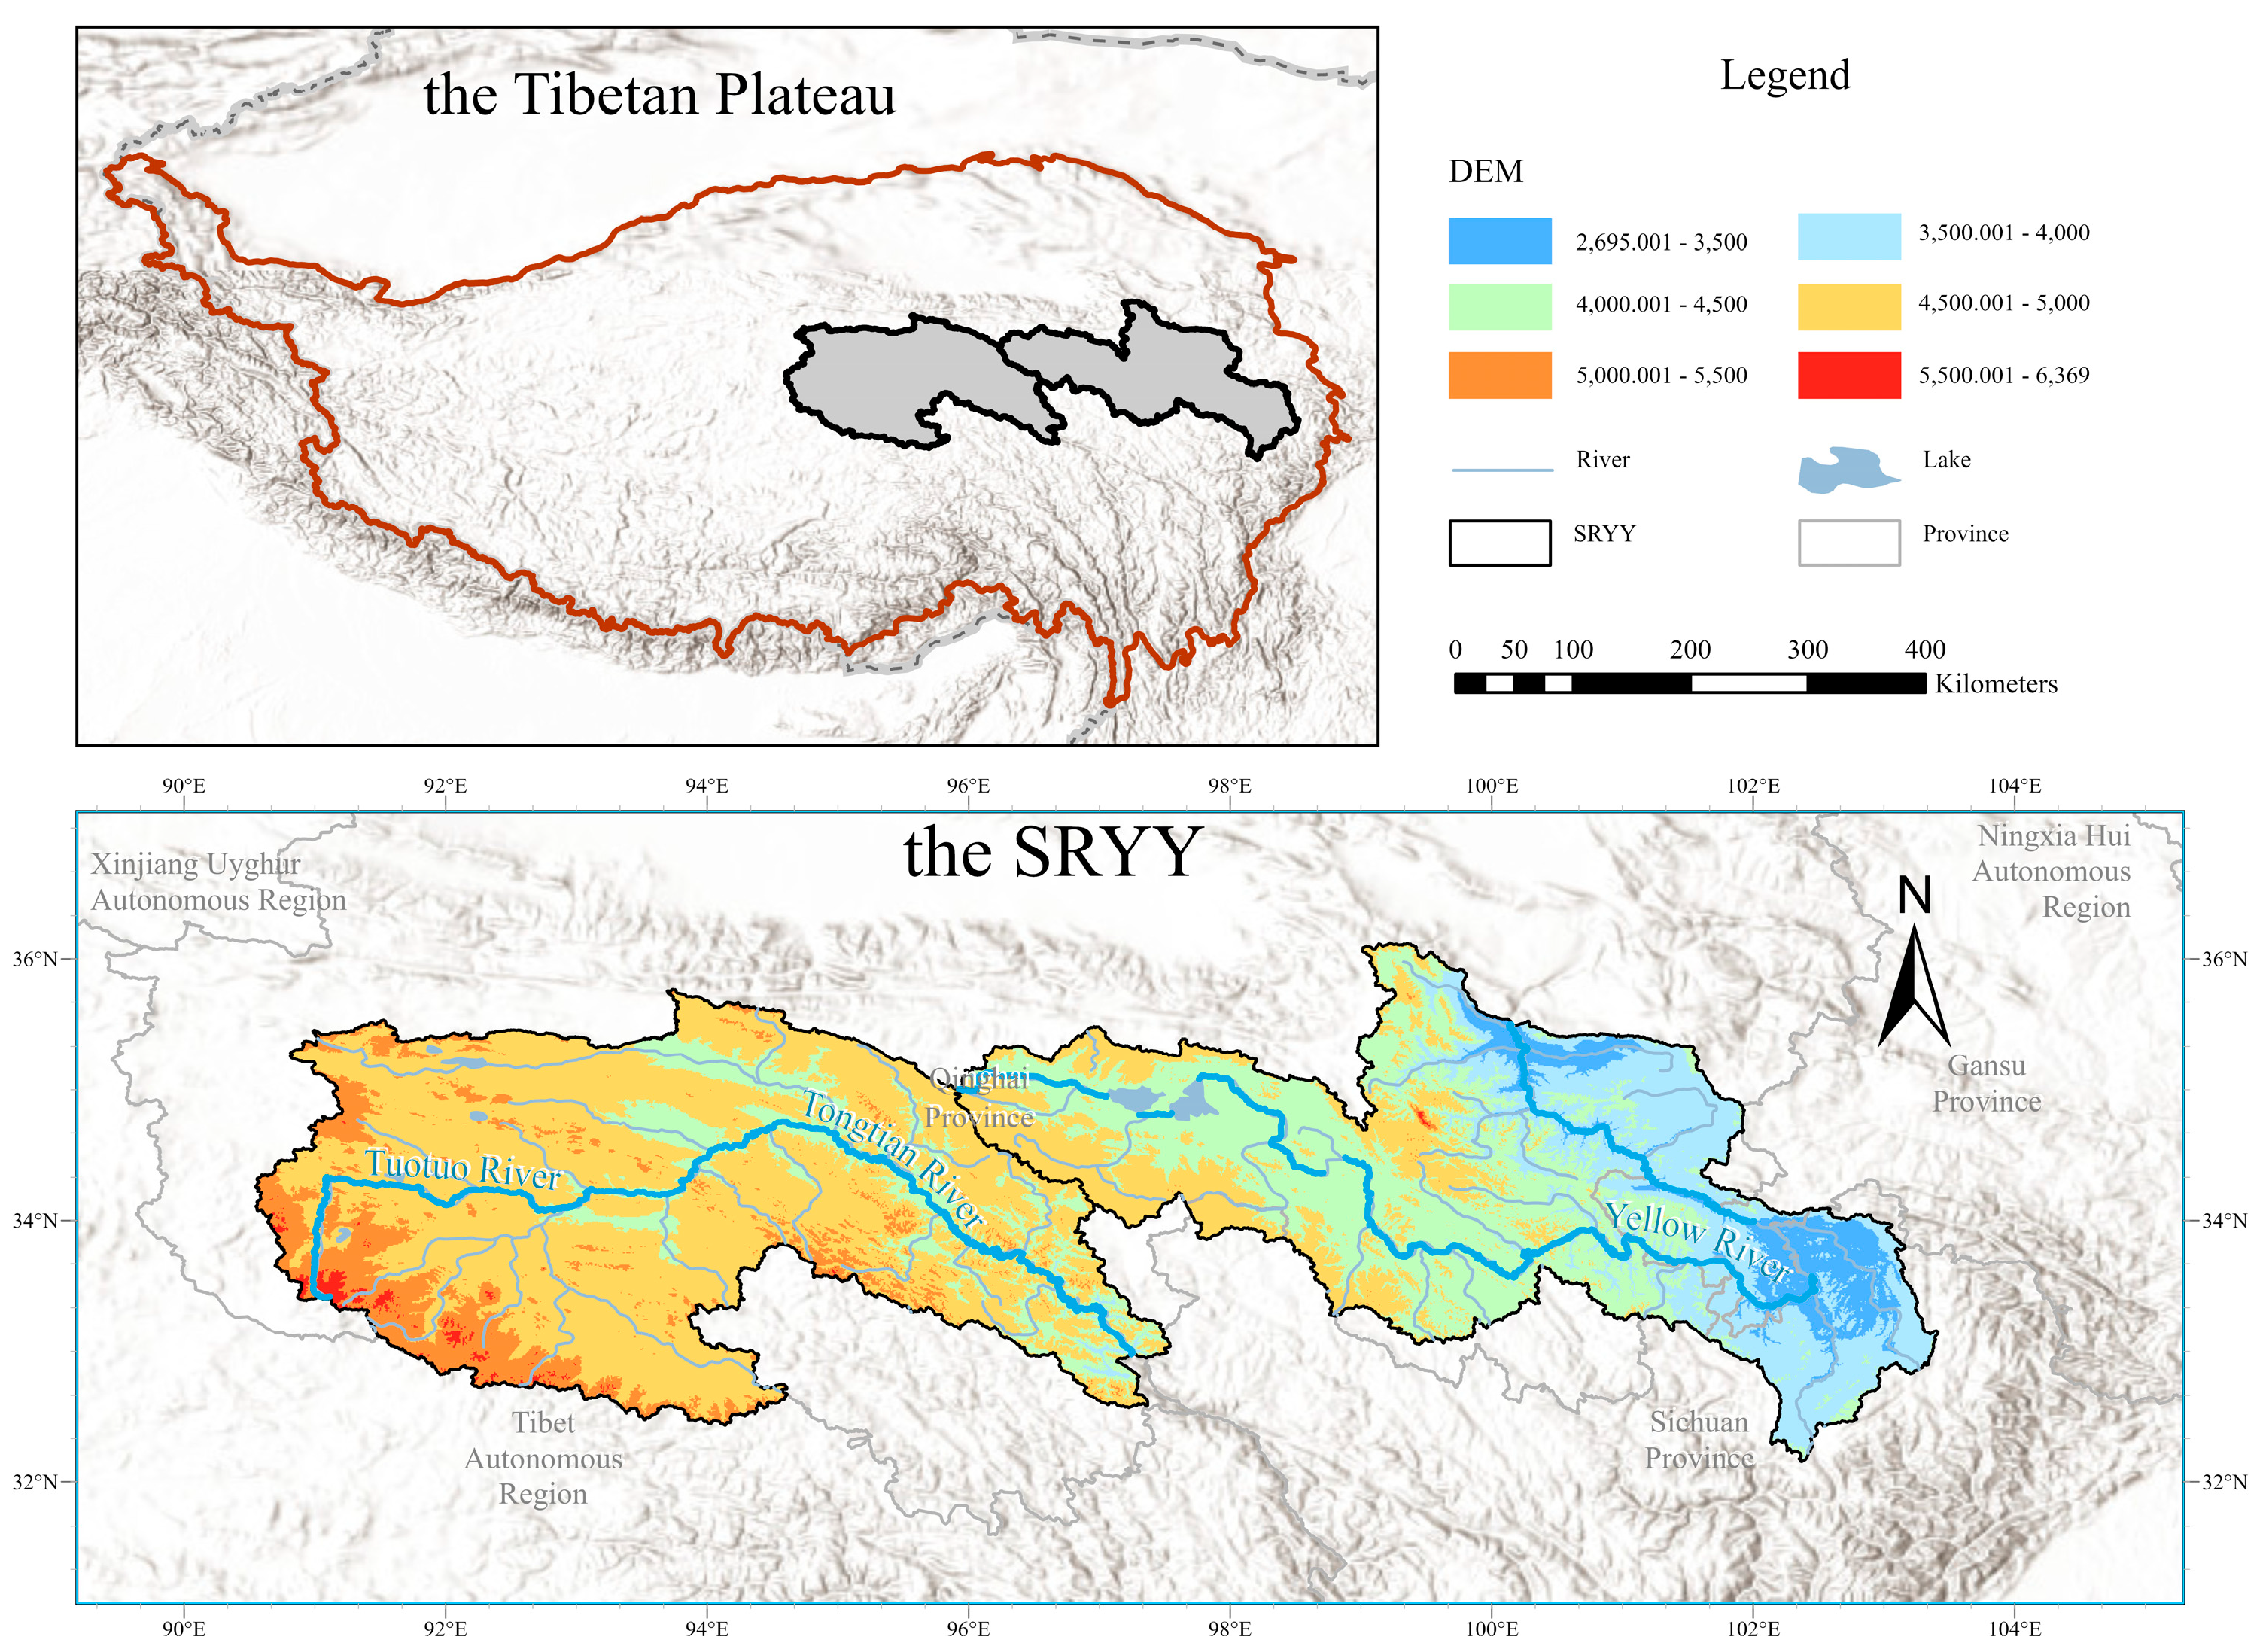
Figure 1. Location of Source Region of the Yangtze and Yellow Rivers (SRYY), China.
Water 17 02834 g001
Figure 2. Integrated framework for ecological security assessment in the SRYY: coupling risk-health-service dimensions with multi-source geospatial data.
Water 17 02834 g002
Figure 3. Spatiotemporal variations in ecological indices of the Yangtze and Yellow River Source Region (SRYY), 2000–2020. ERI, Ecological Risk Index; EHI, Ecological Health Index; ESsI, Ecosystem Service Supply Index. Shaded areas indicate the 95% confidence interval.
Water 17 02834 g003
Figure 4. Sankey mapping of ecological index class transitions (ERI, EHI, ESsI, ESI) in the Yangtze and Yellow River Source Region: A natural breaks-transition matrix approach, 2000–2020.
Water 17 02834 g004
Figure 5. Spatial heterogeneity of ecological security in the Yangtze and Yellow River Source Region (SRYY), 2000–2020.
Water 17 02834 g005
Figure 6. Spatiotemporal coupling of ecological security decline and permafrost degradation, 2000–2020.
Water 17 02834 g006
Figure 7. Multi-temporal local indicators of spatial association (LISA) for ecological security index (ESI) dynamics, 2000–2020.
Water 17 02834 g007
Figure 8. Spatiotemporal evolution of HH/LL Clusters in the Yangtze and Yellow River Source Region: A standard deviation ellipse analysis, 2000–2020.
Water 17 02834 g008
Figure 9. Factor detector and interaction detector analysis of ecological security, 2000–2020.
Water 17 02834 g009
Table 1. Summary of data sources and processing methods.
Data CategorySpecific Data & IndicatorsData Source/Processing Method
Vegetation DataNDVI, NDMICalculated from LANDSAT 5 & 8 optical bands via Google Earth Engine for years 2000–2020, 30 m
Leaf Area Index (LAI)Derived from MODIS/006/MCD12Q1 product’s LC_Type3 band for years 2000–2020, 500 m
Vegetation CoverageNational Tibetan Plateau Data Center (https://data.tpdc.ac.cn, accessed on 15 April 2025) for years 2000–2020, 250 m
Soil DataSoil Organic Matter, Soil TextureChina Soil Dataset (v1.1) based on HWSD (http://www.ncdc.ac.cn, accessed on 18 April 2025) for years 2000–2020, 1 km
Soil MoistureNational Tibetan Plateau Data Center (https://data.tpdc.ac.cn, accessed on 20 April 2025) for years 2000–2020, 500 m
Meteorological DataWind Speed, Snow CoverCalculated using the ERA5 dataset in Google Earth Engine for years 2000–2020, 1 km
Precipitation, Potential EvapotranspirationChina Meteorological Data Network (http://data.cma.cn/, accessed on 25 April 2025) for years 2000–2020, 1 km
SPEIProvided by the team of Miao at Beijing Normal University [43] for years 2000–2020, 1 km
Land Use DataLand Use Type (6 categories, 22 subcategories)China Multi-Period Land Use Remote Sensing Monitoring Dataset (CNLUCC) (www.resdc.cn, accessed on 11 April 2025) for years 2000, 2005, 2010, 2015, 2020, 30 m
Table 2. Quantitative framework for ecosystem service assessment: Formula specifications and parametric drivers of key functions.
Ecosystem Service FunctionsFormulasExplanation
Windbreak and Sand Stabilization (SR) S R = S L p S L
S L p = 2 z S 2 Q m a x p e ( z / s p ) 2
Q maxp = 109.8 ( W F × E F × S C F × K )
S p = 150.71 ( W F × E F × S C F × K ) 0.3711
S L = 2 z S 2 Q m a x e ( z / s ) 2
Q m a x = 109.8 ( W F × E F × S C F × K × C )
S = 150.71 ( W F × E F × S C F × K × C ) 0.3711
SR, SL, and Sp are expressed in units of t/(km2·a).
Sp and Qmaxp denote the potential sand transport quantity and maximum transport capacity respectively, while S and Qmax represent the actual sand transport quantity and maximum transport capacity, all measured in kg/m (kilograms per meter).
The parameter z indicates the maximum wind erosion occurrence distance (m).
WF (Climatic Factor).
EF (Soil Erodibility Factor).
SCF (Soil Crusting Factor).
RS (Surface Roughness Factor).
C (Vegetation Cover Factor).
Annual Water Yield (WY) W Y i = ( 1 A E T i P R E i ) P R E i WYi: Annual water yield in evaluation unit i (mm/a).
PREi: Annual precipitation in unit I (mm/a).
AETi: Annual actual evapotranspiration in unit i (mm/a).
Carbon Storage (CS) C S = C above + C below + C s o i l + C d e a d Cabove: Aboveground biomass carbon stock (t).
Cbelow: Belowground biomass carbon stock (t).
Csoil: Soil organic carbon stock (t).
Cdead: Dead organic matter carbon stock (t).
Soil Retention (SC) S C = R K L S U S L E = R × K × L S × ( 1 C × P ) RKLS and USLE represent the potential soil erosion and actual soil erosion, respectively, with units of metric tons (t).
R: Rainfall erosivity factor (MJ·mm/(ha·h·a)).
K: Soil erodibility factor (t·ha·h/(ha·MJ·mm)).
LS: Slope length and steepness factor (dimensionless).
C: Vegetation cover and management factor (dimensionless).
P: Conservation practice factor (dimensionless).
Water Conservation Capacity (Rtt) R t t = min ( 1 , 249 V e l o c i t y ) min ( 1 , 0.9 T I 3 ) min ( 1 , K s a t 300 ) W Y TI: Topographic index (dimensionless), reflecting terrain-driven water accumulation.
Ksat: Soil saturated hydraulic conductivity (mm/h).
Velocity: Surface runoff velocity coefficient (m/s).
WY: Water yield (mm/a).
Table 3. Geodetector-based predictor variable system for spatiotemporal ecological security.
CategoryIndicatorVariable
TopographicDEMX1
SlopeX2
Surface RoughnessX3
VegetationLAI (Leaf Area Index)X4
FVC (Fractional Vegetation Cover)X5
NAMI (Net Aboveground Mass Index)X6
NDVI (Normalized Difference Vegetation Index)X7
MeteorologicalPET (Potential Evapotranspiration)X8
P (Precipitation)X9
TMP (Temperature)X10
SWI (Soil Water Index)X11
SoilSoil Hydraulic ConductivityX12
LandscapeLandscape HeterogeneityX13
Disclaimer/Publisher’s Note: The statements, opinions and data contained in all publications are solely those of the individual author(s) and contributor(s) and not of MDPI and/or the editor(s). MDPI and/or the editor(s) disclaim responsibility for any injury to people or property resulting from any ideas, methods, instructions or products referred to in the content.