Article

Gravity-Driven Operation Mitigates Inorganic Fouling and Enables Low-Pressure Filtration in a Pilot-Scale Dynamic Membrane Bioreactor

1
School of Energy and Building Environment, Guilin University of Aerospace Technology, Guilin 541004, China
2
School of Environment and Climate, Guangdong Engineering Research Center of Water Treatment Processes and Materials, and Guangdong Key Laboratory of Environmental Pollution and Health, Jinan University, Guangzhou 510632, China
*
Author to whom correspondence should be addressed.
Water 2025, 17(19), 2799; https://doi.org/10.3390/w17192799
Submission received: 2 September 2025 / Revised: 16 September 2025 / Accepted: 22 September 2025 / Published: 23 September 2025

Abstract

The filtration behaviors of dynamic membrane (DM) under gravity-driven and pump-driven modes were investigated in a pilot-scale DM bioreactor (DMBR) for domestic wastewater treatment. After DM formation, both modes achieved effective solid–liquid separation, producing effluent with turbidity below 1 NTU, with the gravity-driven module exhibiting marginally lower turbidity than the pump-driven system. Although the flux in the gravity-driven mode (30–48 L/m2·h) was approximately half that of the pump-driven mode, the transmembrane pressure (TMP) required was only 10–20% of that under the pump-driven operation. The DM formed under pump-driven conditions was thicker and more compact, leading to more frequent and rapid TMP increases. Inorganic content accounted for 85% of the pump-driven DM mass, significantly higher than that in the gravity-driven DM (50%) and activated sludge (15%), indicating a pronounced accumulation of inorganic solids on the mesh filter surface, particularly under the pump-driven operation. This accumulation increased filtration resistance and elevated TMP. Therefore, enhancing the removal of inorganic solids prior to the DMBR can improve system stability and facilitate broader application of the DMBR technology.

1. Introduction

When inexpensive screens with large pore sizes, such as nylon or stainless-steel mesh, are used as filtration media in bioreactors, a dynamic membrane (DM) layer, composed primarily of biofilms and retained solids from wastewater, forms on the mesh. This layer provides biomass retention and solid–liquid separation performance comparable to that of conventional microfiltration membranes [1,2]. Dynamic membrane bioreactors (DMBRs) offer advantages including low construction cost and, when properly operated, the ability to achieve high flux under low transmembrane pressure (TMP) without the need for chemical cleaning [3,4,5,6,7,8,9].
Numerous lab-scale studies have examined the effects of reactor configuration, support materials, sludge age, flux, and sludge properties on DMBR filtration performance, confirming its feasibility and benefits [2,10,11,12,13,14,15,16,17,18]. For instance, Huang et al. (2019) [15] demonstrated that a lab-scale DMBR operating at a sludge age of 20 days could maintain a stable flux of 15 L/(m2·h) and a low TMP < 20 Pa for more than 180 days without any cleanings when treating synthetic wastewater. However, real domestic wastewater contains complex constituents, including soluble inorganic compounds, particulate organics, and inorganic solids of varying sizes, along with periodic fluctuations in quality. These factors can significantly influence activated sludge characteristics, as well as the composition, structure, and hydraulic resistance of the DM. Additionally, colloidal particles, humic substances, and planktonic algae present in domestic wastewater may affect effluent turbidity [19]. Consequently, the performance and operational strategies of DMBRs in pilot-scale applications treating real municipal wastewater may differ considerably from lab-scale observations.
Unfortunately, experience with pilot-scale DMBRs for municipal wastewater treatment remains limited, and full-scale applications have not yet been reported. In existing pilot studies, effluent turbidity typically ranged from 0.17 to 4 NTU after DM formation [11,20,21,22,23]. These systems generally maintained fluxes between 40 and 460 L/(m2·h) with TMP values of 0.1–2.5 Kpa for operational periods of 2–50 days. Rapid TMP increases usually occurred within 1–40 days, necessitating physical cleaning. Although long-term stable operation has been achieved at lab scale, reliable strategies for maintaining stable low-TMP operation at pilot and full scales have not been well established. Although the foulants for microfiltration/ultrafiltration membrane-based membrane bioreactors have been well studied even in full scale applications, the primary causes of instability and the key wastewater constituents contributing to pilot-scale DMBRs fouling remain poorly identified. Furthermore, the influence of gravity-driven versus pump-driven operations on filtration behavior and DM structure in pilot-scale DMBRs is still unclear. Thus, further pilot-scale investigations are essential.
In this study, a pilot-scale DMBR was established for treating municipal wastewater. Two nylon mesh filter modules were submerged in the reactor—one operating under the gravity-driven mode and the other under the pump-driven suction. The filtration performance and characteristics of the DMs formed under both modes were systematically investigated.

2. Materials and Methods

2.1. Pilot-Scale DMBR Setup and Wastewater

The pilot-scale dynamic membrane bioreactor (DMBR) system consisted of an anoxic zone, an aerobic zone, and a DM zone, with mixed liquor recirculated from the DM zone to the anoxic zone (Figure 1). The total effective volume of the reactor was 3.5 m3. A mixer was installed in the anoxic zone to ensure adequate mixing, while fine bubble diffusers were placed at the bottom of both the aerobic and DM zones. Two identical DM modules were submerged in the DM zone (Figure 1b). Each module comprised five plate filters constructed by wrapping 25 μm nylon mesh around stainless-steel frames (810 mm × 550 mm). A previous study indicated that, to avoid unallowable high effluent turbidity during start-up or after cleaning, a mesh size of ~25 μm was more suitable for DMBR [15]. The effective filtration area per side of each filter was 0.45 m2, resulting in a total filtration area of approximately 4.5 m2 per module.
Campus domestic wastewater from Jinan University was used to feed the pilot scale process. The suspended solids (SS) and inorganic SS (ISS) in the influent were 11.1 ± 1.4 mg/L and 5.2 ± 2.3 mg/L, respectively. The influent total COD concentration (TCOD) was 166.4 ± 40.9 mg/L and the influent ammonia nitrogen concentration (NH4+-N) was 29.2 ± 4.3 mg/L.

2.2. Operation and Monitoring of the Pilot-Scale DMBR

The two DM modules operated under different driving modes: one was pump-driven via a suction pump, and the other was gravity-driven, utilizing the hydraulic head difference between the effluent outlet and the water level in the DM zone (Figure 1a). For the pump-driven module, a vacuum pressure gauge was installed on the suction line to monitor the transmembrane pressure (TMP). On day 63 of the operation, the flux of the gravity-driven module declined to nearly zero despite a water head loss of approximately 0.5 m. A separate vacuum pump was subsequently connected to this module to provide additional driving force continuously.
The reactor was inoculated with activated sludge obtained from a municipal wastewater treatment plant in Guangzhou City. Throughout the experiment, approximately 175 L of mixed liquor was discharged daily. The effluent flux, TMP, and turbidity of both modules were measured separately. Mixed liquor suspended solids (MLSS), mixed liquor volatile suspended solids (MLVSS), as well as COD and ammonia concentrations in the combined effluent from both modules were regularly monitored. Analytical methods followed those described in a previous study [15]. TMP in the pump-driven line and water head loss in the gravity-driven line were recorded at regular intervals. When TMP reached the maximum allowable level, the mesh filters were removed and cleaned using high-pressure water flushing.

2.3. Filtration Resistance Calculation

Given that the hydraulic resistance of the clean nylon mesh is negligible compared to that of the in situ formed DM, the total filtration resistance (R) calculated using Equation (1) primarily represents the resistance attributable to the DM layer [24]. In Equation (1), the TMP is the transmembrane pressure, which is the water head loss of the gravity-driven DM module or the recorded value by pressure gauge for the pump-driven DM module.
R = T M P μ × J
T M P = Δ H × 9.81 × 1000
where
R is the membrane resistance (m−1);
TMP is the transmembrane pressure (Pa);
ΔH is the head loss between the outlet and the liquid level in the reactor (m);
J is the flux (m3·m−2·s−1);
μ is the water viscosity (Pa·s).

2.4. SEM and EDX/EDS Analysis

In order to observe the structure of DM formed on the mesh filters with different operation modes, the mesh was analyzed using scanning electron microscopy (SEM). The mesh samples were dehydrated first and then coated with an aurum–platinum alloy [25]. The detailed preparing procedures were described previously [26]. Thereafter, the mesh samples were observed using a scanning electron microscope (ZEISS, Germany). The porosity of each dynamic layer was analyzed based on at least three SEM images using Image J software. In addition, the elements in the DMs were analyzed by energy-dispersive X-ray spectroscopy (EDX), which is an adjunct to SEM [27].

2.5. CLSM Analysis

The distributions of EPS and cells in the DMs formed on mesh filters of both operation modes were analyzed by confocal laser scanning microscope (CLSM). Four mesh samples were randomly taken from each mesh filter, one pair of which was used to observe the distribution of biofilm proteins and polysaccharides, and the other pair of samples was used to observe the distribution of live and dead cells. Fluorescein isothiocyanate (FITC, sigma, USA), concanavalin A (Con A, Invitrogen, USA), calcofluor white (CW, sigma, USA), SYTO9 (Invitrogen, USA), and propidium iodide (PI, Biofroxx, Germany) were used to stain the EPS proteins, α-d-glucopyranose polysaccharides, β-d-glucopyranose polysaccharides, live cells, and dead cells in DMs, respectively [28,29]. The detailed procedures for staining were described previously [26]. The stained samples were imaged using CLSM (Zeiss LSM880, Germany). Raw CLSM images were exported using Zeiss confocal software (ZEN 3.3) to obtain a series of 2D images.

3. Results and Discussion

3.1. MLSS Concentration and the Removals of COD and Ammonia

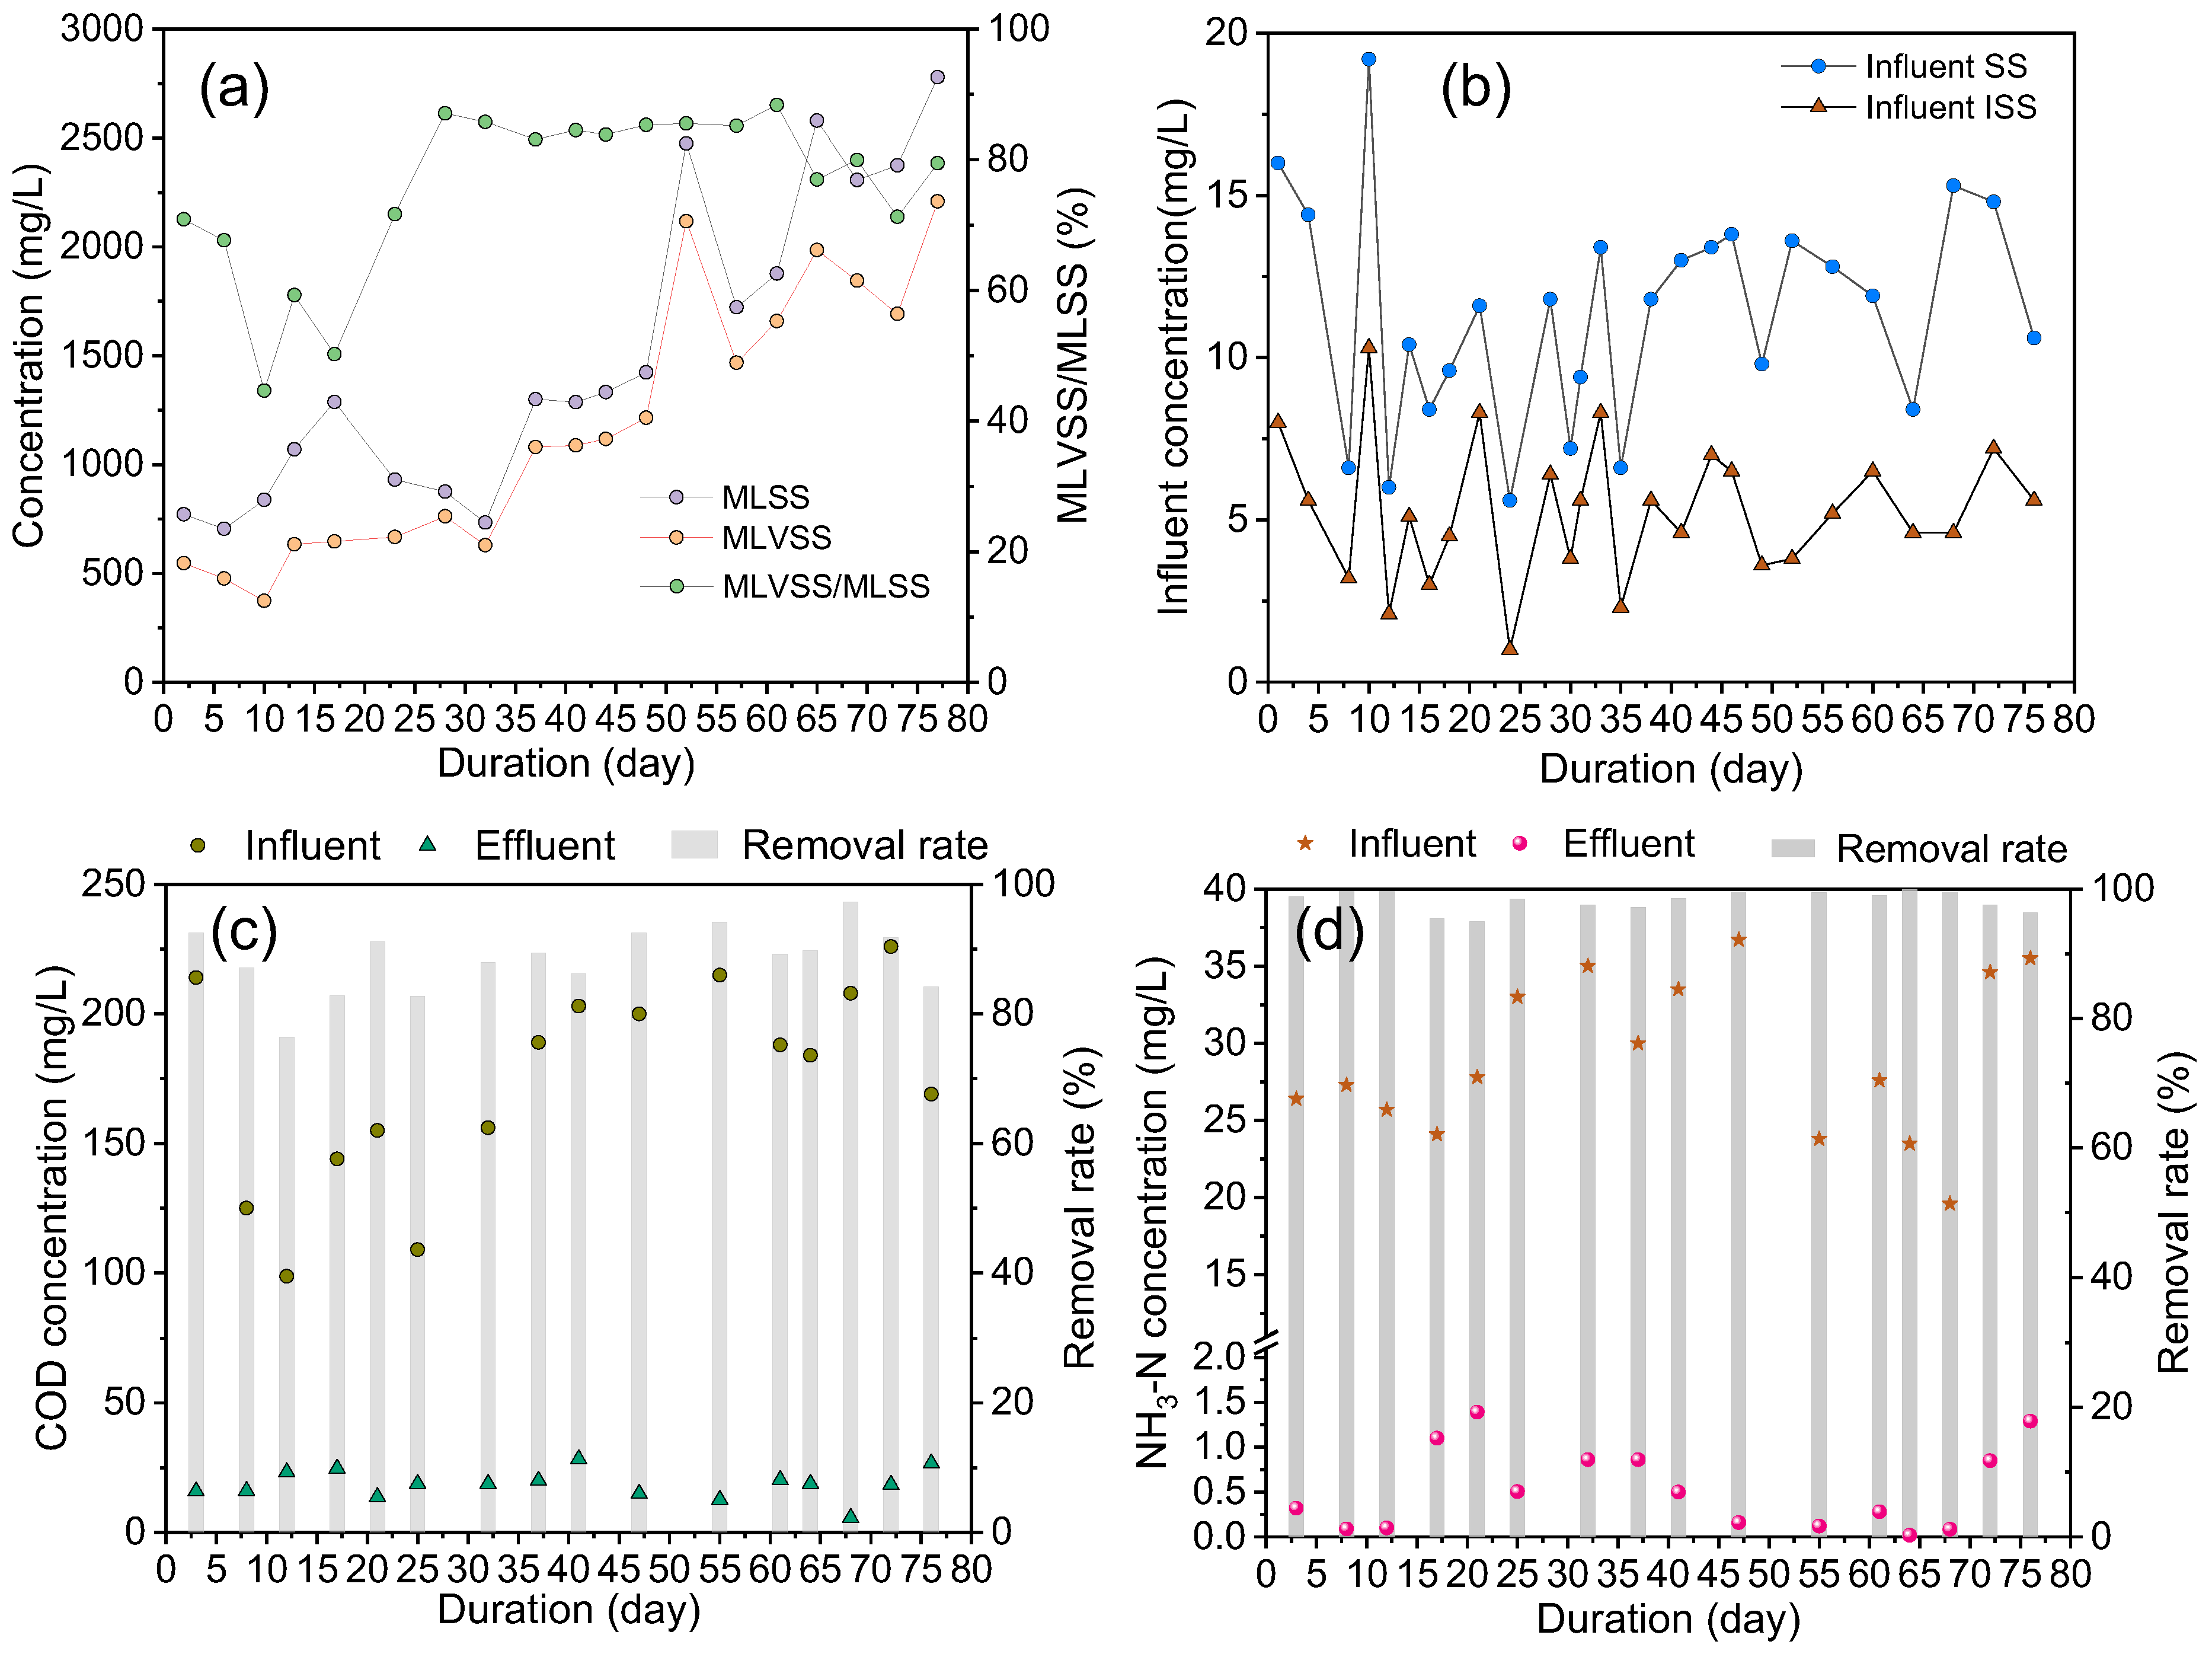
The inoculated sludge had a high inorganic content, resulting in a relatively low initial MLVSS/MLSS ratio (Figure 2a). As the operation continued, the MLSS concentration gradually increased and stabilized within the range of 1400–2000 mg/L after day 32, with the MLVSS/MLSS ratio stabilizing at approximately 85%. The inorganic content of the sludge decreased after day 17, likely due to sludge wasting and the accumulation of newly formed biomass. The influent contained a low influent ISS content (Figure 2b), with an average of 5.3 mg/L.
Figure 2c,d display the COD and ammonia removals in the pilot DMBR. Both influent COD and ammonia concentrations fluctuated considerably during the experiment, influenced by weather conditions. The effluent COD concentration was 18.6 ± 5.6 mg/L (n = 16) with an average removal rate of 88.5%, and the effluent ammonia nitrogen concentration was 0.53 ± 0.46 mg/L (n = 16) with an average removal rate of 98.2%. Continuous aeration provided in the aerobic and DM zones supported nitrifying and heterotrophic microorganisms retained by the DM, enabling high removal performance. The effluent quality achieved in this study is consistent with that reported in laboratory-scale DMBRs [30,31,32]. The low effluent COD concentration further confirms the excellent solid–liquid separation capability of the DM. Since the primary focus of this study was to compare the filtration performance of the pilot-scale DMBR under the two operation modes, total nitrogen (TN) and total phosphorus (TP) removal, which require more precise dissolved oxygen control, they were not monitored.

3.2. Solids Separation Performance Indicated by Effluent Turbidity

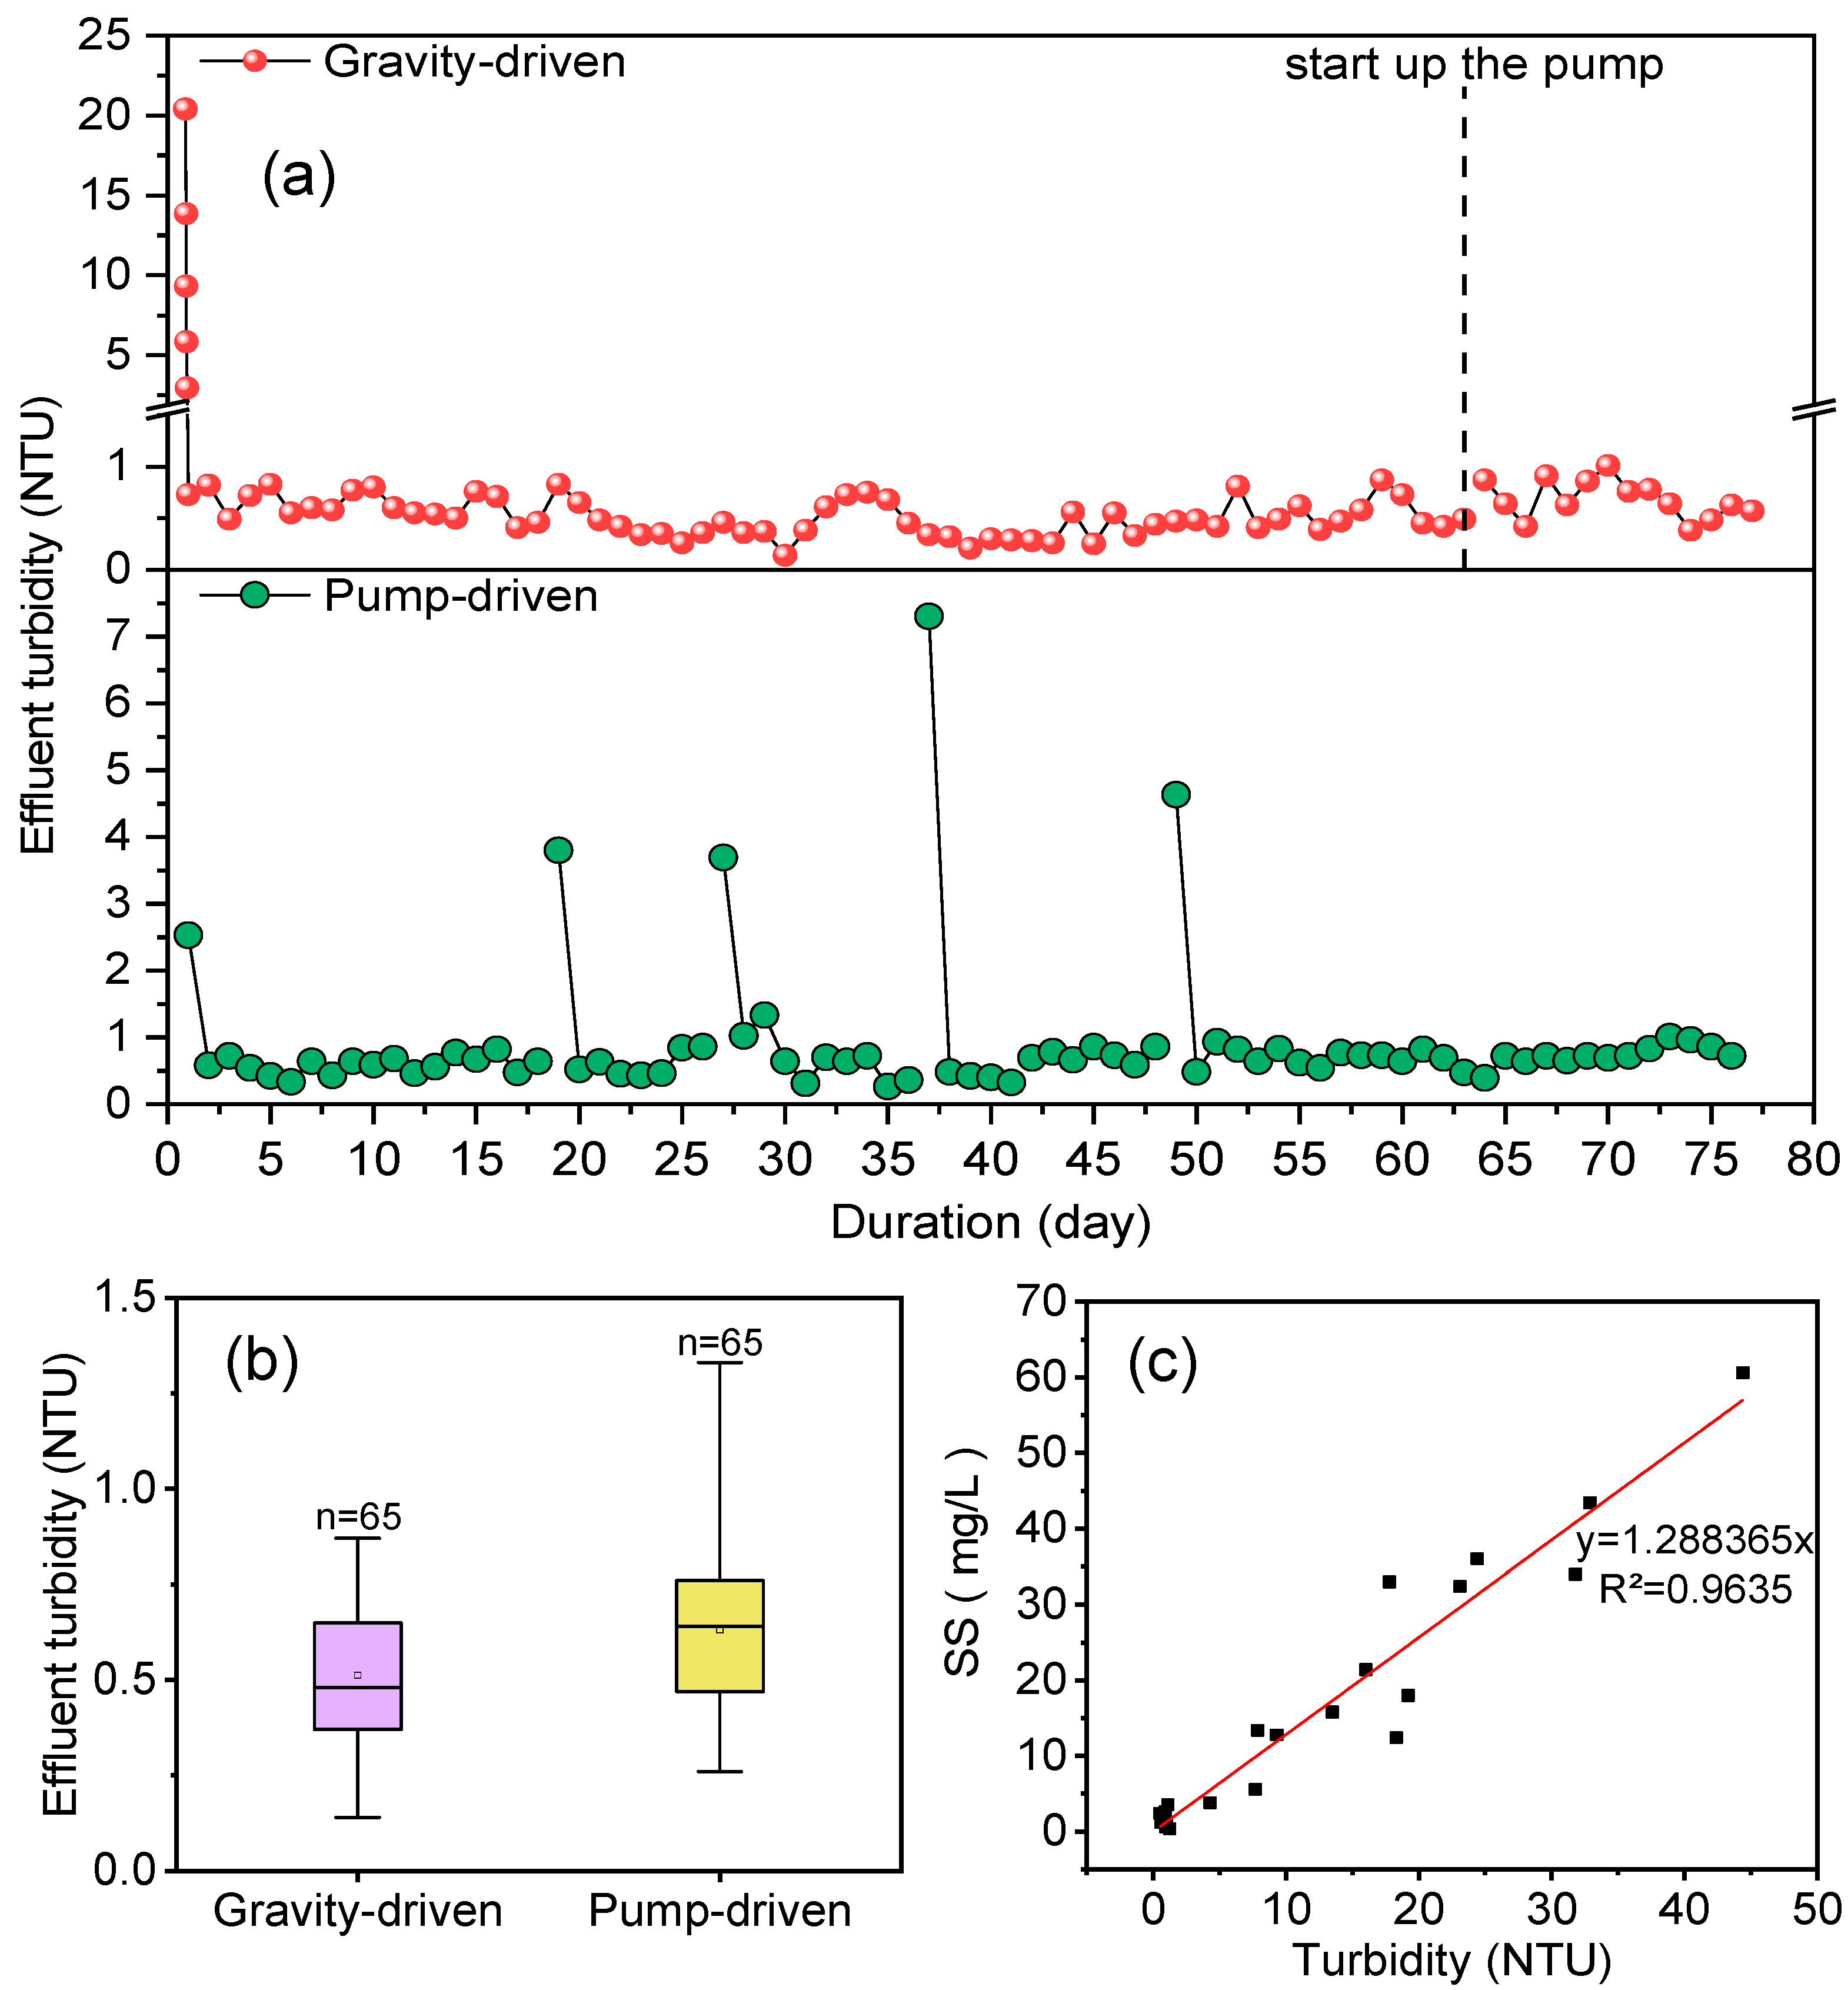
Effluent turbidity serves as an indicator of the solid separation efficiency achieved by the combination of the support material (nylon mesh) and the in situ formed DM. Previous studies indicated that the effluent turbidity could be less than 1 NTU when the effective DMs were formed [33]. In municipal wastewater treatment using DMBR, an effluent turbidity of less than 5 NTU is generally considered indicative of successful DM formation [11]. As illustrated in Figure 3, upon installation of the gravity-driven DM module, the initial effluent turbidity was 20.4 NTU, suggesting that a functional DM had not yet developed. However, within 3 h, the turbidity dropped below 1 NTU and remained stable at this level thereafter, even after a suction pump was introduced on day 63. Similarly, the pump-driven module achieved effective DM formation within 24 h, as evidenced by effluent turbidity being consistently below 1 NTU.
During the experiment, transient increases in effluent turbidity were observed in the pump-driven module following offline cleaning and reinstallation. Under stable operating conditions with mature DM, the average effluent turbidity was 0.51 NTU for the gravity-driven module and 0.63 NTU for the pump-driven module (Figure 2b). Both values are lower than typical effluent turbidity levels (2–5 NTU) reported for DMBRs treating domestic wastewater [22,34]. In the present study, a strong correlation (1 NTU = 1.29 mg-SS/L, R2 = 0.963, Figure 3c) was observed between effluent turbidity and SS, which aligns with a previously reported correlation (1 NTU = 1.46 mg-SS/L) [35]. Based on this correlation, the average effluent SS concentrations were estimated to be 0.66 mg/L and 0.81 mg/L for the gravity-driven and pump-driven modules, respectively.

3.3. Changes in Operation Flux, TMP, and Resistance

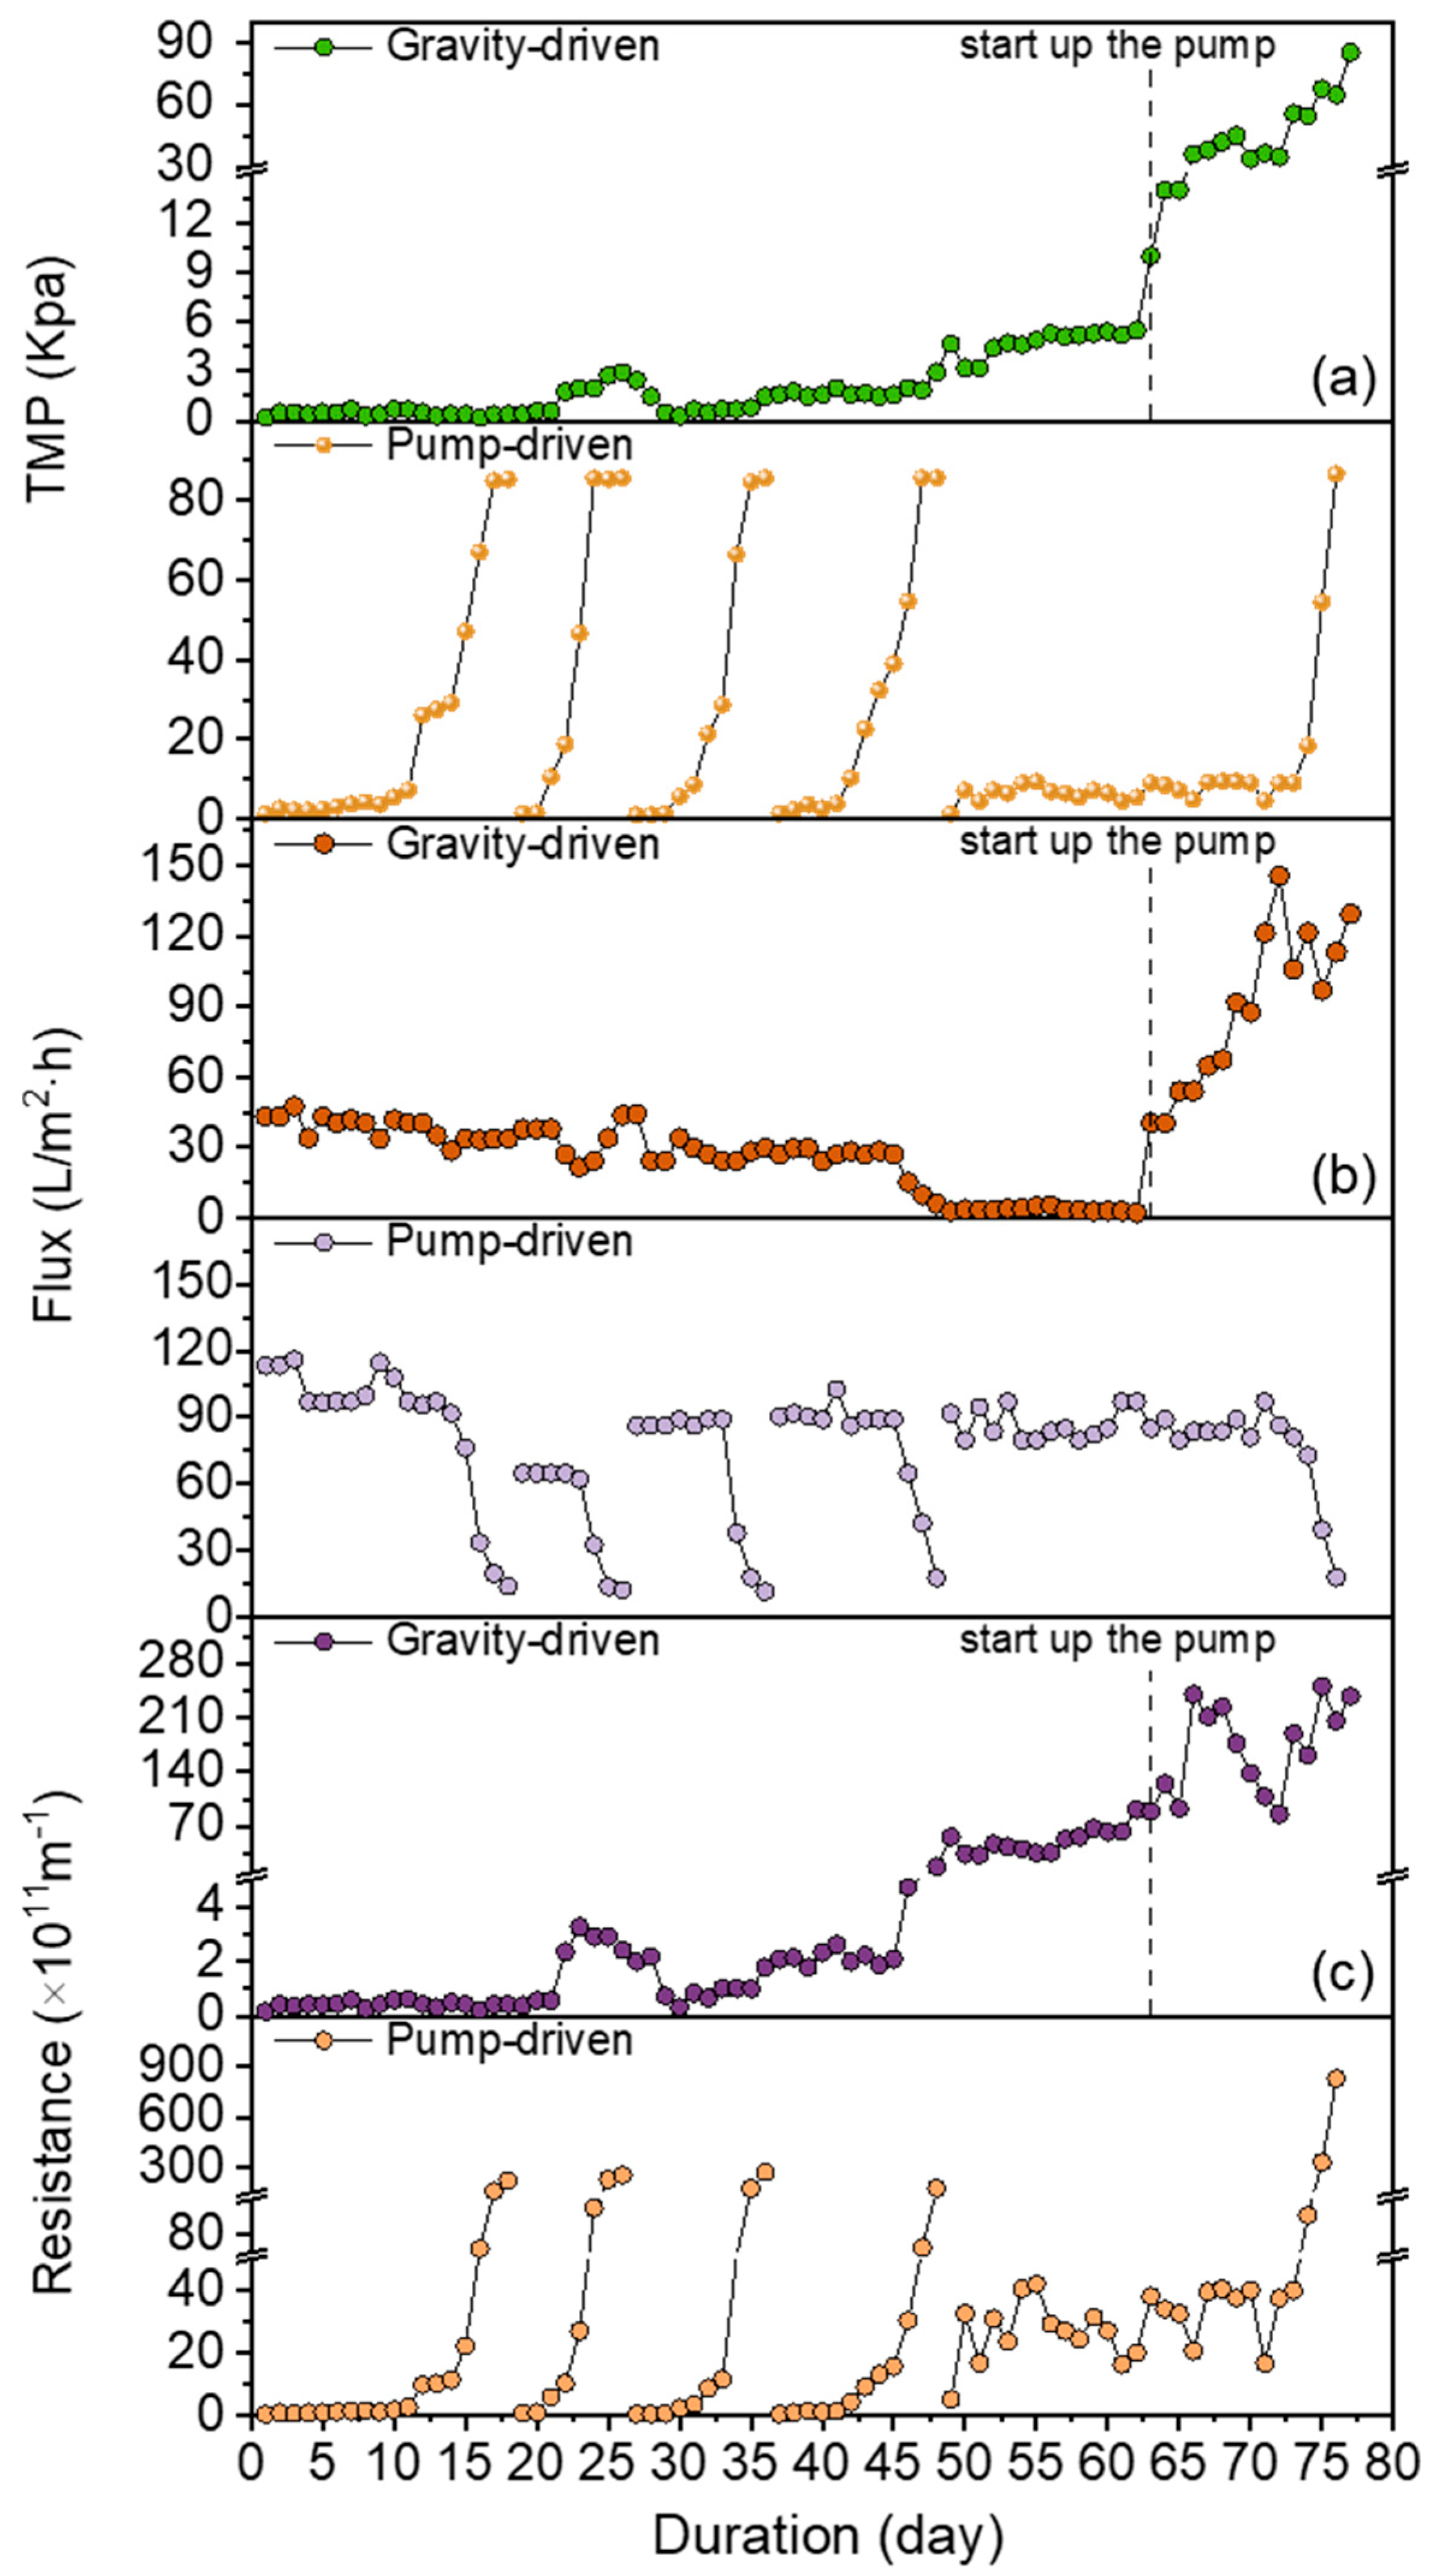
Prior to day 20, the gravity-driven module maintained a high flux ranging from 30 to 48 L/(m2·h) (Figure 4b) and a low TMP below 700 Pa (corresponding resistance < 0.61 × 10¹¹ m−1). Between days 20 and 45, likely due to increasing filtration resistance, the TMP fluctuated between 300 and 3000 Pa, while the flux varied from 24 to 44 L/(m2·h). Beginning on day 46, the TMP rose steadily as filtration resistance continued to accumulate, reaching a maximum of 5880 Pa by day 63. Concurrently, the flux declined to below 3 L/(m2·h) after day 45. After day 63, a suction pump was introduced to supplement the driving force for the gravity-driven module, enabling the recovery of high flux levels, albeit with a rapid increase in filtration resistance. Notably, as shown in Figure 3, the effluent turbidity remained largely unchanged after the suction pump was applied.
The pump-driven module initially sustained a low TMP of 1–5 kPa and a high flux exceeding 90 L/(m2·h) for 11 days. However, by day 18, both resistance and TMP increased sharply, reaching 221 × 1011 m−1 and 85 kPa, respectively. Following the first offline water flushing on day 18, the period of low TMP and high flux lasted only 4 days before TMP again rose rapidly to 85 kPa by day 24. A similar pattern was observed after the second and third cleanings, with TMP reaching the maximum allowable level within 8–10 days. The rapid TMP increase indeed reflected a critical transition in DM development. Initially, the DM layer formed by sludge deposition acted as a pre-filter. The continuous high pressure probably forced particles (including inorganic and biomass) into a denser configuration, drastically increasing specific resistance and reducing permeability. The reduced porosity could trap fine colloids within the DM layer, forming a gel-like, high-resistance barrier, further increasing filtration resistance, resulting in rapid rising in TMP. After day 48, however, the pump-driven module achieved relatively stable operation for 25 days (days 48–74), maintaining a flux of 90 L/(m2·h) and a TMP between 1 and 18 kPa. These results suggest significant fluctuations in the filtration behavior of the pump-driven module, potentially attributable to unmonitored variations in sludge properties and wastewater quality [12,15,16,18].
Compared to the pump-driven operation mode, the gravity-driven mode generally enabled longer periods of stable operation with lower TMP and filtration resistance, albeit at a comparatively lower flux. During the stabilized period, e.g., days 1–45 for gravity-driven and days 1–11 for pump-driven, the flux of the gravity-driven module (30–48 L/(m2·h) was approximately half that of the pump-driven module, yet its TMP was only 10–20% of the pump-driven values. This substantially lower TMP implies significantly reduced energy consumption. When the flux in the gravity-driven module declined severely, increasing the TMP with a suction pump allowed a high flux of 40–145 L/(m2·h) to be maintained for over two weeks. These findings indicate that a hybrid approach combining gravity-driven filtration with a backup suction pump could facilitate low-pressure operation while ensuring operational reliability during periods of high resistance. Moreover, gravity-driven operation did not use additional energy for filtration, further decreasing the energy consumption for the DMBR.

3.4. DM Structures Characterized by SEM and CLSM

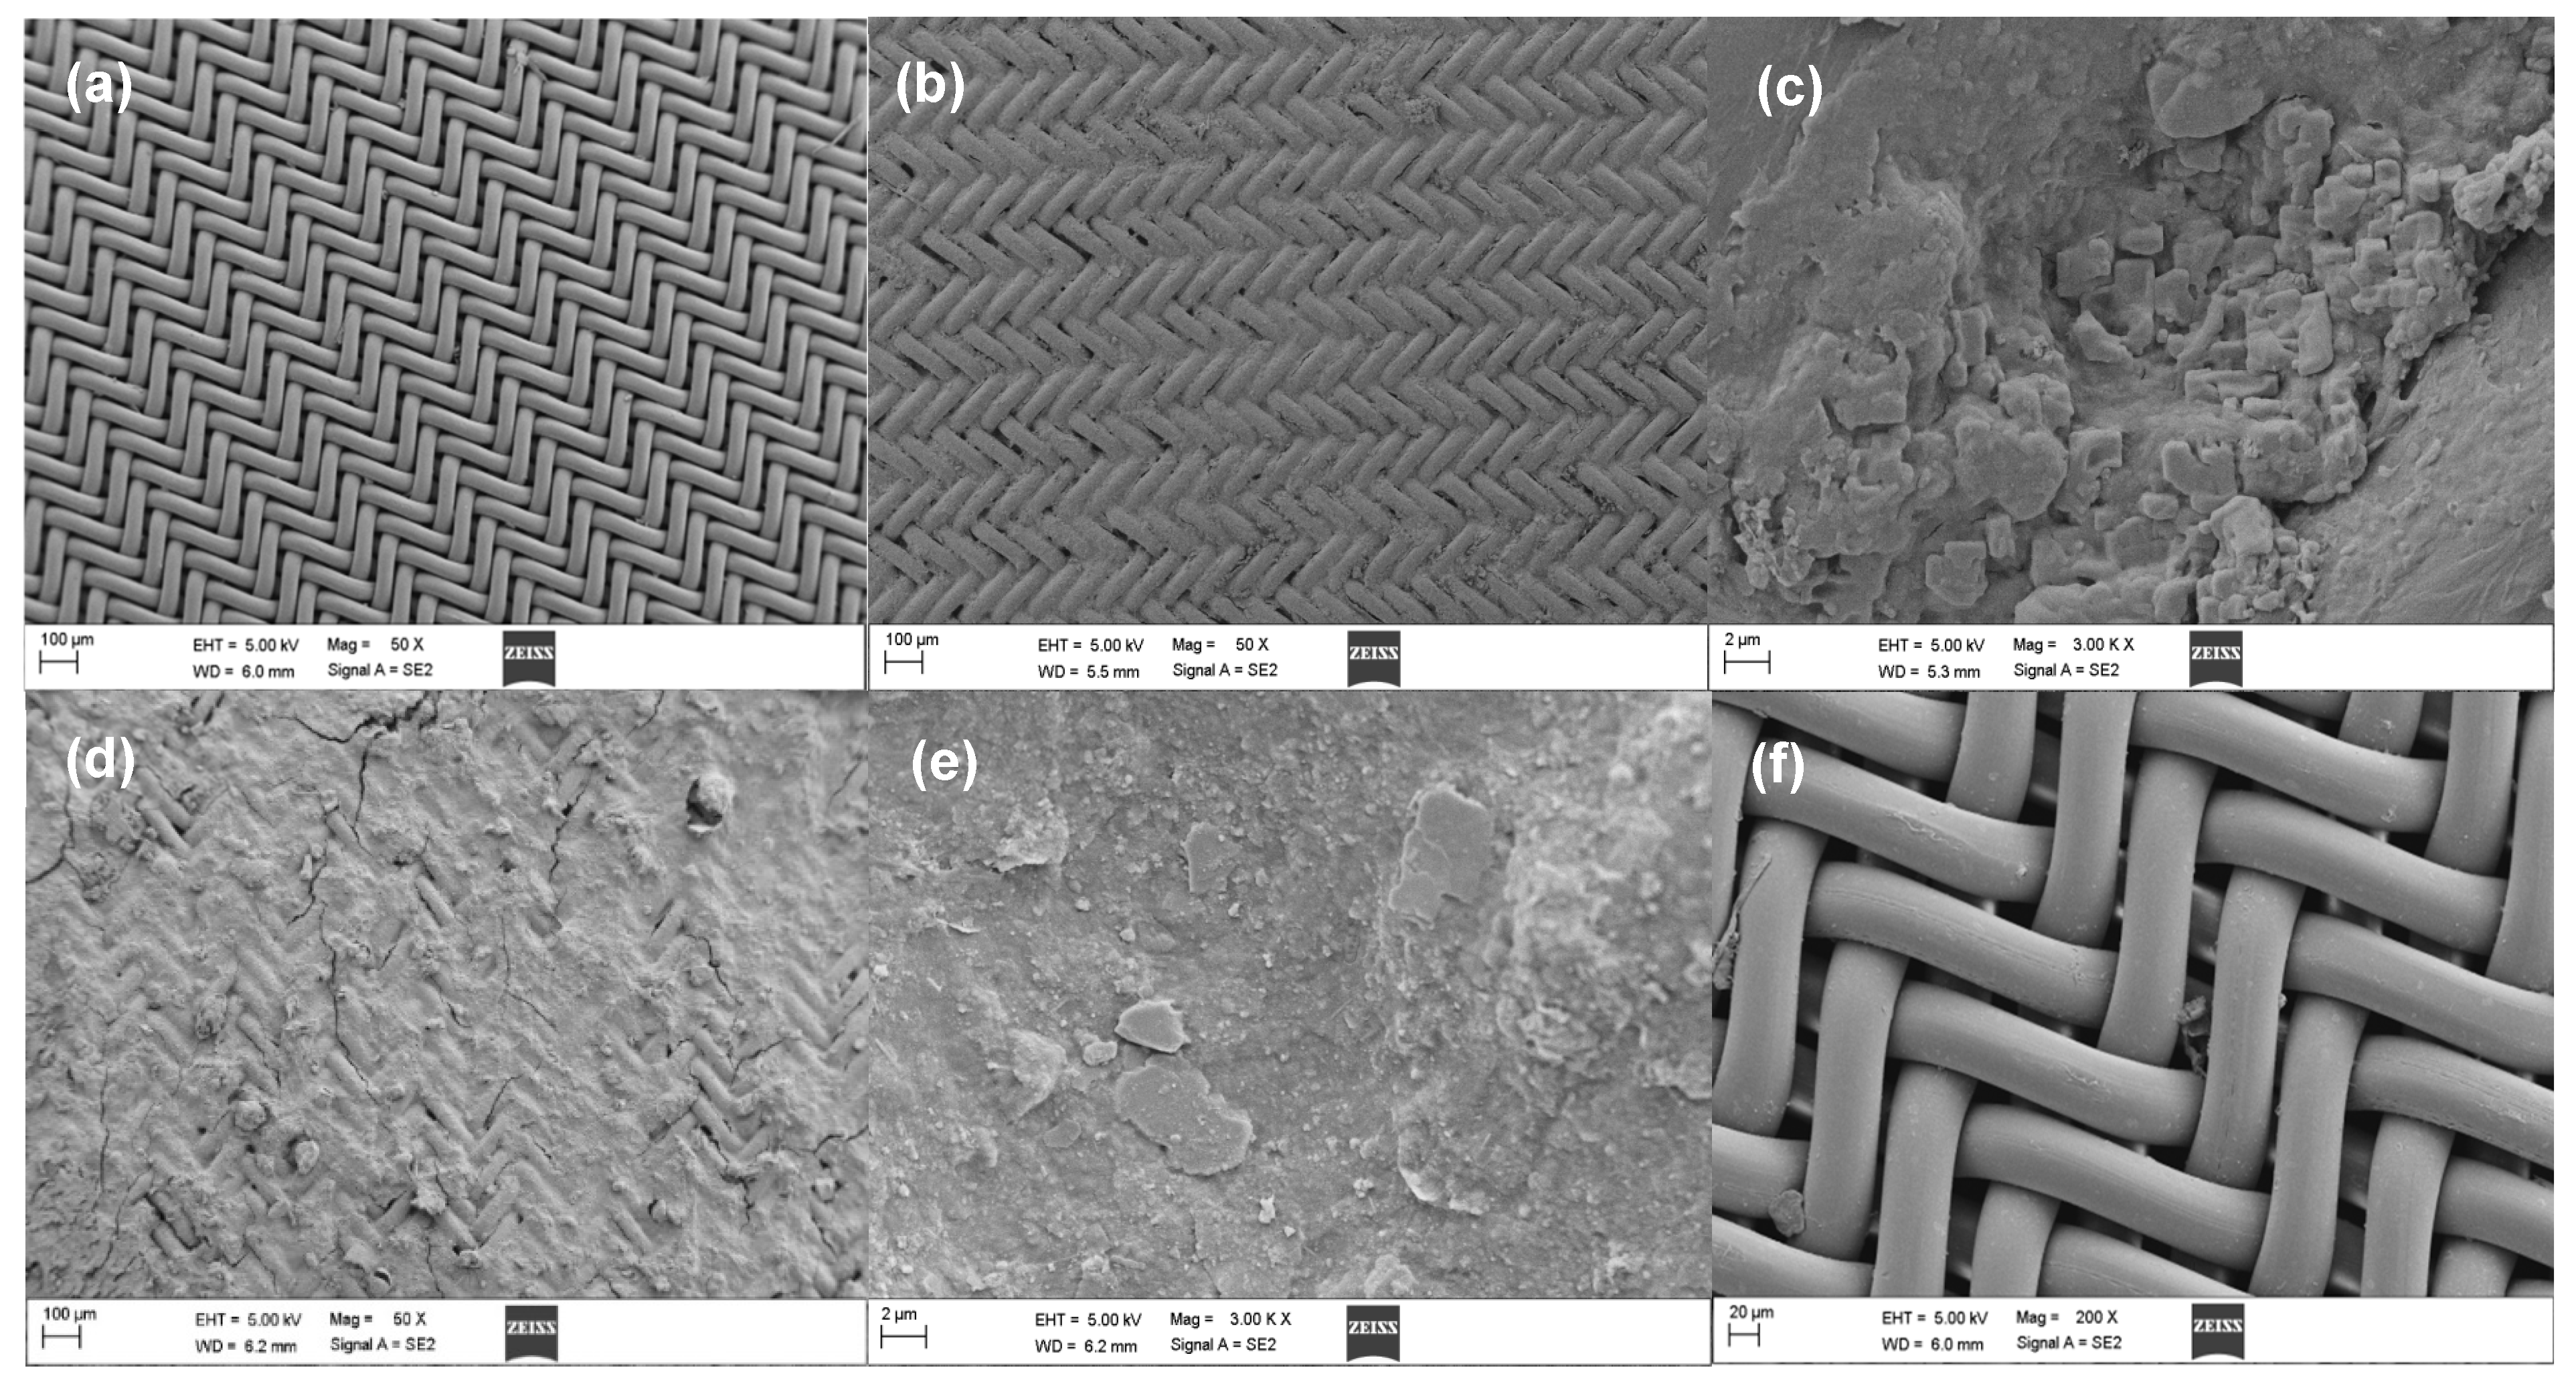
When the filtration resistance reached 90 × 1011 (on day 63) for the gravity-driven module and 250 × 1011 m−1 (on day 75) for the pump-driven module, the DM formed on filters were analyzed based on SEM and CLSM. As shown in Figure 5b,d, most of the mesh pores were blocked by solids under both operation modes, forming functional DMs that enabled fine particle separation but also contributed to increased filtration resistance. Notably, the DM layer formed under the pump-driven operation was visibly thicker and more compact. The porosity of the DM formed under the gravity-driven operation was 7.10%, compared to 0.99% for the pump-driven DM, while the clean nylon mesh had an initial porosity of 21.7%. Thus, the two filtration modes reduced the effective pore area by 67.3% and 95.4%, respectively. This substantial reduction in porosity under the pump-driven operation explains its significantly higher filtration resistance (Figure 4c).
As illustrated in Figure 5c,e, numerous angular particles were deposited on the mesh and embedded within gel-like substances, such as bacterial extracellular polymeric substances (EPS). The structural characteristics of these DMs were consistent with those observed in previous studies treating simulated wastewater containing both organic matter and fine inorganic particles (0.5–69.2 μm) [26]. Figure 5f demonstrates that even the thick DM formed under pump-driven conditions could be effectively removed by high-pressure water flushing.
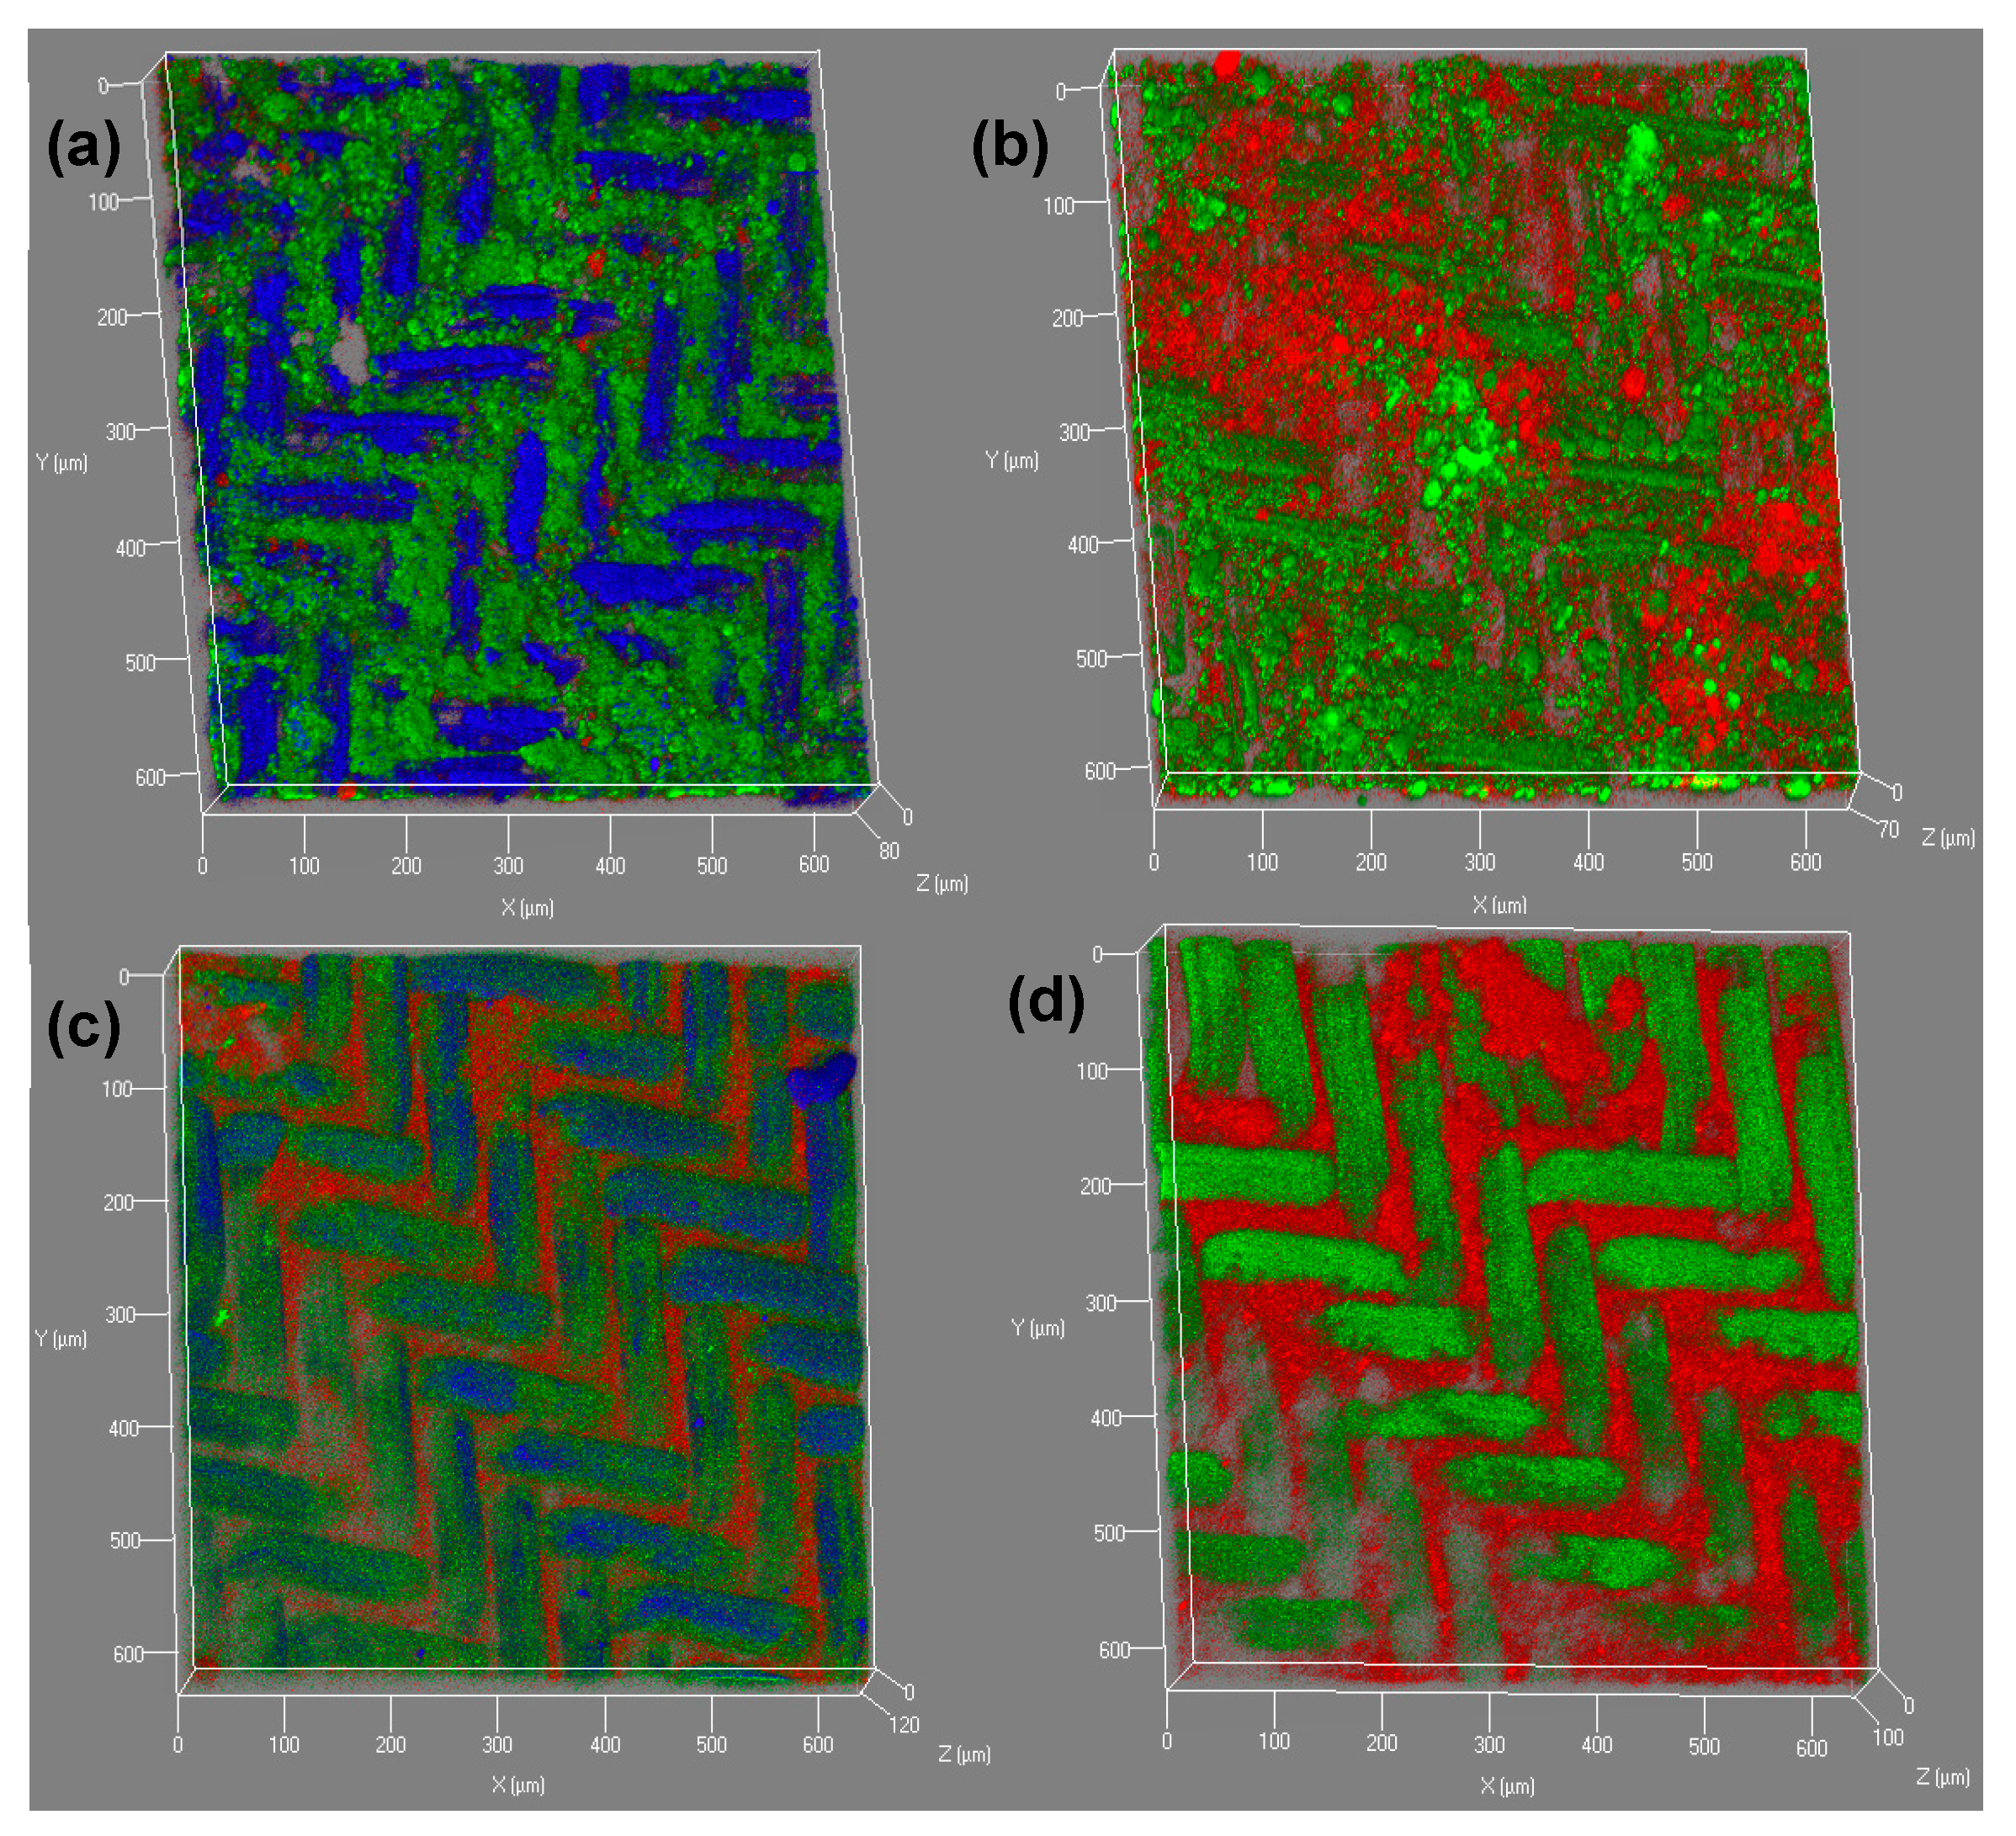
Both EPS (including polysaccharides and proteins) and microbial cells are major constituents of DMs and represent key foulants in microfiltration systems [36,37,38,39]. The spatial distributions of EPS and live/dead cells within the DMs were further examined via CLSM, as presented in Figure 6. In the gravity-driven DM, mesh pores were primarily blocked by proteins and a small amount of α-d-glucopyranose polysaccharides, while the mesh filaments were predominantly coated with β-d-glucopyranose polysaccharides. In contrast, the pump-driven DM showed dominant accumulation of α-d-glucopyranose polysaccharides within the pores, with proteins and β-d-glucopyranose polysaccharides mainly adhered to the filaments. The distributions of live and dead cells also differed between the two operational modes. However, the underlying mechanisms through which operational mode influences EPS and cell distribution remain unclear and warrant further investigation. Please note that the influent COD concentration in our study (~166 mg/L) was lower than the typical range for many municipal wastewaters [10,11]. In the treatment of wastewater with high influent COD, the DM layer would likely be a more complex organic–inorganic composite, due to the fact that more COD can be used to support biofilm growth in DMs. The higher organic content would probably lead to a thicker, more gel-like bio-cake, potentially accelerating the initial TMP rise due to higher organic deposition and pore blocking. However, the adverse effect of high influent COD on DMBR can be alleviated by extending the solids retention time (SRT) since a long SRT could reduce the availability of COD in the bulk solution [14].

3.5. Inorganic and Elemental Composition of the DM

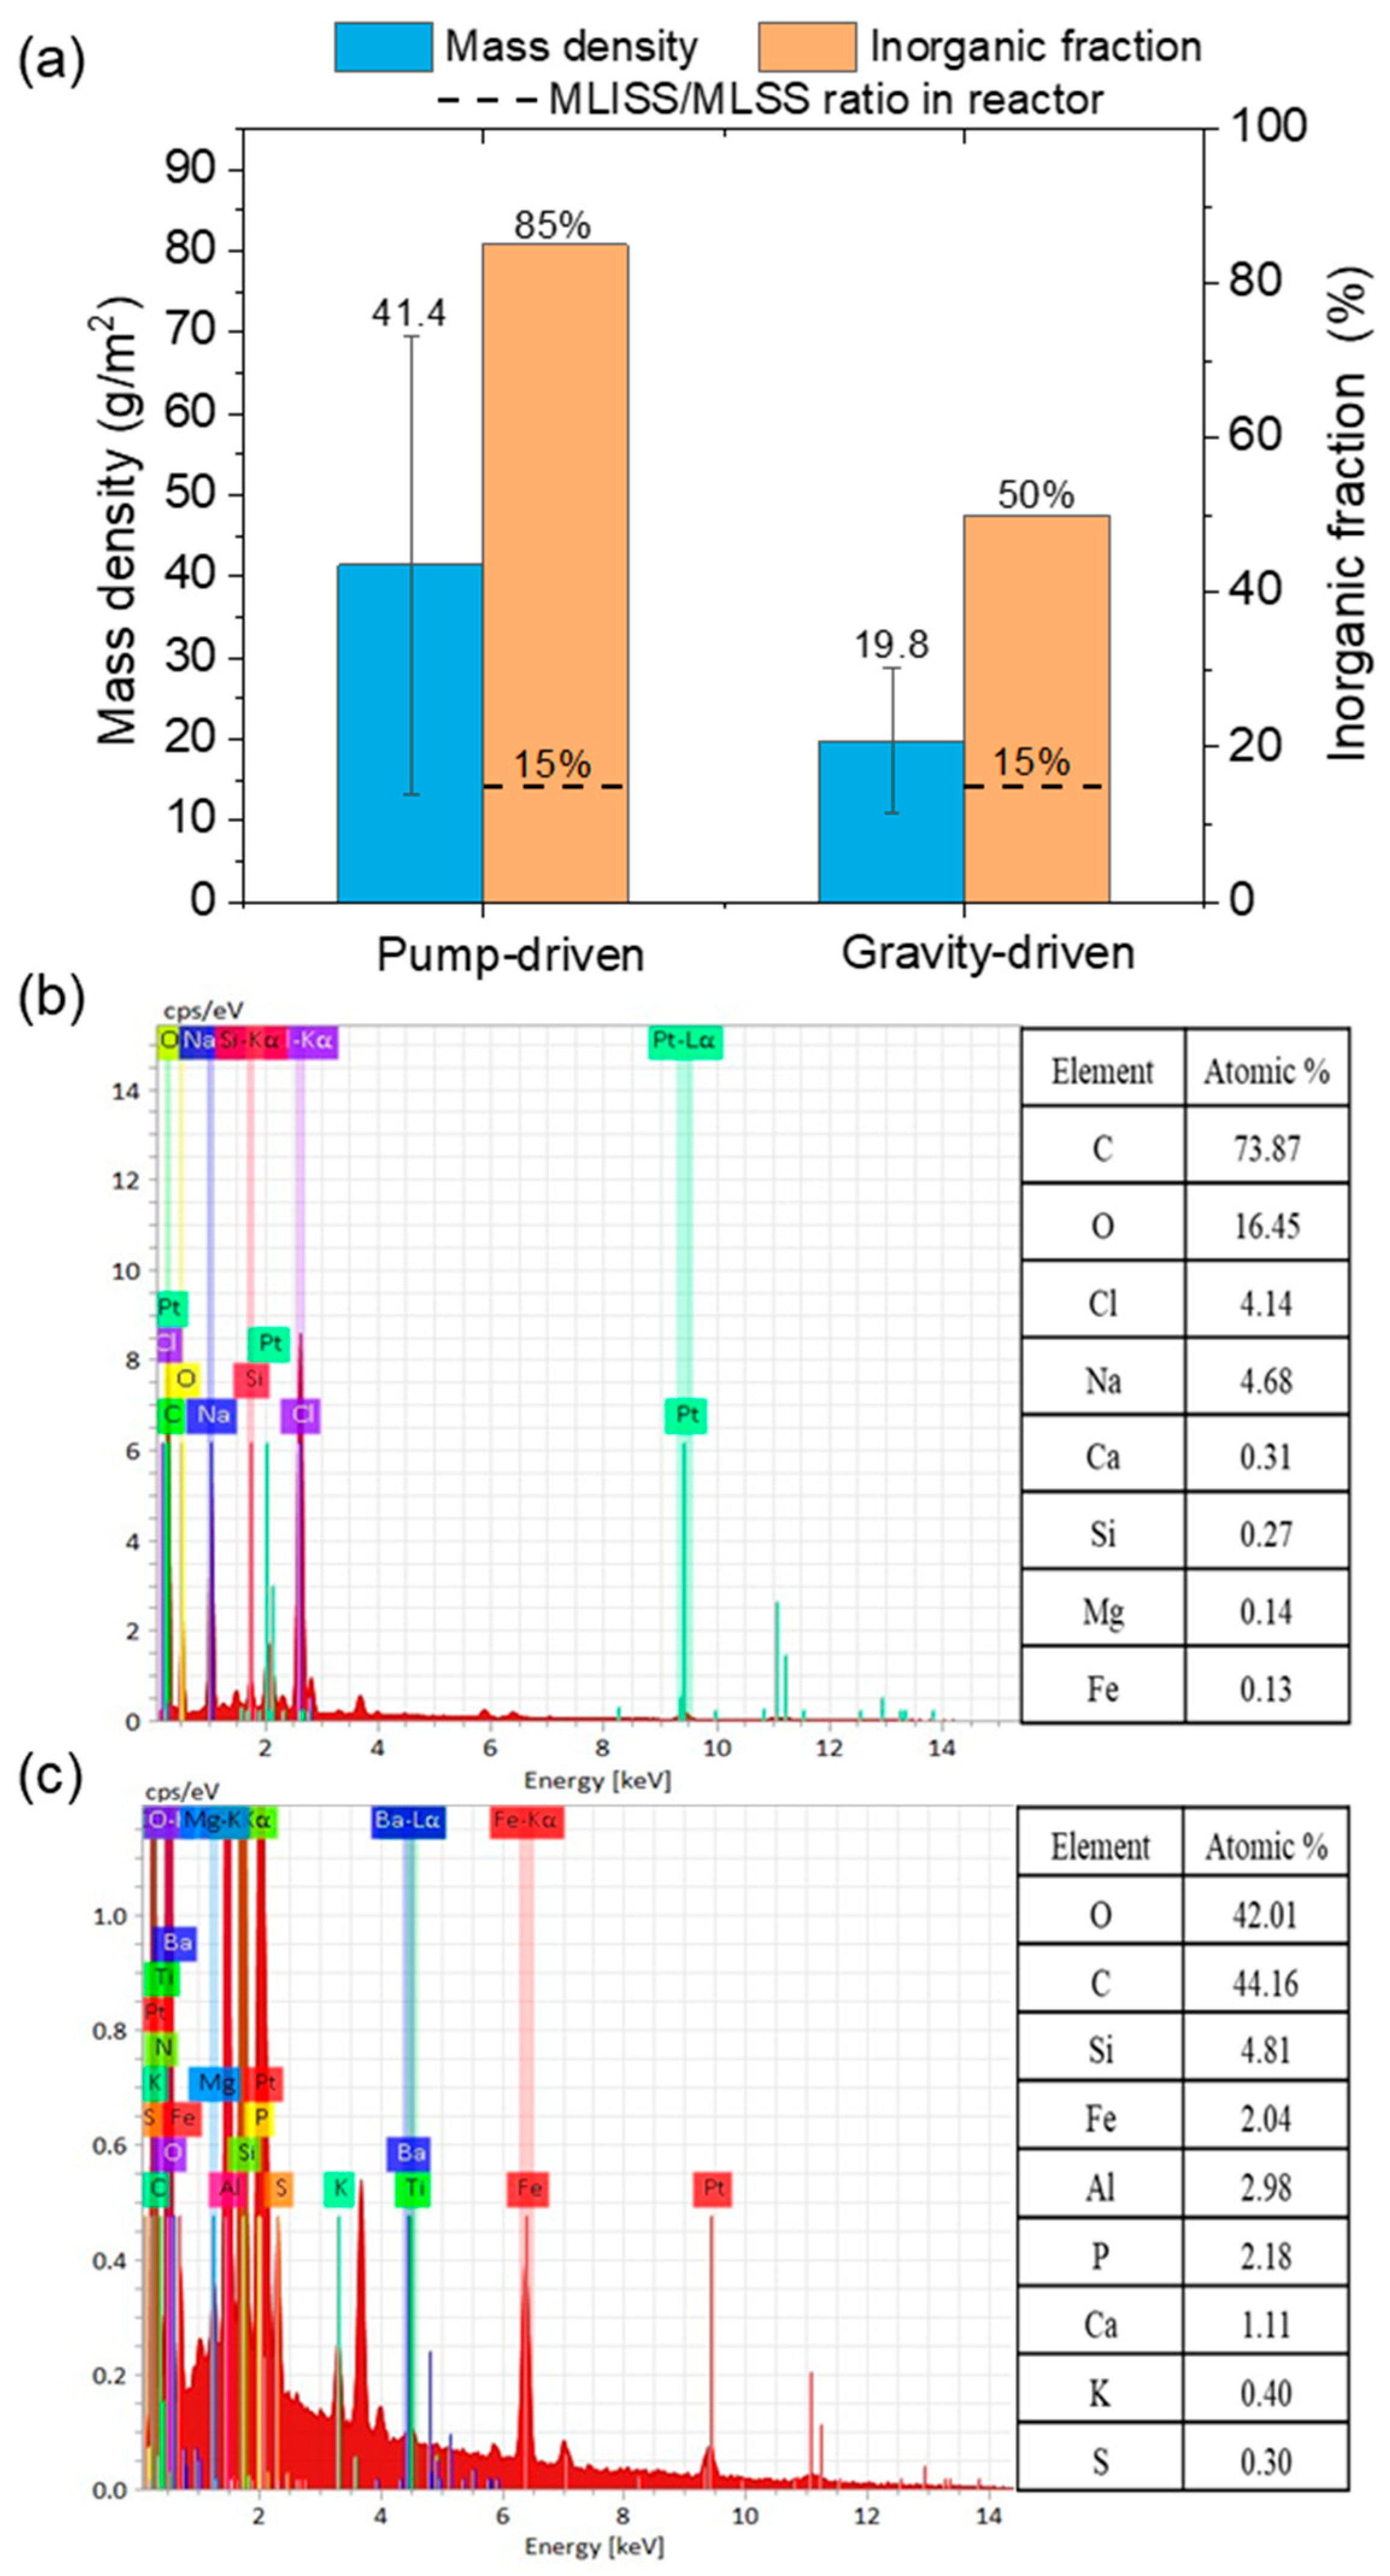
As shown in Figure 7a, the mass of the DM formed on the mesh filters was 41.4 ± 28.2 g/m2 for the pump-driven mode and 19.8 ± 9.0 g/m2 for the gravity-driven mode, consistent with SEM observations indicating a thicker DM layer under the pump-driven operation. Furthermore, the inorganic content of the pump-driven DM reached 85%, which is significantly higher than that of the gravity-driven DM (50%). Notably, the inorganic fraction in both DMs substantially exceeded the MLISS/MLSS ratio of the bulk sludge (approximately 15% at the time of sampling), suggesting a preferential accumulation of inorganic particles on the mesh surface. The higher TMP applied in the pump-driven operation likely accelerated this accumulation by forcing the inorganic particles (including grits and clays) into a denser configuration, drastically increasing specific resistance and reducing permeability. EDX analysis revealed that silicon, carbon, oxygen, and calcium were the predominant elements on the mesh surface and within the pores. This elemental composition aligns with previous reports identifying silica and calcium carbonate as major inorganic constituents in domestic wastewater, as confirmed by EDX and XRD/XRF techniques [40,41].
Previous lab-scale studies demonstrated that DMBRs treating synthetic wastewater without inorganic solids could maintain a flux of 15 L/(m2·h) and a low TMP of 20 Pa for over 180 days without cleaning [15,26]. When DMs are primarily composed of biofilms, the accumulated hydraulic resistance can decrease spontaneously through flux reduction [42]. However, the high inorganic content in the DMs in this study likely impeded this self-recovery, preventing flux restoration in the gravity-driven module without cleaning (Figure 4b). Inorganic particles contribute directly to resistance by pore blockage and constriction. Additionally, they may interact with biofilms under aeration conditions, potentially stimulating microorganisms to produce more EPS, further increasing filtration resistance [43]. Due to the inflow issue of the sewer system, the domestic wastewater inevitably contained some inorganics solids, e.g., grit and clay soils, especially in the developing countries [26]. Therefore, enhancing the removal of inorganic solids prior to the DMBR could improve operational stability and facilitate the full-scale application of DMBR technology. In addition, it is necessary to investigate the connections between the accumulation of inorganic solids in DMs and their properties such as particle sizes, shapes, and compositions, in future studies.

4. Conclusions

This study investigated the filtration performance of dynamic membranes (DMs) in a pilot-scale DMBR treating domestic wastewater under gravity-driven and pump-driven operational modes. After DM formation, the gravity-driven module achieved slightly lower effluent turbidity (0.51 NTU) than the pump-driven module (0.63 NTU). Although the flux in gravity-driven mode (30–48 L/(m2·h)) was lower than that in pump-driven mode, the required TMP was only 10–20% of that under the pump-driven operation. The DM formed under pump-driven conditions was thicker, more compact, and exhibited higher filtration resistance, leading to more frequent rapid TMP increases. Inorganic content accounted for 85% of the pump-driven DM mass, significantly higher than that in the gravity-driven DM (50%) and the activated sludge (15%), indicating pronounced accumulation of inorganic solids on the mesh filter, especially under the pump-driven operation. Therefore, maximizing the removal of inorganic solids from wastewater before entering the DMBR is recommended to enhance system stability and support broader implementation of the DMBR technology. It should be noted that since this study’s focus was on filtration performance, TN and TP removal were not monitored, which represents a limitation in assessing the system’s overall nutrient removal capabilities.

Author Contributions

X.L.: Manuscript draft and funding acquisition. D.L. and L.J.: Investigation, methodology, data analysis, and manuscript draft. G.L.: Conceptualization, supervision, manuscript draft, and resources. All authors have read and agreed to the published version of the manuscript.

Funding

This study was supported by the grant from Guangxi Education Department (2022KY0797).

Data Availability Statement

The raw data supporting the conclusions of this article will be made available by the authors on request.

Conflicts of Interest

The funders had no role in the design of the study; in the collection, analysis, or interpretation of data; in the writing of the manuscript; or in the decision to publish the results.

References

  1. Jeison, D.; Díaz, I.; Van Lier, J.B. Anaerobic membrane bioreactors: Are membranes really necessary? Electron. J. Biotechnol. 2008, 11, 1–2. [Google Scholar] [CrossRef]
  2. Zhang, X.; Wang, Z.; Wu, Z.; Lu, F.; Tong, J.; Zang, L. Formation of dynamic membrane in an anaerobic membrane bioreactor for municipal wastewater treatment. Chem. Eng. J. 2010, 165, 175–183. [Google Scholar] [CrossRef]
  3. Chu, H.Q.; Zhang, Y.L.; Zhou, X.F.; Zhao, Y.Y.; Dong, B.Z.; Zhang, H. Dynamic membrane bioreactor for wastewater treatment: Operation, critical flux, and dynamic membrane structure. J. Membr. Sci. 2014, 450, 265–271. [Google Scholar] [CrossRef]
  4. Yu, Z.Z.; Hu, Y.S.; Dzakpasu, M.; Wang, X.C.C.; Ngo, H.H. Dynamic membrane bioreactor performance enhancement by powdered activated carbon addition: Evaluation of sludge morphological, aggregative and microbial properties. J. Environ. Sci. 2019, 75, 73–83. [Google Scholar] [CrossRef]
  5. Chu, H.-q.; Cao, D.-w.; Jin, W.; Dong, B.-z. Characteristics of bio-diatomite dynamic membrane process for municipal wastewater treatment. J. Membr. Sci. 2008, 325, 271–276. [Google Scholar] [CrossRef]
  6. Meng, F.; Zhang, S.; Oh, Y.; Zhou, Z.; Shin, H.-S.; Chae, S.-R. Fouling in membrane bioreactors: An updated review. Water Res. 2017, 114, 151–180. [Google Scholar] [CrossRef] [PubMed]
  7. Wang, Z.; Ma, J.; Tang, C.Y.; Kimura, K.; Wang, Q.; Han, X. Membrane cleaning in membrane bioreactors: A review. J. Membr. Sci. 2014, 468, 276–307. [Google Scholar] [CrossRef]
  8. Yamamoto, K.; Hiasa, M.; Mahmood, T.; Matsuo, T. Direct solid-liquid separation using hollow fiber membrane in an activated sludge aeration tank. In Water Pollution Research and Control Brighton, Proceedings of the Fourteenth Biennial Conference of the International Association on Water Pollution Research and Control, Brighton, UK, 18–21 July 1988; Elsevier: Amsterdam, The Netherlands, 1988; pp. 43–54. [Google Scholar] [CrossRef]
  9. Judd, S. The status of industrial and municipal effluent treatment with membrane bioreactor technology. Chem. Eng. J. 2016, 305, 37–45. [Google Scholar] [CrossRef]
  10. Seo, G.T.; Moon, B.H.; Park, Y.M.; Kim, S.H. Filtration characteristics of immersed coarse pore filters in an activated sludge system for domestic wastewater reclamation. Water Sci. Technol. 2007, 55, 51–58. [Google Scholar] [CrossRef]
  11. Xiong, J.L.; Fu, D.F.; Singh, R.P. Self-adaptive dynamic membrane module with a high flux and stable operation for the municipal wastewater treatment. J. Membr. Sci. 2014, 471, 308–318. [Google Scholar] [CrossRef]
  12. Chen, G.C.; Wen, J.L.; Yu, Y.; Liu, M.; Liu, G.Q. Dynamic membranes with sparse nanofibers as the skeletons yield better and more stable effluent quality without sacrificing the flux in bioreactors. J. Membr. Sci. 2022, 650, 120414. [Google Scholar] [CrossRef]
  13. Loderer, C.; Worle, A.; Fuchs, W. Influence of Different Mesh Filter Module Configurations on Effluent Quality and Long-Term Filtration Performance. Environ. Sci. Technol. 2012, 46, 3844–3850. [Google Scholar] [CrossRef] [PubMed]
  14. Satyawali, Y.; Balakrishnan, M. Treatment of distillery effluent in a membrane bioreactor (MBR) equipped with mesh filter. Sep. Purif. Technol. 2008, 63, 278–286. [Google Scholar] [CrossRef]
  15. Huang, J.; Wu, X.W.; Cai, D.L.; Chen, G.F.; Li, D.Y.; Yu, Y.; Petrik, L.F.; Liu, G.Q. Linking solids retention time to the composition, structure, and hydraulic resistance of biofilms developed on support materials in dynamic membrane bioreactors. J. Membr. Sci. 2019, 581, 158–167. [Google Scholar] [CrossRef]
  16. Isik, O.; Batyrow, M.; Abdelrahman, A.M.; Orman, I.; Ozgun, H.; Ersahin, M.E.; Pasaoglu, M.E.; Demir, I.; Koyuncu, I. Dynamic membrane bioreactor performance for treatment of municipal wastewaters at different sludge concentrations. Environ. Technol. Innov. 2021, 22, 101452. [Google Scholar] [CrossRef]
  17. Chuang, S.-H.; Lin, P.-K.; Chang, W.-C. Dynamic fouling behaviors of submerged nonwoven bioreactor for filtration of activated sludge with different SRT. Bioresour. Technol. 2011, 102, 7768–7776. [Google Scholar] [CrossRef]
  18. Yu, Z.Z.; Hu, Y.S.; Dzakpasu, M.; Wang, X.C.C. Thermodynamic prediction and experimental investigation of short-term dynamic membrane formation in dynamic membrane bioreactors: Effects of sludge properties. J. Environ. Sci. 2019, 77, 85–96. [Google Scholar] [CrossRef]
  19. Imai, A.; Fukushima, T.; Matsushige, K.; Kim, Y.H.; Choi, K. Characterization of dissolved organic matter in effluents from wastewater treatment plants. Water Res. 2002, 36, 859–870. [Google Scholar] [CrossRef] [PubMed]
  20. Yang, Y.; Deng, W.; Hu, Y.; Chen, R.; Wang, X.C. Gravity-driven high flux filtration behavior and microbial community of an integrated granular activated carbon and dynamic membrane bioreactor for domestic wastewater treatment. Sci. Total Environ. 2022, 825, 153930. [Google Scholar] [CrossRef]
  21. Hu, Y.; Wang, X.C.; Tian, W.; Ngo, H.H.; Chen, R. Towards stable operation of a dynamic membrane bioreactor (DMBR): Operational process, behavior and retention effect of dynamic membrane. J. Membr. Sci. 2016, 498, 20–29. [Google Scholar] [CrossRef]
  22. Wang, Y.K.; Sheng, G.P.; Li, W.W.; Yu, H.Q. A pilot investigation into membrane bioreactor using mesh filter for treating low-strength municipal wastewater. Bioresour. Technol. 2012, 122, 17–21. [Google Scholar] [CrossRef]
  23. Xiong, J.; Fu, D.; Singh, R.P.; Ducoste, J.J. Structural characteristics and development of the cake layer in a dynamic membrane bioreactor. Sep. Purif. Technol. 2016, 167, 88–96. [Google Scholar] [CrossRef]
  24. Huang, J.; Wu, X.W.; Liang, Z.H.; Yu, Y.; Liu, G.Q. Water flushing irremovable biofilms on support material in dynamic membrane bioreactor: Formation, composition, and microbial community. Chemosphere 2021, 271, 129813. [Google Scholar] [CrossRef]
  25. Lin, H.J.; Xie, K.; Mahendran, B.; Bagley, D.M.; Leung, K.T.; Liss, S.N.; Liao, B.Q. Sludge properties and their effects on membrane fouling in submerged anaerobic membrane bioreactors (SAnMBRs). Water Res. 2009, 43, 3827–3837. [Google Scholar] [CrossRef]
  26. Jiang, L.G.; Yu, Y.; Liu, G.Q. Effects of inorganic particles and their interactions with biofilms on dynamic membrane structure and long-term filtration performance. Sci. Total Environ. 2021, 780, 146639. [Google Scholar] [CrossRef]
  27. Abd Mutalib, M.; Rahman, M.; Othman, M.; Ismail, A.; Jaafar, J. Scanning electron microscopy (SEM) and energy-dispersive X-ray (EDX) spectroscopy. In Membrane Characterization; Elsevier: Amsterdam, The Netherlands, 2017; pp. 161–179. [Google Scholar]
  28. Quintas, V.; Prada-López, I.; Tomás, I. Analyzing the oral biofilm using fluorescence-based microscopy: What’s in a dye. In Microscopy: Advances in Scientific Research and Education; Méndez-Vilas, A., Ed.; Formatex Research Center: Badajoz, Spain, 2014; pp. 226–238. [Google Scholar]
  29. Yuan, B.; Wang, X.H.; Tang, C.Y.; Li, X.F.; Yu, G.H. In situ observation of the growth of biofouling layer in osmotic membrane bioreactors by multiple fluorescence labeling and confocal laser scanning microscopy. Water Res. 2015, 75, 188–200. [Google Scholar] [CrossRef] [PubMed]
  30. Cai, D.L.; Huang, J.; Liu, G.Q.; Li, M.Y.; Yu, Y.; Meng, F.G. Effect of support material pore size on the filtration behavior of dynamic membrane bioreactor. Bioresour. Technol. 2018, 255, 359–363. [Google Scholar] [CrossRef] [PubMed]
  31. Liu, H.B.; Li, Y.J.; Yang, C.Z.; Pu, W.H.; He, L.; Bo, F. Stable aerobic granules in continuous-flow bioreactor with self-forming dynamic membrane. Bioresour. Technol. 2012, 121, 111–118. [Google Scholar] [CrossRef] [PubMed]
  32. Sreeda, P.; Sathya, A.B.; Sivasubramanian, V. Novel application of high-density polyethylene mesh as self-forming dynamic membrane integrated into a bioreactor for wastewater treatment. Environ. Technol. 2018, 39, 51–58. [Google Scholar] [CrossRef]
  33. Li, L.C.; Xu, G.R.; Yu, H.R.; Xing, J. Dynamic membrane for micro-particle removal in wastewater treatment: Performance and influencing factors. Sci. Total Environ. 2018, 627, 332–340. [Google Scholar] [CrossRef]
  34. Xue, N.T.; Xia, J.L.; Huang, X. Fouling control of a pilot scale self-forming dynamic membrane bioreactor for municipal wastewater treatment. Desalination Water Treat. 2010, 18, 302–308. [Google Scholar] [CrossRef]
  35. Fuchs, W.; Resch, C.; Kernstock, M.; Mayer, M.; Schoeberl, P.; Braun, R. Influence of operational conditions on the performance of a mesh filter activated sludge process. Water Res. 2005, 39, 803–810. [Google Scholar] [CrossRef] [PubMed]
  36. Chu, H.Q.; Zhang, Y.L.; Zhou, X.F.; Dong, B.Z. Bio-enhanced powder-activated carbon dynamic membrane reactor for municipal wastewater treatment. J. Membr. Sci. 2013, 433, 126–134. [Google Scholar] [CrossRef]
  37. Hu, Y.S.; Wang, X.C.C.; Sun, Q.Y.; Ngo, H.H.; Yu, Z.Z.; Tang, J.L.; Zhang, Q.H. Characterization of a hybrid powdered activated carbon-dynamic membrane bioreactor (PAC-DMBR) process with high flux by gravity flow: Operational performance and sludge properties. Bioresour. Technol. 2017, 223, 65–73. [Google Scholar] [CrossRef]
  38. Zhang, J.S.; Loong, W.L.C.; Chou, S.R.; Tang, C.Y.; Wang, R.; Fane, A.G. Membrane biofouling and scaling in forward osmosis membrane bioreactor. J. Membr. Sci. 2012, 403, 8–14. [Google Scholar] [CrossRef]
  39. Ou, S.H.; You, S.J.; Chang, W.Y.; Damodar, R.A. Effect of sludge retention time on sludge properties and membrane fouling of different hydrophobic PTFE membranes. Desalination Water Treat. 2011, 30, 105–113. [Google Scholar] [CrossRef]
  40. Chen, Y.-P.; Guo, J.-S.; Wang, J.; Yan, P.; Ji, F.-Y.; Fang, F.; Dong, Y. A grit separation module for inorganic matter removal from activated sludge: Investigation on characteristics of split sludge from the module. Environ. Technol. 2016, 37, 3168–3176. [Google Scholar] [CrossRef]
  41. Bayo, J.; López-Castellanos, J.; Martínez-García, R.; Alcolea, A.; Lardín, C. Hydrocyclone as a cleaning device for anaerobic sludge digesters in a wastewater treatment plant. J. Clean. Prod. 2015, 87, 550–557. [Google Scholar] [CrossRef]
  42. Chen, G.F.; Cai, D.L.; Huang, J.; Lu, Z.C.; Yu, Y.; Liu, G.Q. Biofilm as a live and in-situ formed membrane for solids separation in bioreactors: Biofilm succession governs resistance variation demonstrated during the start-up period. J. Membr. Sci. 2020, 608, 118197. [Google Scholar] [CrossRef]
  43. Zhou, L.J.; Ye, B.; Xia, S.Q. Assessment of membrane bioreactor fouling with the addition of suspended aluminum nitride nanoparticles. Chemosphere 2019, 237, 124473. [Google Scholar] [CrossRef] [PubMed]
Figure 1. (a) Pilot-scale dynamic membrane bioreactor; (b) dynamic membrane module.
Water 17 02799 g001
Figure 2. Sludge concentration and influent and effluent quality: (a) MLSS and MLVSS, (b) influent SS and ISS, (c) COD, and (d) ammonia.
Water 17 02799 g002
Figure 3. Effluent turbidity for the gravity-driven and pump-driven DM modules (a); the box plot for the effluent turbidity under stabilized conditions when the dynamic membrane was formed (n = 65) (b); correlation between turbidity and SS in the effluent (n = 25) (c).
Water 17 02799 g003
Figure 4. Variations in (a) TMP, (b) flux, and (c) filtration resistance for gravity-driven and pump-driven DM modules.
Water 17 02799 g004
Figure 5. SEM images for (a) fresh mesh, (b,c) gravity-driven DM, (d,e) pump-driven DM, and (f) pump-driven DM after high-pressure water cleaning.
Water 17 02799 g005
Figure 6. Distribution of EPS in (a) gravity-driven and (c) pump-driven DM; distribution of live and dead cells in (b) gravity-driven and (d) pump-driven DM. In the images (a,c), green, red, and blue represent EPS proteins, α-D-glucopyranose polysaccharides, and β-D-glucopyranose polysaccharides, respectively. In the images (b,d), green and red color represent live and dead cells, respectively.
Water 17 02799 g006
Figure 7. (a) Mass density and inorganic fraction in DMs; elemental composition in (b) gravity-driven and (c) pump-driven DMs as determined by EDX analysis (Pt Peak is from the sputter coating).
Water 17 02799 g007
Disclaimer/Publisher’s Note: The statements, opinions and data contained in all publications are solely those of the individual author(s) and contributor(s) and not of MDPI and/or the editor(s). MDPI and/or the editor(s) disclaim responsibility for any injury to people or property resulting from any ideas, methods, instructions or products referred to in the content.