Article

Occurrence Characteristics and Ecological Risk Assessment of Microplastics in Aquatic Environments of Cascade Reservoirs Along the Middle-Lower Han River

1
North Alabama International College of Engineering and Technology, Sustainability, Guizhou University, Guiyang 550025, China
2
Basin Water Environmental Research Department, Changjiang River Scientific Research Institute, Wuhan 430010, China
3
Innovation Team for Basin Water Environmental Protection and Governance of Changjiang Water Resources Commission, Wuhan 430010, China
*
Author to whom correspondence should be addressed.
Water 2025, 17(19), 2793; https://doi.org/10.3390/w17192793
Submission received: 7 August 2025 / Revised: 10 September 2025 / Accepted: 17 September 2025 / Published: 23 September 2025
(This article belongs to the Section Water Quality and Contamination)

Abstract

The presence and accumulation of microplastics (MPs) in riverine waters have been widely documented. The sustained operation of cascade reservoirs has altered the retention characteristics of MPs in the Han River basin. In this study, the composition, sources, and ecological risks of MPs in the water column and sediments of the Han River mainstream across different periods were investigated. Results showed that the MP abundances in the water column and sediments were higher during the flood season than in the non-flood season. Additionally, MPs in the water column exhibited an increasing trend along the operational sequence of cascade reservoirs. During the flood season, polyamide (PA), polyethylene (PE), and polypropylene (PP) were the dominant MP types in the water column, while polycarbonate (PC) and PP prevailed in sediments. In the non-flood season, polyethylene terephthalate (PET) was the dominant MP type in the water column, whereas PC and PET dominated in sediments. Overall, the distribution characteristics of MPs conformed to the “upstream input-reservoir accumulation-downstream output” pattern. The pollution risk of MPs in both the water column and sediments ranged from low to moderate. These findings provide a basis for exploring the impacts of cascade reservoir operation on the characteristics of MP in water and sediments. Future research will focus on migration mechanisms of MP under the joint operation of cascade reservoirs.

1. Introduction

Microplastics (MPs, solid plastic particles ≤ 5 mm) are considered one of the four major emerging contaminants of global concern [1]. Their environmental behavioral characteristics and ecological risks have become a research hotspot in the field of environmental science. These composite pollutants, composed of polymer matrices, functional additives, and chemical auxiliaries, pose multi-dimensional threats to aquatic ecosystems due to their environmental persistence, potential for ingestion, and associated ecotoxicity [2]. Specifically, MPs can affect aquatic organisms through three main pathways: physical obstruction, chemical toxicity, and biological carrier effects. Larger-sized MPs can directly block the digestive tracts of organisms, while nano-sized MPs can penetrate cell membranes and release toxic additives such as plasticizers. Additionally, the persistent organic pollutants (POPs) and heavy metals adsorbed on their surfaces can produce combined toxic effects [3,4].
Notably, terrestrial freshwater systems, an important medium for pollutant transport, have hydrodynamic-sediment coupling processes that significantly affect MPs’ environmental fate. In riverine environments, the interaction between hydrodynamic conditions and sediment transport forms an interplay between MP transport and retention. In high-velocity areas (such as the center of river channels), longitudinal transport of MPs primarily occurs, while deposition is more likely in low-velocity zones (such as river bends and shoals) [5]. Among these parameters, velocity gradient, turbulence intensity, and riverbed morphology collectively regulate the spatiotemporal distribution characteristics of MPs. For example, rough riverbed structures can enhance turbulent mixing in the near-bottom layer, promoting the secondary suspension of MPs; seasonal water level changes, on the other hand, can lead to the exchange between shoals and channels, resulting in the lateral redistribution of MPs [6,7].
As an important component of terrestrial freshwater systems, reservoirs alter flow regimes, water levels, and sediment transport patterns of natural rivers by altering water level fluctuations, flow velocity, and sediment deposition patterns, thereby profoundly influencing the evolution of river water environments [8]. By the end of 2023, China had built over 94,000 reservoirs [9]. While these reservoirs fulfill the function of water resource regulation, their unique operation mode of “storing clear water and discharging turbid water” has a significant impact on the migration and transformation of MPs. Specifically, during flood seasons—when floods are discharged and sediments flushed—large quantities of sediments carrying adsorbed MPs are transported downstream. By contrast, during non-flood seasons, especially the water storage phase, the low flow or stagnant conditions promote MP settlement and accumulation. Existing studies have shown that the slow-flow environment in reservoir areas significantly facilitates the vertical settlement of MPs by reducing water flow shear stress. However, drastic hydrodynamic changes during scheduling processes (such as flood discharge) may cause sediment resuspension, leading to the re-entry of settled MPs into the water column [10,11].
Across major river basins in China, MPs in reservoirs differ distinctly from one another in terms of particle size and morphological characteristics among different basins. Secondary MPs with a particle size of <1 mm (primarily originating from long-term physical fragmentation and chemical degradation of plastic products) dominate, which is associated with the longer hydraulic retention time in reservoirs that facilitates the further fragmentation of MPs [12]. The morphological distribution is characterized by a typical combination of fibers (mainly from the discharge of textile washing wastewater), fragments (mostly degradation products of packaging materials), and films (commonly derived from residual agricultural mulch entering the reservoir area via surface runoff) [13]. Source apportionment reveals that tributary input is the primary contribution pathway for MPs in the studied system. Additionally, atmospheric dry and wet deposition—including MP particles in industrial dust and urban fugitive dust—and agricultural non-point source pollution (mainly from the degradation of agricultural plastic films and fragmentation of fertilizer packaging) also serve as important supplementary sources [14]. However, existing studies on MP pollution in reservoirs have mostly focused on investigating the occurrence characteristics of individual reservoirs. Notably, against the backdrop of long-term and intensive water resource development, river systems have generally formed cascade reservoir group structures. This dense spatial layout may lead to the superimposition of environmental impacts from individual reservoirs, specifically manifested as the cascading amplification of spatial heterogeneity in hydrological elements such as runoff, sediment, and water temperature [15,16]. Whether this cumulative effect will significantly alter the migration and sedimentation patterns of MPs remains unclear, which in turn hinders the precise formulation of MP prevention and control strategies at the basin scale.
Addressing this issue, this study focused on the cascade reservoirs along the middle and lower reaches of the Han River, the largest tributary of China’s Yangtze River. Utilizing field investigations, we analyzed the occurrence characteristics and assessed their potential ecological risks of MPs in both the water and sediments of the reservoir system. The findings provide new insights into the transport behavior of MPs under the operational regime of cascade hydro power projects. They offer a valuable theoretical basis for precisely predicting MP transport fluxes in rivers and support the scientific management and control of MPs in the basin’s aquatic environment.

2. Materials and Methods

2.1. Study Area and Sample Collection

The middle and lower reaches of the Han River are situated in Hubei Province, China, extending 652 km from the Danjiangkou Reservoir to the Hankou Longwang Temple Hydrological Station. The basin covers an area of 64,000 km2 within the East Asian subtropical monsoon climate zone, characterized by abundant rainfall. The annual average runoff is 5.13 × 10¹⁰ m3, accounting for 7.2% of the Yangtze River’s water resources. However, flow distribution is highly uneven intra-annually, with summer-autumn floods being one of the most significant hydrological features. To date, 15 cascade reservoirs have been constructed along the main stream, including six hydraulic projects in the middle-lower reaches (i.e., W1-4 for Wangfuzhou, X1-4 for Xinji, C1-4 for Cuijiaying, Y1-4 for Yakou, N1-4 for Nianpanshan, and H1-4 for Xinglong), collectively raising water levels by over 6 m.
The study targeted the entire mainstem of the middle-lower Han River. Sampling was conducted at 24 cross-sections distributed upstream (below the dam of the previous cascade; one section), midstream (two sections), and downstream (ahead of the next dam; one section) between adjacent projects (excluding Xinglong Lock) (Figure 1). During the flood season (October 2023) and non-flood season (April 2024), 15 L of surface water was collected from the central channel at each section using stainless steel water samplers. Samples were immediately pre-filtered through a 300-mesh (48 μm) stainless steel sieve on-site. Sieve-retained material was rinsed with deionized water and transferred into 250 mL glass bottles.
Simultaneously, surface sediment samples (~1000 g wet weight) were collected from the central channel using a stainless steel grab sampler (32 cm × 21 cm). After homogenization, samples were wrapped in aluminum foil, sealed in plastic bags, and refrigerated at 4 °C for further processing.

2.2. Laboratory Procedures

Surface water digestion was performed by adding 50 mL of 30% H2O2 to samples in glass beakers [17]. After sealing with aluminum foil, the samples were digested at 50 °C for 24 h with stirring every 8 h. Following digestion, vacuum filtration (using a 0.45-μm glass microfiber filter membrane) was initiated when organic impurities were visually undetectable. Membranes were air-dried in Petri dishes at room temperature prior to microscopic examination.
Sediment samples were wrapped in kraft paper and dried in a drying oven at 60 °C until they reached a constant weight. After gentle grinding, macroscopic impurities (e.g., stones, twigs, shells) were manually removed. A 20 g aliquot was weighed for digestion. Added 30% H2O2 dropwise to the sediment aliquot in 5 mL increments (total ≤ 50 mL) until effervescence subsided. Digested in a 50 °C water bath for 48 h. Centrifuged the digestate at 4000× g for 5 min; supernatant was carefully decanted. Following oxidative digestion, density separations were sequentially performed using solutions of NaCl (1.15 g/cm3) and ZnCl2 (1.59 g/cm3). Each separation involved 1 min vortex mixing and centrifugation at 4000× g for 5 min, with two replicate extractions per density solution. Pooled supernatants were filtered through pre-weighed 0.45 μm membranes, which were subsequently dried to constant weight prior to polymer identification.
Potential MP particles on filter membranes were isolated using a Zeiss Stemi 2000-C stereomicroscope (Carl Zeiss AG, Oberkochen, Germany) coupled with an imaging system. Morphological attributes-including color, size (μm), and shape-were documented during visual inspection. The polymer composition was determined using a DXR3XI micro-Raman imaging spectrometer (Thermo Fisher Scientific, Waltham, MA, USA, with a 532 nm laser, and a Raman shift 50–3500 cm−1). Acquired spectra were calibrated against reference spectral libraries for qualitative identification.

2.3. Ecological Risk Calculation

An ecological risk assessment of MPs pollution in aqueous and sedimentary matrices of cascade reservoirs along the middle-lower Han River was conducted using the Potential Ecological Risk Index (PERI) and Pollution Load Index (PLI) [18,19]. The PERI was used to assess the potential risk levels of plastic polymers based on the MP abundance in samples from the study area and in conjunction with the hazard coefficients of various plastic polymers (Table 1). The equation was as follows [20]:
E r i = T r i × C i / C r i
T r i = S i × P i / C i
PERI   =   i = 1 n E r i   =   i = 1 n T r i   ×   C i / C r i
where Pi is the abundance of MP polymer at site i. Ci represents the measured total MP abundance (n·kg−1). C r i denotes the reference value. In this study, the value 6650 particles/m3, representing the predicted no-effect concentration (PNEC) for MPs in surface water bodies estimated by Everaert et al. (2018) using mathematical modeling, was selected as the reference value [21]. For MPs in sediment, 540 n·kg−1 was adopted as the reference background value. T r i is the toxic response factor, calculated as the sum of the percentage of plastic polymer i relative to the total abundance multiplied by its hazard index. E r i is the potential ecological risk index, and n represents the number of MP polymer types present in the sample. The ecological risk levels represented by the PERI are classified into the following five grades. PERI < 10 is level I risk, 10 ≤ PERI < 100 is level II risk, 100 ≤ PERI < 1000 is level III risk, and PERI > 1000 is level IV risk.
The PLI took the abundance of MPs as the main indicator to assess the overall pollution situation [24]. The equation was as follows:
C F i = C s / C n
P L I i = C F i
P L I z o n e = P L I 1 × P L I 2 P L I n n
where C s represents the measured total MP abundance (n·kg−1). C n denotes the reference value (n·kg−1). P L I i represents the MP pollution load index at site i. P L I z o n e denotes the MP pollution load index for the entire study area. Pollution levels are classified as follows: PLI < 1 indicates low pollution; 1 ≤ PLI ≤ 2 indicates moderate pollution; and PLI > 2 indicates high pollution.

2.4. Data Processing and Analysis

Sampling site distribution maps were generated in QGIS v3.36.3 based on GPS coordinates of collection points. Statistical analyses and graphical visualizations were performed using Microsoft Office 2021 along with Origin 2024 (OriginLab Corporation, Northampton, MA, USA).

3. Results and Discussion

3.1. Abundance Distribution of MPs

This study investigated MP abundance in surface water and sediment across the middle-lower Han River during flood and non-flood seasons. MPs were ubiquitously detected (100% occurrence) in both surface water and sediment at each site. Waterborne MP concentrations spanned 609–5333 n/m3 (flood) and 200–3600 n/m3 (non-flood), while sedimentary MPs ranged 226–2018 n/kg (flood) and 50–650 n/kg (non-flood).
The cascade reservoir system of the middle-lower Han River displayed distinct longitudinal MP distribution patterns between hydrological seasons. During flood season, waterborne MP concentrations exhibited a marked downstream increase (2000–3000 n/m3), with minimum levels at Xinji Dam and peak accumulation at the confluence of the Yangtze River (Figure 2a). This gradient reflects (1) cumulative pollutant loading [25], (2) the reduction in flow velocity caused by dam structures [26], and (3) intensified anthropogenic impacts downstream [27].
The non-flood period showed significantly reduced MP abundances (200–3600 n/m3, Figure 2b), ranking lower than comparable Chinese rivers [28]. Lower velocity during the non-flood period, combined with no additional pollutant input, resulted in the sedimentation of MPs from the water phase to the sediment. Therefore, the abundance of MPs along Wangfuzhou, Xinji, Cuijiaying, and Yakou Dams showed a slowly decreasing pattern. The surge of MP abundance in the water at the Nianpanshan Dam could be explained by the surrounding agricultural, industrial activities, and domestic sewage, as well as plastic wastes from Zhongxiang City. Compared with the abundance of MPs in the surface headwater of the Yangtze River (the largest tributary of which is the Han River; 247–2686 n/m3) [29], and riverine waters of the Tibetan Plateau region (where the Yangtze River originates; 483–967 n/m3) [30], the abundance of MPs in the middle and lower reach of Han River was higher. However, compared with other Chinese rivers, such as the mainstream of the Yangtze River (21–44,080 n/m3) [31] and the Pearl River along Guangzhou city (8725–53,250 n/m3) [32], it was relatively low.
In the sediments, during the flood period, MPs were more abundant at the Wangfuzhou Reservoir section (~1200 n/kg) and Cuijiaying Reservoir section (~1500 n/kg). It is attributed to the proximity to Xiangyang City, the second-largest economic hub in Hubei Province. The region’s dense population, intensive industrial activities, and consequent discharge of domestic sewage, industrial effluent, and agricultural runoff may constitute persistent sources of MP pollution [33]. During the non-flood period, the MP distribution pattern remains largely consistent, with Wangfuzhou (~400 n/kg) and Cuijiaying sections (~400 n/kg) sustaining elevated levels. The persistent peak observed at Cuijiaying across both hydrological periods suggested that river hydrodynamics play a subordinate role in MP accumulation, further corroborating the presence of speculative constant input sources in this region. The abundance of MPs in the sediments in this study was higher than recorded in the Yellow River Delta wetlands (20–520 n/kg) [34] and the Yangtze River estuary (20–340 n/kg) [35], yet lower than the levels detected in the Pearl River estuary sediments (100–7900 n/kg) [36]. Overall, the observed MP concentration in sediments in this research represents a moderate level within the context of China’s aquatic environments [37].

3.2. Morphological Characteristics of MPs

3.2.1. Form

One essential aspect for defining MPs is their types/shapes/forms. In this study, different forms of MPs are categorized according to a consensus definition [38]. As illustrated, six distinct morphological types of MPs were detected in water samples during the flood season: foams, microbeads, pellets, films, fibers, and fragments. The detection rates for foam, microbead, and pellet-shaped MPs were relatively low (3.37%, 15.7%, and 33.7%, respectively), appearing only sporadically at specific sampling points and minimal proportional representation (0.3%, 2.2%, and 9.0%, respectively).
During the flood period (Figure 3a and Figure S3a), fragmentary MPs predominated in water, accounting for 19% to 71% across all sampling sections, with notable spatial variability but no monotonically increasing/decreasing or bell-shaped distribution pattern from upstream to downstream. Fibrous MPs followed in abundance, detected at all sites except N2, ranging from 0% to 55% in proportion, also lacking a clear distribution trend. Film-shaped MPs exhibited a generally higher detection rate, absent only at X4, C4, and Y3, with notably elevated proportions at N2 (75%), N3 (45%), and N4 (71%). MP pellets and microbeads were infrequently detected, appearing only at isolated locations, typically constituting less than 20% of the total.
During the non-flood period (Figure 3b and Figure S3b), fibrous MPs became the dominant form in water, reaching 100% detection frequency and substantial proportional representation, ranging from 50% to 100% across all sampling sites. Fragmentary MPs followed, accounting for 0% to 50%. Spherical and film-shaped MPs were rarely detected: spherical types appeared solely at X2 (7.7%), while film types were limited to X1 (40%).
As for the MPs in the sediments, 5 forms (fragments, fibers, films, pellets, and microbeads) were detected (Figure 3c,d and Figure S3c,d). Overall, fragmentary and fibrous MPs were the most abundant. Most plastic microbeads were detected during the flood period and accounted for a relatively low proportion. During the flood period, fragmentary MPs accounted for 31–86% of MPs, and fibrous MPs accounted for 6–46% at each sampling site. At C2 and Y1, pellets contributed more than 50% of all MPs. During the non-flood period, fragmentary MPs were the most prevalent and were not present only in W2 and X4. MP pellets were presented in 36% samples and peaked at Y1 with a relative abundance of 67% (Figure S3d). Microbeads were observed only in H2 with a relative abundance of 14% (Figure S3d).
Abundant MP pellets detected in both water and sediment in Y1 indicated the domestic sewage contributing to the distribution of MPs, as MP pellets were broadly used in cosmetic products [39]. In addition, the source of abundant MP films at C4, Y3, and H2 was attributed to the degradation of plastic food packaging bags and agricultural plastic mulch films [40], indicating potentially high levels of agricultural contamination in the area.

3.2.2. Color

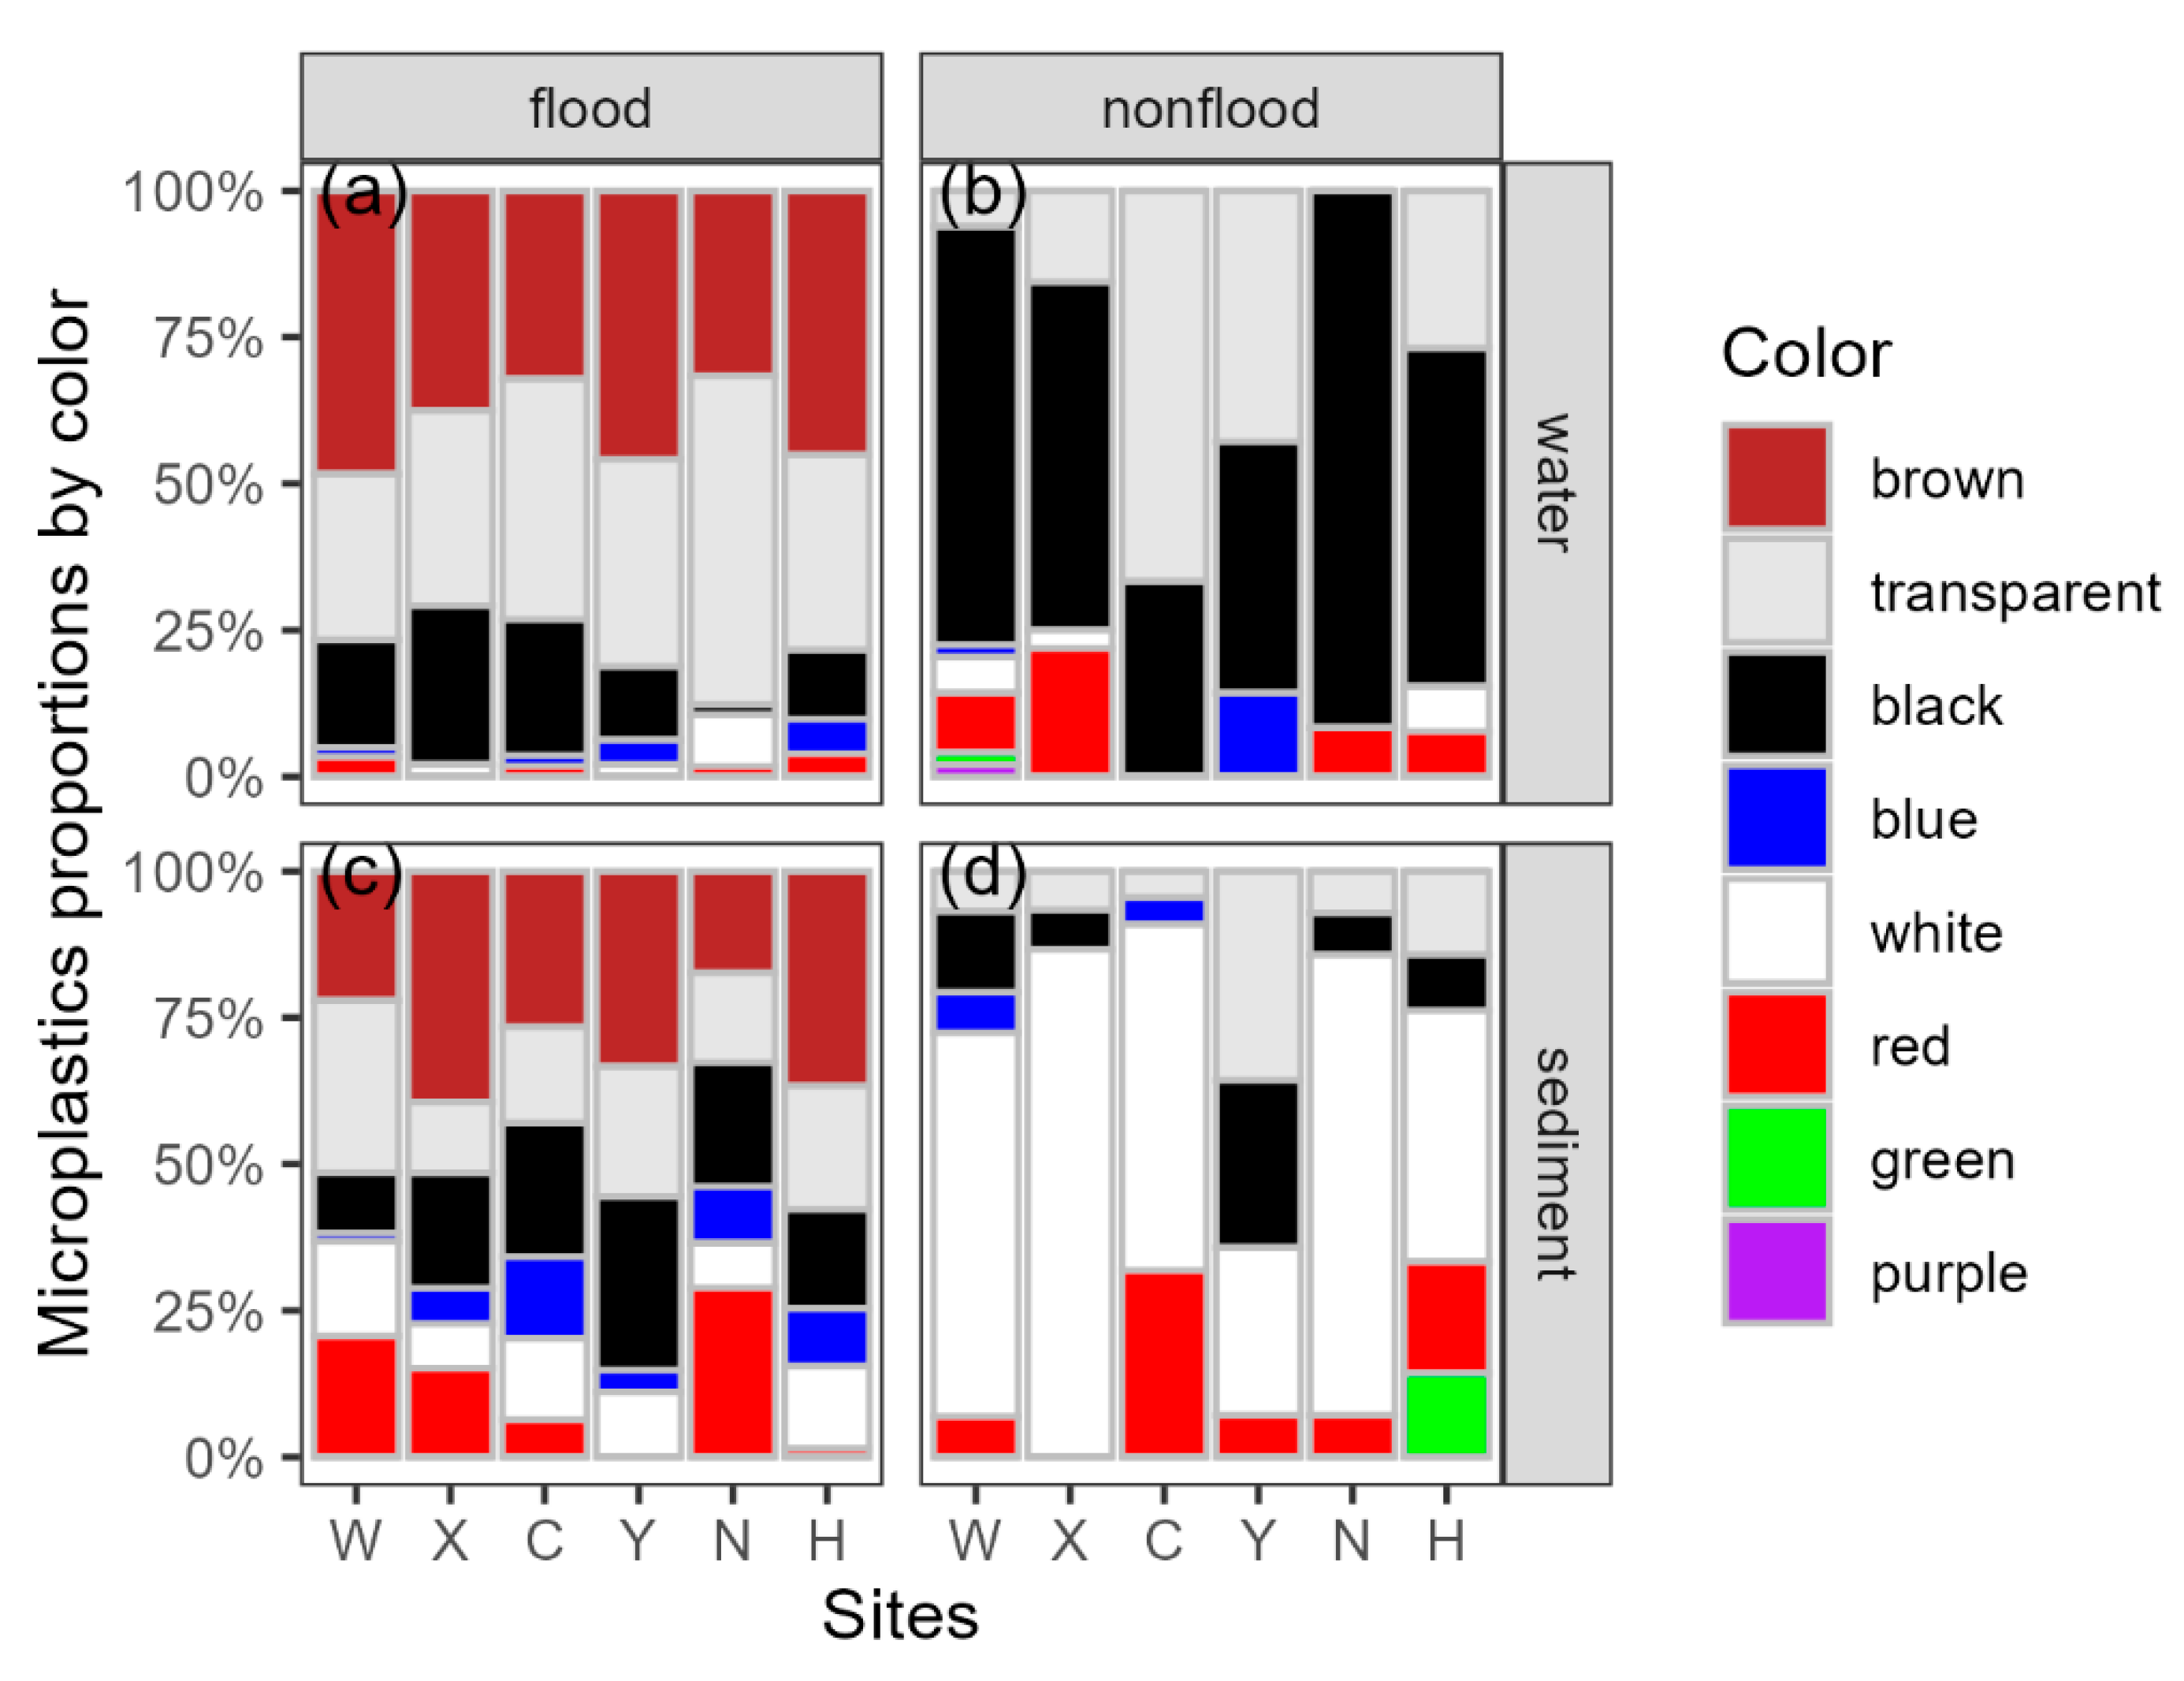
In this research, various colors of MPs, including brown, transparent, black, blue, white, red, green, and purple, were observed at different sites in river waters. As demonstrated in Figure 4a and Figure S4a, during the flood period, brown was the most common color of MPs in water, ranging from 17 to 63% at each site, followed by transparent (18–68% at each site) and black (0–36% at each site). Blue, white, and red MPs were only detected in a few sites with a relatively low abundance. During the non-flood period, as illustrated in Figure 4b and Figure S4b, black MPs were the most prevalent and were detected in all but 3 samples with relative abundances ranging from 33% to 100%. Transparent MPs were the second most prevalent, with a relative abundance of 3–100%. Other colors, such as white, blue, purple, and green, were only found in very few samples with low abundances. Comparing the colors of MPs in water during different periods, a higher variation in microplastic coloration between adjacent sampling sites was found during the non-flood period. We hypothesize that enhanced hydrological dynamics during the flood season homogenize water bodies in the middle and lower reaches of the Han River, facilitating the downstream transport of MPs and increasing the compositional similarity across samples. Conversely, during the non-flood period, reduced flow velocities likely promote the settlement of MPs to the sediment.
In sediments, during the flood period (Figure 4c and Figure S4c), brown MPs were the most prevalent, accounting for 0–66% of MPs in each sediment sample, followed by transparent (0–53%) and black (0–57%) MPs. During the non-flood period (Figure 4d and Figure S4d), white MPs made up the majority with relative abundances ranging from 14 to 100% in 19 samples, and red ones followed with 0–100% in 8 samples. Transparent MPs were detected in only 7 samples, with proportions ranging from 9% to 66% in these samples. Green and blue MPs were only found in 1 and 2 samples, respectively, while no brown or purple MPs were detected. Comparing MPs collected from sediment samples in different periods, similar to water samples, a higher similarity across different sites was observed in the flood period, validating the previously proposed hypothesis that the decrease in flow velocity in the non-flood period hindered the transportation of MPs from upstream to downstream, and resulted in higher differences in color among sediment samples taken during the non-flood period.

3.2.3. Particle Size

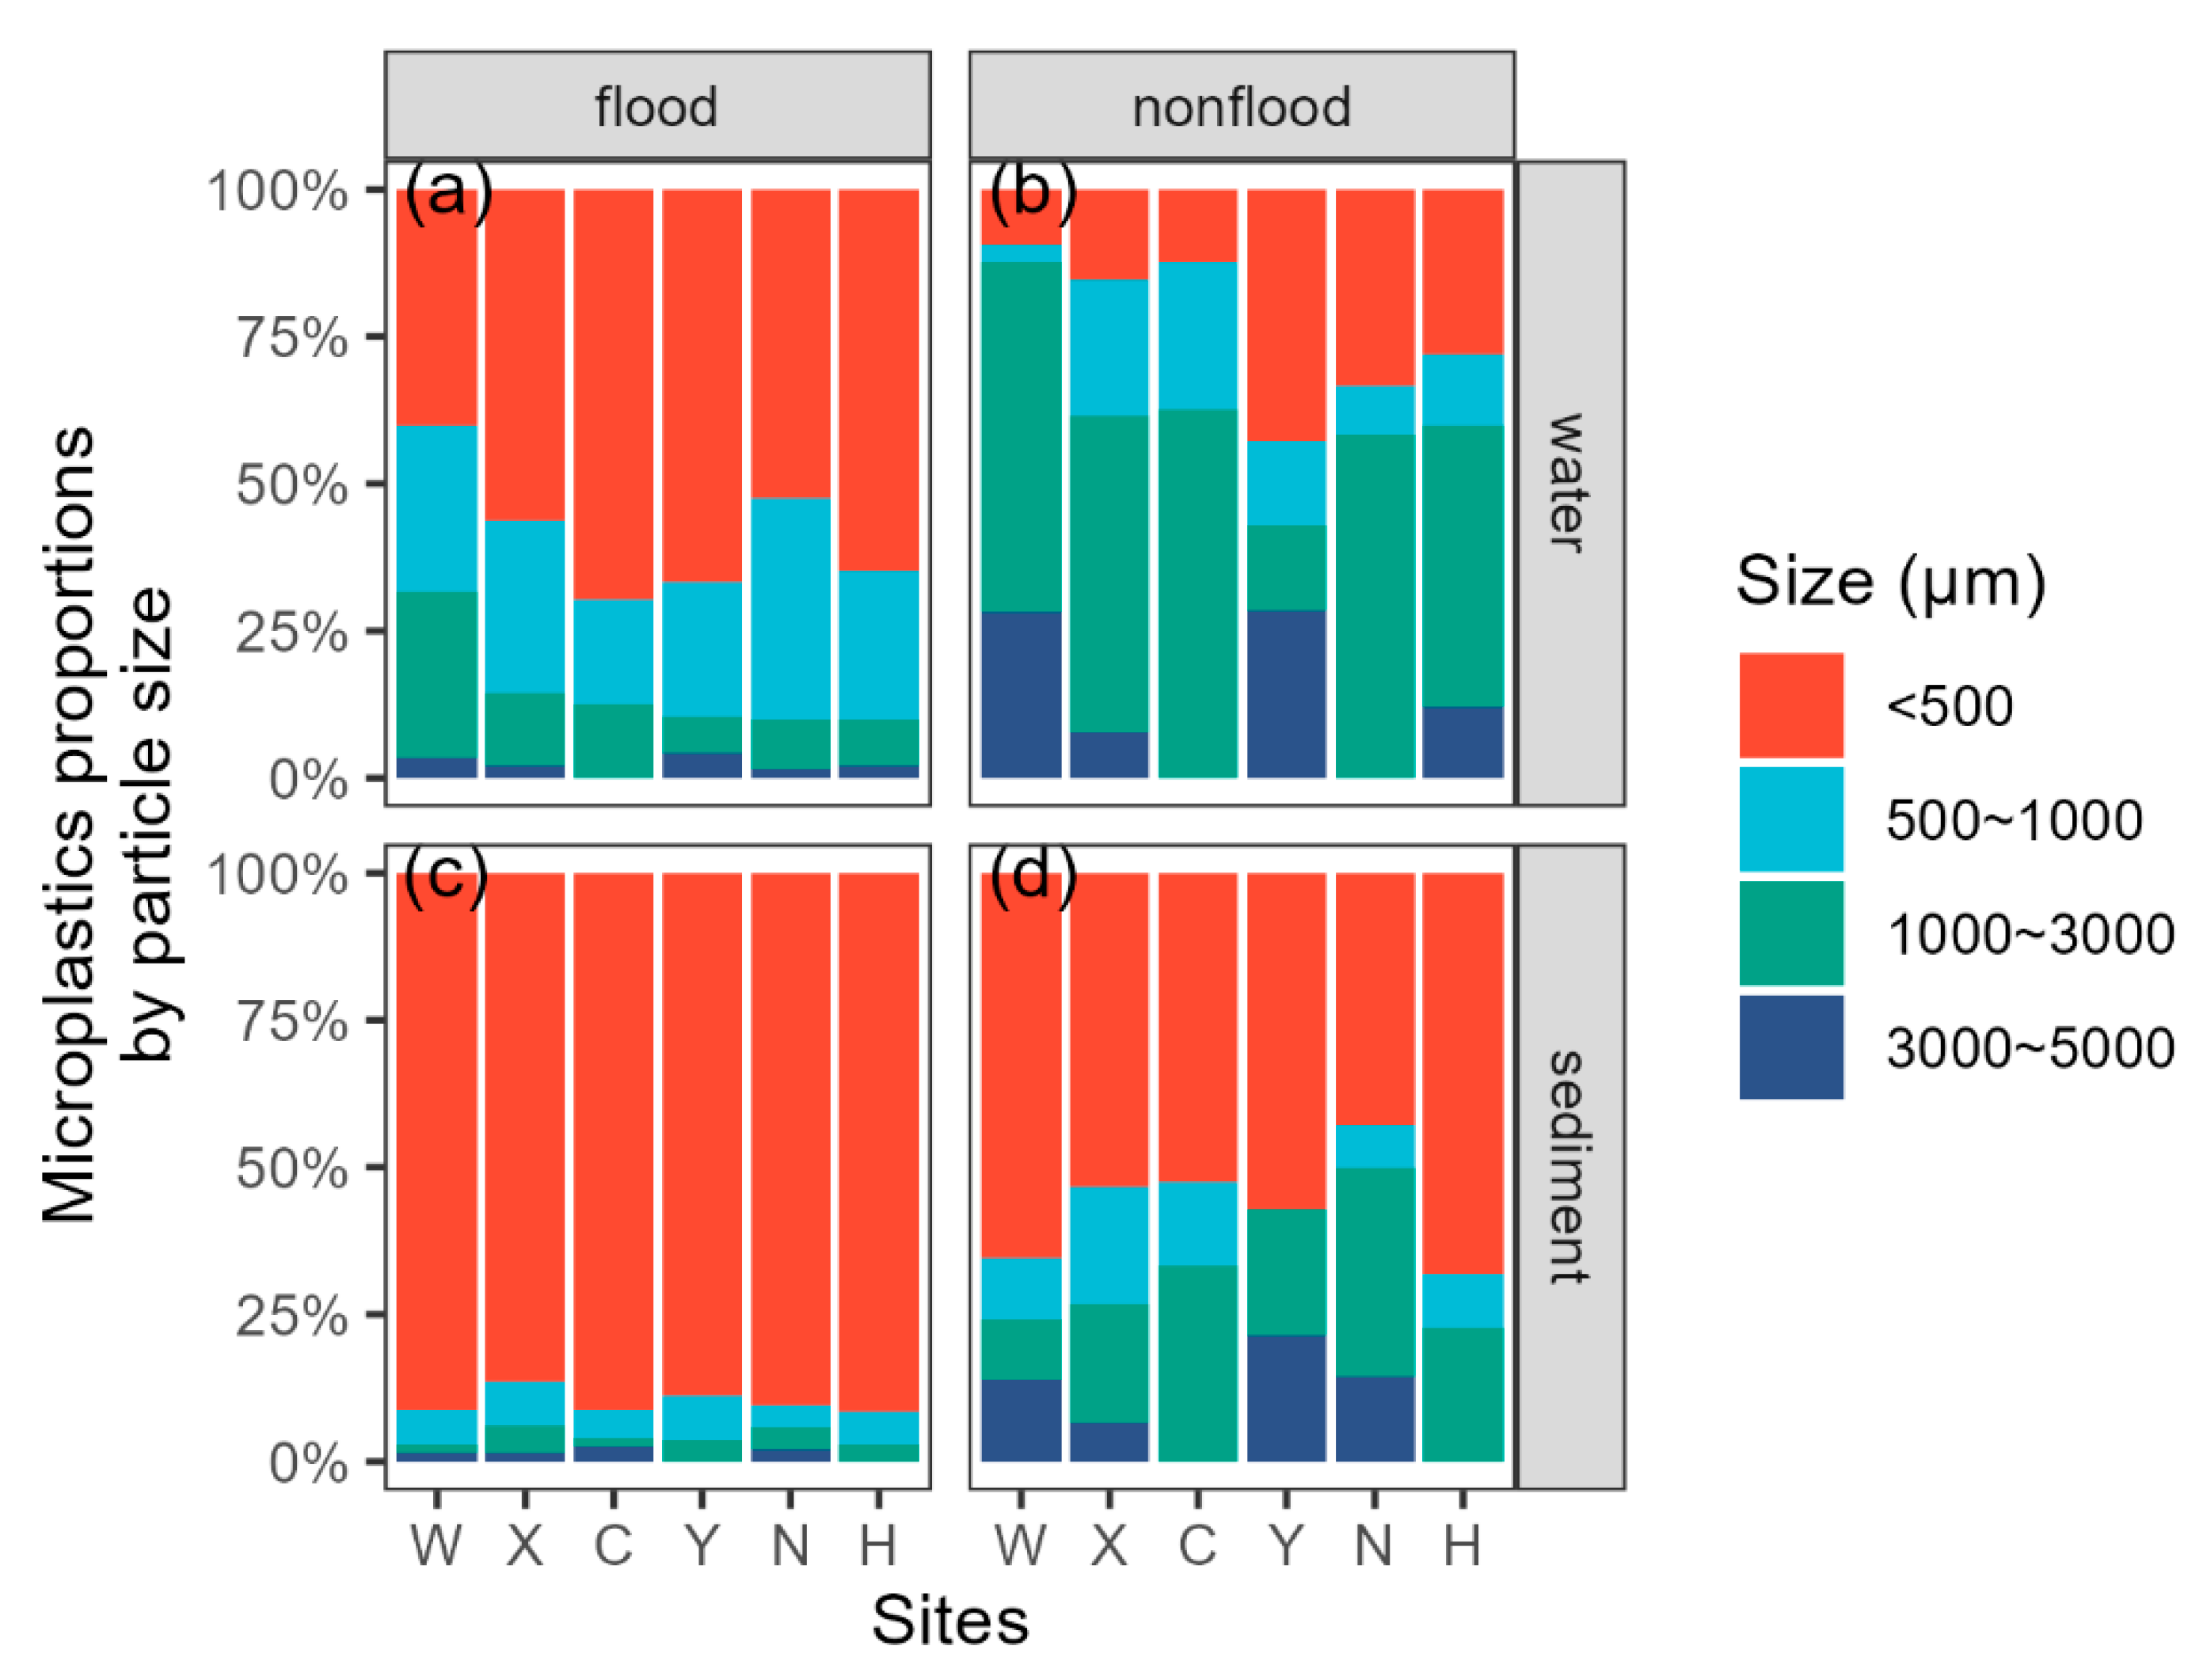
Visualized in Figure 5a,b and Figure S5a,b, most MPs had a smaller particle size, and during the flood period, MPs with a size less than 500 µm accounted for the largest proportion. During the flood period, with more intensified hydrodynamic forces, larger MPs are more susceptible to fragmentation, resulting in smaller MP particles.
In sediments (Figure 5c,d and Figure S5c,d), MPs with a size less than 500 µm took the majority in both flood and non-flood periods with a proportion of 65–100%. Focusing on the MPs less than 500 µm, their proportions in sediment (65–100%) are higher than those in water (30–90%), and they were more abundant during the flood period (82%) than during the non-flood period (63%).

3.3. Materials of MPs

During the flood season survey, seven different materials of MPs were identified in water, including polycarbonate (PC), polypropylene (PP), polyethylene terephthalate (PET), polyamide (PA), polyethylene (PE), and ethylene vinyl acetate copolymer (EVA). Among these, the three most prevalent types, PA, PE, and PP, accounted for 48%, 24.5%, and 13.5%, respectively (as illustrated in Figure 6a). Conversely, in the non-flood season, five types of MPs were detected in water in the middle and lower reaches of the Han River: PET, PE, PP, PA, and polystyrene (PS). Notably, PET dominated the composition, representing 89.4% of the total, respectively (Figure 6b).
PA is typically derived from synthetic fibers such as nylon. These fibers shed during laundering and industrial processes, ultimately entering natural water bodies through wastewater treatment systems. Due to their chemical properties, they exhibit significant resistance to natural degradation [41]. PE is widely employed in plastic wrap, shopping bags, storage containers, buckets, and water bottles. PP frequently originates from packaging materials, strapping bands, bottle caps, gears, belts, as well as mechanical and automotive components. PS was only detected during the non-flood period, indicating the relevance to certain seasonal anthropogenic activities (e.g., tourism), which might increase the release of certain polymer compositions of MPs.
Overall, the findings align with previous reports documenting the predominant MP components detected in the Danjiangkou Reservoir and its tributaries [12chenyuling], effectively reflecting the production and consumption patterns of various polymer types. According to the “MP Source-Specific Classification System” proposed by Wang et al. (2019), the primary sources of MPs in the middle and lower reaches of the Han River can be attributed to domestic wastewater discharge, the application of paints and adhesives, as well as improper disposal of fishing gear [42]. Secondary MPs generated during household textile activities such as laundry frequently enter aquatic systems either directly or indirectly through sewage pathways, thereby exacerbating water pollution.
In the sediments, five types of polymers from MPs were identified during the flood period (Figure 6c), including PA, PE, PP, PET, and PC. Among these, PC, PP, and PET predominated, accounting for 40.5%, 24.0%, and 15.6%, respectively. In contrast, the non-flood season sediments contained different MP compositions: PET, PP, PS, PA, and PE (Figure 6d). Among them, PET, PP, and PS were the most abundant, taking 46.0%, 30.2%, and 11.1%, respectively. The presence of PS during the non-flood season can be attributed to seasonal human activities, such as tourism, which amplify the discharge of certain MP types [43].
From a broader perspective, denser MPs, PC (1.2–1.6 g/cm3), and PET (1.38–1.41 g/cm3) dominated the sediment polymer composition of MPs. This predominance stems from their propensity to settle in low velocity conditions, where fine-grained sediments further facilitate their deposition and adsorption. Nevertheless, lighter MPs like PP (0.89–0.92 g/cm3) still constituted a notable proportion, accounting for 24% in the flood season and 30% in the non-flood season. This occurrence can be explained by PP particles adsorbing organic matter, sediment grains, or heavy metals, thereby increasing their effective density and enabling their sedimentation [44].
Based on the “MP Source-Specific Classification System” proposed by Wang et al. (2019) [42], the primary origins of MPs in the middle and lower reaches of the Han River include textile fibers discharged via wastewater or surface runoff. Given their higher densities (PC: 1.19 g/cm3, PET: 1.38–1.41 g/cm3), these polymers are more likely to settle from the water column and accumulate in the sediments [45].

3.4. Source Analysis of MPs

During the flood period, the spatial distribution patterns of MPs were significantly influenced by the hydrodynamic forces. Due to continuous inputs of domestic sewage from urban residential areas, the proportion of polyamide (PA) in the water from the downstream section of the Danjiangkou Dam (W1) to the Wangfuzhou segment (W2–W3) reached 48%. Strong hydrodynamic forces reduced the abundance of MPs in sediments (226–450 n/kg) in this region due to resuspension. The simultaneous enrichment of polycarbonate (PC, 40.5%) and polyethylene terephthalate (PET, 30.5%) was shown in the Cuijiaying segment (C2–C3) during the flood period, which was directly attributed to the downstream transport of industrial emissions from Xiangyang City under strong flow conditions. Additionally, there was a significant increase in spherical polystyrene (PS, 55%) at the downstream section of the Yakou Dam (Y1), indicating the significant impact of the input from fishery waste caused by heavy rainfall. The Nianpanshan segment (N2–N4) was mainly contaminated by a combination of PE films (71%) and fibrous PA (35%) during the flood period, which could be speculated to reflect the co-effect of agricultural non-point source pollution as well as urban domestic sewage [46]. Moreover, the MP pollutants are transported rapidly from the Wuhan urban agglomeration under flood conditions [47], resulting in MP abundance reaching 5333 n/m3, with PET accounting for 42% at Hankou section (H4).
During the non-flood period, the slow velocity of water flow promoted the dominance of MP settlement. The proportion of PA in sediments from the upstream Wangfuzhou Dam (W2–W3) increased to 52%, indicating the continuous accumulation of domestic-source MPs. Moreover, at downstream of the Cuijiaying Dam (Y1), the proportion of PS in sediments increased to 67% during non-flood periods, reflecting the sedimentation and accumulation of fishery waste. Notably, the green film-like MPs (43%) identified as ship paint fragments via FTIR were detected only in Shayang (H2) during non-flood periods, indicating the localized accumulation of shipping pollutants under low-flow conditions [48]. Additionally, the persistently high proportions of PC (38%) and PET (42%) in sediments at the Hankou section (H4) reflected the long-term cumulative effect of industrial pollutants during non-flood periods.
In summary, it can be clarified that the MP pollution in the Danjiangkou Reservoir follows an “upstream input-reservoir accumulation-downstream output” transport pattern. Upstream urban residential (W1–W3) and industrial areas (X1–X4) are the primary pollution sources, with MPs significantly accumulating in the reservoir (C1–Y4) due to hydrological retention. Ultimately, MPs are transported downstream to the Yangtze River main stream via the Nianpanshan segment (N2–H4).

3.5. Ecological Risk Assessment of MPs

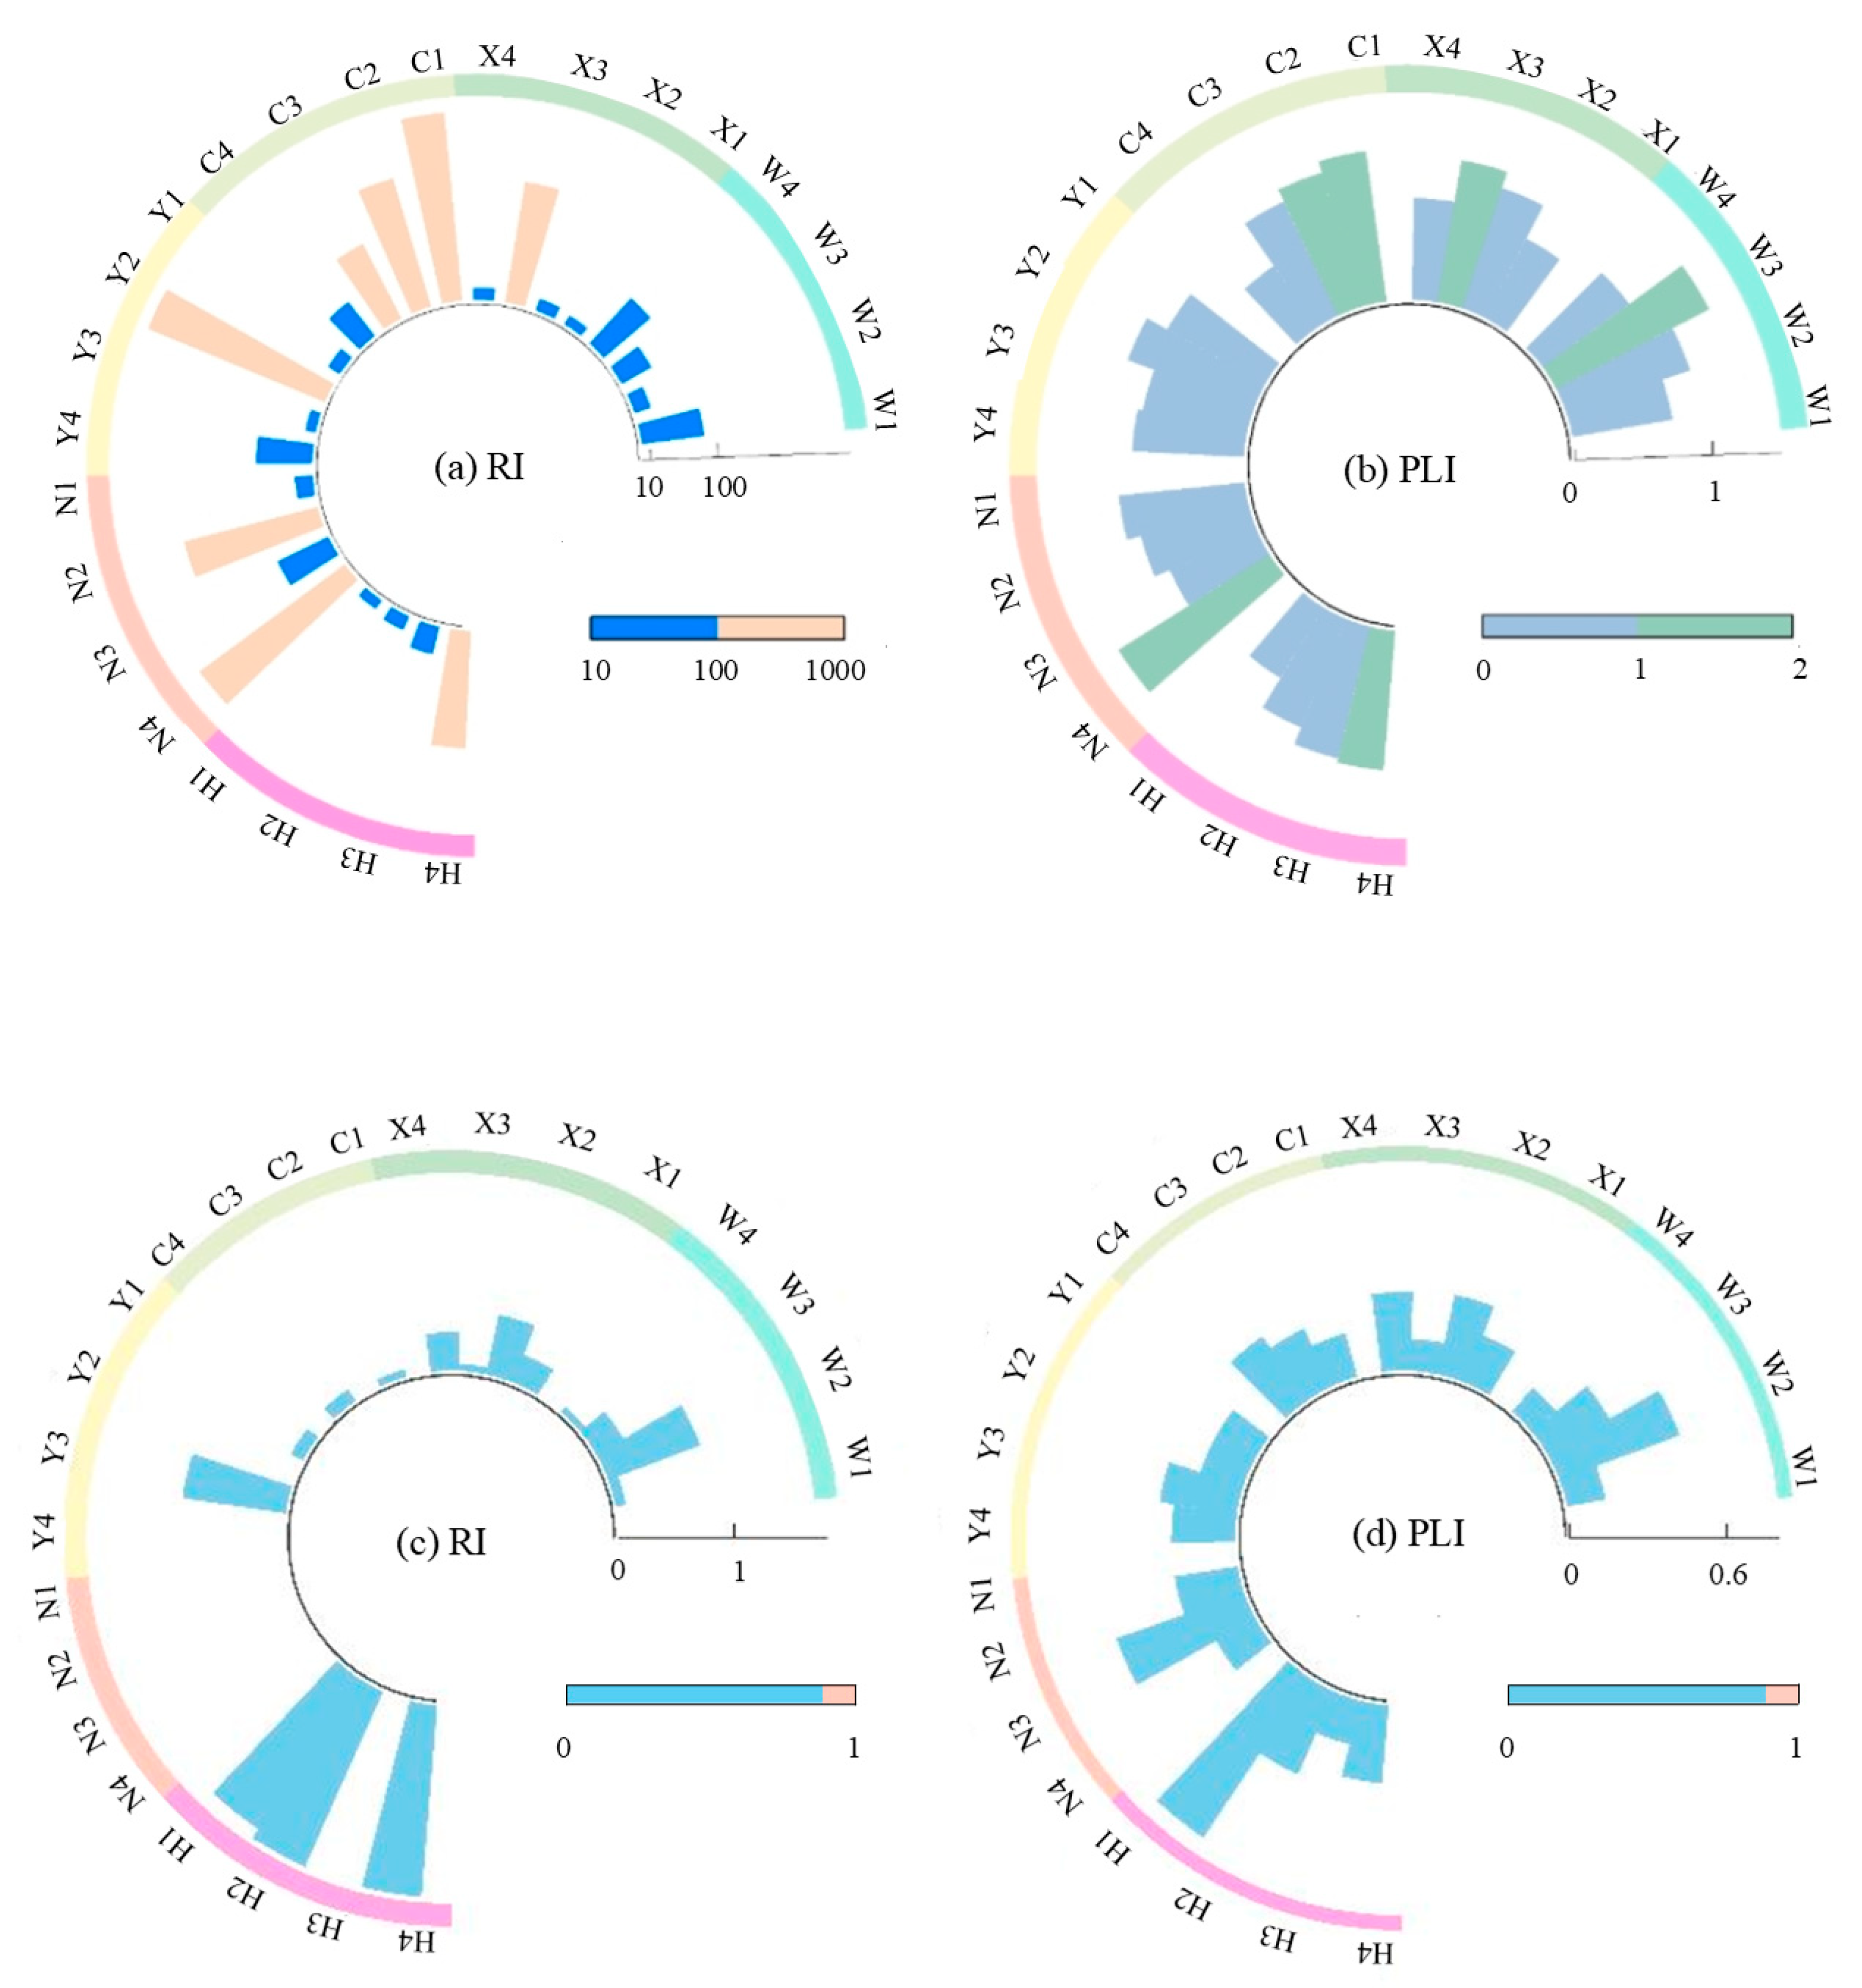
The calculated results of the PERI for MPs in water bodies are presented in Figure 7a,b. During flood seasons, the MP loads in the middle and lower reaches of the Han River were at Levels II–III risk, with PERI values ranging from 13.31 to 254.46, indicating a moderate pollution level. Spatially, the PERI values between Danjiangkou Dam and Wangfuzhou Dam remained below 100 with Level II risk. Along the cascade reservoir system, the PERI value presented an increasing trend, reaching a maximum value in the Yakou Dam section (Level III risk). The PLI values of MPs ranged from 0.55 to 1.30 during flood periods, representing low to moderate pollution levels. Specifically, the Nianpanshan and Cuijiaying segments showed the highest and lowest PLI value, respectively. The overall regional PLIzone value was 0.86, indicating a low pollution level.
In contrast, during non-flood periods, the MP pollution load in the middle and lower reaches of the Han River demonstrated Level I risk, with RI values ranging from 0.06 to 1.65 (Figure 7c,d). Spatially, RI values in the middle reaches were consistently below 1, while those in the lower reaches ranged between 1 and 10, with low risk levels.
These findings demonstrated that the substantial rainfall during flood seasons led to significantly increased surface runoff, which transported greater quantities of MPs from terrestrial environments, urban drainage systems, and waste accumulation sites into aquatic systems. Consequently, the ecological risks associated with MPs were markedly higher during flood seasons compared to those during non-flood periods. Furthermore, the rapid influx of MPs during flood events increased their abundance in river systems [49]. The enhanced flow velocities during floods also promoted the dispersion of MPs (Figure 2a,b), facilitating their rapid transport through river networks and increasing the potential to interact with various ecosystem components, thereby elevating the ecological risks. Additionally, the strong hydrodynamic forces during floods could cause sediment resuspension, which not only increases the concentration of MPs in the water column but may also accelerate their aging and fragmentation processes, leading to the formation of smaller, more bioavailable nanoplastics that could pose greater ecological hazards [50].
The RI calculations for MPs in sediments (Figure 8a) showed that during flood seasons, the pollution load in the middle and lower reaches of the Han River was at Levels II–IV risk, with RI values ranging from 95.44 to 2123.97. The Yakou segment and the Nianpanshan segment showed the lowest and highest RI values, respectively. The PLIzone value was 1.16 for the region (Figure 8b), indicating a moderate pollution level. Specifically, during autumn floods, sediment PLI values ranged from 0.53 to 1.93, indicating low to moderate pollution, with the Yakou segment being the least polluted and the Cuijiaying Dam segment the most polluted.
During non-flood periods, sediment MP pollution loads were at Levels I–II risk, with RI values ranging from 0.09 to 13.61 (Figure 8c). Notably, only the risk in Cuijiaying (C2) was at Level II. The regional PLIzone value was 0.64 (Figure 8d, low pollution), with only the downstream area of Danjiangkou Dam (W1) and Cuijiaying (C2) showing PLI values greater than 1 (moderate pollution).
It can be speculated from the results that the potential health risk of MPs in sediments is greater than that in the original water bodies due to the interception and accumulation processes. Sediment-associated MPs are typically dominated by smaller particles (0–300 μm), which can be easily ingested by benthic organisms, especially when they are resuspended by strong hydrodynamics, transmitted through the food chain, and then harm organisms at higher trophic levels, thereby increasing ecological risks [51]. In addition, it should be noted that there were some limitations of the presented methods, such as different toxicological mechanisms of microplastics with heavy metal pollutants, and difficulty in considering the physical properties of microplastics, which would make it hard to fully guarantee the accuracy of the evaluation results. Further studies should develop a comprehensive evaluation system.

4. Conclusions

In this study, the characteristics of MPs in the Hanjiang River were explored under the operation of dams in the middle and lower reaches. The main types and shapes of MPs during the flood season and the non-flood season were different. Meanwhile, the ecological risk of microplastic pollution was assessed. The main conclusions are as follows:
  • The higher microplastic abundance in both water and sediment during the flood period is driven by intense runoff washing terrestrial debris (e.g., packaging, agricultural film) into the river, explaining the prevalence of PA, PE, PP, and PC fragments.
  • In the non-flood period, point sources such as wastewater effluent result in a high release of PET. Microplastics accumulated downstream, forming local hotspots near the dam (e.g., Cuijiaying) due to the continuous input and deposition.
  • Microplastics with a small size and good bioavailability accumulate in sediments during flood periods and amplify in the food chain after ingestion by benthic organisms, leading to higher ecological risk.
These findings can provide guidance for assessing the ecological risk of microplastics under the operation of Cascade Reservoirs. Based on the characteristics, it is recommended that the management of waste discharge from fisheries, agriculture, and industrial activities should be strengthened. Further work will focus on the migration mechanism and the environmental behavior of MPs to clarify their environmental fate and ecological effects.

Supplementary Materials

The following supporting information can be downloaded at: https://www.mdpi.com/article/10.3390/w17192793/s1, Table S1: The name, number and coordinates of the sampling points; Table S2: Abundance Dis-tribution of Microplastics; Table S3: Size distribution of Microplastics.; Figure S1: The example of photos obtained with stereomicroscope; Figure S2: Typical Raman spectra of PP (a) and PE (b) from the middle and lower reaches of the Han River; Figure S3: The proportion of different shape of MPs in (a~b) water columns and (c~d) sediments during different period; Figure S4: The proportion of different color of MPs in (a~b) water columns and (c~d) sediments during different period; Figure S5: The proportion of different size of MPs in (a~b) water columns and (c~d) sediments during different period.

Author Contributions

R.Z.: conceptualization, writing—original draft. Z.G.: methodology, writing—editing. L.L.: conceptualization, writing—review. X.P.: software, writing—editing. Y.G.: software, writing—editing. Y.L.: investigation. All authors have read and agreed to the published version of the manuscript.

Funding

This study was supported by the Natural Science Foundation of Hubei Province of China for Distinguished Young Scholars (No.2023AFA056), the National Natural Science Foundation of China (No.52200224), and the State-level Public Welfare Scientific Research Institutes Basic Scientific Research Business Project of China (No. CKSF2022253/SH).

Data Availability Statement

The original contributions presented in this study are included in the Supplementary Material. Further inquiries can be directed to the corresponding author.

Acknowledgments

The authors are grateful to all research staff who contributed to the data collection required for this study.

Conflicts of Interest

The authors declare that they have no known competing financial interests or personal relationships that could have appeared to influence the work reported in this paper.

References

  1. Thompson, R.C.; Courtene-Jones, W.; Boucher, J.; Pahl, S.; Raubenheimer, K.; Koelmans, A.A. Twenty years of microplastics pollution research-what have we learned? Sci. Total Environ. 2024, 386, 6720. [Google Scholar] [CrossRef]
  2. Agrawal, M.; Vianello, A.; Picker, M.; Simon-Sánchez, L.; Chen, R.; Estevinho, M.M.; Weinstein, K.; Lykkemark, J.; Jess, T.; Peter, I.; et al. Micro- and nano-plastics, intestinal inflammation, and inflammatory bowel disease: A review of the literature. Sci. Total Environ. 2024, 953, 176228. [Google Scholar] [CrossRef]
  3. De Sá, L.C.; Oliveira, M.; Ribeiro, F.; Rocha, T.H.; Futter, M.N. Studies of the effects of microplastics on aquatic organisms: What do we know and where should we focus our efforts in the future? Sci. Total Environ. 2018, 645, 1029–1039. [Google Scholar] [CrossRef]
  4. Li, Y.F.; Ling, W.; Hou, C.; Yang, J.; Xing, Y.; Lu, Q.B.; Wu, T.Q.; Gao, Z.Y. Global distribution characteristics and ecological risk assessment of microplastics in aquatic organisms based on meta-analysis. J. Hazard. Mater. 2025, 491, 137977. [Google Scholar] [CrossRef]
  5. Lu, X.R.; Wang, X.L.; Liu, X.; Singh, V.P. Dispersal and transport of microplastic particles under different flow conditions in riverine ecosystem. J. Hazard. Mater. 2023, 442, 130033. [Google Scholar] [CrossRef] [PubMed]
  6. Chen, L.M.; Li, J.P.; Tang, Y.Y.; Wang, S.Q.; Lu, X.; Cheng, Z.W.; Zhang, X.Y.; Wu, P.F.; Chang, X.Y.; Xia, Y. Typhoon-induced turbulence redistributed microplastics in coastal areas and reformed plastisphere community. Water Res. 2021, 204, 117580. [Google Scholar] [CrossRef] [PubMed]
  7. Xia, F.Y.; Yao, Q.W.; Zhang, J.; Wang, D.Q. Effects of seasonal variation and resuspension on microplastics in river sediments. Environ. Pollut. 2021, 286, 117403. [Google Scholar] [CrossRef] [PubMed]
  8. Ji, P.; Yuan, X.; Jiao, Y. Future hydrological drought changes over the upper Yellow River basin: The role of climate change, land cover change and reservoir operation. J. Hydrol. 2023, 617, 129128. [Google Scholar] [CrossRef]
  9. Guo, D.; She, J. (Eds.) National Bureau of Statistics of China (2023); China Statistical Yearbook; China Statistics Press: Beijing, China, 2023. [Google Scholar]
  10. Xu, C.Y.; Xu, Z.H.; Cai, Y.P.; Zhu, Z.C.; Tan, Q. Impact of reservoir operation policies on nitrogen cycling processes and water quality dynamics in a large water supply reservoir. J. Clean. Prod. 2023, 416, 137975. [Google Scholar] [CrossRef]
  11. Phuong, N.N.; Dhivert, E.; Mourier, B.; Grosbois, C.; Gasperi, J. Microplastic trapping in dam reservoirs driven by complex hydrosedimentary processes (Villerest Reservoir, Loire River, France). Water Res. 2022, 225, 119187. [Google Scholar]
  12. Chen, Y.; Lin, L.; Li, Y.; Gao, Y.; Dong, L.; Pan, X.; Guo, Z. Dam operation changed the transport patterns of microplastics-from a global perspective. Environ. Pollut. 2025, 383, 126755. [Google Scholar] [CrossRef] [PubMed]
  13. He, D.; Chen, X.J.; Zhao, W.; Zhu, Z.Q.; Qi, X.J.; Zhou, L.F.; Chen, W.; Wan, C.Y.; Li, D.W.; Zou, X.; et al. Microplastics contamination in the surface water of the Yangtze River from upstream to estuary based on different sampling methods. Environ. Res. 2021, 196, 110908. [Google Scholar] [CrossRef] [PubMed]
  14. Han, N.P.; Ao, H.Y.; Mai, Z.; Zhao, Q.C.; Wu, C.X. Characteristics of (micro)plastic transport in the upper reaches of the Yangtze River. Sci. Total Environ. 2023, 855, 158887. [Google Scholar] [CrossRef]
  15. Yan, H.C.; Zhang, X.F.; Xu, Q.X. Variation of runoff and sediment inflows to the Three Gorges Reservoir: Impact of upstream cascade reservoirs. J. Hydrol. 2021, 603, 126875. [Google Scholar] [CrossRef]
  16. Soomro, S.; Shi, X.T.; Guo, J.L.; Ke, S.F.; Hu, C.H.; Asad, M.; Jalbani, S.; Zwain, H.M.; Khan, P.; Boota, M.W. Are global influences of cascade dams affecting river water temperature and fish ecology? Appl. Water Sci. 2023, 13, 106. [Google Scholar] [CrossRef]
  17. Lin, L.; Pan, X.; Zhang, S.; Li, D.W.; Zhai, W.L.; Wang, Z.; Tao, J.X.; Mi, C.Q.; Li, Q.Y.; Crittenden, J.C. Distribution and source of microplastics in China’s second largest reservoir—Danjiangkou Reservoir. J. Environ. Sci. 2021, 102, 74–84. [Google Scholar] [CrossRef]
  18. Shukur, S.A.; Hassan, F.M.; Fakhry, S.S.; Ameen, F.; Stephenson, S.L. Evaluation of microplastic pollution in a lotic ecosystem and its ecological risk. Mar. Pollut. Bull. 2023, 194, 115401. [Google Scholar] [CrossRef] [PubMed]
  19. Zhou, Y.; Zhang, Z.Y.; Bao, F.F.; Du, Y.H.; Dong, H.Y.; Wan, C.R.; Huang, Y.F.; Zhang, H.Y. Considering microplastic characteristics in ecological risk assessment: A case study for China. J. Hazard. Mater. 2024, 470, 134111. [Google Scholar] [CrossRef]
  20. Pan, Z.; Liu, Q.L.; Jiang, R.G.; Li, W.W.; Sun, X.W.; Lin, H.; Jiang, S.C.; Huang, H.N. Microplastic pollution and ecological risk assessment in an estuarine environment: The Dongshan Bay of China. Chemosphere 2021, 262, 127876. [Google Scholar] [CrossRef] [PubMed]
  21. Everaert, G.; Van Cauwenberghe, L.; Rijcke, M.D.; Koelmans, A.A.; Mees, J.; Vandegehuchte, M.; Janssen, C.R. Risk assessment of microplastics in the ocean: Modelling approach and first conclusions. Environ. Pollut. 2018, 242, 1930–1938. [Google Scholar] [CrossRef]
  22. Lithner, D.; Larsson, Å.; Dave, G. Environmental and health hazard ranking and assessment of plastic polymers based on chemical composition. Sci. Total Environ. 2011, 409, 3309–3324. [Google Scholar] [CrossRef] [PubMed]
  23. Plastics Europe. Plastics-the Facts 2017: An Analysis of European Plastics Production, Demand and Waste Data. Brussels: Association of Plastic Manufacturer. Available online: https://plasticseurope.org/wp-content/uploads/2021/10/2017-Plastics-the-facts.pdf (accessed on 1 November 2021).
  24. Tomlinson, D.L.; Wilson, J.G.; Harris, C.R.; Jeffrey, D.W. Problems in the assessment of heavy-metal levels in estuaries and the formation of a pollution index. Helgoländer Meeresunters. 1980, 33, 566–575. [Google Scholar] [CrossRef]
  25. Zhang, Y.; Ban, X.; Li, E.; Wang, Z.; Xiao, F. Evaluating ecological health in the middle-lower reaches of the Hanjiang River with cascade reservoirs using the Planktonic index of biotic integrity (P-IBI). Ecol. Indic. 2020, 114, 106282. [Google Scholar] [CrossRef]
  26. Yang, N.; Li, Y.; Zhang, W.; Lin, L.; Qian, B.; Wang, L.; Niu, L.; Zhang, H. Cascade dam impoundments restrain the trophic transfer efficiencies in benthic microbial food web. Water Res. 2020, 170, 115351. [Google Scholar] [CrossRef] [PubMed]
  27. Yao, P.; Zhou, B.; Lu, Y.H.; Yin, Y.; Zong, Y.Q.; Chen, M.T.; O’Donnell, Z. A review of microplastics in sediments: Spatial and temporal occurrences, biological effects, and analytic methods. Quatern. Int. 2019, 519, 274–281. [Google Scholar] [CrossRef]
  28. Fan, J.X.; Zou, L.; Duan, T.; Qin, L.; Qi, Z.L.; Sun, J.X. Occurrence and distribution of microplastics in surface water and sediments in China’s inland water systems: A critical review. J. Clean. Prod. 2022, 331, 129968. [Google Scholar] [CrossRef]
  29. Zhang, S.; Pan, X.; Lin, L.; Tao, J.; Liu, M. Preliminary study on composition and distribution characteristics of microplastics in water from the source region of Yangtze River. J. Yangtze River Sci. Res. Inst. 2021, 38, 12–18. (In Chinese) [Google Scholar]
  30. Jiang, C.B.; Yin, L.S.; Li, Z.W.; Wen, X.F.; Luo, X.; Hu, S.P.; Yang, H.Y.; Long, Y.N.; Deng, B.; Huang, L.Z.; et al. Microplastic pollution in the rivers of the Tibet Plateau. Environ. Pollut. 2019, 249, 91–98. [Google Scholar] [CrossRef]
  31. Li, S.Q.; Wang, H.; Chu, L.Y.; Zeng, Y.C.; Yan, Y.T. Pollution Characteristics and Ecological Risk Assessment of Microplastics in the Yangtze River Basin. Environ. Sci. 2024, 45, 1439–1447. [Google Scholar]
  32. Yan, M.T.; Nie, H.Y.; Xu, K.H.; He, Y.H.; Hu, Y.T.; Huang, Y.M.; Wang, J. Microplastic abundance, distribution and composition in the Pearl River along Guangzhou city and Pearl River estuary, China. Chemosphere 2019, 217, 879–886. [Google Scholar] [CrossRef]
  33. Du, J.; Yang, W.; Yang, Q.; Li, Y.; Wan, X.; Zhu, A.; He, Z.; Shrestha, R.P.; Razzaq, A. Assessment and Seasonal Monitoring of Groundwater Quality in Landfill-Affected Regions of China: Findings from Xiangyang. Water 2025, 17, 572. [Google Scholar] [CrossRef]
  34. Geng, N.; Zhao, G.M.; Zhang, D.H.; Yuan, H.M.; Li, X.G. Distribution, Sources, and Risk Assessment of Microplastics in Surface Sediments of Yellow River Delta Wetland. Environ. Sci. 2023, 44, 5046–5054. [Google Scholar]
  35. Peng, G.Y.; Zhu, B.S.; Yang, D.Q.; Su, L.; Shi, H.H.; Li, D.J. Microplastics in sediments of the Changjiang Estuary, China. Environ. Pollut. 2017, 225, 283–290. [Google Scholar] [CrossRef]
  36. Zuo, L.Z.; Sun, Y.X.; Li, H.X.; Hu, Y.X.; Lin, L.; Peng, J.P.; Xu, X.R. Microplastics in mangrove sediments of the Pearl River Estuary, South China: Correlation with halogenated flame retardants’ levels. Sci. Total Environ. 2020, 725, 138344. [Google Scholar] [CrossRef]
  37. Wu, Y.; Mei, K.; Shi, H.; Tang, R.; Tao, J.; Chen, T. Analysis of Spatial Heterogeneity of Microplastics in China’s Freshwater Environment Its Influencing Factors. J. Hydroeco. 2024. (In Chinese) [Google Scholar] [CrossRef]
  38. Frias, J.P.G.L.; Nash, R. Microplastics: Finding a consensus on the definition. Mar. Pollut. Bull. 2019, 138, 145–147. [Google Scholar] [CrossRef]
  39. Lee, S.; Lee, T.G. A novel method for extraction, quantification, and identification of microplastics in CreamType of cosmetic products. Sci. Rep. 2021, 11, 18074. [Google Scholar] [CrossRef]
  40. Yuan, W.K.; Liu, X.N.; Wang, W.F.; Di, M.X.; Wang, J. Microplastic abundance, distribution and composition in water, sediments, and wild fish from Poyang Lake, China. Ecotoxicol. Environ. Safety. 2019, 170, 180–187. [Google Scholar] [CrossRef]
  41. Chen, M.S.; Yue, Y.H.; Bao, X.X.; Yu, H.; Tan, Y.S.; Tong, B.B.; Kumkhong, S.; Yu, Y.Y. Microplastics as contaminants in water bodies and their threat to the aquatic animals: A mini-review. Animals 2022, 12, 2864. [Google Scholar] [CrossRef] [PubMed]
  42. Wang, T.; Zou, X.Q.; Li, B.J.; Yao, Y.L.; Zang, Z.; Li, Y.L.; Yu, W.W.; Wang, W.Z. Preliminary study of the source apportionment and diversity of microplastics: Taking floating microplastics in the South China Sea as an example. Environ. Pollut. 2019, 245, 965–974. [Google Scholar] [CrossRef]
  43. Nhon, N.T.T.; Nguyen, N.T.; Hai, H.T.N.; Hien, T.T. Distribution of Microplastics in Beach Sand on the Can Gio Coast, Ho Chi Minh City, Vietnam. Water 2022, 14, 2779. [Google Scholar] [CrossRef]
  44. Kooi, M.; Koelmans, A.A. Simplifying Microplastic via Continuous Probability Distributions for Size, Shape, and Density. Environ. Sci. Tech. Let. 2019, 6, 551–557. [Google Scholar] [CrossRef]
  45. Gewert, B.; Plassmann, M.M.; MacLeod, M. Pathways for degradation of plastic polymers floating in the marine environment. Environ. Sci. Proc. Imp. 2015, 17, 1513–1521. [Google Scholar] [CrossRef]
  46. Cao, X.L. Phthalate Esters in Foods: Sources, Occurrence, and Analytical Methods. Compr. Rev. Food Sci. F. 2010, 9, 21–43. [Google Scholar] [CrossRef]
  47. Zhang, K.; Shi, H.H.; Peng, J.P.; Wang, Y.H.; Xiong, X.; Wu, C.X.; Lam, P.K.S. Microplastic pollution in China’s inland water systems: A review of findings, methods, characteristics, effects, and management. Sci. Total Environ. 2018, 630, 1641–1653. [Google Scholar] [CrossRef]
  48. Alimi, O.S.; Budarz, J.M.; Hernandez, L.M.; Tufenkji, N. Microplastics and nanoplastics in aquatic environments: Aggregation, deposition, and enhanced contaminant transport. Environ. Sci. Technol. 2018, 52, 1704–1724. [Google Scholar] [CrossRef]
  49. Liu, X.; Zhong, B.; Li, N.; Wu, W.M.; Wang, X.; Li, X.; Yang, Z.; Mei, X.; Yi, S.; He, Y. Notable ecological risks of microplastics to Minjiang River ecosystem over headwater to upstream in Eastern Qinghai-Tibetan Plateau. Water Res. 2025, 274, 123137. [Google Scholar] [CrossRef]
  50. Chen, M.; Liu, S.; Bi, M.; Yang, X.; Deng, R.; Chen, Y. Aging behavior of microplastics affected DOM in riparian sediments: From the characteristics to bioavailability. J. Hazard. Mater. 2022, 431, 128522. [Google Scholar] [CrossRef] [PubMed]
  51. Zhou, J.; Liu, X.; Li, W.; Cao, Y. Characteristics, sources, and distribution of microplastics in sediments and their potential ecological risks: A case study in a typical urban river of China. J. Environ. Chem. Eng. 2024, 12, 114575. [Google Scholar] [CrossRef]
Figure 1. Sampling point layouts for the cascade reservoir groups in the middle and lower reaches of the Han River. W, Wangfu Zhou Reservoir; X, Xinji Reservoir; C, Cuijiaying Reservoir; Y, Ya Kou Reservoir; N, Nianpanshan Reservoir; H, section from the estuary of Hanjiang River to Nianpanshan Hub.
Water 17 02793 g001
Figure 2. MP abundance in water (a,b) and sediments (c,d) of the cascade reservoir group in the middle and lower reaches of the Han River during flood season and non-flood season.
Water 17 02793 g002
Figure 3. Morphological forms of MPs in water (a,b) and sediments (c,d) of the cascade reservoirs along the middle-lower Han river.
Water 17 02793 g003
Figure 4. MP colors in water (a,b) and sediments (c,d) of the cascade reservoirs along the middle-lower Han River.
Water 17 02793 g004
Figure 5. MP particle sizes in water (a,b) and sediments (c,d) of the cascade reservoirs along the middle-lower Han River.
Water 17 02793 g005
Figure 6. Different proportions of materials of MPs in water (a,b) and sediment (c,d) during flood and non-flood periods.
Water 17 02793 g006
Figure 7. The RI and PLI calculation results of MPs in the Hanjiang River water column during flood (a,b) and non-flood (c,d) period.
Water 17 02793 g007
Figure 8. The results of RI and PLI calculation results of MPs in the sediments of the Hanjiang River during flood (a,b) and non-flood (c,d) periods.
Water 17 02793 g008
Table 1. MP polymer hazard scores [22,23].
PolymerAbbreviationDensit (g/cm3)Score (Si)
PolypropylenePP0.85–0.921
Polydiol terephthalatePET1.38–1.414
PolyethylenePE0.89–0.9811
Polyamide(nylon)PA1.14–1.1547
PolycarbonatePC1.191177
Ethylene-vinyl acetate copolymerEVA0.93–0.959
Disclaimer/Publisher’s Note: The statements, opinions and data contained in all publications are solely those of the individual author(s) and contributor(s) and not of MDPI and/or the editor(s). MDPI and/or the editor(s) disclaim responsibility for any injury to people or property resulting from any ideas, methods, instructions or products referred to in the content.