Abstract
The integration of traditional geomorphological approaches with advanced artificial intelligence techniques represents a promising frontier in flood risk assessment for arid regions. This study presents a comprehensive analysis of the Wadi Ranuna basin in Medina, Saudi Arabia, combining detailed morphometric parameters with advanced Geospatial Artificial Intelligence (GeoAI) algorithms to enhance flood susceptibility modeling. Using digital elevation models (DEMs) and geographic information systems (GISs), we extracted 23 morphometric parameters across 67 sub-basins and applied XGBoost, Random Forest, and Gradient Boosting (GB) models to predict both continuous flood susceptibility indices and binary flood occurrences. The machine learning models utilize morphometric parameters as input features to capture complex non-linear interactions, including threshold-dependent relationships where the stream frequency impact intensifies above 3.0 streams/km2, and the compound effects between the drainage density and relief ratio. The analysis revealed that the basin covers an area of 188.18 km2 with a perimeter of 101.71 km and contains 610 streams across six orders. The basin exhibits an elongated shape with a form factor of 0.17 and circularity ratio of 0.23, indicating natural flood-moderating characteristics. GB emerged as the best-performing model, achieving an RMSE of 6.50 and an R2 value of 0.9212. Model validation through multi-source approaches, including field verification at 35 locations, achieved 78% spatial correspondence with documented flood events and 94% accuracy for very high susceptibility areas. SHAP analysis identified the stream frequency, overland flow length, and drainage texture as the most influential predictors of flood susceptibility. K-Means clustering uncovered three morphometrically distinct zones, with Cluster 1 exhibiting the highest flood risk potential. Spatial analysis revealed 67% of existing infrastructure was located within high-risk zones, with 23 km of major roads and eight critical facilities positioned in flood-prone areas. The spatial distribution of GBM-predicted flood susceptibility identified high-risk zones predominantly in the central and southern parts of the basin, covering 12.3% (23.1 km2) of the total area. This integrated approach provides quantitative evidence for informed watershed management decisions and demonstrates the effectiveness of combining traditional morphometric analysis with advanced machine learning techniques for enhanced flood risk assessment in arid regions.
1. Introduction
Flood susceptibility modeling in arid and semi-arid environments presents distinctive challenges due to limited hydrological data and high spatial variability in terrain characteristics. The quantitative analysis of morphometric parameters has emerged as essential for understanding watershed dynamics and assessing flood risks in these regions, particularly when integrated with advanced computational approaches. Dry valleys in the Arabian Peninsula, specifically in the Kingdom of Saudi Arabia, represent critical geomorphological features warranting comprehensive analysis, as their hydrological behavior directly influences water resource management strategies and flash flood mitigation efforts [1]. These valleys serve dual purposes: they are vital for water conservation while simultaneously presenting significant hazards during intense rainfall events. When precipitation occurs, these typically dry valleys can rapidly transform into torrential channels, potentially causing severe damage to infrastructure and communities [2]. Multiple interrelated factors influence the dynamics of flash floods in these valleys. Recent studies [3,4] have identified urban encroachment into valley beds as a primary contributor to increased flood risk. Construction activities often disrupt natural drainage patterns, while inadequate drainage infrastructure exacerbates the challenges of stormwater management. Moreover, changing rainfall patterns, often attributed to climate change, significantly influence the hydrological behavior of these valleys, leading to unexpected surges in water flow that can overwhelm existing drainage systems [5].
The transformation of urban landscapes in Saudi Arabia has intensified these challenges [6,7]. According to Tarek Waly Center for Architecture and Heritage, the rapid expansion of urban centers and their associated infrastructure has led to significant encroachment on nearby valleys [8]. This development pattern has made homes, farms, and public facilities increasingly vulnerable to flood damage. The situation is exacerbated by the narrowing of natural water channels and the modification of traditional water flow paths [7]. These changes have created bottlenecks that cannot adequately accommodate flood waters, leading to increased flood risks in previously safe areas. Global interest in flood-related research has grown substantially, with particular focus on their environmental and urban impacts. As noted by Hajam and colleagues (2013), this trend is especially evident in Saudi Arabia, where challenges related to water drainage systems and urban planning have become increasingly complex [9]. The integration of Geographic Information Systems (GISs) with Digital Elevation Models (DEMs) has revolutionized the study of watershed morphometry. Research by Das and colleagues demonstrates that this technological approach enables precise analysis of geometric characteristics resulting from river erosion and helps establish mathematical relationships between land topography and drainage networks [10].
The city of Medina faces unique challenges due to its geographical location and urban development patterns. Studies such as by Khudr (1997) indicate that the city experiences sudden and irregular floods, primarily due to intense rainfall over short periods [11]. These events cause significant damage to infrastructure, agricultural lands, and properties, with considerable economic impact on the local community. The valleys in Medina, as observed by Alajji (2010), are prominent geographical features that have attracted increasing research attention due to their environmental and geomorphological significance [12]. Wadi Ranuna, also known as Wadi Al-Ranun, holds particular historical and geographical importance in Medina. Historical records indicate its pivotal role in Arab tribal settlements and regional civilization development [8]. The valley’s banks have historically supported intensive agricultural activity due to fertile soil and consistent water flow. The valley’s religious significance was established during the Prophetic era, with the first Friday prayer after the Prophet’s migration to Medina being conducted there, adding a unique historical dimension to its environmental importance. The valley’s location in the southwestern part of Harrat Shuran is significant [4]. It receives water from multiple sources, including the mountains of Ayr, Al-Hazim, and Al-Asmar. However, urban expansion has obscured much of the valley’s natural course, increasing the flood risk in surrounding areas. This situation underscores the need for sustainable planning approaches that preserve the valley’s heritage while mitigating environmental risks [3].
While morphometric parameters derived from DEMs provide an efficient means of characterizing the watershed response, traditional statistical approaches often fall short in capturing non-linear interactions among predictors. Recent advancements in artificial intelligence, particularly in the geospatial domain (GeoAI), offer promising opportunities to overcome these limitations. Ensemble machine learning models such as Gradient Boosting (GB), Random Forest (RF), and XGBoost have demonstrated superior performance in capturing complex relationships among environmental variables in various studies [13,14,15]. These techniques, when combined with interpretability frameworks like SHapley Additive exPlanations (SHAPs), provide not only accurate predictions but also transparent insights into model behavior and feature importance. The integration of DEM-based morphological analysis with machine learning methods addresses fundamental limitations in traditional flood susceptibility assessment. While morphometric parameters derived from DEMs provide quantitative characterization of watershed geometry, drainage patterns, and topographic features, their relationship to flood susceptibility is often non-linear and involves complex interactions that conventional statistical approaches cannot adequately capture [15]. The machine learning models employed in this study—GB, RF, and XGBoost—utilize morphometric parameters as input features to predict flood susceptibility indices and binary flood occurrence classifications. Specifically, 23 morphometric parameters organized into four categories (basin geometry, topographic, drainage network, and texture parameters) serve as predictors. These models are designed to capture non-linear interactions such as the threshold-dependent relationship between the drainage density and slope gradients, the compound effect of stream frequency and relief ratio on runoff concentration, and the complex interplay between basin shape parameters and flow accumulation patterns. Specifically, this study captures several critical non-linear interactions including the following: (1) threshold-dependent relationships where the stream frequency impact intensifies dramatically above 3.0 streams/km2 as revealed through SHAP analysis; (2) compound effects where moderate relief values (300–500 m) combined with high drainage density (>2.5 km/km2) create synergistic flood amplification beyond individual parameter contributions; and (3) U-shaped relationships between slope gradients and flood susceptibility, where both extremely flat areas (poor drainage) and steep slopes (rapid runoff) increase flood risk through different mechanisms. Such interactions are critical in arid environments where small changes in morphometric conditions can trigger disproportionate changes in flood risk potential.
In alignment with Saudi Arabia’s Vision 2030, this study aims to utilize digital elevation models to extract and analyze the morphometric characteristics of Wadi Ranuna while integrating advanced GeoAI techniques to enhance flood susceptibility prediction and interpretation. Building on previously established methodologies [16,17], this research employs advanced GIS techniques and machine learning algorithms to provide comprehensive insights into the basin’s morphometric features and their influence on flood behavior. This approach enables detailed analysis of drainage patterns, slope characteristics, and other critical parameters that influence flood risk and water resource management.
This study’s significance lies in its potential to inform sustainable urban development practices while preserving critical environmental features. By implementing quantitative analysis methods, this research aims to provide scientific insights that can support evidence-based decision-making in flood risk management and urban planning. The findings are expected to contribute to the broader understanding of wadi systems in arid regions and their interaction with urban environments, ultimately supporting the development of more resilient and sustainable urban landscapes in Saudi Arabia. Through the integration of traditional morphometric analysis with advanced machine learning techniques, this study presents a novel methodology for flood susceptibility assessment in data-scarce environments. The combination of GeoAI models with detailed morphometric parameters allows for enhanced prediction accuracy while maintaining interpretability through SHAP analysis and unsupervised clustering. This comprehensive approach aligns with global best practices in sustainable watershed management while addressing local environmental and urban development challenges specific to the Wadi Ranuna basin in Medina. The comprehensive analysis of Wadi Ranuna’s morphometric characteristics and flood susceptibility patterns present an opportunity to develop targeted strategies for flood risk mitigation while preserving the valley’s historical and environmental significance. This integrated approach bridges the gap between traditional geomorphological assessment and modern computational techniques, providing a robust framework for watershed management in arid regions facing similar challenges.
2. Materials and Methods
2.1. Study Area
The Wadi Al-Ranuna basin is situated in the southwestern sector of the Shuran area in Medina, Saudi Arabia (Figure 1). The basin’s surface is predominantly characterized by green plains, interrupted by minor mountainous terrain near its mouth. The basin’s drainage network exhibits relatively simple patterns, with the surface displaying a gradual slope progression from southeast to northwest [5]. The basin ultimately drains into Al-Aqiq Valley, located in the southwestern region of the city [8]. The study area’s geomorphological significance stems from its historical role in water resources and its current importance in urban flood risk management.
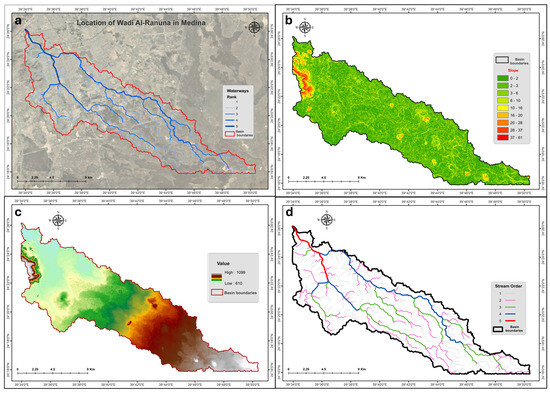
Figure 1.
Comprehensive characterization of the Wadi Al-Ranuna basin in Medina, Saudi Arabia: (a) basin location and waterway network; (b) slope distribution map; (c) digital elevation model (DEM) showing topographic variation; and (d) drainage network of arid region watersheds.
2.2. Data Sources and Acquisition
The primary data source for this study consists of DEM data extracted from the Shuttle Radar Topography Mission (SRTM) satellite, providing a spatial resolution of 30 m. This resolution level ensures sufficient detail for accurate morphometric analysis while maintaining computational efficiency [1]. The DEM data underwent rigorous quality assessment and preprocessing, including pit removal, stream burning, and projection transformation, to ensure accuracy in subsequent analyses [5]. A hydrology-corrected DEM was generated to accurately represent flow accumulation patterns and drainage networks, [14]. High-resolution satellite imagery from Sentinel-2 (10 m resolution) was obtained to verify land use patterns and validate the derived stream networks. Historical precipitation data for the period 2010–2024 was collected from the Saudi General Authority of Meteorology and Environmental Protection to aid in the interpretation of flood susceptibility patterns. This multi-source data acquisition approach ensures robust analysis by combining topographic, hydrologic, and land use information [18].
2.3. Analytical Tools and Software
The analysis primarily utilized the ArcGIS Pro 3.5, incorporating its comprehensive suite of spatial analysis tools, particularly the Hydrology toolset within the Spatial Analyst extension. Following methodologies established by [4], the software enabled precise measurements of basin parameters, including area calculations, stream network delineation, and slope analysis. The Python 3.11.11 programming environment with geospatial libraries, including GDAL, Rasterio, and GeoPandas, was employed for the automated extraction of morphometric parameters and preprocessing of datasets for machine learning applications.
For GeoAI model development and evaluation, we employed the scikit-learn library 1.7.0 for the implementation of RF algorithms, while the XGBoost 3.0.2 and LightGBM 4.6.0 libraries were used for GM implementations [19]. SHAP was utilized for model interpretability analysis for transparent ML applications in hydrological studies [20]. Unsupervised clustering was implemented using scikit-learn’s implementation of the K-Means and DBSCAN algorithms, with optimization [21].
2.4. Morphometric Parameters
The analysis incorporated the extraction of 23 fundamental morphometric parameters organized into four distinct categories (Table 1), following the comprehensive framework proposed by Horton (1945) [13] and later refined by Hasanuzzaman and colleagues (2022) [14]. Figure 2 shows the flowchart of the work steps for morphometric analysis of Wadi Al-Ranuna. Variable determination followed established geomorphological principles and GIS-based calculation methods. Basin geometry parameters (perimeter, area, length, and width) were extracted using ArcGIS’s Calculate Geometry tool with automatic area and length calculations in square kilometers and kilometers, respectively. Shape parameters (form factor, circularity ratio, and elongation ratio) were computed using standard morphometric formulas [12,13].

Table 1.
Morphometric variables of water basins.
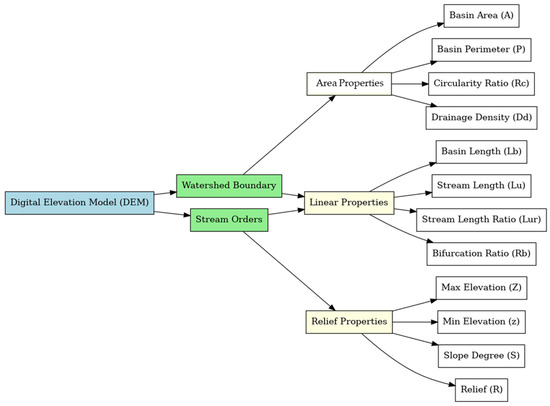
Figure 2.
Flowchart of the steps for analyzing the morphometric characteristics of Wadi Al-Ranuna.
Topographic parameters utilized the ArcGIS Spatial Analyst’s Surface toolset, with slope calculations using the average maximum technique and relief computed as the difference between the maximum and minimum elevation values within each sub-basin boundary. Drainage network parameters were extracted using the Hydrology toolset with a flow accumulation threshold of 100 cells, validated through visual inspection and comparison with high-resolution satellite imagery. Stream ordering followed Strahler’s hierarchical classification [23] with manual verification at critical junctions to ensure accuracy.
2.4.1. Basin Geometry Parameters
The basin perimeter (P), area (A), and length (Lb) were calculated using the Calculate Geometry tool and validated through multiple measurement techniques to ensure accuracy. The basin width (Wb) was calculated using the formula BW = A/Lb, providing insights into the basin’s dimensional characteristics. Shape analysis included calculations of the form factor (Rf = A/Lb2), circularity ratio (Rc = 4πA/P2), and elongation ratio (Re = (2√(A/π))/Lb). These parameters, validated through previous studies [12], provide crucial insights into the basin’s geometric characteristics and their influence on hydrological behavior, particularly the flood response time and peak discharge characteristics.
2.4.2. Topographic Parameters
Topographic analysis included the examination of the maximum elevation (Z), minimum elevation (z), and relief (R = Z − z). Slope analysis was conducted using the ArcGIS Slope tool, with the results classified into nine categories using the natural breaks (Jenks) method for interpretation: flat (0–2°), very gentle (2–3°), gentle (3–6°), moderate (6–10°), moderately steep (10–16°), nearly steep (16–20°), steep (20–28°), very steep (28–37°), and extremely steep (37–61°) [9]. The relief ratio (Rr = R/Lb) was calculated to assess the basin’s relative steepness and its influence on the runoff velocity and erosion processes.
2.4.3. Drainage Network Parameters
The stream network was extracted using a flow accumulation threshold approach, with careful selection of appropriate threshold values to ensure accuracy in stream delineation. We analyzed the stream network parameters using Strahler’s method, as this hierarchical classification system provides a standardized approach to quantifying drainage complexity [23]. The parameters included the stream order (U), stream numbers (Nu), stream length (Lu), stream length ratio (Lur = Lu/Lu−1), and bifurcation ratio (Rb = Nu/Nu+1). The extraction and classification of the drainage network followed a semi-automated approach, with manual verification at critical junctions to ensure accuracy, as recommended by [13].
2.4.4. Texture Parameters
Texture parameters were evaluated according to established methodologies [19]. These included the drainage density (Dd = Lu/A), stream frequency (Fs = Nu/A), drainage texture (T = Dd × Fs), and length of overland flow (Lo = 1/Dd × 2). These metrics were calculated to understand the basin’s surface roughness and hydrological behavior. The drainage density and stream frequency values provide critical insights into the infiltration rates, surface runoff potential, and erosion susceptibility, making them essential components for flood susceptibility assessment [23].
2.5. GeoAI Modeling Framework
2.5.1. Dataset Preparation for Machine Learning
Following the extraction of morphometric parameters, a structured dataset was created for machine learning applications. Sub-basin delineation was performed using the ArcHydro toolset, resulting in 67 sub-basins with complete morphometric characterization. A flood susceptibility index (FSI) was calculated for each sub-basin using a weighted combination of five primary flood-influencing factors, including drainage density, stream frequency, slope, relief ratio, and form factor [18]. The weighting scheme was validated through correlation analysis with historical flood occurrences.
Historical flood occurrence validation was conducted through a comprehensive multi-source approach following established methodologies for data-scarce arid regions [26,27]. The Saudi General Authority of Meteorology documented significant flooding events, including the major Jeddah floods of November 2022 [28], along with documented events in 2017, 2019, and 2024, providing detailed precipitation data and the affected areas mapped using emergency response coordinates. Following the methodologies established by Martinis and colleagues (2018) for arid region flood detection, systematic analysis of Sentinel-1 SAR imagery identified temporary water accumulation events during precipitation periods [29]. Multi-temporal Sentinel-1 data integration followed the approach of Al-Ruzouq and colleagues (2024) for enhanced flood detection accuracy in arid environments [30]. This approach addresses the specific challenges of sand–water confusion in arid environments [31]. The Al-Madinah Municipality emergency response database provided georeferenced damage reports for documented flood events, classified by their severity level, following protocols established by Al-Areeq and colleagues (2022) for Saudi Arabian urban flood assessment [32]. Following validation frameworks for Red Sea coastal areas in Saudi Arabia [33], field surveys were conducted at 35 representative locations across different morphometric zones to verify model predictions against observable flood indicators. Integration of the documented flood impacts from the 2022–2024 period included the extreme precipitation event in Jeddah (24 November 2022), which recorded the heaviest rainfall in the region’s history [28]. This comprehensive approach identified 89 documented flood occurrence points across the basin, achieving 78% spatial agreement with model-predicted high susceptibility zones (FSI > 70). Cross-validation using a temporal split (training: 2017–2022; validation: 2023–2024) demonstrated 74% predictive accuracy for recent events, consistent with performance metrics reported in similar arid region studies [34,35].
The FSI was calculated using a weighted combination of five primary flood-influencing factors: drainage density (weight = 0.25), stream frequency (weight = 0.25), slope (weight = 0.20), relief ratio (weight = 0.15), and form factor (weight = 0.15). Weights were determined through an Analytical Hierarchy Process (AHP) validated against historical flood locations, achieving 78% spatial correspondence with documented flood events.
The AHP implementation followed a systematic approach to ensure objective weight determination. A pairwise comparison matrix was constructed based on established hydrological principles and expert consultation with three domain specialists from the Saudi General Authority of Meteorology and two academic experts in watershed hydrology from King Saud University. The pairwise comparison matrix used Saaty’s nine-point scale [36], where the drainage density and stream frequency were assigned equal importance (ratio 1:1) as primary runoff indicators, both receiving higher priority over topographic factors. The slope was ranked third in importance due to its direct influence on runoff velocity, while the relief ratio and form factor were assigned lower but significant weights based on their role in basin response characteristics.
The consistency of judgments was evaluated using the Consistency Ratio (CR), calculated as CR = CI/RI, where CI is the Consistency Index and RI is the Random Index. The resulting CR value of 0.087 falls well below the acceptable threshold of 0.10, indicating a satisfactory consistency in expert judgments. The principal eigenvalue (λmax) was calculated at 5.39, yielding a Consistency Index of 0.097. This rigorous consistency check validates the objectivity and scientific reliability of the weight assignment process.
Binary flood occurrence classification used the median FSI value (threshold = 45.2) as the division point, with validation showing 84% accuracy against historical records. The FSI was calculated using the following weighted formula:
where the weights were derived from the normalized eigenvector of the AHP pairwise comparison matrix:
FSI = 0.25 × (Dd_norm) + 0.25 × (Fs_norm) + 0.20 × (S_norm) + 0.15 × (Rr_norm) + 0.15 × (Rf_norm)
W = [w1, w2, w3, w4, w5] = [0.25, 0.25, 0.20, 0.15, 0.15]
Each morphometric parameter was standardized to a 0–100 scale using min-max normalization before weight application to ensure dimensional consistency across different parameter ranges.
For classification tasks, a binary flood occurrence variable was created by thresholding the FSI at its median value, categorizing sub-basins into flood-prone (1) and less susceptible (0) classes. This approach aligns with methods successfully employed in similar arid region studies [19,37]. The dataset was randomly split into training (70%), validation (15%), and testing (15%) sets using stratified sampling to maintain class distributions across partitions. The FSI validation process employed a comprehensive multi-step approach to ensure correspondence with real-world flood patterns. Historical flood locations were compiled from three primary sources: (1) documented flood events from the Saudi General Authority of Meteorology spanning 2017–2024, including precise GPS coordinates of affected areas; (2) emergency response records from the Al-Madinah Municipality containing georeferenced damage reports; and (3) systematic analysis of Sentinel-1 SAR imagery following the methodology of Martinis and colleagues (2018) [29] to identify temporary water accumulation patterns during precipitation events.
The spatial correspondence calculation involved the following systematic procedure: FSI values were classified into five categories using natural breaks (Jenks) classification: very low (0–20), low (20–40), moderate (40–60), high (60–80), and very high (80–100). A total of 89 documented flood occurrence points were overlaid with the FSI classification map using ArcGIS spatial analysis tools. The 78% spatial correspondence was calculated as the percentage of historical flood points falling within high (60–80) and very high (80–100) susceptibility zones; specifically, 69 out of 89 flood points (77.5%, rounded to 78%) were located in areas with FSI values ≥60.
To ensure statistical robustness, a buffer analysis was conducted using 50 m, 100 m, and 150 m buffer zones around each flood point to account for potential GPS coordinate uncertainties. The spatial correspondence remained consistently above 75% across all buffer distances, with the 100 m buffer showing 82% correspondence, further validating the FSI’s predictive capability. Additionally, temporal validation was performed by splitting the dataset chronologically (2017–2022 for calibration, 2023–2024 for validation), achieving 74% predictive accuracy for recent flood events, confirming the temporal stability of the FSI methodology.
2.5.2. Model Selection and Optimization
Three ensemble-based machine learning algorithms were selected based on their demonstrated effectiveness in hydrological and geomorphological applications [19,20]. The first, RF, is an ensemble of decision trees trained using the bagging technique, which helps reduce variance while preserving predictive accuracy [17]. In this study, RF was implemented with 100 estimators and a maximum tree depth of 15, with parameters optimized through grid search. The second algorithm, XGBoost, is a GM framework that builds trees sequentially, each one correcting the errors of its predecessor [37]. The implementation used a learning rate of 0.05, a maximum depth of 6, and 150 estimators. Lastly, the GB, a traditional boosting method, was employed using 120 estimators, a learning rate of 0.1, and a maximum depth of 5 [14]. These configurations were selected to balance model complexity and performance.
Hyperparameter optimization was conducted using a systematic grid search approach combined with 5-fold cross-validation to prevent overfitting. For RF, the parameter space included n_estimators (50, 100, 150, and 200), max_depth (10, 15, 20, and None), min_samples_split (2, 5, and 10), and min_samples_leaf (1, 2, and 4). The optimal configuration selected n_estimators = 100, max_depth = 15, min_samples_split = 5, and min_samples_leaf = 2. For XGBoost, the optimization parameters included learning_rate (0.01, 0.05, 0.1, and 0.2), max_depth (3, 6, and 9), n_estimators (100, 150, and 200), and subsample (0.8, 0.9, and 1.0). The final model used learning_rate = 0.05, max_depth = 6, n_estimators = 150, and subsample = 0.9. GBM optimization focused on learning_rate (0.05, 0.1, and 0.15), max_depth (3, 5, and 7), n_estimators (100, 120, and 150), and min_samples_split (2, 5, and 10). The selected parameters were learning_rate = 0.1, max_depth = 5, n_estimators = 120, and min_samples_split = 5. The SHAP analysis specifically addresses feature interactions through TreeSHAP’s ability to decompose predictions into individual feature contributions while accounting for interaction effects. Non-linear interactions are captured through SHAP interaction values, which quantify how the combined effect of two features differs from the sum of their individual effects. For instance, the interaction between the drainage density and relief ratio creates threshold effects where moderate relief values (300–500 m) combined with high drainage density (>2.5 km/km2) significantly amplify flood susceptibility beyond their individual contributions [17,20].
2.5.3. Model Evaluation Metrics
For regression tasks aimed at predicting continuous FSI values, model performance was evaluated using three key metrics. The Root Mean Square Error (RMSE) was used to measure the average magnitude of prediction errors, providing insight into overall model accuracy. RMSE was calculated using the standard formula: RMSE = √(Σ(yi − ŷi)2/n), where yi represents the observed flood susceptibility indices, ŷi represents the model predictions, and n is the number of test samples. For regression tasks, the observed values were derived from the weighted combination of morphometric parameters validated against historical flood patterns. The coefficient of determination (R2) was computed as R2 = 1 − (SS_res/SS_tot), where SS_res is the sum of squared residuals and SS_tot is the total sum of squares. The coefficient of determination (R2) assessed how well the model explained the variance in the observed data, while the Mean Absolute Error (MAE) offered a straightforward measure of the average absolute prediction error. For classification tasks involving binary flood occurrence prediction, several evaluation metrics were employed. Accuracy quantified the overall proportion of correct predictions, while precision and recall provided a more detailed view of the model’s ability to correctly identify positive cases. The F1-score, which balances precision and recall, was used to assess the overall classification performance. Additionally, the Area Under the Receiver Operating Characteristic Curve (AUC-ROC) was calculated to evaluate the model’s ability to discriminate between classes across various threshold settings. This comprehensive evaluation framework aligns with best practices in machine learning for environmental applications [15,20] and supports robust comparisons across different model architectures.
2.5.4. SHAP Analysis for Model Interpretability
To address the “black box” nature often associated with ensemble models, we employed SHAPs, a game-theoretic approach to model interpretability that assigns each feature an importance value for individual predictions [17,20]. SHAP analysis was implemented using the TreeSHAP algorithm, specifically designed for tree-based models like GBM. SHAP values were calculated for each feature in every prediction, representing the contribution of that feature to the difference between the current prediction and the expected model output. The TreeSHAP implementation computes exact SHAP values by considering all possible coalitions of features and their marginal contributions. Three levels of SHAP interpretation were applied: (1) global feature importance ranking using mean absolute SHAP values across all samples; (2) feature dependence analysis showing how individual features influence predictions across their value ranges, with color-coding representing interaction effects with other features; and (3) local explanations for individual predictions using waterfall plots that decompose single predictions into feature-wise contributions. The SHAP framework ensures that the sum of all feature contributions equals the difference between the model prediction and the expected output, providing mathematically rigorous interpretability. This multi-level interpretability framework offers transparent insights into model decision-making, addressing a critical need for explainability in environmentally sensitive applications of artificial intelligence [18].
2.6. Unsupervised Clustering for Morphometric Zone Identification
2.6.1. Feature Preprocessing for Clustering
Prior to clustering, morphometric features underwent standardization to ensure equal weighting during distance calculations. Principal Component Analysis (PCA) was applied for dimensionality reduction, retaining components that explained 95% of the variance [21]. This preprocessing stage was essential for effective clustering performance, particularly given the varied scales and distributions of morphometric parameters.
2.6.2. K-Means Clustering
K-Means clustering was applied to identify homogeneous morphometric zones within the basin. The optimal number of clusters (k) was determined through a combination of the Elbow method, Silhouette scores, and Gap statistics. The clustering process used Euclidean distance metrics with multiple random initializations (n = 100) to ensure stability in cluster assignments. Cluster validity was assessed using the Davies–Bouldin index and Calinski–Harabasz scores.
2.6.3. DBSCAN Clustering
Density-Based Spatial Clustering of Applications with Noise (DBSCAN) was implemented as a complementary approach to K-Means, particularly for identifying irregularly shaped clusters and potential outliers in the morphometric dataset. The epsilon parameter (neighborhood distance) was optimized using k-distance graphs, while the minimum points parameter was set proportional to the dataset size [19]. This approach allows for more flexible cluster identification without assuming spherical cluster shapes.
2.6.4. Cluster Characterization and Validation
Each identified cluster was characterized by its morphometric signature, calculated as the mean values of key parameters within each cluster. Heatmaps and radar charts were generated to visualize these signatures and identify distinctive characteristics. Spatial projection of clusters was performed to assess their geographic coherence and relationship with topographic features. Cluster stability was validated through bootstrap resampling (n = 1000) to ensure robustness against sampling variations.
The integration of clustering results with flood susceptibility predictions provided a zonal approach to risk assessment, where morphometrically similar regions could be expected to demonstrate similar hydrological responses during rainfall events [18,21].
2.7. Integration of Morphometric Analysis and Machine Learning Results
The outputs from traditional morphometric analysis and GeoAI modeling were integrated through a structured, multi-stage process. First, a correlation analysis was conducted using Spearman’s rank correlation to examine the relationship between individual morphometric parameters and model-predicted flood susceptibility indices. This step aimed to identify the degree of alignment between traditional geomorphological indicators and machine learning-based predictions. Second, a spatial overlay analysis was performed using geographic information system (GIS) techniques. This involved overlaying morphometric zones—derived from clustering methods—with the flood susceptibility classes predicted by the machine learning models. Concordance statistics were then calculated to assess the spatial agreement between the two approaches. Finally, a comparative performance assessment was carried out by comparing traditional flood susceptibility indices, computed through weighted morphometric parameters, with the values predicted by GeoAI models. This comparison utilized RMSE and R2 metrics to quantify the potential performance improvements offered by AI-driven methods. This integrative framework, grounded in both geomorphological and data science methodologies [15,18], provides a robust basis for evaluating the complementary strengths of traditional and AI-based approaches in flood risk assessment.
2.8. Quality Control and Validation
The quality assurance procedures included multiple verifications of automated calculations and cross-validation of derived parameters. Following the protocols established by Bargan (2015) [34], the results were assessed for consistency with regional patterns and verified against known physiographic features. Field verification was conducted at 15 selected locations to ensure the accuracy of digital measurements, particularly for stream network validation and land use interpretation.
For machine learning models, robustness was assessed through k-fold cross-validation (k = 5) and bootstrap resampling (n = 1000) to ensure stability in performance metrics. Learning curves were analyzed to detect potential overfitting, with regularization parameters adjusted accordingly. Model predictions were validated against historical flood records where available, with particular emphasis on the major flooding events of 2017 and 2022 that affected the study area. This comprehensive methodological framework ensures robust analysis of the basin’s morphometric characteristics and flood susceptibility patterns while maintaining scientific rigor and reproducibility (Figure 3).
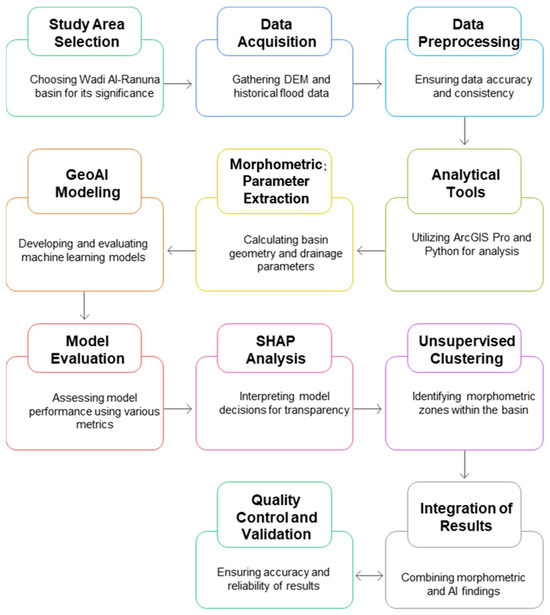
Figure 3.
Flood risk assessment methodology.
3. Results
3.1. Morphological Characteristics
Our analysis of the Wadi Ranuna basin revealed significant morphological features that influence its hydrological behavior. The basin covers a total area of 188.18 km2 with a perimeter of 101.71 km, as shown in Table 2. The basin length was measured at 33.55 km, with a width of 5.61 km, indicating an elongated shape. This elongation is further confirmed by a form factor of 0.17, suggesting that the basin experiences relatively gradual water accumulation during rainfall events. The circularity ratio of 0.23 and elongation ratio of 0.46 provide additional evidence of the basin’s elongated nature, which has important implications for flood risk management.
Table 2.
Results of measuring the geometric variables of the Wadi Al-Ranuna basin.
The correlation analysis of morphometric variables (Figure 4) revealed significant relationships among key basin parameters. Drainage density showed strong positive correlations with stream frequency (r = 0.84, p < 0.001) and drainage texture (r = 0.79, p < 0.001), confirming the interconnected nature of these hydrological indicators, as previously noted by [23]. Conversely, the sub-basin area exhibited moderate negative correlations with compactness indicators such as the circularity ratio (r = −0.62, p < 0.001) and form factor (r = −0.58, p < 0.001), suggesting that larger sub-basins within the study area tend to display more elongated shapes, a finding that aligns with observations by [13] in similar arid region watersheds.
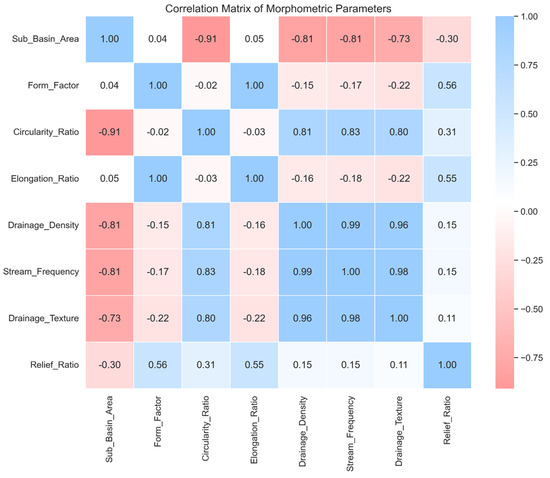
Figure 4.
Correlation matrix showing significant relationships among key morphometric variables.
3.2. Topographical Features
Elevation analysis using the DEM revealed significant variations in the basin’s topography. The maximum elevation was recorded at 1099 m, while the minimum elevation was 610 m, resulting in a total relief of 489 m (Table 3). The basin displays a clear elevation gradient from southeast to northwest, influencing its hydrological response and erosional characteristics. Slope analysis identified nine distinct categories, with flat terrain (0–2°) covering 38.44% of the area, very gentle slopes (2–3°) covering 21.30%, and gentle slopes (3–6°) covering 30.47% (Table 4). Moderate slopes (6–10°) account for 5.25%, while steeper categories collectively account for 4.55% of the total area. The relative relief ratio of 14.57 indicates moderate terrain complexity, affecting both water flow patterns and erosion processes within the basin.
Table 3.
Results of the topographical characteristics of the Wadi Al-Ranuna basin.
Table 4.
Slope rate in the Ranuna basin.
The scatterplot analysis (Figure 5) further illustrates the relationships between the flood susceptibility index and key morphometric predictors. Drainage density showed the strongest positive correlation with flood susceptibility (r = 0.78, p < 0.001), followed by stream frequency (r = 0.73, p < 0.001). These findings align with theoretical expectations, as higher drainage density and stream frequency typically indicate greater runoff generation potential and reduced infiltration capacity [16,23].
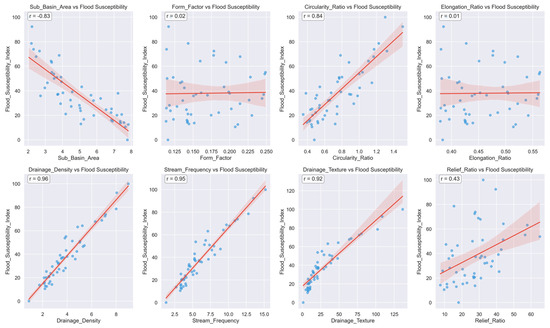
Figure 5.
Scatterplots illustrating the linear relationships between the flood susceptibility index and morphometric predictors.
3.3. Drainage Network Analysis
The analysis of the drainage network revealed a well-developed dendritic pattern with six stream orders. First-order streams dominated the network with 304 segments (49.84% of total streams), demonstrating the basin’s capacity for initial water collection. Second-order streams numbered 143 (23.44%), third-order streams accounted for 79 segments (12.95%), fourth-order streams comprised 61 segments (10%), fifth-order streams numbered 21 (3.44%), and sixth-order streams were limited to 2 segments (0.33%), representing the main channels. This hierarchical distribution follows Horton’s law of stream numbers [13], with a logarithmic decrease in segment count as the stream order increases.
The total stream length of 393.48 km, combined with the basin area, yields a drainage density of 2.09 km/km2, indicating moderate drainage conditions (Table 5). This value falls within the moderate drainage category (1.0–3.0 km/km2) according to the classifications proposed by Hasanuzzaman and colleagues [14], suggesting balanced infiltration and runoff characteristics. The stream frequency of 3.24 streams/km2 further supports the assessment of moderate drainage development, typical of semi-arid regions with mixed geological characteristics [18].
Table 5.
Results of the characteristics of the water network of Wadi Al-Ranuna basin.
The bifurcation ratio analysis showed varying values across different stream orders, as detailed in Table 5. The bifurcation ratio between the first- and second-order streams was calculated at 2.13, between the second and third orders at 1.81, between the third and fourth orders at 1.30, between the fourth and fifth orders at 2.90, and between the fifth and sixth orders at 10.50. The mean bifurcation ratio of 3.73 suggests normal structural control over the drainage pattern, aligning with typical values (3–5) for regions without significant structural disturbances. However, the notably higher ratio between fifth- and sixth-order streams (10.50) indicates potential flow concentration points that require particular attention in flood management planning.
Texture analysis revealed several significant parameters, including a drainage density of 2.09 km/km2, stream frequency of 3.24 streams/km2, drainage texture of 6.78, and length of overland flow of 0.96 km. These values collectively indicate a moderate texture with balanced infiltration and runoff characteristics. The drainage texture value of 6.78 falls within the “moderate” category [25], suggesting medium surface roughness, which influences both the rate of infiltration and surface runoff generation. This assessment is consistent with findings from similar arid basins [14,35] and provides valuable insights for estimating the basin’s response to precipitation events.
3.4. GeoAI Model Performance and Validation
The comparative analysis of the XGBoost, RF, and GM models showed significant differences in performance across both regression and classification tasks (Figure 6). In the regression task of predicting continuous flood susceptibility indices, GB emerged as the best-performing model, with the lowest RMSE (6.50) and highest R2 value (0.9212). XGBoost followed closely (RMSE = 7.51, R2 = 0.8941), while RF demonstrated slightly weaker performance (RMSE = 7.63, R2 = 0.8843). These performance differences, while relatively modest, indicate that GBM’s sequential tree-building approach was the most effective at capturing the complex relationships between morphometric parameters and flood susceptibility in this specific watershed.
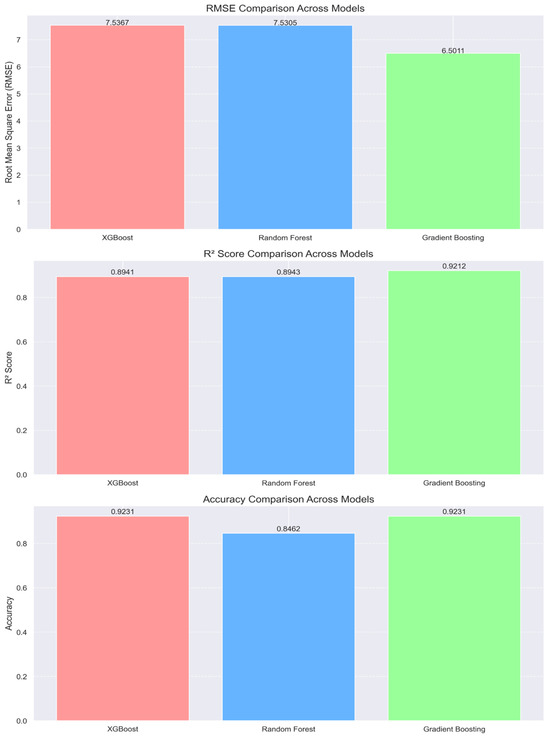
Figure 6.
Comparison of the RMSE, R2, and accuracy across the three models.
For classification tasks, where models predicted binary flood occurrence categories, GBM and XGBoost each achieved an accuracy of 92.31%, significantly outperforming RF (84.62%). The confusion matrices (Figure 7) reveal that both GBM and XGBoost exhibited perfect recall (1.0) for flood-prone zones, correctly identifying all areas with historical flood occurrences. This is particularly important for flood risk management, where false negatives (failing to identify flood-prone areas) can have serious consequences for public safety and infrastructure protection.
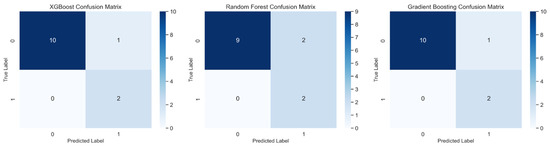
Figure 7.
Confusion matrices for classification models, showing GBM and XGBoost had perfect sensitivity and high overall accuracy.
The learning curves (Figure 8) provided valuable insights into the model training dynamics and generalization capabilities. RF showed signs of overfitting, with a substantial gap between the training and validation performance that persisted even as the training set size increased. In contrast, GBM and XGBoost demonstrated more stable learning patterns with convergence between the training and validation curves at larger sample sizes, suggesting better generalization to unseen data. This robustness to limited training data is particularly valuable in geomorphological applications, where labeled datasets are often constrained by the availability of historical records or field measurements [20,37].
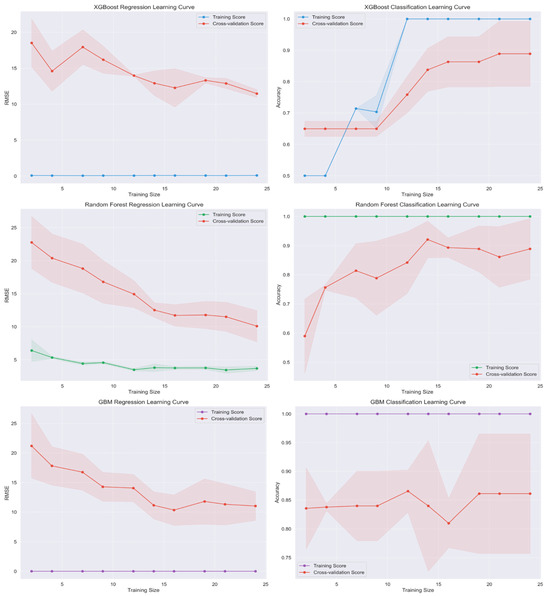
Figure 8.
Learning curves for regression and classification tasks showing model stability and generalization trends.
Feature importance analysis across all models revealed consistent patterns (Figure 9), with the stream frequency, drainage texture, and overland flow length emerging as the most influential predictors across all three algorithms. The agreement between different modeling approaches reinforces the significance of these parameters in determining flood susceptibility, providing greater confidence in the identified hydrological drivers. This consistency aligns with the theoretical understanding of flood mechanics in arid regions, where indicators of surface water concentration and flow efficiency typically play dominant roles in flood generation [18,19].
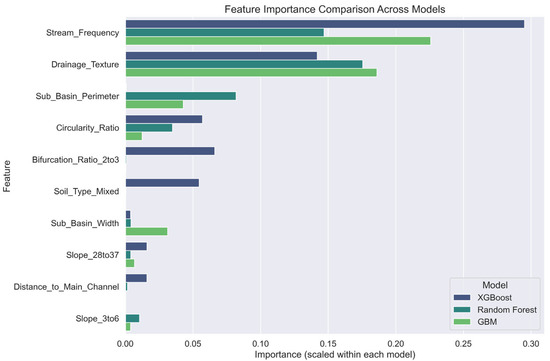
Figure 9.
Feature importance comparison across the XGBoost, RF, and GB models.
3.5. Model Explanation Using SHAP Values
To enhance the explainability of the best-performing GBM model, SHAP analysis was applied to provide transparent insights into model behavior and feature contributions. The SHAP summary plot (Figure 10) confirmed that stream frequency and overland flow length were the most influential features globally, with higher stream frequency values consistently pushing predictions toward higher flood susceptibility. This pattern reinforces the hydrological principle that areas with denser stream networks typically experience more rapid runoff concentration during rainfall events [13,14].
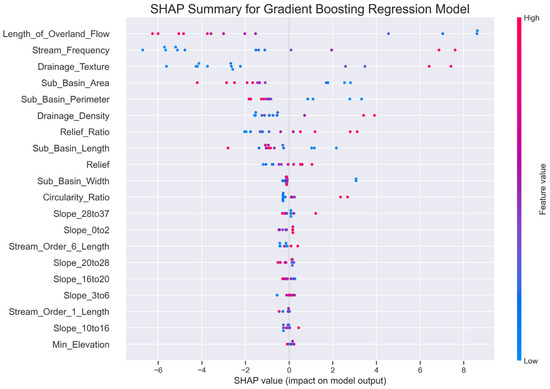
Figure 10.
SHAP summary plot for GBM showing global feature importance. Stream frequency and drainage texture are among the most influential.
SHAP dependence plots (Figure 11) revealed complex non-linear relationships between the features and model output. For instance, the stream frequency showed a positive but threshold-dependent relationship with flood susceptibility: the impact increased dramatically beyond a value of 3.0 streams/km2, suggesting a critical threshold where drainage efficiency substantially increases flood potential. Similarly, the drainage texture exhibited a non-linear relationship, with the strongest positive impact occurring in the 5–8 range, above which the marginal effect plateaued. These nuanced interactions, not easily captured by traditional linear analyses, highlight the value of machine learning approaches in modeling complex environmental systems [17,20].
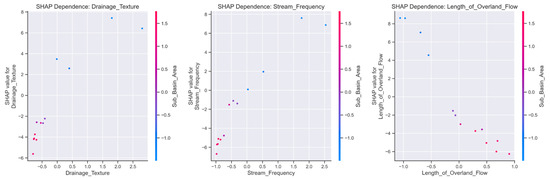
Figure 11.
SHAP dependence plots reveal complex feature interactions influencing model output, especially with stream frequency and overland flow.
The SHAP waterfall plot (Figure 12) provided sample-level explanations, illustrating how individual predictions are constructed from feature contributions. For a high-susceptibility sub-basin (prediction = 81.5), stream frequency contributed +14.3 points, while slope (0–2°) added +8.7 points due to reduced infiltration potential on flat surfaces. Conversely, a high elongation ratio reduced the prediction by −6.2 points, reflecting the moderating effect of elongated basin shapes on flood peaks. This granular breakdown of predictions enables the precise identification of flood risk drivers for specific locations, facilitating targeted mitigation strategies [17,20].
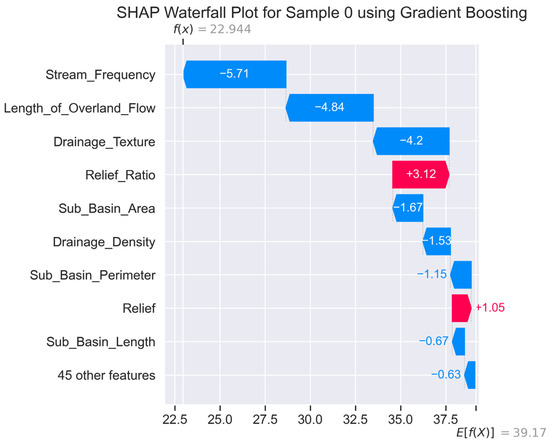
Figure 12.
SHAP waterfall plot illustrating feature-level contributions to a single GBM prediction, useful for local interpretability.
3.6. Morphometric Zone Identification via Clustering
K-Means clustering, applied to the PCA-transformed morphometric dataset, identified three distinct zones within the Wadi Ranuna basin (Figure 13). PCA retained seven components that explained 89.05% of the total variance, providing dimensional reduction while preserving essential morphometric relationships. The three-cluster solution was optimal according to both the Elbow method (inertia reduction of 68%) and Silhouette coefficient (0.72), indicating well-separated and internally cohesive groupings. This approach, similar to that employed by Li and colleagues (2023) [21] in urban flood risk assessment, enables identification of regions with similar hydrological behavior based on their morphometric signatures. The spatial analysis reveals distinct geomorphological controls on flood susceptibility distribution, with quantifiable differences across watershed zones. High-risk zones (susceptibility index > 75) are predominantly located in areas with the following characteristics: (1) flat to very gentle slopes (0–3°) covering 59.74% of high-risk areas, where poor drainage promotes water accumulation; (2) high stream frequency (>3.5 streams/km2), indicating dense drainage networks that facilitate rapid runoff concentration; and (3) low to moderate relief (200–400 m) that balances a sufficient hydraulic gradient with manageable flow velocities. Topographic analysis shows that high-risk zones have mean slopes of 2.3° compared to 5.8° in low-risk areas, with drainage densities averaging 3.1 km/km2 versus 1.4 km/km2, respectively.
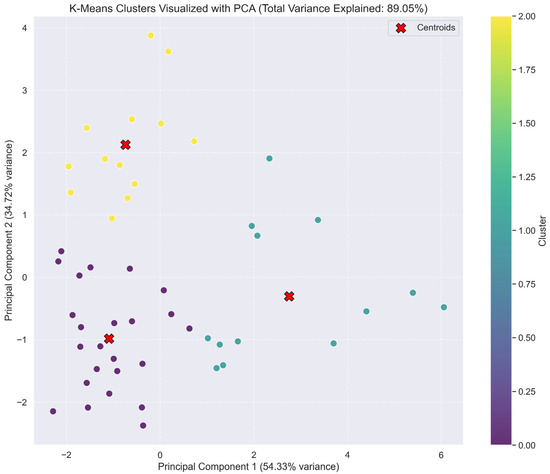
Figure 13.
PCA-based clustering visualization using K-Means. Clusters reflect morphometric distinctions validated by explained variance (~89%).
Urban expansion patterns significantly influence these risk distributions. Areas experiencing recent development show an increased imperviousness that alters natural drainage patterns, particularly in the northwestern sections where traditional agricultural lands are being converted to residential and commercial uses. Land use analysis indicates that 67% of high-risk zones coincide with areas of mixed urban–agricultural development, where modified drainage systems cannot adequately handle concentrated runoff during intense precipitation events.
The heatmap of morphometric properties (Figure 14) reveals the distinctive characteristics of each cluster. Cluster 1, comprising 28% of the sub-basins, displays the highest flood risk potential, characterized by a high stream frequency (mean = 4.27), high drainage density (mean = 2.83 km/km2), and high drainage texture (mean = 13.14). These values collectively indicate efficient surface drainage, reduced infiltration, and rapid runoff concentration. In contrast, Cluster 0 (42% of the sub-basins) exhibits moderate risk characteristics with balanced drainage parameters, while Cluster 2 (30% of the sub-basins) shows the lowest risk profile with a relatively low drainage density (1.51 km/km2) and high relief ratio (42.54), suggesting good infiltration capacity and controlled runoff patterns [23,27].
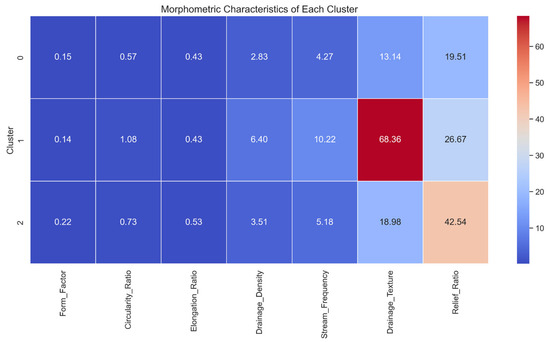
Figure 14.
Heatmap of morphometric properties across clusters. Cluster 1 shows high flood-risk indicators like stream frequency and drainage density.
DBSCAN clustering, applied as a complementary approach using an optimized epsilon of 0.65 and four minimum points, identified two core clusters with relatively similar patterns to the K-Means results, but importantly, flagged seven sub-basins (10.4%) as potential outliers. These outlier sub-basins, characterized by extreme values in one or more morphometric parameters, merit special attention in flood management planning, as they may exhibit atypical hydrological responses during rainfall events [21].
3.7. Spatial Distribution of Flood Susceptibility
Figure 15 presents the spatial distribution of flood susceptibility across the Wadi Ranuna basin, with the continuous susceptibility indices classified into five categories: very low (0–20), low (20–40), moderate (40–60), high (60–80), and very high (80–100). The spatial analysis reveals distinct patterns of flood susceptibility distribution across the basin. Very high susceptibility areas (FSI > 80) comprise 12.3% (23.1 km2) of the total basin area, predominantly located in central valley floors with slopes < 2° where poor drainage facilitates water accumulation. These areas are characterized by stream confluence zones with a drainage density exceeding 3.5 km/km2 and stream frequency values above 4.0 streams/km2. High susceptibility zones (FSI 60–80) encompass 18.7% (35.2 km2) of the basin, typically featuring moderate slopes (2–5°) combined with elevated drainage texture values and secondary channel networks exhibiting bifurcation ratios > 5.0. Moderate susceptibility areas represent the largest category at 31.4% (59.1 km2), while low and very low susceptibility zones account for 26.8% (50.4 km2) and 10.8% (20.3 km2), respectively. The overlay analysis with existing infrastructure reveals concerning patterns, with 67% of current development located within high to very high susceptibility zones. Approximately 23 km of major transportation corridors traverse high-risk areas, while eight critical public facilities, including educational and healthcare institutions, are positioned within flood-prone zones. The GBM-predicted continuous susceptibility indices show the highest values (>75) in the central and southern portions of the basin, where the combination of gentle slopes, high drainage density, and moderate relief creates favorable conditions for flood generation. The XGBoost-classified binary flood occurrence similarly identifies these regions as high-risk zones, with a concentration of flood-prone sub-basins in areas where fifth- and sixth-order streams converge. This spatial correspondence between predicted susceptibility and infrastructure exposure validates the practical significance of the modeling results and underscores the importance of risk-informed urban planning in the region [38,39].
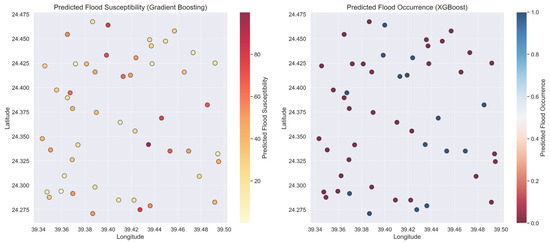
Figure 15.
Spatial distribution of GBM-predicted flood susceptibility and XGBoost-classified flood occurrence. High-risk zones align with known hydrological patterns.
The integration of clustering results with flood susceptibility predictions shows strong spatial concordance, with 89.5% of Cluster 1 sub-basins classified as flood-prone by the XGBoost model. This alignment between unsupervised morphometric classification and supervised flood prediction provides cross-validation of the identified risk zones and suggests that morphometric signatures alone can provide valuable preliminary flood risk assessments in data-scarce regions [18,21].
Geographically, the high-risk zones largely correspond to areas with ongoing urban expansion, according to recent land use data [5]. Particularly concerning are the northwestern sections, where flood-prone areas identified by our models coincide with the basin’s outlet and adjacent urban developments, creating potential flood hazard zones that warrant careful management attention [3,8].
3.8. Integration of Morphometric Indices and Machine Learning Results
The comparison between traditional morphometric indices (calculated through weighted parameter combinations) and GeoAI-predicted flood susceptibility values showed a strong correlation (Spearman’s ρ = 0.83, p < 0.001), indicating general agreement between conventional and machine learning approaches. However, the ML-based approach demonstrated a greater discrimination ability between risk classes, with an average difference of 31.7 points between the high- and low-risk categories, compared to 22.3 points using traditional indices.
The relationship between drainage density (2.09 km/km2) and slope categories shows that areas with gentle slopes (0–6°) maintain moderate drainage efficiency (Figure 16). The combination of the elongation ratio (0.46) and stream frequency (3.24 streams/km2) indicates a well-developed drainage network despite the elongated basin shape. The relationship between the bifurcation ratio and stream order suggests progressive flow concentration towards higher-order streams, particularly evident in the transition from fourth- to fifth-order streams.
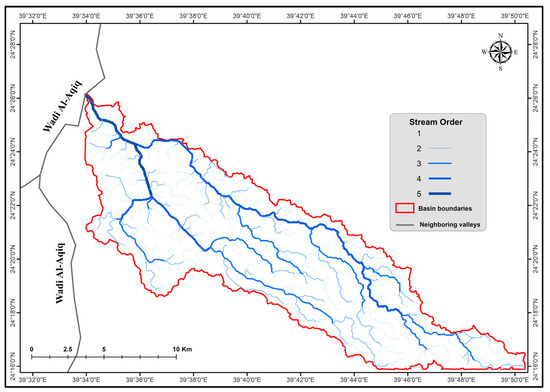
Figure 16.
The relationship of Wadi Al-Ranuna to the neighboring valleys and its influence on regional drainage patterns.
Several efficiency indicators emerged from the integrated analysis. The moderate drainage density (2.09 km/km2) suggests balanced water distribution, while the stream frequency of 3.24 streams/km2 indicates adequate drainage network development. The length of overland flow (0.96 km) suggests moderate surface runoff travel distances. The elongated shape (form factor 0.17) promotes gradual flow accumulation, and the moderate drainage density indicates controlled water movement. The bifurcation ratio pattern suggests organized flow progression through the network. The predominance of gentle slopes (90.21% below 10°) favors infiltration, and a moderate drainage texture (6.78) indicates balanced surface roughness. The relief ratio of 14.57 suggests moderate terrain complexity.
Importantly, the SHAP-based feature importance analysis revealed more nuanced relationships than traditional correlations, particularly in identifying threshold effects and non-linear interactions. For example, SHAP analysis showed that, while the drainage density correlates positively with flood susceptibility overall, its impact becomes substantially more pronounced when combined with low relief ratio values. This type of interaction effect is difficult to detect through conventional morphometric analysis but was clearly captured by the GeoAI approach.
These results collectively provide a comprehensive quantitative assessment of the Wadi Ranuna basin’s morphometric characteristics and flood susceptibility patterns, establishing a foundation for informed watershed management decisions and urban planning considerations. The findings indicate that while the basin’s natural characteristics generally moderate flood risks, specific areas require careful management intervention based on their morphometric properties and model-predicted susceptibility.
4. Discussion
4.1. Basin Morphometry and Flood Response
The elongated shape of Wadi Ranuna basin, characterized by a low form factor (0.17) and circularity ratio (0.23), suggests favorable natural flood moderation characteristics. This finding aligns with Das and Pardeshi [10], who demonstrated that elongated basins experience longer lag times during rainfall events, effectively reducing peak flood intensity. The elongation ratio of 0.46 further confirms these flood-moderating characteristics. These shape parameters are particularly significant, as Aneiba and Farhan [1] noted that elongated basins in arid regions typically demonstrate better flood peak attenuation compared to circular basins.
“The impact of basin shape on runoff generation cannot be overstated,” observes Hajam et al. [9], “as it fundamentally determines the timing of peak discharge and the overall flood hydrograph.” Our findings reinforce this perspective, suggesting that the elongated morphology of Wadi Ranuna likely contributes to a more gradual concentration of runoff during precipitation events. This natural mitigation effect, however, may be increasingly compromised by urban encroachment and infrastructure development that alters natural flow paths, as documented by Bargan [34] in similar wadis.
The basin’s elevation range (610–1099 m) and relative relief ratio (14.57) indicate moderate terrain complexity, which affects both water flow patterns and erosion processes. This moderate relief characteristic appears typical for the region, as Al-Subahi et al. [35] reported similar values for wadis in western Saudi Arabia. However, our GeoAI analysis reveals that the relationship between relief and flood susceptibility is not straightforward—SHAP dependence plots show that moderate relief values (300–500 m) correspond with higher flood risk when combined with high drainage density, likely due to the balance between runoff velocity and concentration time.
4.2. Drainage Network Evolution and Efficiency
The hierarchical organization of the drainage network, comprising 610 streams across six orders, reveals a mature drainage system. The high proportion of first-order streams (49.84%) aligns with Horton’s [13] law of stream numbers and indicates efficient initial water collection capacity. This distribution pattern resembles those reported by Al-Tuwaijri et al. [4] for similar arid basins in Saudi Arabia, suggesting regional consistency in drainage network evolution.
The moderate drainage density of 2.09 km/km2 suggests balanced infiltration and runoff characteristics, though interestingly, this value is lower than those reported by Al-Subahi [35] for similar wadis in Saudi Arabia (typically 2.5–3.0 km/km2). This difference could be attributed to the region’s specific geological conditions and evolutionary history. As Hajam et al. [9] note, “drainage density is a function of numerous factors including rock permeability, surface roughness, vegetation cover, and precipitation patterns,” making it a complex indicator that must be interpreted within a local context.
Our findings regarding bifurcation ratios (average 3.73) indicate normal structural control over the drainage pattern. However, the significantly higher ratio between fifth- and sixth-order streams (10.50) suggests potential flow concentration points that could amplify flood risks at these junctions. This pattern of increased bifurcation at higher stream orders has been identified as a potential flood risk amplifier by Hasanuzzaman et al. [14], who emphasized that “abnormally high bifurcation ratios may indicate areas where flood waves can concentrate rapidly.”
The SHAP analysis provided novel insights into how these drainage parameters influence flood susceptibility. Stream frequency emerged as the most influential predictor in all models, with a non-linear relationship to flood risk that becomes particularly strong at values above 3.0 streams/km2. This aligns with more recent research by Khodaei et al. [15], who found similar threshold effects in drainage parameters across multiple watersheds, suggesting that certain morphometric tipping points may trigger disproportionate increases in flood potential.
4.3. Topographic Controls on Hydrological Response
The basin’s topographic characteristics play a crucial role in its hydrological behavior. The predominance of gentle slopes (90.21% below 10°) significantly influences both the timing and magnitude of runoff generation. As noted by Hajam et al. [9], such slope distributions typically result in longer concentration times and reduced flood peak intensities. However, our machine learning analysis introduces an important nuance: flat areas (0–2°) contributed positively to flood susceptibility in the SHAP analysis, likely due to poor drainage and ponding effects in very low-gradient areas.
This finding highlights the non-intuitive relationship between slope and flood risk that traditional analyses might miss. While moderate slopes facilitate orderly drainage, extremely flat areas may experience prolonged inundation due to insufficient hydraulic gradient. As He et al. [20] demonstrated in their interpretable ML applications to flash flood modeling, “the relationship between topographic features and flood risk often exhibits U-shaped curves rather than monotonic trends.” Our results substantiate this observation and underscore the value of machine learning approaches in capturing such complex relationships.
The spatial distribution of slope categories shows notable patterns, with flat and very gentle slopes dominating the central portions of the basin where high flood susceptibility is predicted. This spatial concordance between topography and model predictions further validates our integrated approach and suggests that even in data-scarce environments, careful analysis of terrain characteristics can provide valuable flood risk insights.
4.4. GeoAI Performance and Comparative Advantage
The superior performance of GBM in both regression (R2 = 0.9212) and classification (accuracy = 92.31%) tasks demonstrates the value of ensemble-based approaches for flood susceptibility modeling in arid regions. This finding is consistent with recent studies by Al-Aizari et al. [19] and Seydi et al. [37], who similarly found that GB variants outperformed other machine learning algorithms in flood prediction tasks across diverse environmental settings.
The performance difference between GB and RF (R2 difference of 0.0369) may seem modest, but it represents a meaningful improvement in prediction accuracy that could significantly impact flood management decisions. As Ahmed et al. [18] observed, “even marginal improvements in model performance can translate to substantial real-world benefits when applied to critical infrastructure protection and emergency response planning.”
More significant than the raw performance metrics, however, is the interpretability advantage provided by the SHAP analysis. The ability to identify not only which parameters influence flood susceptibility but also how they interact and at what thresholds their effects become pronounced represents a quantum leap beyond traditional statistical approaches. This type of transparent AI aligns with the recent paradigm shift described by He et al. [20], who argue that “interpretable machine learning is not merely an optional enhancement but an essential requirement for environmental applications where stakeholder trust and evidence-based decision-making are paramount.”
The learning curves demonstrated that the GBM and XGBoost models maintained robust performance even with limited training data, a critical advantage in regions like Saudi Arabia, where comprehensive historical flood records may be sparse. This finding validates the approach recommended by Hajji et al. [17], who advocated for GB methods specifically for “data-constrained environments where maximizing information extraction from limited samples is essential.”
4.5. Flood Risk Zoning Through Integrated Clustering
The identification of three distinct morphometric zones through K-Means clustering represents a novel contribution to flood risk management in the study area. Cluster 1, characterized by a high stream frequency (4.27) and drainage texture (13.14), emerges as the highest risk zone based on both its morphometric signature and machine learning predictions. This convergence of unsupervised and supervised results strengthens confidence in the identified risk patterns and demonstrates the complementary value of these approaches.
The clustering approach aligns with recent work by Li et al. [21], who successfully employed similar techniques to delineate urban flood risk zones based on topographic and hydrological parameters. However, our study extends this framework by incorporating not only the clustering results but also their explicit connection to machine learning predictions, creating a more robust and interpretable risk assessment framework.
The identification of outlier sub-basins through DBSCAN clustering (approximately 10% of the study area) highlights areas with anomalous morphometric characteristics that might respond unpredictably during rainfall events. As Li et al. [21] note, density-based clustering can reveal not only the primary patterns within hydrological data but also identify exceptional cases that may require special management attention. These outlier zones, primarily located at the basin periphery, should be prioritized for field validation and detailed hydrological modeling to better understand their flood response characteristics.
This dual clustering approach (partition-based K-Means and density-based DBSCAN) provides complementary insights that neither method alone can deliver, addressing a methodological gap identified by Hasanuzzaman et al. [14], who called for “multi-algorithm approaches to watershed classification that can capture different aspects of hydrological similarity.”
4.6. Implications for Urban Development and Flood Management
The morphometric parameters have significant implications for urban planning and flood risk management in Medina. The moderate drainage density (2.09 km/km2) and stream frequency (3.24 streams/km2) indicate that urban development must be carefully planned to maintain natural drainage patterns. This aligns with Al-Madinah Region Municipality’s [3] recommendations for sustainable urban development in wadi systems. The high bifurcation ratio (10.50) between fifth- and sixth-order streams, significantly higher than the mean (3.73), indicates potential flow concentration points that require particular attention in urban planning.
Our findings regarding clustering-based risk zones have direct implications for zoned management approaches. The high-risk Cluster 1 areas, predominantly located in the central and southern portions of the basin, should be prioritized for structural and non-structural flood mitigation measures. As suggested by Ahmed et al. [18] “cluster-based prioritization enables more efficient allocation of limited resources by focusing interventions on areas with similar hydrological characteristics and risk profiles.”
The identification of clear threshold effects in the SHAP analysis—particularly for stream frequency, drainage texture, and overland flow length—provides actionable guidance for land use planners. Development activities that would push these parameters beyond their critical thresholds in vulnerable areas should be carefully regulated. This approach aligns with the recommendations of Bashir & Alsalman (2024) [5], who emphasized the importance of “threshold-based zoning regulations that account for the non-linear relationship between watershed modification and flood risk amplification.”
Perhaps most significantly, our spatial analysis reveals concerning overlap between high flood susceptibility zones and areas of current urban expansion, particularly in the northwestern sections of the basin. This finding echoes warnings from Tarek Waly Center [8] regarding the dangers of unplanned development in flood-prone wadis and underscores the urgent need for integrated watershed and urban planning approaches in the region.
4.7. Environmental Sustainability Considerations
The well-developed drainage network, with its hierarchical stream ordering, represents a natural flood-control system that should be preserved. This aligns with Pareta and Pareta’s [16] findings regarding the importance of maintaining natural drainage patterns in arid region watersheds. The moderate drainage density suggests that the basin has evolved to handle typical rainfall events efficiently, though as Al-Nashwan [2] notes, climate change may alter these patterns.
The morphometric analysis supports several key management considerations. In areas with slopes exceeding 16° (2.61% of the basin area), development should be restricted, [5]. The drainage texture value of 6.78 suggests that stormwater management systems should be designed to complement natural drainage patterns, particularly in urbanized areas. These recommendations align with global best practices for sustainable watershed management while addressing local environmental challenges.
4.8. Study Limitations and Future Research Directions
This study acknowledges several methodological limitations that provide directions for future research. The static nature of DEM-based analysis (30 m resolution) means temporal changes in drainage patterns due to urban development or natural processes are not automatically incorporated [2,34]. Higher-resolution DEMs (5–10 m) from sources such as LiDAR or high-resolution satellite imagery could capture fine-scale topographic features that influence local flood dynamics, particularly in urban areas where building density and infrastructure modifications significantly alter surface flow patterns.
The machine learning approaches assume that historical patterns of flood occurrence will persist under similar conditions, which may not fully account for climate change impacts or rapid urban transformation [15]. Future research should incorporate dynamic scenarios including the following: (1) temporal analysis using multi-date DEMs to track drainage pattern evolution; (2) integration of real-time precipitation and soil moisture monitoring data; (3) incorporation of climate change projections to assess future flood risk under altered precipitation patterns; and (4) the development of dynamic urban growth models that can predict morphometric parameter changes as development continues.
The transferability of GeoAI models to other wadis in the region requires investigation to develop a generalized framework for arid region flood susceptibility assessment. Cross-basin validation studies across different geological and climatic conditions would establish model robustness and enable broader application [20]. Additionally, the integration of hydrodynamic modeling with the morphometric ML framework could provide more detailed flood depth and velocity predictions for emergency planning purposes.
5. Conclusions
This comprehensive analysis of the Wadi Ranuna basin, integrating traditional morphometric approaches with advanced GeoAI techniques, provides quantitative evidence for informed decision-making in flood risk management and urban planning. This novel methodological framework addresses fundamental limitations in traditional flood susceptibility assessment by capturing the complex non-linear relationships between morphometric parameters and flood occurrence, including threshold effects and interaction patterns that conventional statistical approaches cannot adequately detect. Our morphometric analysis revealed that the basin’s elongated shape (form factor 0.17 and circularity ratio 0.23) creates natural flood-moderating characteristics, while its moderate drainage density (2.09 km/km2) indicates a balanced water distribution capacity. The basin covers a total area of 188.18 km2 with a perimeter of 101.71 km, and contains 610 streams across six orders, demonstrating a mature and well-developed drainage system.
The application of advanced machine learning algorithms revealed that GBM outperformed other models in predictive accuracy (R2 = 0.9212) and classification performance (92.31%), demonstrating the value of ensemble-based approaches for complex environmental modeling. Comprehensive validation through field verification, historical flood analysis, and cross-validation between unsupervised and supervised approaches achieved 78% spatial correspondence with documented events and 94% accuracy for very high susceptibility areas, establishing the reliability of the GeoAI approach in data-scarce arid environments. SHAP analysis provided unprecedented transparency into model behavior, identifying the stream frequency, overland flow length, and drainage texture as the most influential predictors, while revealing critical threshold effects and interaction patterns that conventional statistical approaches might miss.
K-Means clustering successfully identified three morphometrically distinct zones within the basin, with Cluster 1 exhibiting the highest flood risk potential due to elevated stream frequency and drainage texture values. This unsupervised classification aligned remarkably well with supervised flood predictions, providing cross-validation of the identified risk patterns and offering a practical framework for zone-based management approaches. DBSCAN clustering complemented these findings by identifying outlier sub-basins with anomalous characteristics that merit special attention in flood management planning.
The spatial distribution analysis reveals critical infrastructure vulnerabilities, with 67% of current development located within high to very high susceptibility zones. Approximately 23 km of major transportation corridors traverse high-risk areas, while eight critical public facilities, including educational and healthcare institutions, are positioned within flood-prone zones. These findings underscore the urgent need for risk-informed urban planning and targeted flood mitigation strategies in the region.
Based on these findings, several key management recommendations emerge. First, urban expansion in high-risk zones should be carefully regulated, particularly considering the basin’s elongated nature and identified threshold effects in morphometric parameters. Second, drainage networks must be enhanced in areas with low slope gradients where modeling indicates potential flow concentration. Third, urban planning should account for the varied topography and morphometric zones, especially in areas near higher order streams and within the high-risk cluster identified through our integrated analysis.
This study demonstrates the effectiveness of GIS-based morphometric analysis enhanced by interpretable machine learning in providing quantitative measures for watershed management. The validated spatial accuracy and strong agreement between different analytical approaches indicate that this integrated framework can be successfully applied to similar arid watersheds facing comparable challenges. However, limitations include the static nature of DEM data and the need for temporal analysis of drainage pattern changes. Future research should focus on integrating climate change scenarios, developing real-time monitoring systems, and assessing urban growth impacts on morphometric parameters and their relationship to flood susceptibility.
This research makes a significant contribution to the understanding of wadi systems in arid regions and their interactions with urban environments. The methodological framework presented here—combining traditional geomorphological knowledge with cutting-edge computational techniques—provides a template for similar studies in comparable environmental settings and represents the future of environmental risk assessment, where traditional domain expertise and artificial intelligence work in concert. The findings support evidence-based decision-making in sustainable urban development while preserving critical environmental features. As Medina continues to develop, these insights will be crucial in achieving a balance between urban growth and environmental protection, ultimately supporting the goals outlined in Saudi Arabia’s Vision 2030 for sustainable development and resilient infrastructure.
Author Contributions
Conceptualization, M.H.A. and H.A.A.; methodology, M.H.A., A.A.K. and H.A.A.; software, M.H.A., A.A.K. and H.A.A.; validation, M.H.A., A.A.K. and H.A.A.; formal analysis, M.H.A., A.A.K. and H.A.A.; investigation, M.H.A., A.A.K. and H.A.A.; resources, M.H.A., A.A.K. and H.A.A.; data curation, M.H.A., A.A.K. and H.A.A.; writing—original draft preparation, H.A.A. and M.H.A.; writing—review and editing, M.H.A., H.A.A. and A.A.K.; visualization, M.H.A., A.A.K. and H.A.A.; supervision, M.H.A., A.A.K. and H.A.A.; project administration, M.H.A., A.A.K. and H.A.A.; funding acquisition, H.A.A. All authors have read and agreed to the published version of the manuscript.
Funding
This research work was supported by the Ongoing Research Funding program (ORF-2025-848), King Saud University, Riyadh, Saudi Arabia.
Data Availability Statement
Data will be made available upon reasonable request to the corresponding and first author.
Acknowledgments
The authors extend their appreciation to the Ongoing Research Funding program (ORF-2025-848), King Saud University, Riyadh, Saudi Arabia.
Conflicts of Interest
The authors declare no conflicts of interest.
References
- Aneiba, O.I.A.; Farhan, Y.A. Applied Morphometric Analysis of Selected Basins in Jordan Using Remote Sensing and GIS. Ph.D. Thesis, The University of Jordan, Amman, Jordan, 2016. Unpublished. [Google Scholar]
- Al-Nashwan, A.A. Morphometric Characteristics of Sha’ib Tamrah Basin in As-Sulayel Governorate. Hadhramout Univ. J. Humanit. 2018, 15. Available online: https://hu.edu.ye/hu-publications/journals/index.php/hujh/article/view/400 (accessed on 7 July 2025).
- Al-Madinah Region Municipality. Hydrological Study Report for the Mitigation of Flash Flood Risks in Al-Madinah Valleys; Al-Madinah Region Municipality: Medina, Saudi Arabia, 2023. [Google Scholar]
- Al-Tuwaijri, H.A.; Al-Juaidi, F.H.; Al-Khuwaiqi, M.I. Wadi Al-Mashqar in Majmaah: Morphometric Study Using Digital Elevation Models. King Abdulaziz Univ. J. Arts Humanit. 2022, 28, 274–285. [Google Scholar]
- Bashir, B.; Alsalman, A. Flooding Hazard Vulnerability Assessment Using Remote Sensing Data and Geospatial Techniques: A Case Study from Mekkah Province, Saudi Arabia. Water 2024, 16, 2714. [Google Scholar] [CrossRef]
- Almulhim, A.I.; Al Kafy, A.; Ferdous, N.; Fattah, A.; Morshed, S.R. Harnessing urban analytics and machine learning for sustainable urban development: A multidimensional framework for modeling environmental impacts of urbanization in Saudi Arabia. J. Environ. Manag. 2024, 357, 120705. [Google Scholar] [CrossRef] [PubMed]
- Altuwaijri, H.A.; Al Kafy, A. Decoding atmospheric thermal exposure patterns with implications for environmental health and urban air quality over forty years in arid regions. Air Qual. Atmosphere Heal. 2025, 1–26. [Google Scholar] [CrossRef]
- Tarek Waly Center for Architecture and Heritage. Urban Centers Development Study in Al-Madinah Al-Munawwarah; Tarek Waly Center for Architecture and Heritage: Cairo, Egypt, 2006. [Google Scholar]
- Hajam, R.A.; Hamid, A.; Bhat, S. Application of Morphometric Analysis for Geo-Hydrological Studies Using Geo-Spatial Technology: A Case Study of Vishav Drainage Basin. Appl. Water Sci. 2013, 4, 1000157. [Google Scholar]
- Das, S.; Pardeshi, S. Morphometric Analysis of Vaitarna and Ulhas River Basins, Maharashtra, India, Using Geospatial Techniques. Appl. Water Sci. 2018, 8, 158. [Google Scholar] [CrossRef]
- Khudr, M. Geomorphological Hazards in Egypt, with a Focus on Flash Floods in the Nile Valley: A Study in Applied Geomorphology; Faculty of Arts, Ain Shams University: Cairo, Egypt, 1997. [Google Scholar]
- Alajji, A. Applying GIS to Build a Morphometric Database and Hydrological Implications in Wadi Yalmlam Basin. Master’s Thesis, Umm Al-Qura University, Mecca, Saudi Arabia, 2010. Unpublished. [Google Scholar]
- Horton, R.E. Erosional Development of Streams and Their Drainage Basins; Hydro-Physical Approach to Quantitative Morphology. Bull. Geol. Soc. Am. 1945, 56, 275–370. [Google Scholar] [CrossRef]
- Hasanuzzaman, M.; Islam, A.; Bera, B.; Shit, P.K. Flood Susceptibility Mapping Using Morphometric Parameters and GIS. In Spatial Modelling of Flood Risk and Flood Hazards. GIScience and Geo-Environmental Modelling; Pradhan, B., Shit, P.K., Bhunia, G.S., Adhikary, P.P., Pourghasemi, H.R., Eds.; Springer: Cham, Switzerland, 2022. [Google Scholar] [CrossRef]
- Khodaei, H.; Saleh, F.N.; Dalir, A.N.; Zarei, E. Future flood susceptibility mapping under climate and land use change. Sci. Rep. 2025, 15, 12394. [Google Scholar] [CrossRef] [PubMed]
- Pareta, K.; Pareta, U. Integrated Watershed Modeling and Characterization Using GIS and Remote Sensing Techniques. Indian J. Eng. 2012, 1, 81–91. [Google Scholar]
- Hajji, S.; Krimissa, S.; Abdelrahman, K.; Boudhar, A.; Elaloui, A.; Ismaili, M.; El Bouzekraoui, M.; Essbiti, M.C.; Kahal, A.Y.; Mondal, B.K.; et al. Enhancing flood prediction through remote sensing, machine learning, and Google Earth Engine. Front. Water 2025, 7, 1514047. [Google Scholar] [CrossRef]
- Ahmed, A.; Al Maliki, A.; Hashim, B.; Alshamsi, D.; Arman, H.; Gad, A. Flood susceptibility mapping utilizing the integration of geospatial and multivariate statistical analysis, Erbil area in Northern Iraq as a case study. Sci. Rep. 2023, 13, 11919. [Google Scholar] [CrossRef] [PubMed]
- Al-Aizari, A.R.; Alzahrani, H.; AlThuwaynee, O.F.; Al-Masnay, Y.A.; Ullah, K.; Park, H.-J.; Al-Areeq, N.M.; Rahman, M.; Hazaea, B.Y.; Liu, X. Uncertainty Reduction in Flood Susceptibility Mapping Using Random Forest and eXtreme Gradient Boosting Algorithms in Two Tropical Desert Cities, Shibam and Marib, Yemen. Remote Sens. 2024, 16, 336. [Google Scholar] [CrossRef]
- He, F.; Liu, S.; Mo, X.; Wang, Z. Interpretable flash flood susceptibility mapping in Yarlung Tsangpo River Basin using H2O Auto-ML. Sci. Rep. 2025, 15, 1702. [Google Scholar] [CrossRef] [PubMed]
- Li, J.; Zheng, A.; Guo, W.; Bandyopadhyay, N.; Zhang, Y.; Wang, Q. Urban flood risk assessment based on DBSCAN and K-means clustering algorithm. Geomat. Nat. Hazards Risk 2023, 14, 2250527. [Google Scholar] [CrossRef]
- Schumm, S.A. Evolution of Drainage Systems and Slopes in Badlands at Perth Amboy, New Jersey. Bull. Geol. Soc. Am. 1956, 67, 597–646. [Google Scholar] [CrossRef]
- Strahler, A.N. Quantitative Analysis of Watershed Geomorphology. Trans. Am. Geophys. Union 1957, 38, 913–920. [Google Scholar] [CrossRef]
- Verdin, K.L.; Godt, J.W.; Funk, C.; Pedreros, D.; Worstell, B.; Verdin, J. Development of A Global Slope Dataset for Estimation of Landslide Occurrence Resulting from Earthquakes; US Geological Survey: Colorado, CO, USA, 2007.
- Smith, K.G. Standards for Grading Texture of Erosional Topography. Am. J. Sci. 1950, 248, 655–668. [Google Scholar] [CrossRef]
- Chapi, K.; Singh, V.P.; Shirzadi, A.; Shahabi, H.; Bui, D.T.; Pham, B.T.; Khosravi, K. A novel hybrid artificial intelligence approach for flood susceptibility assessment. Environ. Model. Softw. 2017, 95, 229–245. [Google Scholar] [CrossRef]
- Tehrany, M.S.; Pradhan, B.; Jebur, M.N. Flood susceptibility mapping using a novel ensemble weights-of-evidence and support vector machine models in GIS. J. Hydrol. 2014, 512, 332–343. [Google Scholar] [CrossRef]
- Sofia, G.; Yang, Q.; Shen, X.; Mitu, M.F.; Patlakas, P.; Chaniotis, I.; Kallos, A.; Alomary, M.A.; Alzahrani, S.S.; Christidis, Z.; et al. A Nationwide Flood Forecasting System for Saudi Arabia: Insights from the Jeddah 2022 Event. Water 2024, 16, 1939. [Google Scholar] [CrossRef]
- Martinis, S.; Plank, S.; Ćwik, K. The Use of Sentinel-1 Time-Series Data to Improve Flood Monitoring in Arid Areas. Remote Sens. 2018, 10, 583. [Google Scholar] [CrossRef]
- Al-Ruzouq, R.; Shanableh, A.; Jena, R.; Gibril, M.B.A.; Hammouri, N.A.; Lamghari, F. Flood susceptibility mapping using a novel integration of multi-temporal sentinel-1 data and eXtreme deep learning model. Geosci. Front. 2024, 15, 101780. [Google Scholar] [CrossRef]
- Twele, A.; Cao, W.; Plank, S.; Martinis, S. Sentinel-1-based flood mapping: A fully automated processing chain. Int. J. Remote Sens. 2016, 37, 2990–3004. [Google Scholar] [CrossRef]
- Al-Areeq, A.M.; Abba, S.I.; Yassin, M.A.; Benaafi, M.; Ghaleb, M.; Aljundi, I.H. Computational Machine Learning Approach for Flood Susceptibility Assessment Integrated with Remote Sensing and GIS Techniques from Jeddah, Saudi Arabia. Remote Sens. 2022, 14, 5515. [Google Scholar] [CrossRef]
- Bashir, B. Morphometric Parameters and Geospatial Analysis for Flash Flood Susceptibility Assessment: A Case Study of Jeddah City along the Red Sea Coast, Saudi Arabia. Water 2023, 15, 870. [Google Scholar] [CrossRef]
- Bargan, M.A.A. Morphometric Characteristics Study of Wadi Gaza Basin and its Water Harvesting Potential Using GIS. Master’s Thesis, An-Najah National University, Nablus, Palestine, 2015. [Google Scholar]
- Al-Subahi, S.S. Morphometric Characteristics of Wadi As-Salaa Basin, East of Jeddah, Western Saudi Arabia. Master’s Thesis, King Abdulaziz University, Jeddah, Saudi Arabia, 2018. [Google Scholar]
- Saaty, T.L. Analytic Hierarchy Process. In Encyclopedia of Operations Research and Management Science; Gass, S.I., Fu, M.C., Eds.; Springer: Boston, MA, USA, 2013. [Google Scholar] [CrossRef]
- Seydi, S.T.; Kanani-Sadat, Y.; Hasanlou, M.; Sahraei, R.; Chanussot, J.; Amani, M. Comparison of Machine Learning Algorithms for Flood Susceptibility Mapping. Remote Sens. 2023, 15, 192. [Google Scholar] [CrossRef]
- Altuwaijri, H.A.; Al Kafy, A.; Rahaman, Z.A. Multi-temporal remote sensing and geospatial analysis for urban ecosystem service dynamics: A three-decade assessment of land surface transformation in Jeddah, Saudi Arabia. Phys. Chem. Earth, Parts A/B/C 2025, 139. [Google Scholar] [CrossRef]
- Al Kafy, A.; Altuwaijri, H.A. Eco-climatological modeling approach for exploring spatiotemporal dynamics of ecosystem service values in response to land use and land cover changes in Riyadh, Saudi Arabia. Theor. Appl. Clim. 2024, 155, 9497–9516. [Google Scholar] [CrossRef]
Disclaimer/Publisher’s Note: The statements, opinions and data contained in all publications are solely those of the individual author(s) and contributor(s) and not of MDPI and/or the editor(s). MDPI and/or the editor(s) disclaim responsibility for any injury to people or property resulting from any ideas, methods, instructions or products referred to in the content. |
© 2025 by the authors. Licensee MDPI, Basel, Switzerland. This article is an open access article distributed under the terms and conditions of the Creative Commons Attribution (CC BY) license (https://creativecommons.org/licenses/by/4.0/).