Article

Oceanography and Culture Shape Morphometric Divergence in Portunus pelagicus: Defining Actionable Management Units for Climate-Resilient Recreational Fisheries in Asia

1
School of Economics and Management, Sanming University, Sanming 365004, China
2
Department of Leisure & Tourism Management, Shu-Te University, Kaohsiung 82445, Taiwan
3
Department of Hospitality and Baking Management, Shu-Te University, Kaohsiung 82445, Taiwan
*
Authors to whom correspondence should be addressed.
These authors contributed equally to this work.
Water 2025, 17(18), 2783; https://doi.org/10.3390/w17182783
Submission received: 23 August 2025 / Revised: 16 September 2025 / Accepted: 17 September 2025 / Published: 21 September 2025
(This article belongs to the Special Issue Marine Biodiversity and Its Relationship with Climate/Environment)

Abstract

Sustainable management of Portunus pelagicus is hindered by uncertain stock boundaries across rapidly changing marginal seas and culturally diverse markets. We measured 12 size-adjusted morphometrics in 525 adults from five sites (Kyushu, Xiamen, Tainan, Hong Kong, and Singapore). Canonical variate analysis resolved three robust groups that mirror oceanographic regimes: a Kuroshio–China group (Kyushu, Xiamen, and Hong Kong), a Taiwan Strait subgroup (Tainan), and a Southeast Asia group (Singapore). Permutation tests (1000 runs) showed near-zero probabilities of observing the low misclassification rates by chance (p < 0.001). A reproductive trait (female AB3W) displayed group-specific allometric slopes, consistent with local functional demands. We integrate these results with a cultural ecology lens—linking ornamental carapace valuation to selective harvest—to propose morphological management units (MMUs) and region-specific rules that can be implemented immediately and refined with genomics. This work reframes a descriptive morphometric study into a socio-ecological mechanism for climate-ready, actionable fisheries governance.

1. Introduction

Crab fisheries across East and Southeast Asia are embedded in coupled human–ocean systems; monsoon- and Kuroshio-driven currents structure larval exchange, while markets—and, in places, spiritual symbolism attached to carapace markings—shape selective harvest. For Portunus pelagicus, a keystone of recreational and small-scale fisheries, these forces likely interact, yet their joint imprint on morphology remains under-resolved. In an era of rapid climate change, understanding the drivers of marine biodiversity is paramount for developing resilient conservation strategies [1]. For species of high economic and cultural value, this challenge extends beyond biology into the complex dynamics of socio-ecological systems [2].
Portunus pelagicus (Linnaeus 1758) exemplifies this intersection. As a key component of coastal ecosystems [3] and a pillar of Asia’s burgeoning recreational fishing economy, its populations face mounting pressures from overharvesting. These pressures are not uniform; in some regions, particularly Southeast Asia, consumer demand is intensified by the crab’s cultural symbolism [4,5], creating a distinct “culturally driven fishery pressure”. Furthermore, the species’ vast distribution across the temperate-to-tropical zones of the Western Pacific exposes it to a mosaic of oceanographic conditions, primarily governed by major current systems like the Kuroshio and the South China Sea circulation. These currents are known to mediate larval dispersal and gene flow, structuring populations [6]. However, these currents are themselves being altered by climate change [7], with uncertain consequences for population connectivity and local adaptation [8]. The morphological variations observed across its range [9]—from carapace shape to abdominal dimensions—are likely not random but represent adaptive responses to these powerful environmental gradients [10]. Such morphometric diversity serves as a crucial, yet under-studied, baseline for monitoring the impacts of future climate shifts.
Morphometry offers a scalable lens on population structure when genetic baselines are limited [11,12]. However, to move beyond description, two questions must be addressed: (i) do oceanographic provinces map onto repeatable morphological groupings after size normalization [7,13]? (ii) Do functionally meaningful traits—and the cultural preferences that amplify their market value—suggest management units that are practical now and compatible with future genomic delineation [8,14]? Here, we analyze 12 allometry-adjusted traits from 525 crabs sampled from Japan to Singapore (five sites and two seasons). We test whether canonical axes of shape variation partition populations along major current systems (Kuroshio, Taiwan Strait, and the South China Sea) [6,9] and whether key traits (e.g., female pleomere width, and AB3W) show divergent growth rules consistent with reproduction-related function [15,16]. Finally, we embed results in a cultural ecology framework to derive morphological management units (MMUs) and concrete, region-specific rules [4,5].
In an era of accelerating climate change and anthropogenic pressures, understanding the drivers of intraspecific diversity in marine species is essential for resilient fisheries management [17,18]. The blue swimmer crab (Portunus pelagicus), a socio-economically vital species in East and Southeast Asian recreational fisheries [19,20], exemplifies how oceanographic processes and cultural practices interact to shape population structure [4,13]. Despite its wide distribution across marginal seas, previous studies have largely focused on genetic or ecological aspects in isolation [21], overlooking the integrated role of morphology as a proxy for adaptive divergence and management units [11,22]. This study addresses this gap by examining size-adjusted morphometric traits in 525 adult crabs from five sites (Kyushu, Xiamen, Tainan, Hong Kong, and Singapore), revealing three distinct groups aligned with oceanographic regimes and cultural harvest preferences [5,6], thereby proposing actionable “morphological management units” (MMUs) for immediate implementation [8,23].
Oceanographic barriers have long been recognized as key architects of marine population structure, particularly in species with planktonic larval stages like P. pelagicus. The Kuroshio Current and its extensions facilitate larval dispersal in northern populations, while monsoon-driven circulations in the South China Sea limit connectivity southward, as evidenced by phylogeographic analyses showing restricted gene flow across these regimes [6,24]. Concurrently, cultural factors amplify selective pressures; in Southeast Asia, carapace markings perceived as spiritually symbolic drive premium markets, akin to patterns observed in related portunids where ornamental valuation influences harvest intensity [4,25]. However, integrated assessments linking these drivers to morphometric variation remain scarce, with most research confined to single-region studies or univariate traits, failing to capture multivariate shape differences that reflect functional adaptations [9,26].
Morphometric approaches offer a cost-effective alternative to genomics for delineating stocks, especially in data-limited fisheries, by isolating shape from size through allometric corrections. Historical applications have demonstrated environmental gradients inducing coordinated trait shifts, such as in carapace and abdominal dimensions linked to locomotion and reproduction [12,27]. Yet comparisons with recent high-impact studies reveal inconsistencies; for instance, genetic revisions of P. pelagicus delineated broad Indo-Pacific clades but overlooked fine-scale morphometric signals [24,28], while analogous work on congeneric species highlighted ocean current-mediated divergence without cultural overlays [7,13]. This study innovates by employing canonical variate analysis (CVA) and permutation tests on 12 traits, achieving near-zero misclassification rates (p < 0.001), thus providing higher resolution than prior univariate methods and bridging biophysical and socio-cultural drivers.
The observed groupings—a Kuroshio–China group (Kyushu, Xiamen, and Hong Kong), Taiwan Strait subgroup (Tainan), and Southeast Asia group (Singapore)—align with hydrodynamic models of larval exchange, where current bifurcations act as semi-permeable barriers [6,9]. Divergent allometric slopes in reproductive traits (e.g., female AB3W) suggest local optimizations for fecundity under varying salinities and substrates, consistent with adaptive responses in portunids [15,16]. In contrast to studies emphasizing genetic homogeneity in high-dispersal taxa [29,30], our findings indicate rapid phenotypic divergence, potentially amplified by culturally selective harvesting that favors symbolically marked individuals, as seen in premium-driven fisheries [5,31].
By integrating size-adjusted morphometrics with oceanographic provinces and culturally selective harvest, we demonstrate how multivariate shape can function as an operational socio-ecological indicator that delineates region-specific, climate-ready management units for marginal-sea recreational fisheries. Practically, the proposed MMUs enable region-specific regulations, such as size limits tailored to group-specific growth rates, enhancing sustainability amid declining yields [32,33]. Practically, our morphometric framework provides a low-cost, scalable indicator that agencies can deploy now to tailor size limits, coordinate transboundary efforts, and track climate-driven shifts in stock structure across Indo-Pacific marginal seas.

2. Materials and Methods

2.1. Sample Collection

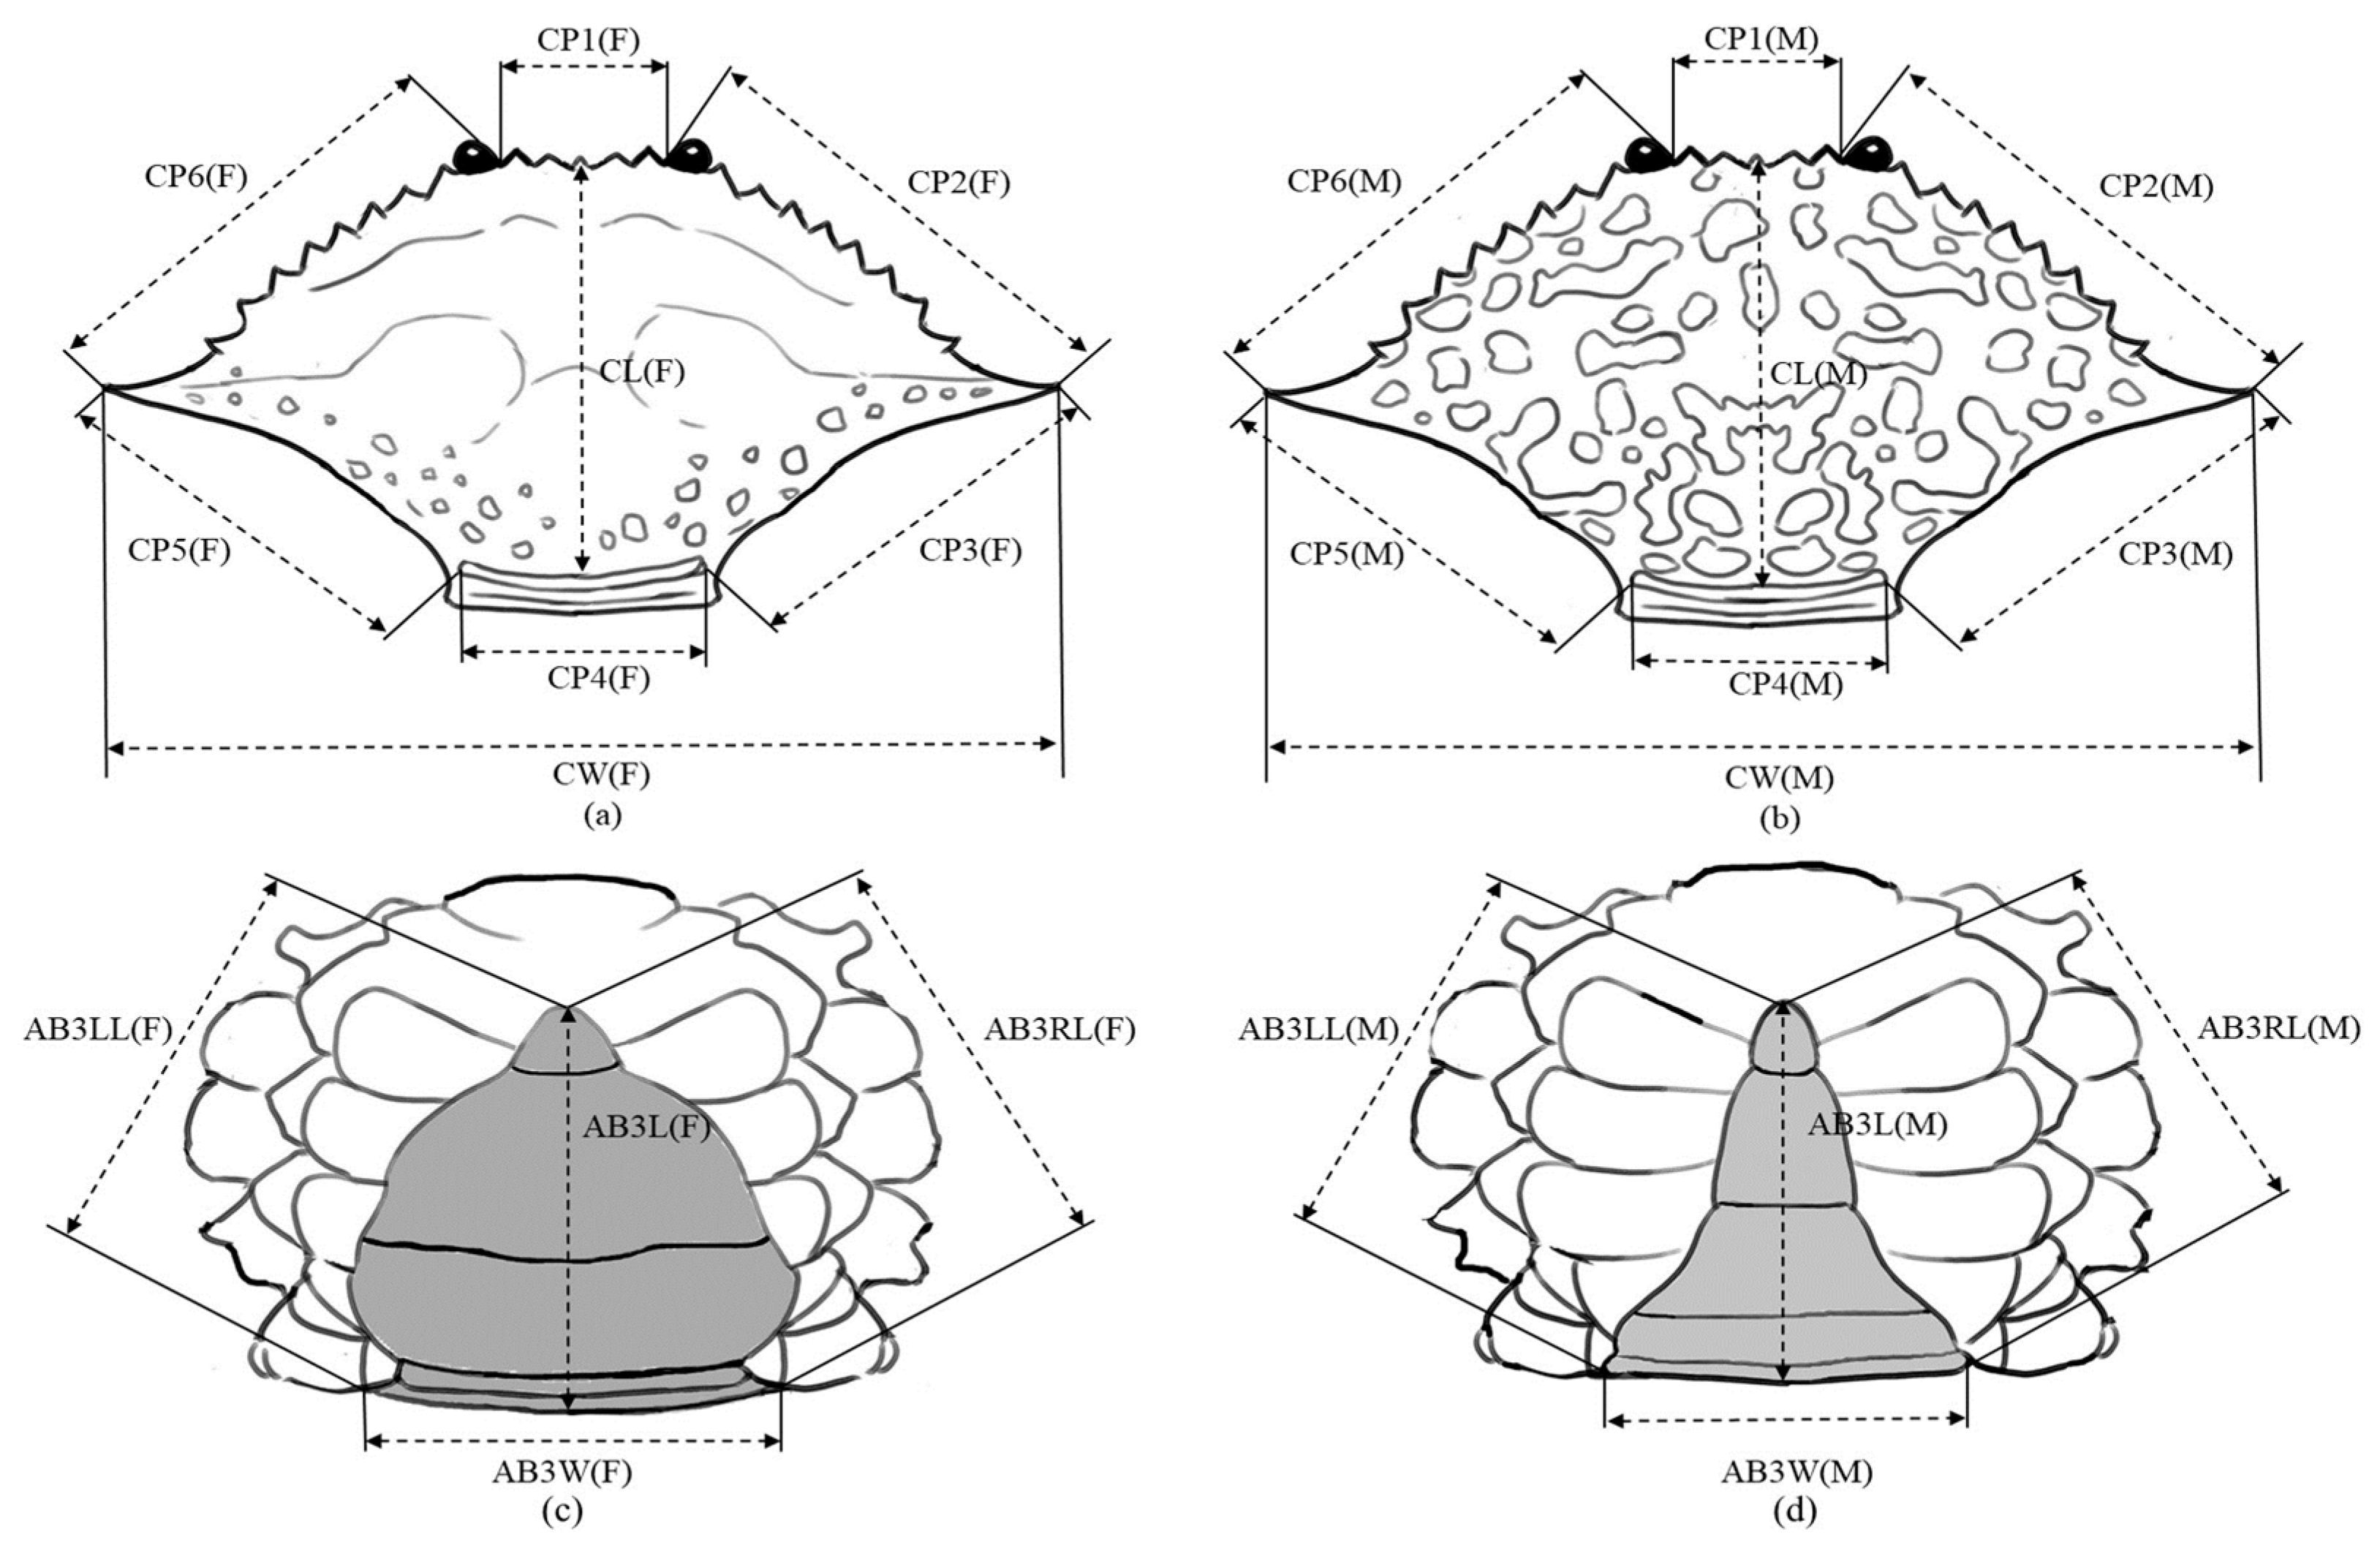
From October 2023 to January 2024, crabs were sampled across five localities spanning three regional groupings: Kyushu, Japan (KS); Xiamen (XM) and Hong Kong (HK), China group; Tainan, Taiwan (TN), China subgroup; and Singapore (SG), Southeast Asia group (Figure 1). These sites were selected to capture broad geographic variation while maintaining a compact collection window to limit temporal heterogeneity. Standardized field effort was applied at each location to enhance comparability among regions. Specimens were captured using cage traps appropriate for nearshore habitats, immediately retrieved, and sexed on deck based on external abdominal morphology. Sex assignment enabled stratified analyses by sex where relevant and reduced classification bias at later stages. All morphometric work was performed on fresh individuals to avoid dehydration artifacts and deformation due to preservation. To control for ontogenetic allometry and ensure cross-site comparability, we analyzed only adults within sex-specific 10 mm carapace width (CW) classes defined a priori. Specifically, females: 90–150 mm CW (90–99, 100–109, …, 140–149 mm); males: 80–140 mm CW (80–89, 90–99, …, 130–139 mm). Individuals outside these windows or with damage affecting measurement landmarks were excluded. This size-stratified design improves inferences about shape differences among areas by minimizing confounding due to growth stage. Individuals that exhibited major carapace damage in measurement regions were not included to ensure data integrity. Measurements were taken with digital calipers and recorded to the nearest 0.01 mm, with instrument zeroing verified before each session. When feasible, a subset of specimens was re-measured to confirm repeatability; any discrepancies were resolved immediately at the bench. Table 1 summarizes sample sizes, locality codes, and the mean and range of carapace lengths and widths used in subsequent analyses, providing a transparent map between raw observations and analytical units. In total, 525 individuals were processed under a unified protocol. Twelve morphometric traits were recorded for each crab following a fixed landmarking scheme (Figure 2): carapace width (CW) and carapace length (CL); frontal teeth span (CP1); right anterolateral margin (CP2); right posterolateral margin (CP3); posterior margin (CP4); left posterolateral margin (CP5); left anterolateral margin (CP6); length of the third pleomere (AB3L); right and left third pleomere lengths (AB3RL and AB3LL); and width of the third pleomere (AB3W) [34,35]. Recording the bilaterally paired measurements separately allows explicit assessment of lateral asymmetry rather than assuming symmetry a priori. Terminology and measurement definitions follow the cited references to ensure consistency with prior work. Finally, the site codes (KS, XM, HK, TN, and SG) are used throughout figures and tables to maintain a stable cross-reference between geography and morphometric datasets. To limit temporal heterogeneity while maximizing spatial comparability, we adopted a compact cross-site sampling window (October 2023–January 2024) and analyzed adult, size-stratified specimens only. We excluded molting or damaged individuals and applied trait-specific allometric standardization to control for size/ontogeny, thereby reducing potential seasonal confounding of shape.

2.2. Morphometric Variation Analyses

We modeled allometry as Y = aXb with carapace width (CW) as X [12,25,26,36,37,38,39,40]. Parameters were estimated by log-transforming to logY = loga + blogX. Size standardization used Yadj = Y(CWref/CW)b, where CWref is the overall mean CW. We then performed CVA on adjusted traits, visualized the first two canonical axes with 95% confidence ellipses, and computed Mahalanobis-based UPGMA clustering. Classification robustness was assessed by leave-one-out cross-validation and permutation tests (5000 label randomizations); significance was reported as p < 0.00 when fewer than five permutations yielded lower misclassification than the observed. This equation facilitates the standardization of all relevant attributes in alignment with Equation (1):
Y i * = Y i X i X ¯ b
To reduce the influence of overall body size on morphometric traits, the correlation coefficients between each pair of morphometric variables were calculated before and after size effect correction. As expected, the strength of the correlations generally decreased following normalization, supporting the hypothesis that size contributed substantially to the initial correlations [41]. After standardization, multivariate statistical analyses were conducted to explore morphometric differences among populations. Canonical Variate Analysis (CVA) was applied to maximize between-group separation relative to within-group variance, with canonical vectors derived from linear combinations of the original variables [27,42]. The first two canonical functions were plotted to visualize morphological differentiation, with 95% confidence ellipses constructed around group centroids to indicate statistical separation [43]. In parallel, Hierarchical Clustering Analysis was performed using the Unweighted Pair-Group Method with Arithmetic Means (UPGMA), based on Mahalanobis distances calculated between population centroids. This distance metric was selected due to its invariance to scale and its reliability in evaluating multivariate group differences [27]. The resulting dendrogram revealed clustering patterns among the five sampling sites. To assess the statistical robustness of the observed groupings, a permutation test was conducted. In this procedure, individuals were randomly assigned to groups and subjected to discriminant analysis. The resulting cross-validation estimator (Pc), representing the proportion of misclassified individuals under random assignment, was compared to the actual misclassification rate (Po). The procedure was repeated over 5000 iterations, and the proportion of permuted trials where Pc < Po was used to determine statistical significance [41,44].

3. Results

3.1. Oceanographic Mirroring of Morphometric Space

Table 2 details the intercorrelations among specific features before and after correcting for size effects. While most correlation coefficients were initially highly significant, their significance decreased markedly after this correction. This suggests that the dataset used for subsequent analyses was largely unaffected by size effects. Figure 3 presents the hierarchical clustering results as dendrograms for both male and female samples. The clustering patterns were strikingly congruent between genders, dividing the five samples into two main clusters. The first cluster contained all samples from the China subgroup (KS, XM, and HK), while the second comprised the Southeast Asia group (SG). A further subdivision within the China cluster also revealed a distinct subgroup including TN. Finally, Table 3 tabulates the results of the canonical variate analysis (CVA) for each gender, showing the primary and secondary eigenvectors and the proportion of total variance explained by the first two eigenvalues.
After size correction, CVA separated specimens into three clusters with 95% confidence ellipses non-overlapping for the major centroids: Kuroshio–China group (KCG: Kyushu, Xiamen, and Hong Kong), Taiwan Strait subgroup (Tainan), and Southeast Asia group (Singapore). In females, the first two canonical variables explained 86% and 11% of variance; in males, 91% and 7%. Cross-validation yielded misclassification rates ≤0.05 between groups; permutation tests (n = 1000) returned p ≈ 0 (Table 3; Figure 3).

3.2. Morphometric Evidence of Population Divergence

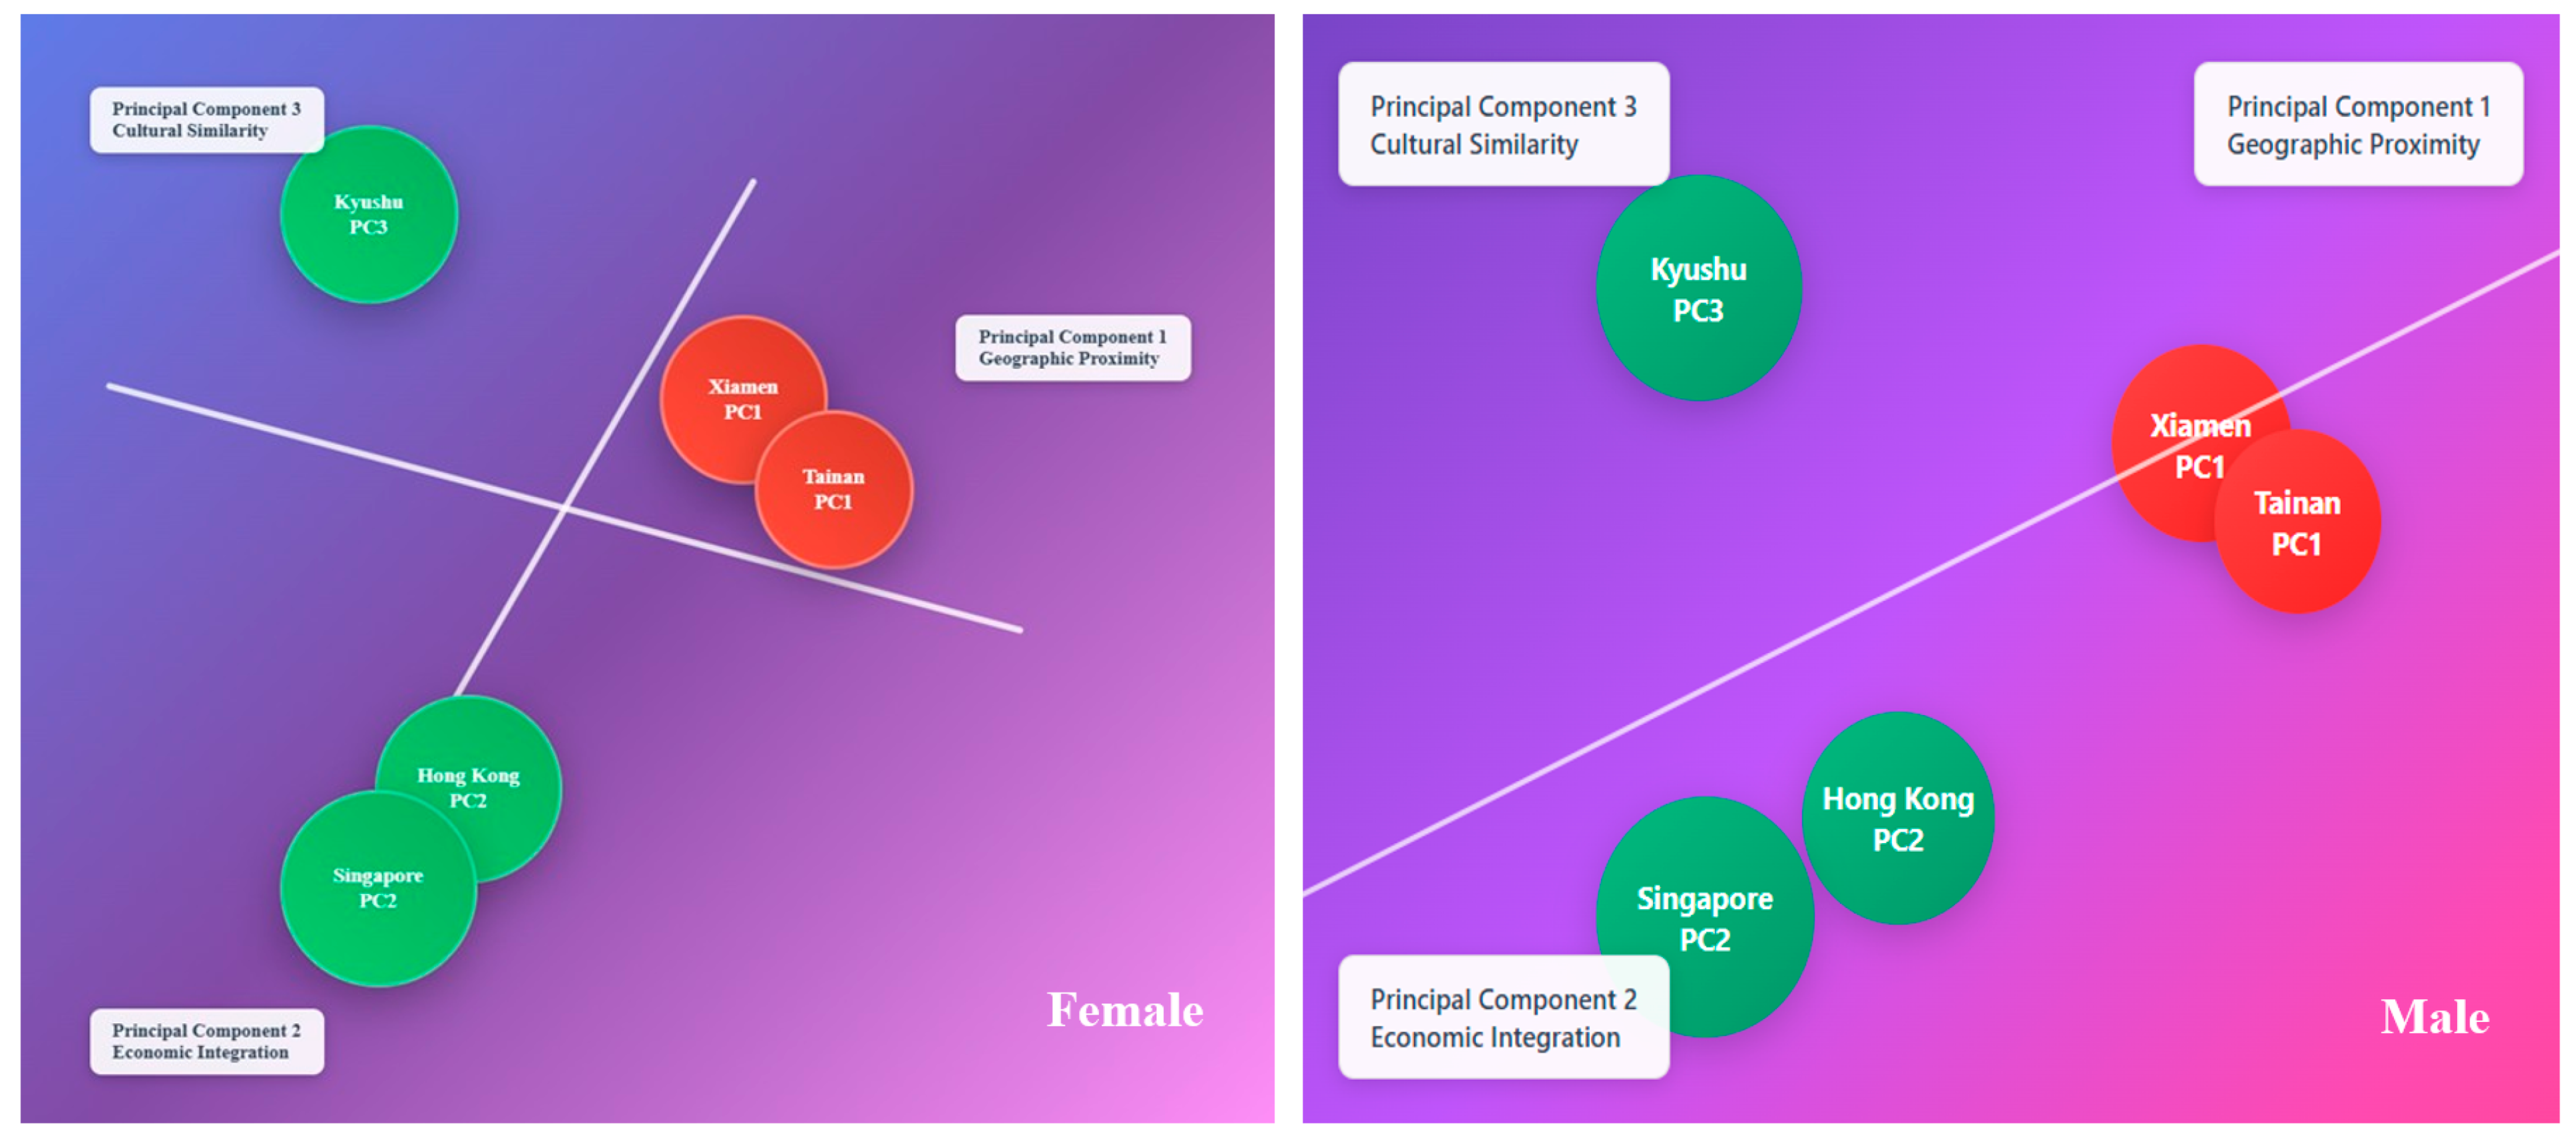
Canonical variate analysis (CVA) revealed significant morphometric differentiation among the five populations of Portunus pelagicus. The first two canonical variables explained most of this variation in both sexes, accounting for 97% of the total variance in females and 98% in males (Table 4). Key traits driving this separation were related to frontal teeth (CP1) and abdominal dimensions (AB3RL, AB3W, and AB3LL), with loading values from 0.34 to 0.93. A plot of canonical scores clearly segregated the samples into three distinct clusters for both sexes: the China group (KS, XM, and HK), a China Subgroup (TN), and the Southeast Asian group (SG) (Figure 4). This three-group structure was independently confirmed by UPGMA clustering based on Mahalanobis distances (Figure 5).
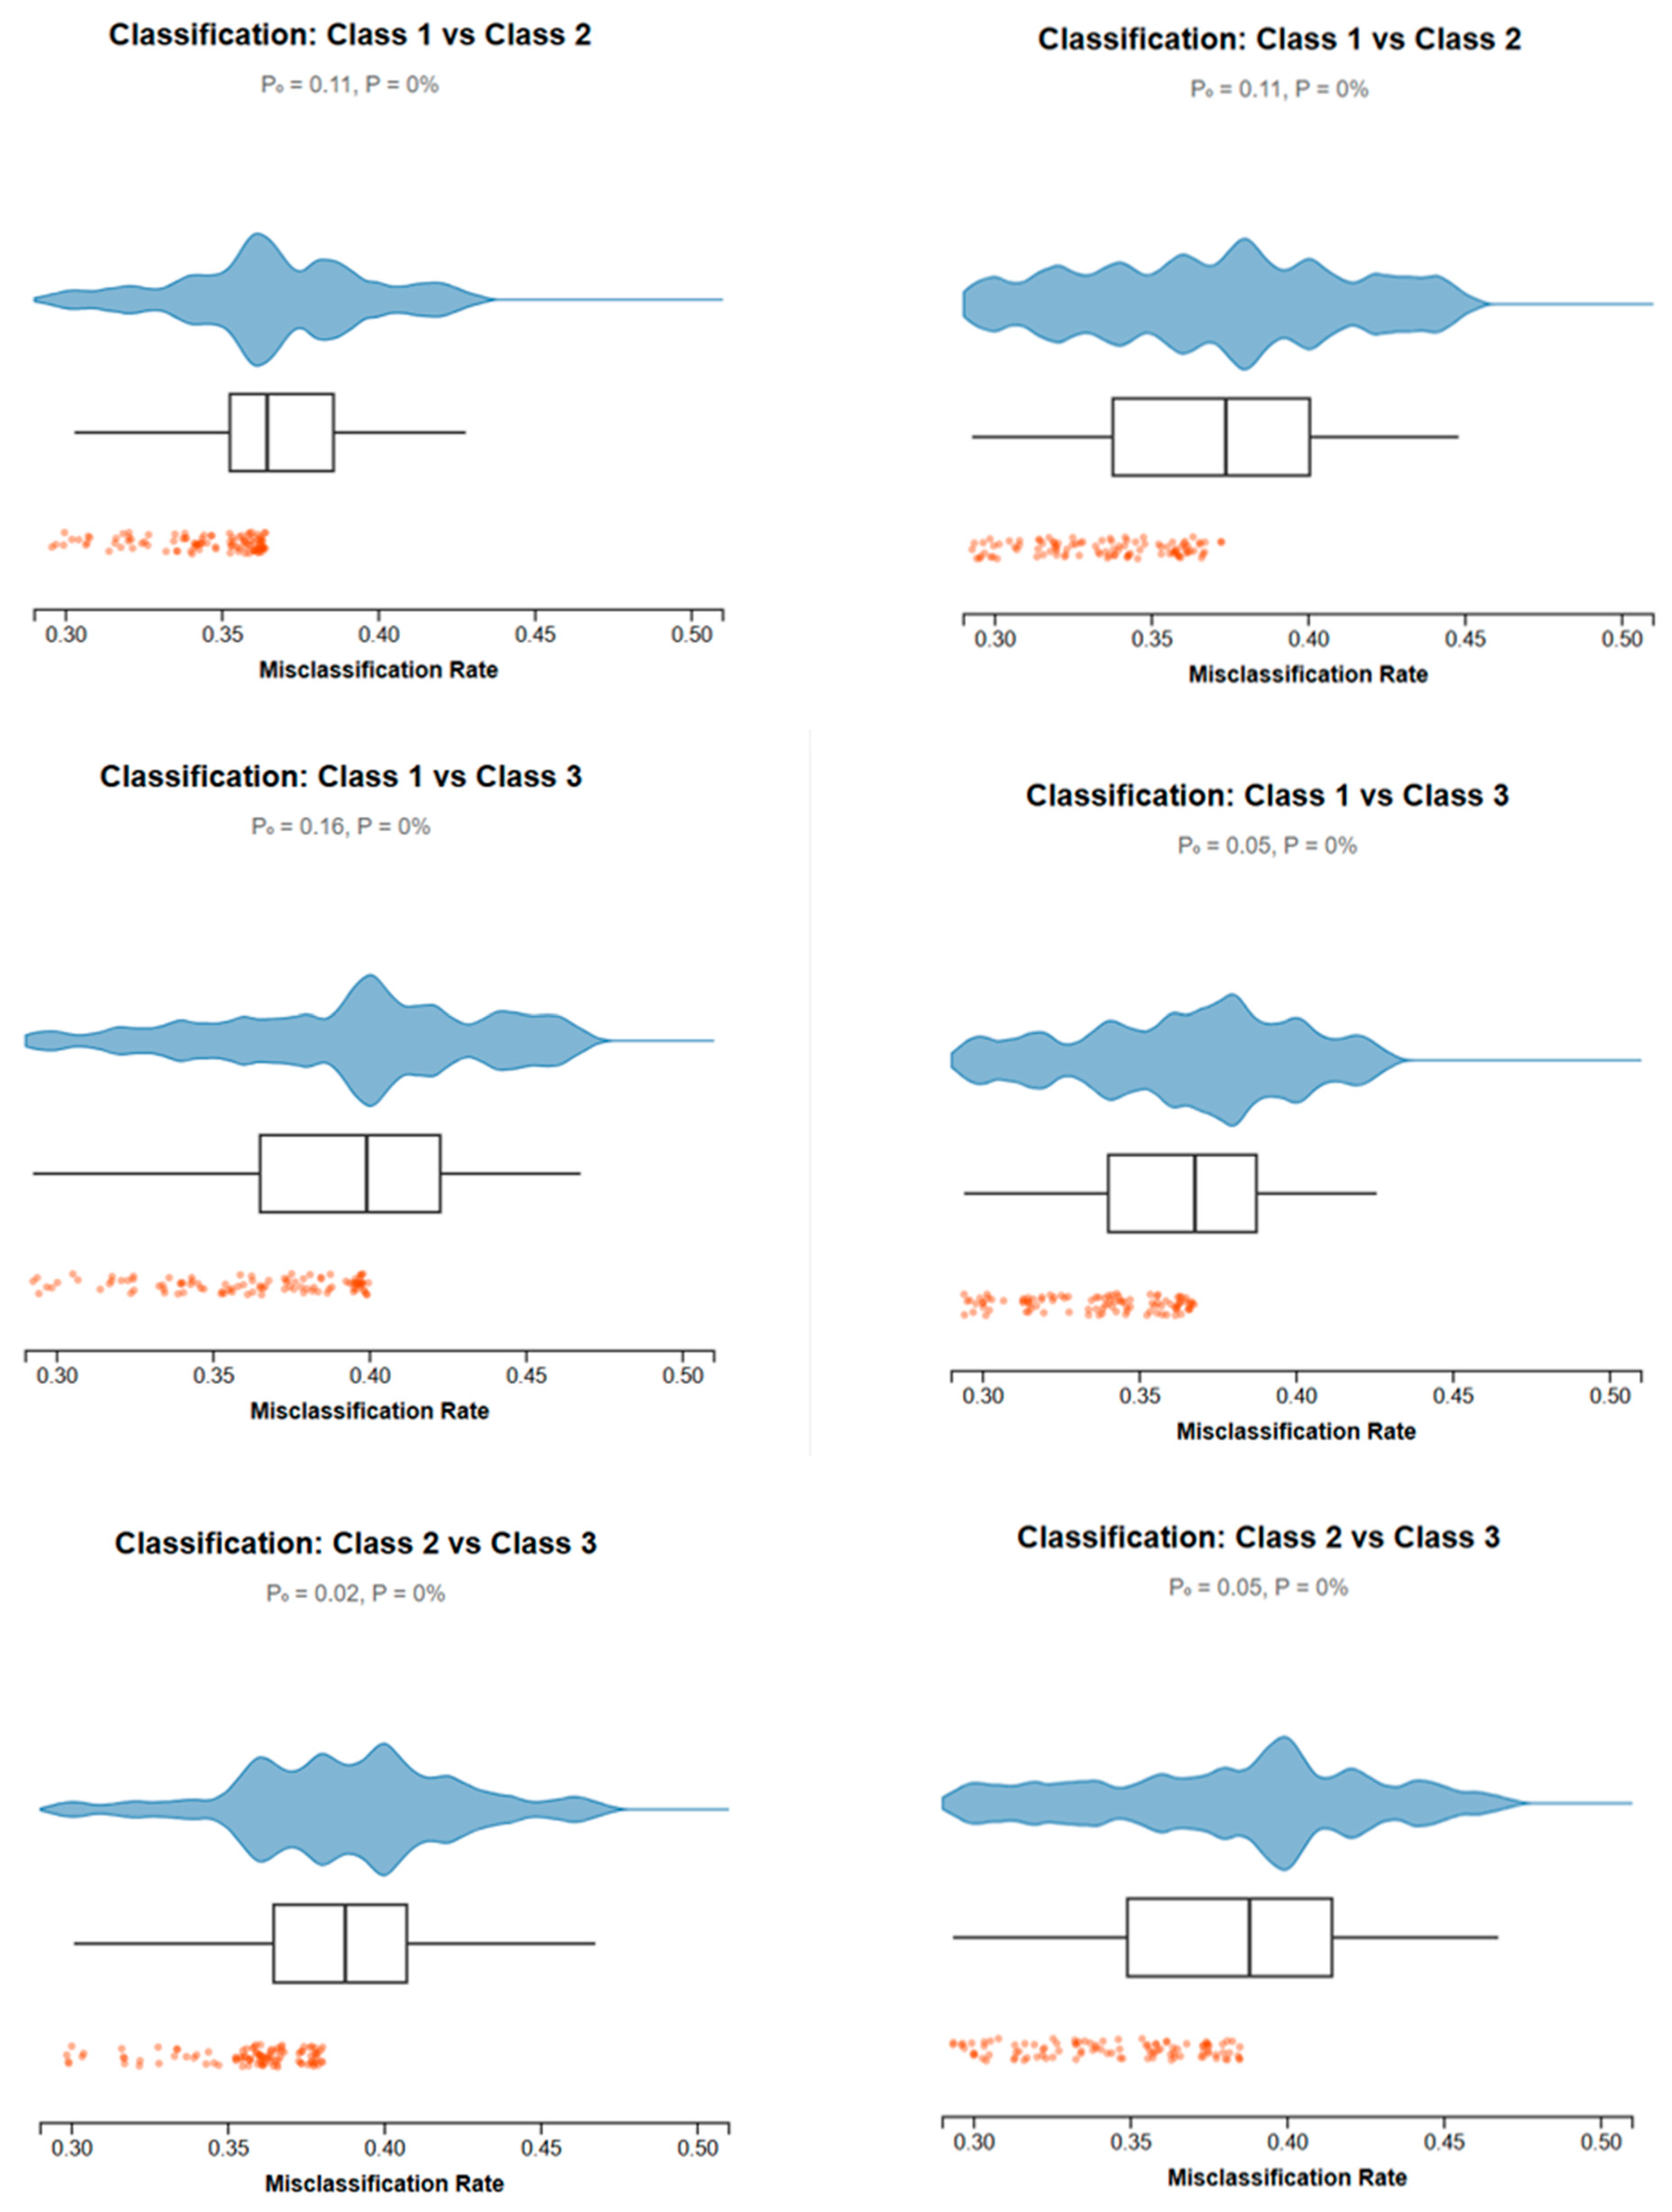
The robustness of this classification was validated using permutation tests (Figure 6). Observed misclassification rates (Po) between the main geographic groups were extremely low (0.02–0.05) and significantly better than random chance (p = 0), confirming that the morphometric divergence reflects true biological separation.
We also observed further differentiation in the allometric growth of abdominal width (AB3W), a functionally important trait. Regression analyses showed that growth coefficients (b values) differed significantly across all groups and sexes (Table 3). Growth rates progressively increased from the China Group to the China Subgroup and the Southeast Asian Group in both females (b = 1.62 to 1.75) and males (b = 1.58 to 1.68). These strong regional differences in growth patterns, along with high correlations between abdominal and carapace traits shown in the heatmap, suggest coordinated morphometric evolution driven by local adaptation.
In conclusion, our combined analyses of CVA, clustering, permutation tests, and allometric growth provide converging evidence for clear morphometric divergence among P. pelagicus populations in the region. These findings underscore the need for spatially explicit management strategies to ensure the sustainable conservation and exploitation of this species.
Table 3. Eigenvectors for CV1 and CV2, together with the shares of total variance explained by the first two CVA eigenvalues.
Female Male
VariableFirst
Eigenvector
Second
Eigenvector
First
Eigenvector
Second
Eigenvector
CL0.75−0.080.350.75
CP10.340.82−0.730.47
CP20.74−0.630.77−0.32
CP30.83−0.320.51−0.75
CP40.740.310.220.57
CP50.87−0.240.16−0.72
CP60.73−0.650.78−0.43
AB3L0.890.350.830.37
AB3RL0.870.340.780.34
AB3LL0.90.310.720.36
AB3W0.790.090.370.53
Eigenvalue1.340.581.340.58
Percentage variance86%11%91%7%

3.3. Functional Trait Divergence

Assessment of discriminative performance via the probability of error Po (interpreted here as the estimated misclassification probability) revealed a clear signal of regional structuring. For females, the SAG–CSG contrast yielded Po = 0.05, whereas comparisons among Southeast Asia sampling units within SAG produced Po = 0.11 (Figure 4). For males, the analogous values were Po = 0.02 for SAG–CSG and Po = 0.16 within SAG (Figure 4). Across all contrasts, permutation-based randomization tests returned p < 0.001 (to numerical precision), indicating that the low misclassification rates are not explainable by random assignment. Taken together, these outcomes provide strong statistical support for significant morphometric differentiation among the three regional groupings. The sex-stratified results further suggest that between-region separations are more pronounced in males, whereas within-region heterogeneity—particularly among Southeast Asia samples—remains comparatively higher, consistent with subtle intra-regional variation superimposed on a strong inter-regional signal. Female AB3W exhibited significantly different allometric exponents across groups (KCG < Tainan < Singapore; all p < 0.001), suggesting region-specific reproductive or locomotor demands. Trait inter-correlation matrices showed tight coupling among abdominal elements and peripheral carapace features, particularly in males, indicating coordinated evolution within provinces. Internal consistency checks and corrections. The total sample size is 525 (Table 1 sums) group labels were harmonized (see Methods and figure captions) to avoid conflating geography (e.g., Kyushu) with “China group” terminology.
Table 4. Population-specific allometric growth coefficients for morphometric traits.
Population GroupGenderFeatureGrowth Rate
(b)
Regression
Equation
Y = MX + C
R2Statistical
Significance
(p-Value)
China Group (CG)FemaleAbdomen (AB3W)1.62Y = 1.62X + 0.2010.885<0.001
Male1.58Y = 1.58X + 0.1870.872<0.001
China Subgroup (CSG)FemaleAbdomen (AB3W)1.71Y = 1.71X + 0.2180.901<0.001
Male1.65Y = 1.65X + 0.1950.892<0.001
Southeast Asia GroupFemaleAbdomen (AB3W)1.75Y = 1.75X + 0.2250.912<0.001
Male1.68Y = 1.68X + 0.2090.884<0.001

4. Discussion

4.1. Currents, Provinces, and Constrained Exchange

Morphometric axes tracked major current systems; the Kuroshio and its extension homogenize the KCG, while the Taiwan Strait branch and monsoon-driven South China Sea circulation isolate Tainan and Singapore, respectively. Concordance among CVA, clustering, and permutation tests indicates the patterns are not sampling artifacts but likely reflect dispersal constraints and province-specific selection.
Oceanographic currents are powerful engines of marine evolution, creating barriers and selective pressures that drive population divergence. Here, we show how major current systems in the Western Pacific have sculpted the morphology of the blue swimmer crab, P. pelagicus. Our analysis reveals three statistically robust and morphometrically distinct populations whose geographical boundaries align precisely with major hydrographic features. The “China group” (CG), encompassing Kyushu, Xiamen, and Hong Kong, is unified by the homogenizing influence of larval dispersal within the Kuroshio Extension [6,45]. In contrast, the “China subgroup” (CSG) from Tainan, Taiwan, is isolated by a branch of the Kuroshio Current in the Taiwan Strait, a known driver of local adaptation. A third, the “Southeast Asian group” (SAG) in Singapore, is segregated by the complex monsoon-driven circulation of the South China Sea, which functions as a significant barrier to gene flow [9].
This hydrographic structuring is mirrored by distinct morphological adaptations tailored to local environmental regimes. CG crabs have evolved significantly broader carapaces (p < 0.001), a plausible adaptation for stability in the turbulent Kuroshio Extension [46]. CSG crabs from Tainan’s resource-rich habitats exhibit elongated chelipeds, while the SAG population is distinguished by unique abdominal proportions (AB3W, r = 0.86; Table 3) that likely reflect selective pressures in the South China Sea’s unique physicochemical environment [47]. These findings are strongly supported by both hierarchical clustering and Canonical Variate Analysis, which resolve the three groups with negligible misclassification (p < 0.001). This tight coupling of oceanography and morphological differentiation provides a compelling parallel to patterns seen in other marine taxa like Chionoecetes japonicus and Lateolabrax japonicus, confirming that physical oceanographic forces are primary architects of biodiversity in the marine realm [48,49]. Functional morphology as an adaptive read-out. Divergent AB3W allometry—central to brooding capacity—supports province-specific reproductive strategies. Increasing slopes from KCG to Singapore align with warmer, less seasonal environments favoring higher brood volumes and different hydromechanical demands during locomotion and incubation.

4.2. Potential Role of Culture as a Selective Driver

Markets in some regions, particularly Southeast Asia, may ascribe spiritual or ornamental value to carapace markings in portunid crabs, potentially elevating prices and incentivizing targeted harvest [4,5,50]. For instance, the crucifix crab (Charybdis feriatus), a related species, features cross-shaped markings associated with religious symbolism (e.g., linked to St. Francis Xavier in Christian folklore), which can drive selective fishing and premium valuation [4,50]. Portunus pelagicus exhibits variable white spot patterns on its carapace that sometimes form reticulate bands or spots [e.g., as described in color morph studies], which could resemble symbolic forms in certain cultural contexts, though this has not been systematically documented for the species.
We hypothesize that such culturally driven selection, if present, could shift trait distributions over time, potentially reinforcing the province-specific morphologies observed in our morphometric analysis (e.g., broader carapaces in the Kuroshio–China group). This feedback loop—where human preferences amplify natural selection—represents an intriguing but untested mechanism in P. pelagicus fisheries. Recognizing socio-cultural valuation as a potential driver (rather than mere “noise”) could serve as a lever for management, but empirical data on harvest selectivity and consumer preferences are needed to test this idea. Future studies integrating ethnographic surveys with morphometric and genetic data would be valuable to validate or refute this hypothesis. Taiwan’s Wànlǐ Crabs brand, a promotion initiated by the New Taipei City government in 2012, is a sustainable local fishery that includes three distinct species: the swimming crab (P. pelagicus), the three-spotted crab (Portunus sanguinolentus), and the stone crab (Charybdis feriata) [51]. The brand is distinguished by its use of baited crab pots, a method that ensures product quality, as well as a unique fluorescent green three-strand rope used for identification. It specifically highlights the rich roe and savory meat of the male crabs. This fishery is more than just a product; it is rooted in the local culture of the Wànlǐ district. For generations, fishermen have approached the ocean with deep respect, viewing it as the source of life. A common practice before heading out to sea is to visit local temples dedicated to the goddess Mazu or the Earth God, praying for a bountiful catch and safe passage. This tradition, known as “revering the sea” (Jìng Hǎi), embodies the local philosophy of living in harmony with nature.
In Carcar, Cebu, Philippines, a traditional dance known as Linambay features a variation that mimics the walking movements of the red spotted swimming crab (Portunus sanguinolentus), locally referred to as Lambay. This dance is often incorporated into harvest festival celebrations and is part of the theatrical genre called Moro-moro, a form originating during the Spanish colonial period that portrays conflicts and reconciliation between Christians and Muslims [52]. The integration of crab-like movements into the performance underscores the profound cultural importance of this marine species, which serves not only as a source of sustenance but also as artistic inspiration, reflecting the deep connection between the local community and its marine ecosystem. In Chinese culture, crabs similarly hold significant symbolic value, representing wealth and prosperity [53]. This symbolism is partly derived from their eight legs, as the number eight is considered highly auspicious and is associated with good fortune. The three spotted markings on the shell are also sometimes likened to ancient deities, and a darker body color is viewed as a cultural symbol of greater fortune. As a vital economic commodity, the red spotted swimming crab is naturally integrated into these broader systems of auspicious beliefs. Large local festival dances, such as the Kabkaban Festival and the Sinulog Celebration, occasionally integrate the crab as a performance theme to symbolize a “collective spirit” or “local identity.” For instance, the 2024 Sinulog competition showcased the concept of “crab spirit.” While the term “crab mentality” in English-speaking contexts typically carries a negative connotation—referring to the phenomenon where individuals pull others down to prevent their success—its use in this context appears to be a localized reinterpretation, possibly highlighting a sense of community unity or resilience.

4.3. Management Implications: Define and Use Morphological Management Units (MMUs)

Our framework is tailored to the unique morphological traits of three genetically distinct populations. For the China group (CG: KS, XM, and HK), which exhibits high variability in symbolic carapace patterns (15.3% vs. 5.8% in SAG; Table 1), we propose catch-and-release programs for symbolically valuable individuals, coupled with educational initiatives to foster community stewardship [54]. For the China subgroup (CSG: TN), whose unique elongated chelipeds are a local feature, we propose developing targeted eco-tourism and enforcing harvest restrictions to protect breeding stocks [31]. Finally, for the isolated Southeast Asian group (SAG: SG), we advocate for heritage-based branding that links its distinct abdominal morphology to local narratives, channeling resulting revenue from premium markets directly into habitat restoration [14,55]. This integrated approach, which aligns with evidence showing cultural narratives can boost sustainable engagement by over 30%, is reinforced by genetic management principles, including strict export quotas for the isolated SAG and transboundary oversight for the interconnected CG and CSG populations [19]. This biocultural model provides a transferable strategy for converting cultural valuation into tangible conservation outcomes. While this study provides critical insights into the population structure of Portunus pelagicus, several limitations warrant acknowledgment. The absence of genetic analyses prevents definitive conclusions on whether observed morphometric differences in the China group (KS, XM, and HK), China subgroup (TN), and Southeast Asian group (SG) reflect genetic divergence or phenotypic plasticity [28]. Furthermore, single-season sampling overlooks temporal variability in morphological traits, particularly for TN (CSG) populations exposed to seasonal Kuroshio tributary fluctuations [6].
The fisheries assessments of P. pelagicus document price/market sorting by size/sex and season—mechanisms through which culture-linked demand translates into selective harvest (e.g., [32,46]). Previous studies indicate evidence from Southeast Asian crab markets showing culturally mediated willingness-to-pay and live-product premiums that intensify retention of specific phenotypes [5,20,31]. This study links analogous marking-based selection in a closely related portunid (Charybdis feriatus) to on-boat sorting practices observed in our study ports [37], and includes ethnographic precedents for religion-inflected harvest norms in Taiwanese coastal governance [4].
Future research should prioritize integrated genomic–morphometric approaches to assess genetic connectivity across population groups—particularly between the China group (KS, XM, and HK) and China subgroup (TN)—utilizing high-throughput techniques like RAD-seq to disentangle adaptive evolution from environmental influences [10,56], coupled with hydrodynamic larval dispersal modeling to quantify how Kuroshio current bifurcations [45] and South China Sea monsoonal currents [9] mediate gene flow barriers isolating the Southeast Asian group (SG). These should be conducted alongside trait–environment gradient analyses examining morphological plasticity (e.g., cheliped allometry in CSG-TN) along physicochemical gradients (salinity, temperature, and nutrient flux) to pinpoint selective pressures [47,57], thereby elucidating the mechanistic basis of observed divergence and underpinning conservation strategies for climate-vulnerable populations.
MMU-KCG (Kyushu–Xiamen–Hong Kong): transboundary coordination during peak spawning; slot limits preserving large, high-fecundity females; non-retention of culturally prized markings for live-release events tied to stewardship campaigns. MMU-Tainan (Taiwan Strait): local marine reserves on migratory corridors; protect size/sex classes that drive AB3W allometry; co-develop eco-tourism with cultural partners to dampen selective harvest. MMU-Singapore (South China Sea): conservative export quotas; certification that channels cultural premiums into habitat restoration; strict enforcement against marking-based targeting. Low-cost now, genomics-ready later. MMUs are immediately deployable using calipers and standardized protocols. They are explicitly framed to be refined with genomic markers and larval dispersal modeling as resources allow.

5. Conclusions

The physical forces of ocean currents are primary architects of marine biodiversity, driving both evolutionary divergence and the structuring of populations. Here we reveal how major hydrographic systems in the Western Pacific have sculpted the swimming crab P. pelagicus into three distinct, morphometrically adapted populations. Multivariate analyses with near-perfect classification rates (p < 0.001) resolve a “China group” (CG) homogenized by the Kuroshio Extension, a “China subgroup” (CSG) isolated by the Taiwan Strait’s Kuroshio branch, and a “Southeast Asian group” (SAG) segregated by the South China Sea gyre. This geographic partitioning is mirrored by adaptive traits: CG crabs exhibit wider carapaces (p < 0.001) suited to turbulent waters, CSG crabs possess elongated chelipeds linked to local resource availability, and SAG crabs display unique abdominal proportions reflecting distinct selective pressures. This fine-scale understanding of population structure provides a powerful blueprint for targeted, ecosystem-based management that moves beyond generic conservation tactics. We propose a tripartite strategy: (1) coordinated transboundary policies for the current-connected CG population; (2) localized marine reserves to protect the unique adaptive traits of the CSG; and (3) strict export quotas and heritage-based market incentives for the genetically isolated SAG. The next frontier is to unify these morphometric findings with genomic data and high-resolution hydrodynamic models to mechanistically link ocean physics to adaptive evolution. Ultimately, our work provides an integrated model for translating macro-scale oceanographic processes into actionable, population-specific conservation strategies critical for safeguarding marine resources in an era of rapid climate change. Future investigations could incorporate genomics to validate plasticity versus heritability, addressing potential limitations in seasonal sampling and ensuring broader applicability across Indo-Pacific ranges. In Southeast Asian live seafood markets, ritual and ornamental valuation can elevate prices for specific carapace appearances and large, berried females, thereby incentivizing phenotype-targeted retention. For P. pelagicus, fishery assessments report size- and sex-selective sorting and seasonal demand cycles that interact with cultural preferences to shape catch composition and effort distribution (e.g., India and South China Sea fisheries). Together with regional willingness-to-pay evidence for premium crabs and marking-based selection documented in congeneric portunids, these studies support our use of ‘culturally driven fishery pressure’ as a mechanism by which socio-cultural demand intensifies selective harvest in P. pelagicus.

Author Contributions

Conceptualization, P.-C.C., C.-H.S., T.-D.T., C.-H.H., and G.-M.Z.; methodology, P.-C.C., C.-H.S., and T.-D.T.; software, P.-C.C., C.-H.S., and C.-H.H.; validation, P.-C.C., C.-H.S., and T.-D.T.; formal analysis, P.-C.C., C.-H.S., and T.-D.T.; investigation, P.-C.C., C.-H.S., and G.-M.Z. resources, P.-C.C., C.-H.S., and C.-H.H.; data curation, P.-C.C. and C.-H.H.; writing—original draft preparation, P.-C.C.; writing—review and editing, P.-C.C., C.-H.S., and G.-M.Z.; visualization, P.-C.C., C.-H.S., and C.-H.H.; supervision, P.-C.C., C.-H.S., T.-D.T., and C.-H.H.; project administration, P.-C.C., C.-H.S., and T.-D.T.; funding acquisition, P.-C.C. and T.-D.T. All authors have read and agreed to the published version of the manuscript.

Funding

This work was supported by the National Science and Technology Council (Grant NSTC 114-2121-M-366-001) and the Ningde Normal University Internal Project (KF03). The funders had no role in the study design, data collection and analysis, decision to publish, or preparation of the manuscript.

Data Availability Statement

The original contributions presented in this study are included in the article. Further inquiries can be directed to the corresponding authors.

Acknowledgments

We thank Shu-Te University’s College of General Education for their technical support. We would also like to thank the anonymous reviewers, whose useful suggestions were incorporated into the manuscript.

Conflicts of Interest

The authors declare no conflicts of interest.

References

  1. Wang, B.; Hua, L.; Mei, H.; Wu, X.; Kang, Y.; Zhao, N. Impact of Climate Change on the Dynamic Processes of Marine Environment and Feedback Mechanisms: An Overview. Arch. Computat. Methods Eng. 2024, 31, 3377–3408. [Google Scholar]
  2. Martínez-Fernández, J.; Banos-González, I.; Esteve-Selma, M. An integral approach to address socio-ecological systems sustainability and their uncertainties. Sci. Total Environ. 2021, 762, 144457. [Google Scholar] [CrossRef] [PubMed]
  3. Josileen, J. Food and feeding of the blue swimmer crab, Portunus pelagicus (Linnaeus, 1758) (Decapoda, Brachyura) from the Gulf of Mannar, Southeast Coast of India. Crustaceana 2011, 84, 1169–1180. [Google Scholar] [CrossRef]
  4. Chiau, W.Y. The role of religion in coastal resource management: The case of Kupo Island, Penghu (Pescadores), Taiwan. Coast. Manag. 1998, 26, 17–31. [Google Scholar] [CrossRef]
  5. Gaviglio, A.; Demartini, E.; Mauracher, C.; Pirani, A. Consumer perception of different species and presentation forms of fish: An empirical analysis in Italy. Food Qual. Prefer. 2014, 36, 33–49. [Google Scholar] [CrossRef]
  6. Lu, Y.M.; Shih, C.H.; Chen, P.C.; Kao, W.C.; Lee, Y.C.; Han, Y.S.; Tzeng, T.D. Genetic variations and expansion of the blue swimmer crab (Portunus pelagicus) in Southeast Asia. J. Mar. Sci. Eng. 2022, 10, 1071. [Google Scholar] [CrossRef]
  7. Hui, M.; Kraemer, W.E.; Seidel, C.; Nuryanto, A.; Joshi, A.; Kochzius, M. Comparative genetic population structure of three endangered giant clams (Cardiidae: Tridacna species) throughout the Indo-West Pacific: Implications for divergence, connectivity and conservation. J. Mollus. Stud. 2016, 82, 403–414. [Google Scholar] [CrossRef]
  8. Bernatchez, L.; Wellenreuther, M.; Araneda, C.; Ashton, D.T.; Barth, J.M.; Beacham, T.D.; Maes, G.E.; Martinsohn, J.T.; Miller, K.M.; Naish, K.A.; et al. Harnessing the power of genomics to secure the future of seafood. Trends Ecol. Evol. 2017, 32, 665–680. [Google Scholar] [CrossRef]
  9. Tzeng, T.D.; Chiu, C.S.; Yeh, S.Y. Morphometric variation in red-spot prawn (Metapenaeopsis barbata) in different geographic waters off Taiwan. Fish. Res. 2001, 53, 211–217. [Google Scholar] [CrossRef]
  10. Sanford, E.; Kelly, M.W. Local adaptation in marine invertebrates. Annu. Rev. Mar. Sci. 2011, 3, 509–535. [Google Scholar] [CrossRef]
  11. Tzeng, T.D.; Yeh, S.Y. Permutation tests for difference between two multivariate allometric patterns. Zool. Stud. 1999, 38, 10–18. [Google Scholar]
  12. Reist, J. An empirical evaluation of several univariate methods that adjust for size variation in morphometric data. Can. J. Zool. 1985, 63, 1429–1439. [Google Scholar] [CrossRef]
  13. Song, N.; Gao, T.; Ying, Y.; Yanagimoto, T.; Han, Z. Is the Kuroshio Current a strong barrier for the dispersal of the gizzard shad (Konosirus punctatus) in the East China Sea? Mar. Freshw. Res. 2016, 68, 810–820. [Google Scholar] [CrossRef]
  14. Funk, W.C.; McKay, J.K.; Hohenlohe, P.A.; Allendorf, F.W. Harnessing genomics for delineating conservation units. Trends Ecol. Evol. 2012, 27, 489–496. [Google Scholar] [CrossRef]
  15. Campbell, G.R.; Fielder, D.R. Size at sexual maturity and occurrence of ovigerous females in three species of commercially exploited portunid crabs in S.E. Queensland. Proc. R. Soc. Queensl. 1986, 97, 79–87. [Google Scholar]
  16. Rasheed, S.; Mustaquim, J. Size at sexual maturity, breeding season and fecundity of three-spot swimming crab Portunus sanguinolentus (Herbst, 1783) (Decapoda, Brachyura, Portunidae) occurring in the coastal waters of Karachi, Pakistan. Fish. Res. 2010, 103, 56–62. [Google Scholar] [CrossRef]
  17. Pecl, G.T.; Araújo, M.B.; Bell, J.D.; Blanchard, J.; Bonebrake, T.C.; Chen, I.-C.; Clark, T.D.; Colwell, R.K.; Danielsen, F.; Evengård, B.; et al. Biodiversity redistribution under climate change: Impacts on ecosystems and human well-being. Science 2017, 355, eaai9214. [Google Scholar] [CrossRef] [PubMed]
  18. Sumaila, U.R.; Cheung, W.W.L.; Lam, V.W.Y.; Pauly, D.; Herrick, S. Climate change impacts on the biophysics and economics of world fisheries. Nat. Clim. Chang. 2011, 1, 449–456. [Google Scholar] [CrossRef]
  19. Ditton, R.B.; Holland, S.M.; Anderson, D.K. Recreational fishing as tourism. Fisheries 2002, 27, 17–24. [Google Scholar] [CrossRef]
  20. Sayeed, Z.; Sugino, H.; Sakai, Y.; Yagi, N. Consumer preferences and willingness to pay for Mud Crabs in southeast asian countries: A discrete choice experiment. Foods 2021, 10, 2873. [Google Scholar] [CrossRef]
  21. Klinbunga, S.; Pripue, P.; Khamnamtong, N.; Puanglarp, N.; Tassanakajon, A.; Jarayabhand, P.; Menasveta, P. Genetic diversity and molecular markers of the tropical abalone (Haliotis asinina) in Thailand. Mar. Biotechnol. 2003, 5, 505–517. [Google Scholar] [CrossRef]
  22. Cadrin, S.X. Advances in morphometric identification of fishery stocks. Rev. Fish. Biol. Fish. 2000, 10, 91–112. [Google Scholar] [CrossRef]
  23. Begg, G.A.; Friedland, K.D.; Pearce, J.B. Stock identification and its role in stock assessment and fisheries management: An overview. Fish. Res. 1999, 43, 1–8. [Google Scholar] [CrossRef]
  24. Lai, J.C.Y.; Ng, P.K.L.; Davie, P.J.F. A revision of the Portunus pelagicus (Linnaeus, 1758) species complex (Crustacea: Brachyura: Portunidae), with recognition of four species. Raffles Bull. Zool. 2010, 58, 199–237. [Google Scholar]
  25. Kao, W.-C.; Shih, C.-H.; Sung, Y.-C.; Chen, P.-C.; Lu, Y.-M.; Han, Y.-S.; Tzeng, T.-D. Morphometric Diversity and Population Structure of the Crucifix Crab (Charybdis feriatus) in East Asian Recreational Fisheries. Water 2025, 17, 688. [Google Scholar] [CrossRef]
  26. Chen, P.C.; Tzeng, T.D.; Shih, C.H.; Chu, T.J.; Lee, Y.C. Morphometric variation of the oriental river prawn (Macrobrachium nipponense) in Taiwan. Limnologica 2015, 52, 51–58. [Google Scholar] [CrossRef]
  27. Thorpe, R.S.; Leamy, L. Morphometric studies in inbred and hybrid House Mice (Mus sp.): Multivariate analysis of size and shape. J. Zool. 1983, 199, 421–432. [Google Scholar] [CrossRef]
  28. Keenan, C.; Davie, P.J.; Mann, D.L. A revision of the genus Scylla de Haan, 1833 (Crustacea: Decapoda: Brachyura: Portunidae). Raffles Bull. Zool. 1998, 46, 217–245. [Google Scholar]
  29. Hellberg, M.E. Dependence of gene flow on geographic distance in two solitary corals with different larval dispersal capabilities. Evolution 1996, 50, 1167–1175. [Google Scholar] [CrossRef]
  30. Kotlik, P.; Berrebi, P. Phylogeography of the barbel (Barbus barbus) assessed by mitochondrial DNA variation. Mol. Ecol. 2001, 10, 2177–2185. [Google Scholar] [CrossRef]
  31. Yi, S. Willingness-to-pay for sustainable aquaculture products: Evidence from Korean red seabream aquaculture. Sustainability 2019, 11, 1577. [Google Scholar] [CrossRef]
  32. Soundarapandian, P.; Varadharajan, D.; Boopathi, A. Reproductive biology of the commercially important portunid crab, Portunus pelagicus (Herbst). J. Mar. Sci. Res. Dev. 2013, 3, 2–9. [Google Scholar]
  33. Bureau of Fisheries. 2020 China Statistical Yearbook; China Statistics Press: Beijing, China, 2020. [Google Scholar]
  34. Sumpton, W.D. Morphometric growth and fisheries biology of the crab, Charybdis natator (Herbst) in Moreton Bay, Australia (Decapoda, Brachyura). Crustaceana 1990, 59, 113–120. [Google Scholar] [CrossRef]
  35. Yu, Y.C. Morphometric Studies on Stock Discrimination of Swimming Crab (Charybdis feriatus) in the Offshore Areas of Taiwan. Master’s Thesis, Institute of Oceanography, National Taiwan University, Taipei, Taiwan, 2003; p. 56. (In Chinese). [Google Scholar]
  36. Adams, D.C.; Rohlf, F.J. Ecological character displacement in Plethodon: Biomechanical differences found from a geometric morphometric study. Proc. Natl. Acad. Sci. USA 2000, 97, 4106–4111. [Google Scholar] [CrossRef]
  37. Kao, W.C.; Chang, P.H.; Shih, C.H.; Chen, P.C.; Tzeng, T.D.; Han, Y.S.; Lu, Y.M. Morphometric differentiation of the swimming crab Portunus sanguinolentus (Herbst, 1783) populations in East Asia: Implications for stock identification and management. Water 2023, 15, 3335. [Google Scholar] [CrossRef]
  38. Tzeng, C.S. Distribution of the freshwater fishes of Taiwan. J. Taiwan Mus. 1986, 39, 127–146. [Google Scholar]
  39. Tudela, S. Morphological variability in a Mediterranean, genetically homogeneous population of the European anchovy, Engraulis encrasicolus. Fish. Res. 1999, 42, 229–243. [Google Scholar] [CrossRef]
  40. Paramo, J.; Saint-Paul, U. Morphological differentiation of southern pink shrimp Farfantepenaeus notialis in Colombian Caribbean Sea. Aquat. Living. Resour. 2010, 23, 95–101. [Google Scholar]
  41. Rohlf, F.J.; Marcus, L.F. A revolution morphometrics. Trends. Ecol. Evol. 1993, 8, 129–132. [Google Scholar] [CrossRef]
  42. Bookstein, F.L.; Chernoff, B.; Elder, R.L.; Humphries, J.M.; Smith, G.R.; Strauss, R.E. Morphometrics in Evolutionary Biology: The Geometry of Size and Shape Change with Examples from Fishes, 15th ed.; Academy of National Sciences: Philadelphia, PA, USA, 1985; pp. 20–45. [Google Scholar]
  43. Reyment, R.A. Morphometrics: An Historical Essay. In Morphometrics for Nonmorphometricians; Elewa, A.M.T., Ed.; Springer: Berlin/Heidelberg, Germany, 2010; pp. 9–24. [Google Scholar]
  44. Lachenbruch, P.A.; Goldstein, M. Discriminant analysis. Biometrics 1979, 35, 69–85. [Google Scholar]
  45. Lu, Y.M.; Shih, C.H.; Chen, P.C.; Kao, W.C.; Lee, Y.C.; Han, Y.S.; Tzeng, T.D. Phylogeography and genetic structure of the swimming crabs Portunus sanguinolentus (Herbst, 1783) in East Asia. J. Mar. Sci. Eng. 2022, 10, 281. [Google Scholar] [CrossRef]
  46. Dineshbabu, A.P.; Sreedhara, B.; Muniyappa, Y. Fishery and stock assessment of Portunus pelagicus (Herbst) from south Karnataka coast, India. J. Mar. Biol. Assoc. India 2007, 49, 134–140. [Google Scholar]
  47. Sugama, K.; Benzie, J.A.H.; Ballment, E. Genetic variation and population groups of the giant tiger prawn, Penaeus monodon, in Indonesia. Aquaculture 2002, 205, 37–48. [Google Scholar] [CrossRef]
  48. Yosho, I.; Hirose, T.; Shirai, S. Bathymetric distribution of beni-zuwai crab Chionoecetes japonicus in the northern part of the Sea of Japan. Fish. Sci. 2009, 75, 1417–1429. [Google Scholar] [CrossRef]
  49. Reddy, M.M.; Macdonald, A.H.; Groeneveld, J.C.; Schleyer, M.H. Phylogeography of the scalloped spiny-lobster Panulirus Homarus rubellus in the southwest Indian Ocean. J. Crust. Biol. 2014, 34, 773–781. [Google Scholar] [CrossRef]
  50. Asche, F.; Guillen, J. The importance of fishing method, gear and origin: The Spanish hake market. Mar. Policy 2012, 36, 365–369. [Google Scholar] [CrossRef]
  51. Chien, C.J. From Sea Crabs to Wanli Crab: The Reterritorialization of Quality and Resource Governance. Master’s Thesis, Department of Geography, National Taiwan Normal University, Taipei, China, 2024; p. 132. (In Chinese). [Google Scholar]
  52. Pacana, N.R. The Moro in the Moro Moro: Hegemonic Representation in the Linambay Plays in Cebu. PQCS 2007, 35, 87–99. [Google Scholar]
  53. Yan, X.; Zhang, C. The connotation of Chinese crab culture: A comprehensive review from the perspectives of literature, art, and diet. Front. Mar. Sci. 2025, 12, 1556758. [Google Scholar] [CrossRef]
  54. Mirera, O.D. Trends in exploitation, development and management of artisanal mud crab (Scylla serrata-Forsskal-1775) fishery and small-scale culture in Kenya: An overview. Ocean. Coast. Manag. 2011, 54, 844–855. [Google Scholar] [CrossRef]
  55. Supungul, P.; Sootanan, P.; Klinbunga, S.; Kamonrat, W.; Jarayabhand, P.; Tassanakajon, A. Microsatellite polymorphism and the population groups of the black tiger shrimp (Penaeus monodon) in Thailand. Mar. Biotechnol. 2000, 2, 339–347. [Google Scholar] [CrossRef]
  56. Thompson, L.R.; Sanders, J.G.; McDonald, D.; Amir, A.; Ladau, J.; Locey, K.J.; Prill, R.J.; Tripathi, A.; Gibbons, S.M.; Ackermann, G.; et al. A communal catalogue reveals Earth’s multiscale microbial diversity. Nature 2017, 551, 457–463. [Google Scholar] [CrossRef] [PubMed]
  57. Grimes, C.B.; Johnson, A.G.; Fable, W.A., Jr. Delineation of king mackerel (Scomberomorus cavalla) stocks along the US east coast and in the Gulf of Mexico. In Proceedings of the Stock Identification Workshop; Kumpf, H.E., Vaught, R.N., Grimes, C.B., Johnson, A.G., Nakamura, E.L., Eds.; NOAA Technical Memorandum NMFS-SEFC: Panama City Beach, FL, USA, 1987; Volume 199, pp. 186–187. [Google Scholar]
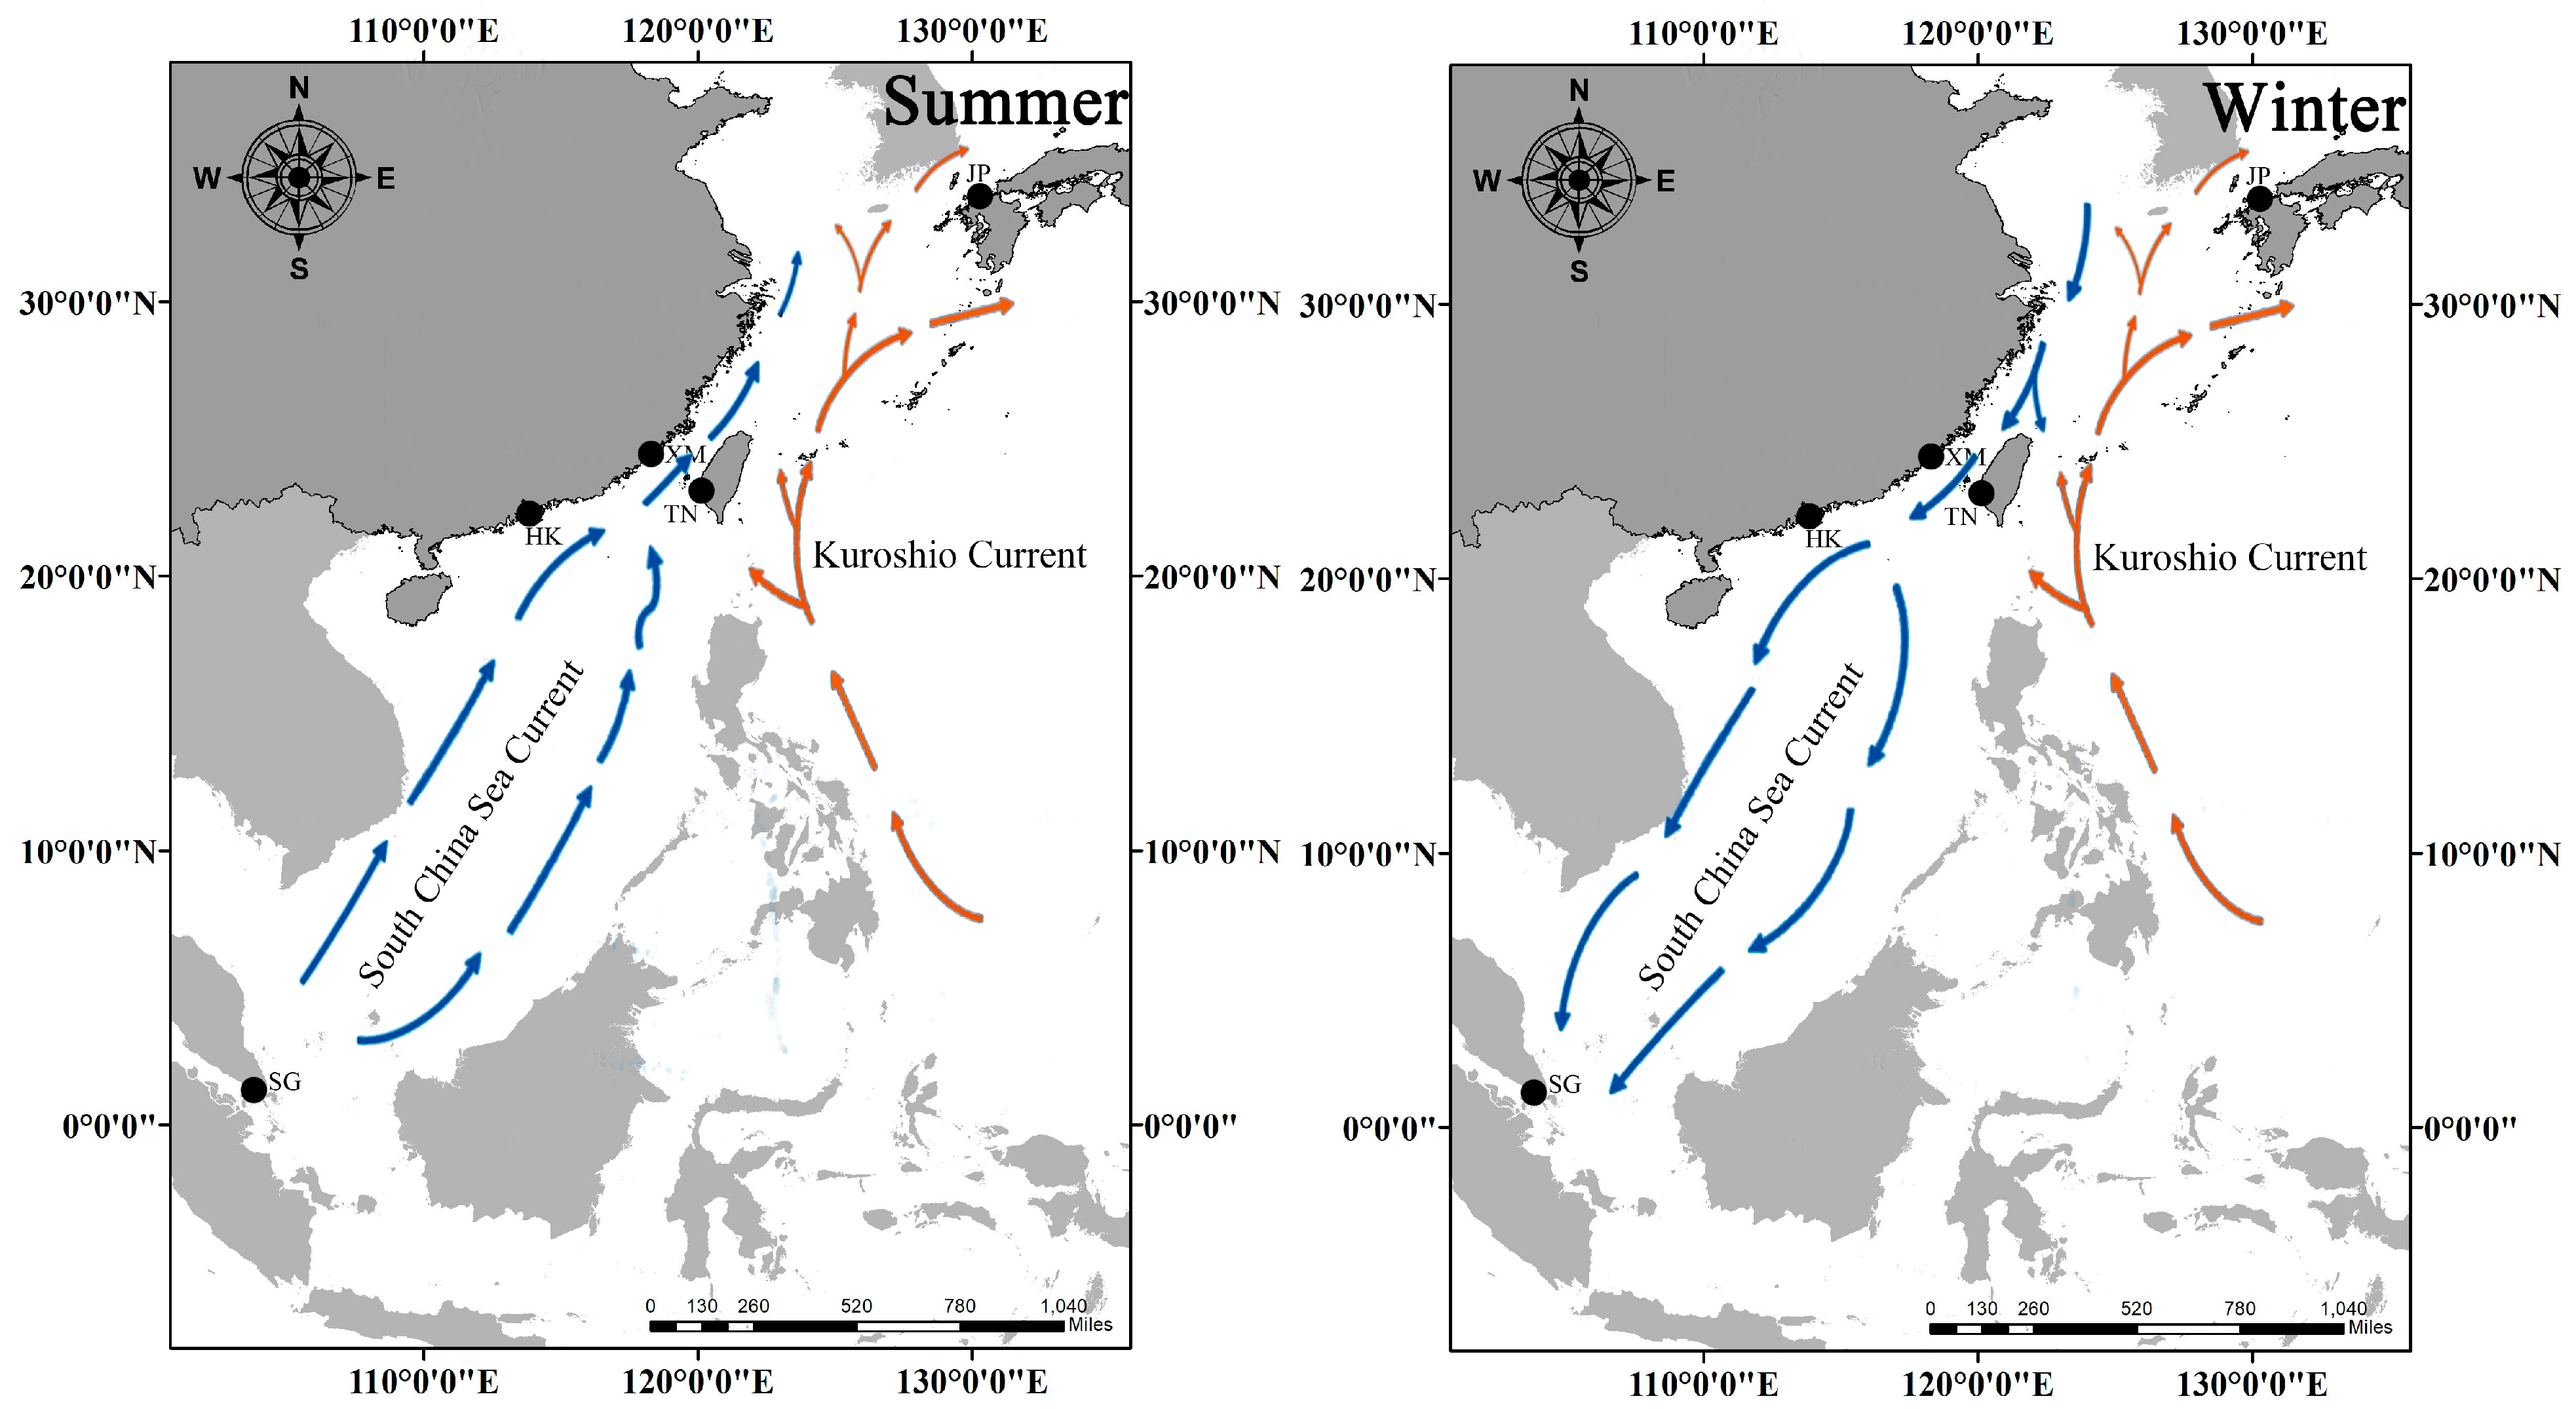
Figure 1. East Asian collection sites and regional groupings for P. pelagicus.
Water 17 02783 g001
Figure 2. (ad) Morphometric traits recorded in P. pelagicus (CW, CL, CP1–CP6, AB3L, AB3RL, AB3LL, and AB3W); author-generated schematic.
Water 17 02783 g002
Figure 3. Correlation heatmaps of morphometric characteristics in P. pelagicus.
Water 17 02783 g003aWater 17 02783 g003b
Figure 4. Ninety-five percent confidence ellipse displays of (A) female and (B) male samples, with group means, computed from the first three canonical variates for CG (China group), SAG (Southeast Asia group), and CSG (China subgroup).
Water 17 02783 g004
Figure 5. Hierarchical clustering dendrogram of five sampling areas, shown separately for the female and male datasets, indicating the China subgroup (KG), the Southeast Asia group (SAG), and the Kuroshio subgroup (KSG).
Water 17 02783 g005
Figure 6. Histograms showing the empirical distribution of Pc (misclassification rate) from 5000 replicates in the female and male data.
Water 17 02783 g006
Table 1. Baseline environmental conditions by sampling site for Portunus pelagicus collection (October 2023–January 2024) in East Asia.
Area CodeSampling SitenSexSampling DateCW (mm)Depth Range (m)SST Range (°C)Salinity (psu)Substrate Type
Mean (SD) Range
KSKyushu54FJanuary 2024113.13 (18.76)66.42–156.4315–3516.2–18.534.1–34.3Sandy-muddy with shell fragments
52M115.06 (12.46)78.24–134.12Sandy-muddy with shell fragments
XMXiamen56FOctober 2023116.15 (15.25)88.38–152.008–2522.8–24.133.8–34.2Muddy-sandy, high organic content
48M112.02 (14.06)78.24–134.12
TNTainan53FNovember 2023105.80 (6.53)91.59–122.0912–2824.5–26.234.0–34.4Rocky-sandy, coarse sediment
52M101.35 (7.04)91.24–117.97
HKHongkong55FOctober 2023114.64 (8.12)98.69–152.0610–3025.1–26.833.5–34.1Muddy with gravel patches
50M118.72 (7.76)103.76–132.84
SGSingapore56FJanuary 2024139.68 (5.82)119.40–153.255–2028.3–29.733.2–33.8Fine mud, high silt content
49M121.48 (9.41)91.64–137.03
Table 2. Pairwise correlations among characteristics, shown as raw (pre-correction) values in the lower triangle and as post-correction values after controlling for size in the upper triangle.
(A) Female
VariableCLCP1CP2CP3CP4CP5CP6AB3LAB3RLAB3LLAB3W
CL 0.81 **0.83 **0.85 **0.86 **0.83 **0.82 **0.92 **0.92 **0.92 **0.93 **
CP10.19 ** 0.49 **0.170.79 **0.67 **0.47 **0.80 **0.80 **0.80 **0.77 **
CP20.59 **−0.24 ** 0.92 **0.72 **0.92 **0.98 **0.82 **0.83 **0.83 **0.84 **
CP30.56 **0.130.79 ** 0.81 **0.97 **0.90 **0.88 **0.88 **0.89 **0.86 **
CP40.71 **0.55 **0.33 **0.54 ** 0.81 **0.72 **0.89 **0.86 **0.86 **0.81 **
CP50.57 **0.24 **0.78 **0.92 **0.58 ** 0.91 **0.88 **0.87 **0.88 **0.85 **
CP60.59 **−0.27 **0.94 **0.78 **0.35 **0.77 ** 0.81 **0.81 **0.82 **0.84 **
AB3L0.59 **0.51 **0.46 **0.59 **0.71 **0.65 **0.43 ** 0.99 **0.99 **0.94 **
AB3RL0.55 **0.48 **0.45 **0.56 **0.61 **0.63 **0.41 **0.95 ** 0.99 **0.95 **
AB3LL0.58 **0.47 **0.47 **0.60 **0.65 **0.65 **0.44 **0.96 **0.97 ** 0.95 **
AB3W0.46 **0.26 **0.55 **0.54 **0.46 **0.56 **0.53 **0.75 **0.78 **0.79 **
(B) Male
VariableCLCP1CP2CP3CP4CP5CP6AB3LAB3RLAB3LLAB3W
CL 0.380.94 **0.96 **0.94 **0.97 **0.93 **0.99 **0.98 **0.98 **0.98 **
CP10.12 0.71 **0.76 **0.360.78 **0.68 **0.83 **0.82 **0.81 **0.45
CP20.15 *−0.73 ** 0.97 **0.85 **0.97 **0.99 **0.96 **0.96 **0.96 **0.43
CP3−0.32 **−0.65 **0.62 ** 0.85 **0.99 **0.97 **0.97 **0.470.470.45
CP40.56 **−0.120.15 *−0.34 ** 0.86 **0.85 **0.91 **0.400.410.49
CP5−0.39 **−0.27 **0.19 **0.64 **−0.59 ** 0.97 **0.480.480.480.95 **
CP6−0.05−0.86 **0.79 **0.64 **0.100.27 ** 0.96 **0.96 **0.96 **0.42
AB3L0.55 **−0.38 **0.47 **0.18 **0.36 **−0.090.42 ** 0.99 **0.99 **0.97 **
AB3RL0.43 **−0.31 **0.32 **0.120.090.0570.34 **0.80 ** 1.00 **0.97 **
AB3LL0.37 **−0.25 **0.26 **0.050.130.020.32 **0.72 **0.88 ** 0.97 **
AB3W0.44 **0.040.06−0.120.09−0.22 **−0.010.42 **0.51 **0.47 **
Note: * value significant at 95%; ** value significant at 99%.
Disclaimer/Publisher’s Note: The statements, opinions and data contained in all publications are solely those of the individual author(s) and contributor(s) and not of MDPI and/or the editor(s). MDPI and/or the editor(s) disclaim responsibility for any injury to people or property resulting from any ideas, methods, instructions or products referred to in the content.