Abstract
Pumped storage power stations are effective stabilizers and regulators of the power grids. However, during the transient process, especially the operating point entering the S-shaped region, the internal flow patterns and pressure pulsations in the pump–turbine unit change violently, seriously affecting the safety of the power stations, which requires enough optimizations in the design stage of the pump–turbine. In this paper, to explore the key factors which influence the evolutions of flow patterns and pressure pulsations during the runaway process, three pump–turbine runners with different inlet blade lean, including positive angle, no angle and negative angle, were selected to simulate by using the three-dimensional method. The results show that the changes in the inlet blade lean angles have significant effects on the variation periods and maximum values of the macro parameters during the runaway process, and especially the runner with no lean angle results in the smallest oscillation periods and pressure pulsations but enlarges the runner radial forces. In addition, backflows generate from the hub side under the cases with positive or no blade lean angle, while those occur from the shroud side due to the negative angle. The results provide a basic reference for the design of the pump–turbine.
1. Introduction
With the fast increase in the renewable energy, the stability of the power grid is gradually receiving more attention [1,2,3]. The pumped storage power stations, as the most mature energy storage tool with large capacity, bear the responsibility of regulating the stability of the power grid, becoming the main choice in the large-scale basin [4]. However, many steady operating conditions and frequent condition transitions may cause unit vibration and stability problems [5,6,7]. The S-shaped region is the area where the n11–Q11 or n11–M11 curve presents an inverted “S” shape on the four quadrants plane, in which the pump–turbine encounters severe fluctuations in rotational speed, discharge, torque, and pressure [8,9]. The runaway process is easy to threaten the safety of the pumped storage power stations, during which when the unit is disconnected from the power grid, the guide vanes refuse to close, including from the turbine mode and pump mode [10,11,12,13]. In the low specific speed pump–turbine, the operating point is prone to oscillations in the S-shaped region, and the discharge and pressure pulsation also exhibit approximate periodic evolution [14].
At present, research on the runaway processes of the pump–turbines usually use the three-dimensional (3D) simulations or experimental methods to analyze the two types of conditions, including the runaway point and runaway transient process with rotational speed variation. The results focus on the flow patterns and pressure pulsations at the inlet and outlet of the runner, as well as in the blade passages [15]. Until now, research on runaway point conditions have shown that the abundant unstable vortices generate at the vaneless space, in the blade passages and draft tube [16,17]. Regarding the runaway transient process, the dynamic trajectory usually forms a loop in the S-shaped region [10]. Su [18] pointed out that the dynamic trajectory of the working point only maintains consistency with the static characteristic curve in the early stage during the runaway process, then the working point oscillates in the S-shaped region. And the amplitude of pressure pulsation reaches the maximum value at the runaway point, mainly caused by backflows and rotor–stator interaction. Yang [14] simulated the runaway processes of four different pump–turbines and concluded that as the specific speed decreases, the operating point is more likely to oscillate in the S-shaped region, and the backflow transitions at the runner inlet are also more abundant. Xia [19] conducted three-dimensional simulations of the runaway processes from four different guide vane openings and found that guide vane openings can lead to different backflows at the runner inlet. Fu [20] also simulated the runaway processes of a pump–turbine from different guide vane openings, and the results showed that the backflows at the runner inlet are unstable sources with larger guide vane opening. Zhang [21] chose different inertia of rotating parts to investigate the runaway characteristic, and pointed out that when the operating point enters the S-shaped region, the large inertia is more likely to cause a sudden increase in radial force, because the large inertia slows down the changes in rotational speed and discharge, allowing enough time to generate unstable and non-uniform flow patterns. Hou [22] analyzed the influence of clearance during the runaway process on the axial and radial force of the runner and found that there are similar pressure signal components in the main flow channel and clearance, and the radial force is mainly affected by the flow patterns in the main flow channel, while the flow patterns in the clearance strengthens fluctuation degree. Most results indicate that unstable vortex structures in the blade passages and vaneless space can lead to significant pressure pulsations, both in steady conditions and transient processes.
However, previous studies only focus on the internal and external characteristics of a pump–turbine during runaway process, without further investigating the influence of specific structures on the flow patterns and pressure pulsations. In Yang’s research [14], the simulation results of four different pump–turbines during runaway processes pointed out the effects of blade lean angles, runner inlet height, and other factors on the backflows and pressure pulsations at the runner inlet. The results indicate that the blade lean angles at the runner inlet affect the pressure gradient distribution, further affecting the location of the backflows. Moreover, the smaller inlet heights make backflows easily have transitions, ultimately leading to significant differences in pressure pulsations. However, due to many significant differences in the four pump–turbine structures, such as the length and number of blades, as well as the number of guide vanes, it is a comprehensive evaluation result that cannot solely reflect the influence of a certain parameter. In response to this issue, it is particularly important to conduct in-depth research on changing a certain structural dimension only, to investigate how the body structure affects the internal and external characteristics. A few researchers have carried out some investigations. For example, Lu [23] optimized the shape of the guide vanes and analyzed their influences on fluid energy dissipation in pump mode. Zhao [24] drew on the protuberances of the leading edge of a humped whale flipper, and designed different bionic protuberances applied to stay–guide vanes. The results show that the bionic protuberances can effectively improve the flow regime in the stay–guide vanes and runner and weaken the flow separation. Qin [25] optimized the runner by introducing the concepts of “swept”, “bowed (lean),” and “twisted” to widen the design space, which can increase the efficiency in the pump and turbine modes. In addition, there are studies on the influence of blade lean angles on flow patterns and pressure fluctuations. Ma [26] studied the internal and external characteristics at steady operating points under three different blade lean angles, including negative angles, positive angles, and no angles. It was found that blade lean angles can change the S-shaped characteristics and cause changes in the internal flow state and pressure at various points in the S-shaped region. Li [27] also optimized the blade lean angles and explored the influence on the hump shaped characteristic, flow patterns and pressure fluctuations. The analysis showed that the change in blade lean angles reduced the stall vortices formed by three low-pressure regions, alleviated the phenomenon of rotating stalls, and made the circumferential distribution of pressure fluctuations more uniform. Xia [28] simulated the differences and correlations in flow patterns and pressure fluctuations during load rejections with different blade lean angles, indicating that the blade lean angles can effectively affect the position of the backflows at the runner inlet, thereby affecting the amplitudes of pressure fluctuations. Although there have been some studies on structural optimization in the above studies, the internal and external mechanisms influenced by blade lean angles during the transient process are still incomplete and require further research.
This paper takes a pump–turbine as a benchmark and modifies the high-pressure side to obtain three runners with positive blade lean angles, no blade lean angles, and negative blade lean angles, respectively. The remaining parts of the structure remain unchanged, and the three runaway processes are simulated based on the same boundary conditions. This paper aims to analyze the flow pattern distributions at the initial steady condition and compare the evolution differences in macro parameters, flow patterns, pressure pulsations, and runner forces during runaway processes in three runners, and ultimately conclude how the blade lean angles affect the external and internal characteristics.
2. Numerical Methods
2.1. Computational Domain and Main Parameters of the Pump–Turbine
The objects of the simulations are three model pump–turbines, and the computational domain is shown in Figure 1, including spiral casing, stay vanes, guide vanes, runner, draft tube, and extension pipes. Among them, Runner-2 is the original runner with no blade lean angle, and then the blade lean angle is adjusted in 5° to obtain Runner-1 (positive angles) and Runner-3 (negative angles), respectively. The basic parameters of the pump–turbine are shown in Table 1.
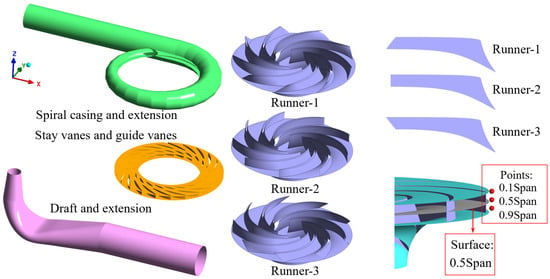
Figure 1.
The simulation domain and monitoring points in pump–turbines.

Table 1.
Main parameters of the pump–turbine.
2.2. Three-Dimensional CFD Setup
The mesh was generated by ICEM-CFD and the 3D CFD simulations were carried out by using ANSYS FLUENT 2022 R1, respectively. The spiral casing, runner, draft tube, and the extension pipes were discretized by hexahedral structure grids, while the stay and guide vane regions were discretized by wedge grids. Because there was only a minor change at the runner inlet and the rest of the geometry remained unchanged, the mesh dependence was conducted considering the efficiency in turbine mode based on the original runner with no blade lean angle (Figure 2a), and it was found that the efficiency no longer undergoes significant changes when the grid number exceeds 6.9 million; finally, we chose it considering the simulation time and computer resources (Figure 3). In addition, the comparisons of simulation and model test results at steady conditions are shown in Figure 2b, and Y+ of runner blades and guide vanes are shown in Figure 2c. During the runaway simulations, the upper and lower extension pipes were set as pressure boundaries, and the timestep was selected as 0.0005 s. The k-ω SST turbulence model and SIMPLEC algorithm were adopted, and the sliding mesh approach was used for rotor–stator interface configuration.
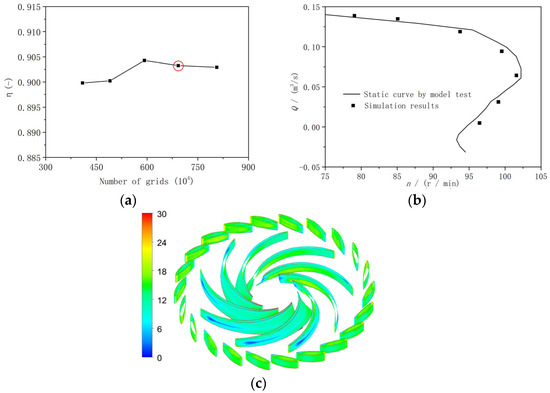
Figure 2.
Grid independence, simulation model verification, and Y+ of runner blades based on the original runner with no blade lean angle (Runner-2). (a) Grid independence; (b) simulation model verification; (c) Y+ of runner blades and guide vanes.
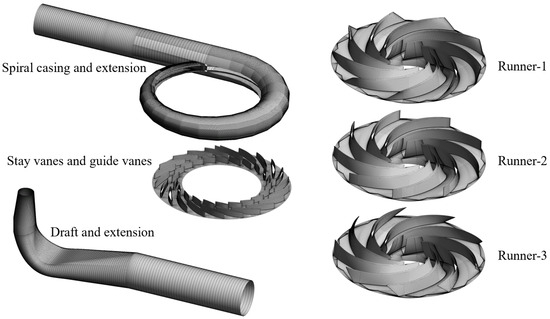
Figure 3.
Grid diagram of the simulation region.
3. Simulation Results
3.1. Internal Characteristics in the Pump–Turbine at Initial Operating Point
The flow patterns on the pressure and suction surfaces of the runner blades under three initial steady conditions are shown in Figure 4. The velocity vector diagram stained by black represents the flow trend on the wall without any velocity magnitude, but can also be called flow patterns. It can be seen that the blade lean angles have significant interference effect on the pressure distribution, which further affects the development of the flow patterns. Specifically, in Runner-1 (Figure 4a), on the pressure surface of the blades, the pressure near the hub side is low, while that near the shroud side is high; then the inlet water flows from the shroud side towards the hub side. However, in the middle and rear parts of the blade, the upward flow has a clear trend to go downwards. The pressure distribution on the suction surface at the blade leading edge is exactly the opposite, with higher pressure near the hub side and lower pressure near the shroud side. In addition, the water also flows approximately perpendicular to the blade inlet, namely a downward trend. For the Runner-2 (Figure 4b), whether on the pressure surface or suction surface at the blade leading edge, the pressures at the hub side and the shroud side are similar, which results in the flow at pressure surface converging from the upper and lower sides towards the middle, while the flow on suction surface enters the blade passage approximately horizontally. And for Runner-3 (Figure 4c), the pressure distribution at the blade leading edge and flow patterns on the blade surfaces are exactly opposite to those in Runner-1. Therefore, the change in blade lean angles mainly affects the distribution of pressure and the flow trend at the runner inlet. However, because these operating conditions are near the optimal one and there are fewer unstable vortex structures, the influence on macro parameters is not significant.
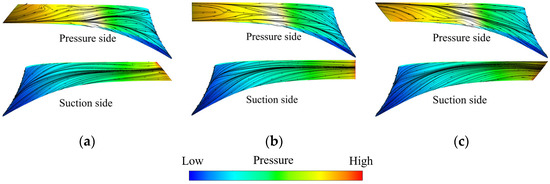
Figure 4.
Flow patterns on steady conditions in three runners. (a) Runner-1; (b) Runner-2; (c) Runner-3.
The streamlines on 0.1 Span, 0.5 Span, and 0.9 Span in each operating condition were selected (Figure 1), and the influence of blade lean angles on flow patterns were further analyzed (Figure 5, Figure 6 and Figure 7). Firstly, the overall similarity is that in all the three operating conditions, the velocity at 0.1 Span and 0.9 Span is higher, while that at 0.5 Span is lower, indicating that the water mainly enters the blade passages along the hub side and shroud side. Secondly, comparing the flow patterns at 0.1 Span in three operating conditions, relative low-velocity regions occur in the middle of the blade pressure surfaces in Runner-1 (Figure 5a). The reason is that the presence of blade lean angle in Runner-1 causes spatial distortion in the front section of the blade, changing the water flow direction. For this reason, in Runner-2 (Figure 6) and Runner-3 (Figure 7), the overall flow is relatively smooth despite the low-velocity regions on the pressure surfaces. For the flow patterns on 0.5 Span and 0.9 Span of three operating conditions, the slight flow separations, namely the streamlines deviating from the blade surface, occur in the middle of the blade pressure surface at 0.5 Span in Runner-2, while the smooth flow patterns generate at the other locations. Overall, the flow patterns at the hub side and middle region of the blade pressure surface are more obviously affected by the blade lean angles, presenting in forms of the low-velocity region caused by the blade distortion, while the flow velocity at the shroud side is generally higher due to the downward flow trend with small differences in each condition.
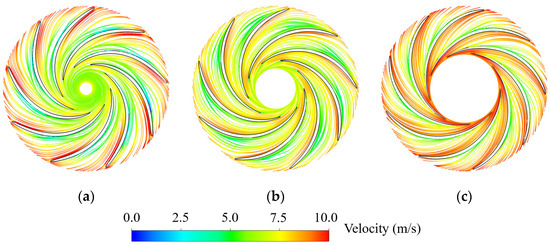
Figure 5.
Flow patterns on different surfaces under steady conditions in Runner-1. (a) 0.1 Span; (b) 0.5 Span; (c) 0.9 Span.
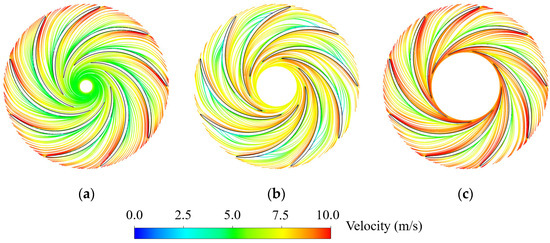
Figure 6.
Flow patterns on different surfaces under steady conditions in Runner-2. (a) 0.1 Span; (b) 0.5 Span; (c) 0.9 Span.
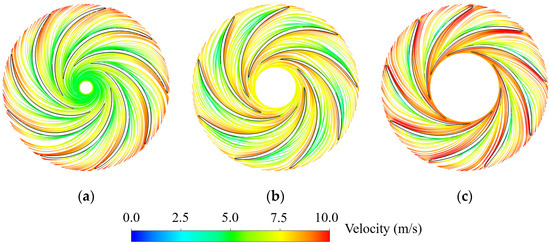
Figure 7.
Flow patterns on different surfaces under steady conditions in Runner-3. (a) 0.1 Span; (b) 0.5 Span; (c) 0.9 Span.
3.2. Variations in Macro Parameters During the Runaway Processes
Based on the above three steady operating conditions, numerical simulations of the runaway processes are conducted. The unit parameters are defined as and , where H = E1 − E2, with E1 and E2 being the total energy values at the spiral casing inlet and the runner outlet, respectively. The dynamic trajectory curves of the three operating points are shown in Figure 8. Due to the high head and low specific speed of the pump–turbine selected in this paper, all the three dynamic trajectories enter the reverse pump mode and exhibit circular characteristics. By comparison, the dynamic trajectory in Runner-3 occupies the largest loop, which is related to changes in macro parameters. When the operating point slides into the S-shaped region, there is a high-frequency and high amplitude pulsation phenomenon.
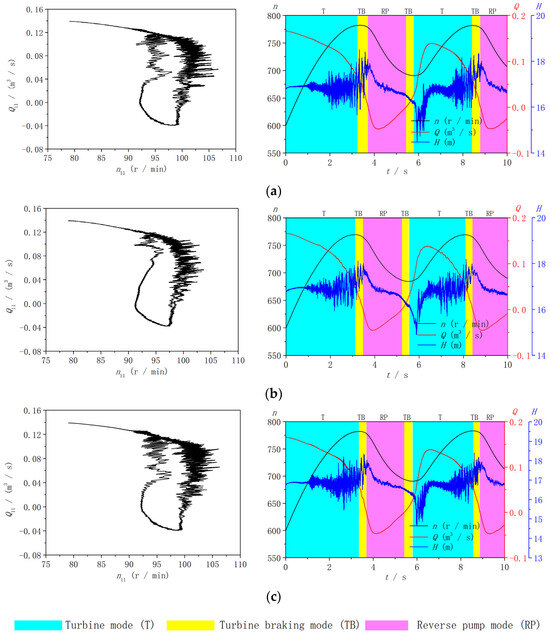
Figure 8.
Dynamic trajectories and variations in macro parameters in three working conditions. (a) Runner-1; (b) Runner-2; (c) Runner-3.
Because the previous studies show that the operating point during runaway conditions in the high head pump–turbine is prone to experience periodic oscillations [14], only one fluctuation period of macro parameters was selected in this paper, which is enough to meet the investigation of flow patterns, and pressure fluctuations (Figure 8). Also, the oscillation periods and extreme values of the rotational speed and discharge are shown in Table 2. By comparison, there are several significant differences in the specific parameters between the three operating conditions. Firstly, the variation periods are different, which in Runner-2 is the shortest one (4.95 s), while those in other two conditions are similar. Secondly, the variation period causes the rotational speed in the Runner-2 condition, reaching its maximum value as quickly as possible, directly leading to the smallest rate of increase in the rotational speed compared to those in the other two conditions. This is also the reason why the dynamic trajectory shape in the Runner-2 condition is the smallest one. Thirdly, the difference in the head variation is mainly reflected in high-frequency and high amplitude pulsation, with the relatively smaller amplitude in the Runner-2 condition.

Table 2.
Main parameters of the rotation speed and discharge.
Therefore, the changes in the blade lean angles in the pump–turbine affect the amplitude and period of macro parameters and the dynamic trajectories on the four quadrant characteristic plane, which need to be carefully considered in the design stage of the pump–turbine.
3.3. Backflows at the Runner Inlet During Three Runaway Processes
In the aforementioned analysis, especially in Xia’s research [28], the change in blade lean angles has a significant effect on the backflows at the runner inlet during load rejections and even changes the generation position of the backflows. To further investigate the differences in internal parameter changes under three transient processes, the method in Xia’s research [28] was used, which involved selecting three monitoring points at the runner inlet, including the hub side (0.1 Span), middle span (0.5 Span), and shroud side (0.9 Span), as shown in Figure 1, to monitor the real-time radial velocity changes during the runaway process. The filtered low-frequency values mean the flow trend and are dimensionless according to Equation (1). In addition, although the flow distribution inside the runner is uneven during the runaway process, the three-dimensional flow patterns at the runner inlet can also explain the evolution mechanism of the backflows.
where Ur is the instantaneous radial velocity, m/s; n0 is the rated rotational speed, r/min; D1 is the runner inlet diameter, m; π is a natural constant.
Firstly, in the Runner-1 condition (Figure 9a), the initial velocity fluctuation is small, indicating that the water flow enters the blade channel normally along the blade, and the flow loss is small. It can also be observed that the initial flow velocity at the three monitoring points is different, with the lower flow velocity at 0.5 Span and the higher flow velocity at 0.1 Span and 0.9 Span. This flow velocity distribution also provides a basis for subsequent velocity changes during the runaway process. When the rotational speed increases, the velocity triangle at the runner inlet and outlet change, leading to the direction of flow deviating from the blade bone line, and the degree of impact between the water with the blade intensify. Then, the radial velocity fluctuation increases, with the largest amplitude at the hub side. Also, as the operating point slides towards the S-shaped region near the runaway point, the fluctuation amplitude at each monitoring point reaches its maximum value. However, once the operating point enters the reverse pump mode, the amplitudes at all monitoring point rapidly decrease, although there are still some pulsations. Subsequently, due to the oscillation of operating points in the S-shaped region, the variation law of the radial velocity is also approximately periodic, which is similar to the head variation mentioned before.
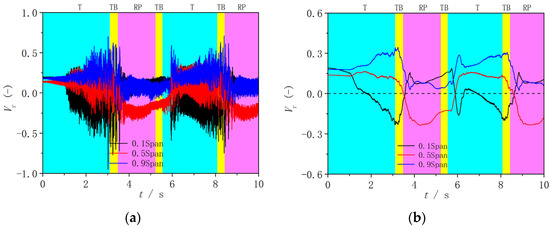
Figure 9.
Radial velocity at the runner inlet in Runner-1. (a) Original data; (b) filtered data.
The filtered velocity variation is shown in Figure 9b. Because the increase in the rotational speed leads to an increase in centrifugal force, the discharge begins to decrease, which also means that the inlet radial velocity will decrease. However, during this process, the radial velocities decrease inconsistently at the entire inlet, decreasing slowly at 0.1 Span and remaining approximately unchanged at 0.5 Span and 0.9 Span (Before t = 1 s). After t = 1 s, the velocity at 0.1 Span undergoes a sudden change and begins to decrease rapidly. Correspondingly, the velocity at 0.5 Span increases rapidly, while that at 0.9 Span increases slowly, which is similar to the time of the discharge change in Figure 8a. Then, when the velocities at 0.5 Span and 0.9 Span reach their maximum values, they no longer rise and begin to fluctuate slightly. During this process, the velocity at 0.1 Span begins to reverse at t = 1.6 s and reaches its maximum value near t = 3 s, and the discharge also decreases rapidly (Figure 8a), indicating that the decrease in discharge is caused by changes in the radial velocity at the runner inlet. After the working point enters the turbine braking mode, the velocity at each monitoring point rapidly decreases, and a backflow transition occurs near t = 3.6 s, namely the velocity at 0.5 Span begins to reverse, and the velocity at 0.1 Span begins to go forward, indicating that the backflows turn from the hub side to the middle span and maintains this state in the reverse pump mode.
Figure 10 shows the backflows at the part region of the runner inlet in Runner-1. When t = 3 s (Figure 10a), the velocity at the shroud side increases. The flow on the hub side collides with the blade pressure surface and forms reverse flow, and the velocity is relatively small. It should be noted that the backflows can cross adjacent blades to re-enter the vaneless space. When t = 3.55 s (Figure 10b), the backflows at the hub side are closer to the vaneless space, making it difficult for the water to enter the runner passage. At t = 4.5 s (Figure 10c), the working point enters the reverse pump mode, and the discharge is reversed. In addition, the overall velocity is very small, and only part of water enters the blade passage from the hub side and shroud side. With the periodic oscillation of the operating point, after the operating point enters the turbine mode again, the backflows undergo a transition.

Figure 10.
Evolutions of backflows at the runner inlet in Runner-1. (a) t = 3 s; (b) t = 3.55 s; (c) t = 4.5 s.
The variations in the radial velocity and flow patterns in Runner-2 (Figure 11 and Figure 12) are similar to those in Runner-1, which means the backflows occur from the hub side, develop to the middle span, and then periodically move between the two locations. However, the difference is that in the initial stage of the runaway, the radial velocities at all three monitoring points in Runner-2 slowly decrease simultaneously (Figure 11b), unlike the laws in Runner-1. Secondly, the time needed for the velocity to decrease and reach the maximum reverse value at 0.1 Span is significantly shortened, and it only costs 2.1 s, and the velocity at 0.5 Span and 0.9 Span also shows a rapid increasing trend, indicating that the lost interference of blade lean angles in Runner-2 accelerates the evolutions of the flow patterns. Then, before the working point enters the turbine braking mode, the velocity at 0.1 Span and 0.5 Span completes the directional change, that means the backflows turn from the hub side to the middle span. Therefore, in the turbine braking mode and the reverse pump mode, the backflows mainly exist at the middle span. The above rapid change also directly leads to a short residence time of the operating point in the S-shaped region, and the velocity fluctuation amplitude at the hub side is relatively small, indicating that the insufficient development of the flow patterns can reduce the fluctuation amplitude. Then the operating point enters the turbine mode again, the backflows still exist in the middle span for some time before transferring to the hub side.
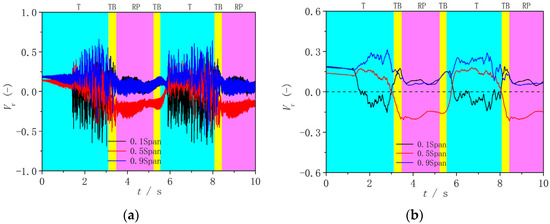
Figure 11.
Radial velocity at the runner inlet in Runner-2. (a) Original data; (b) filtered data.

Figure 12.
Evolutions of backflows at the runner inlet in Runner-2. (a) t = 2.5 s; (b) t = 3.05 s; (c) t = 4.5 s.
Finally, the radial velocity and flow patterns in Runner-3 are shown in Figure 13 and Figure 14, respectively. Compared with the results in previous two conditions, the pulsation amplitude at the shroud side is the largest in Runner-3, and the backflows also generate from the shroud side. This indicates that the change in blade lean angles can effectively affect the generating location of the backflows. In addition, the developing trend of the radial velocity in Runner-3 is very similar to that in Runner-1, especially the fluctuation period. Also, 0.1 Span in Runner-1 and 0.9 Span in Runner-3 are the backflow generation regions, respectively, and the decreasing trend and maximum reverse values of the radial velocity in these two conditions are very similar.
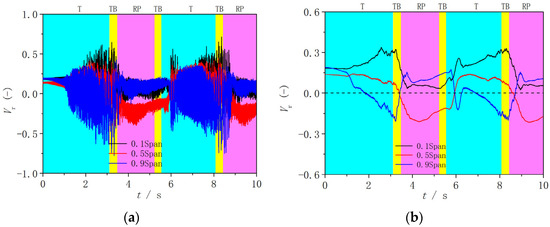
Figure 13.
Radial velocity at the runner inlet in Runner-3. (a) Original data; (b) filtered data.

Figure 14.
Evolutions of backflows at the runner inlet in Runner-3. (a) t = 3 s; (b) t = 3.48 s; (c) t = 4.5 s.
3.4. Pressure Pulsations at the Vaneless Space During Three Runaway Processes
The above three monitoring points are also selected to investigate the pressure pulsation characteristics at the vaneless space during the runaway process, and Equation (2) is used for dimensionless analysis.
where p is the instantaneous pressure signals, Pa; pave is the average pressure, Pa; ρ is the water density, kg/m3; and u1 is the tip velocity of the runner blade leading edge, m/s.
The pressure pulsation at the vaneless space is mainly affected by the rotor–stator interaction, and its amplitude is not only affected by the flow patterns, but also by the distance between the monitoring position and the blade leading edge. The variations in the pressure pulsations under three runaway processes are shown in Figure 15, Figure 16 and Figure 17. Overall, the developing trend of the pressure pulsation is similar to that of radial velocity, but with some differences. Firstly, the initial pressure fluctuation is small, indicating that the water approximately enters the blade channel along the blade bone line, and the degree of impact between the water and the blade is weak. Although there are differences in variations in the rotational speeds among the three processes, the initial pressure between them is similar with only slight changes due to the different blade lean angles. Secondly, during the runaway processes, it can be inferred from the aforementioned radial velocity changes that the velocity at the three monitoring points in each process exhibits different trends at different positions, but the pressure changes are similar. However, the difference in blade lean angles only results in partial differences in pressure pulsation between the three processes. For example, the pressure pulsations in Runner-2 increase rapidly, while those in Runner-1 and Runner-3 increase slowly. Also, the pressure pulsation in each location reaches maximum value near the runaway point. After the working point enters reverse pump mode, the pressure pulsation amplitudes at different positions in three conditions all decrease rapidly, which is consistent with that of velocity pulsations. Subsequently, due to the oscillation of three operating points in the S-shaped region, the variation laws of pressure pulsation exhibit periodic changes.

Figure 15.
The evolution of pressure pulsations in Runner-1. (a) 0.1 Span; (b) 0.5 Span; (c) 0.9 Span.

Figure 16.
The evolution of pressure pulsations in Runner-2. (a) 0.1 Span; (b) 0.5 Span; (c) 0.9 Span.

Figure 17.
The evolution of pressure pulsations in Runner-3. (a) 0.1 Span; (b) 0.5 Span; (c) 0.9 Span.
A more specific analysis of the three working conditions are as follows. In Runner-1, due to the slow change in radial velocity (Figure 9), the pressure pulsation before t = 1 s also shows a slow increasing trend (Figure 15). After t = 1 s, the radial velocity decreases rapidly (Figure 9), and the pressure pulsation increases rapidly (Figure 15). Because the backflows generate from the hub side, the degree of water hitting the blade pressure surface increases, intensifying the effect of the rotor–stator interaction, resulting in obvious higher pressure at 0.1 Span than that at 0.9 Span. After the working point enters the S-shaped region, the pressure pulsations at all three monitoring points increase significantly and reach maximum values near the runaway points, followed by the decrease in the reverse pump mode. In addition, when the operating point re-enters the turbine mode, the pressure pulsations increase again. As the backflows still exist at the hub side, the pressure at 0.1 Span is also relatively large and even more pronounced than that in the first turbine mode. In Runner-2, the evolution mechanism of backflows is similar with that in Runner-1, except for the advanced generation time. Therefore, Runner-1 and Runner-2 all have the rapid increase in pressure pulsations in the initial stage and similar variation characteristics during other times. In Runner-3, the opposite characteristics occur, including larger pressure pulsations at 0.9 Span because the backflows generate at 0.9 Span.
Based on the pressure pulsation characteristics analyzed above, it can be concluded that the different blade lean angles change the generation position of backflows, further affecting the developing trend of pressure pulsations, which needs to be emphasized in the design stage.
3.5. Flow Patterns in the Blade Passages During Runaway Process
To further analyze the evolution mechanism of pressure pulsations, the streamlines at 0.5 Span at typical time in three processes are selected, and the distributions of flow direction and velocity magnitude are analyzed (Figure 18, Figure 19 and Figure 20). The flow patterns at the initial point are explained in Section 3.1; this section focuses on the process accompanying the high amplitude pressure fluctuations, during which the working point passes through the turbine mode, turbine braking mode, and reverse pump mode. It can be observed that the flow patterns inside the blade passages present similarity between the three processes. Taking the results in Runner-1 as an example, when t = 2.5 s the backflow region is located at the hub side, but the velocities in the middle and shroud side are relatively large (Figure 9b). Therefore, the velocity at 0.5 Span at the runner inlet increases and part of flow patterns are disorganized, and the high velocity region is mainly distributed on the pressure surface (Figure 18a). This is also the reason for the pressure increase in Figure 15. When t = 3.55 s, the operating point is in the turbine braking mode, and the rotating stalls occur with backflows and low-velocity vortices generating in the six blade passages, and it happens to be the moment when the backflows turn from the hub side to the middle span. When t = 4.5 s, low-velocity vortices appear almost throughout the entire blade passages, but the overall velocity is low, namely the degree of impact between the water and blade is small, and this is also the reason for the relatively small pressure fluctuation amplitude in the reverse pump mode. In Runner-2 and Runner-3, the developments of flow patterns in the blade passages are similar to that in Runner-1, both of which go through several stages including inlet velocity increasing, rotating stall generating, and low-velocity vortices occupying the entire blade channels. The main difference between them is that the unstable flow patterns occur at different time due to the different fluctuation periods caused by different blade lean angles.
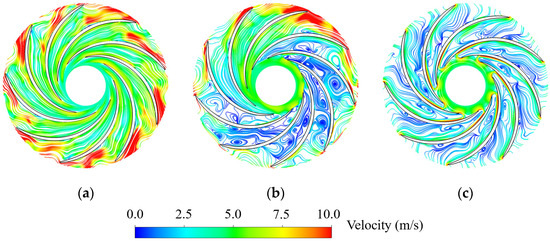
Figure 18.
Typical flow patterns at 0.5 span in Runner-1. (a) t = 2.5; (b) t = 3.55 s; (c) t = 4.5 s.
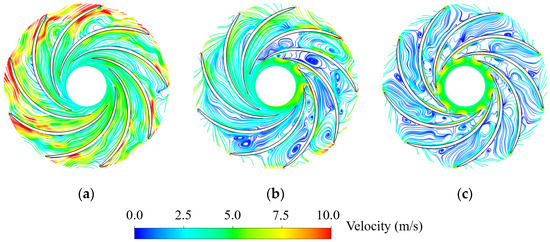
Figure 19.
Typical flow patterns at 0.5 span in Runner-2. (a) t = 2.5; (b) t = 3.3 s; (c) t = 4.5 s.
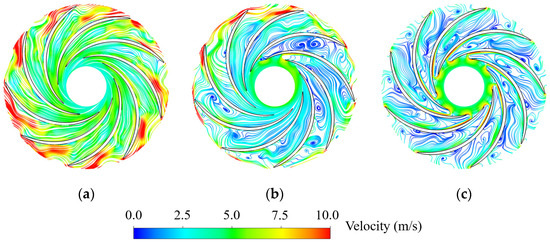
Figure 20.
Typical flow patterns at 0.5 span in Runner-3. (a) t = 2.5; (b) t = 3.5 s; (c) t = 4.5 s.
3.6. Runner Forces During Runaway Processes
The forces acting on the runner include radial forces (Fx and Fy) and axial force (Fz). The radial forces (Fx and Fy) mean the radial hydraulic thrust on the runner in the x and y directions, while the axial force (Fz) means axial hydraulic thrust in the z direction, and the directions of x, y, and z are shown in Figure 1. The runner forces are all dimensionless according to Equation (3) [29].
where Ftime is the instantaneous runner force (Fx, Fy, Fz), N; ρ is the water density, kg/m3; D1 is the runner inlet diameter, m; g is the gravitational acceleration, m/s2; H is the rated head, m.
The variation in radial forces reflects the non-uniformity of the flow patterns in the blade passages and vaneless space, while the axial force is not only affected by the flow patterns, but also by the discharge and water hammer inside the draft tube. During the runaway process, as the operating point slides through different working conditions, the runner forces also exhibit regular fluctuations (Figure 21). Overall, as the rotational speed increases, the radial and axial force pulsations gradually increase. When the working points approach the runaway points, the uneven distributions of flow patterns in the blade passages become more severe, and the radial forces show significant sudden increases, while the axial forces gradually decrease under the influence of discharge. In addition, it should be noted that due to the severe non-uniformity of the flow patterns in the turbine braking mode and the increasing range of the backflows at the runner inlet, the radial forces reach maximum values. After the operating points enter the reverse pump mode, the overall velocity inside the runner is relatively small, then both radial and axial forces show small fluctuations, although the blade passages are still filled with vortex structures.
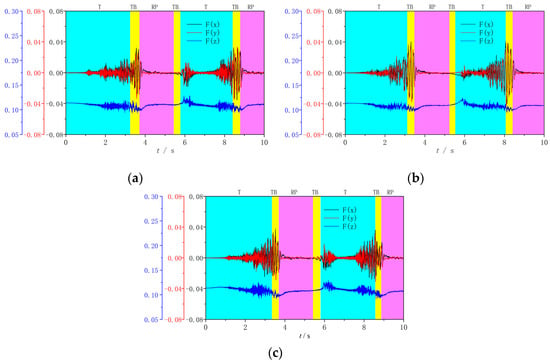
Figure 21.
Evolutions of runner forces during runaway processes. (a) Runner-1; (b) Runner-2; (c) Runner-3.
Specifically, for the radial forces, the maximum absolute values of Fx observed for Runner-1, Runner-2, and Runner-3 are 0.03531, 0.04065, and 0.03784, respectively, while those of Fy are 0.03497, 0.04320, and 0.03162, respectively, and all the maximum values occur in the turbine braking mode. Because of the presence of the blade lean angles in Runner-1 (Figure 21a) and Runner-3 (Figure 21c), the radial forces increase rapidly and last for a long time due to the forced change in the radial velocity at different spans during rotational speed increasing period. However, the radial forces of Runner-2 are the largest when the working point enters the turbine braking mode (Figure 21b), and from the comparison of the flow patterns between three conditions (Figure 18b, Figure 19b, and Figure 20b), it can be clearly observed that the distribution of inlet backflows in Runner-2 is the most uneven. Similar to the variation trend of the pressure pulsations, the radial force pulsations in the reverse pump mode are also the smallest. For the axial force, the changes in the internal flow patterns in the runner cause the axial forces to present high frequency and high amplitude characteristics, while that of Runner-2 is the smallest. From the perspective of flow patterns, the inlet backflows in Runner-3 mainly occur on the shroud side, which is near the draft tube and may cause relatively large amplitudes.
4. Conclusions
Three pump–turbine runners with different blade lean angles were selected in this paper to study the evolution mechanism differences in the macro parameters and internal flow pattern characteristics at the initial steady point and during the runaway processes from turbine mode. The variation laws of macro parameters in three conditions during the transient processes were compared, the mechanism of backflows at the runner inlet and vortex structures in the blade passages were investigated, the influences of blade lean angles on the pressure pulsations and runner forces were explored, and the correlations between the blade lean angles with macro parameters and internal flow patterns were summarized. The specific conclusions are as follows:
- (1)
- The blade lean angles affect the pressure distribution at the runner inlet and the direction of flow entering the blade passages from the vaneless space under steady operating conditions. At the blade pressure side, the inlet water flows from the shroud side towards the hub side, affected by a positive angle; converges from the hub and shroud sides towards the middle region, affected by no angle; and flows from the hub side to the shroud side, affected by a negative angle. At the blade suction side, the inlet water flows towards the blade passages approximately perpendicular to the blade inlet.
- (2)
- The blade lean angles affect the generation position and development trend of the backflows at the runner inlet. The backflows generate from the hub side in runners with a positive angle and no angle, while they occur from the shroud side under the condition with a negative angle, and the backflows in all three conditions transfer to middle region in the reverse pump mode.
- (3)
- The blade lean angles affect the variations in macro parameters, pressure pulsations, and runner forces during runaway processes. The macro parameter of three runners exhibit periodic oscillations, and especially the process with no blade lean angle has the shortest fluctuation period, smallest pressure pulsations, and the largest runner radial forces.
- (4)
- This paper focuses on the influence of blade lean angles on internal and external characteristics during the runaway process. In practical design, the more steady and transient conditions, accompanied with different heads, guide vane openings and lean angles can be comprehensively considered to investigate how the blade lean angles affect the instability of the pump–turbine unit.
Author Contributions
Conceptualization, Z.Y. and C.L.; methodology, Z.Y. and C.Z.; validation, B.Z.; data curation, J.F.; writing—original draft preparation, Z.Y. and C.L.; writing—review and editing, T.Q. and B.Z.; visualization, T.Q. and C.Z. All authors have read and agreed to the published version of the manuscript.
Funding
This research was funded by the Science and Technology Project of PowerChina HuaDong Engineering Corporation Limited (Grant No. KY2025-JD-02-01).
Data Availability Statement
The original contributions presented in this study are included in the article. Further inquiries can be directed to the corresponding author.
Conflicts of Interest
Authors Zhiyan Yang, Jie Fang, Baoyong Zhang, Chengjun Li, Tang Qian were employed by the company PowerChina HuaDong Engineering Corporation Limited. The remaining authors declare that the research was conducted in the absence of any commercial or financial relationships that could be construed as a potential conflict of interest. The authors declare that this study received funding from Science and Technology Project of PowerChina HuaDong Engineering Corporation Limited. The funder was not involved in the study design, collection, analysis, interpretation of data, the writing of this article, or the decision to submit it for publication.
References
- Liu, J.; Wang, L.; Jiao, T.; Yang, W.; Xu, R.; Wu, K.; Ha, H. Multi-Period Voltage Stability-Constrained Optimal Power Flow with Uncertainties. Appl. Energy 2024, 369, 123522. [Google Scholar] [CrossRef]
- Gao, J.T.; Tang, Y. Renewable Energy Utilization and Stability through Dynamic Grid Connection Strategy and AI-Driven Solution Approach. J. Energy Storage 2024, 95, 112546. [Google Scholar] [CrossRef]
- Najjarpour, M.; Tousi, B.; Ebadi Zahedan, A. Improving Reliability of Active Distribution Networks Using Probabilistic Assessment of Renewable Resource Units. Int. J. Eng. 2024, 37, 1780–1789. [Google Scholar] [CrossRef]
- Xi, F.; Yan, R.; Shi, J.; Zhang, J.; Wang, R. Pumped Storage Power Station Using Abandoned Mine in the Yellow River Basin: A Feasibility Analysis under the Perspective of Carbon Neutrality. Front. Environ. Sci. 2022, 10, 983319. [Google Scholar] [CrossRef]
- Hu, H.; Xia, M.; Song, X.; Zhao, W.; Wang, W.; Wang, Z. A Field Investigation of Stability Characteristics of Pressure Fluctuation and Vibration in Prototype Pump Turbine at Multiple Working Points. Water 2023, 15, 3378. [Google Scholar] [CrossRef]
- Nennemann, B.; Parkinson, É. YiXing Pump Turbine Guide Vane Vibrations: Problem Reso Lution with Advanced CFD Analysis. IOP Conf. Ser. Earth Environ. Sci. 2010, 12, 012057. [Google Scholar] [CrossRef]
- Zhang, F.; Lowys, P.; Houdeline, J.; Guo, X.; Hong, P.; Laurant, Y. Pump-Turbine Rotor-Stator Interaction Induced Vibration: Problem Resolution and Experience. IOP Conf. Ser. Earth Environ. Sci. 2021, 774, 012124. [Google Scholar] [CrossRef]
- Fu, X.L.; Li, D.Y.; Wang, H.J.; Zhang, G.H.; Li, Z.G.; Wei, X.Z. Dynamic Instability of a Pump-Turbine in Load Rejection Transient Process. Sci. China Technol. Sci. 2018, 61, 1765–1775. [Google Scholar] [CrossRef]
- Casartelli, E.; Ryan, O.; Schmid, A.; Mangani, L. CFD Simulation of Transient Startup for a Low Specific-Speed Pump-Turbine. IOP Conf. Ser. Earth Environ. Sci. 2019, 240, 082007. [Google Scholar] [CrossRef]
- Zhang, X.; Cheng, Y.; Xia, L.; Yang, J.; Qian, Z. Looping Dynamic Characteristics of a Pump-Turbine in the s-Shaped Region during Runaway. J. Fluids Eng. Trans. ASME 2016, 138, 091102. [Google Scholar] [CrossRef]
- Zeng, W.; Yang, J.; Hu, J. Pumped Storage System Model and Experimental Investigations on S-Induced Issues during Transients. Mech. Syst. Signal Process. 2017, 90, 350–364. [Google Scholar] [CrossRef]
- Yang, Z.Y.; Zhang, X.X.; Liu, D.M.; Cheng, Y.G.; Zhao, M.D. CFD Simulation of the Pump Trip Runaway Transient Process of a Pumped-Storage Power Plant with Head 700 m. IOP Conf. Ser. Earth Environ. Sci. 2021, 774, 012102. [Google Scholar] [CrossRef]
- Hu, J.; Yang, J.; Zeng, W.; Tang, R. Transient Pressure Pulsations of a Model Pump-Turbine during Power Failure. In Proceedings of the ASME 2017 Fluids Engineering Division Summer Meeting, Waikoloa, HI, USA, 3 August 2017; Volume 1A. [Google Scholar]
- Yang, Z.; Liu, Z.; Cheng, Y.; Zhang, X.; Liu, K.; Xia, L. Differences of Flow Patterns and Pressure Pulsations in Four Prototype Pump-Turbines during Runaway Transient Processes. Energies 2020, 13, 5269. [Google Scholar] [CrossRef]
- Zhang, Y.; Wu, Y. A Review of Rotating Stall in Reversible Pump Turbine. Proc. Inst. Mech. Eng. C J. Mech. Eng. Sci. 2017, 231, 1181–1204. [Google Scholar] [CrossRef]
- Guang, W.; Lu, J.; Pan, J.; Tao, R.; Xiao, R.; Liu, W. Study on Runaway Performance of Pump-Turbine Based on Finite-Time Lyapunov Exponent and Proper Orthogonal Decomposition Method. J. Energy Storage 2024, 83, 110759. [Google Scholar] [CrossRef]
- Chen, Z.; Jiang, Z.; Chen, S.; Zhang, W.; Zhu, B. Experimental and Numerical Study on Flow Instability of Pump-Turbine under Runaway Conditions. Renew. Energy 2023, 210, 335–345. [Google Scholar] [CrossRef]
- Su, W.T.; Li, X.B.; Xia, Y.X.; Liu, Q.Z.; Binama, M.; Zhang, Y.N. Pressure Fluctuation Characteristics of a Model Pump-Turbine during Runaway Transient. Renew. Energy 2021, 163, 517–529. [Google Scholar] [CrossRef]
- Xia, L.; Cheng, Y.; Yang, Z.; You, J.; Yang, J.; Qian, Z. Evolutions of Pressure Fluctuations and Runner Loads During Runaway Processes of a Pump-Turbine. J. Fluids Eng. 2017, 139, 091101. [Google Scholar] [CrossRef]
- Fu, X.; Li, D.; Wang, H.; Zhang, G.; Wei, X. Mechanism and Influence Factors of Hydraulic Fluctuations in a Pump-Turbine. Proc. Inst. Mech. Eng. Part A J. Power Energy 2022, 236, 33–50. [Google Scholar] [CrossRef]
- Zhang, X.; Cheng, Y.; Yang, Z.; Chen, Q.; Liu, D. Influence of Rotational Inertia on the Runner Radial Forces of a Model Pump-Turbine Running Away through the S-Shaped Characteristic Region. IET Renew. Power Gener. 2020, 14, 1883–1893. [Google Scholar] [CrossRef]
- Hou, X.; Cheng, Y.; Yang, Z.; Liu, K.; Zhang, X.; Liu, D. Influence of Clearance Flow on Dynamic Hydraulic Forces of Pump-Turbine during Runaway Transient Process. Energies 2021, 14, 2830. [Google Scholar] [CrossRef]
- Lu, Z.; Xiao, R.; Tao, R.; Li, P.; Liu, W. Influence of Guide Vane Profile on the Flow Energy Dissipation in a Reversible Pump-Turbine at Pump Mode. J. Energy Storage 2022, 49, 104161. [Google Scholar] [CrossRef]
- Zhao, Y.; Li, D.; Chang, H.; Fu, X.; Wang, H.; Qin, D. Suppression Effect of Bionic Guide Vanes with Different Parameters on the Hump Characteristics of Pump-Turbines Based on Entropy Production Theory. Energy 2023, 283, 128650. [Google Scholar] [CrossRef]
- Qin, Y.; Li, D.; Wang, H.; Liu, Z.; Wei, X.; Wang, X. Multi-Objective Optimization Design on High Pressure Side of a Pump-Turbine Runner with High Efficiency. Renew. Energy 2022, 190, 103–120. [Google Scholar] [CrossRef]
- Ma, Z.; Zhu, B. Pressure Fluctuations in Vaneless Space of Pump-Turbines with Large Blade Lean Runners in the S- Shaped Region. Renew. Energy 2020, 153, 1283–1295. [Google Scholar] [CrossRef]
- Li, D.; Qin, Y.; Wang, J.; Zhu, Y.; Wang, H.; Wei, X. Optimization of Blade High-Pressure Edge to Reduce Pressure Fluctuations in Pump-Turbine Hump Region. Renew. Energy 2022, 181, 24–38. [Google Scholar] [CrossRef]
- Xia, L.S.; Zhang, C.Z.; Li, H. Influences of Runner Blade Shape on the Transient Behaviours of Pump-Turbines in Load Rejection. J. Hydraul. Res. 2021, 59, 462–476. [Google Scholar] [CrossRef]
- Fu, X.; Li, D.; Wang, H.; Zhang, G.; Li, Z.; Wei, X. Numerical Simulation of the Transient Flow in a Pump-Turbine During the Load Rejection Process With Special Emphasis on the Cavitation Effect. ASME J. Fluids Eng. 2020, 142, 011103. [Google Scholar] [CrossRef]
Disclaimer/Publisher’s Note: The statements, opinions and data contained in all publications are solely those of the individual author(s) and contributor(s) and not of MDPI and/or the editor(s). MDPI and/or the editor(s) disclaim responsibility for any injury to people or property resulting from any ideas, methods, instructions or products referred to in the content. |
© 2025 by the authors. Licensee MDPI, Basel, Switzerland. This article is an open access article distributed under the terms and conditions of the Creative Commons Attribution (CC BY) license (https://creativecommons.org/licenses/by/4.0/).