Article

Comparison of Laboratory and Field Methods for Biosand Filter Sand Characterization

Department of Civil and Environmental Engineering, Lehigh University, Bethlehem, PA 18015, USA
*
Author to whom correspondence should be addressed.
Water 2025, 17(18), 2706; https://doi.org/10.3390/w17182706
Submission received: 25 July 2025 / Revised: 1 September 2025 / Accepted: 10 September 2025 / Published: 13 September 2025
(This article belongs to the Section Water Quality and Contamination)

Abstract

The Centre for Affordable Water and Sanitation Technology (CAWST) (2012) recommends size standards for the effective size (ES) and uniformity coefficient (UC) of filtration media in biosand filters (BSFs) to ensure optimal effluent flow rates and contaminant removal. The recommended, laboratory-determined ES and UC ranges are also advised for field use despite differences in mass- versus volume-based protocols and no studies comparing laboratory versus field protocols to date. ES and UC values of five sand samples were compared using mass- versus volume-based measurements and lab versus field protocols. Results suggest that the use of mass- or volume-based measurements generally does not affect the ES or UC of a given method (except in cases where the density of sand grains varies significantly across the size distribution range). Differences between laboratory and field protocols, however, were found to affect ES and UC values by up to 24%. Overall, differences in laboratory and field sand size determination protocols should be further evaluated to ensure standardized field construction of BSFs and to limit potential impacts to filter efficacy and sustained, household filter usage.

1. Introduction

Several studies have identified decentralized, point-of-use (POU) water treatment as an effective tool to improve household access to clean drinking water in rural areas [1,2,3,4,5], settings where centralized water treatment is technically or economically unfeasible [2,5,6], or during periods of infrastructure development or interruption [7]. The biosand filter (BSF), which has been found to reduce the incidence of diarrheal diseases that are a leading cause of child morbidity and mortality in less developed countries [2,8], has been highlighted as a relatively inexpensive [2,6], durable [6], and easy-to-use [9] POU water treatment technology. BSFs are intermittently operated [10], gravity (i.e., downward) filters that remove contaminants through mechanical (e.g., adsorption, screening, sedimentation) and biological processes [1,8,11,12]. Biological contaminant removal is performed by a microbiological mat (i.e., biofilm, biolayer, or schmutzdecke) that forms around sand particles at the top of the BSF after about a 30-day ripening period [1], and is supported by oxygen and nutrients from influent water [8,9]. Previous studies have found BSFs to have high contaminant removal rates in laboratory evaluations, including 92–99% Escherichia coli (E. coli) [2] and 88–99% turbidity removal [9,13,14].
To promote effective BSF filtration, the Centre for Affordable Water and Sanitation Technology (CAWST) recommends sand size standards that should be met for the fine (i.e., filtration) sand layer in a BSF, regardless of the sand source [15]. The sand size characterization parameters used to target the optimal flow rate (mL/min; numeric values vary depending on filter design and removal performance of BSFs [16]) are the effective size (ES, also referred to as the d10), d60, and uniformity coefficient (UC). The ES is the sand grain diameter at which 10% of the sand sample by mass is finer; similarly, the d60 is the diameter at which 60% of the sample by mass is finer. The UC has the ratio of d60 to ES. For optimal performance of BSFs, CAWST recommends fine and uniformly graded sand in the range of 0.15–0.20 mm and 1.5–2.5 for the ES and UC, respectively [15].
Achieving the target sand size parameters and subsequent flow rates are important for filter efficacy and consumer acceptance. High filtration rates (resulting from high ES or UC close to 1) can reduce filtration efficacy and cause pathogens to slough from the BSF media and contaminate filter effluent, decreasing consumer acceptance of filters in cases where treated water has poor taste, odor, and clarity [1,6,17]. Low filtration rates (resulting from low ES or high UC) can lead to unacceptably long run times (i.e., duration of filtration cycle) and more frequent clogging and maintenance (e.g., backwashing) requirements for the user, increasing the likelihood of filter abandonment [11,15,17,18]. Research by Benson et al. (2025) found that low flow rates, while improving filtration efficacy, reduced household filter uptake and satisfaction [6].
Compared to laboratory performance of BSFs, the field performance of BSFs has been more variable and generally reduced, including negative to 99.9% E. coli [2,13] and 39–91% turbidity removal [13]. Tsafeck et al. (2024) found that, in the West Region of Cameroon, locally made BSFs did not consistently meet World Health Organization (WHO) bacteriological quality standards [3]. BSF performance reductions during field trials suggest that the construction, quality, and operation and maintenance of BSFs in the field likely vary [6] from ideal laboratory conditions and specifications. Filtration sand size parameters may play a role in the variable field performance of BSFs. For example, investigations of field BSF performance have used filtration sand with ES values ranging from 0.11 mm to 0.52 mm [9,13], while other studies do not mention the sand size parameters evaluated [2,14].
The CAWST-recommended ES and UC ranges for filtration sand were determined in a laboratory, using laboratory-grade sieves, mechanical sieve shakers, and a balance to measure the mass of sand retained on each sieve. By comparison, ES and UC values in the field are often calculated volumetrically, using portable hand-held field sieves and a graduated cylinder to measure the volume of sand retained on each sieve, due to a lack of access to laboratory equipment in remote areas where BSFs are typically used. Despite the different protocols for determining ES and UC values in the laboratory versus the field, the parameter ranges determined in the laboratory are also suggested for field use. The CAWST field protocols, therefore, assume that mass and volume measurements scale linearly (i.e., filtration sand is uniform with respect to size, shape, density, and packing [19,20,21,22,23]). To the authors’ knowledge, no studies to date have compared the ES and UC values obtained from the laboratory versus the field protocols, nor have any studies evaluated the assumption that mass and volume measurements of filtration sand scale linearly.
This study aimed to determine if the ES and UC of a sand sample are comparable when the sand grain analyses are determined based on the mass versus the volume of sand retained on each sieve. Non-linear scaling of mass and volume measurements was evaluated as a potential effect of sand size, shape, and density. Irregular packing was not evaluated as a cause of non-linear scaling because each sample was manually tamped before volumetric measurements were taken to limit the effects of irregular packing. In addition, the study compared the CAWST field methods for ES and UC determination to the standard laboratory method.

2. Materials and Methods

2.1. Sand Samples

Five sand samples (S1–S5) were selected for analysis (Table 1; Figure S1). The five sand samples were washed according to CAWST guidelines for BSF sand preparation [1] (see Supplementary Materials for details) prior to characterization of the ES, UC, density, roundness, and circularity.

2.2. Sand Size Parameter Determination

2.2.1. Sieve Testing

Field (i.e., CAWST) sieve testing methods followed CAWST’s Sand Grain Size Analysis (Sieve Analysis) [15], and laboratory sieve testing methods were based on American Society for Testing and Materials (ASTM) C136/C136M-19 [24], ASTM D6913-04 [25], and International Organization for Standardization (ISO) 11277:2020 [26]. Sieve tests were conducted on each sand sample with both laboratory-grade and CAWST (hand-held) sieve sets (Figure S2). Five laboratory-grade (i.e., American Standard) sieves (Fischer Scientific Company, Hampton, NH, USA; Soiltest Incorporated, Evanston IL, USA; The W.S. Tyler Company, Cleveland, OH, USA), numbers (No.) 25 (0.71 mm), 40 (0.425 mm), 60 (0.25 mm), 80 (0.177 mm), and 140 (0.105 mm), plus a catch pan, were stacked from most coarse (No. 25) to least coarse (No. 140). Similarly, the CAWST sieve column included CAWST sieve (CAWST, Calgary, AB, Canada) No. 24 (0.71 mm), 40 (0.38 mm), 60 (0.25 mm), 80 (0.18 mm), and 150 (0.10 mm), plus a catch pan, stacked from most coarse (No. 24) to least coarse (No. 50). Each sieve and the catch pan were individually weighed before each trial; each sand sample (n = 5) was tested in 17 independent trials with each sieve set. For each trial, sand volume (170–200 mL for the laboratory sieves; 90 mL for the CAWST sieves) was measured in a graduated cylinder and poured into the top of the sieve column. The laboratory sieve column was placed in a RoTAP Sieve Shaker (Model RX-29, W. S. Tyler, Mentor, OH, USA) (Figure S2) and shaken for two minutes; the CAWST sieve column was shaken manually for five minutes. Each sieve with its retained sand was weighed, and the mass of sand retained on each sieve was calculated by subtracting the initial mass of the sieve. Retained sand was poured into a graduated cylinder; after each addition of sand to the graduated cylinder, the sides of the cylinder were tapped by hand (to improve sample packing and achieve a flat measurement surface), and the cumulative volume was recorded. Sieves were cleaned with wire brushes between trials to remove sand grains stuck in the sieve mesh.

2.2.2. Sand ES and UC Analysis

ES and UC values for each sand sample were calculated based on the sand grain size distribution (by mass or volume) determined by plotting sieve mesh size (i.e., sand grain diameter) against percent sand finer from the sieve tests (Figure S3). The ES, d60, and UC were calculated from the grain size distribution curve. CAWST field methods followed CAWST’s Sand Grain Size Analysis (Sieve Analysis) [15] for grain size distribution development, and laboratory method for grain size distribution development was based on ASTM D6913-04 [25] and ISO 11277:2020 [26].
Sample calculations are included in the Supplementary Materials and can also be found in CAWST’s Biosand Filter Grain Size Analysis Instructions [15]. Using percent sand finer calculations, median ES and UC values were determined using four different methods (Table 2), each repeated using sand mass or sand volume measurements, respectively, for a total of eight ES and UC values for each sand sample. The methods differ by the type of sieve used (laboratory versus CAWST) and the calculation of ES and UC (i.e., hand-made graph versus a Microsoft Excel Particle Size Distribution (PSD) graph vs. an app). Sand characterization methods were labeled “prescribed” if they were explicitly recommended for use (e.g., the CAWST Graph and CAWST App (https://play.google.com/store/apps/details?id=com.cawst.bsfsand&hl=en_US&gl=US, accessed on 22 December 2021, Apple version, accessed in 2021) methods are recommended by CAWST in field settings, and the Lab PSD method is the recommended laboratory method). While each prescribed method does specify either mass- or volume-based calculations, in this study, the methods were performed with both types of calculations for comparison. Resulting ES and UC values were compared to determine if mass- and volume-based measurements and calculations yielded similar sand characterization parameters.

2.3. Additional Sand Characterization

2.3.1. Density Calculations

The overall density of a sand sample was calculated using the sum of sand masses retained on each sieve and catch pan after sieving, and the initial volume of sand (measured before sieving for each lab sieve trial). For example,
ρ O v e r a l l   = M R C u m u l a t i v e V i n i t i a l
where ρ O v e r a l l is overall density, M R C u m u l a t i v e is the cumulative mass retained, and V i n i t i a l is the initial volume of sand measured before sieving.
Single sieve sand densities for each size fraction within a sand sample were calculated using the mass and volume retained on a sieve mesh during each lab sieve trial. For example,
ρ S i e v e = M R V R  
where ρ S i e v e is the density of sand retained on a single sieve, M R is the mass retained on a single sieve, and V R is the volume retained on a single sieve.
For trials where the volume of sand retained was recorded at 0 mL (i.e., volume retained was <1 mL on a sieve mesh), no single sieve density was calculated.

2.3.2. Percent Retained

The percent of a sand sample retained on a sieve was calculated for the lab sieves using the total quantity of sand retained on that particular sieve compared to the quantity of sand retained cumulatively on all sieves. For example,
P R = M R   ( o r   V R ) M R C u m u l a t i v e   ( o r   V R C u m u l a t i v e ) × 100 %
where P R is the percent of a total sample (mass or volume) retained on a single sieve, M R   ( o r   V R ) is the mass (or volume) retained on a single sieve, and M R C u m u l a t i v e   ( o r   V R C u m u l a t i v e ) is the cumulative mass (or volume) retained on all sieves and the catch pan.

2.3.3. ImageJ

Images of sand particles were taken by scanning electron microscopy (SEM) and analyzed using ImageJ 1.53t (Wayne Rasband, Washington, DC, USA) software to determine sand shape (Figure S4). Circularity was calculated as the ratio of a sand particle’s measured area to the area of a circle with an equivalent perimeter (i.e., circularity equal to one is exactly circular) [27,28], and roundness was the ratio of a sand particle’s area to the area of a circle with a diameter equal to the Max-Feret (longest along any axis) diameter (i.e., roundness equal to one is completely smooth edges) [27,28].
Each image was converted to binary to show the particles’ edges in black and empty space in white. The interior of the imaged sand grains was filled with black, so single particles were not disconnected in binary (Figure S4). Sand grains that were entirely visible with clear edges, and no overlap with other grains, were selected for measurements of area, perimeter, and Min-Feret (the shortest along any axis) diameter to determine the median and standard deviation roundness and circularity of the sand grain. This process was repeated for each sand sample. For some binary images in which sand grain edges were not clearly defined, the contrast of the original SEM image was enhanced before converting the image to binary black and white (Figure S4). Some enhanced sand grain images required manual cleanup (using the ImageJ drawing tool) to remove small gaps or artificial connections to other sand grains.
Kruskal-Wallis and Dunn Tests were performed on ImageJ datasets, including and excluding the manually cleaned sand grain roundness and circularity values. The inclusion or exclusion of manually cleaned grains did not affect the significance of Kruskal-Wallis and Dunn Test results comparing sample circularity and roundness (i.e., a significant Kruskal-Wallis or Dunn Test p-value excluding cleaned grains remained significant if cleaned grains were included, and vice versa). Therefore, manually cleaned measurements were included to increase statistical power. Furthermore, all grains with a Min-Feret diameter measurement < 0.01 mm (corresponding to silt particles) were removed, so only filtration sand was analyzed.

2.4. Statistical Analysis

Statistical analyses were performed with R4.2.2 using RStudio 2022.12.0 (RStudio, Boston, MA, USA). Packages used in the statistical analyses included dpylr, ggplot2, readxl, rstatix, ggpubr, stats, and tidyr.
Kruskal-Wallis tests were used to identify significant differences among the sand sample characteristics (i.e., circularity, roundness, density, and percent of sample retained on a sieve) and ES and UC values from the three prescribed method types. Post hoc Dunn Tests (with a Holm p-value adjustment) further investigated if any two of the five sand samples yielded statistically different sample characteristic values.
Mann–Whitney U tests were used to identify significant differences between (1) the mass- and volume-based ES and UC calculations for each sand sample using each of the four methods, and (2) the percent of a sand sample retained on a sieve using mass- versus volume-based measurements.
All statistical tests were performed with a significance level of 5%, and Holm adjustments were used to control for a family-wise error rate of 5% (α = 0.05).

3. Results

3.1. Mass and Volume Measurement Comparisons

Differences between mass and volume measurement methods were evaluated by comparing the percent mass and volume retained on each laboratory sieve. Mann–Whitney analyses of sieve test data revealed at least one difference in the percent of sand retained on a sieve using mass or volume calculations for every sample (Mann–Whitney p < 0.05; Figure 1; Table S1). Additionally, S3 was the only sand sample with a single sieve (No. 60) with more than 50% of the sample by volume retained and a significantly higher percent retained using volume than mass measurements (Mann–Whitney p < 0.05; Figure 1; Table S1).

3.2. ES and UC Values

ES and UC values were calculated for each sand sample using the four methods (Table 2) with calculations based on mass and volume, respectively. For the methods using CAWST sieves, the median UC for all five sand samples fell within the CAWST-recommended UC range for sand used in BSFs (1.5 to 2.5) for each method (Figure 2). Methods using CAWST sieves also demonstrated that S4 always had, S1 and S3 generally did not have, and S2 and S5 never had median ES values that fell within the CAWST-recommended range for sand used in BSFs (0.15 to 0.20 mm) (Figure 2; Table S2).
Like methods using the CAWST sieves, median UC values using the (control) Lab PSD method always fell within the CAWST-recommended range (Figure 3). The Lab PSD method identified only S4 to be within the recommended ES range (Figure 3; Table S2). Comparing Lab PSD and CAWST-sieve-derived ES values, S4 always fell within, and S2 and S5 always fell outside the recommended ES range, regardless of the method (Figure 2 and Figure 3; Table S2). These results suggest that S4 would be unilaterally accepted for use in a BSF, while S2 and S5 would be unilaterally rejected for use in a BSF, regardless of sieve type, ES/UC determination method, and measurement type (i.e., mass or volume). Conversely, S1 and S3 would be differentially accepted for use in the BSF based on ES differences resulting from different sieve types, determination methods, and measurement types, warranting further investigation into why different methods yield varying results across S1 and S3 (Figure 2 and Figure 3; Table S2).

3.3. ES and UC Comparisons

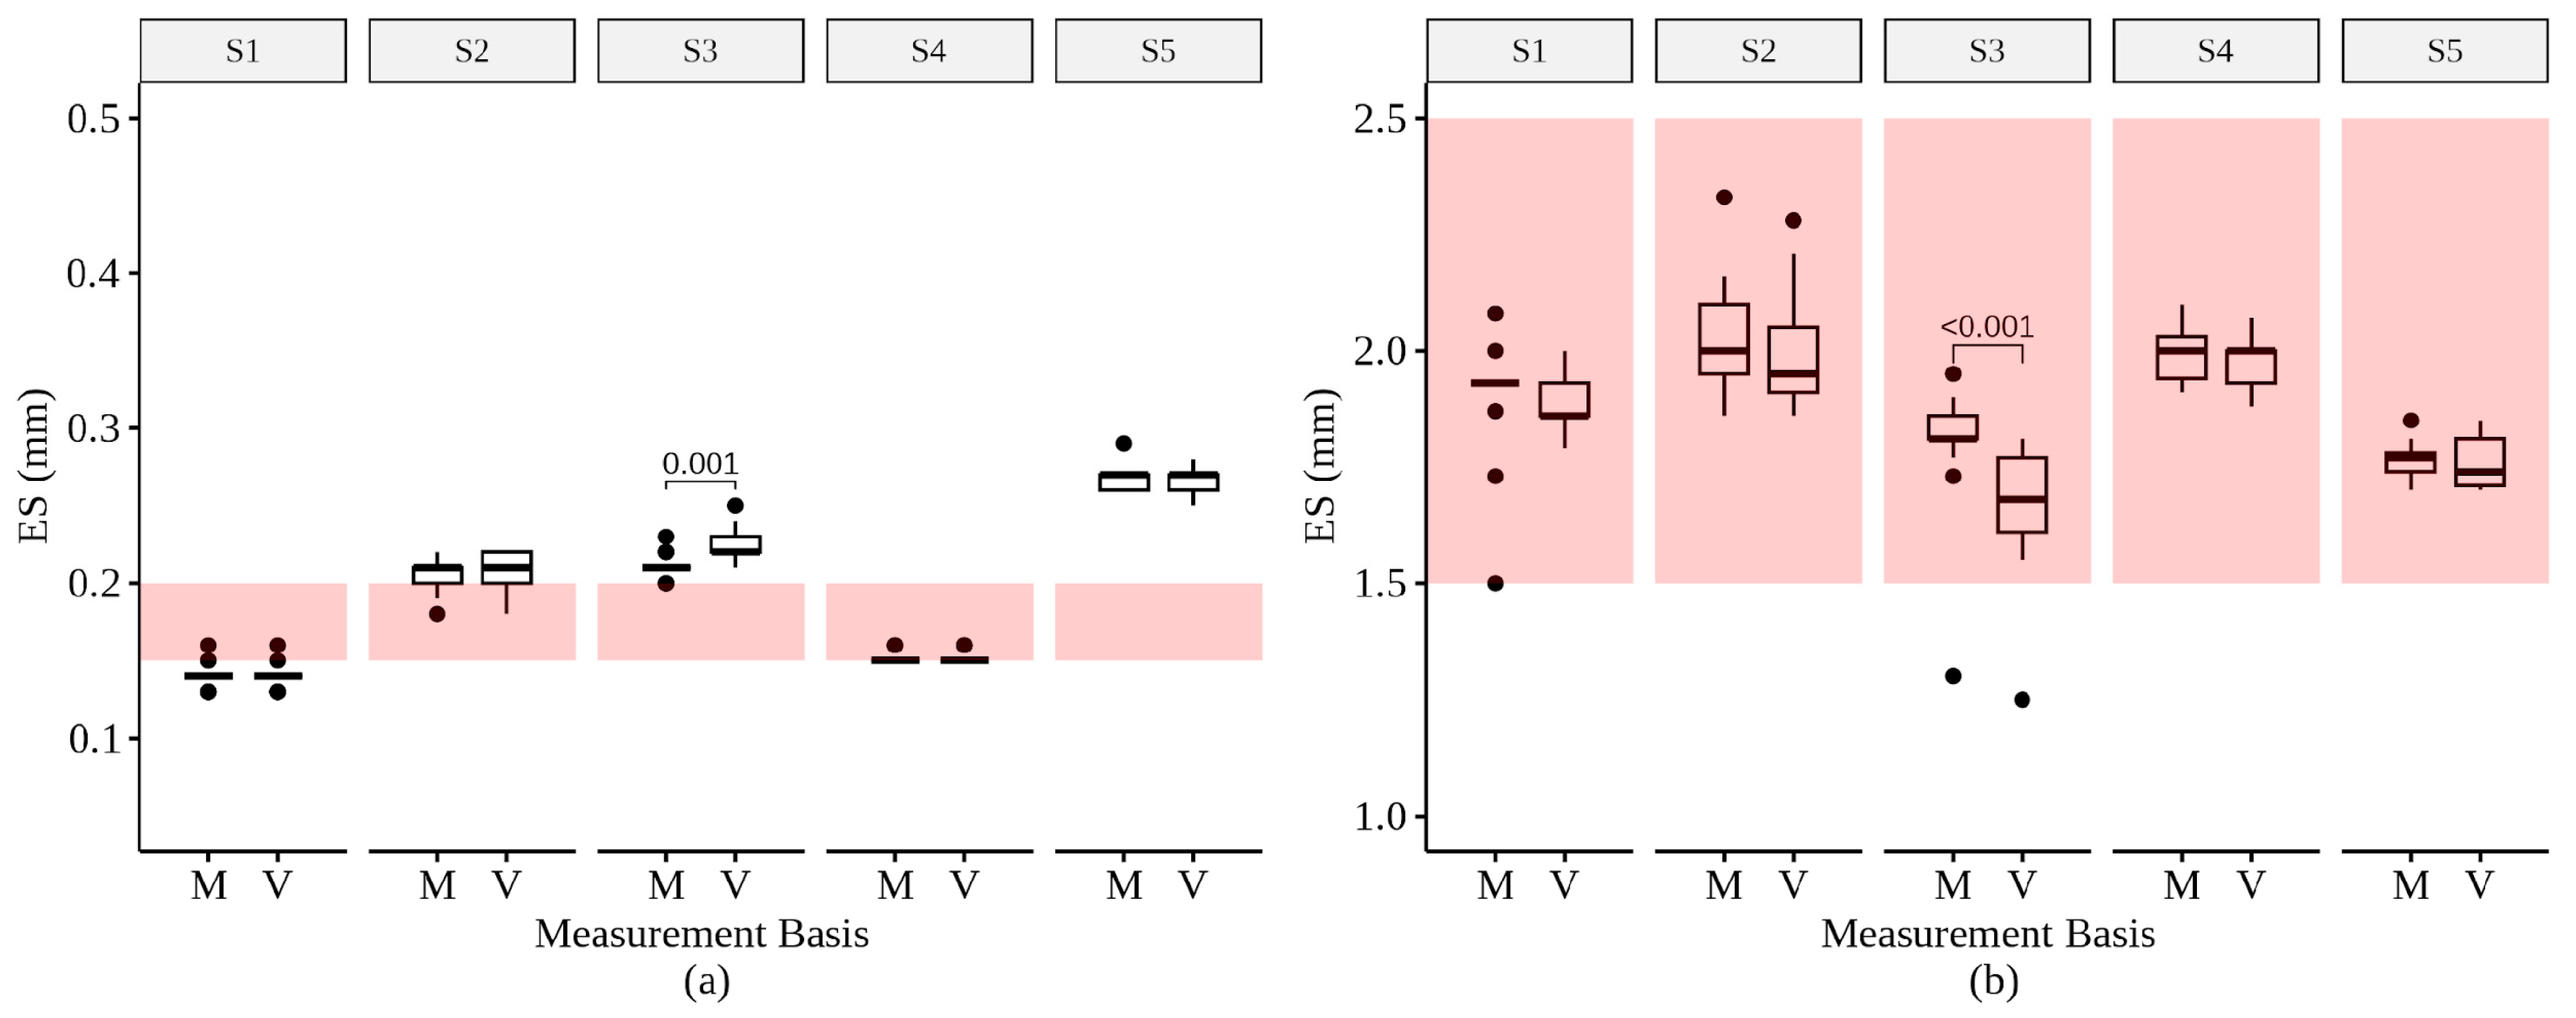
Comparing the median ES and UC values calculated using mass and volume measurements demonstrated that median ES values determined using volume-based measurements were always greater than or equal to median ES values determined using mass-based measurements (Figure 2 and Figure 3). Results suggested that using volume-based measurements generally inflated the median ES value; however, the differences in ES values calculated using volumetric measurements were not significantly different from those calculated with mass measurements (Mann–Whitney p > 0.05) for all sands except S3 (Figure 2 and Figure 3; Tables S3 and S4). ES values for S3 were significantly different when using mass versus volume measurements for the CAWST App (Mann–Whitney p = 0.018) and CAWST Graph (Mann–Whitney p = 0.018) methods, but not the CAWST PSD method (Mann–Whitney p > 0.05) (Table S3). Furthermore, the prescribed CAWST App method would reject S3 based on median ES values using volume measurements but accept S3 with mass measurements. Hence, the CAWST-prescribed methods, using volume measurements, may be more precautionary for sand with ES near the upper recommended range and UC near the lower recommended range.
Except for the S2 UC calculated using the CAWST PSD method, the median UC values determined using volume-based measurements were always less than or equal to the median UC values determined using volume-based measurements. This suggests that using volume-based measurements generally deflated the UC value for sand; however, UC values calculated using volumetric measurements were not significantly different (Mann–Whitney p > 0.05) from the UC values calculated using mass measurements for a given method using CAWST field sieves for all sands except S3 (Figure 2; Table S3). S3 was the only sand sample to yield significantly different UC results depending on whether mass or volume was used for all three CAWST methods (Mann–Whitney: CAWST PSD p = 0.012; CAWST App p = 0.018; CAWST Graph p = 0.007) (Figure 2; Table S3).
The ES and UC values obtained with mass and volume measurements using laboratory sieves and the laboratory PSD method were also compared (Figure 3; Table S4). For all samples except S3, the ES and UC values were statistically similar (Mann–Whitney p > 0.05) and yielded similar results for meeting CAWST-recommended ranges, regardless of whether sand mass or sand volume measurements were used (Figure 3; Table S4). S3 was again the only sample for which the ES and UC values determined by the Lab PSD method were significantly different depending on whether the calculations were based on sand mass versus sand volume (Mann–Whitney: ES p = 0.001; UC p < 0.001) (Figure 3; Table S4). These differences, however, did not change the fact that S3 would be rejected based on the ES value obtained with the Lab PSD method using either mass or volume measurements.

3.4. Sand Characteristic Comparisons

3.4.1. Density

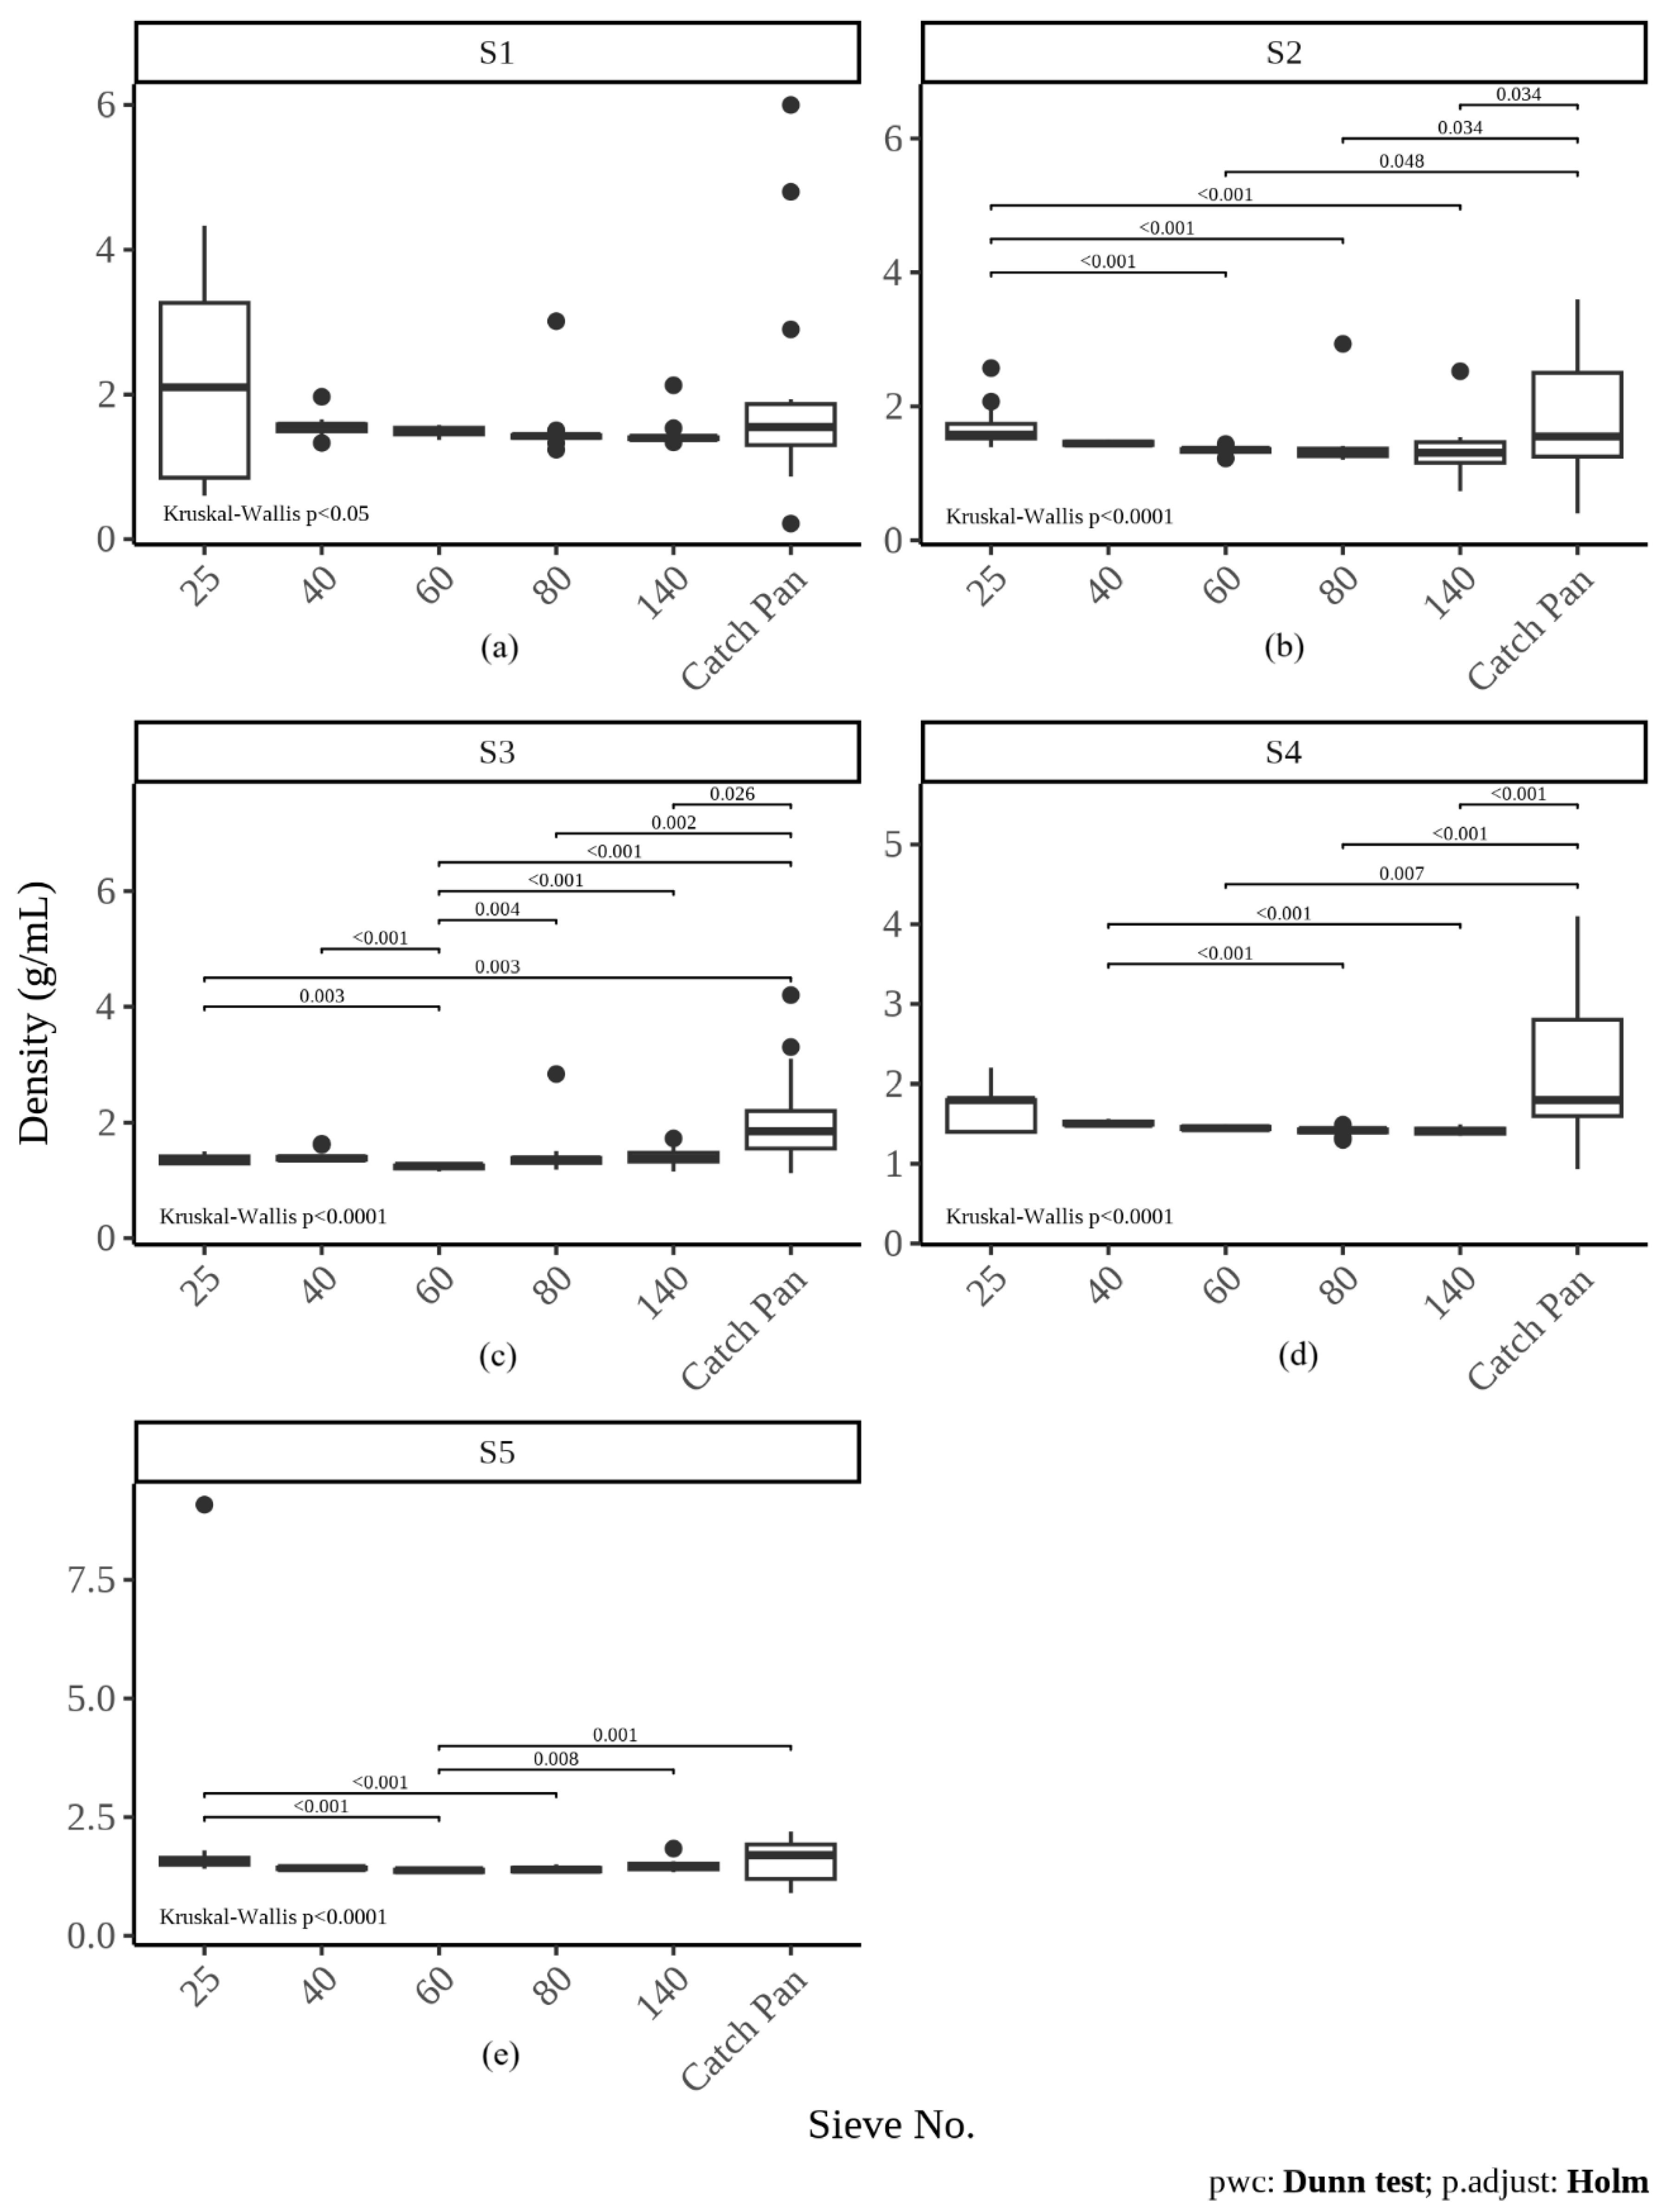
The overall densities of S2 and S3 were lower than, and statistically different from, S1, S4, and S5 (Dunn pHolm < 0.05; Table S5). S3 had the lowest overall density of the sands (Table 1; Figure S5).
The calculated densities of a single sand sample were compared across the fractions retained on each sieve (Figure 4). Notably, no significant differences were found among the densities of sand retained on each sieve for S1 only (Dunn pHolm ≥ 0.05; Table S6), but differences among densities of sand retained on each sieve were identified for all other sand samples (Dunn pHolm < 0.05; Tables S7–S10). Only S3 had a sieve (No. 60) with a density of retained sand significantly different from and lower than all other sieves (Dunn pHolm < 0.05; Figure 4c; Table S8).

3.4.2. Roundness

S2 was the least round sand sample overall, while S1 and S3 were the most round (Table 1). A Kruskal-Wallis test found that at least one sand sample had different roundness than the others (Kruskal-Wallis p = 0.003; Table S11), and post hoc Dunn tests identified that S2 and S3 had statistically different roundness from each other (Dunn pHolm = 0.002; Table S11; Figure S6).

3.4.3. Circularity

Overall, S5 was the least circular of the sand samples, while S4 was the most circular (Table 1). A Kruskal-Wallis test found that at least one sand sample had different circularity than the others (Kruskal-Wallis p < 0.001; Table S12); Dunn post hoc tests determined statistically different circularity between S1 and S2 (Dunn pHolm < 0.001), S1 and S5 (Dunn pHolm < 0.001), S2 and S3 (Dunn pHolm < 0.001), S2 and S4 (Dunn pHolm < 0.001), S3 and S4 (Dunn pHolm = 0.019), S3 and S5 (Dunn pHolm < 0.001), and S4 and S5 (Dunn pHolm < 0.001) (Figure S7; Table S12).

3.5. Prescribed Method Comparisons

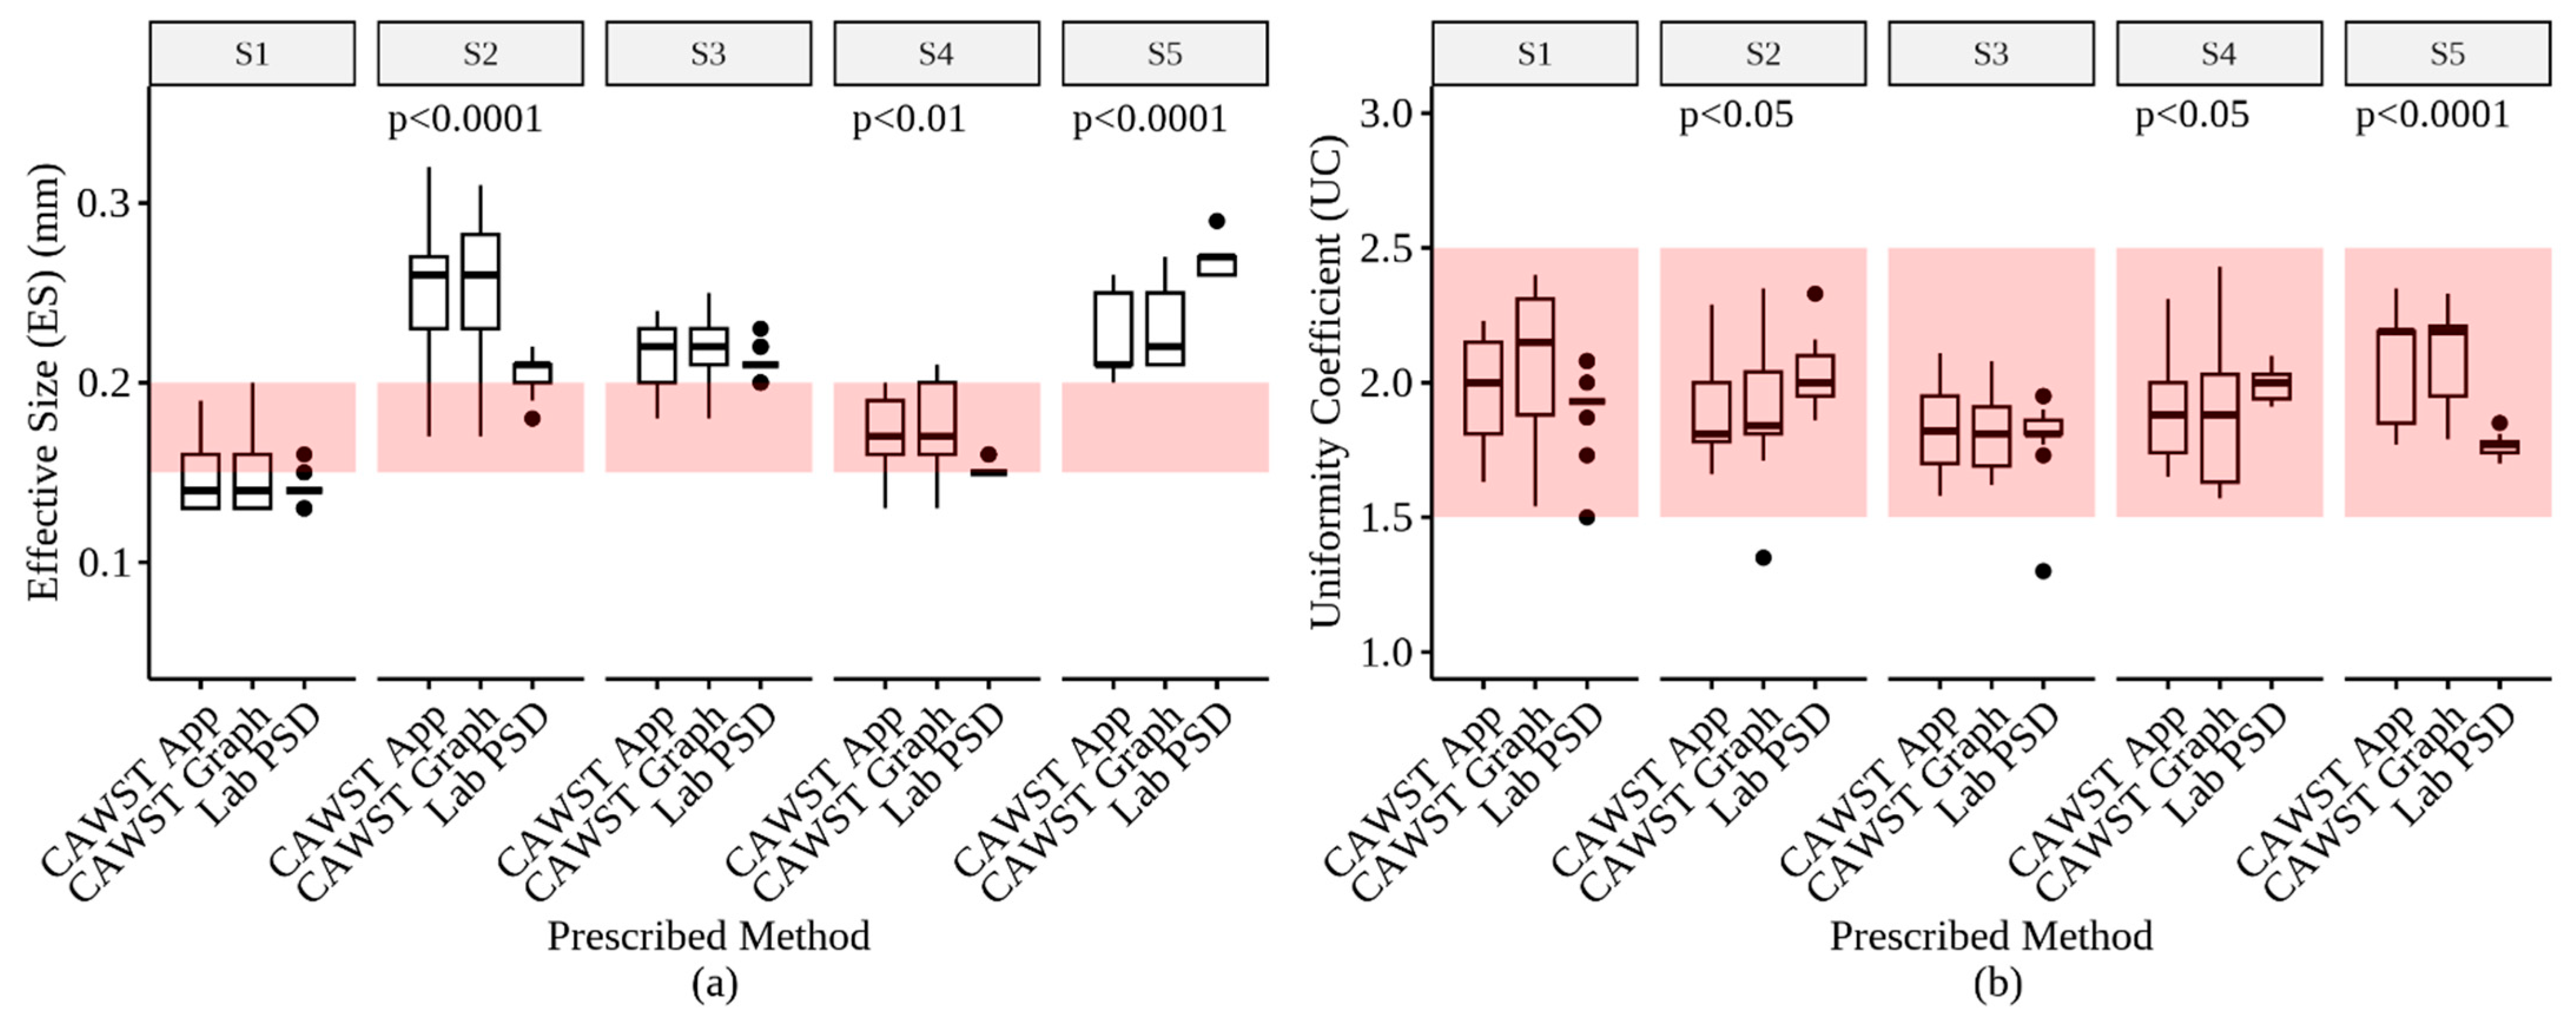
The ES and UC values obtained with the three prescribed methods (CAWST App and CAWST Graph, using volume, and the Lab PSD method, using mass) were compared (Figure 5). The median ES and UC values determined using the CAWST App method differed by 0–24% and 1–24%, respectively, from the Lab PSD method (Table 3). The median ES and UC values determined using the CAWST Graph method differed by 0–24% and 0–24%, respectively, from the Lab PSD method (Table 3). There were no cases in which differences between the CAWST App, CAWST Graph, and Lab PSD would result in differential sand selection for a BSF, although the median ES value for S4 using the Lab PSD method was 0.15, at the bottom of the CAWST-recommended range for ES values (Table 3).
The ES values obtained by these three methods were statistically different for S2, S4, and S5 (Kruskal-Wallis: p < 0.001, p = 0.001, and p < 0.001, respectively; Figure 5; Table S13). Post hoc tests determined significant differences between ES values using the CAWST App and Lab PSD for S2, S4, and S5 (Dunn pHolm < 0.001, Dunn pHolm = 0.003, Dunn pHolm < 0.001, respectively), and CAWST Graph and Lab PSD for S2, S4, and S5 (Dunn pHolm < 0.001, Dunn pHolm = 0.003, Dunn pHolm < 0.001, respectively; Table S13).
Similarly, significant differences were observed in UC values using the three prescribed methods for S2, S4, and S5 (Kruskal-Wallis: p = 0.011, p = 0.033, p < 0.001, respectively; Figure 5; Table S14). Post hoc tests determined significant differences between UC values using the CAWST App and Lab PSD for S2 and S5 (Dunn pHolm = 0.014, Dunn pHolm < 0.001, respectively), and CAWST Graph and Lab PSD for S2 and S5 (Dunn with Holm adjustment: p = 0.044, p < 0.001, respectively; Table S14). Although significant differences in UC values using the CAWST field and Lab PSD methods were observed, these differences did not affect whether the sand would be rejected or accepted for use in a BSF (Figure 5).
ES and UC values calculated using the CAWST App (with mass-based measurements), CAWST Graph (with mass-based measurements), and Lab PSD methods were also compared. Although neither of the CAWST methods is recommended for use with mass-based measurements, this analysis was performed to confirm that the significant differences observed between the prescribed CAWST field methods and the Lab PSD method were not a result of the CAWST field methods using volume-based calculations and the Lab PSD method using mass-based calculations. Significant differences across the three methods were observed in the ES values for S2, S3, S4, and S5 (Kruskal-Wallis: p < 0.001, p = 0.030, p = 0.008, and p < 0.001, respectively; Table S15) and the UC values for S1, S3, and S5 (Kruskal-Wallis: p = 0.030, p = 0.003, and p < 0.001, respectively; Table S16). The CAWST Graph (mass) and the CAWST App (mass) methods resulted in statistically similar ES and UC values for all five sand samples (Dunn pHolm > 0.05) (Tables S15 and S16). The CAWST App (mass) and Lab PSD methods resulted in statistically different ES values for S2, S3, S4, and S5 (Dunn pHolm < 0.001, Dunn pHolm = 0.029, Dunn pHolm = 0.021, and Dunn pHolm < 0.001, respectively; Table S15), and statistically different UC values for S3 and S5 (Dunn pHolm = 0.005, Dunn pHolm < 0.001, respectively; Table S16). The CAWST Graph (mass) and Lab PSD methods resulted in statistically different ES values for S2, S4, and S5 (Dunn pHolm < 0.001, Dunn pHolm = 0.021, Dunn pHolm < 0.001, respectively; Table S15), and statistically different UC values for S1, S3, and S5 (Dunn pHolm = 0.024, pHolm = 0.011, Dunn pHolm < 0.001, respectively; Table S16). These findings support the conclusion that differences between the two CAWST field methods and the Lab PSD method result from the methods themselves and not the use of mass versus volume measurements.

3.6. Filter Performance Pilot Study

A small pilot study was performed to assess how filter performance corresponds to the CAWST ES and UC range recommendations. The performance of duplicate pilot columns (Figure S8; Tables S17 and S18), measured using turbidity removal [29,30], was evaluated for 55 days, after a 30-day ripening period [1]. A detailed description of the pilot study is included in the Supplementary Materials. Findings suggest that a filtration sand with an ES and UC value within the CAWST-recommended ranges does not necessarily change filter performance (Figures S9 and S10; Tables S19 and S20). Preliminary results also suggest, however, that filter performance begins to decline as the ES value for filtration sand increases further beyond the upper (safety) limit of the recommended ES range (Figure S11). Further investigation, including filtration sands with additional ES values and filter performance metrics, should be performed before broader implications of CAWST ES and UC recommendations can be drawn.

4. Discussion

4.1. Impact of Sand Characteristics on Volume Sand Analysis

S3 was the only sand sample analyzed to have the density of sand retained on a single sieve (No. 60) significantly different from, and lower than, all other sieves (Figure 4c; Table S8). The lower density of S3 retained on sieve No. 60 meant that a larger volume of S3 would need to be retained on sieve No. 60 to attain an equivalent mass to the S3 sand retained on every other sieve, demonstrating that S3 had irregular (i.e., non-uniform) density over different grain size fractions. Mass and volume measurements of S3 may have scaled non-linearly, yielding differences in percent sand finer, and therefore, ES and UC values. This finding illustrates that using volume-based measurements, per the CAWST-prescribed methods, relies on regular sand densities for the sand retained on different sieves to yield the same results as the Lab PSD method, which does not always occur.
Non-linear scaling of mass and volume S3 measurements, caused by irregular sand densities over different grain sizes, may have been exacerbated by the majority (> 50%) of S3 being retained on a single sieve, sieve No. 60. The high fraction of S3 retained on sieve No. 60 (Figure 1), compounded with the significantly lower density of S3 retained on sieve No. 60 (Figure 4c), shifted the S3 volume-based ES values higher and further left on the x-axis of a PSD curve (Figure S2). Conversely, significant differences in the fraction of sand retained on a sieve using mass- and volume-based measurements for S1, S2, S4, and S5 may not have had as large an impact on ES and UC values because the differences did not occur within a size group composing more than half of the sample size.
Based on roundness, S1 and S3 should have yielded the smallest void ratios and best packing [20], and therefore more similar mass- and volume-based ES and UC values; however, this expected outcome was only true for S1 (Figure 2 and Figure 3), likely due to the irregular scaling in density and grain size distribution previously discussed for S3. It should be noted that all five sand samples had very similar median roundness values, ranging from 0.63 (S2) to 0.69 (S1 and S3), which may have been too narrow a range to fully assess the relationship between irregular roundness and the linear scaling of mass and volume for sand.
Sands with higher circularity, assuming circularity as a proxy for sphericity, should have higher packing density, and therefore closer mass and volume measurements [31], we did not observe this relationship to hold across the circularities measured in this study; for example, S5 did not have significantly different ES and UC measurements using mass and volume, despite having the lowest circularity. However, the overall range of median circularity in this study spanned 0.55 (S5) to 0.69 (S4), a small range from which to conclude the effect of irregular circularity on the linear scaling of mass and volume in sand.

4.2. Impact of Value Determination Method and Sieve Type on ES and UC

There are several, major differences between the prescribed CAWST methods (App & Graph) and the Lab PSD method, aside from mass and volume measurement types, which may explain the observed differences in ES and UC values discussed above. First, the CAWST methods rely on linear interpolation between data points on the PSD, while the laboratory method uses smoothed curves to best fit the data series. The sieves used and provided by CAWST are also made of flimsier walls and screens compared to laboratory sieves used in the Lab PSD method. In addition, the CAWST Graph method may differ from the CAWST App method due to human error in drawing straight lines between data points, rather than the exact linear interpolation performed using the CAWST App. While the authors attempted to minimize human error in this study, human error may generally lead to different sand characterization results, especially under field conditions. Furthermore, the CAWST sieves have a smaller diameter and use a smaller volume of sand than the lab sieves; the differences in sieve diameter, sand volume, and sand volume to diameter ratio, combined with the manual shaking of the CAWST sieves, may result in artificially high quantities of sand retained on a CAWST sieve if the grains are unable to reach the sieve mesh and pass to the next sieve in the column.

4.3. Implication of Findings for BSF Field Construction

While crushed rock is recommended for the BSF filtration sand layer, it can be inaccessible and unaffordable in remote regions [1]. Previous studies have emphasized the importance of local filter materials, including wood charcoal, silica sand, river sand, and shells [1,12,32], for maintaining low construction and repair costs [3], long-term sustainability [6], and durability [3]. Rao et al. (1981) found that filtration media (with similar size parameters) can be replaced in a filter without worsening turbidity and pathogen removal performance [33]. Alternative filtration media, however, like river sand, often have a non-uniform grain size distribution across locations, causing varying efficacy when used in a BSF [1] and introducing potential variation in ES and UC values determined in field settings.
Previous studies have identified performance differences in BSF pathogen removal and flow rate between sands with relatively small size parameter differences. For example, Tellen et al. (2010) evaluated BSF performance using a river sand with an ES of 0.3 mm (outside of the CAWST-recommended ES range) and crushed granite gravel with an ES of 0.15 mm (within the CAWST-recommended ES range) [34]. Average percent total coliform, fecal coliform, and turbidity removal was 67% lower, 67% lower, and 29% lower, respectively, when using river sand than crushed granite gravel [34]. Average effluent flow (L/min) was 56% lower when using crushed granite gravel than river sand [34]. Chan et al. (2015) found that as the ES of filtration sand in a CAWST (Version 10) BSF decreased from 0.25 mm (outside the CAWST-recommended ES range) to 0.20 mm (within the CAWST-recommend ES range), the initial flow rate (L/min) decreased by 60%, average effluent turbidity (NTU) increased by 65%, and 6 hour batch residence time percent total coliform removal increased by 18% [8]. The finding that a BSF with a lower ES had higher effluent turbidity conflicts with the results of Tellen et al. (2010) and CAWST’s BSF Technical Guidance [1,8,34]. A possible explanation is that the effluent tubing in the BSF with an ES of 0.20 mm was partially clogged [8], which may have released sand into the effluent and artificially elevated effluent turbidity readings.
Like Tellen et al. (2010) [34] and Chan et al. (2015) [8], our pilot study results showed that differences in ES affect BSF performance. The results of the pilot study in this paper (Supplementary Materials) agree with the results of Tellen et al. (2010) [34], which showed that BSFs with a lower ES had higher turbidity removal. Our pilot study, however, showed smaller differences in filter performance when the ES (Lab PSD) was within or close to (i.e., within 0.1 mm of) the CAWST-recommended range. Median percent turbidity removal varied by up to 2.1% for S1 to S4, with (Lab PSD) ES values between 0.14 mm and 0.21 mm (Table 3 and Table S19). Median percent turbidity removal of S5, with a (Lab PSD) ES value of 0.27 mm, however, was 10.8% lower than S3, the next worst-performing sand, demonstrating that filter performance differences varied more as the ES value was further from the CAWST-recommended range (Table 3 and Table S19).
Chan et al. (2015) [8] demonstrated that BSF performance can vary when the ES of filtration media differs by 0.05 mm. Importantly, in our analysis of prescribed methods, we found the ES values determined using CAWST field methods and laboratory methods differed by up to 0.06 mm (Table 3), leaving field-constructed BSFs vulnerable to unintended performance differences. Overall, these findings underscore the importance of quality control practices, including accurate and comparable sand size parameter determination methods, to achieve acceptable filter efficacy and filter run times [6].

5. Conclusions

This study compared the effects of mass- versus volume-based measurements and laboratory- versus field-based protocols on the calculated ES and UC of a sand sample. Major takeaways include the following:
  • Generally, the use of mass- or volume-based measurements does not affect the ES or UC for a given method. However, non-linear scaling of mass and volume and extreme sand size distributions can affect ES and UC parameters;
  • ES and UC values determined with the prescribed CAWST methods (App & Graph with volume-based measurements) generally differ from values determined using the Lab PSD method (using mass-based measurements). For the sands tested in this study, however, there were no cases in which these differences resulted in differential sand selection for a BSF based on the CAWST-recommended ES and UC ranges;
  • Differences between CAWST field protocols versus standard lab protocols (e.g., parameter calculation method, sieve type, linear versus smoothed (PSD) line type) may affect ES and UC values and may influence whether a size parameter falls within CAWST’s recommended ES range.
Overall, BSF implementers should be wary of filtration sands with an extreme grain size distribution, where one size range comprises more than half of a sample and the density of that size range is significantly different than the density of the rest of the sand sample. Extreme grain size distributions may result in non-linear scaling of mass and volume and, subsequently, ES and UC measurements that differ when calculations are based on mass versus volume. Future research should focus on understanding how extreme sand size distributions and irregular sand density may impact sand size parameter determination methods and filtration sand selection. Additionally, BSF implementers should develop (1) educational resources for BSF users on the risks of extreme sand size distribution when selecting BSF filtration sand and (2) new sand preparation protocols for sand with extreme size distributions and ES/UC values outside of the CAWST-recommended ranges to avoid rejecting sand sources entirely in sand-scarce environments. Furthermore, future BSF (and other sand filtration) research should always report, at least, the ES and UC of the filtration sand used, and ideally the sand PSD. Sand size characterization, which frequently goes unreported, can provide important context for understanding the study results.

Supplementary Materials

The following supporting information can be downloaded at: https://www.mdpi.com/article/10.3390/w17182706/s1, Figure S1: Five sand samples analyzed, in ascending order from S1 on the far left to S5 on the far right; Figure S2: Sieve sets used to perform sieve testing of five sand samples; Figure S3: Example Particle Size Distribution (PSD) curve created using the Lab PSD protocols and S1; Figure S4: SEM and ImageJ protocol for determining sand shape characteristics; Table S1: Mann–Whitney results for the fraction of a sample retained on a laboratory sieve using mass or volume measurements; Table S2: Whether or not ES values resulting from the determination methods evaluated fell within the recommended ES range (0.15–0.20 mm); Table S3: Mann–Whitney U test results for mass versus volume comparison of CAWST sieves; Table S4: Mann–Whitney U test results for mass versus volume comparison of laboratory sieves; Table S5: Kruskal-Wallis and Dunn post hoc test results for overall sample density; Figure S5: Plot of overall sand density and Kruskal-Wallis and Dunn post hoc statistics; Table S6: Kruskal-Wallis and Dunn post hoc test results for the S1 densities of sand retained on each sieve; Table S7: Kruskal-Wallis and Dunn post hoc test results for the S2 densities of sand retained on each sieve; Table S8: Kruskal-Wallis and Dunn post hoc test results for the S3 densities of sand retained on each sieve; Table S9: Kruskal-Wallis and Dunn post hoc test results for the S4 densities of sand retained on each sieve; Table S10: Kruskal-Wallis and Dunn post hoc test results for the S5 densities of sand retained on each sieve; Table S11: Kruskal-Wallis and Dunn post hoc test results for average grain roundness; Figure S6: Distribution of sand sample roundness measurements determined with ImageJ, and Kruskal-Wallis and Dunn post hoc results; Table S12: Kruskal-Wallis and Dunn post hoc test results for average grain circularity; Figure S7: Distribution of sand sample circularity measurements determined with ImageJ, and Kruskal-Wallis and Dunn post hoc results; Table S13: Kruskal-Wallis and Dunn post hoc test results for ES values from the three prescribed methods (CAWST App and CAWST Graph, using volume; and Lab PSD, using mass); Table S14: Kruskal-Wallis and Dunn post hoc test results for UC values from the three prescribed methods (CAWST App and CAWST Graph, using volume; and Lab PSD, using mass); Table S15: Kruskal-Wallis and Dunn post hoc test results for ES values from CAWST App, CAWST Graph, and Lab PSD methods, using mass only; Table S16: Kruskal-Wallis and Dunn post hoc test results for UC values from CAWST App, CAWST Graph, and Lab PSD methods, using mass only; Figure S8: Pilot BSF column design; Table S17: Cost breakdown for pilot BSF columns used in filter testing; Table S18: Porosity testing results for fill volume determination in pilot BSF columns; Table S19: Median percent turbidity removal flow rate, post-ripening period (after day 30), and maximum flow rate for pilot column filters.; Figure S9: Comparison of median percent turbidity removal (n = 110 per sample), post-ripening period (after day 30), for sand samples as a function of median ES meeting the CAWST-recommended ES standard; Figure S10: Plot of sample percent turbidity removal and Kruskal-Wallis and Dunn post hoc statistics, post-ripening period (after day 30); Table S20: Kruskal-Wallis and Dunn post hoc test results for sample percent turbidity removal, post-ripening period (after day 30); Figure S11: Comparison of median percent turbidity removal (n = 110 per sample), post-ripening period (after day 30), for sand samples as a function of median ES calculated from the prescribed Lab PSD method.

Author Contributions

Conceptualization, N.A., A.H. and K.J.; methodology, N.A., A.H. and K.J.; software, N.A.; formal analysis, N.A.; investigation, N.A., A.H., A.F. and S.B.; resources, K.J.; data curation, N.A.; writing—original draft preparation, N.A., A.H. and K.J.; writing—review and editing, N.A., A.H., A.F., S.B. and K.J.; visualization, N.A.; supervision, K.J.; project administration, K.J.; funding acquisition, K.J. All authors have read and agreed to the published version of the manuscript.

Funding

This research received no external funding.

Data Availability Statement

The data presented in this study are available on request from the corresponding author.

Acknowledgments

The authors thank Millie Adam, Emilie Sanmartin, Melinda Foran, and Candice Rojanschi for their technical expertise and for providing the CAWST sieves used in the study. The authors also thank Leslie O’Brien (Lehigh University Institute for Functional Materials and Devices) for capturing SEM images of sand samples, and Marcio Botto (CAWST) for reviewing the manuscript.

Conflicts of Interest

The authors declare no conflicts of interest.

Abbreviations

The following abbreviations are used in this manuscript:
CAWSTCentre for Affordable Water and Sanitation Technology
ESEffective Size
UCUniformity Coefficient
BSFBiosand Filter
POUPoint-of-Use
mL/minMilliliters per minute
d10Diameter 10
d60Diameter 60
mmMillimeter
WHOWorld Health Organization
S1Sample 1
S2Sample 2
S3Sample 3
S4Sample 4
S5Sample 5
No.Number
PSDParticle Size Distribution
ASTMAmerican Society for Testing and Materials
ISOInternational Organization for Standardization
gGram
mLMilliliter
SEMScanning Election Microscopy
PVCPolyvinyl Chloride
KOKnock-Out
VVolume
P.V.Pore Volume
ODOuter Diameter
IDInner Diameter
APHAAmerican Public Health Association

References

  1. Centre for Affordable Water and Sanitation Technology Biosand Filter for Technicians 2012. Available online: https://washresources.cawst.org/en/resources/b6be2637/biosand-filter-construction-manual (accessed on 22 December 2024).
  2. Baumgartner, J.; Murcott, S.; Ezzati, M. Reconsidering ‘Appropriate Technology’: The Effects of Operating Conditions on the Bacterial Removal Performance of Two Household Drinking-Water Filter Systems. Environ. Res. Lett. 2007, 2, 024003. [Google Scholar] [CrossRef]
  3. Tsafack, H.N.; Djoko, G.R.P.; Akwa, T.E.; Kwekap, J.W.; Wamba, F.R.; Temgoua, E. Assessment of Filtration Capacity of Different Filters Used in the West Region of Cameroon for Quality Improvement of Drinking Water. Sustain. Water Resour. Manag. 2024, 10, 159. [Google Scholar] [CrossRef]
  4. Eniola, J.O.; Sizirici, B. Assessing the Sustainability of Modified Biosand Filters Using Life Cycle Assessment, Cost and Performance Factors. Environ. Dev. Sustain. 2024. [Google Scholar] [CrossRef]
  5. Ojomo, E.; Elliott, M.; Goodyear, L.; Forson, M.; Bartram, J. Sustainability and Scale-up of Household Water Treatment and Safe Storage Practices: Enablers and Barriers to Effective Implementation. Int. J. Hyg. Environ. Health 2015, 218, 704–713. [Google Scholar] [CrossRef]
  6. Benson, M.; Noor, A.; Moreau, J.-L. Clean Water for All Building Filtration Systems in Rural Uganda. Glob. Res. Acad. Synerg. 2025, 3, 11–22. [Google Scholar]
  7. Brown, J.; Clasen, T. High Adherence Is Necessary to Realize Health Gains from Water Quality Interventions. PLoS ONE 2012, 7, e36735. [Google Scholar] [CrossRef]
  8. Chan, C.C.V.; Neufeld, K.; Cusworth, D.; Gavrilovic, S.; Ngai, T. Investigation of the Effect of Grain Size, Flow Rate and Diffuser Design on the CAWST Biosand Filter Performance. Int. J. Serv. Learn. Eng. 2015, 10, 1–23. [Google Scholar] [CrossRef]
  9. Duran Romero, D.A.; De Almeida Silva, M.C.; Chaúque, B.J.M.; D. Benetti, A. Biosand Filter as a Point-of-Use Water Treatment Technology: Influence of Turbidity on Microorganism Removal Efficiency. Water 2020, 12, 2302. [Google Scholar] [CrossRef]
  10. Freitas, B.L.S.; Terin, U.C.; Fava, N.M.N.; Maciel, P.M.F.; Garcia, L.A.T.; Medeiros, R.C.; Oliveira, M.; Fernandez-Ibañez, P.; Byrne, J.A.; Sabogal-Paz, L.P. A Critical Overview of Household Slow Sand Filters for Water Treatment. Water Res. 2022, 208, 117870. [Google Scholar] [CrossRef]
  11. Ngai, T.K.K.; Baker, D.L. Recent Advances in Household Biosand Filter Design. In Progress in Slow Sand and Alternative Biofiltration Processes; IWA Publishing: London, UK, 2014; pp. 319–330. ISBN 978-1-78040-638-1. [Google Scholar]
  12. Dwivedi, A.H.; Nidheesh, P.V. Comparison of Various Low-Cost Household Drinking Water Treatment Filters, Mechanisms and Applications: A Review. Water Air Soil Pollut. 2025, 236, 331. [Google Scholar] [CrossRef]
  13. Jenkins, M.W.; Tiwari, S.K.; Darby, J. Bacterial, Viral and Turbidity Removal by Intermittent Slow Sand Filtration for Household Use in Developing Countries: Experimental Investigation and Modeling. Water Res. 2011, 45, 6227–6239. [Google Scholar] [CrossRef] [PubMed]
  14. Loo, S.-L.; Fane, A.G.; Krantz, W.B.; Lim, T.-T. Emergency Water Supply: A Review of Potential Technologies and Selection Criteria. Water Res. 2012, 46, 3125–3151. [Google Scholar] [CrossRef] [PubMed]
  15. Centre for Affordable Water and Sanitation Technology Sand Grain Size Analysis (Sieve Analysis) 2012. Available online: https://washresources.cawst.org/en/resources/ea0b7613/biosand-filter-sand-grain-size-analysis-instructions?queryId=75d9b0305d9f57540c6cc781b5b1cb32 (accessed on 22 December 2024).
  16. Ji, X.; Zhao, C.; Lv, Y.; Yang, J.; Li, B. Influence of Particle Size of River Sand on the Decontamination Process in the Slow Sand Filter Treatment of Micro-Polluted Water. Water 2022, 14, 100. [Google Scholar] [CrossRef]
  17. Chaúque, B.J.M.; Issufo, M.; Benitez, G.B.; Cossa, V.C.; Chaúque, L.G.H.; Stauber, C.E.; Benetti, A.D.; Rott, M.B. Why Do Low-Cost Point-of-Use Water Treatment Technologies Succeed or Fail in Combating Waterborne Diseases in the Field? A Systematic Review. J. Environ. Chem. Eng. 2023, 11, 110575. [Google Scholar] [CrossRef]
  18. Brown, J.; Proum, S.; Sobsey, M.D. Sustained Use of a Household-Scale Water Filtration Device in Rural Cambodia. J. Water Health 2009, 7, 404–412. [Google Scholar] [CrossRef]
  19. Cho, G.-C.; Dodds, J.; Santamarina, J.C. Particle Shape Effects on Packing Density, Stiffness, and Strength: Natural and Crushed Sands. J. Geotech. Geoenviron. Eng. 2006, 132, 591–602. [Google Scholar] [CrossRef]
  20. Cubrinovski, M.; Ishihara, K. Maximum and Minimum Void Ratio Characteristics of Sands. Soils Found. 2002, 42, 65–78. [Google Scholar] [CrossRef]
  21. Guan, W.; Qi, Q.; Zhang, Z.; Nan, S. Effect of Sand Particle Size on Microstructure and Mechanical Properties of Gypsum-Cemented Similar Materials. Materials 2020, 13, 765. [Google Scholar] [CrossRef]
  22. Maeda, K.; Miura, K. Relative Density Dependency of Mechanical Properties of Sands. Soils Found. 1999, 39, 69–79. [Google Scholar] [CrossRef]
  23. Polakowski, C.; Sochan, A.; Bieganowski, A.; Ryzak, M.; Földényi, R.; Tóth, J. Influence of the Sand Particle Shape on Particle Size Distribution Measured by Laser Diffraction Method. Int. Agrophysics 2014, 28, 195–200. [Google Scholar] [CrossRef]
  24. ASTM C136/C136M-19; ASTM International Standard Test Method for Sieve Analysis of Fine and Coarse Aggregates. ASTM: West Conshohocken, PA, USA, 2019. [CrossRef]
  25. ASTM D6913-04; ASTM International Standard Test Methods for Particle-Size Distribution (Gradation) of Soils Using Sieve Analysis. ASTM: West Conshohocken, PA, USA, 2004. [CrossRef]
  26. ISO 11277:2020; ISO Soil Quality—Determination of Particle Size Distribution in Mineral Soil Material—Method by Sieving and Sedimentation. ISO: Geneva, Switzerland, 2020.
  27. Ferreira, T.; Rasband, W. ImageJ User Guide. Available online: https://imagej.net/ij/docs/guide/ (accessed on 22 December 2024).
  28. Li, L.; Iskander, M. Evaluation of Roundness Parameters in Use for Sand. J. Geotech. Geoenviron. Eng. 2021, 147, 04021081. [Google Scholar] [CrossRef]
  29. Napotnik, J.A.; Baker, D.; Jellison, K.L. Effect of Sand Bed Depth and Medium Age on Escherichia Coli and Turbidity Removal in Biosand Filters. Environ. Sci. Technol. 2017, 51, 3402–3409. [Google Scholar] [CrossRef]
  30. World Health Organization (Ed.) Guidelines for Drinking-Water Quality; Fourth Edition Incorporating the First and Second Addenda; World Health Organization: Geneva, Switzerland, 2022; ISBN 978-92-4-004506-4. [Google Scholar]
  31. Blott, S.J.; Pye, K. Particle Shape: A Review and New Methods of Characterization and Classification. Sedimentology 2008, 55, 31–63. [Google Scholar] [CrossRef]
  32. Rahmadyanti, E.; Palupi, A.E. Rainwater Treatment with Bio-Slow Sand Filtration for Sustainable Water Supply. J. Ecol. Eng. 2025, 26, 190–200. [Google Scholar] [CrossRef]
  33. Rao, D.R.J. Evolving High Rate Filter and Use of Crushed Stone as Filter Media. J. Inst. Eng. 1981, 61, 92–96. [Google Scholar]
  34. Tellen, V.; Nkeng, G.; Dentel, S. Improved Filtration Technology for Pathogen Reduction in Rural Water Supplies. Water 2010, 2, 285–306. [Google Scholar] [CrossRef]
  35. Centre for Affordable Water and Sanitation Technology Wash That Sand. Available online: https://washresources.cawst.org/en/resources/06a575a3/wash-that-sand (accessed on 22 December 2024).
  36. APHA 2130 TURBIDITY; Standard Methods for the Examination of Water and Waste Water. American Public Health Association, American Water Works Association, Water Environment Federation: Washington, DC, USA, 2012.
  37. Fogel, D.; Isaac-Renton, J.; Guasparini, R.; Moorehead, W.; Ongerth, J. Removing Giardia and Cryptosporidium by Slow Sand Filtration. J.-Am. Water Work. Assoc. 1993, 85, 77–84. [Google Scholar] [CrossRef]
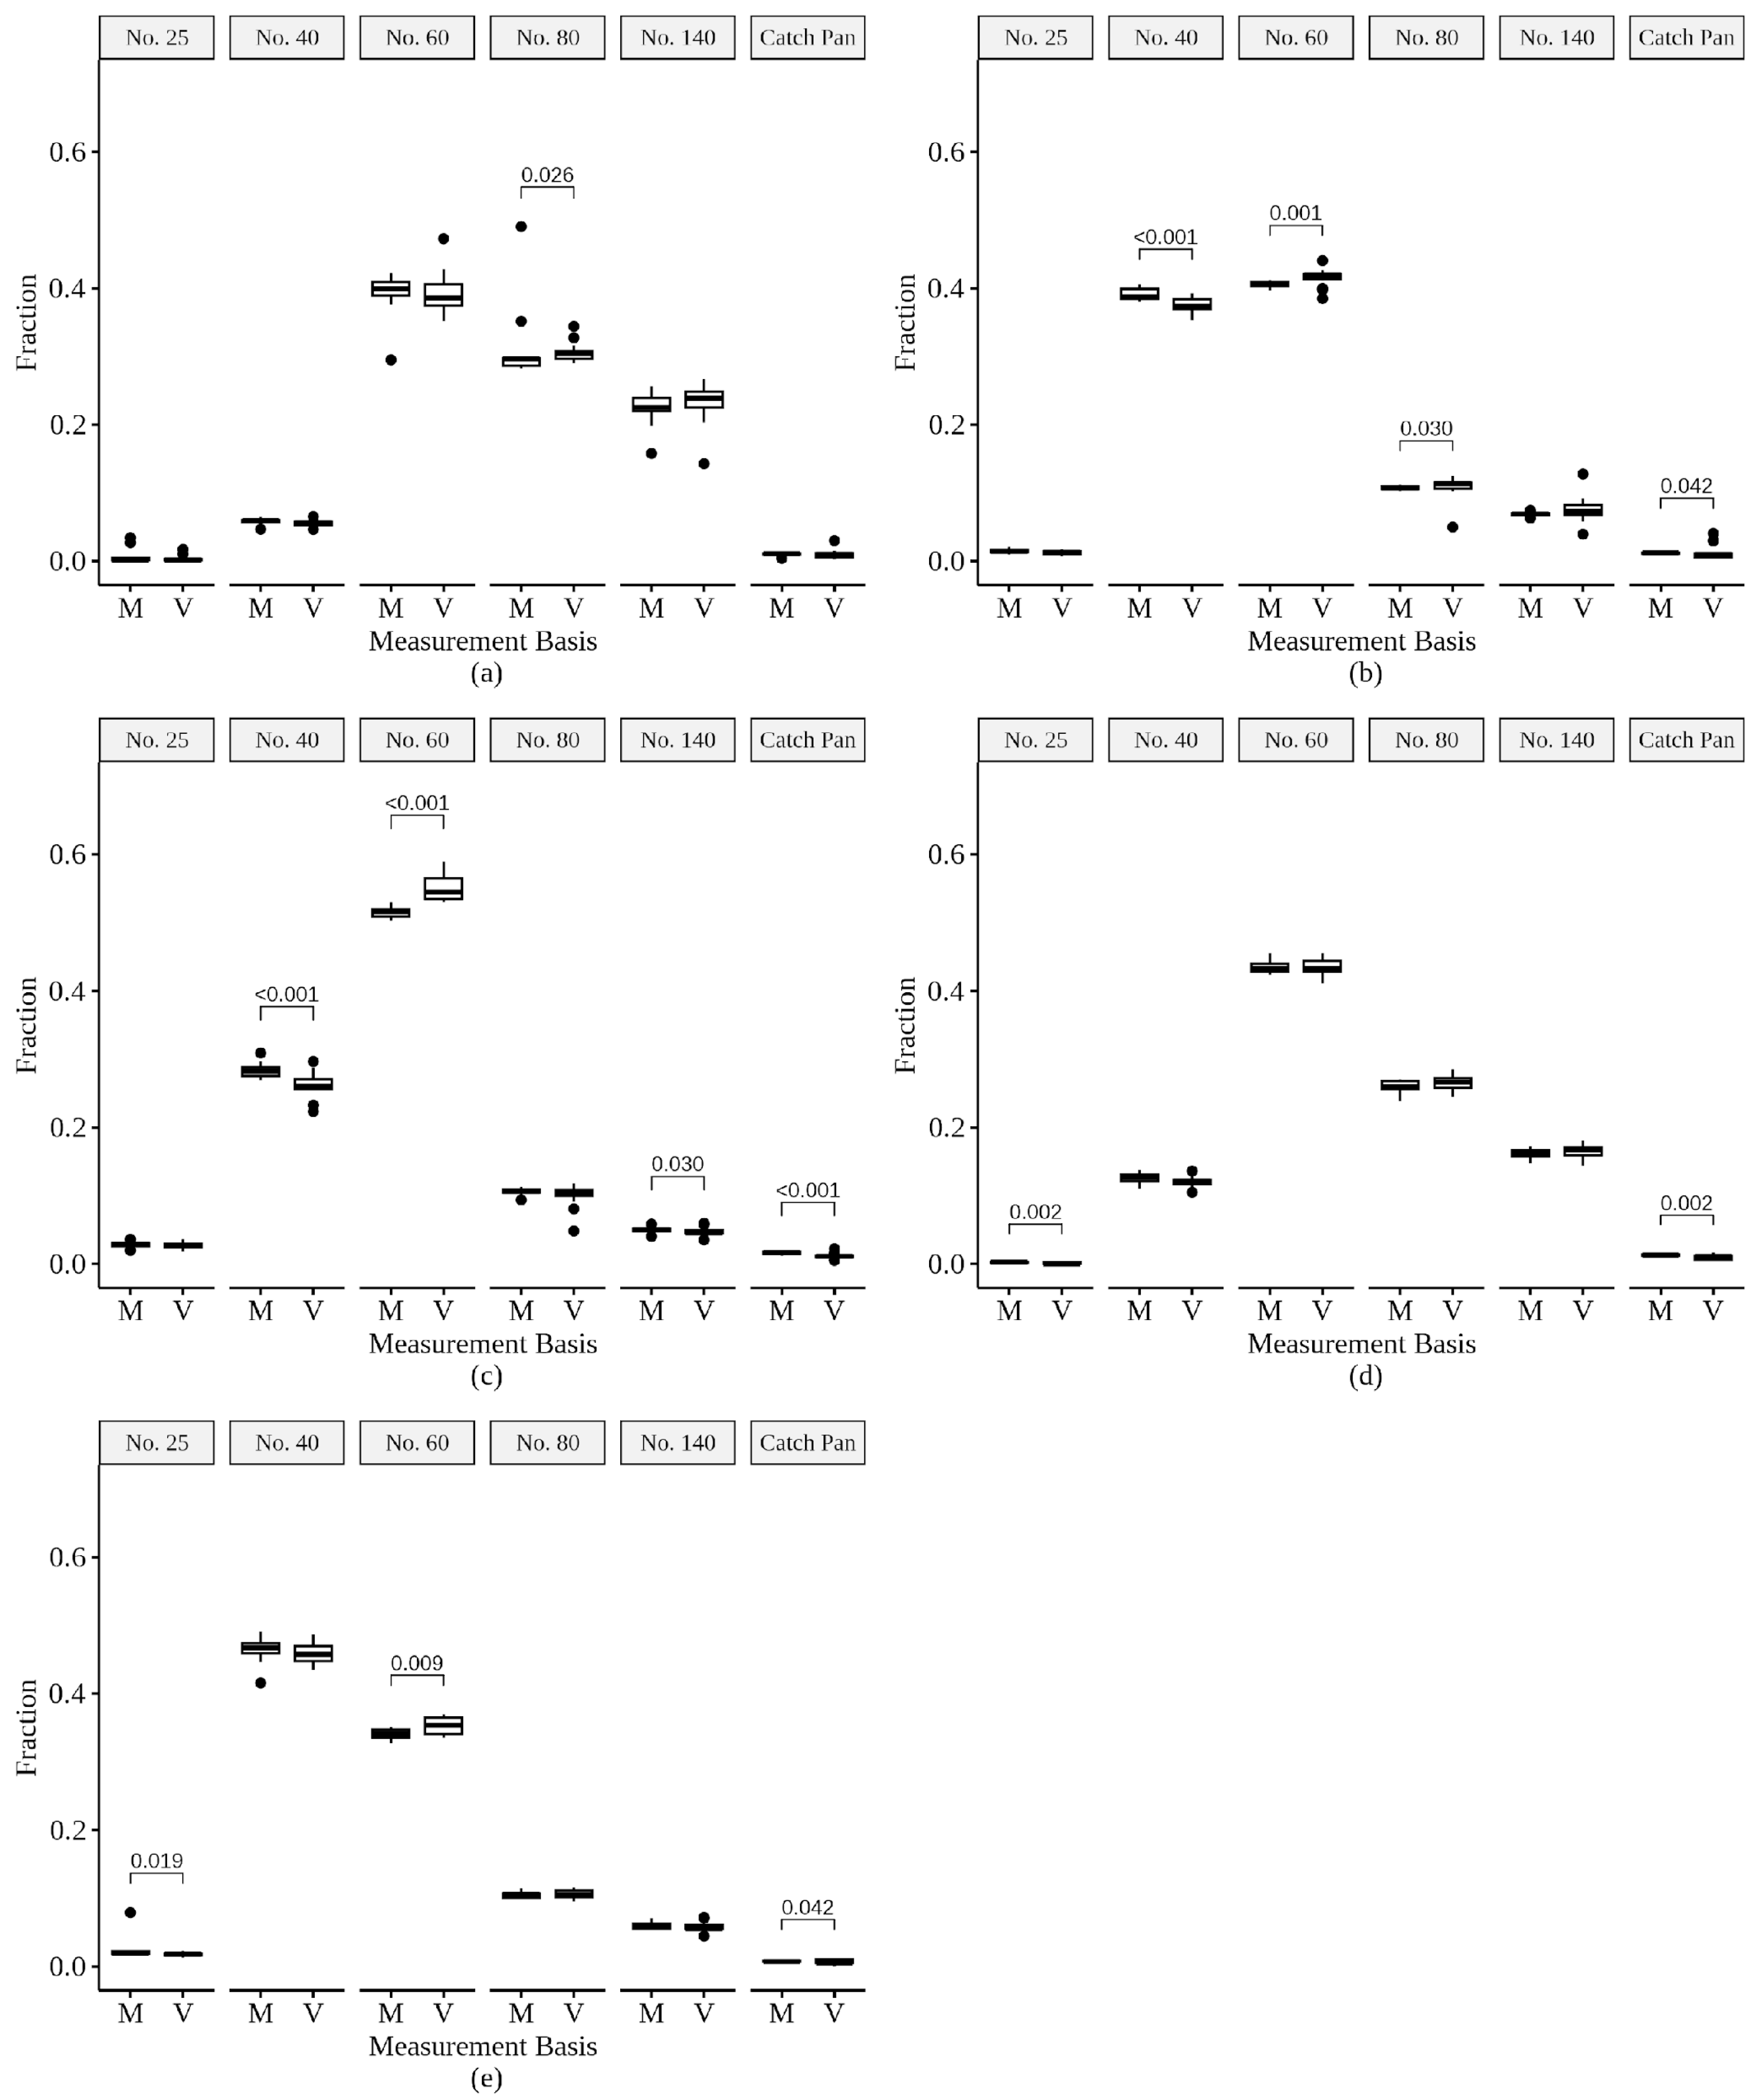
Figure 1. Mann–Whitney results and the fraction of a sample retained on a laboratory sieve using sand mass (M) or sand volume (V) measurements for (a) S1; (b) S2; (c) S3; (d) S4; and (e) S5. The numbers above brackets indicate the Mann–Whitney p-values for statistically different comparisons.
Water 17 02706 g001
Figure 2. Boxplots for (a) effective size (ES) using CAWST PSD (n = 17); (b) uniformity coefficient (UC) using CAWST PSD (n = 17); (c) ES using CAWST App (n = 17); (d) UC using CAWST App (n = 17); and (e) ES using CAWST Graph (n = 17); and (f) UC using CAWST Graph (n = 17) based on sand mass (M) versus sand volume (V) measurements. Red highlights represent the suggested ES and UC ranges by CAWST. Numbers above brackets indicate the Mann–Whitney p-values for statistically different comparisons.
Water 17 02706 g002
Figure 3. (a) Effective size (ES) (n = 17) and (b) uniformity coefficient (UC) (n = 17) boxplots determined using laboratory sieves and the Lab PSD method based on sand mass (M) versus sand volume (V) measurements. Red highlights represent the suggested ES and UC ranges by CAWST. Numbers above brackets indicate the Mann–Whitney p-values for statistically different comparisons.
Water 17 02706 g003
Figure 4. Densities of the sand samples retained on each sieve for (a) S1; (b) S2; (c) S3; (d) S4; and (e) S5. Boxplots were determined using laboratory sieves, and densities were calculated using the mass and volume retained on each sieve after the sieving process. Numbers above brackets indicate Holm-adjusted, post hoc Dunn Test values for statistically different comparisons.
Water 17 02706 g004
Figure 5. Comparison of effective size (ES) values (n = 17; (a)) and uniformity coefficient (UC) values (n = 17; (b)) for the three prescribed methods. Red highlights represent the suggested ES and UC ranges by CAWST. Kruskal-Wallis p-values are shown for ES and UC values that significantly differ across the three prescribed methods for a sand sample.
Water 17 02706 g005
Table 1. Descriptions and sand characterization parameters for analyzed sands. “Med.” represents median values, “s.d.” represents standard deviation of values; and “n” represents sample size. Median effective size (ES) and uniformity coefficient (UC) values in bold font indicate that the CAWST-recommended ES and UC ranges were met, respectively.
SandSand Characterization Parameter 1Notes
Effective Size (ES)Uniformity Coefficient (UC)Overall Density 2 (mg/L)Roundness (Unitless)Circularity (Unitless)
S1Med. = 0.14
s.d. = 0.01
n = 17
Med. = 1.93
s.d. = 0.14
n = 17
Med. = 1.47
s.d. = 0.12
n = 17
Med. = 0.70
s.d. = 0.14
n = 159
Med. = 0.68
s.d. = 0.08
n = 159
S2Med. = 0.21
s.d. = 0.01
n = 17
Med. = 2.00
s.d. = 0.11
n = 17
Med. = 1.42
s.d. = 0.04
n = 17
Med. = 0.65
s.d. = 0.17
n = 225
Med. = 0.57
s.d. = 0.11
n = 225
Small, dead insects and shell fragments observed in sample
S3Med. = 0.21
s.d. = 0.01
n = 17
Med. = 1.81
s.d. = 0.14
n = 17
Med. = 1.34
s.d. = 0.04
n = 17
Med. = 0.70
s.d. = 0.15
n = 720
Med. = 0.65
s.d. = 0.14
n = 720
S4Med. = 0.15
s.d. = 0.00
n = 17
Med. = 2.00
s.d. = 0.06
n = 17
Med. = 1.51
s.d. = 0.29
n = 17
Med. = 0.68
s.d. = 0.15
n = 150
Med. = 0.69
s.d. = 0.08
n = 150
Recovered from deconstructed BSFs
S5Med. = 0.27
s.d. = 0.01
n = 17
Med. = 1.77
s.d. = 0.04
n = 17
Med. = 1.50
s.d. = 0.04
n = 17
Med. = 0.67
s.d. = 0.14
n = 187
Med. = 0.55
s.d. = 0.09
n = 187
Notes: 1 Sand characterization parameters were determined using the Lab Particle Size Distribution (PSD) method in this study after washing. 2 Overall density was determined using laboratory sieves, with densities calculated using the sum of masses retained on each sieve (after the sieving process) divided by the starting volume of the sand (before the sieving process).
Table 2. Effective size (ES) and uniformity coefficient (UC) determination methods for mass- and volume-based measurements.
CharacteristicMethod
CAWST PSDPrescribed Methods
CAWST GraphCAWST AppLab PSD (Control Method)
Recommender (Prescriber)N/ACAWSTCAWSTGenerally accepted laboratory method
Recommended Measurement BasisN/AVolumeVolumeMass
Effective Size (ES) (and d60) value determination methodA PSD graph where sieve mesh size versus percent sand finer was fit with a smooth curve using a computer program (e.g., Microsoft Excel).A reusable, hand-drawn graph (provided by CAWST and included with the hand-held sieve package) where sieve mesh size versus percent sand finer were connected linearly. In this study, each ES and d60 were calculated as the average of four users’ hand-drawn results.Automatically calculated with a mobile app created by CAWST in which one input is entered for each sieve in CAWST’s sieve column. Each input is the cumulative volume (mL) of sand retained on that sieve (i.e., the sum of the volume retained on that sieve and all sieves with a larger mesh).A PSD graph where sieve mesh size versus percent sand finer was fit with a smooth curve using a computer program (e.g., Microsoft Excel).
Uniformity coefficient (UC) value determination methodUC = d60/ESUC = d60/ESAutomatically calculated with a mobile app created by CAWST.UC = d60/ES
Sieve typeCAWST hand-heldCAWST hand-heldCAWST hand-heldLaboratory-grade
Table 3. Effective size (ES) and uniformity coefficient (UC) values determined using the prescribed methods. for analyzed sands. “Med.” represents median values, “s.d.” represents standard deviation of values, and “n” represents sample size. Median ES and UC values in bold font indicate that the CAWST-recommended ES and UC ranges were met, respectively.
SandEffective Size (ES) (mm)Uniformity Coefficient (UC)
CAWST AppCAWST GraphLab PSDCAWST AppCAWST GraphLab PSD
S1Med. = 0.14
s.d. = 0.02
n = 17
Med. = 0.14
s.d. = 0.03
n = 17
Med. = 0.14
s.d. = 0.01
n = 17
Med. = 2.00
s.d. = 0.22
n = 17
Med. = 2.15
s.d. = 0.30
n = 17
Med. = 1.93
s.d. = 0.14
n = 17
S2Med. = 0.26
s.d. = 0.04
n = 17
Med. = 0.26
s.d. = 0.05
n = 17
Med. = 0.21
s.d. = 0.01
n = 17
Med. = 1.81
s.d. = 0.18
n = 17
Med. = 1.84
s.d. = 0.23
n = 17
Med. = 2.00
s.d. = 0.11
n = 17
S3Med. = 0.22
s.d. = 0.02
n = 17
Med. = 0.22
s.d. = 0.02
n = 17
Med. = 0.21
s.d. = 0.01
n = 17
Med. = 1.82
s.d. = 0.16
n = 17
Med. = 1.81
s.d. = 0.13
n = 17
Med. = 1.81
s.d. = 0.14
n = 17
S4Med. = 0.17
s.d. = 0.02
n = 17
Med. = 0.17
s.d. = 0.02
n = 17
Med. = 0.15
s.d. = 0.00
n = 17
Med. = 1.88
s.d. = 0.17
n = 17
Med. = 1.88
s.d. = 0.27
n = 17
Med. = 2.00
s.d. = 0.06
n = 17
S5Med. = 0.21
s.d. = 0.02
n = 17
Med. = 0.22
s.d. = 0.02
n = 17
Med. = 0.27
s.d. = 0.01
n = 17
Med. = 2.19
s.d. = 0.18
n = 17
Med. = 2.19
s.d. = 0.18
n = 17
Med. = 1.77
s.d. = 0.04
n = 17
Disclaimer/Publisher’s Note: The statements, opinions and data contained in all publications are solely those of the individual author(s) and contributor(s) and not of MDPI and/or the editor(s). MDPI and/or the editor(s) disclaim responsibility for any injury to people or property resulting from any ideas, methods, instructions or products referred to in the content.