Article

Extreme Short-Duration Rainfall and Urban Flood Hazard: Case Studies of Convective Events in Warsaw and Zamość, Poland

by
Bartłomiej Pietras
1,2,* and
Robert Pyrc
2
1
Institute of Biology and Earth Science, University of the National Education Commission, 2 Podchorazych St., 30-084 Krakow, Poland
2
Institute of Meteorology and Water Management—National Research Institute, Department in Krakow, 14 Piotr Borowy St., 30-215 Krakow, Poland
*
Author to whom correspondence should be addressed.
Water 2025, 17(18), 2671; https://doi.org/10.3390/w17182671
Submission received: 20 July 2025 / Revised: 30 August 2025 / Accepted: 4 September 2025 / Published: 9 September 2025

Abstract

This study investigates two extreme convective rainfall events that struck Poland in August 2024, affecting Warsaw (Okęcie) on 19 August and Zamość on 21 August. The aim is to evaluate the meteorological background, intensity, and spatial characteristics of these short-duration storms. We used high-resolution meteorological observations, radar imagery, and satellite data provided by the Institute of Meteorology and Water Management (IMGW-PIB). The storms were analyzed using temporal rainfall profiles, Chomicz α index classification, and comparison with World Meteorological Organization (WMO) thresholds for extreme precipitation. Both events exceeded national and international criteria for torrential rainfall. In Zamość, over 88.3 mm of rain fell within one hour, and 131.3 mm within three hours—ranking this episode among the most intense short-duration rainfall events in the region. Convective organization patterns, including multicellular clustering and convective training, were identified as key factors enhancing rainfall intensity. The results demonstrate the diagnostic value of combining national indices with global benchmarks in rainfall assessment. These findings support further integration of convection-permitting models and real-time nowcasting into urban hydrometeorological warning systems.

1. Introduction

Extreme precipitation events, particularly short-duration convective rainfall, have been increasing in frequency and severity across Central Europe. This intensification is closely linked to anthropogenic climate change and the amplification of the hydrological cycle [1,2]. In urbanized and semi-urban areas, the combination of sealed surfaces and inadequate drainage systems exacerbates the impact of such events, leading to frequent flash flooding.
In Poland, there is growing evidence of an increase in localized torrential rainfall events [3,4]. These events are frequently associated with high atmospheric instability, weak deep-layer flow, and moderate vertical wind shear—conditions that promote slow-moving or clustered convective systems with enhanced rainfall efficiency. Understanding such mesoscale dynamics is essential for risk-informed spatial planning and the design of resilient infrastructure. Similar mechanisms involving slow-moving convective systems and weak synoptic forcing have also been identified in other regions, such as northeastern Brazil, where urban areas face comparable flash flood risks [5,6]. This study presents two recent and impactful cases from August 2024 to illustrate the variability, mechanisms, and hydrological implications of convective extremes in an urban context.
Numerous studies have confirmed the increasing frequency and severity of extreme precipitation events in Europe, attributed largely to anthropogenic climate change. The intensification of the hydrological cycle due to a warmer atmosphere, which increases moisture availability and results in more intense rainfall events, has been emphasized in previous studies [1,7].
Recent studies have documented a significant rise in extreme rainfall events in Poland. An increasing frequency of daily extremes above 30 mm in multiple regions since the 1980s has been observed [4]. Similarly, Wypych et al. [8] highlighted a growing contribution of convective precipitation in the Polish Carpathians, linked to mesoscale circulation anomalies. Kundzewicz et al. [9] linked such trends with increased flood risks and damages. Local convective storms, especially during summer, have become a growing concern for infrastructure resilience and spatial planning [10,11].
Studies focusing on mesoscale convective systems (MCSs) indicate that their presence in Central Europe often leads to rapid water accumulation and flash flooding [12,13]. In urban areas, land-use changes, sealed surfaces, and limited infiltration capacity significantly increase vulnerability to such phenomena [14,15,16].
Remote sensing and radar precipitation data have been increasingly used to monitor and analyze storm dynamics [17]. Integrating satellite data, local measurements, and terrain models improves the spatial resolution of rainfall analysis and supports adaptive risk management [18].
Recent international research provides strong evidence that hourly precipitation extremes are intensifying more rapidly than anticipated. The rate of increase in short-term rainfall intensity has been shown to exceed thermodynamic expectations [19]. Other studies confirm that global warming substantially increases the likelihood of extreme rainfall [20,21]. High-resolution climate models project significantly heavier summer downpours [22], while increased convective hazards in Europe are linked to atmospheric circulation patterns [23]. Similarly, convection-permitting models simulate stronger temporal loading and peak intensities of rainfall, especially under future warming scenarios in northern and western Europe [24].
Despite increasing interest in urban flash flood risk, three research gaps remain. First, few studies systematically document convective rainfall extremes in Central-Eastern Europe using both national and international classification systems. Second, detailed event-scale analyses combining radar, station, and model data are still rare. Third, there is limited use of the Chomicz α index in the English-language literature, despite its relevance in Polish hydrometeorology. This study addresses these gaps by examining two high-impact convective events from August 2024 using multi-source observational and simulated data.
The aim is to evaluate the spatial and temporal characteristics of short-duration rainfall extremes in urban areas and to assess their classification using both the Chomicz α index and WMO thresholds. We also explore how convective organization (e.g., multicell systems, training) influences rainfall intensity.
The following sections present the data and methods (Section 2), results of synoptic and rainfall analysis (Section 3 and Section 4), discussion including implications and comparisons (Section 5), and conclusions with recommendations (Section 6).

2. Materials and Methods

2.1. Data Sources

This study employed high-resolution meteorological datasets provided by the Institute of Meteorology and Water Management—National Research Institute (IMGW-PIB). These included synoptic station observations, automatic rain gauge data with 10 min and 1 min resolution (Warsaw-Okęcie and Zamość) (Figure 1), numerical weather prediction output from the ALARO model configured for the Polish domain, and over 1000 radar reflectivity images from the national POLRAD network. Dual-polarization C-band radar data from Legionowo (near Warsaw) and Rzeszów (southeastern Poland) were used to assess convective structures and precipitation intensity. Surface synoptic charts and national-scale meteorological maps also originated from IMGW-PIB.
Satellite-based convective diagnostics were supported by the Rapidly Developing Thunderstorms (RDT) product, derived from MSG satellite data and processed with the NWC-SAF Geo 2018.1 software package. This object-oriented nowcasting tool identifies and tracks intense convective cloud systems, providing information on storm evolution, motion vectors, cloud top cooling, and vertical structure. The product enabled enhanced monitoring of rapidly developing convective cells during both analyzed events (Table 1)

2.2. Rainfall Classification

Rainfall intensity in this study was assessed using the Chomicz rainfall efficiency index (α)—a metric widely used in Polish hydrometeorology to evaluate the severity of short-duration convective precipitation [25]. The Chomicz α index is a standard tool in Polish hydrometeorological assessments of short-duration rainfall efficiency. While less common internationally, it provides a practical, event-based classification system. To ensure international relevance, WMO and FFGS thresholds were also applied for comparison. This index integrates total rainfall amount (in mm) and its duration (in minutes), offering a practical tool for identifying torrential rainfall events.
The α index is calculated according to the following formula [25]:
α = h/√t
(where h is precipitation in mm, and t is duration in minutes). When α exceeds 5.66 mm/min, the rainfall is classified as torrential.
The calculation involves three steps:
  • Measurement of precipitation using instruments such as rain gauges or pluviographs.
  • Determination of event duration in minutes.
  • Application of the formula to obtain the efficiency index.
This approach allows for an objective classification of high-intensity rainfall episodes and was used consistently across all analyzed cases in this study.
Table 2 summarizes the classification thresholds, indicating corresponding 10 min and hourly rainfall intensities along with associated hydrological risk levels.
Although not widely applied in international literature, the α index offers a practical benchmark in local assessments and was complemented in this study with internationally recognized criteria, such as the following:
The WMO threshold for very heavy rainfall (>50 mm/h) and extreme rainfall (>80 mm/h) [26].
The Flash Flood Guidance System (FFGS) short-duration thresholds (e.g., >20–30 mm/h) [27].
To enable direct comparison between events of differing durations and dynamics, all precipitation data were resampled to 10 min intervals. Rainfall intensities were then assessed within standardized 10 min and 60 min time windows. This normalization facilitates duration-independent evaluation of rainfall severity. The Chomicz α index inherently accounts for temporal scaling through its formulation (mm/min), and was complemented by international benchmarks such as the WMO (>50 mm/h, >80 mm/h) and FFGS thresholds for short-term rainfall intensity.

2.3. Radar and Numerical Model Analysis

Radar data from the POLRAD network were analyzed at 5 min intervals and 1 km spatial resolution to track storm structure, intensity, and vertical extent. Composite reflectivity fields were examined to identify cloud-top features (e.g., overshooting tops), storm cell organization, and possible back-building behavior.
The classification of storm morphology followed mesoscale convective system (MCS) typologies proposed by Doswell et al. [28] and Surowiecki and Taszarek [29]. Reflectivity alignment, propagation mode, and regeneration patterns were used to distinguish between linear multicells and training convective systems.
To assess synoptic and mesoscale conditions, high-resolution outputs from the ALARO numerical weather prediction model were used to derive key thermodynamic parameters, including Convective Available Potential Energy (CAPE), Precipitable Water (PWAT), and vertical lapse rates. These parameters were further validated using satellite imagery and upper-air sounding observations.
Wind, evaporation, and soil moisture were not explicitly modeled, given the short duration of the events and focus on atmospheric drivers rather than runoff simulation. Radar reflectivity data were spatially interpolated (bilinear method, 2 km radius) to align with station locations, and resampled to match the temporal resolution of gauge observations (1 min and 10 min).

3. Results

The following synoptic and mesoscale overview is based on the authors’ expert meteorological analysis of sounding data, surface charts, satellite imagery, and numerical model outputs.
The synoptic conditions on 19 and 21 August 2024 were highly conducive to the development of mesoscale convective systems (MCS) over central and eastern Poland. Both events formed under weakly forced large-scale patterns, with high moisture content and thermodynamic instability as key ingredients. Developing Thunderstorms (RDT) product revealed minimum values reaching approximately −63 °C, indicative of vigorous vertical development and deep convection. Such temperatures correspond to cloud tops exceeding 15–16 km in altitude, consistent with the presence of overshooting tops and intense updrafts.

3.1. Synoptic and Thermodynamic Conditions—Warsaw (19 August 2024)

On 19 August, a wavering frontal zone (characteristic of a weakly undulating cold front) extended over southern Poland, embedded within a shallow surface low centered near the Carpathian region (Figure 2). This setup was associated with weak synoptic-scale forcing but notable mesoscale features. Near-surface convergence developed from western Mazovia to Podlasie, enhanced by warm and moist subtropical advection, with surface dew points locally exceeding 18–20 °C.
In the mid-troposphere, a weak trough at 500 hPa provided additional lift. Satellite imagery revealed strong vertical development of convective clouds. Convective Available Potential Energy (CAPE) reached 2000–2500 J/kg, while vertical wind shear in the 0–6 km layer ranged from approximately 10 to 15 m/s (20–30 knots). These values represent weak to moderate shear conditions—sufficient to support the organization of multicellular convection but not favorable for sustained supercell development. Such shear magnitudes, combined with high moisture content and instability, facilitated clustered storm structures with the potential for convective training.
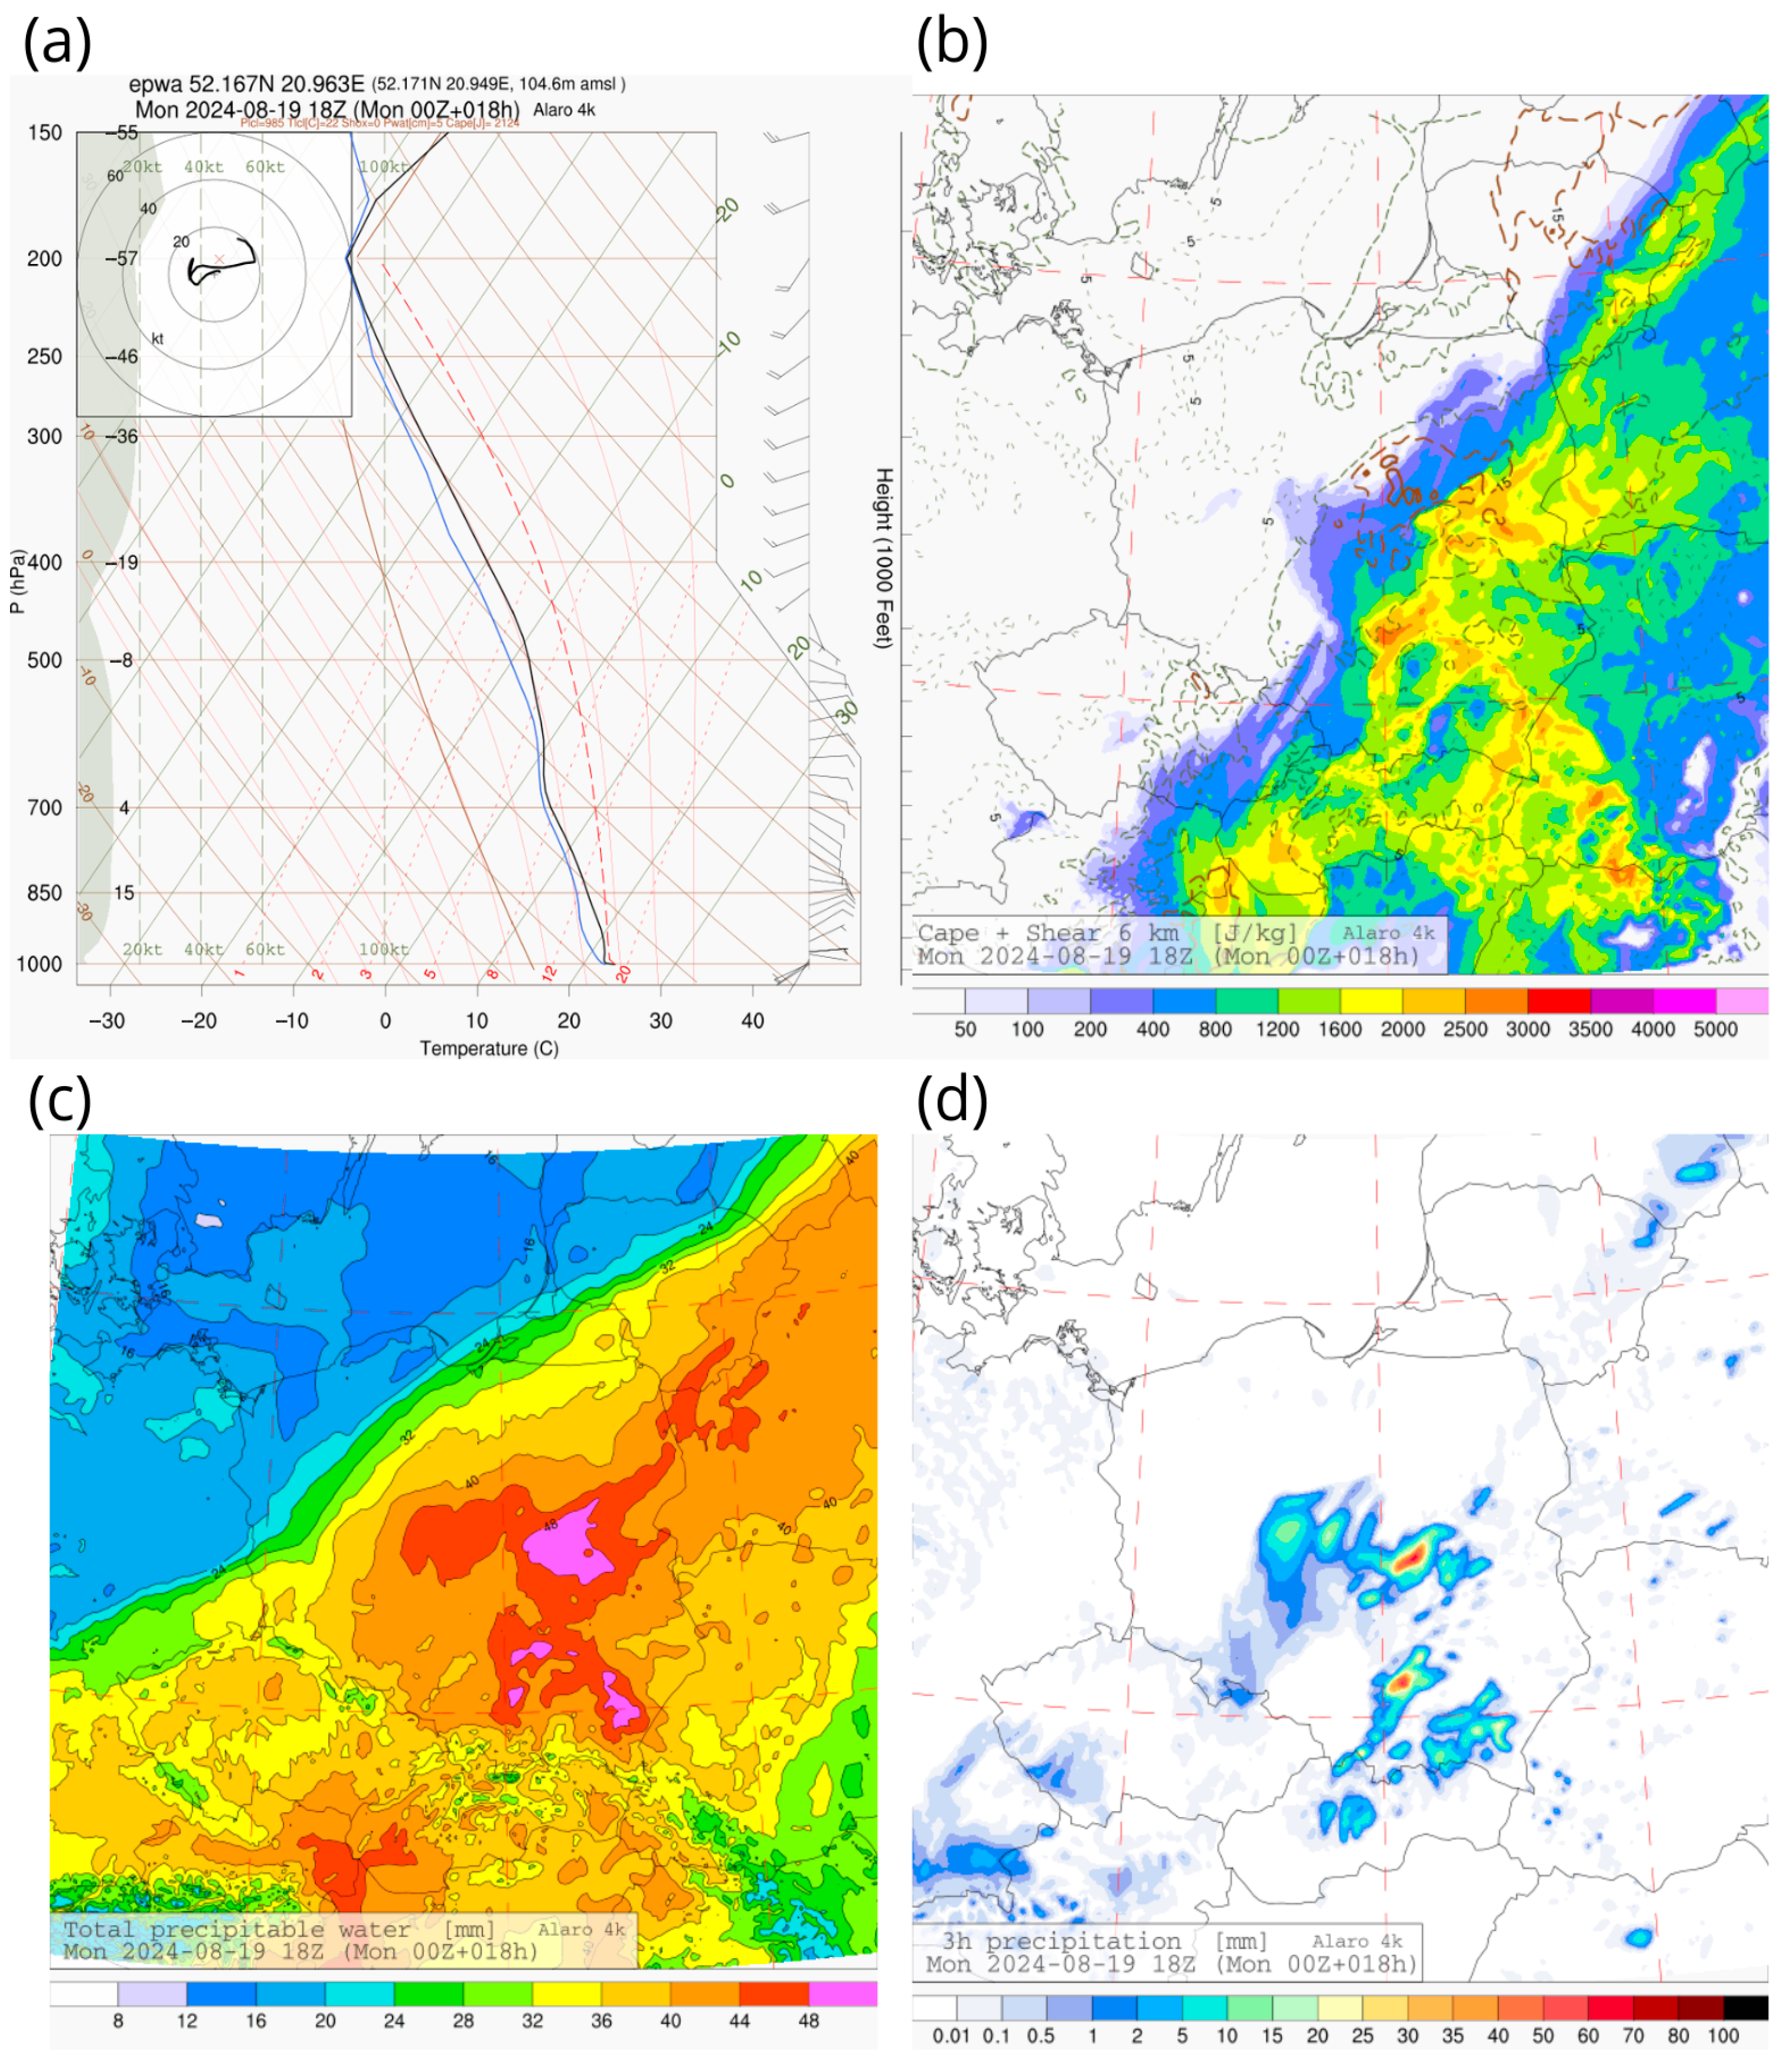
Outputs from the high-resolution ALARO 4 km model indicated a strongly moist environment over central Poland.
Total Precipitable Water (TPW) locally exceeded 40 mm—among the highest values in Europe on that day—enhancing precipitation efficiency. The simulated 3 h accumulated precipitation (15:00–18:00 UTC) revealed a spatially confined but intense rainfall core near Warsaw (Figure 3). The ALARO 4 km model successfully captured the spatial extent and intensity of the most significant precipitation core over central Poland, demonstrating strong skill in simulating convective potential under weak to moderate synoptic forcing. However, a temporal offset of approximately three hours was observed, with the forecast placing the peak precipitation between 15:00 and 18:00 UTC, while radar and gauge observations confirmed that the convective outbreak occurred around 12:00 UTC. Such timing discrepancies—though not uncommon in high-resolution convection-permitting models—reflect the challenges in accurately simulating convective initiation, particularly under diffuse frontal structures and limited dynamic lifting, even when spatial accuracy remains high. This timing discrepancy is consistent with known limitations in convective-permitting models, especially under weakly forced synoptic conditions. Errors in convective initiation are common due to sensitivity to boundary-layer processes and the inherent chaos in mesoscale systems.
Additionally, the forecast aerological diagram for Warsaw-Okęcie (EPWA), valid for 18 UTC, depicted a moist tropospheric profile throughout the column, confirming the presence of deep-layer instability and humidity. The moderate 0–6 km shear environment allowed for the development of clustered multicell storms, which were consistent with radar observations showing repeated redevelopment of slow-moving convective cells over the Warsaw area.
Furthermore, elevated values of the mixing ratio to lapse rate index (850–500 hPa), exceeding 13 g/kg per 100 m, supported sustained vertical development. Based on radar and model diagnostics, the event likely represented a short-lived, marginal mesoscale convective system (MCS) in the sense of Maddox [28], characterized by clustered multicellular convection and high precipitation efficiency over a mesoscale area.

3.2. Precipitation Intensity and Radar Diagnostics—Warsaw (19 August 2024)

A convective storm affected the Warsaw region in central Poland during the early afternoon of 19 August 2024 (Figure 4). The highest daily precipitation total was recorded at the Pruszków station—located approximately 10 km southwest of central Warsaw—where 81.5 mm of rain was measured. The peak 10 min rainfall intensity was observed at the Warsaw-Okęcie station, reaching 21.3 mm. According to the Chomicz classification, this corresponds to an α index of 9.2, identifying the event as a second-degree torrential rainfall (B2) equivalent to ~128 mm/h, well above the WMO threshold for extreme rainfall).
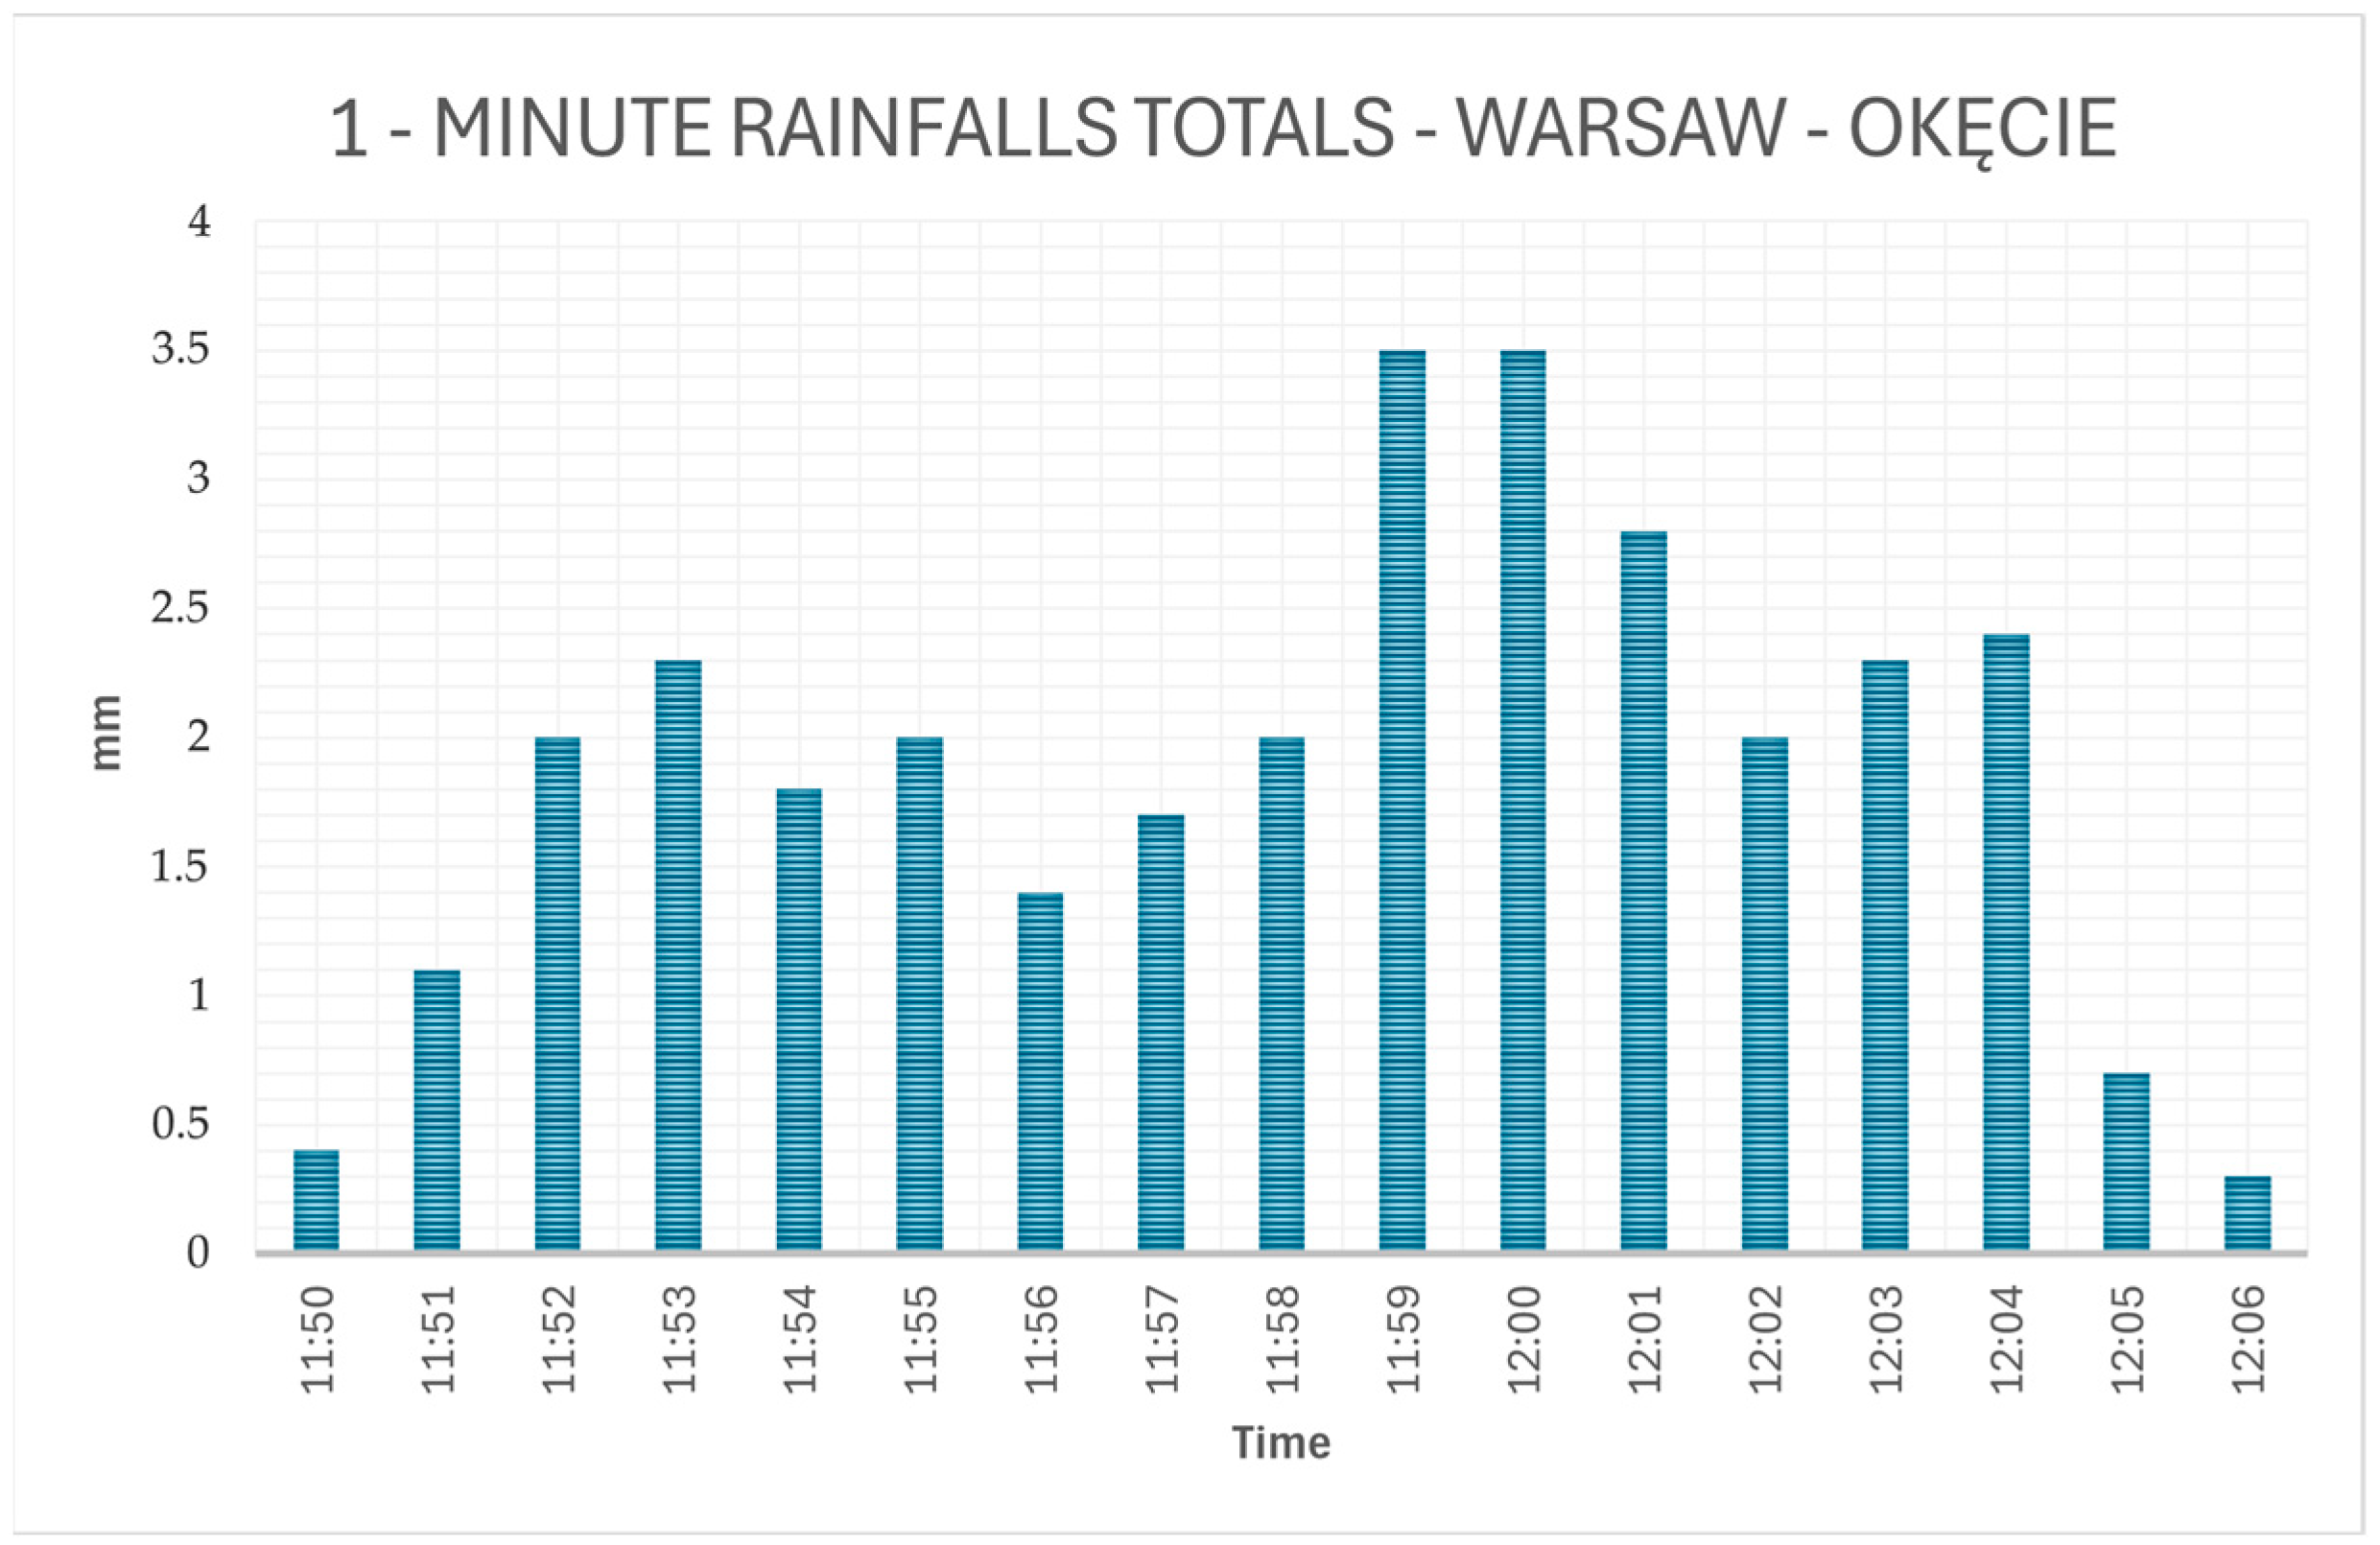
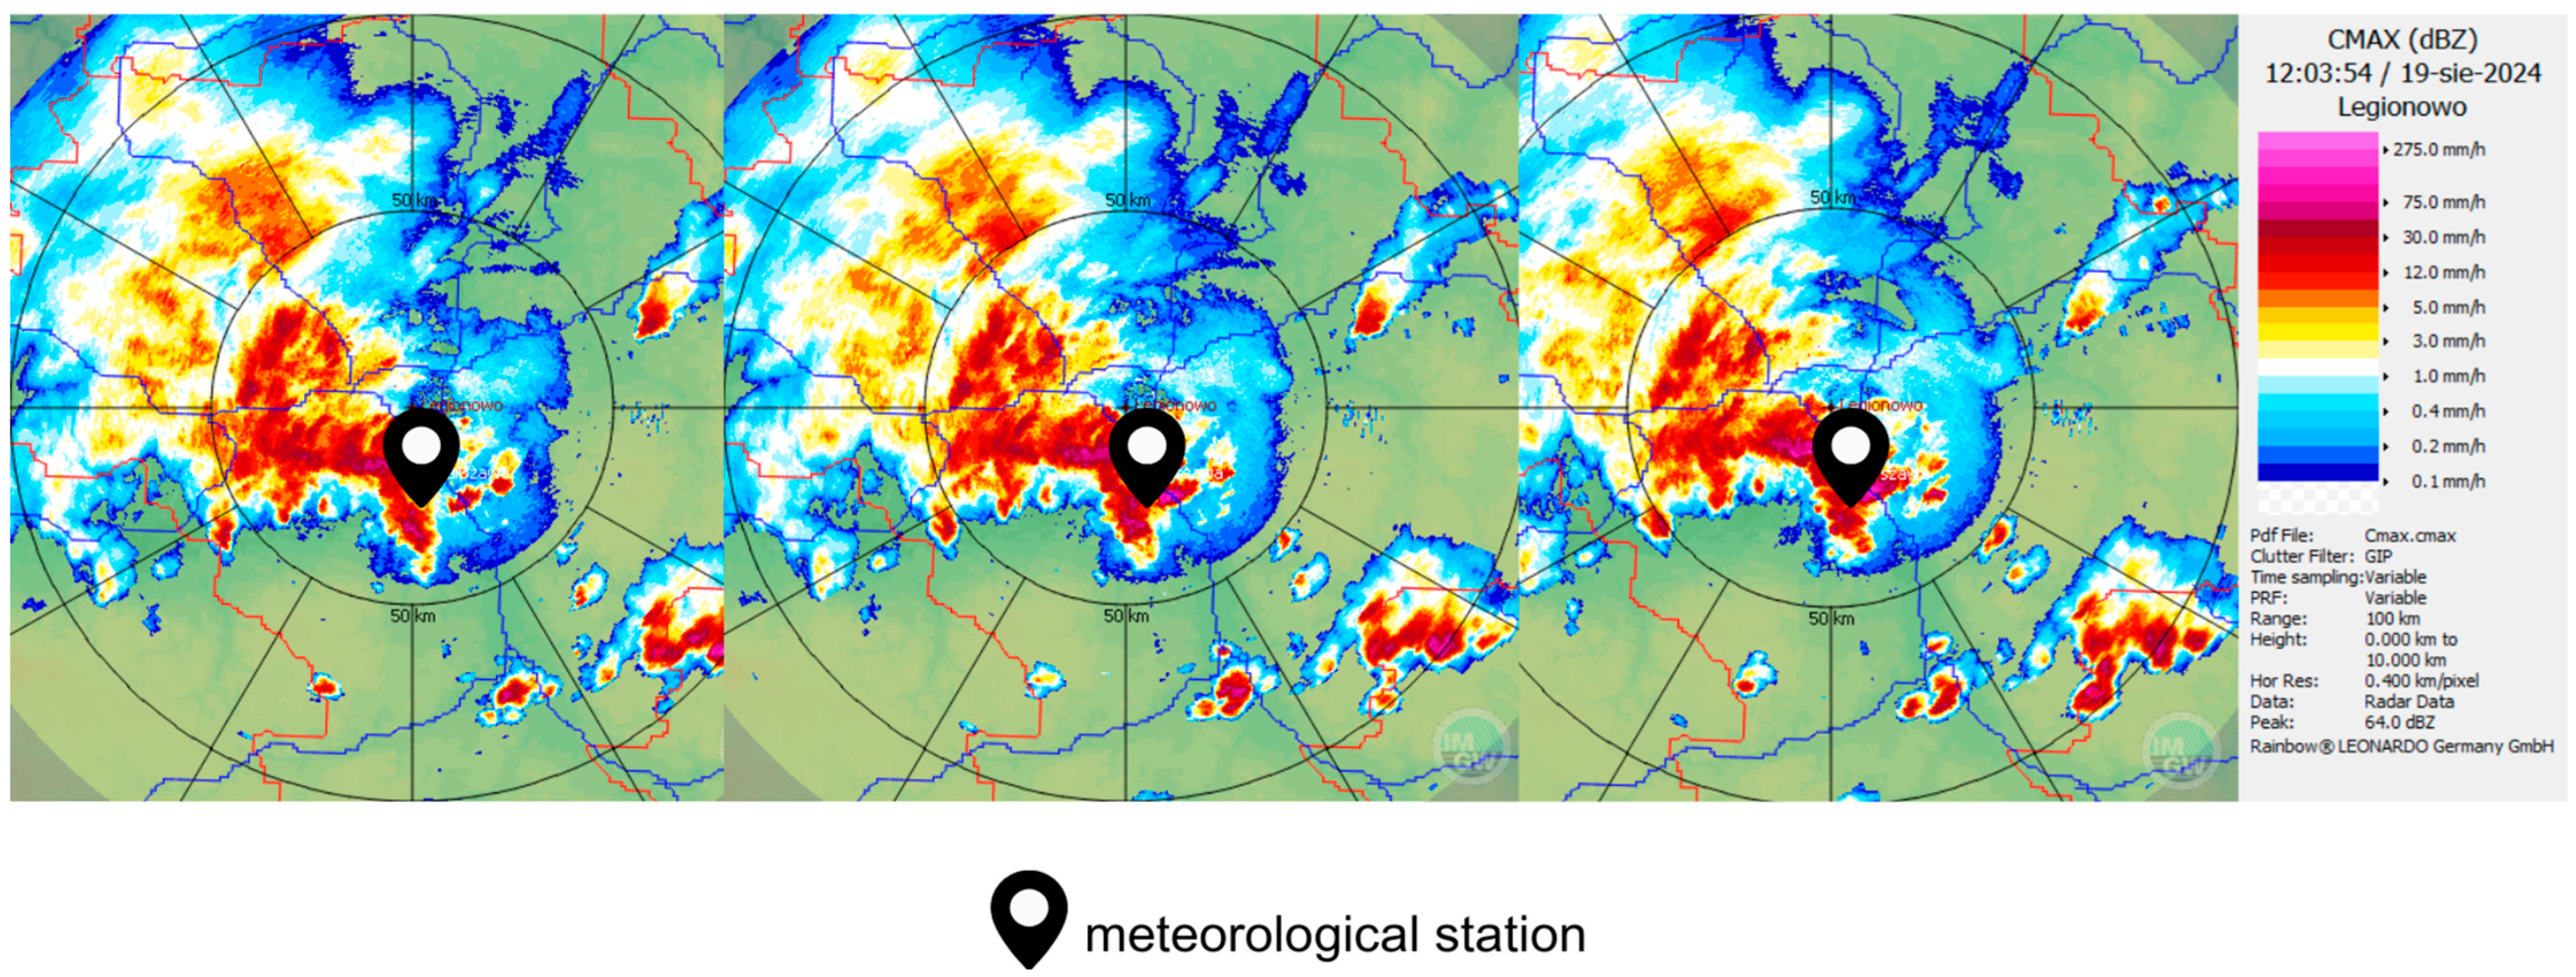
Around 13:55 local time (11:55 UTC), a rapidly intensifying multicellular convective system impacted the western districts of Warsaw. At the Warsaw-Okęcie station, 31.8 mm of rainfall was recorded in approximately 20 min (Figure 5). This corresponds to a first-degree torrential rainfall (α = 8.1) in the Chomicz classification. The spatial proximity of high-intensity rainfall cores suggests a localized but highly efficient precipitation process, typical of slow-moving convective clusters.
Radar and satellite data indicated cloud tops exceeding 16 km, with signs of overshooting tops, suggesting intense vertical motion. The combination of strong convective updrafts and urban land cover—characterized by sealed surfaces—contributed to rapid surface runoff and localized flash flooding in the affected areas.
High-resolution 1 min data from Warsaw-Okęcie revealed peak intensities of 3.5 mm/min at 11:59–12:00 UTC. The most intense 17 min window yielded a total of 32 mm, with sustained rainfall rates above 1 mm/min. For this interval, the α index was 8.2, confirming the classification as second-degree torrential rainfall (~120 mm/h, crossing the extreme threshold per WMO).

3.3. Synoptic and Thermodynamic Conditions—Zamość (21 August 2024)

On 21 August, southeastern Poland experienced intense convective activity associated with a shallow, thermally modified surface low embedded within a weak pressure trough. The region remained under the influence of a quasi-stationary, weak-gradient pressure field, shaped as a mesoscale trough (or col) extending meridionally (Figure 6). Additionally, a cold front progressing eastward across the country was preceded by a well-defined convergence line, which likely played a key role in initiating convective development over the Lublin and Roztocze regions. This mesoscale configuration, coupled with weak synoptic-scale forcing and minimal upper-level steering flow, favored the development of slow-moving and moisture-laden convective systems.
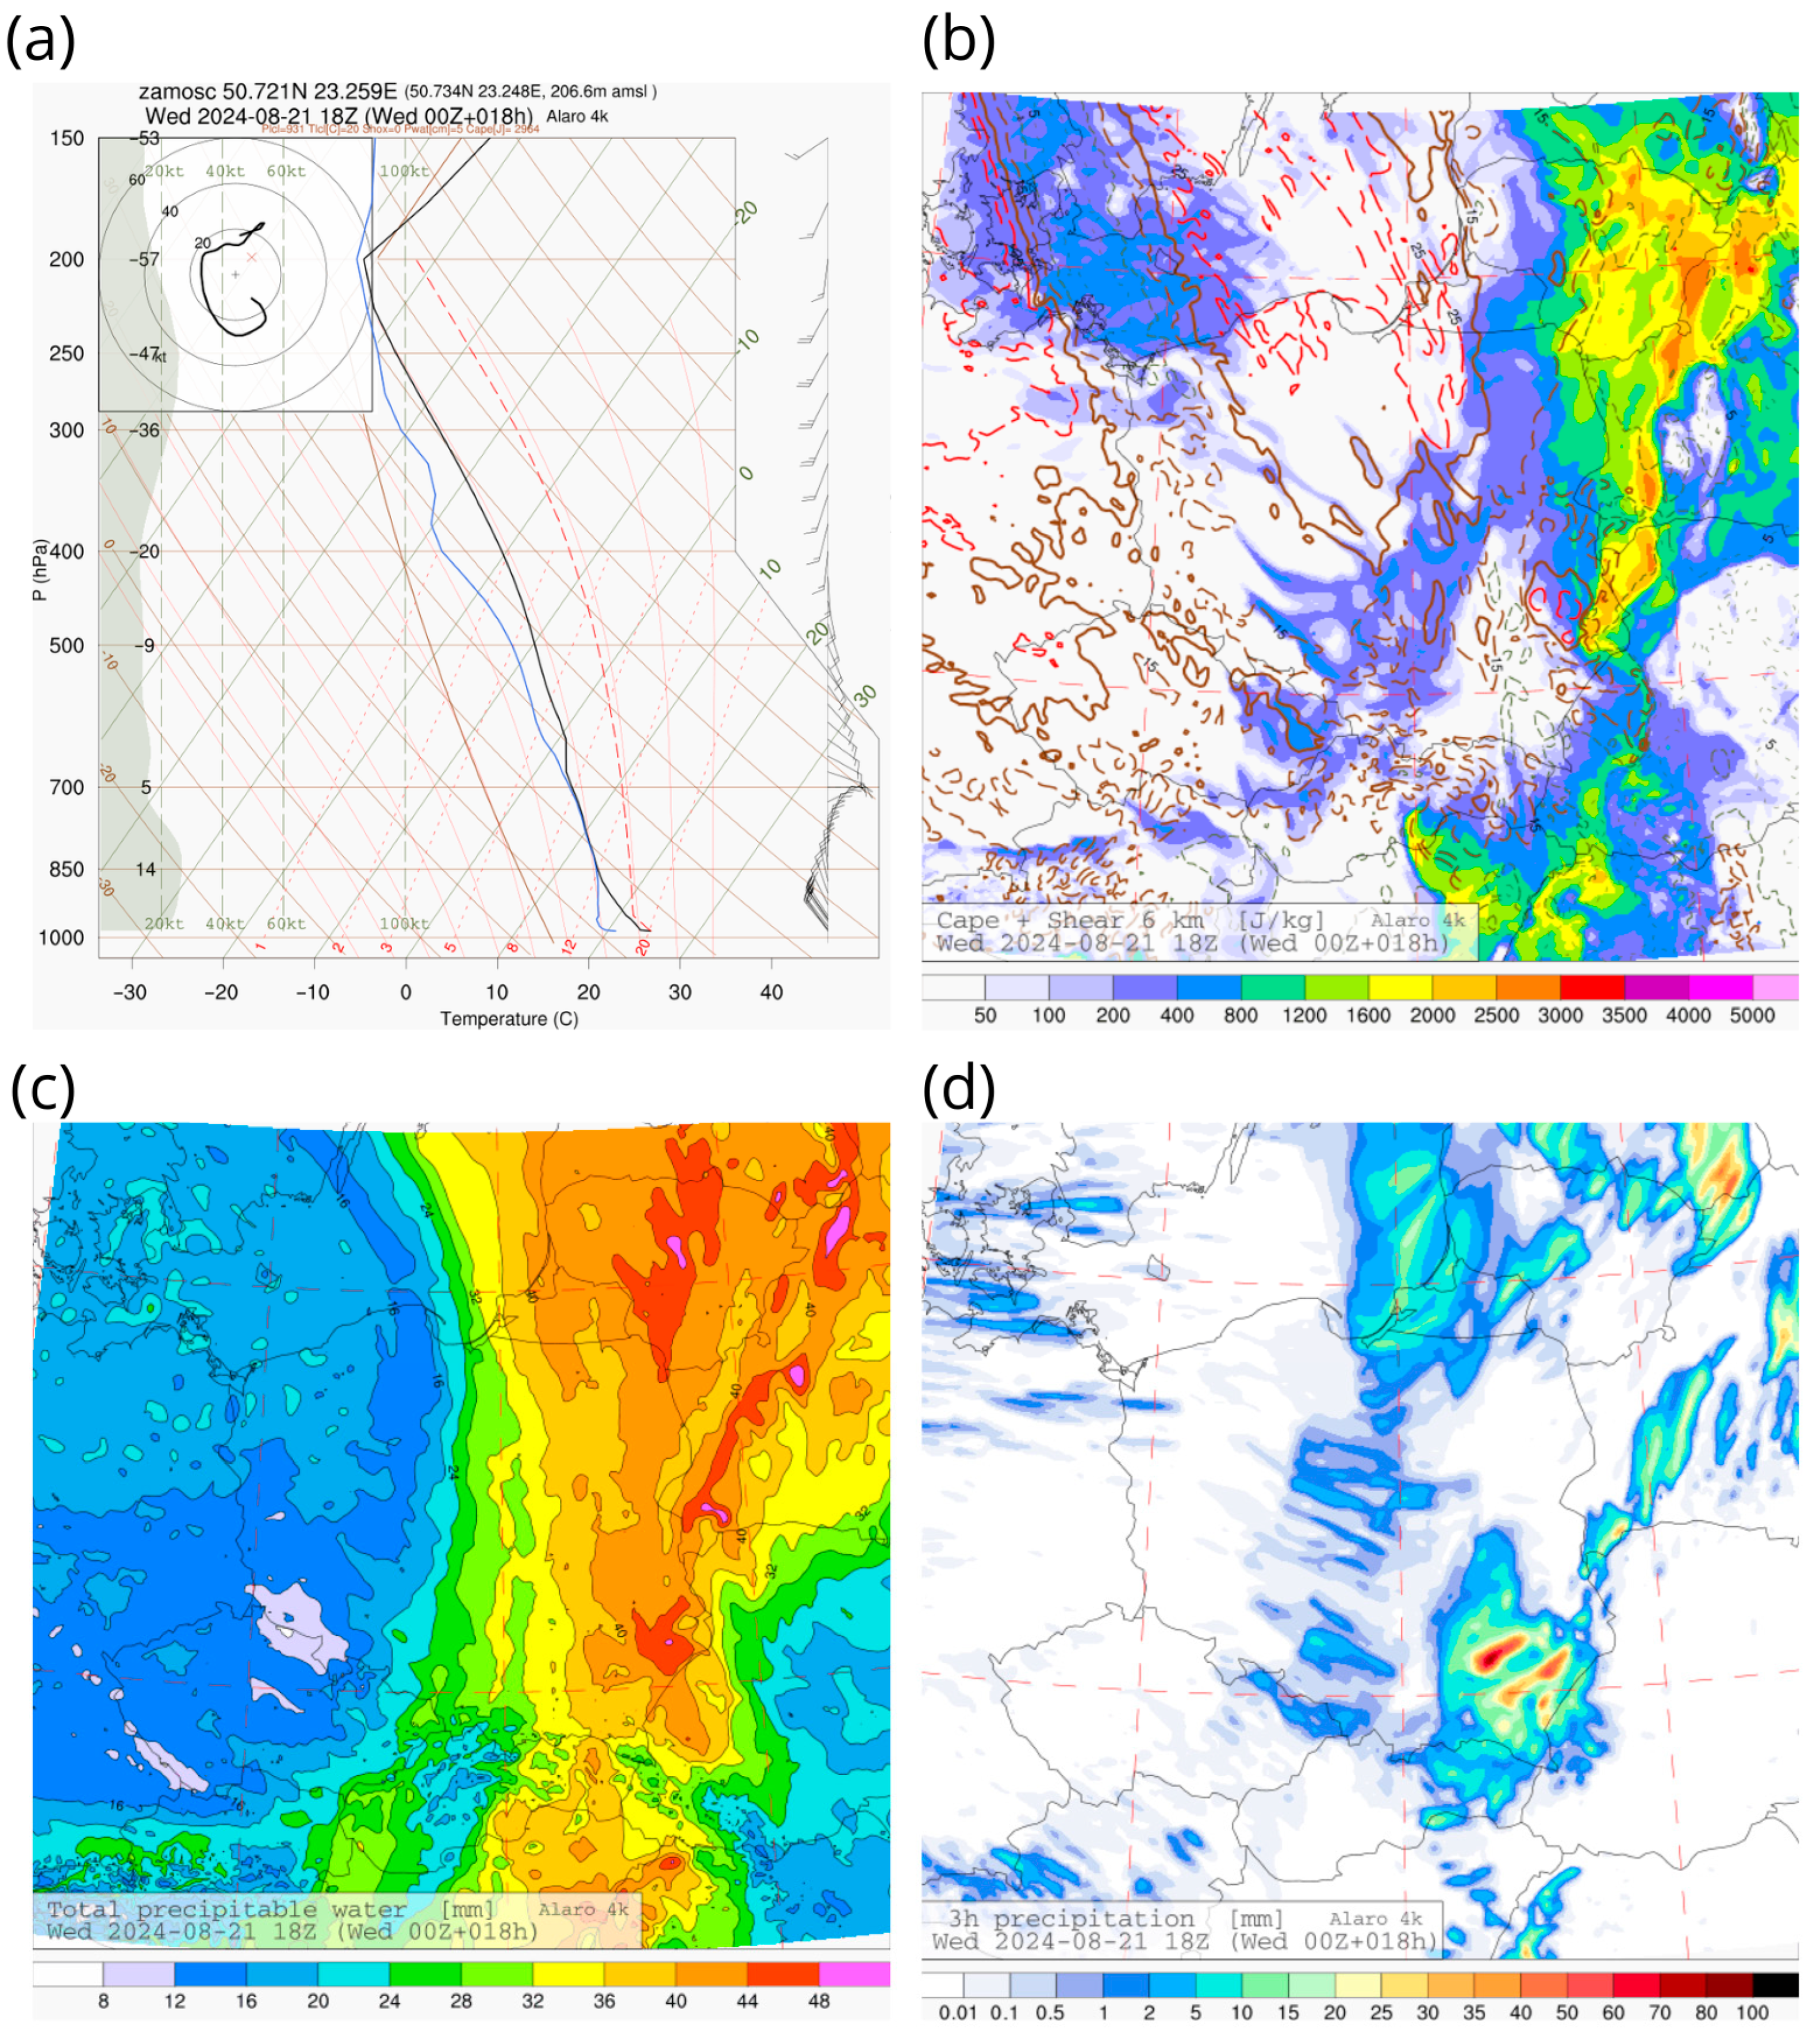
The ALARO 4 km model outputs for 18 UTC indicated an environment conducive to high precipitation efficiency. Total Precipitable Water (TPW) values exceeded 40 mm locally, indicative of a fully saturated tropospheric column and among the highest values simulated across Europe at the time.
The forecast aerological sounding for Zamość (valid at 18 UTC) showed substantial instability, with CAPE values ranging from 2000 to 2500 J/kg. The tropospheric profile exhibited deep-layer moisture, with relative humidity exceeding 80% from the boundary layer through the mid-troposphere, supporting strong convective updrafts and high precipitation efficiency (Figure 7). Vertical wind shear in the 0–6 km layer ranged between 12 and 17 m/s, corresponding to moderate shear conditions. This level of shear supported the organization of clustered multicellular convection and favored the occurrence of convective training, especially when aligned with low steering flow and mesoscale convergence. The combined thermodynamic and kinematic environment was thus highly conducive to persistent and locally intense rainfall production.
The combined CAPE–shear product highlighted moderate buoyancy with low shear, particularly over the Lublin–Zamość axis. This, along with the elevated values of the mixing ratio to lapse rate index (850–500 hPa) exceeding 13 g/kg per 100 m, suggested favorable conditions for sustained deep convection and local storm training.
Simulated 3 h accumulated precipitation fields showed a localized maximum directly over Zamość, with values exceeding 30 mm. This aligns well with radar and station observations, indicating that the model captured the placement and intensity of convection reasonably accurately. The storms’ low translational speed contributed to high local rainfall totals over a limited area.
These synoptic features are consistent with previous studies of high-impact convective extremes in Central Europe, where slow-moving, moisture-laden systems produce intense local rainfall and elevate urban flood risk [22,28].
Although the 21 August storm did not fully meet the spatial criteria of an MCS, it exhibited key mesoscale features such as training, slow motion, and persistent regeneration, consistent with MCS-like dynamics under weak synoptic forcing.

3.4. Precipitation Intensity and Radar Diagnostics—Zamość (21 August 2024)

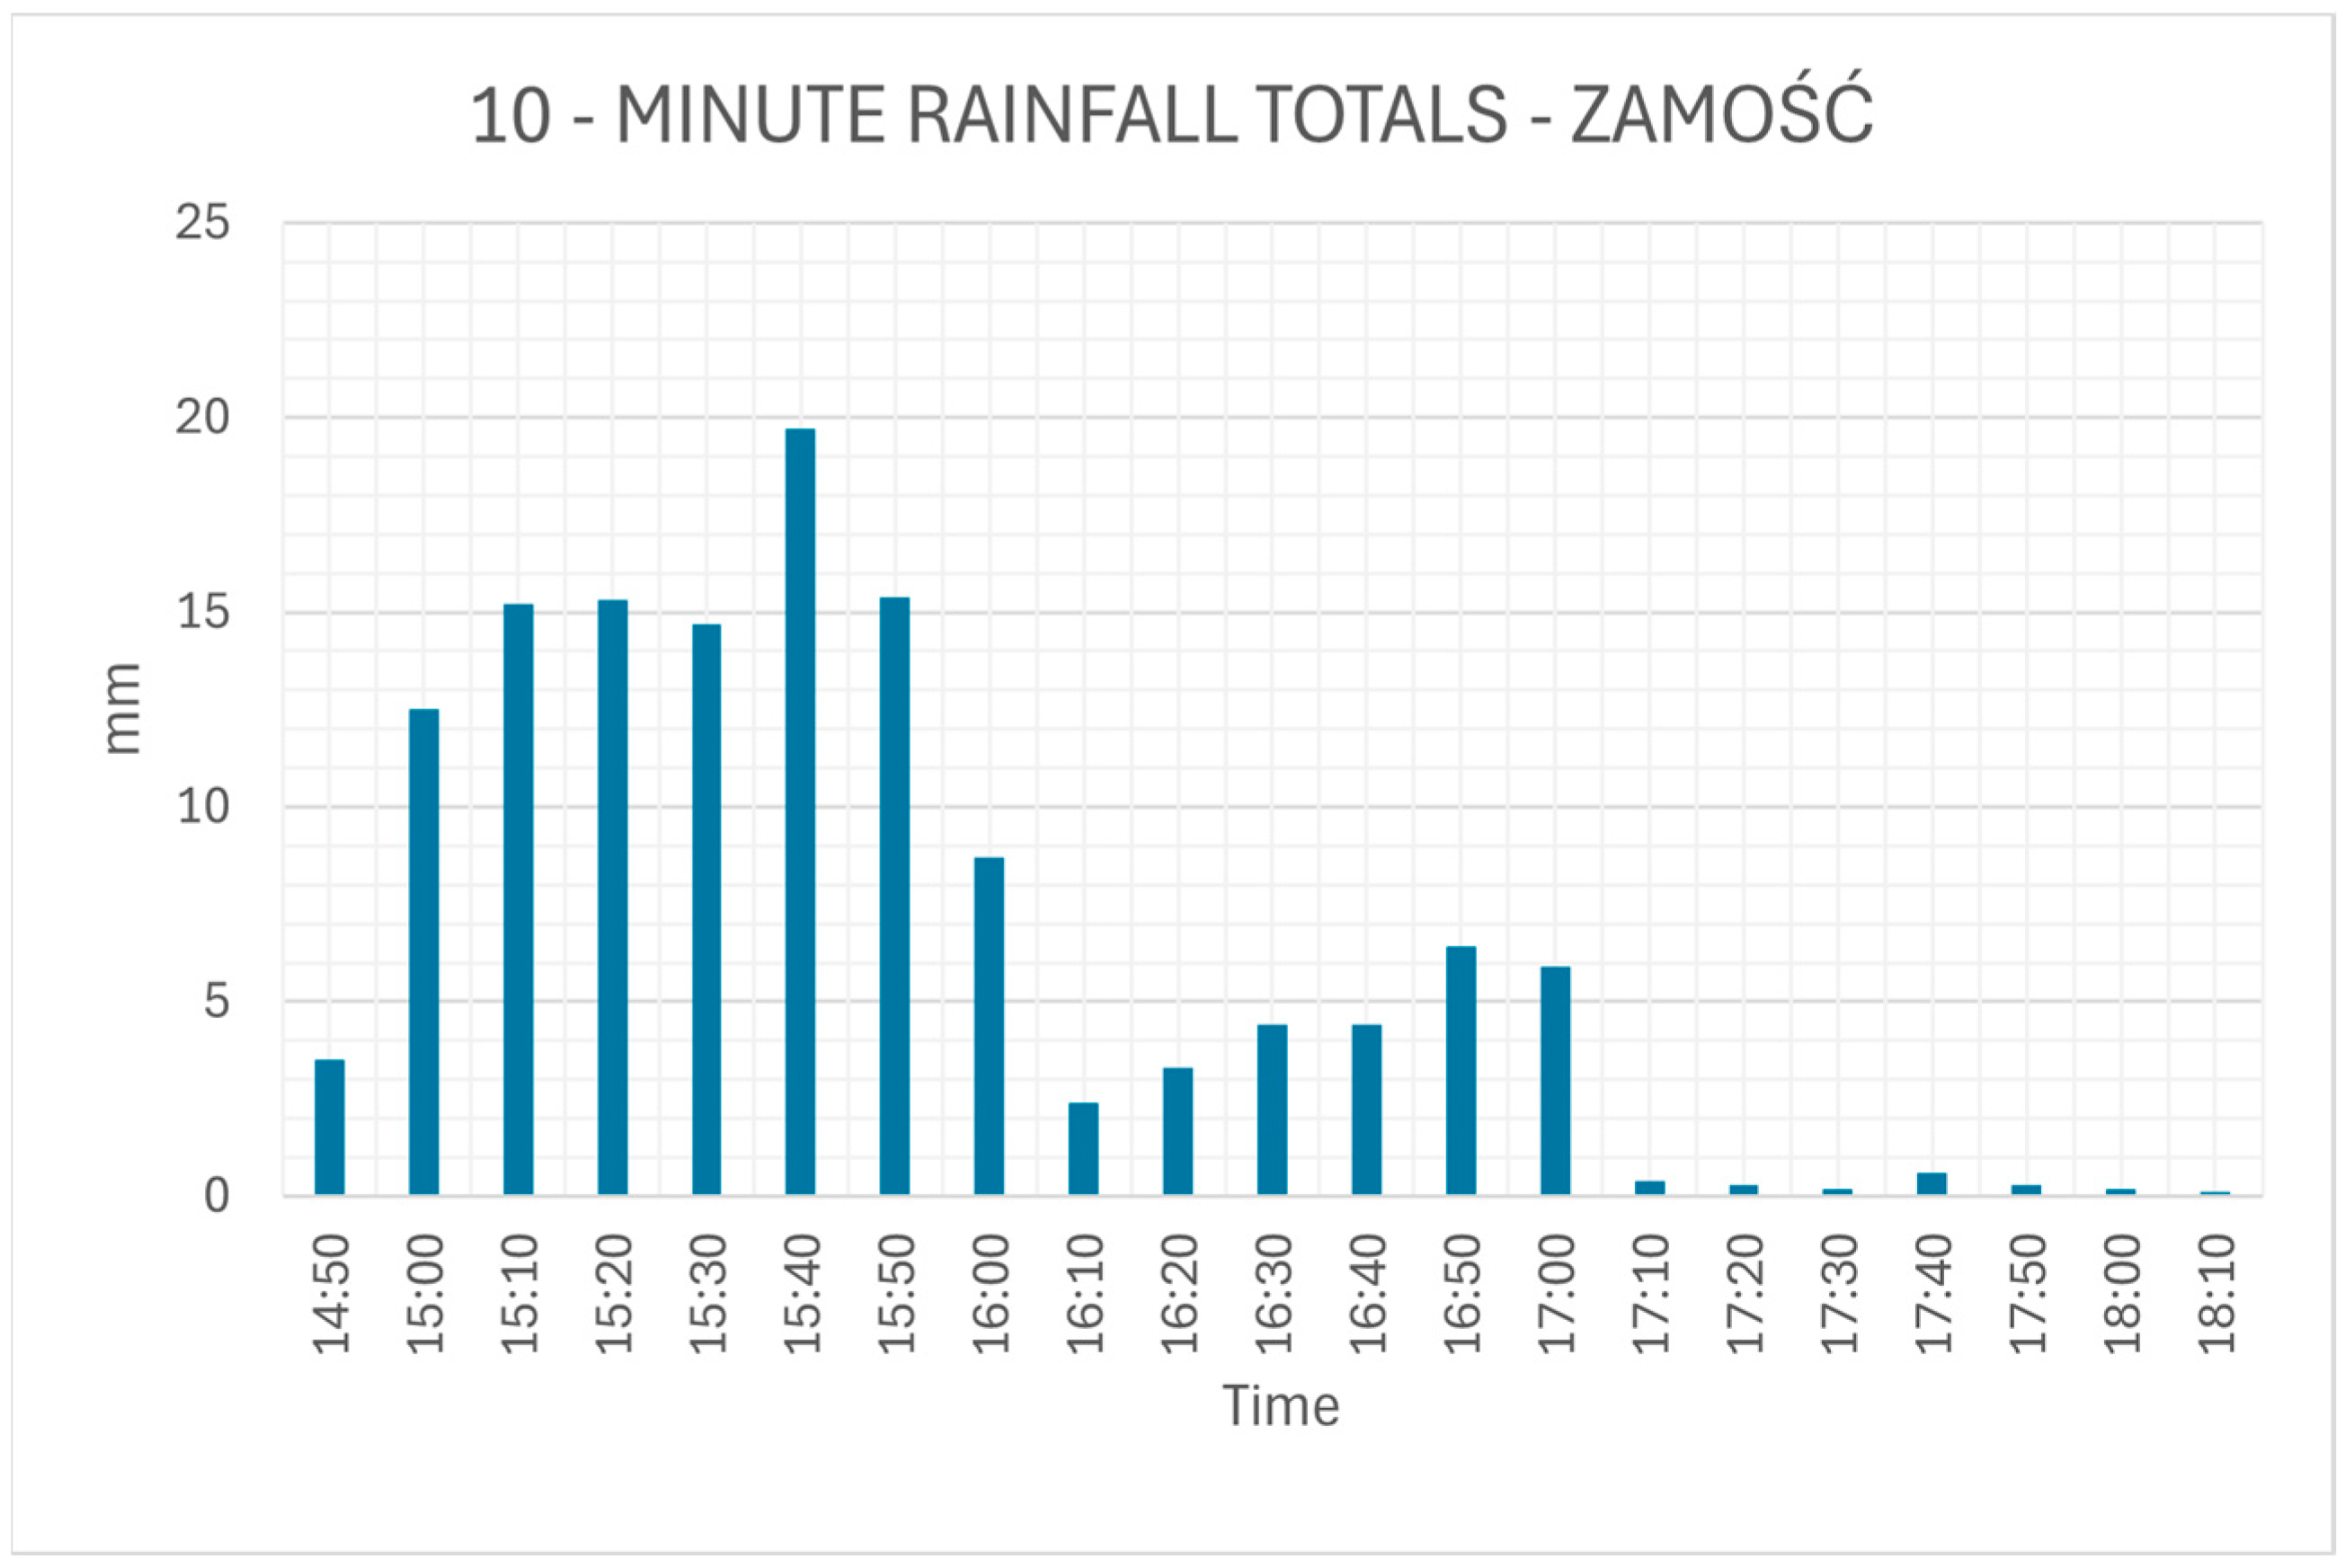
A quasi-stationary convective storm on 21 August 2024 led to one of the most intense rainfall events ever recorded in the Zamość area (Figure 8). Over just one hour, precipitation totaled 88.3 mm, including a maximum 10 min accumulation of 19.5 mm. According to the Chomicz index, this corresponds to α = 12.8, classifying the event as third-degree torrential rainfall (B3) (~117 mm/h, categorized as extreme rainfall by WMO) (Figure 9).
The storm remained nearly stationary due to weak synoptic forcing combined with very low wind speeds in the mid- and upper troposphere, as well as orographic blocking from the Roztocze terrain. This lack of steering flow inhibited the system’s movement and allowed for sustained convective development over the same location. Convective initiation began around 14:00 UTC (16:00 local time), and by 14:50 UTC (16:50 local time), a high-precipitation cumulonimbus system had formed. The storm cell exhibited a vertical extent exceeding 15 km and persistent updraft structures consistent with efficient rainfall production.
Despite its limited spatial extent (approximately 10 km in diameter), the convective event caused widespread flooding in Zamość, particularly in densely urbanized districts where road infrastructure temporarily functioned as drainage channels. The exceptionally high rainfall totals were recorded at the Nielisz station, located around 15 km northwest of Zamość, which serves as a key point of comparison. At this nearby location, rainfall totals remained below 10 mm, underscoring the highly localized and mesoscale nature of the convective core that affected Zamość directly.
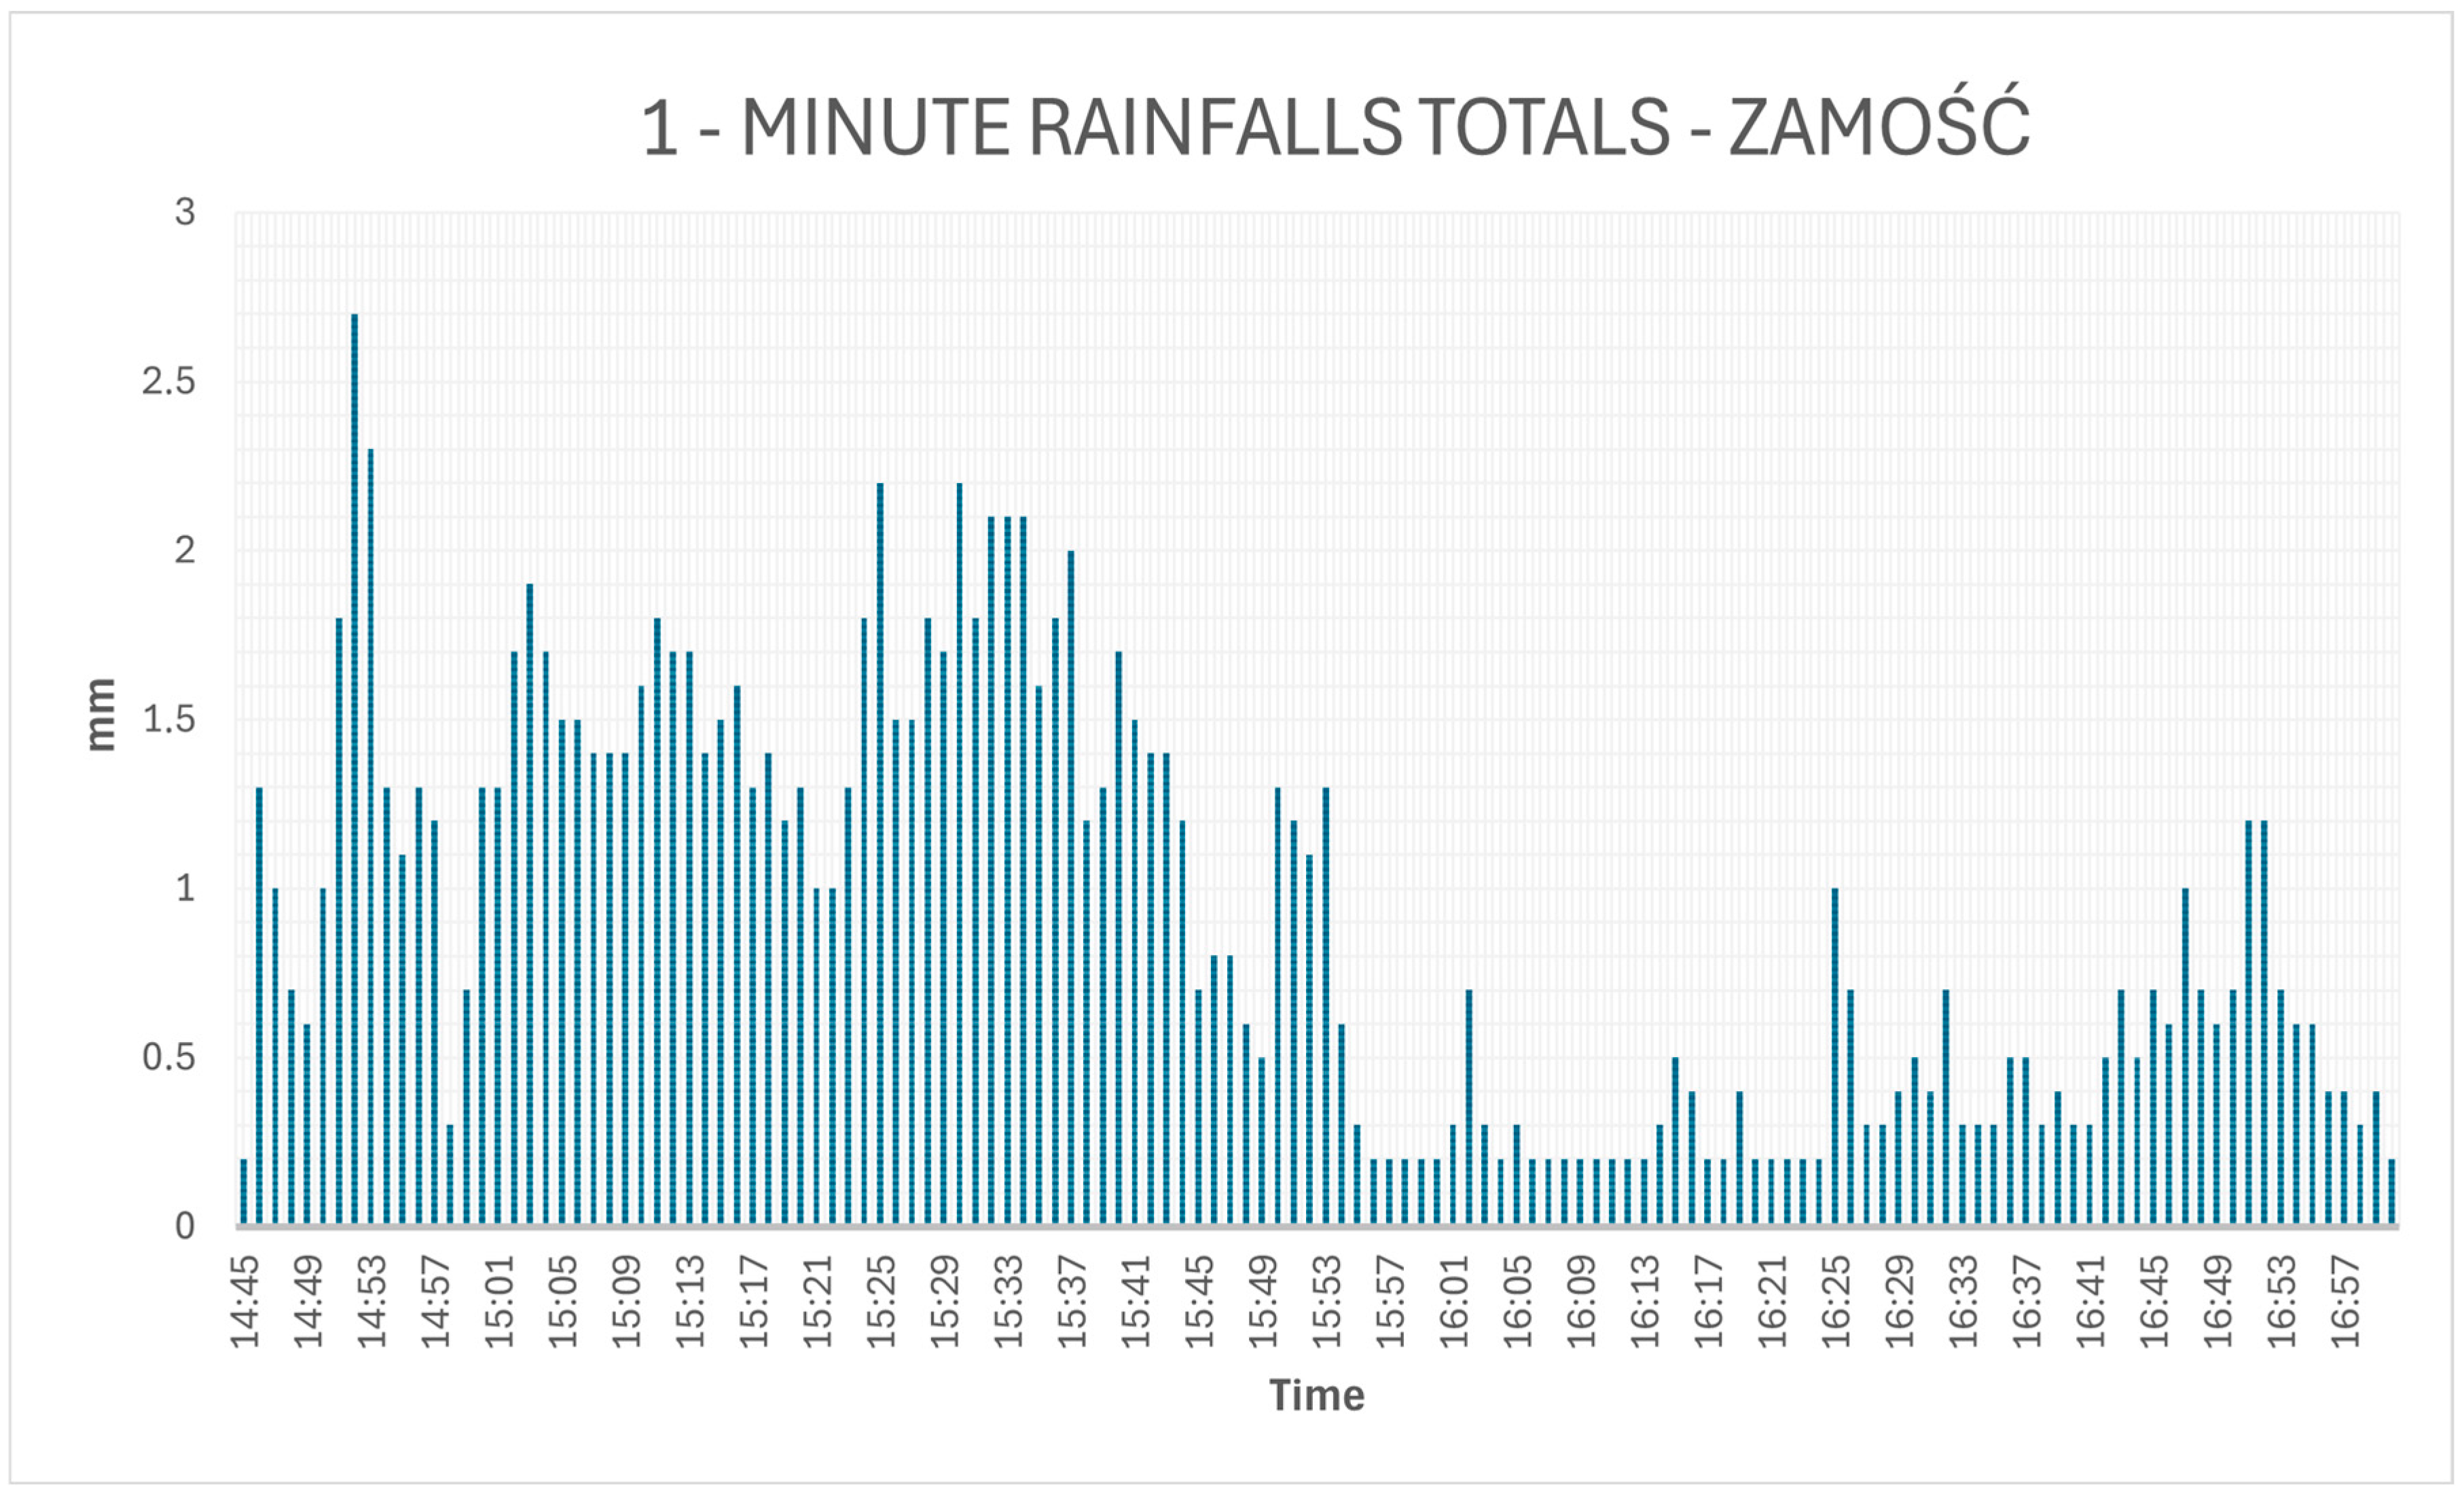
During the most intense phase (from 14:46 UTC to 15:59 UTC), a total of 105.1 mm was recorded within just 73 min (mean rate of ~86 mm/h, within the WMO extreme category). This yields a calculated α index of 12.3 for that specific interval—still qualifying as third-degree extreme rainfall (B3) under the Chomicz classification. The 1 min rainfall profile (Figure 10) reveals several bursts exceeding 2.5 mm/min, which corresponds to instantaneous intensities over 150 mm/h—well above internationally recognized thresholds for extreme precipitation. These values underscore the efficiency and severity of the convective system, particularly in terms of flash flood potential.
To facilitate comparison, Table 3 presents the main quantitative rainfall indicators for the Warsaw and Zamość convective episodes, including α-index values, WMO thresholds, and observed impacts.

4. Convective System Structure and Organization

4.1. Convective System Typology

Radar and observational data suggest that the convective events of 19 and 21 August 2024 were driven by distinct types of storm organization, consistent in part with mesoscale convective system (MCS) dynamics. The classification of convective organization in this study draws upon foundational work by Maddox [30], who defined mesoscale convective complexes (MCCs) as a specific subset of larger mesoscale convective systems (MCSs), based on criteria such as spatial extent, symmetry, and duration. More broadly, Houze [31] synthesized a typology of MCSs encompassing multicellular clusters, squall lines, and convective complexes, emphasizing the role of mesoscale processes in storm maintenance and precipitation efficiency.
The analyzed cases in this study align most closely with short-lived or marginal MCS structures, developing under weak to moderate convective forcing—including mesoscale convergence lines and frontal boundaries—within weakly forced synoptic environments. This combination favored the formation of slow-moving, moisture-laden systems with elevated rainfall efficiency and localized flash flood potential.

4.2. The 19 August Multicellular Linear Convective System: Structure and Dynamics

The convective event near Warsaw on 19 August exhibited features of a multicellular convective cluster with embedded linear segments. Storms were triggered along a convergence boundary and followed a semi-organized west-to-east alignment (Figure 11). The system propagated quickly and produced intense but short-lived rainfall.
Radar reflectivity patterns indicated strong vertical development, with transient updrafts and embedded bowing segments. The storm structure was typical of fast-moving multicell systems, which often produce peak 10–30 min rainfall intensities over confined areas. Notably, the observed rainfall intensity exceeded 31 mm within 20 min at Warsaw-Okęcie, coinciding with a recorded wind gust of approximately 25 m/s around 12:00 UTC. The temporal and spatial overlap of extreme precipitation and strong surface gusts suggests that a wet microburst may have occurred. Although no direct damage reports are available, the radar morphology and meteorological parameters are consistent with convective downdraft surges typical of microburst dynamics.

4.3. The 21 August Back-Building Training System: Structure and Dynamics

In contrast, the storm system over Zamość on 21 August was characterized by nearly stationary convective cells exhibiting training and back-building behavior. Radar imagery showed persistent upstream development of new cells repeatedly impacting the same local area (Figure 12). This morphology is well-known for producing extreme local accumulations and is strongly associated with flash flood risk.
Such systems tend to form under conditions of limited deep-layer flow, abundant atmospheric moisture, and weak synoptic steering—features present during this event. The vertical profile indicated a deeply saturated troposphere from the boundary layer through mid-levels, enhancing precipitation efficiency. Furthermore, weak to moderate vertical wind shear (~10–12 m/s in the 0–6 km layer) and minimal steering flow contributed to the regeneration and anchoring of convective activity over the same location.

5. Discussion

The convective rainfall events analyzed in this study illustrate key features of modern extreme precipitation in Central Europe: strong spatial localization, high short-term intensity, and significant hydrological consequences, particularly in urban environments. Although they occurred under different synoptic conditions, both cases shared critical contributing factors, including high atmospheric moisture content, unstable thermodynamic profiles, and terrain or land-use elements that amplified flood impacts.
The Warsaw–Okęcie case (19 August) demonstrated how rapidly evolving multicellular convection, supported by mesoscale convergence and high precipitable water, can generate flash flooding within a short time window, especially in urbanized zones with limited infiltration capacity. In contrast, the Zamość storm (21 August) highlighted how moderately forced convective environments—characterized by a passing cold front, deep-layer saturation, and favorable kinematic parameters—can lead to nearly stationary storm cells exhibiting training behavior. Despite its confined spatial extent, this event produced rainfall totals comparable to those seen in large-scale flood scenarios.
These events reinforce the need to modernize flood risk assessment methodologies. Conventional intensity–duration–frequency (IDF) curves and static hazard classifications may fail to capture the hazards posed by slow-moving or regenerating convective systems. This is particularly relevant in urban areas, where terrain modifications, sealed surfaces, and insufficient drainage infrastructure significantly increase flash flood vulnerability. Observational and modeling studies from southern Europe—such as Athens [5] and Genoa [32]—have similarly highlighted the role of storm organization and urban exposure in amplifying flood impacts under convective forcing.
While the Chomicz α index remains a useful diagnostic tool in Polish hydrology for assessing short-term rainfall efficiency, its region-specific nature limits its applicability in global comparisons. To enhance the broader relevance of this study, recorded short-duration rainfall intensities were evaluated against internationally recognized thresholds. According to the World Meteorological Organization (WMO), rainfall rates exceeding 50 mm/h are considered very heavy, while values above 80 mm/h are classified as extreme. In both analyzed events, peak intensities—21.3 mm/10 min (~128 mm/h) and 19.5 mm/10 min (~117 mm/h)—clearly surpassed these global benchmarks, as well as standard Flash Flood Guidance System (FFGS) alert thresholds of 20–30 mm per hour. The observed rainfall intensities, particularly exceeding 80–120 mm/h in short intervals, suggest stress levels beyond typical urban drainage design standards. Future studies should explore infrastructure-specific runoff modeling under similar conditions.
These comparisons underscore that the 2024 events were not only regionally significant but also consistent with broader global trends of intensifying convective hazards under a warming climate [2]. Urban vulnerability to such extremes is likely to increase, necessitating climate adaptation strategies focused on drainage infrastructure, land-use policy, and emergency preparedness. Similar convective flood risks in densely built environments have been documented in other European cities, such as Barcelona, where training storm cells repeatedly affected the same catchments and overwhelmed local drainage systems [33].
Recent case studies in China confirm that human-induced climate change is intensifying sub-hourly rainfall extremes in urban areas [34], underscoring the relevance of our findings for future adaptation efforts
Additionally, the events significantly exceeded short-term thresholds established by the Flash Flood Guidance System (FFGS), such as 20–30 mm within 1 h. For example, the total of 131.3 mm in Zamość in less than 3 h—including over 88 mm in just 60 min—indicates conditions highly conducive to flash flooding, regardless of the classification method applied.
The observed impacts in Zamość—despite the relatively limited spatial extent of the storm—underscore the disproportionate hydrological consequences of localized, stationary convection in urban areas. As documented by IMGW-PIB Pilguj et al. [35], emergency services were overwhelmed by sudden flooding, demonstrating the need for more granular flood warning systems and better integration of real-time radar-based tools in municipal planning.
These comparative benchmarks confirm that the analyzed events were exceptionally severe not only from a national perspective but also relative to international hydrometeorological standards. They support the inclusion of such cases in broader discussions on convective extremes and urban flood risk under climate warming [36]. This aligns with trends reported for Central Europe [2,37], highlighting the increasing contribution of short-duration convective storms to localized flooding, particularly in urbanized areas with reduced infiltration capacity. The analyzed cases illustrate that even relatively short-lived storm systems can generate severe disruptions when convective training or regeneration occurs [4].
From an operational perspective, these findings underscore the importance of integrating high-resolution radar nowcasting and model-based reanalysis into local flood risk management frameworks. Authorities and emergency services should account for micro-scale hydrometeorological vulnerabilities and update warning systems accordingly. The results also suggest that conventional rainfall intensity thresholds and static hazard classifications may underestimate the risks posed by stationary or regenerating convective systems.
While the analyzed storms may not fully conform to the classical definition of Mesoscale Convective Systems (MCS) in terms of scale and structure, they were clearly governed by mesoscale processes capable of producing extreme local rainfall. In particular, clustered multicell convection with training behavior was central to both events. These dynamics are consistent with previous studies on MCS-related flood hazards in Central Europe [23,29].
Comparison with Historical Events
Although the convective rainfall events from August 2024 did not result in large-scale disaster losses, their short-term intensity and mesoscale structure are comparable to some of the most significant flash flood episodes recorded in Central Europe in recent decades. These comparisons underscore the growing importance of localized hydrometeorological preparedness under a changing climate regime.
Several recent European cases offer important context:
  • Germany/Belgium, July 2021: A quasi-stationary low-pressure system produced 100–150 mm of rain over 24–48 h, leading to catastrophic flooding in the Ahr Valley. The event was marked by blocked upper-level flow and orographic enhancement—features echoed in the Zamość setup [38].
  • Central Europe, August 2002: Successive Vb-type cyclones originating from the Mediterranean generated over 300–400 mm of rain across southern Bohemia and Austria within several days. These events highlighted the vulnerability of mountain catchments to persistent mesoscale rainfall [39].
  • Southern France, September 2002: A quasi-stationary mesoscale convective system dropped more than 600 mm of rainfall within 24 h in the Gard region. Despite its Mediterranean character, the storm’s morphology—especially training convection—bears similarity to the Zamość event [40].
  • Southeastern Spain, September 2019 (DANA): A cut-off upper-level low interacting with moist Mediterranean inflow caused over 500 mm of rain in two days. Although thermodynamically distinct, it shares synoptic traits with the August 2024 setup over eastern Poland [41].
Among these cases, the 21 August 2024 Zamość storm stands out due to its extreme short-term intensity—131.3 mm in less than 3 h—and minimal horizontal displacement, marking a rare confluence of orographic, thermodynamic, and mesoscale triggers. The event resulted in substantial hydrological impacts, including over 150 emergency service interventions in the Zamość area, and hourly rainfall totals reaching 88.3 mm, highlighting the severity of localized convective flash floods. Conversely, the Warsaw event represents a high-end example of fast-propagating multicellular convection, with significant short-duration precipitation affecting a densely urbanized area. This underscores the interplay between mesoscale atmospheric features and surface imperviousness in shaping urban flood vulnerability.
Conversely, the Warsaw event represents a high-end example of fast-propagating multicellular convection, with substantial short-term rainfall over a highly urbanized area, underscoring the role of mesoscale convergence and surface imperviousness in flash flood risk.
These analogs support the classification of the August 2024 storms as regionally exceptional events, offering broader insights into flash flood risk under intensifying convective regimes. Their comparison with historically impactful cases across Europe also highlights the importance of re-evaluating local thresholds, forecast practices, and adaptation measures in the face of increasingly frequent convective extremes.
In light of growing urban exposure to convective flash floods under climate change, there is a compelling need to develop more comprehensive rainfall indicators. Traditional metrics—such as the Chomicz α index or intensity–duration thresholds—focus primarily on meteorological parameters but often overlook critical environmental and urban features that modulate flood impacts, such as soil sealing, drainage capacity, and land-use heterogeneity. Given the increasing frequency of short-duration, high-intensity rainfall over impervious surfaces, future hydrometeorological frameworks would benefit from a dedicated index tailored to urban environments. Such an index should integrate not only rainfall intensity and duration but also local topography, infiltration potential, and spatial storm characteristics (e.g., stationarity, extent). This would enable more accurate flash flood risk assessments in urbanized catchments, supporting both early warning systems and long-term adaptation planning.

6. Conclusions

This study analyzed two high-impact convective rainfall events that occurred in Poland in August 2024. The findings support the following key conclusions:
  • Both events qualify as torrential rainfall episodes according to the Chomicz α index, with the Zamość case reaching α = 12.8—classifying it as a third-degree event and among the highest recorded in operational archives.
  • The Zamość storm represents one of the most extreme short-duration rainfall events in the region, producing 88.3 mm within one hour, 131.3 mm over a 3 h period, and 147.2 mm during the entire precipitation day, with negligible horizontal storm motion.
  • Highly urbanized areas with limited infiltration capacity—such as Warsaw and Zamość—are particularly vulnerable to flash flooding from short-lived but intense convective systems.
  • There is an urgent need to modernize urban drainage infrastructure, incorporate high-resolution hydrometeorological data into planning frameworks, and adapt to the increasing frequency of convective extremes under climate change.
  • The results highlight the importance of dynamic and spatially precise early warning systems, particularly those incorporating real-time radar monitoring and nowcasting capabilities to identify slow-moving or repeatedly regenerating convective cells with high precipitation efficiency.
  • Further studies should explore urban runoff modeling under convective rainfall scenarios, develop improved rainfall–risk indices tailored to urban surfaces, and test nowcasting integration into local flood warning systems. These directions can enhance resilience to short-duration hydrometeorological extremes.

Author Contributions

Conceptualization, B.P. and R.P.; methodology, B.P.; software, B.P.; validation, B.P. and R.P.; formal analysis, B.P.; investigation, B.P.; resources, B.P. and R.P.; data curation, B.P.; writing—original draft preparation, B.P.; writing—review and editing, B.P.; visualization, B.P.; supervision, R.P.; project administration, B.P. All authors have read and agreed to the published version of the manuscript.

Funding

The publication of this article was financially supported by the University of the National Education Commission in Krakow (UKEN) and the Institute of Meteorology and Water Management–National Research Institute (IMGW-PIB).

Data Availability Statement

The data presented in this study are available in open-access repositories. Radar and meteorological data are accessible from the Polish Institute of Meteorology and Water Management (IMGW-PIB) at https://dane.imgw.pl (accessed on 19 July 2025), while numerical model outputs (ALARO) can be accessed upon request via the IMGW-PIB platform at https://www.imgw.pl (accessed on 19 July 2025) These datasets were derived from public domain resources, including the IMGW-PIB open data portal and the EUMETSAT Earth Observation Portal (https://eoportal.eumetsat.int, accessed on 19 July 2025).

Acknowledgments

During the preparation of this manuscript, the authors used ChatGPT (OpenAI, June 2024 version) for language editing support. The authors have reviewed and edited the output and take full responsibility for the content of this publication.

Conflicts of Interest

The author is employed at University of the National Education Commission in Krakow in a research capacity and works as an operational meteorologist at Institute of Meteorology and Water Management. Both affiliations are listed to reflect the scientific and practical aspects of research. There are no financial or personal conflicts of interest.

Abbreviations

The following abbreviations are used in this manuscript:
MCSMesoscale Convective System
MCCMesoscale Convective Complex
CAPEConvective Available Potential Energy
TPW/PWATTotal Precipitable Water / Precipitable Water
UTCCoordinated Universal Time
RDTRapidly Developing Thunderstorms (satellite product)
MSGMeteosat Second Generation
IMGW-PIBInstitute of Meteorology and Water Management—National Research Institute
FFGSFlash Flood Guidance System
WMOWorld Meteorological Organization
ALAROAROME Limited Area Model with Optional Radiation
POLRADPolish national radar network
EPWAICAO code for Warsaw-Okęcie Airport
α indexRainfall efficiency index by Chomicz
B1, B2, B3…Symbolic codes for torrential rainfall severity based on α index

References

  1. Trenberth, K.E. Changes in precipitation with climate change. Clim. Res. 2011, 47, 123–138. [Google Scholar] [CrossRef]
  2. IPCC. Climate Change 2021: The Physical Science Basis; Cambridge University Press: Cambridge, UK, 2021. [Google Scholar]
  3. Choryński, A.; Pińskwar, I.; Graczyk, D.; Kundzewicz, Z.W. Observed changes in extreme precipitation in Poland: 1991–2015 versus 1961–1990. Theor. Appl. Climatol. 2019, 135, 1245–1261. [Google Scholar] [CrossRef]
  4. Kalbarczyk, R.; Kalbarczyk, E. Risk of Natural Hazards Caused by Extreme Precipitation in Poland in 1951–2020. Water 2024, 16, 1705. [Google Scholar] [CrossRef]
  5. Varlas, G.; Anagnostou, M.N.; Spyrou, C.; Papadopoulos, A.; Kalogiros, J.; Mentzafou, A.; Michaelides, S.; Baltas, E.; Karymbalis, E.; Katsafados, P. A Multi-Platform Hydrometeorological Analysis of the Flash Flood Event of 15 November 2017 in Attica, Greece. Remote Sens. 2019, 11, 45. [Google Scholar] [CrossRef]
  6. Costa, S.B.; Herdies, D.L.; Souza, D.O. Extreme Precipitation Events on the East Coast of Brazil’s Northeast: Numerical and Diagnostic Analysis. Water 2021, 14, 3135. [Google Scholar] [CrossRef]
  7. Allan, R.P.; Soden, B.J.; John, V.O.; Ingram, W.; Good, P. Current changes in tropical precipitation. Environ. Res. Lett. 2010, 5, 025205. [Google Scholar] [CrossRef]
  8. Wypych, A.; Ustrnul, Z.; Czekierda, D.; Palarz, A. Extreme Precipitation Events in the Polish Carpathians and Their Synoptic Determinants. Időjárás 2018, 122, 161–184. [Google Scholar] [CrossRef]
  9. Kundzewicz, Z.W.; Krysanova, V.; Dankers, R.; Hirabayashi, Y.; Kanae, S.; Hattermann, F.F.; Huang, S.; Milly, P.C.D.; Stoffel, M.; Driessen, P.P.J.; et al. Differences in flood hazard projections in Europe. Hydrol. Sci. J. 2017, 62, 1–14. [Google Scholar] [CrossRef]
  10. Nowosad, J.; Stach, A. Relation between extensive extreme precipitation in Poland and atmospheric circulation. Quaest. Geogr. 2014, 33, 115–129. [Google Scholar] [CrossRef]
  11. Pińskwar, I.; Choryński, A.; Graczyk, D. Flash floods in Poland’s Wielkopolska region. Int. J. Disaster Risk Sci. 2023, 14, 440–457. [Google Scholar] [CrossRef]
  12. Da Silva, N.; Haerter, J. The characteristics of mesoscale convective system rainfall over Europe. ESS Open Arch. 2023. [Google Scholar] [CrossRef]
  13. Górka, M.; Pilarz, A.; Modelska, M.; Drzeniecka-Osiadacz, A.; Potysz, A.; Widory, D. Urban Single Precipitation Events: A Key for Characterizing Sources of Air Contaminants and the Dynamics of Atmospheric Chemistry Exchanges. Water 2024, 16, 3701. [Google Scholar] [CrossRef]
  14. Banasik, K.; Hejduk, L.; Barszcz, M. Flood flow consequences of land use changes in a small urban catchment of Warsaw. In Proceedings of the 11th International Conference on Urban Drainage (ICUD), Edinburgh, UK, 31 August–5 September 2008. [Google Scholar]
  15. Banasik, K.; Krajewski, A.; Sikorska, A.; Hejduk, L. Curve number estimation for a small urban catchment from recorded rainfall-runoff events. Arch. Environ. Prot. 2014, 40, 75–86. [Google Scholar] [CrossRef]
  16. Kourtis, I.M.; Tsihrintzis, V.A. Adaptation of Urban Drainage Networks to Climate Change: A Review. Sci. Total Environ. 2021, 771, 145431. [Google Scholar] [CrossRef]
  17. Dzwonkowski, K.; Winnicki, I.; Pietrek, S.; Siewert, J. Analysis of Precipitation Totals Based on Radar and Rain Gauge Data. Remote Sens. 2025, 17, 2157. [Google Scholar] [CrossRef]
  18. Piniewski, M.; Szcześniak, M.; Kardel, I.; Chattopadhyay, S.; Berezowski, T. G2DC-PL+: Gridded daily climate data for Poland. Earth Syst. Sci. Data 2021, 13, 1273–1288. [Google Scholar] [CrossRef]
  19. Lenderink, G.; van Meijgaard, E. Increase in hourly precipitation extremes beyond expectations from temperature changes. Nat. Geosci. 2008, 1, 511–514. [Google Scholar] [CrossRef]
  20. Prein, A.F.; Rasmussen, R.M.; Ikeda, K.; Liu, C.; Clark, M.P.; Holland, G.J. Future intensification of hourly precipitation extremes. Nat. Clim. Change 2017, 7, 48–52. [Google Scholar] [CrossRef]
  21. Papalexiou, S.M.; Montanari, A. Global warming increases risk of extreme rainfall. Water Resour. Res. 2019, 55, 4496–4509. [Google Scholar] [CrossRef]
  22. Kendon, E.J.; Roberts, N.M.; Fowler, H.J.; Roberts, M.J.; Chan, S.C.; Senior, C.A. Heavier summer downpours with climate change. Nat. Clim. Change 2014, 4, 570–576. [Google Scholar] [CrossRef]
  23. Ghasemifard, H.; Groenemeijer, P.; Battaglioli, F.; Púčik, T. Do changing circulation types raise the frequency of summertime thunderstorms and large hail in Europe? Environ. Res. Clim. 2024, 3, 015006. [Google Scholar] [CrossRef]
  24. Asher, M.; Pedersen, J.W.; Boeing, S.; Birch, C.; Trigg, M.; Kendon, E. Extreme Rainfall and Temporal Loading in Great Britain: Analysis Using a Convection-Permitting Climate Model. SSRN Prepr. 2024. [Google Scholar] [CrossRef]
  25. Chomicz, K. Ulewy i deszcze nawalne w Polsce. Wiad. Służby Hydrol. Meteorol. 1951, 2, 5–88. [Google Scholar]
  26. WMO. WMO Guidelines on Multi-Hazard Impact-Based Forecast and Warning Services; WMO-No. 1150; World Meteorological Organization: Geneva, Switzerland, 2019; Available online: https://library.wmo.int/index.php?lvl=notice_display&id=21704 (accessed on 2 July 2025).
  27. WMO. Flash Flood Guidance System: Reference Guide; WMO-No. 1099; World Meteorological Organization: Geneva, Switzerland, 2013. [Google Scholar]
  28. Doswell, C.A., III. Severe convective storms—An overview. In Severe Convective Storms; Doswell, C.A., III, Ed.; American Meteorological Society: Boston, MA, USA, 2001; Volume 28, pp. 1–26. [Google Scholar] [CrossRef]
  29. Surowiecki, A.; Taszarek, M. A 10-Year Radar-Based Climatology of Mesoscale Convective System Archetypes and Derechos in Poland. Mon. Weather Rev. 2020, 148, 3253–3273. [Google Scholar] [CrossRef]
  30. Maddox, R.A. Mesoscale Convective Complexes. Bull. Am. Meteorol. Soc. 1980, 61, 1374–1387. [Google Scholar] [CrossRef]
  31. Houze, R.A. Mesoscale Convective Systems. Rev. Geophys. 2004, 42, RG4003. [Google Scholar] [CrossRef]
  32. Loglisci, N.; Boni, G.; Cauteruccio, A.; Faccini, F.; Milelli, M.; Paliaga, G.; Parodi, A. The role of citizen science in assessing the spatiotemporal pattern of rainfall events in urban areas: A case study in the city of Genoa, Italy. Nat. Hazards Earth Syst. Sci. 2024, 24, 2495–2510. [Google Scholar] [CrossRef]
  33. Esbrí, L.; Rigo, T.; Llasat, M.; Aznar, B. Identifying Storm Hotspots and the Most Unsettled Areas in Barcelona by Analysing Significant Rainfall Episodes from 2013 to 2018. Water 2021, 13, 1730. [Google Scholar] [CrossRef]
  34. Chen, Y.; Zhang, S.; Wang, H.; Chen, D.; Liu, J. Human-Induced Climate Change Intensifies Extreme Precipitation Events in Central China’s Urban Areas. Geophys. Res. Lett. 2025, 51, e2024GL111818. [Google Scholar] [CrossRef]
  35. Pilguj, N.; Surowiecki, A.; Szuster, P.; Duniec, G.; Figurski, M. Opady Nawalne w Zamościu i Okolicach (21.08.2024). IMGW-PIB, Centrum Modelowania Meteorologicznego. 2024. Available online: https://modele.imgw.pl/?p=42513 (accessed on 7 July 2025).
  36. Torelló-Sentelles, H.; Marra, F.; Koukoula, M.; Villarini, G.; Peleg, N. Intensification and Changing Spatial Extent of Heavy Rainfall in Urban Areas. Earth’s Future 2024, 12, e2024EF004505. [Google Scholar] [CrossRef]
  37. Łupikasza, E. Spatial and temporal variability of extreme precipitation in Poland in the period 1951–2006. Int. J. Climatol. 2010, 30, 991–1007. [Google Scholar] [CrossRef]
  38. Lehmkuhl, F.; Schüttrumpf, H.; Schwarzbauer, J.; Brüll, C.; Dietze, M.; Letmathe, P.; Völker, C.; Hollert, H. Assessment of the 2021 summer flood in Central Europe. Environ. Sci. Eur. 2022, 34, 107. [Google Scholar] [CrossRef]
  39. Ulbrich, U.; Brücher, T.; Fink, A.H.; Leckebusch, G.C.; Krüger, A.; Pinto, J.G. The Central European floods of August 2002. Weather 2003, 58, 371–377. [Google Scholar] [CrossRef]
  40. Delrieu, G.; Nicol, J.; Yates, E.; Kirstetter, P.E.; Creutin, J.D.; Anquetin, S.; Obled, C. The catastrophic flash-flood event of 8–9 September 2002 in the Gard region, France. J. Hydrometeorol. 2005, 6, 34–52. [Google Scholar] [CrossRef]
  41. Amengual, A. Hydrometeorological analysis of the 12 and 13 September 2019 widespread flash flooding in eastern Spain. Nat. Hazards Earth Syst. Sci. 2022, 22, 1159–1179. [Google Scholar] [CrossRef]
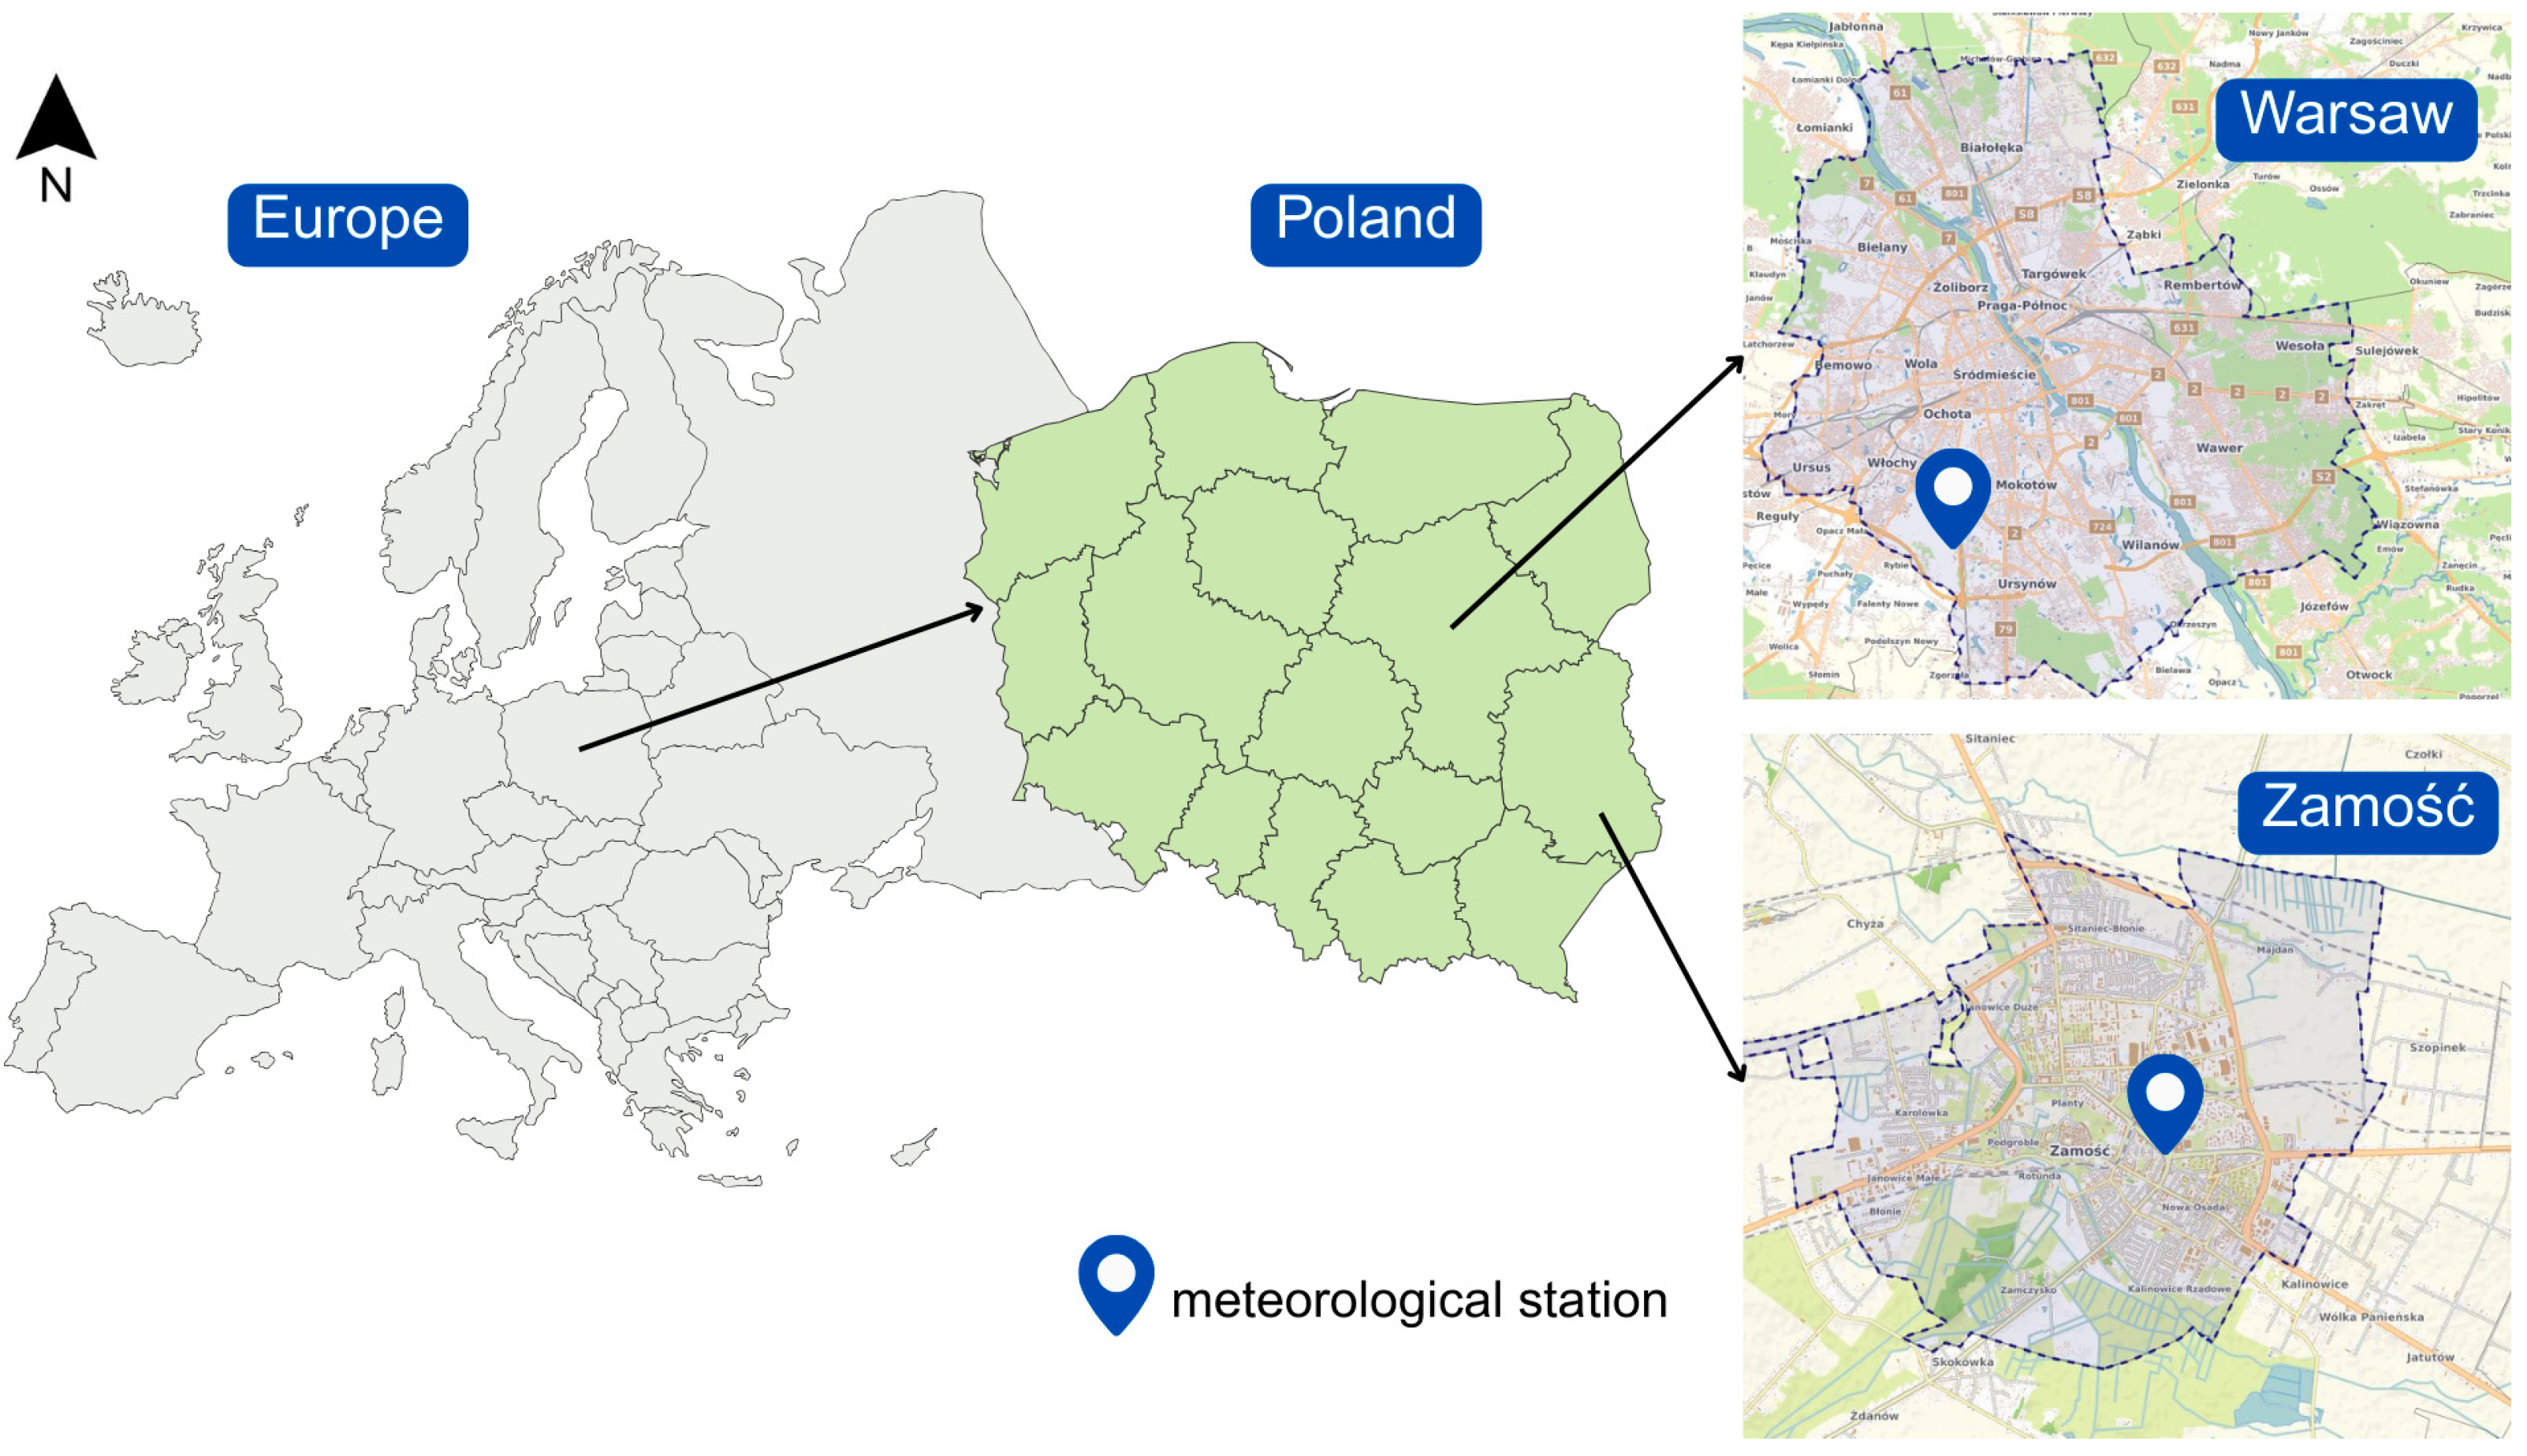
Figure 1. Geographical location of the study areas: Warsaw (central Poland) and Zamość (southeastern Poland), and location of meteorological stations.
Water 17 02671 g001
Figure 2. Synoptic analysis for 19 August 2024 at 12:00 UTC. Data source: Institute of Meteorology and Water Management—National Research Institute (IMGW-PIB).
Water 17 02671 g002
Figure 3. Distribution of selected meteorological parameters from the ALARO model run initialized at 00 UTC on 19 August 2024: (a) Forecast thermodynamic diagram for Warsaw (EPWA) valid for 18 UTC, illustrating atmospheric instability and vertical moisture structure; (b) Composite field of Convective Available Potential Energy (CAPE) and 0–6 km vertical wind shear (SHEAR), indicating zones of moderate instability and weak-to-moderate shear conducive to multicellular convection; (c) Total Precipitable Water (TPW), showing a deeply saturated troposphere over central Poland with local maxima exceeding 40 mm; (d) Simulated 3 h accumulated precipitation for the 15:00–18:00 UTC interval, highlighting a localized precipitation core near Warsaw. Data source: Institute of Meteorology and Water Management—National Research Institute (IMGW-PIB).
Water 17 02671 g003
Figure 4. Satellite image (MSG) from 19 August 2024, 12:00 UTC, showing extensive cloud development over central Poland ahead of the convective outbreak. Cloud-top temperatures reached as low as −63 °C, indicating deep convective activity. Satellite data were obtained from the Rapidly Developing Thunderstorms (RDT) product, produced using the NWC-SAF Geo v2018.1 software package based on MSG (Meteosat Second Generation) imagery, and provided by EUMETSAT.
Water 17 02671 g004
Figure 5. Minute-by-minute rainfall accumulation at Warsaw-Okęcie on 19 August 2024, derived from high-resolution automatic rain gauge data. The chart illustrates the short-term intensity profile of the convective event.
Water 17 02671 g005
Figure 6. Synoptic analysis for 21 August 2024 at 12:00 UTC. Data source: Institute of Meteorology and Water Management—National Research Institute (IMGW-PIB).
Water 17 02671 g006
Figure 7. Distribution of selected meteorological parameters from the ALARO model run initialized at 00 UTC on 21 August 2024: (a) Forecast thermodynamic diagram for Zamość valid for 18 UTC, illustrating atmospheric instability and vertical moisture structure; (b) Composite field of Convective Available Potential Energy (CAPE) and 0–6 km vertical wind shear (SHEAR), indicating zones of moderate instability and weak-to-moderate shear conducive to multicellular convection; (c) Total Precipitable Water (TPW), showing a deeply saturated troposphere over central Poland with local maxima exceeding 40 mm; (d) Simulated 3 h accumulated precipitation for the 15:00–18:00 UTC interval, highlighting a localized precipitation SE Poland—close to Zamość region. Data source: Institute of Meteorology and Water Management—National Research Institute (IMGW-PIB).
Water 17 02671 g007
Figure 8. Rapidly Developing Thunderstorms (RDT) product for 21 August 2024, 16:00 UTC, showing an intensifying convective core over the Zamość area. Satellite data were obtained from the Rapidly Developing Thunderstorms (RDT) product, produced using the NWC-SAF Geo v2018.1 software package based on MSG (Meteosat Second Generation) imagery, and provided by EUMETSAT.
Water 17 02671 g008
Figure 9. Ten-minute rainfall accumulation in Zamość on 21 August 2024, based on automatic rain gauge data. The peak value of 19.5 mm corresponds to an intensity of ~117 mm/h. Data source: Institute of Meteorology and Water Management—National Research Institute (IMGW-PIB).
Water 17 02671 g009
Figure 10. One-minute rainfall intensity in Zamość on 21 August 2024, showing peak values exceeding 2.5 mm/min (~150 mm/h) between 15:20 and 15:35 UTC. Data from the automatic rain gauge network. Data source: Institute of Meteorology and Water Management—National Research Institute (IMGW-PIB).
Water 17 02671 g010
Figure 11. Composite radar reflectivity from the POLRAD network on 19 August 2024 from 11:53 UTC to 12:03 UTC, showing a high-intensity convective cell over the Warsaw region. The reflectivity cores indicate strong precipitation intensity and a vertically developed storm column. Data provided by the Institute of Meteorology and Water Management—National Research Institute (IMGW-PIB), radar site in Legionowo.
Water 17 02671 g011
Figure 12. Radar scan from the Rzeszów radar station on 21 August 2024 from 15:48 to 16:03 UTC, capturing a nearly stationary convective system over Zamość. Persistent high reflectivity suggests sustained updrafts and back-building behavior conducive to extreme local rainfall. Data provided by the Institute of Meteorology and Water Management—National Research Institute (IMGW-PIB), radar site in Rzeszów.
Water 17 02671 g012
Table 1. Overview of datasets used in this study, including spatial resolution and data sources.
DatasetsSourceSpatial ResolutionNotes
Rain gauge dataIMGW-PIBPoint (station)Okęcie, Zamość
Radar data (POLRAD)IMGW-PIB1 kmCMAX product
Satellite imageryEUMETSAT~1–5 kmIR channels
Alaro modelIMGW_PIB4 km60 vertical levels
Note: No field measurements were conducted for this study. All analyses were based on archived observational and remote-sensing datasets.
Table 2. Selected thresholds of rainfall intensity based on the Chomicz α index, showing efficiency levels, symbolic grades, and indicative 10 min and hourly precipitation rates.
Rainfall Efficiency Index (α)Rain Type and Severity ClassificationLetter Code
4.01–5.65heavy rainfallIVA4
5.66–8.00torrential precipitationVB1
8.01–11.30torrential precipitationVIB2
11.31–16.00torrential precipitationVIIB3
16.01–22.61torrential precipitationVIIIB4
22.62–32.00torrential precipitationIXB5
32.01–45.23torrential precipitationXB6
Note: Source: Own elaboration based on the Chomicz rainfall index.
Table 3. Summary of rainfall intensity indicators for the Warsaw (19 August) and Zamość (21 August) convective events.
ParameterWarsaw 19 August 2024Zamość 21 August 2024
Total even duration17 min (main core)73 min (intense phase)
Max 1 min rainfall rate 3.5 mm/min>2.5 mm/min
Peak interval total32 mm in 17 min105.1 in 73 min
α-index (peak interval)8.212.3
Chomicz classificationB2 (2nd-degree torrential)B3 (3rd—degree torrential)
Convective organizationMulticellular, LinearBack Building Training System
Disclaimer/Publisher’s Note: The statements, opinions and data contained in all publications are solely those of the individual author(s) and contributor(s) and not of MDPI and/or the editor(s). MDPI and/or the editor(s) disclaim responsibility for any injury to people or property resulting from any ideas, methods, instructions or products referred to in the content.