Article

Coupling of SWAT and WEAP Models for Quantifying Water Supply, Demand and Balance Under Dual Impacts of Climate Change and Socio-Economic Development: A Case Study from Cauto River Basin, Cuba

1
Water Resources Institute, No. 8 Phao Dai Lang, Dong Da, Hanoi 10000, Vietnam
2
Granma Provincial Delegation of Hydraulics Resources, Amdo Estévez s/n, Bayamo Granma 85100, Cuba
*
Author to whom correspondence should be addressed.
Water 2025, 17(18), 2672; https://doi.org/10.3390/w17182672
Submission received: 17 April 2024 / Revised: 12 May 2024 / Accepted: 18 May 2024 / Published: 10 September 2025

Abstract

The Cauto River Basin (CRB), the heartland of Cuban agriculture, has been hit hard by drought and water shortages. In response to this pressing issue, this study provides a comprehensive assessment of the water supply, demand and balance within the Cauto River Basin, considering the baseline and projected socio-economic and climatic conditions by coupling SWAT and WEAP models. The obtained results revealed that the annual flow in the CRB is projected to slightly decrease (2.5%), in which, the reduction in the rainy season (3.1%) will be higher than that in the dry season (1.3%). The total water demand in the baseline scenario is around 1.194 billion m3, dominated by agriculture (96%), with rice crops requiring nearly half. For the future scenario of 2050, the study showed a 16.6% surge in demand to 1.394 billion m3, driven by climate change and agricultural expansion. However, domestic use will decrease by 10% due to population reduction. The water deficit in the future is projected to increase by 52% from 172.4 to 262.7 million m3 due to a rising water demand and declining water supply. This study shows that integrating a hydrological model into a water allocation model is a promising approach to estimate the water supply, demand and balance, which is a crucial component of water resources management.

1. Introduction

With many regions of the world experiencing water shortages, ensuring the availability and sustainability water resources for all has become a global concern [1,2]. Climate change, compounded by the pressures of a higher water demand for socio-economic development, has made WRM more important, especially for island countries that are frequently exposed to water stress due to their lack of a water storage capability [3]. As an island country in the Caribbean Sea, Cuba has been experiencing the tangible effects of this dual burden. Recent studies on climate change in Cuba showed that the incidence of prolonged and severe droughts has escalated, threatening the livelihood of local people, and the prosperity and stability of Cuba [4]. While Cuba lacks financial resources to implement structural solutions, WRM is considered the most cost-effective measure to cope with the water shortage under the impacts of climate change and socio-economic development [5].
The success of WRM strongly depends on the availability of data on both the water supply and demand sides [6]. On the supply side, hydrological models were extensively utilized to assess the impacts of climate change on hydrological regimes and streamflow. The Soil and Water Assessment Tool (SWAT) is one of the most popular hydrological models for its capability to facilitate the computation of various physical processes of the water cycle in a river basin, including runoff, evapotranspiration, groundwater recharge, streamflow, etc., which are essential for evaluating the effects of present and future climatic variations and land use changes with only a few parameters [7,8]. However, the use of the SWAT model alone has proven to be insufficient for WRM because it is incapable of calculating the water demand and allocation. For the quantification of the water demand and allocation, several researchers employed the Water Evaluation and Planning (WEAP) model. This model enables the allocation of the water supply to different water stakeholders including agricultural, industrial, domestic and environmental uses under multiple scenarios of water supply and demand management strategies [9,10]. However, like other water balance models, WEAP does not simulate the water supply side well due to the fact that it simplifies many hydrological processes such as evapotranspiration and surface–groundwater interactions, which are fully represented in SWAT. In this context, coupling these two models is expected to better serve WRM by leveraging SWAT’s exceptional capability to describe hydrological processes and WEAP’s proficiency in scenario-based water resources allocation [11,12]. This coupling approach has increasingly attracted the attention of various researchers in recent years. For example, it was used to compare different adaptive management strategies to mitigate the water shortage under the impacts of climate change in Chifeng City, China [13]. By combining these two models, the suitable solutions to ameliorate the water shortage in the study area was quantitatively evaluated and selected. It also supported the determination of the amount of water deficit due to irrigation, livestock and hydropower in the future in the upper Pangani River Basin [14]. Using this approach, the effects of urbanization, population growth, economic development, as well as climate change on the water balance in a tributary basin of Tonle Sap Lake in Cambodia were well quantified [15]. The impact assessment of climate change on water resources in the Dee River watershed of Wales was performed using the SWAT-MODFLOW-WEAP modeling system. The outputs of the integrated surface–groundwater model (SWAT-MODFLOW) were used as inputs for the WEAP model to calculate the balance between the water supply and demand [16]. The above successful applications have proven the effectiveness of the coupled SWAT-WEAP modeling approach and lays a solid foundation for this study.
The Cauto River Basin (CRB), the largest and the most important river basin in Cuba, supports the domestic and agricultural water needs of over one million inhabitants [17]. As a result of its low capability for water storage, despite receiving an average annual precipitation of 1200 mm, the basin has suffered from significant water deficits, adversely affecting both the health and socio-economic activities of the local people. In recent years, the river basin has undergone significant drought events due to the periodically recurring El Nino phenomenon and the long-term effects of global warming [18]. These droughts led to a reduction in the water supply and salinity intrusion, and therefore, diminished agricultural yields [17,18]. Consequently, quantifying the water availability and usage requirements as well as proposing a water allocation plan for better WRM in the CRB is an important task.
Although the CRB is an important river basin in Cuba, studies on its hydrological scheme and its response to climate change are very limited. So far, there has been no study that fully assesses the water supply, demand and balance in this river basin. Several studies attempted to apply a hydrologic model to simulate the streamflow in subbasins of the CRB, e.g., [19]. However, these studies simply performed the model calibration and validation without further assessing the future hydrological conditions. There was only one study that quantified the hydrological response to climate change in the CRB [17]. The authors employed SWAT to assess the impacts of climate change in the middle and upper parts of the basin under the RC-8.5 emission scenario. The obtained results showed that compared to the baseline period, the annual streamflow decreased by up to 61%. However, this study did not consider the impacts of climate change on the water resources in the entire CRB and the water demand and balance were not mentioned.
Due to the need for an integrated modeling tool for WRM in the CRB, this study coupled the SWAT and WEAP models to quantify the water supply, demand and its balance. While SWAT simulates the hydrological processes and estimates the water supply, WEAP calculates the water demand of stakeholders and then proposes a suitable allocation plan of the water supply for these stakeholders. Afterward, the water balance between the water demand and supply is determined to analyze the water shortage conditions in time and space across the CRB. The coupling of SWAT-WEAP allows for both hydrological process and water management evaluations, fulfilling the socio-economic development and climate change requisites, which include population growth, increased agricultural land and the overarching effects of climate change.

2. Materials and Methods

2.1. Study Area

The CRB originates from the Sierra Maestra Mountain at an altitude of approximately 760 m above sea level. It traverses nearly 370 km in the east and southeast directions through the provinces of Granma, Holguin, Santiago de Cuba and Las Tunas before entering the Caribbean Sea. The main tributaries of the CRB consist of the Bayamo, Cautillo, Contramaestre and Salado rivers (Figure 1). Located at a seasonally humid climate with maritime influence, the basin has an air temperature ranging from 18 to 25 °C and receives an average precipitation of around 1200 mm/year. The wet season lasts for six months (from May to October) and accounts for more than 70% of the annual precipitation. Encompassing an area of 9540 km2, which constitutes about 8% of Cuba’s area, the CRB is home to 10% of the Cuban population. The basin is the main agricultural producer and plays a crucial role in food security in Cuba [18]. In order to hold and supply water, seven reservoirs were constructed in the basin (Figure 1). These structures work as the water supply points that distribute water resources for different stakeholders in the basin through the irrigation system.

2.2. Methods

2.2.1. General Framework

In order to evaluate the water supply, demand and balance in the CRB under the impacts of climate change and socio-economic development, this study developed an assessment scheme based on the coupling of SWAT and WEAP, as shown in Figure 2. The scheme consists of three parts, namely, water supply calculation, water demand and balance calculation, and impact assessment of climate change and socio-economic development. The water supply calculation part uses the SWAT model to simulate the hydrological processes and compute the water supply generated from rainfall. The water demand and balance calculation part employs the WEAP model to quantify the water demand of water-consuming stakeholders and allocates the water supply estimated from the SWAT model for these stakeholders. The balance between the water supply and demand is calculated to determine which stakeholders suffered from water shortage. The third part is responsible for assessing the impacts of climate change and socio-economic development on the water supply, demand and balance. While climate change influences the water supply via the changing rainfall and increasing temperatures that are the two main weather inputs to the SWAT model, it increases the water demand via the increasing temperatures. The socio-economic development, which includes modifications to the population and agricultural sectors, is assumed to only influence the water demand. Changes in the water supply and demand ultimately affect the water balance. To assess the spatial variation in the water supply, demand and balance, the CRB was divided into various water-consuming zones and the above-mentioned scheme was used for each zone. Details of this scheme are presented below.

2.2.2. Water Supply Calculation

The water supply was calculated using the SWAT model to leverage its refined simulations of hydrological processes. The model’s capability in examining the long-term effects of climatic and land use changes has been validated by numerous studies, demonstrating its robust applicability in assessing and projecting water resources in different regions of the world [20]. The model is based on the basic water balance equation:
SW total = SW 0 + t 1 t   R d Q s E a W seep Q w
in which, SWtotal is the total soil water content, SW0 is the initial soil water content, t is the time in days, Rd is the daily precipitation, Qs is the surface runoff, Ea is the actual evapotranspiration, Wseep is the quantity of water seepage into the vadose zone on day t, and Qgw is the return flow on day t.
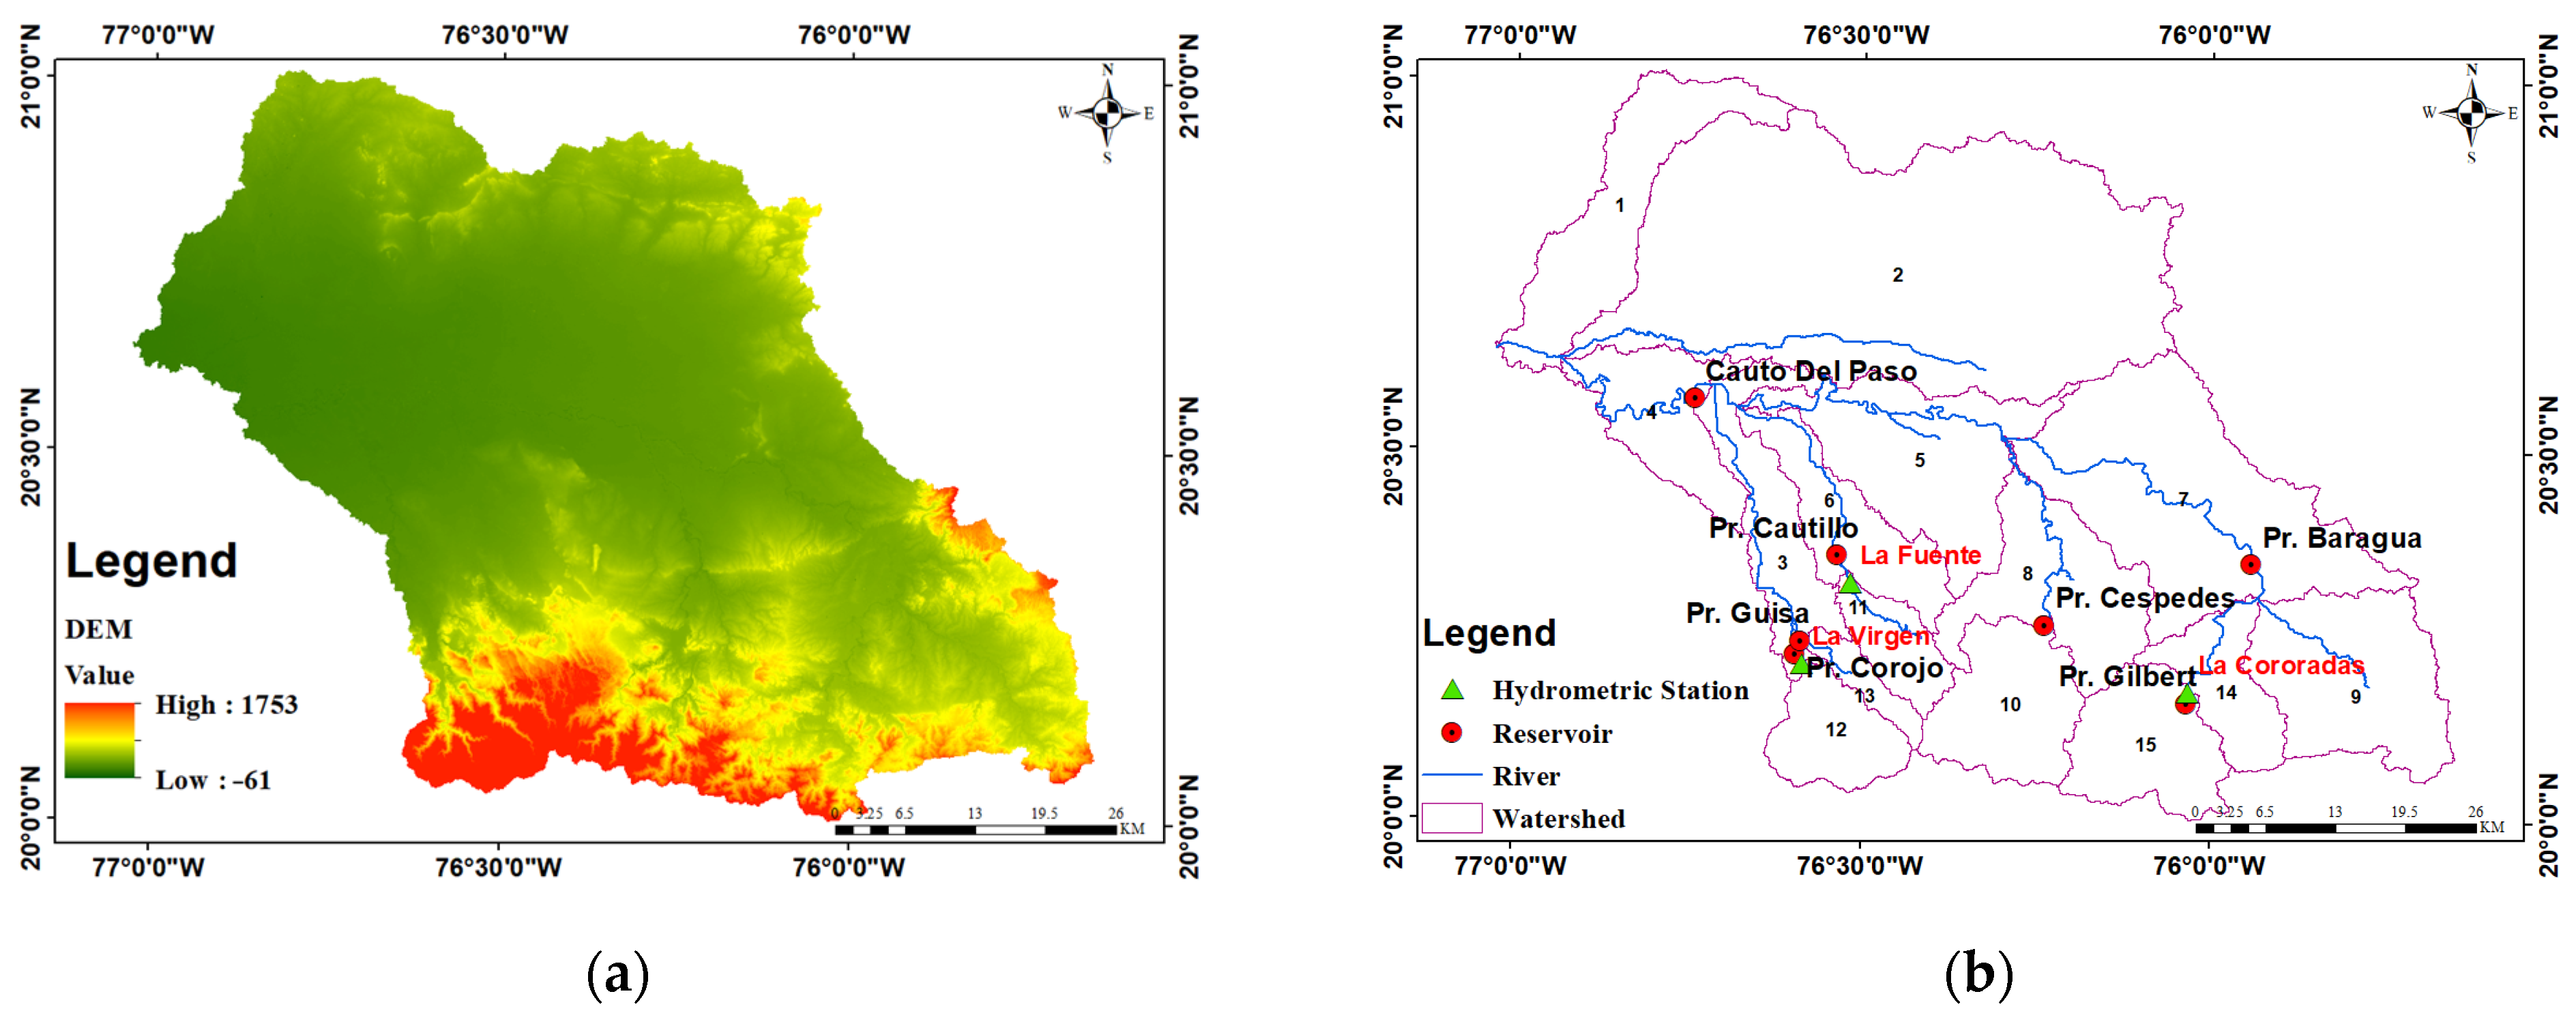
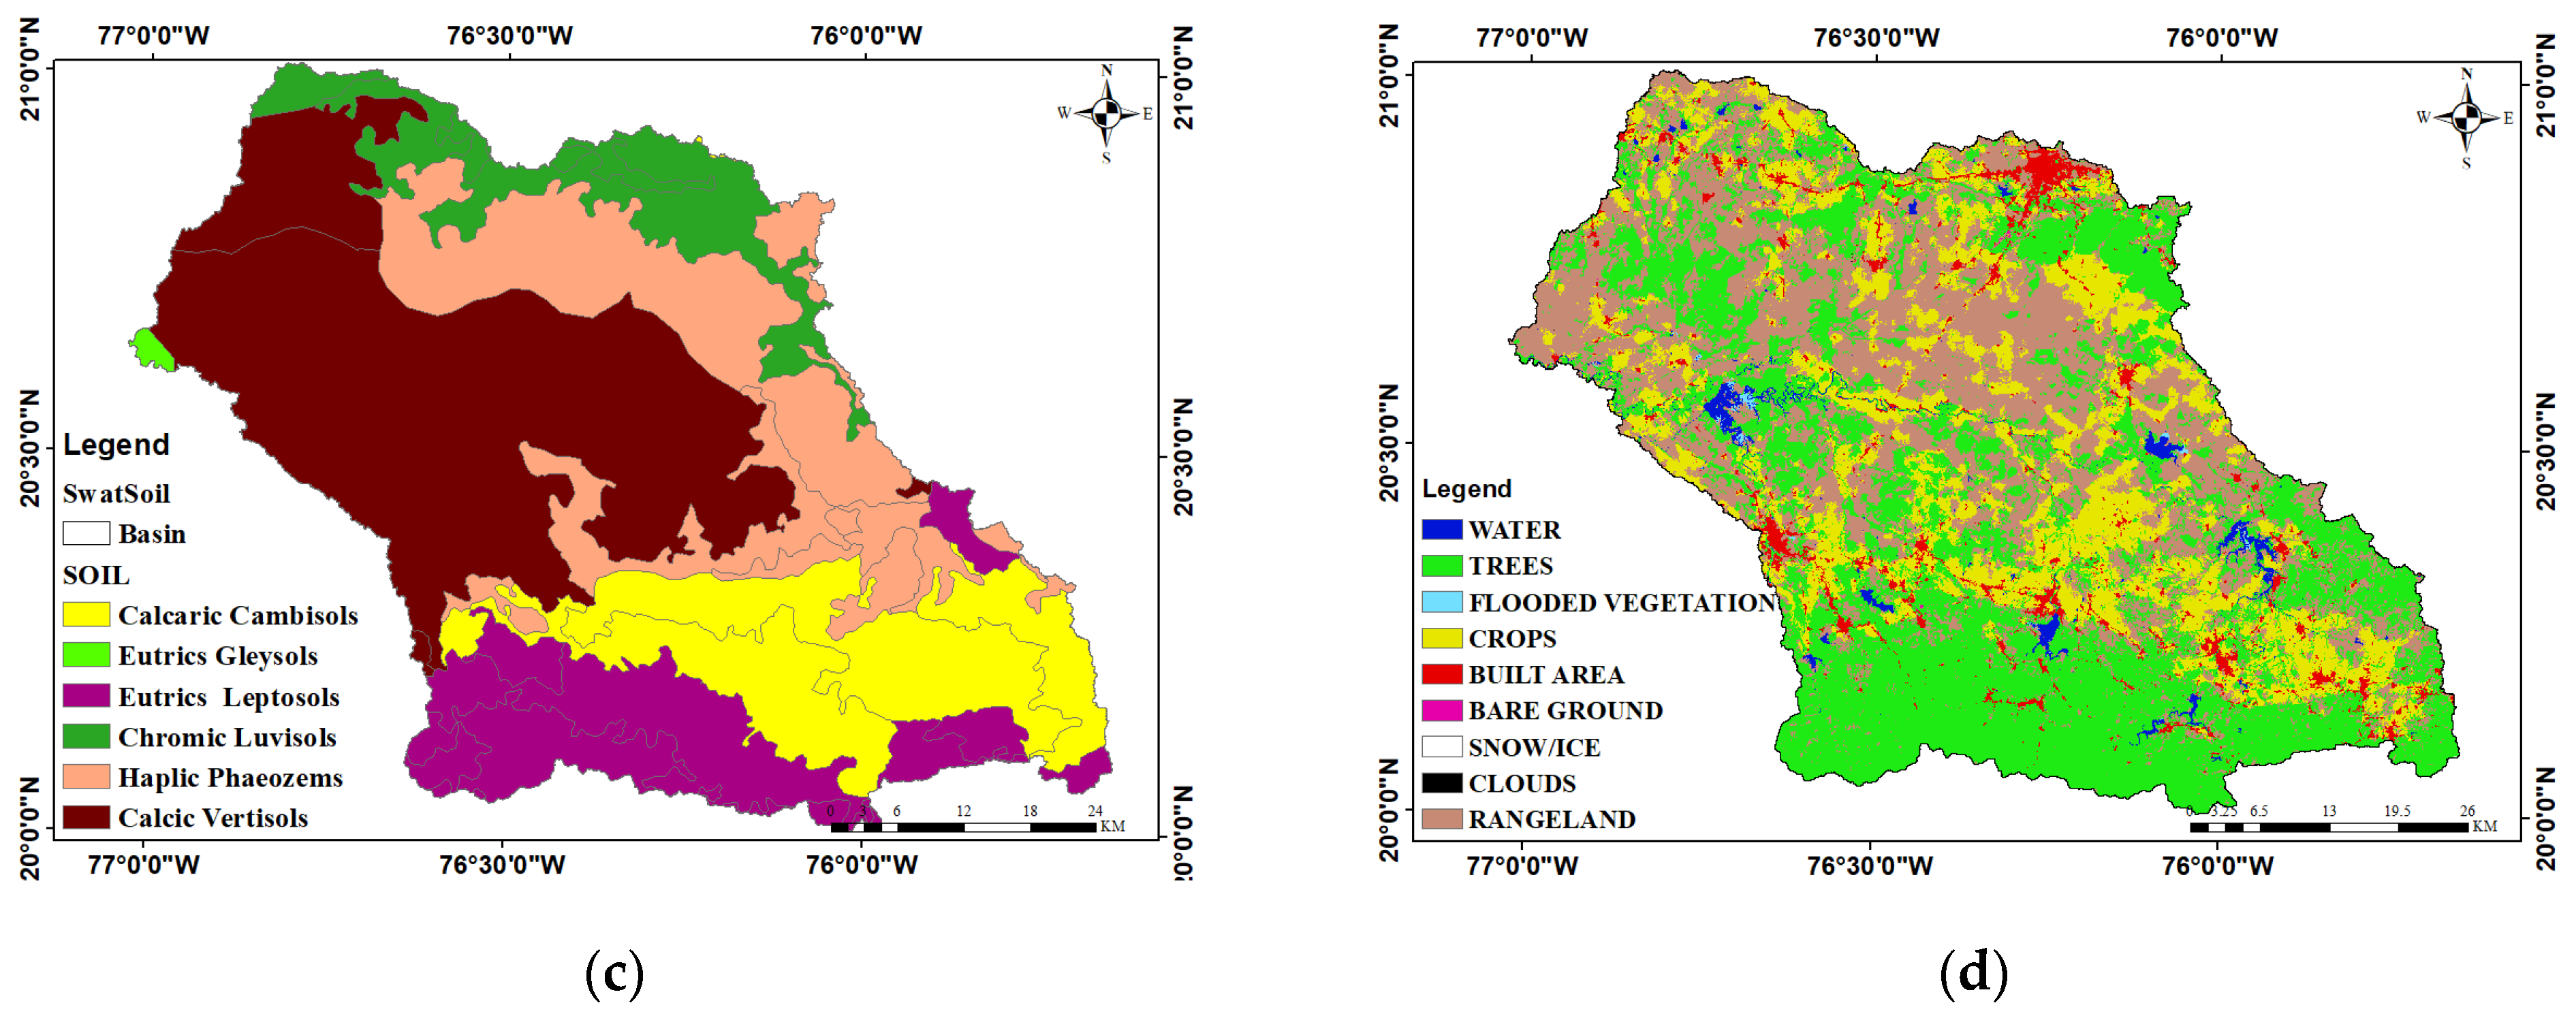
As shown in Table 1, the inputs to the SWAT model include the Digital Elevation Model (DEM), maps of land cover/land use and soil, and weather data. The DEM was obtained from the Digital Elevation Shuttle Radar Topography Mission (SRTM) with a resolution of 30 m (Figure 3a). The soil map was extracted from the SOTERLAC database (version 2) of the ISRIC—World Soil Information at a scale of 1:5,000,000 (Figure 3c). The land cover map was collected from the Environmental Systems Research Institute, Inc. (ESRI), which was generated from the European Space Agency (ESA) Sentinel-2 images at a 10 m resolution (Figure 3d). The weather data include daily precipitation and temperature. Due to the lack of gauged precipitation data in the CRB, the study used the CHIRPS precipitation, which is a global precipitation data source from the Climate Hazards Center (CHC) at UC Santa Barbara. The CHIRPS combines precipitation from five different satellite products, with more than 2000 ground monitoring stations for calibration [21]. Compared to the other global precipitation products, the CHIRPS precipitation has a higher spatial resolution (~5 km), which better describes the spatial variations in precipitation. These data are available from 1981 to present with a spatial area extending from 50° S to 50° N. In order to further improve the quality of the CHIRPS precipitation data, a previous study [22] calibrated this product with the monthly gauged precipitation at eight meteorological stations in the CRB using the Thiessen polygon-based method and linear least squares regression equations. After calibration, the discrepancy between the satellite and gauged precipitation significantly was reduced, with the Nash–Sutcliffe efficiency (NSE) increasing at all meteorological stations, ranging from 0.42 to 0.54. These calibrated CHIRPS data were used as a weather input to the SWAT model. Another important input for the SWAT model is the air temperature. These data were obtained from the National Aeronautics and Space Administration (NASA) via the POWER Data Access Viewer (https://power.larc.nasa.gov/data-access-viewer/ (accessed on 15 February 2023)). These temperature data are the Modern-Era Retrospective Analysis for Research and Applications, Version 2 (MERRA-2) with a spatial resolution of 0.5°. As the 1995–2014 period was chosen as the baseline period for assessing the impacts of climate change on the water supply, we collected both precipitation and temperature data in this period.
In order to simulate the hydrological scheme in the CRB, the SWAT model uses the DEM to generate a river network and subdivides the catchment into subbasins (Figure 3b). In turn, each subbasin can consist of one or more Hydrologic Response Units (HRUs) to represent the spatial heterogeneity within the subbasin. The HRUs are assumed to exhibit a similar hydrological response to the climate and are created by combining the soil type, land use and slope classes within each sub-basin. In order to simulate the hydrological scheme in the river basin, Equation (1) and its associated hydrological processes (i.e., evapotranspiration, infiltration, percolation and surface runoff) are first applied to each HRU. Then, flows from the HRUs are lumped to the sub-basin. Finally, the outflow from each sub-basin is routed to the river outlet through the river channels. In this study, the SWAT model was employed to simulate the hydrological processes in the CRB. Based on the locations of the reservoirs, irrigation areas and topographical characteristics, the entire basin was divided into 15 sub-basins, as shown in Figure 4b. The calibration and validation of this model was performed using the CHIRPS precipitation, MERRA-2 temperature and discharge at the La Virgen hydrological station (see Figure 3b), as was performed in a previous work [23]. While the calibration was automatically conducted in the 1 February 2020–3 April 2020 period using the SWAT-CUP tool [8], the validation was performed in the 1 April 2022–30 April 2022 period. The calibration results showed that there was a relatively good agreement between the modeled and observed discharges, with a correlation coefficient R2 = 0.76 and NSE = 0.66. At the validation stage, the R2 and NSE were, respectively, equal to 0.63 and 0.57. Refer to [23] for a more detailed description of this work. Although, due to uncertainties in the precipitation and temperature data, the correlations of the calibration and validation results were not high, its accuracy is acceptable for simulating the water supply in the CRB.

2.2.3. Water Demand and Balance Calculation

WEAP, developed by the Stockholm Environment Institute (SEI), is acclaimed for its operational flexibility and the versatility of its modeling framework [9,10]. WEAP constructs simulations for water exploitation and utilization systems, offering a customizable allocation of water resources to meet the diverse needs of various water users. The model has the ability to quickly and intuitively build scenarios, allowing for the analysis, comparison and extraction of results under different options of water allocation based on a user-friendly interface. A growing number of water professionals are finding WEAP to be an important modeling tool for water management and planning [10].
Based on the water-consuming sub-region areas provided by the Cuba National Institute of Hydraulic Resources (INRH), the water-consuming zones and water demand nodes for the CRB were defined. Accordingly, the basin includes 26 water use nodes across the 15 water-consuming zones that correspond with the 15 sub-basins in the SWAT model (Table 2 and Figure 4). The types of water demand nodes include rice crops, non-rice crops, livestock and domestic use. The water supply for these nodes was obtained from the SWAT outflows at the 15 sub-basins. Input data for the WEAP model include population, rice and non-rice cultivation areas, and livestock husbandry in the CRB. These data were collected from the 2022 statistical yearbook of the National Office for Establishment and Information of the Republic of Cuba, which were assembled for five sub-regions, as shown in Table 1. Once the data were collected and analyzed, the WEAP model used them to determine the water demand of stakeholders, and then allocated the water supply budget to these stakeholders based on the priority order set by users for each sub-basin.

2.2.4. Impact Assessment of Climate Change and Socio-Economic Development

In this study, the impacts of climate change on the water balance in the CRB were considered via the changes in precipitation and temperature. While both of these weather variables influence the water supply, only temperature influences the water demand via evapotranspiration. The socio-economic development was assumed to not affect the water supply but to impact the water demand via the changes in the population, agricultural area and livestock. Finally, the dual impacts of climate change and socio-economic development were analyzed by comparing the water supply, demand and balance of the baseline and future scenarios.

2.3. Climate Change and Socio-Economic Scenarios

2.3.1. Climate Change Scenarios

In order to assess the impacts of climate change, baseline and future scenarios were developed. For the climate conditions, the 1995–2014 period was selected as the baseline period. Temperature and precipitation data in this period were collected from the CHIRPS and MERRA-2 reanalysis, respectively. The 2040–2059 period centered in 2050 and the SSP2-4.5 (“middle of the road”) scenario were selected for the climate change projection. The projected precipitation and temperature data were obtained from the 6th phase of the Coupled Model Intercomparison Project (CMIP6), which is overseen by the World Climate Research Program and the data are available online at [24].
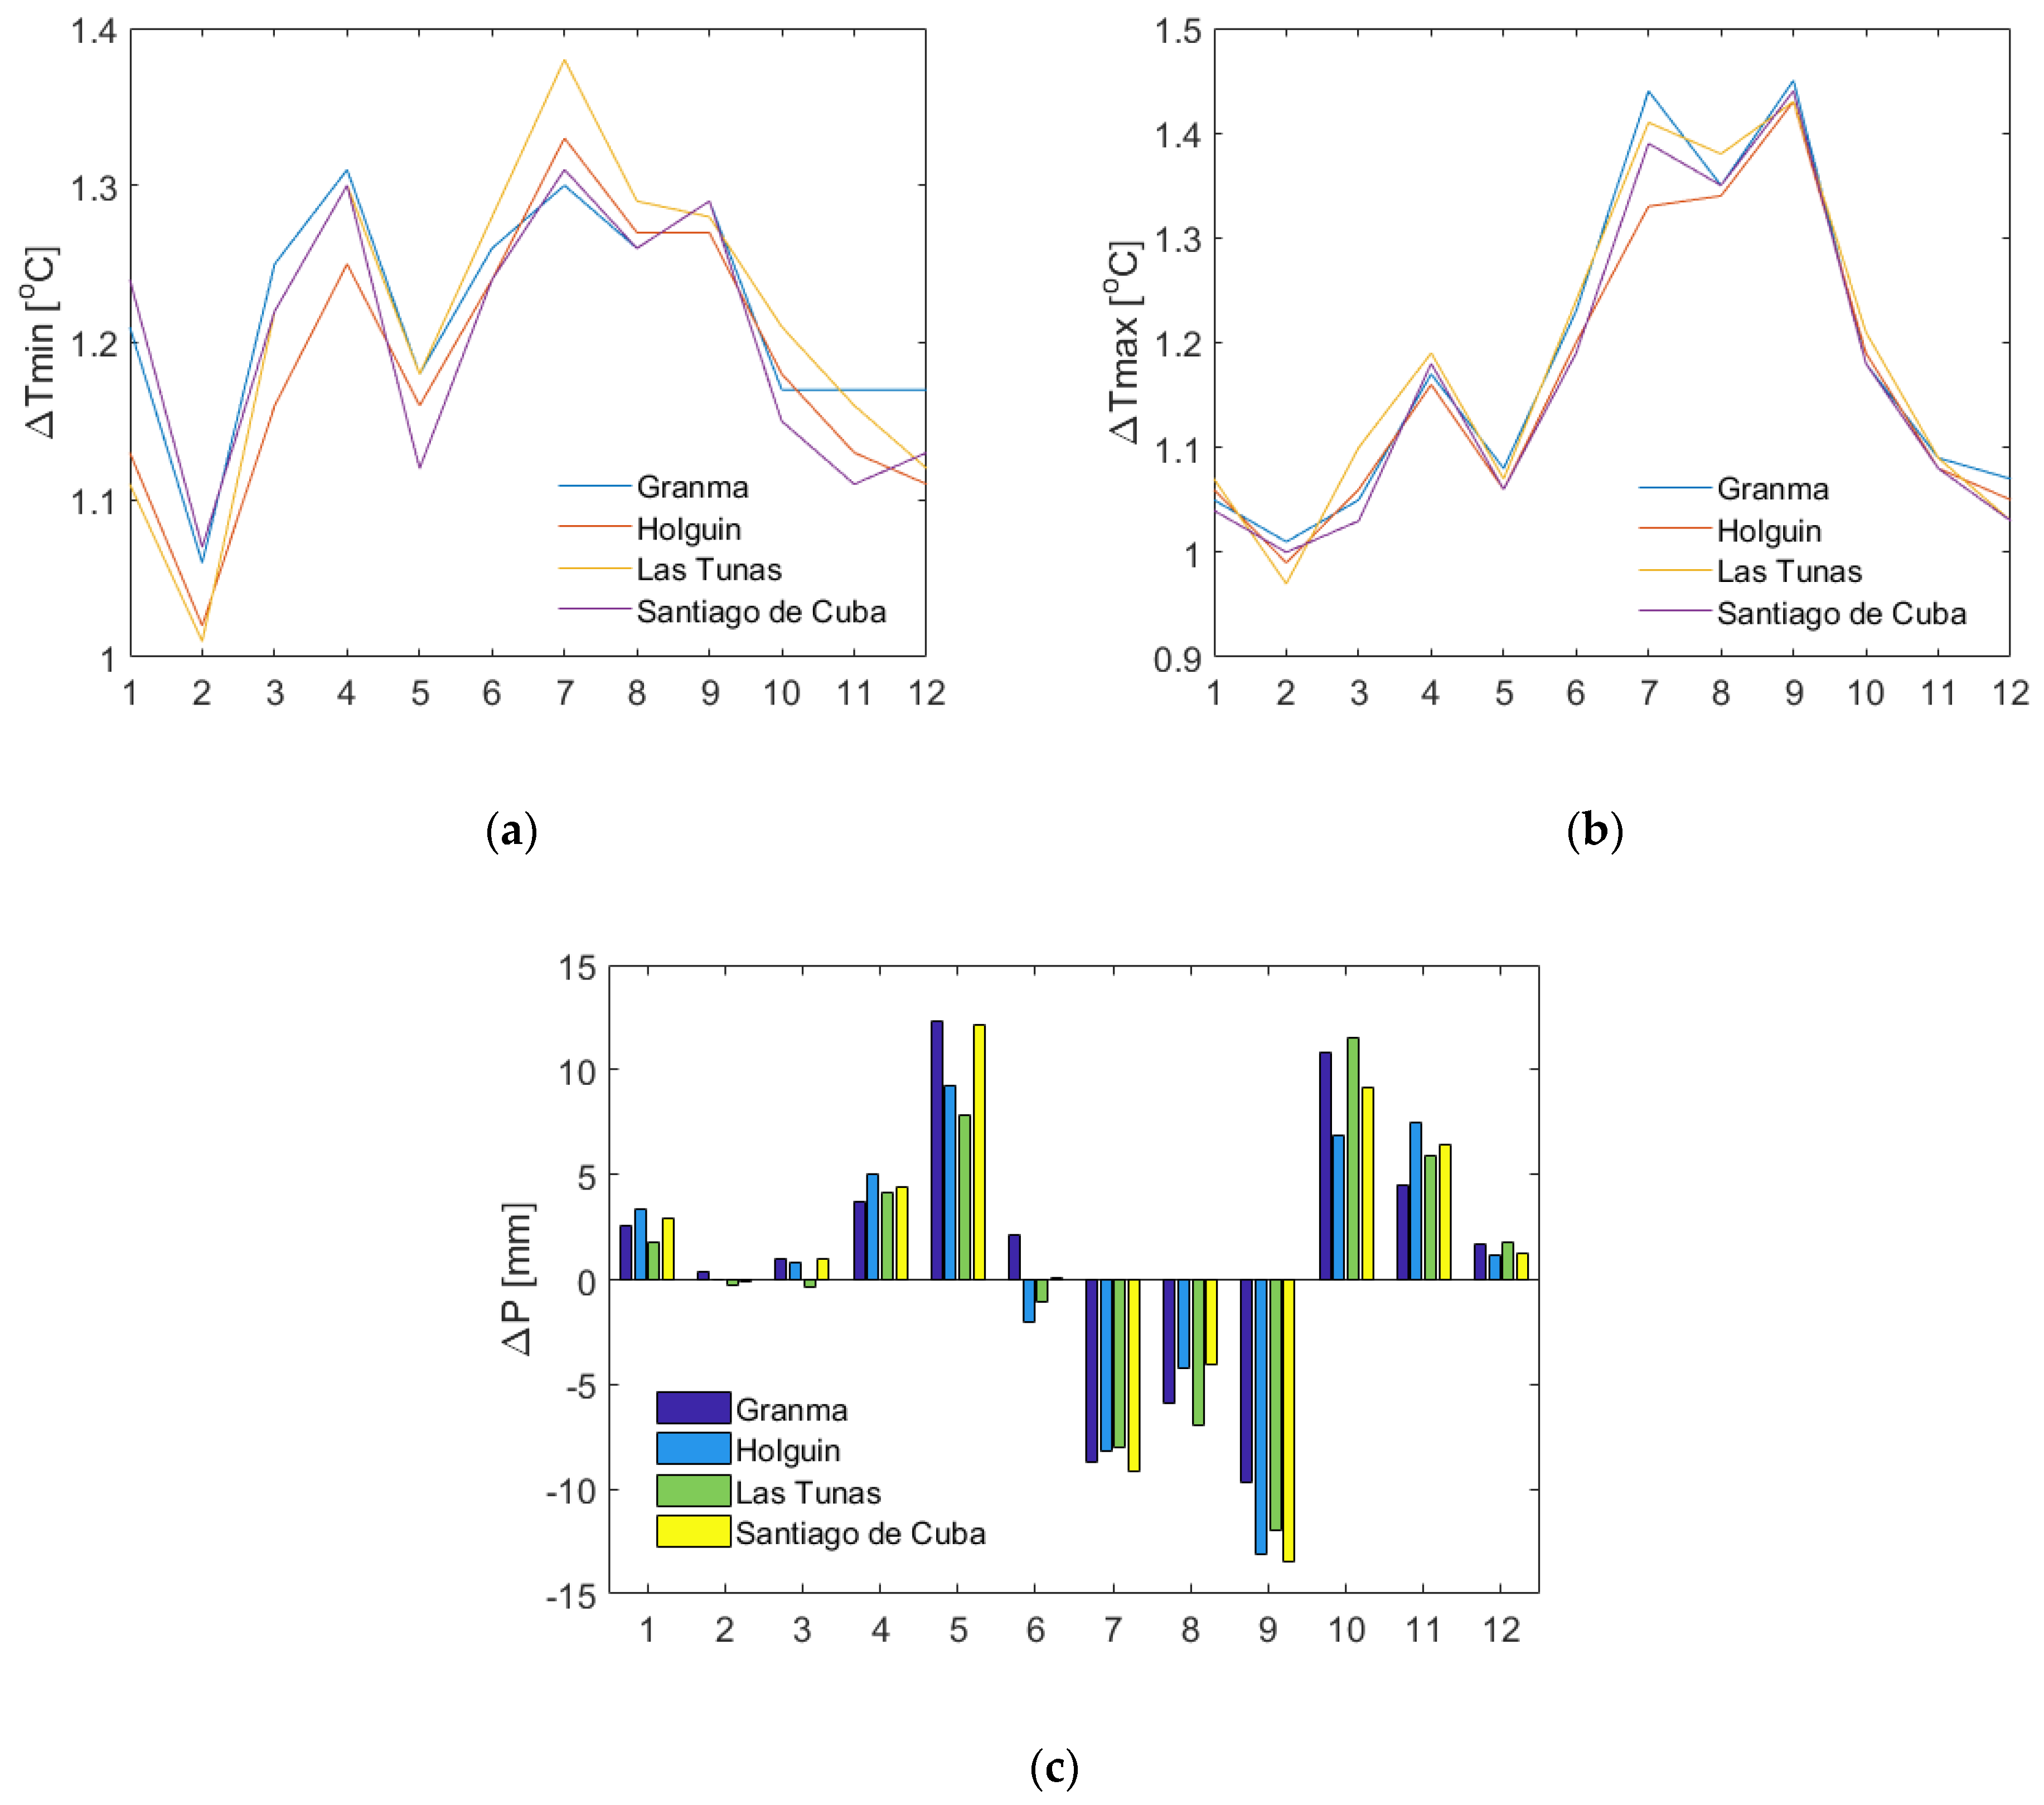
Figure 4 illustrates the monthly fluctuations in the maximum and minimum temperature and precipitation in Granma, Holguin, Las Tunas and Santiago de Cuba. The data revealed a consistent trend in temperature and precipitation changes across the four provinces. Generally, temperature increases from 1 to over 1.4 °C, in which, the summer months (July, August and September) exhibited higher rises than the winter months. The inter-provincial variation in temperature increase was minimal at under 0.1 °C, implying that the change in temperature is spatially homogeneous over the CRB. As for precipitation, a distinct seasonal pattern emerged: during the summer, precipitation diminishes, with September experiencing the most pronounced drop of 13.4 mm/month. Conversely, from October to April, precipitation raises, peaking in May and October, with an increase of up to 12.3 mm. The driest months, February and March, show negligible precipitation changes, ranging from −0.36 to +0.99 mm/month.

2.3.2. Socio-Economic Development Scenarios

The socio-economic development scenarios considered the changes in the population, livestock and agricultural areas (for rice and non-rice crops). The 2022 socio-economic state of Cuba was chosen as the baseline scenario. The demographic projections for Cuba for 2050 were obtained from the 2022 population outlook report of the United Nations [25]. The data indicated that in 2022, the Cuban population stood at 11,305,652 individuals in which, the CRB accounted for around 10%. It is predicted that there will be a gradual decline in the Cuban population over the coming decades. By the midpoint of the 21st century, the population is expected to reduce to 10,162,396, marking a 10% decrease compared to 2022. Since there is no population forecast for each locality in Cuba, the study assumed a population reduction rate in the CRB similar to that of Cuba as a whole (10% population decrease). The baseline agricultural area in the CRB was acquired from the 2022 statistical yearbook of the National Office for Establishment and Information of the Republic of Cuba. Meanwhile, the projected agricultural area was extracted from the report “Project to build a National Transport Master Plan in the Republic of Cuba” [26]. This report predicted an annual increase of 2.2% in agricultural area by 2030. In the absence of longer forecasts, the study assumed that the extent of agricultural land will stabilize post-2030, maintaining similar levels until 2050.

3. Results

3.1. Water Supply

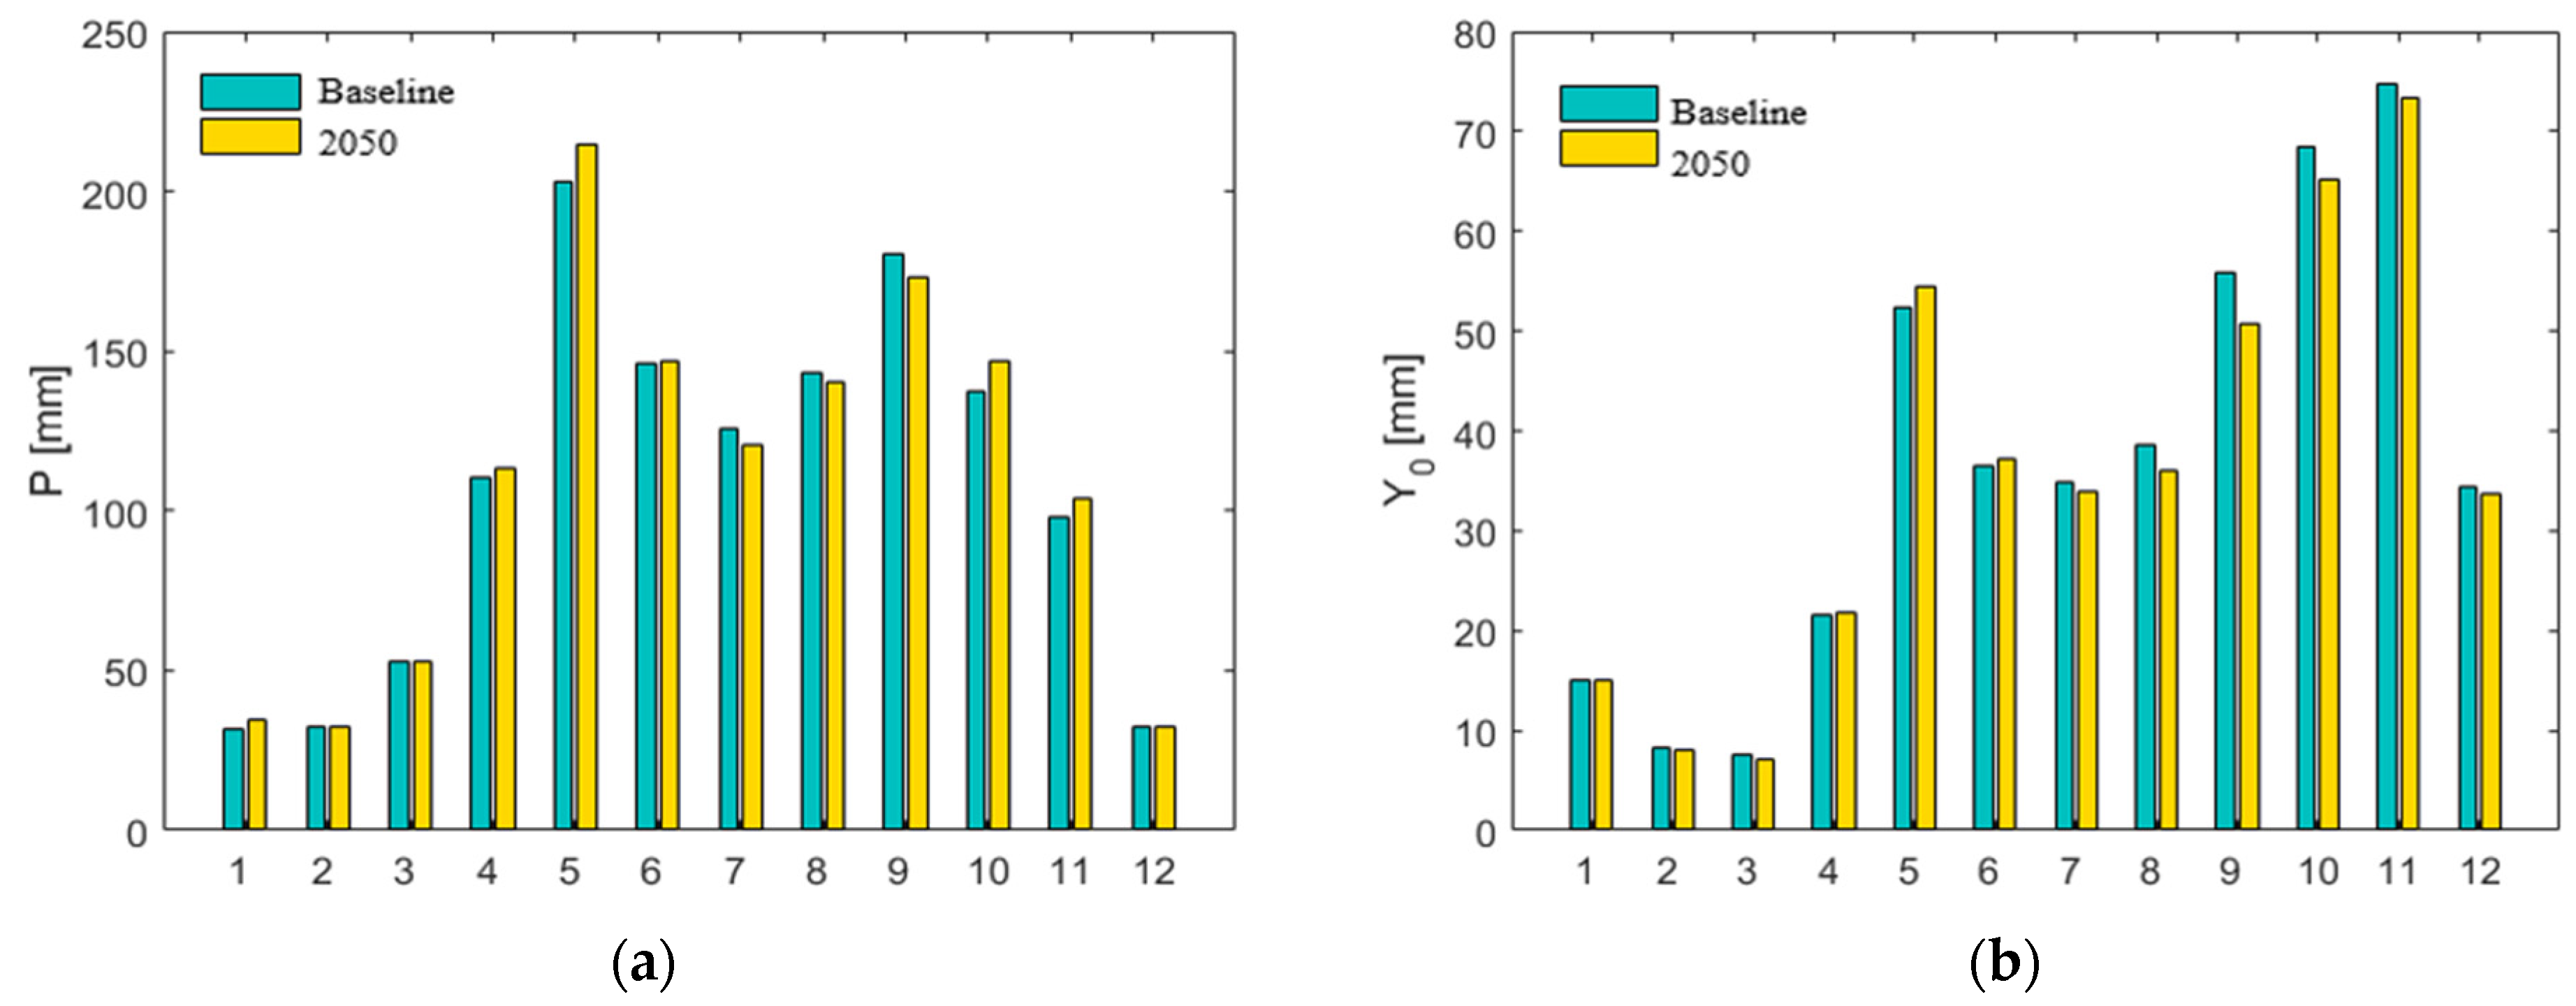
The water supply was estimated by performing hydrological simulation using the calibrated SWAT model during the baseline (1995–2014) and future period (2040–2059). Figure 5 compares the average monthly precipitation and flow from these two periods. The figure shows that the precipitation and flow followed similar annual patterns with two peaks. However, while the first peak occurs in the same month (in May), the second peak of precipitation (in September) arrives two months earlier than that of flow (in November). There are two reasons for this fact. Firstly, the evapotranspiration in September is much higher than that in November. Secondly, the antecedent condition in the CRB in November is much wetter than in September. As a result, although the precipitation in November is lower, the flow in this month is higher than that in September. These are also the reasons why the precipitation in February is the lowest but the flow in March is smallest. Figure 5 also shows that most of the precipitation and flow are concentrated in the wet season but the seasonal difference in flow is smaller than that of precipitation. While precipitation in the wet season accounted for up to 72% of the annual precipitation, the flow in this season occupies 64% because the evaporation in the dry season is considerably higher than in wet season and water in the wet season is kept in the reservoirs for the dry season (Figure 6).
As for the impacts of climate change, Figure 5 and Figure 6 show that compared to the baseline scenario, the flow in the CRB is projected to rise slightly (2.5%), although precipitation will increase by 1.5% because the evaporation will increase by 3.7%. The figures also present that while there is not much difference in evaporation between the wet and dry season, which is around 3.6–3.7%, precipitation will increase by 3.6% in the dry season and 1.5% in the wet season. As a result, the reduction in flow in the wet season (3.1%) will be higher than that in the dry season (1.3%). January will exhibit the largest increase in precipitation (9.7%), followed by October (6.9%) and May (5.9%), while the months from July to September will experience a decrease, ranging from 2.0 to 4.1%. As for flow, the future flow is predicted to increase in April, May and June, of which, May will exhibit the highest rate (4.0%). In the remaining months, the future flow will be reduced, with the strongest decrease in flow in September (9.3%). Finally, it is worth noting that climate change also influences the partitioning of precipitation into evapotranspiration and flow. Figure 6 shows that while the ratios of the annual evapotranspiration and flow to precipitation are, respectively, 62.9% and 34.6% in the baseline scenario, these numbers are 64.2% and 33.3% in the future scenario. This indicates that evapotranspiration significantly dominates the flow and this dominance tends to increase under the climate change impacts.

3.2. Water Demand

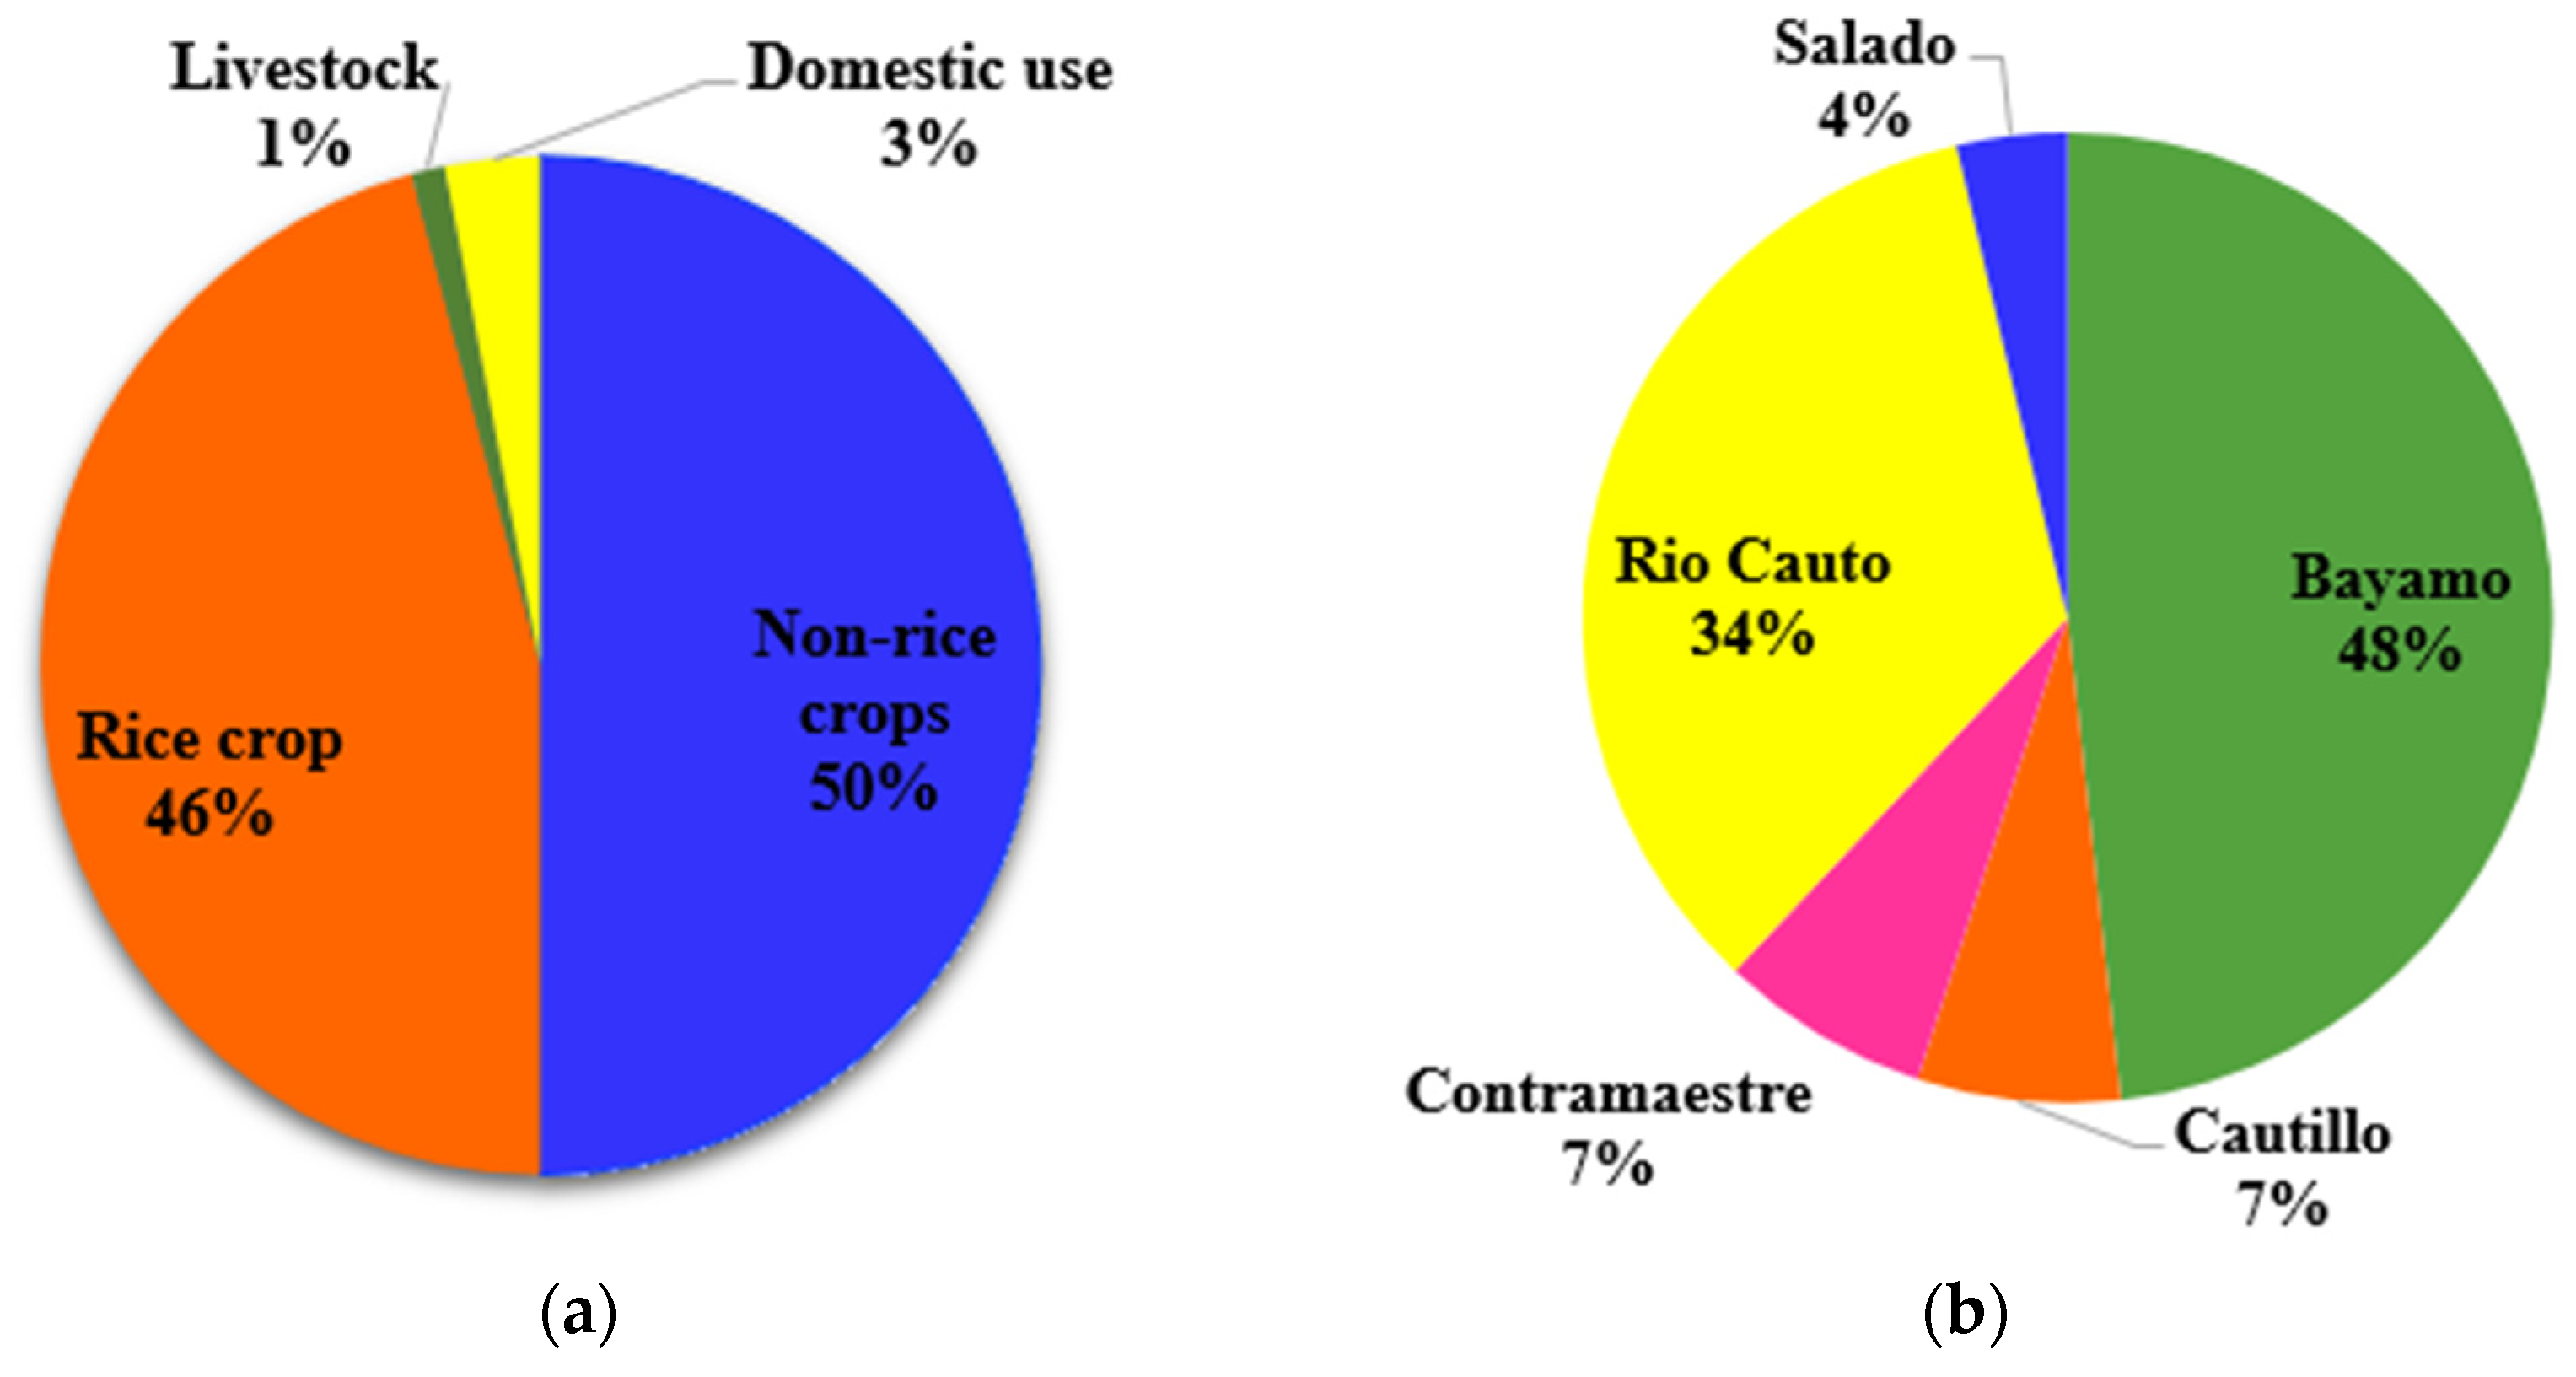
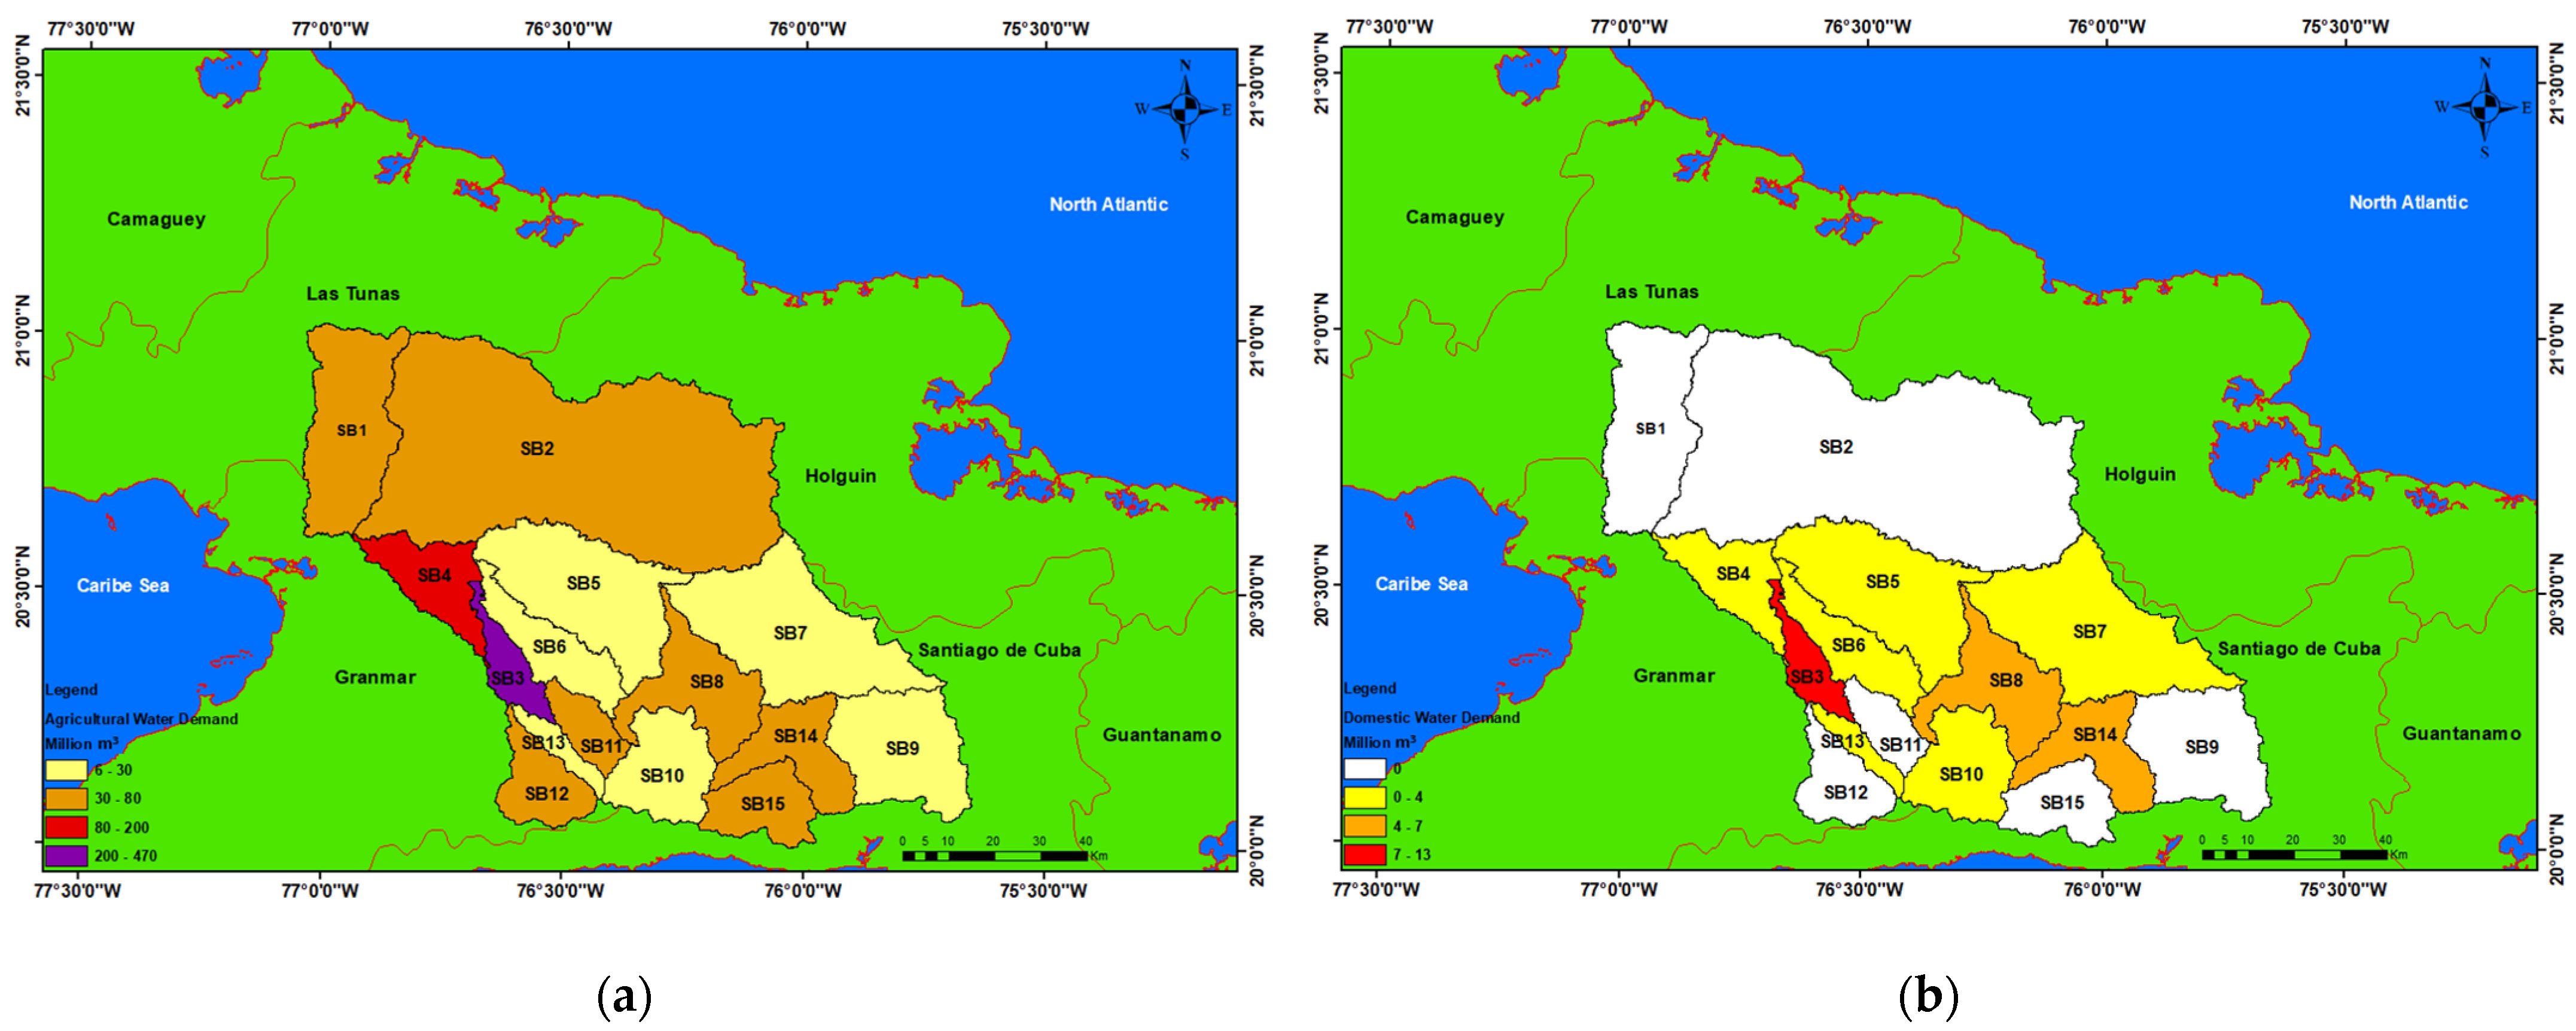
The monthly water demand was calculated using the WEAP model based on the water requirement of the domestic and agricultural (crops and livestock) sectors. The obtained results showed that total water demand for the CRB is around 1194 million m3, of which, agricultural crops (rice, corn, beans, sugarcane, potatoes and peanuts) account for most of the demand, accounting for up to 96%. Rice crops alone necessitate 46% of the total water demand and other non-rice crops require 50%. The water demand for livestock is comparatively minimal, representing only 1%, while the domestic consumption accounts for 3% (Figure 7a). The water demand by regions in the CRB is shown in Figure 7b and the maps of water demand for agriculture (crops and livestock) and domestic use are depicted in Figure 8. The figures show that the Bayamo region, including sub-basins SB3, SB12 and SB13, is the primary consumer, accounting for 48% of the water demand in the CRB, followed by the Rio Cauto region (SB1, SB4, SB5, SB7 and SB9) at 34% because these two regions are the main agricultural hubs of the basin. The remaining regions including Cautillo (SB6 and SB11), Contramaestre (SB8, SB10, SB14, SB15 and SB9), and Salado (SB2) each represents a smaller share of the total demand, ranging from 4% to 7%.
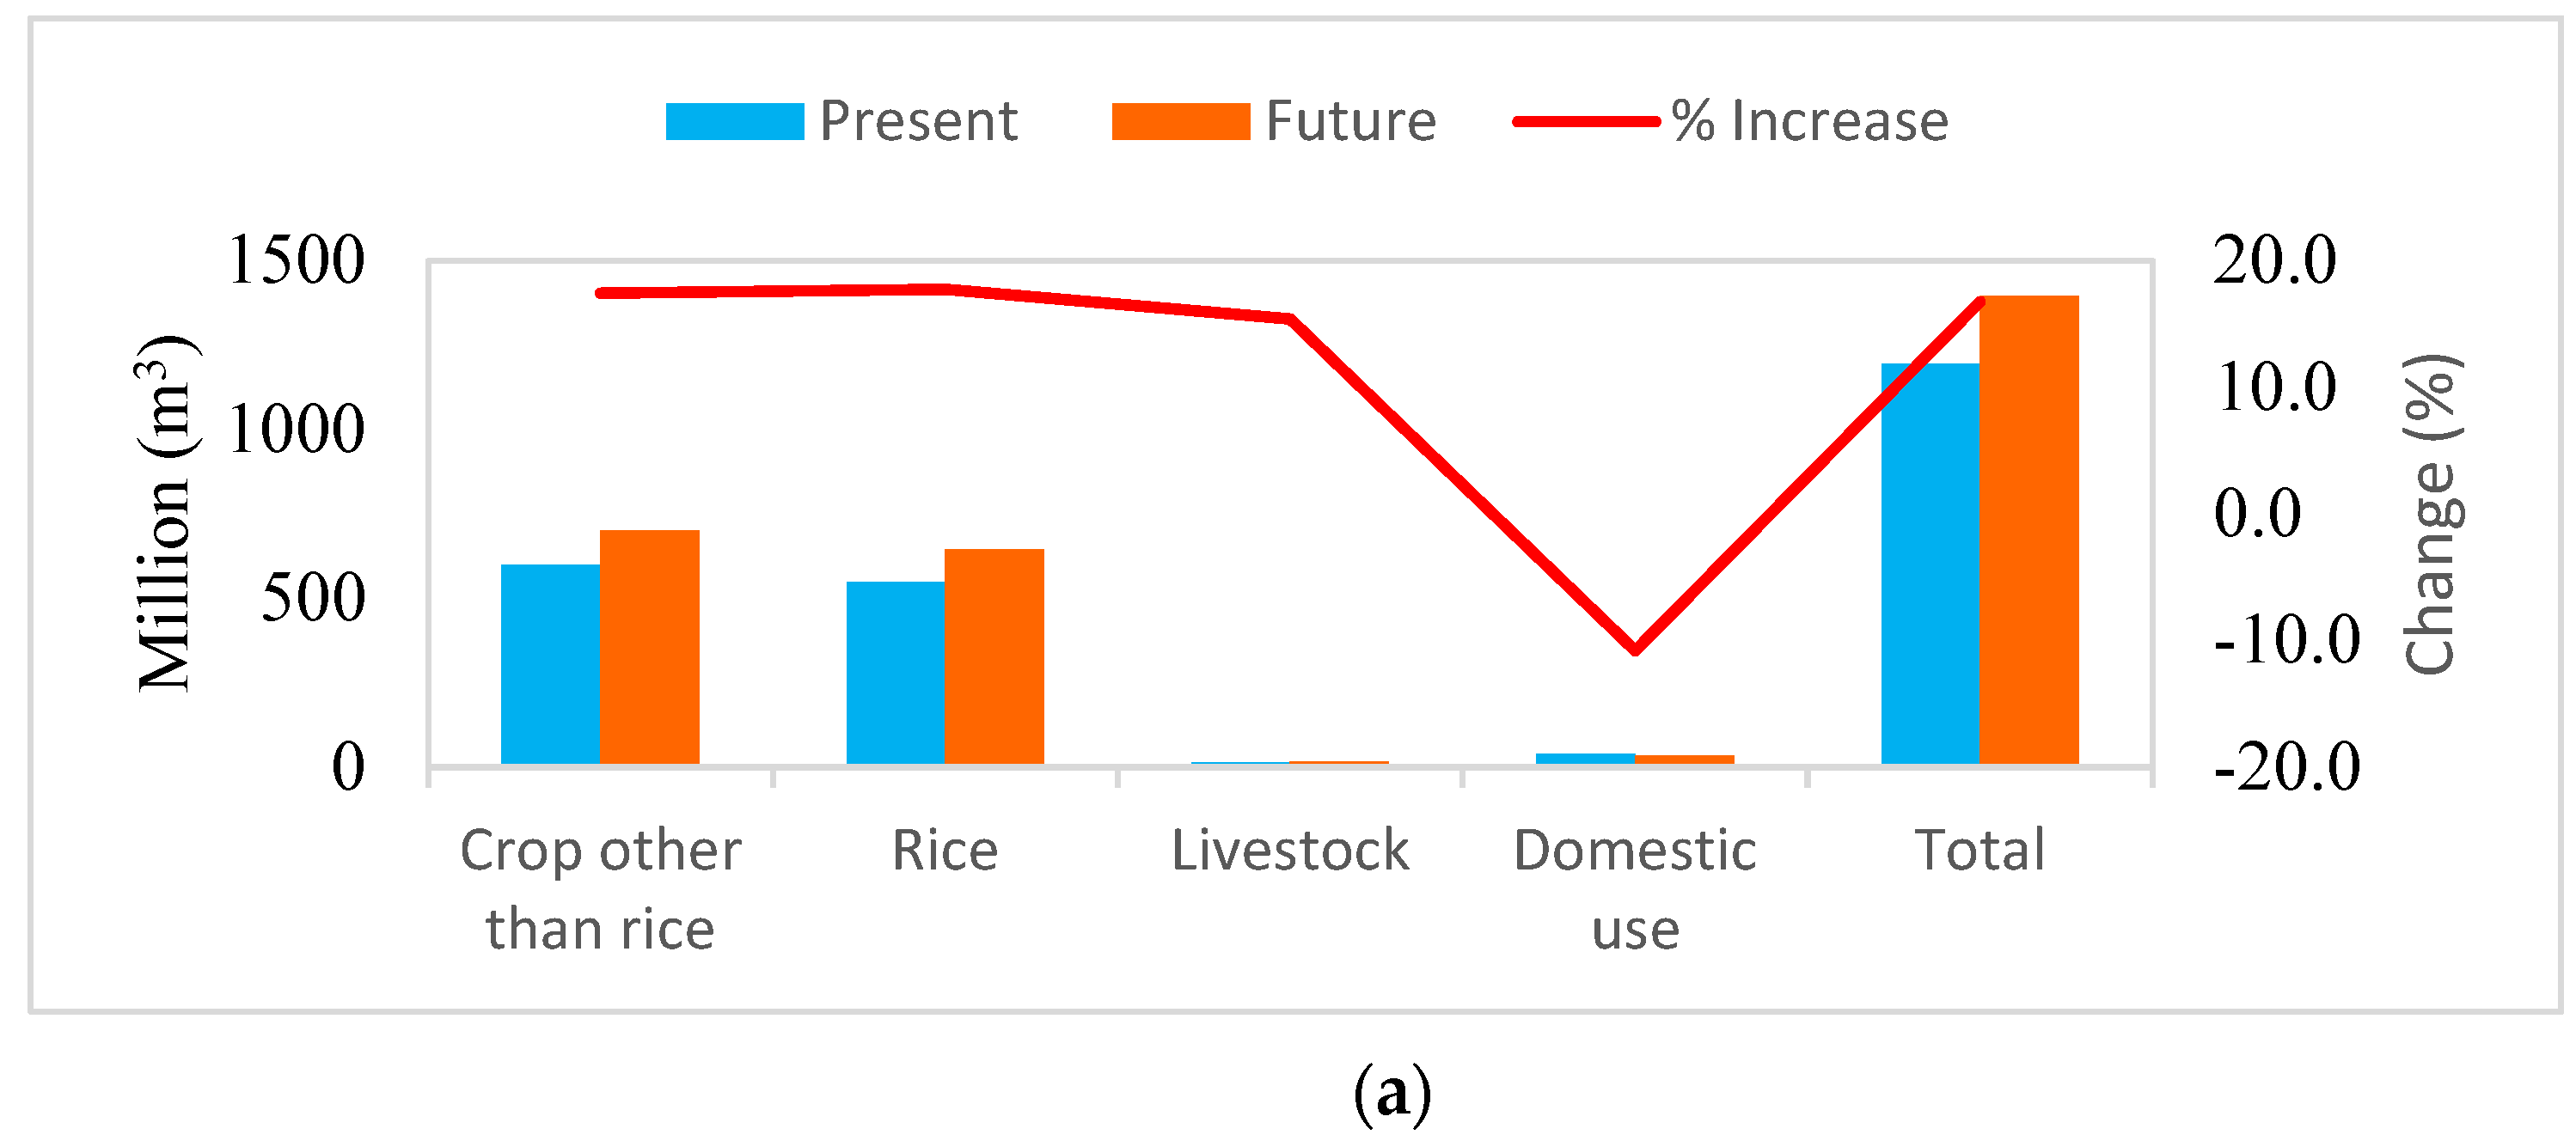
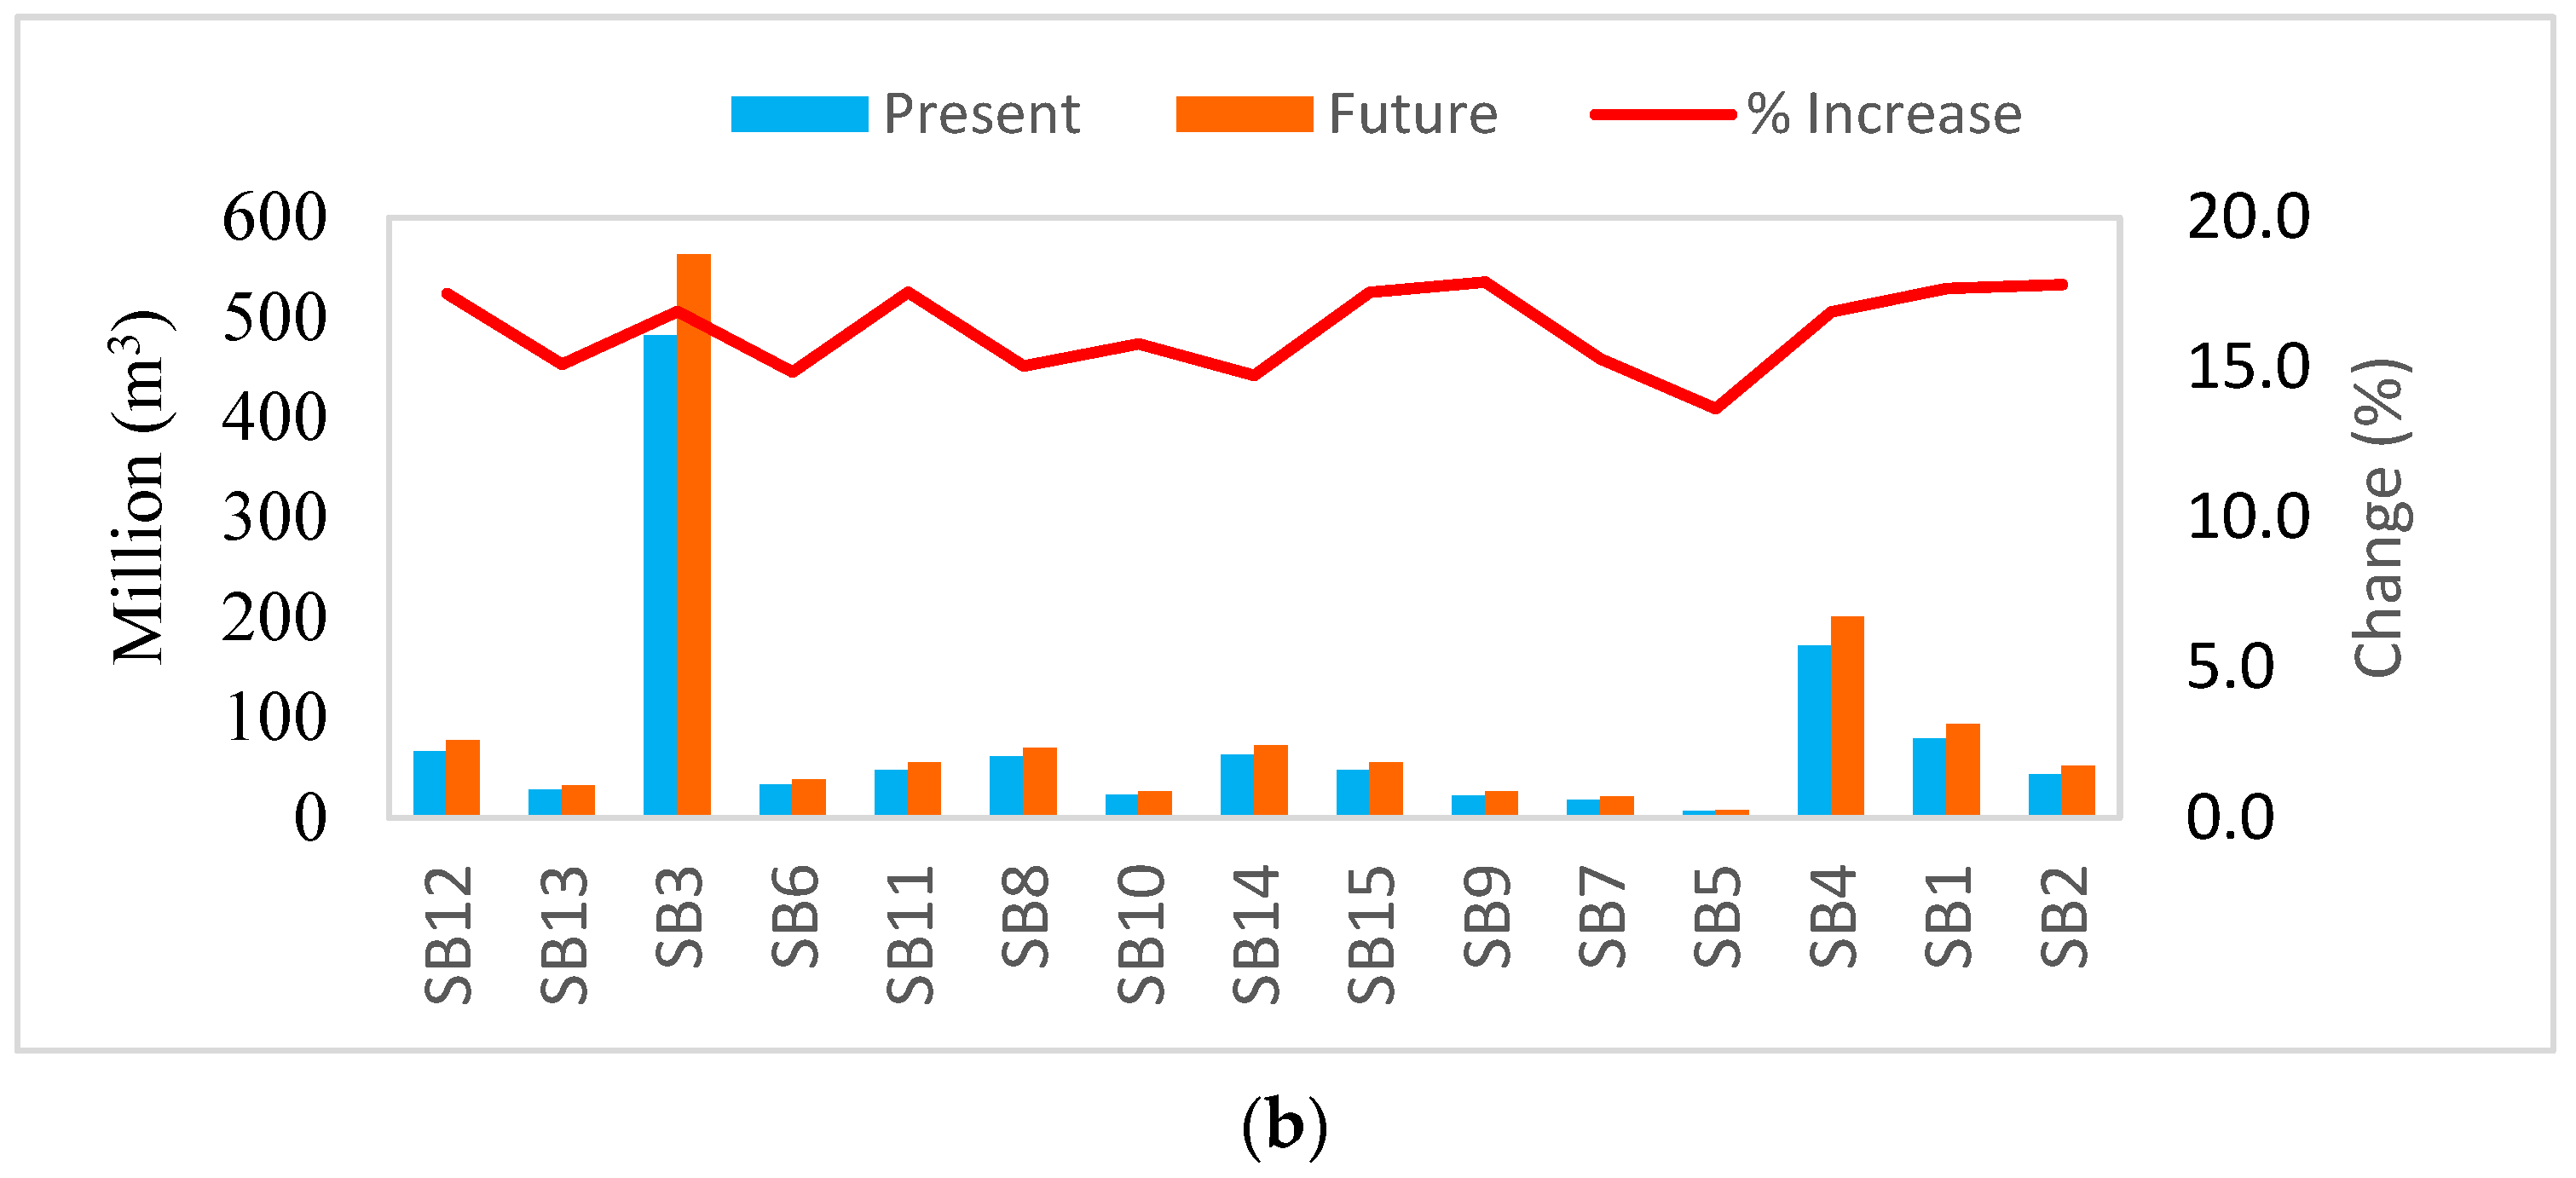
With the context of the climate change, and the anticipated agricultural area and population in 2050, Figure 9 encapsulates the water demand by sector and sub-basin in the CRB. The total water demand for the basin in the future is expected to reach 1394 million m3. This is a significant increase of approximately 200 million m3 (16.8%) from the baseline. The breakdown of this growth reveals a 17.7% increase for rice crops, a 17.4% increase for non-rice crops, and a 15.4% increase for livestock. In contrast, the water demand for domestic use is projected to decrease by 10% due to a projected population reduction in the upcoming years. The sub-basins with the highest water demand will be sub-basins SB3 and SB4 because these are the main agricultural areas of the CRB. The changes in demand of the two sub-basins will also be the largest. The water demand in the SB3 will increase from 482 to 563 million m3, and in the SB4, it will increase from 172 to 200 million m3. In other regions, the demand will exhibit an upward trend but the change will not be significant.

3.3. Water Balance

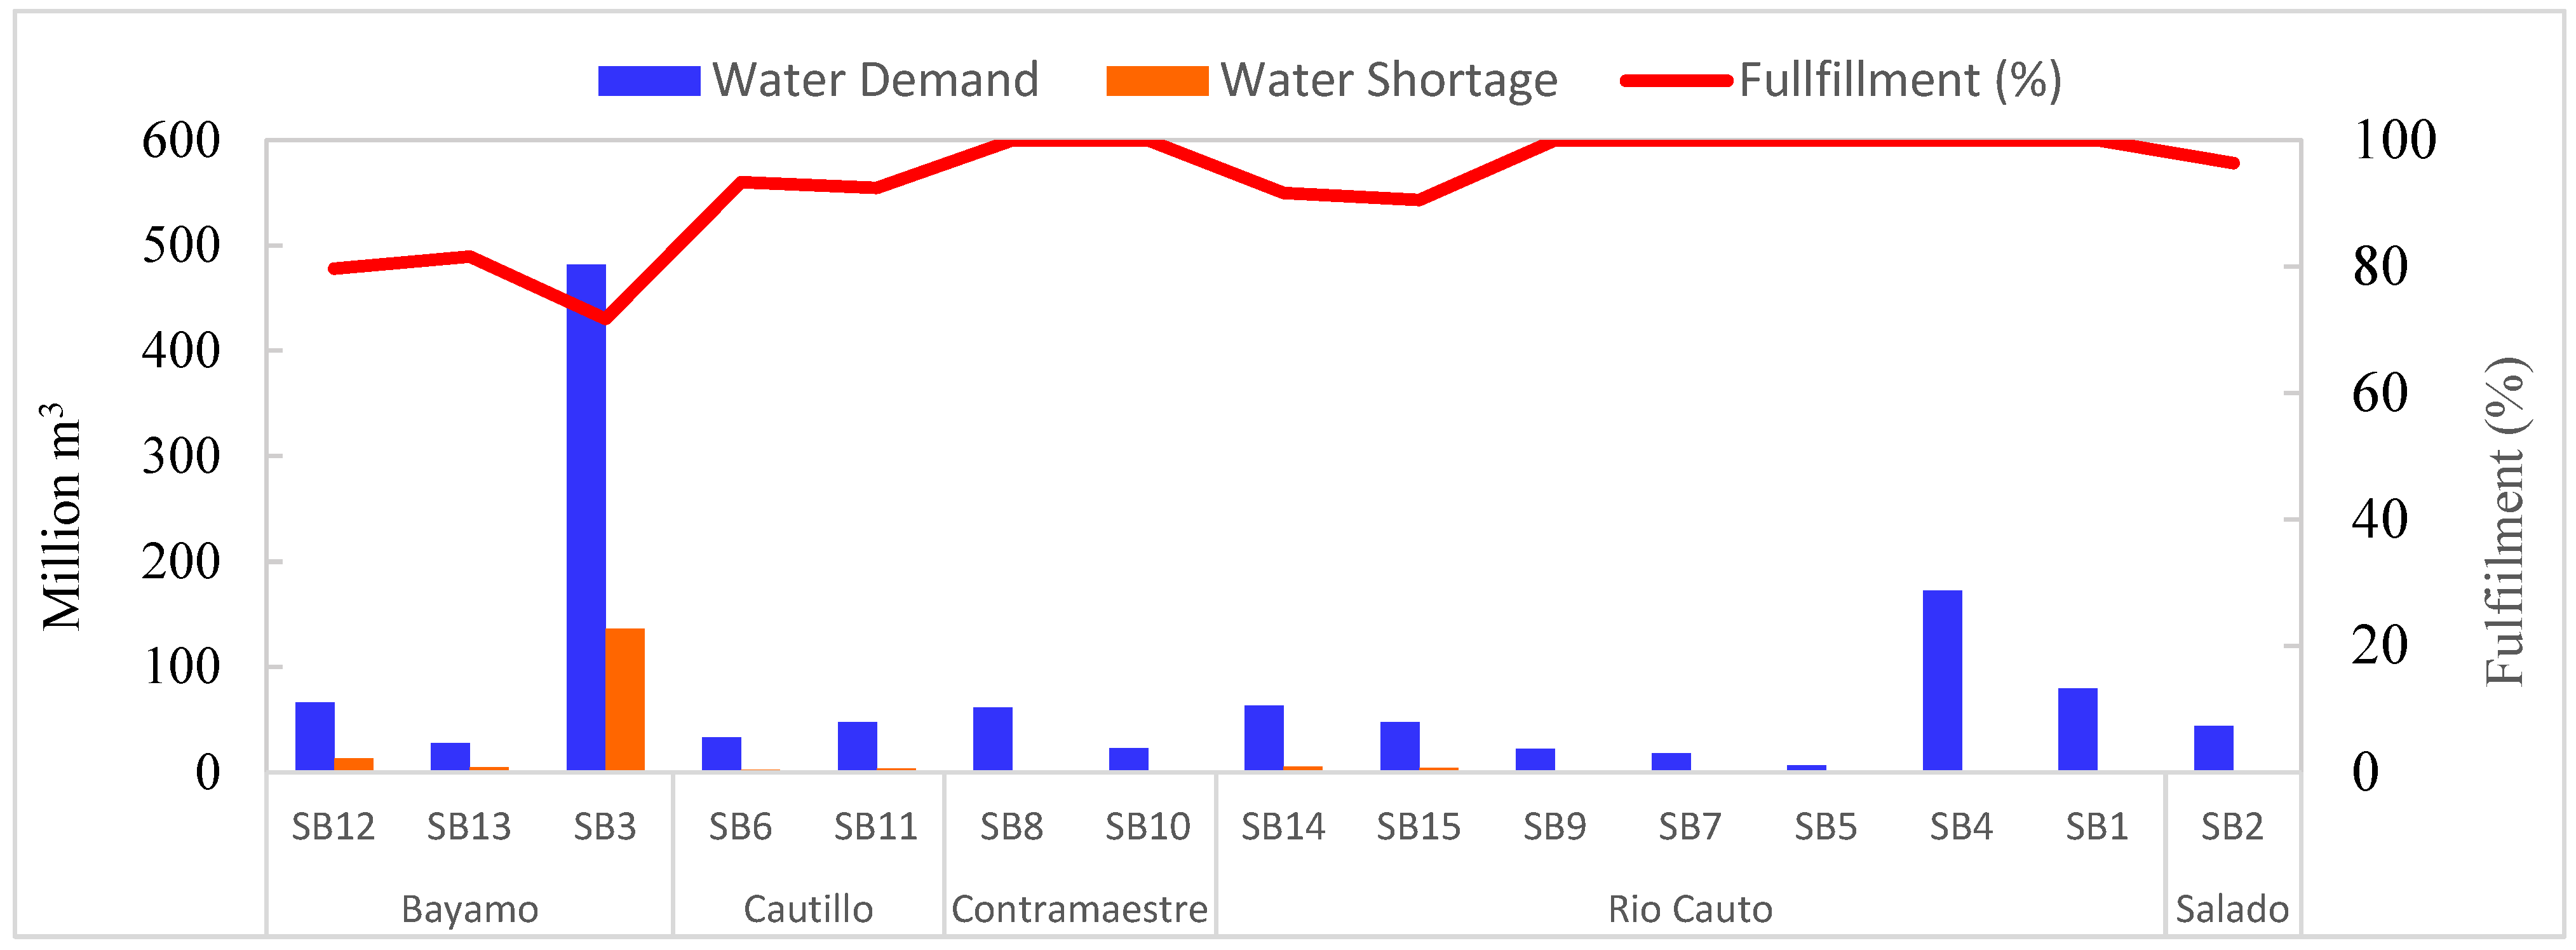
Given the water supply and demand, the water balance was estimated based on the water allocation priorities for different stakeholders that were set by users within the WEAP model. In this study, the water domestic use was set at the highest priority, followed by livestock and agricultural crops. As a result, the domestic water demand was largely met. However, in reality, shortfalls in the domestic water supply still occur primarily due to the outdated water supply system, which fails to distribute drinking water to remote areas. Meanwhile, agricultural crops suffered the most significant deficits, as 95% of the irrigated water in the CRB is sourced from reservoirs, whose storage capacity was insufficient to meet the demand. Figure 10 shows that the most acute shortages were observed in sub-basins SB12, SB13 and SB3 of the Bayamo region with the water fulfillment ranging between 72% and 82%. A water shortage occurred in these sub-basins because they are the main rice cultivation area of the CRB. The sub-basins SB6 and SB11 in Cautillo and SB14 and SB15 in Rio Cauto also suffered from a water deficit but it was less severe. The water fulfillment in these sub-basins was around 91–93%.
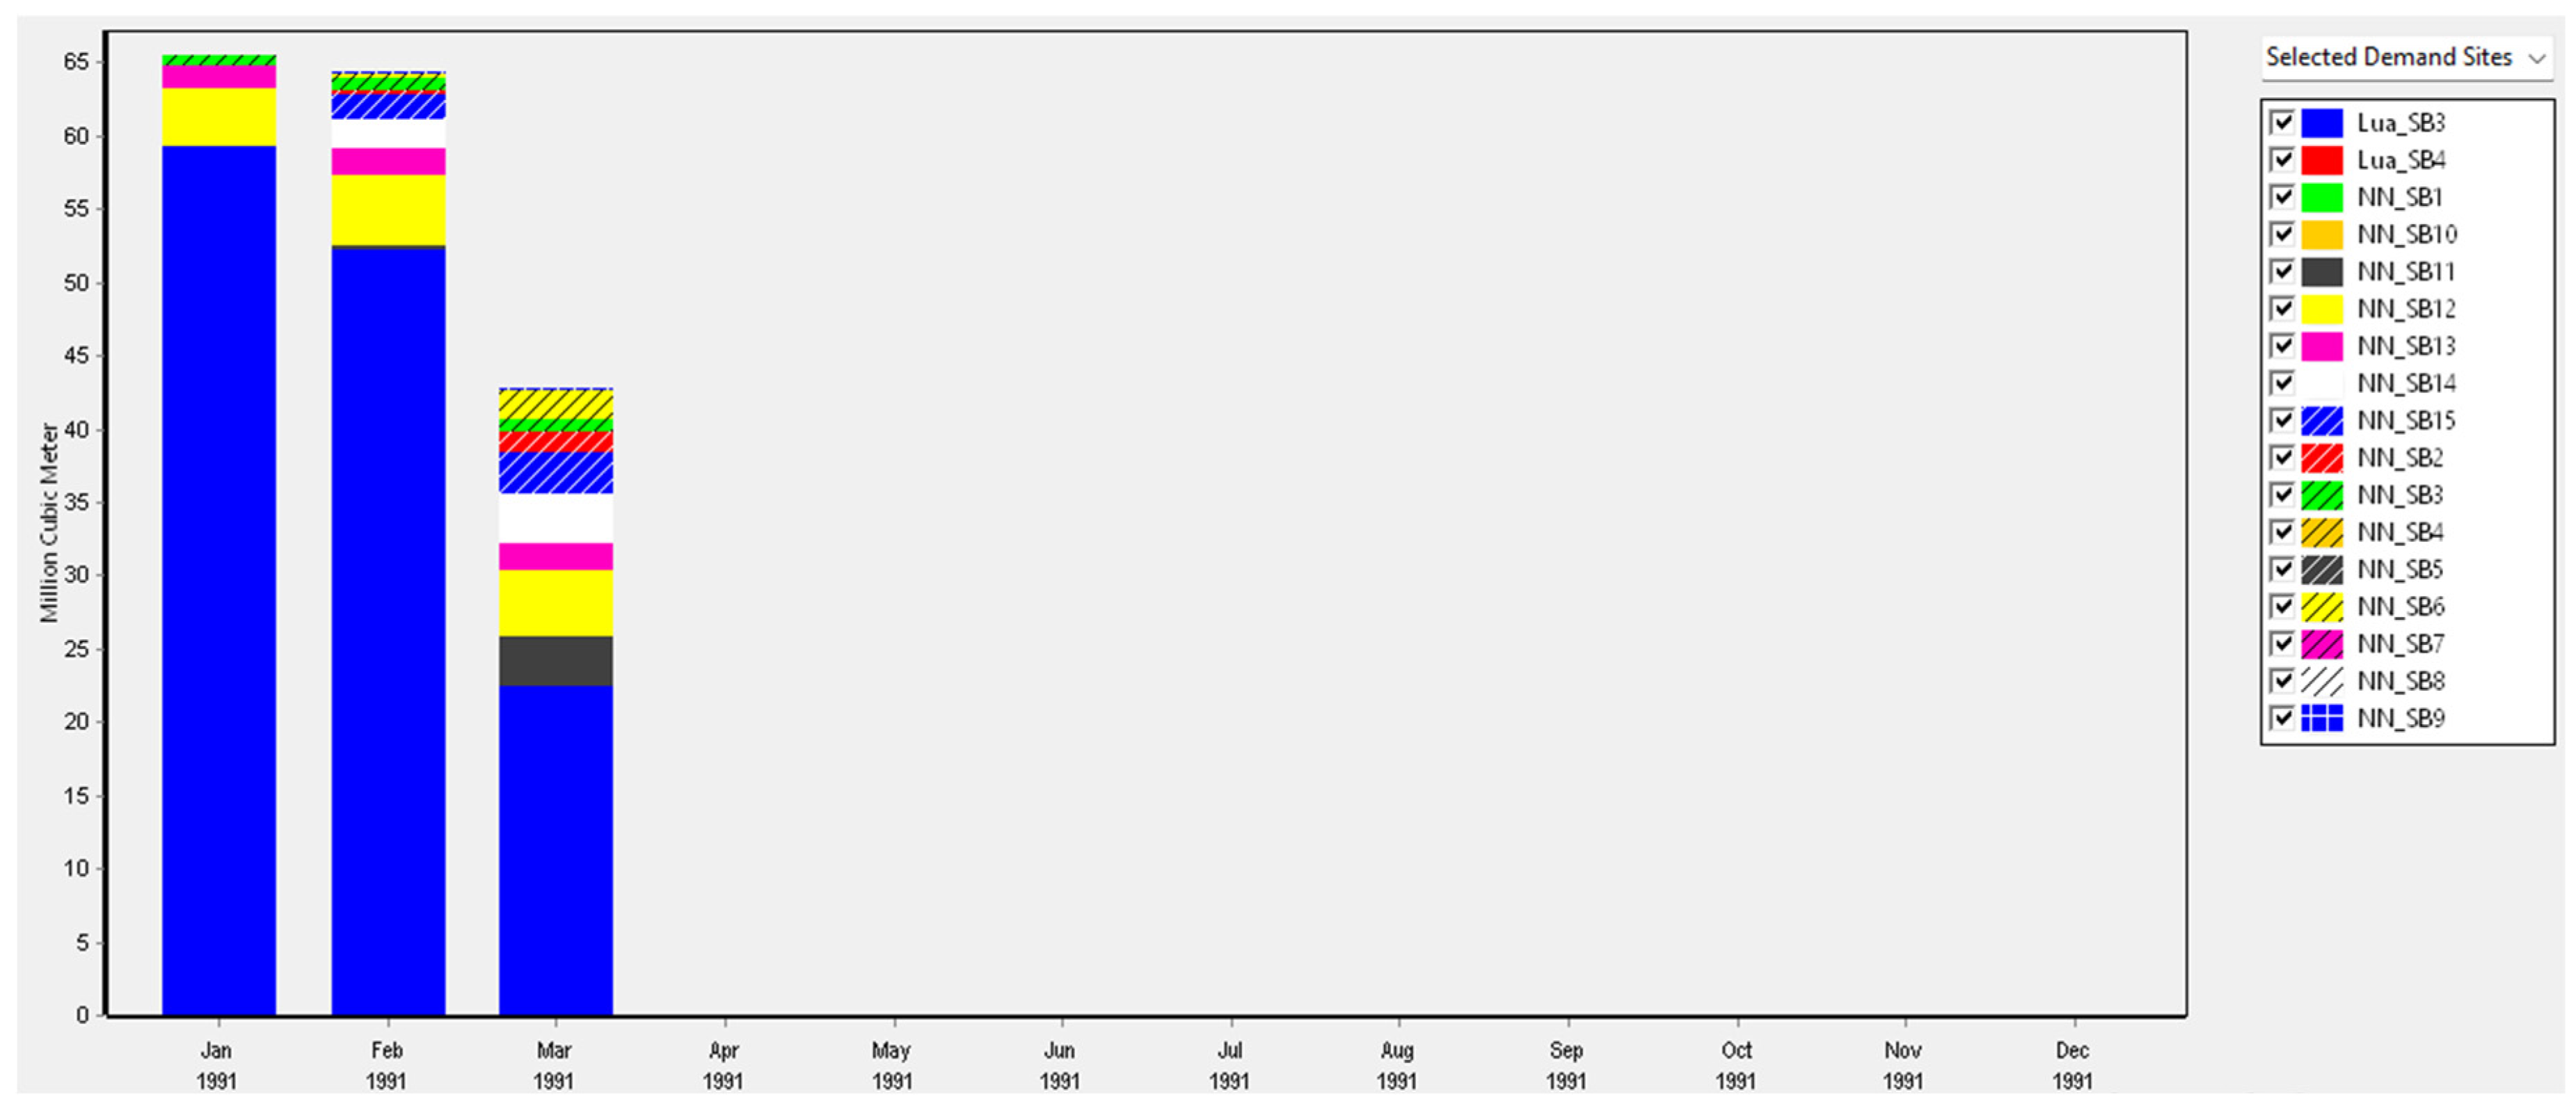
Figure 11 plots the water deficit for crops across the sub-basins in the CRB. The figure shows that the water shortage was significant from January to March. The Bayamo region, particularly the SB3 sub-basin, faced the most severe water deficit: 133.9 million m3 of the total deficit (172.4 million m3). This shortage was primarily due to irrigation demand for rice crops. Rice crops, among all water-dependent sectors, suffered the largest shortage due to its lowest priority in water allocation and its substantial water consumption relative to the other sectors.
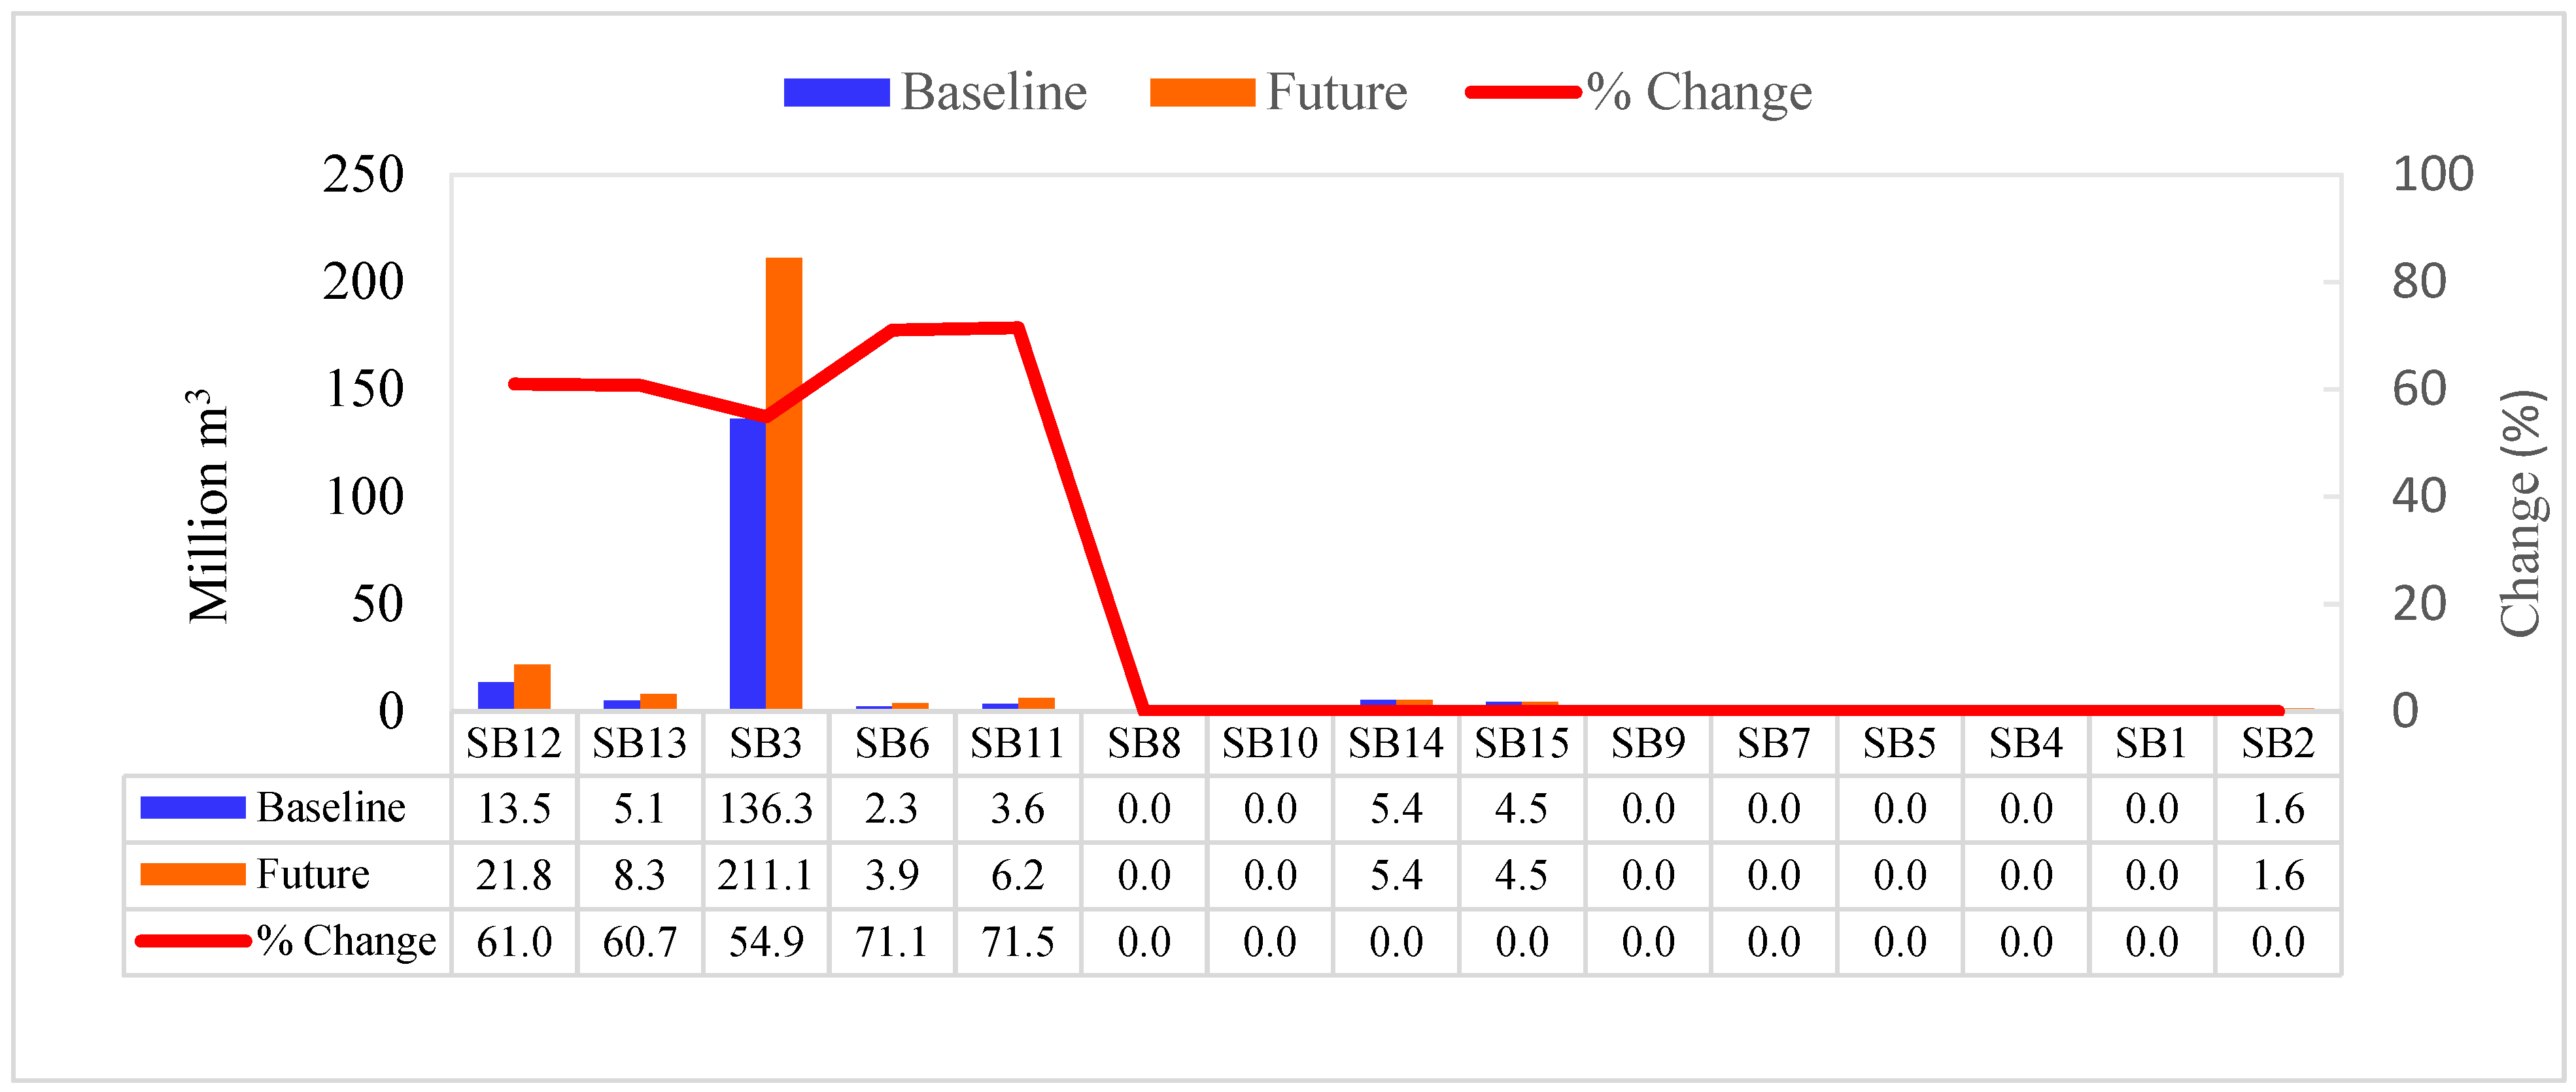
The impacts of climate change and socio-economic development on the water shortage are shown in Figure 12. The figure shows that the sub-basins SB3 and SB12 exhibited the most pronounced deficits and are expected to experience a substantial increase in water shortage in the future. The shortfall in sub-basin SB3 is expected to surge by 74.8 million m3 (55%) and by 8.2 million m3 (61%) in SB12. Collectively, these projections indicate an overall increase in the water shortage, amounting to 90 million m3, which constitutes a 50.2% escalation from the baseline scenario. The intensification of water scarcity can be attributed to a dual phenomenon: a rise in water demand coupled with a potential decline in water supply.

4. Conclusions

The CRB, which is the largest and one of the most important river basins in Cuba, has been increasingly suffering from water shortages due to the impacts of climate change and socio-economic development. Developing a modeling tool for the quantification of the water supply, demand and balance in the CRB under different climate conditions and water allocation strategies is crucial for better WRM. By leveraging the advantage of the SWAT model in simulating multiple hydrological processes and the WEAP model in the flexible allocation of scenario-based water resources, this study coupled these two models to estimate the water demand, supply and balance in the CRB and assessed the severity of the water deficit under the impacts of climate change and socio-economic development. This is the first study to employ this modeling approach to investigate the water shortage issue in the CRB.
The obtained results show that due to the increase in evapotranspiration, the flow in the CRB is projected to decrease slightly (2.5%), in which, the reduction in the rainy season (3.1%) will be higher than that in the dry season (1.3%). Of the total water demand for the Cauto Basin of 1194 million m3, the majority (96%) is attributed to agricultural crops including rice (46%) and non-rice crops (50%). Domestic use accounts for 3%, while livestock accounts only for 1%. In the future, represented by the 2050 scenario, the total water demand for the Cauto Basin, considering the economic development, the population, and climate change, is projected to be 1394 million m3, an increase of about 200 million m3 (16.6%) compared to the baseline scenario. The demand for water is expected to increase by 7.4% for non-rice crops, by 17.6% for rice crops, and by 17.8% for livestock. The demand for domestic use is projected to decrease by 10% due to a population reduction. As for the water balance, the total water shortage under the baseline scenario is 172.4 million m3, which is equal to 14% of the water demand. This indicates that the water supply meets 86% of the total water demand in the CRB. In the future, under the dual effects of climate change and socio-economic development, the water deficit will increase by 52% to 262.7 million m3, which fulfills 81% of the water demand.
The coupled SWAT-WEAP model and obtained results in this study provide useful information to better understand the water supply, demand and balance as well as to support the assessment of water shortages, which are essential for evidence-based WRM in the CRB. The coupled modeling and impact assessment approaches developed in this study can be effectively applied to other river basins. However, there are several drawbacks in this study that need to be addressed in future research. Firstly, due to the lack of observation data, we used the CHIRPS precipitation as an input for the SWAT model. Although this precipitation was adjusted with the gauged observations, its accuracy was still not high due to the sparseness of meteorological stations. In addition, the La Virgen hydrological station that was used to calibrate the SWAT model is situated upstream of the CRB, which may not represent for the entire river basin. well As a result, these two uncertainties ultimately influenced the accuracy of the simulated water supply. Secondly, although the SWAT and WEAP models were coupled to estimate the water supply, demand and balance, these two models were not integrated into a WRM framework to more conveniently construct and analyze management scenarios. In a future study, we will develop a SWAT-WEAP-based decision support system for WRM to better serve decision makers in their WRM missions. Finally, the study showed that the agricultural crops in the CRB, which are crucial for food security in Cuba, were suffering from severe water deficits. Several adaptive solutions are available for alleviating this problem such as reservoir construction, irrigation efficiency improvements and crop structure adjustments. The policymakers may need support in choosing a suitable solution. However, the effectiveness of these solutions was not addressed in this study. Hence, a quantitative evaluation of water shortage mitigation measures is an interesting topic for future studies.

Author Contributions

Conceptualization, A.P.T.; Data curation, B.C.T. and S.B.C.; Funding acquisition, A.P.T., D.H.T. and A.D.N.; Investigation, S.B.C. and T.H.L.; Methodology, B.C.T., A.P.T. and A.D.N.; Project administration, D.H.T. and T.H.L.; Supervision, A.P.T.; Writing – original draft, B.C.T., A.P.T. and N.A.N.; Writing – review & editing, A.P.T., D.H.T., A.D.N. and N.A.N. All authors have read and agreed to the published version of the manuscript.

Funding

This research is funded by the national project titled “Quantifying surface water resources and saltwater intrusion in the Cauto River basin (Cuba) and proposing measures for improved rice production and domestic water supply”, Grant Number: NĐT.100.CU/21.

Data Availability Statement

The data presented in this study are available on request from the corresponding author.

Conflicts of Interest

The authors declare no conflicts of interest.

References

  1. United Nations (UN). The Sustainable Development Goals Report 2021; United Nations: New York, NY, USA, 2021. [Google Scholar]
  2. Cosgrove, W.J.; Loucks, D.P. Water management: Current and future challenges and research directions. Water Resour. Res. 2015, 51, 4823–4839. [Google Scholar] [CrossRef]
  3. Karmalkar, A.V.; Taylor, M.A.; Campbell, J.; Stephenson, T.; New, M.; Centella, A.; Benzanilla, A.; Charlery, J. A review of observed and projected changes in climate for the islands in the Caribbean. Atmósfera 2013, 26, 283–309. [Google Scholar] [CrossRef]
  4. Planos, E.; Guevara, A.V.; Rivero, R. Cambio Climático en Cuba: Vulnerabilidad, Impacto y Medidas de Adaptación; Multimedia Instituto de Meteorología, INSMET: La Habana, Cuba, 2013. [Google Scholar]
  5. Berbel, J.; Julia, M.-O.; Pascual, M. A cost-effectiveness analysis of water-saving measures for the water framework directive: The case of the Guadalquivir River Basin in Southern Spain. Water Resour. Manag. 2011, 25, 623–640. [Google Scholar] [CrossRef]
  6. Mirdashtvan, M.; Najafinejad, A.; Malekian, A.; Sa’doddin, A. Sustainable water supply and demand management in semi-arid regions: Optimizing water resources allocation based on RCPs scenarios. Water Resour. Manag. 2021, 35, 5307–5324. [Google Scholar] [CrossRef]
  7. Jayakrishnan, R.S.R.S.; Srinivasan, R.; Santhi, C.; Arnold, J.G. Advances in the application of the SWAT model for water resources management. Hydrol. Process. Int. J. 2005, 19, 749–762. [Google Scholar] [CrossRef]
  8. Arnold, J.G.; Moriasi, D.N.; Gassman, P.W.; Abbaspour, K.C.; White, M.J.; Srinivasan, R.; Santhi, S.; Harmel, R.D.; van Griensven, A.; Jha, M.K.; et al. SWAT: Model use, calibration, and validation. Trans. ASABE 2012, 55, 1491–1508. [Google Scholar] [CrossRef]
  9. Sieber, J.; Purkey, D. WEAP Tutorial; Stockholm Environment Institute: Stockholm, Sweden, 2008. [Google Scholar]
  10. Asghar, A.; Iqbal, J.; Amin, A.; Ribbe, L. Integrated hydrological modeling for assessment of water demand and supply under socio-economic and IPCC climate change scenarios using WEAP in Central Indus Basin. J. Water Supply Res. Technol. AQUA 2019, 68, 136–148. [Google Scholar] [CrossRef]
  11. Psomas, A.; Panagopoulos, Y.; Konsta, D.; Mimikou, M. Designing water efficiency measures in a catchment in Greece using WEAP and SWAT models. Procedia Eng. 2016, 162, 269–276. [Google Scholar] [CrossRef]
  12. Touseef, M.; Chen, L.; Yang, W. Assessment of surface water availability under climate change using coupled SWAT-WEAP in Hongshui River Basin, China. ISPRS Int. J. Geo-Inf. 2021, 10, 298. [Google Scholar] [CrossRef]
  13. Hao, L.; Sun, G.; Liu, Y.; Qian, H. Integrated modeling of water supply and demand under management options and climate change scenarios in Chifeng City, China. JAWRA J. Am. Water Resour. Assoc. 2015, 51, 655–671. [Google Scholar] [CrossRef]
  14. Kishiwa, P.; Nobert, J.; Kongo, V.; Ndomba, P. Assessment of impacts of climate change on surface water availability using coupled SWAT and WEAP models: Case of upper Pangani River Basin, Tanzania. Proc. Int. Assoc. Hydrol. Sci. 2018, 378, 23–27. [Google Scholar] [CrossRef]
  15. Touch, T.; Oeurng, C.; Jiang, Y.; Mokhtar, A. Integrated modeling of water supply and demand under climate change impacts and management options in tributary basin of Tonle Sap Lake, Cambodia. Water 2020, 12, 2462. [Google Scholar] [CrossRef]
  16. Abbas, S.A.; Xuan, Y.; Bailey, R.T. Assessing climate change impact on water resources in water demand scenarios using SWAT-MODFLOW-WEAP. Hydrology 2022, 9, 164. [Google Scholar] [CrossRef]
  17. Montecelos-Zamora, Y.; Cavazos, T.; Kretzschmar, T.; Vivoni, E.R.; Corzo, G.; Molina-Navarro, E. Hydrological modeling of climate change impacts in a Tropical River Basin: A case study of the Cauto River, Cuba. Water 2018, 10, 1135. [Google Scholar] [CrossRef]
  18. Borrero, B.L. Atálogo de Cuencas Hidrográficas (RÍO CAUTO), CUBA; Instituto de Hidroeconomía: La Habana, Cuba, 1995. [Google Scholar]
  19. Estrada Sifontes, V.; Pacheco Moya, R.M. Modelación hidrológica con HEC-HMS en cuencas montañosas de la región oriental de Cuba. Ing. Hidráulica Y Ambient. 2012, 33, 71–80. [Google Scholar]
  20. Gassman, P.W.; Sadeghi, A.M.; Srinivasan, R. Applications of the SWAT model special section: Overview and insights. J. Environ. Qual. 2014, 43, 1–8. [Google Scholar] [CrossRef] [PubMed]
  21. Funk, C.; Peterson, P.; Landsfeld, M.; Pedreros, D.; Verdin, J.; Shukla, S.; Michaelsen, J. The climate hazards infrared precipitation with stations—A new environmental record for monitoring extremes. Sci. Data 2015, 2, 1–21. [Google Scholar]
  22. Tran, A.P.; Tran, B.C.; Campbell, S.B.; Nguyen, N.A.; Tran, D.H.; Nguyen, T.T.; Nguyen, A.D.; Son, D.H. Spatio-temporal Characterization of Drought Variability in Data-Scarce Regions Using Global Precipitation Data: A Case Study in Cauto River Basin, Cuba. Res. Sq. 2023, preprint. [Google Scholar] [CrossRef] [PubMed]
  23. Chung, T.B.; Phương, T.A.; Hằng, T.T.D.; Anh, N.N.; An, H.T.; Campbell, S.B. Nghiên cứu khả năng sử dụng số liệu mưa vệ tinh độ phân giải cao trong mô phỏng dòng chảy trên lưu vực sông thiếu số liệu. Tạp Chí Khí Tượng Thủy Văn 2023, 754, 59–70. [Google Scholar]
  24. World Bank Group. Climate Change Knowledge Portal. Available online: https://climateknowledgeportal.worldbank.org/country/cuba/climate-data-projections (accessed on 15 February 2023).
  25. United Nations. World Population Prospects 2022. Available online: https://population.un.org/wpp/Graphs/Probabilistic/POP/TOT/192 (accessed on 15 December 2023).
  26. Ministry of Transport, Republic of Cuba. Project for Formulation of National Transport Master Plan in the Republic of Cuba; Final Report; Ministry of Transport, Republic of Cuba, 2023. Available online: https://openjicareport.jica.go.jp/pdf/1000050718_01.pdf (accessed on 2 February 2024).
Figure 1. Study area of CRB.
Water 17 02672 g001
Figure 2. Assessment scheme to quantify water supply, demand and balance in the CRB under the impacts of socio-economic development and climate change.
Water 17 02672 g002
Figure 3. Maps of DEM, subbasin, soil and land cover in the CRB. (a) Terrain elevation. (b) Watershed delineation. (c) Soil. (d) Land cover.
Water 17 02672 g003aWater 17 02672 g003b
Figure 4. Fluctuations in maximum (a) and minimum (b) temperature and precipitation (c) in the provinces in the CRB until 2050.
Water 17 02672 g004
Figure 5. Comparison of monthly precipitation and flow in the baseline and future scenarios. (a) Precipitation. (b) Flow.
Water 17 02672 g005
Figure 6. Comparison of precipitation, evapotranspiration and flow in the dry and wet seasons in the baseline and future scenarios.
Water 17 02672 g006
Figure 7. Water demand by sector (left) and by region (right) in the CRB. (a) Water demand by sector. (b) Water demand by region.
Water 17 02672 g007
Figure 8. Water demand by agricultural and domestic use across the regions in the CRB. (a) Water demand for agriculture. (b) Water demand for domestic use.
Water 17 02672 g008
Figure 9. Comparison of water demand by sector and region in baseline and future scenarios. (a) Water demand by sector. (b) Water demand by region.
Water 17 02672 g009aWater 17 02672 g009b
Figure 10. Water demand and shortage and fulfillment in sub-basins.
Water 17 02672 g010
Figure 11. Amount of water shortage for crops in sub-basins by month in the CRB.
Water 17 02672 g011
Figure 12. Comparison of water deficit in sub-basins in the baseline and future scenarios.
Water 17 02672 g012
Table 1. Input data used for the SWAT and WEAP models.
Data TypeResolutionPeriodSource
DEM30 m2000Digital Elevation Model SRTM 1 Arc-Second 30 m (NASA, NGA)
Soil data1:5,000,0002008ISRIC—World Soil Information
Land use10 m2022ESRI
Temperature0.5° × 0.5°1944NASA POWER Data Access Viewer (DAV) (1981–2022)
Precipitation0.05° × 0.05°1981–2022CHIRPS (1981–2022)
Population 2022National office for establishment and information of the Republic of Cuba
Livestock
Agricultural area
Table 2. Water demand zones in the CRB.
No. Sub-Region Sub-Basin/Water Demand Zone Area (km2) Purpose Water Supply
1BayamoSB12266Irrigation
Domestic use
Corojo Dam
2SB1395Irrigation
Domestic use
Guisa Dam
3SB3393Irrigation
Domestic use
Guisa Dam
Corojo Dam
Bayamo River
4CautilloSB6359Irrigation
Domestic use
Cautillo Dam
5SB11186IrrigationCautillo Dam
6ContramaestreSB8527Irrigation
Domestic use
Cespedes Dam
7SB10437Irrigation
Domestic use
Cespedes Dam
8SaladoSB22712IrrigationSalado River
9SB1562IrrigationCauto del Paso Dam
10SB4367Irrigation
Domestic use
Cauto del Paso Dam
11SB5691Irrigation
Domestic use
Cauto River
Cauto del Paso Dam
12SB71176Irrigation
Domestic use
Baragua Dam
13SB9639IrrigationCauto River
14SB14271Irrigation
Domestic use
Golta Dam
15SB15403Irrigation
Domestic use
Golta Dam
Disclaimer/Publisher’s Note: The statements, opinions and data contained in all publications are solely those of the individual author(s) and contributor(s) and not of MDPI and/or the editor(s). MDPI and/or the editor(s) disclaim responsibility for any injury to people or property resulting from any ideas, methods, instructions or products referred to in the content.