Abstract
The rainy season characteristics are directly modulated by atmospheric circulation and moisture transport dynamics. Focusing on the characteristics of the rainy season onset date (RSOD), this study aims to advance the understanding and prediction of climate change impacts on agricultural production and disaster mitigation strategies. Based on rainfall data from 66 meteorological stations in northeast China (NEC) from 1961 to 2020, this study determined the patterns of the RSOD in the region and established its mechanistic linkages with atmospheric circulation and water vapor transport mechanisms. This study identifies a climatic regime shift around 2000, with the RSOD transitioning from low to high interannual variability in NEC. Further analysis reveals a strong correlation between the RSOD and atmospheric circulation characteristics: cyclonic vorticity amplifies before the RSOD and dissipates afterward. Innovatively, this study reveals a significant transition in the water vapor transport paths during the early rainy season in NEC around 2000, shifting from eastern Mongolia–Sea of Japan to the northwestern Pacific region. Moreover, the advance or delay of the RSOD directly influences the water vapor transport intensity—an early (delayed) RSOD is associated with enhanced (weakened) water vapor transport. These findings provide a new perspective for predicting the RSOD in the context of climate change while providing critical theoretical underpinnings for optimizing agricultural strategies and enhancing disaster prevention protocols.
1. Introduction
Under global climate change, extreme hydrological events, particularly floods and droughts, occur frequently [1], posing a critical challenge to socioeconomic stability and social security. In monsoon-affected regions, the rainy season represents a period of heightened climatic vulnerability. Consequently, the features of the rainy season have long been a significant research topic among scholars [2,3,4]. The spatiotemporal heterogeneity of rainfall serves as the principal driver of extreme hydrological events [5,6], necessitating further research to enhance predictive capabilities and disaster preparedness.
Previous scholars have made substantial progress in regional precipitation characteristics and their associated factors. Chinese researchers have investigated rainfall distributions across eastern and southwestern China [7,8,9], while subsequent investigations established the connection between east Asia rainfall variability and large-scale climatic factors, such as the Western Pacific Subtropical High (WPSH) and sea surface temperature (SST) [10,11]. Recent international studies have demonstrated significant climate teleconnections influencing rainy season variability across different regions. In the Yangtze River basin, hydrological events show statistically significant linkages with SST anomalies, particularly with the El Niño–Southern Oscillation (ENSO) and Indian Ocean Dipole (IOD) phenomena [12,13]. Concurrently, researchers have developed innovative predictive frameworks based on rainfall characteristics during India’s monsoon onset period [14,15], marking important advances in forecasting methodologies. Current research emphasizes precipitation anomalies under climate change, particularly rainfall characteristics and their climatic drivers [16,17,18]. However, existing research is insufficient to systematically explain the characteristics of the RSOD or how direct climatic factors like atmospheric circulation and water vapor flux respond to climate change. Analyzing and accurately predicting the RSOD is crucial for determining the regional drought-flood patterns and guiding agricultural planning, with significant socioeconomic implications [19,20,21].
This study examines northeast China (NEC), a vital agricultural region where rainfall critically impacts crop yields. We investigate the spatiotemporal variations in the RSOD while revealing their relationships with atmospheric circulation and water vapor transport paths. This paper proceeds as follows. Section 2 describes the data and methods used in this study. Characteristics and the climate regime shift are determined in Section 3. Section 4 explores the differences in atmospheric circulation and water vapor patterns before and after the 2000 transition point.
2. Materials and Methods
Precipitation data for the period 1961–2020 in NEC (northeast China) used in this study were obtained from the National Meteorological Information Center of the CMA (China Meteorological Administration, Beijing, China). This study uses hourly moisture flux, moisture flux divergence, and relative humidity (RH) from the fifth-generation reanalysis dataset (ERA5; 0.25° × 0.25°) produced by the European Centre for Medium-Range Weather Forecasts (ECMWF), Reading, United Kingdom [22]. The 500 hPa wind data were obtained from the reanalysis dataset (2.5° × 2.5°) provided by the National Centers for Environmental Prediction/National Center for Atmospheric Research (NCEP/NCAR), Boulder, CO, USA [23]. The specific research methods are as follows:
2.1. Precipitation Data Quality Control
To ensure data reliability and temporal representativeness, the raw records underwent systematic preprocessing and rigorous quality control. This included removing records prior to 1960, flagging implausible values (>999 mm/day) and duplicates as missing, constructing continuous daily series for each station, and standardizing metadata. Crucially, years with over 10% missing days were excluded, and stations were retained only if at least 80% of years during 1960–2020 met this completeness criterion. Following this process, 66 stations demonstrating high data integrity were selected for analysis of long-term hydroclimatic patterns.
2.2. RSOD Determination
The criterion for rainy season onset is defined as follows [24]: Beginning on 1 June, if the 5-day moving accumulated precipitation at a given station meets or exceeds eight times the climatological mean daily precipitation (derived from the June–September long-term average), and at least one day within this 5-day period records a daily precipitation ≥ 10 mm, then the first day with precipitation ≥ 10 mm in this window is designated as the rainy season onset date for that station.
2.3. Abrupt Change Detection
To better capture potential regime shifts in the interannual variability of the RSOD, the analysis focused on the frequency of abnormal years rather than the original time series. An “abnormal year” was defined as one in which the RSOD value deviated beyond ±1 standard deviation from the climatological mean, i.e., satisfying the condition:
where denotes the RSOD value in year , is the mean of the RSOD series, and is the corresponding standard deviation.
The time series of abnormal-year frequency was then constructed using a centered moving window of size (ranging from 9 to 15 years). Within each window, the number of abnormal years was counted to form a smoothed frequency series:
To detect potential abrupt changes in this frequency series, the Pettitt test [25] was applied. The Pettitt test is a non-parametric rank-based method that identifies a single most probable change point in the time series by maximizing the test statistic , defined as follows:
where sgn (⋅) denotes the sign function, and is the length of the series. The most likely change point corresponds to the time step at which is maximized. The significance level p is estimated using the approximate formula:
A change point is considered statistically significant when p < 0.05. This approach allows for detecting regime transitions in the frequency of abnormal RSOD events, which can better reflect underlying changes in variability than direct analysis of the raw RSOD series.
Statistical significance testing procedures for the identified change point are documented in Section 3.1.2.
3. Results
3.1. Characteristics of RSOD
3.1.1. Spatiotemporal Characteristics and Variability
Under the influence of the East Asian summer monsoon, the monsoon rain belt moves northward to north and northeast China during July and August, establishing the regional rainy season [26,27]. The spatial pattern of the climatological mean onset date (Figure 1) was derived from station observations across 66 sites over 1961–2020. The earliest onset occurs in the southwestern region, with the earliest areas before day 190 (9 July). In contrast, the Liaodong Peninsula exhibits the latest onset, typically after day 207 (26 July). Provincially, Liaoning and Heilongjiang Provinces have the most pronounced difference in onset timing. Notably, within Liaoning Province itself, the onset dates varied by more than 12 days, with the majority of areas after day 202 (21 July). In contrast, Jilin displays relatively uniform onset sequences, confined within a 10-day window. Overall, the RSOD in NEC exhibits marked spatial heterogeneity, which gradually shifts from the southwest and southeast toward other regions, such as the north and east.
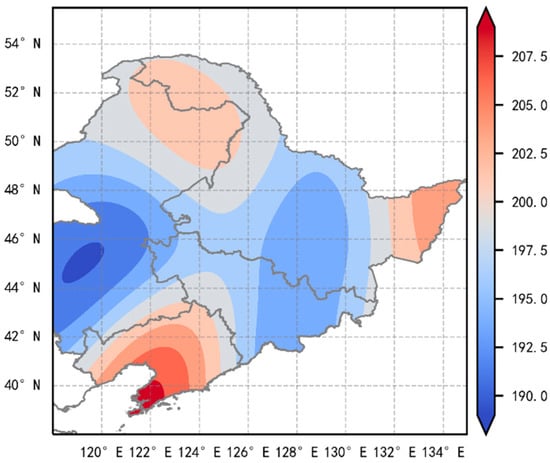
Figure 1.
Spatial distribution of the RSOD across NEC (1961–2020), showing the earliest onset (<day 190) in southwestern regions and the latest onset (>day 207) in the Liaodong Peninsula.
Figure 2 shows the interannual variation of the RSOD across NEC from 1961 to 2020. The analysis reveals substantial year-to-year variability, with a mean onset date of day 197. A statistically significant shift in onset timing emerged when comparing pre- and post-2000 periods. During 1961–2000, the onset dates remained relatively stable, fluctuating within a 35-day range (earliest: day 181 in 1983 and 1998; latest: day 215 in 1997). Annual variations typically oscillated moderately around the mean, with only seven years exceeding the standard deviation range. Post-2000, onset timing exhibited markedly greater variability, as confirmed by a statistically significant increase in the interannual variance (Levene’s test, p < 0.001), with the maximum interannual difference reaching 56 days (earliest: day 169 in 2012; latest: day 225 in 2019). Notably, 40% of years (8/20) exceeded the standard deviation range, demonstrating both increased frequency and magnitude of deviations from the mean. While no significant long-term trend toward an early or delayed RSOD was detected, the observed increase in an extreme RSOD presents considerable challenges for accurate rainy season prediction.
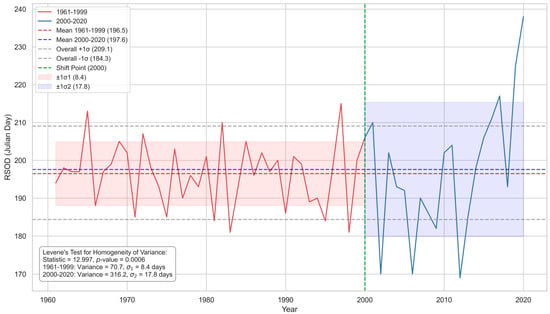
Figure 2.
RSOD interannual variability in northeast China (1961–2020). Time series of rainy season onset dates (day of year) for 1961–1999 (red) and 2000–2020 (blue), with period-specific means (dashed lines), ±1σ ranges (shaded areas), and overall variability (gray dashed lines). Statistical results from Levene’s test for variance homogeneity are annotated.
3.1.2. Abrupt Change Point Analysis
To further investigate the interannual variation in the abrupt behavior of the RSOD index, a moving-window-based frequency analysis was conducted. Abnormal years were defined as those with RSOD values exceeding ±1σ from the climatological mean, and the frequency of such events was calculated within a sliding window of 9 to 15 years. The resulting frequency series was analyzed using Pettitt’s non-parametric change-point detection method. A statistically significant shift was identified around the year 2000 (p < 0.001) consistently across all window lengths (Figure 3). This finding is in line with the 1999/2000 ENSO regime shift [28], suggesting that ENSO may modulate rainy season behavior by triggering mid-high latitude circulation anomalies and synergistic multi-factor interactions.
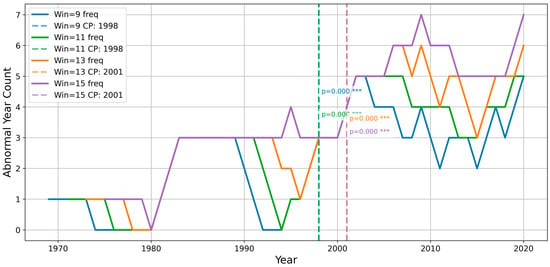
Figure 3.
Time series of the RSOD abnormal-year frequency (±1σ) computed using a moving window. Dashed vertical lines indicate the change points detected by the Pettitt test for different window sizes (9–15 years), all converging between 1998 and 2001. *** means p < 0.001.
3.2. Atmospheric Circulation Changes
Focusing on the RSOD in NEC, this study identifies 2000 as the critical transition point. The pre-2000 period exhibited limited interannual variation in onset timing, while the post-2000 period marked a transition to heightened variability. Therefore, we analyze the wind field, water vapor flux, and relative humidity (RH) patterns separately for 1961–2000 and 2000–2020 to investigate associated atmospheric changes.
Identical composite analysis procedures (i.e., 10-day mean atmospheric fields centered on the early/delayed RSOD) were applied to all three variables (winds, vapor flux, RH) to ensure methodological consistency across diagnostics.
3.2.1. Pre- and Post-2000 Wind Field Dynamics
Before the early rainy season, NEC exhibited strong cyclonic circulation (Figure 4a,b), indicating converging airflow favorable for low-pressure systems and convection development. Post-2000, this cyclonic circulation has strengthened and expanded. After the early RSOD, the cyclonic circulation in the north gradually dissipated, exhibiting characteristics of anticyclonic airflow (Figure 4c,d). This spatiotemporal evolution pattern became especially pronounced post-2000. A fully developed anticyclonic circulation differential field emerged over the northeast region, with its circulation center precisely situated over the Greater Khingan Range (Figure 4b,d).
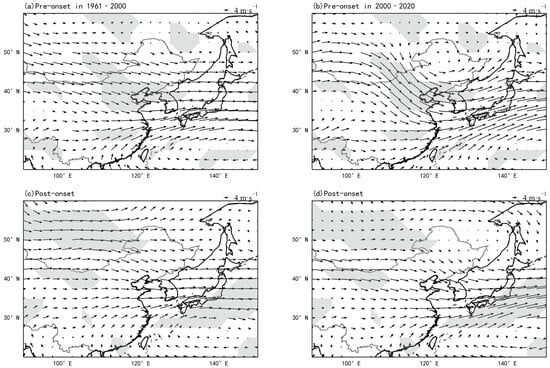
Figure 4.
Composite 10-day wind patterns (vectors: wind speed; shade: regions exceeding 95% confidence level) during early RSOD. (a) Pre-onset (1961–2000); (b) Pre-onset (2000–2020); (c) Post-onset (1961–2000); (d) Post-onset (2000–2020).
Compared with the early rainy season, the cyclonic circulation over NEC during the delayed rainy season significantly weakened pre- and post-2000 (Figure 5). A composite wind field analysis reveals that delayed rainy season events demonstrate distinct phase-dependent circulation dynamics: atmospheric circulation intensifies preceding onset but weakens significantly following commencement, exhibiting opposing trends between pre- and post-onset periods. Notably, these circulation anomalies have exhibited significantly enhanced intensity in the post-2000 climatic regime.
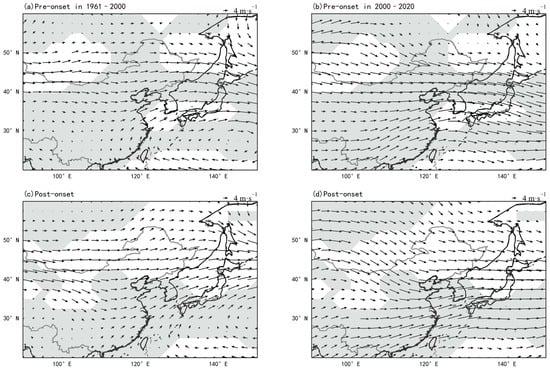
Figure 5.
Composite 10-day wind patterns (vectors: wind speed; shade: regions exceeding 95% confidence level) during delayed RSOD. (a) Pre-onset (1961–2000); (b) Pre-onset (2000–2020); (c) Post-onset (1961–2000); (d) Post-onset (2000–2020).
Enhanced pre-onset cyclonic circulation promotes rainfall initiation, while subsequent anticyclonic transition stabilizes precipitation. The circulation shows a difference in cyclonic characteristics before and after the RSOD. Post-2000 amplification of these circulation shifts has a significant impact on the RSOD and rainfall in NEC. A comparison of Figure 4 and Figure 5 reveals that the wind field during the 10 days pre- and post-onset has undergone a significant transformation in the two periods around 2000, with more than half of the grid points passing the significance test (α = 0.05). This indicates that the main contribution to the increased variability of the RSOD after 2000 comes from the delayed rainy season. Numerous studies have confirmed that El Niño events influence precipitation in certain regions of China, particularly in the south and east, by regulating mid-latitude atmospheric circulation [29,30]. However, this influence is less clear and generally not statistically significant in NEC. This study focuses on characterizing the key atmospheric circulation changes associated with the observed precipitation shift. Understanding these structural changes in circulation is a critical prerequisite for unraveling the complex interplay of underlying climate drivers—a crucial direction for future research aimed at attributing the observed shifts.
3.2.2. Hydrological Regime Shifts
Figure 6 and Figure 7 illustrate the water vapor flux with divergence and the RH before and after the RSOD during the period from 1961 to 2000, respectively. Observational analyses reveal that water vapor flux divergence over NEC before the RSOD is characterized by negative values (Figure 6a), indicative of convergent atmospheric circulation that facilitates moisture advection from the surroundings. Post-onset (Figure 6b), the sustained intensification of water vapor flux ensures adequate hydrological supply for precipitation systems, with this dual-phase moisture regime serving as a critical stabilizer for rainy season persistence. The difference in water vapor flux before and after the onset timing directly reflects the dynamic balance of moisture input and output over this region, indicating a convergent airflow that channels moisture from eastern Mongolia and the Sea of Japan into NEC (Figure 6c).
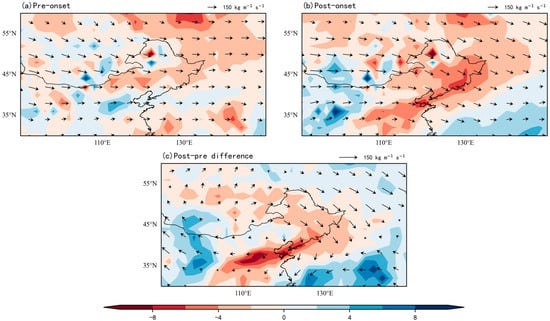
Figure 6.
Composite water vapor flux (vectors: kg m−1 s−1) and divergence (shade: 10−5 kg m−2 s−1) during early RSOD (1961–2000). (a) Pre-onset; (b) Post-onset; (c) Anomaly (Post-onset minus Pre-onset).
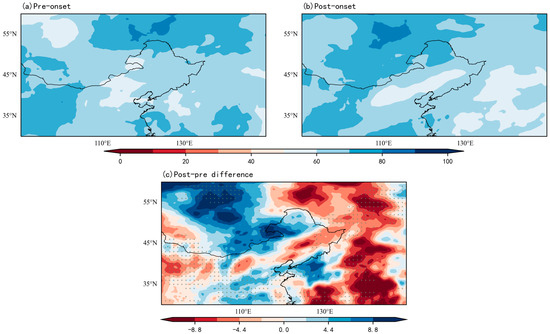
Figure 7.
Composite RH (%) during the early RSOD (1961–2000). Stippling indicates regions exceeding the 95% confidence level. (a) Pre-onset; (b) Post-onset; (c) Anomaly (Post-onset minus Pre-onset).
RH patterns demonstrate phased heterogeneity (Figure 7): northwest and southeast regions show progressive humidification post-onset, while a northeast–southwest oriented aridification belt emerges centrally (Figure 7b). This spatial dichotomy arises from orographic effects—the Changbai and Greater Khingan Mountains impede moisture replenishment, causing precipitation-driven atmospheric drying to outweigh convergent moisture inputs.
Figure 8 shows the water vapor flux and divergence field before and after the early RSOD for the period 2000–2020. Enhanced pre-onset water vapor convergence spatially coincides with regions exhibiting advanced onset timing (Figure 1 and Figure 8), confirming circulation-mediated moisture advection as a critical onset determinant. Spatiotemporal heterogeneity manifests through opposing trends: southern NEC experiences a water vapor flux decrease, while northern regions show intensification, establishing a persistent southeast-northwest moisture gradient. Post-onset northward migration of divergence maxima reflects intensified water vapor transport from subtropical sources, particularly the western Pacific (Figure 8c). Despite a much stronger decline in RH during early rainy season onset in 2000–2020 compared to pre-2000 periods (Figure 9c), large-scale atmospheric circulation maintained a positive moisture budget over NEC, indicating persistent moisture recycling mechanisms stabilized subsequent rainy season progression.
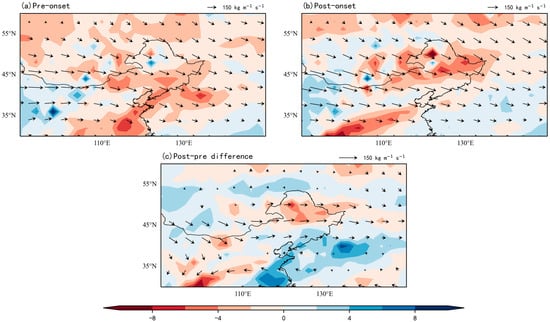
Figure 8.
Composite water vapor flux (vectors: kg m−1 s−1) and divergence (shade: 10−5 kg m−2 s−1) during early RSOD (2000–2020). (a) Pre-onset; (b) Post-onset; (c) Anomaly (Post-onset minus Pre-onset).
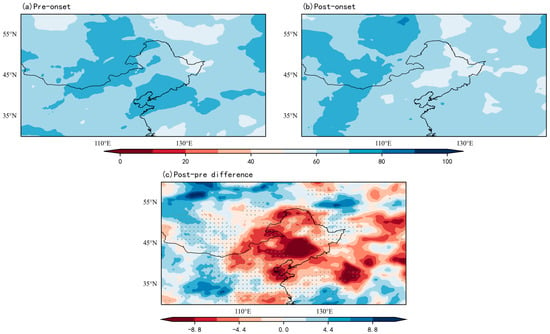
Figure 9.
Composite RH (%) during the early RSOD (2000–2020). Stippling indicates regions exceeding the 95% confidence level. (a) Pre-onset; (b) Post-onset; (c) Anomaly (Post-onset minus Pre-onset).
Compared to the early rainy season, the delayed rainy season shows enhanced pre-onset water vapor flux phases that reflect intensified moisture transport while exhibiting post-onset weakening (Figure 10a,b). After the RSOD, rapid circulation reorganization triggers a marked weakening of moisture advection, disrupting hydrological continuity and critically constraining rainy season sustainability through this mechanism. Throughout the onset period, the RH in the mid-eastern part of NEC remains persistently lower than in other regions (Figure 11a,b). Notably, despite the RSOD differences, both delayed and early rainy seasons derive moisture mainly from consistent source regions—eastern Mongolia and the Sea of Japan. In contrast, the most pronounced decline in RH occurs in the northwest.
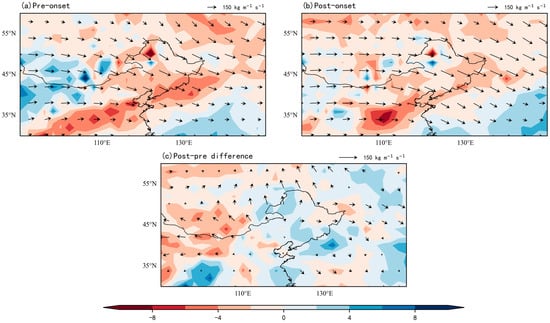
Figure 10.
Composite water vapor flux (vectors: kg m−1 s−1) and divergence (shade: 10−5 kg m−2 s−1) during delayed RSOD (1961–2000). (a) Pre-onset; (b) Post-onset; (c) Anomaly (Post-onset minus Pre-onset).
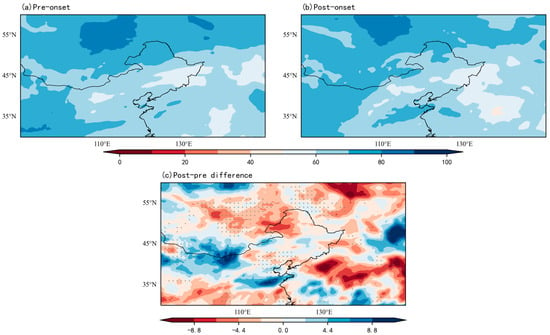
Figure 11.
Composite RH (%) during the delayed RSOD (1961–2000). Stippling indicates regions exceeding the 95% confidence level. (a) Pre-onset; (b) Post-onset; (c) Anomaly (Post-onset minus Pre-onset).
Figure 12 shows the water vapor flux and divergence field before and after the delayed RSOD for the period 2000–2020. Before the delayed RSOD, water vapor flux across NEC and the surrounding regions exhibited significant intensification (Figure 12a). After the onset, while the flux magnitude declined, its spatial increasing trend persisted, with NEC experiencing further moisture accumulation (Figure 12b). During the initial phase of delayed rainy seasons, regional moisture advection maintained enhanced intensity. Consistent with this dynamic, Figure 13 reveals stable RH in NEC throughout the onset period, contrasting sharply with the pronounced drying over the northwestern Pacific—the dominant moisture source for delayed rainy seasons during 2000–2020, aligning closely with early rainy season patterns.
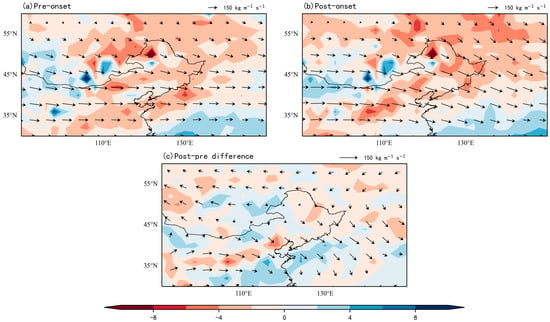
Figure 12.
Composite water vapor flux (vectors: kg m−1 s−1) and divergence (shade: 10−5 kg m−2 s−1) during delayed RSOD (2000–2020). (a) Pre-onset; (b) Post-onset; (c) Anomaly (Post-onset minus Pre-onset).
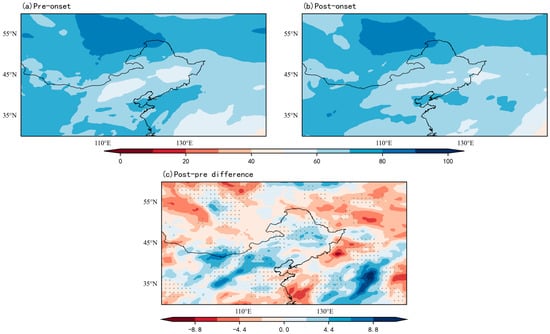
Figure 13.
Composite RH (%) during the delayed RSOD (2000–2020). Stippling indicates regions exceeding the 95% confidence level. (a) Pre-onset; (b) Post-onset; (c) Anomaly (Post-onset minus Pre-onset).
4. Discussion
This study analyzes daily precipitation data from 66 meteorological observation stations for NEC between 1961 and 2020 to investigate spatiotemporal variation and linkage between atmospheric circulation, water vapor transport, and the RSOD. The principal findings reveal the following:
The results demonstrate significant temporal divergence in onset dates, with an average RSOD at day 197 but exhibiting distinct regime shifts before and after 2000. During 1961–2000, the maximum interannual variation reached 35 days, while post-2000 variability increased markedly to 56 days, reflecting the enhanced volatility.
The analysis of atmospheric circulation demonstrates a clear transition from strong cyclonic convergence during the pre-onset period to systematic weakening after onset, with this pattern becoming increasingly pronounced in 21st-century observations. This dynamic evolution underscores the growing impacts of dynamic forcing on the RSOD.
A discernible reorganization of water vapor paths occurred circa 2000, where pathways originating from eastern Mongolia–Sea of Japan weakened while northwestern Pacific-sourced flows intensified, representing a key innovation of this study. Although transport intensity remained stable, observational data revealed significantly divergent flux convergence patterns: enhanced moisture convergence was observed during early onset years, while decreased convergence characterized delayed onset years. These distinct hydrological regimes established contrasting preconditions for rainy season development. These interconnected changes have increased prediction uncertainty while offering a dynamical framework to improve monsoon onset forecasting for agricultural applications in NEC.
Author Contributions
Q.C. and H.Z. designed the study. S.L. (Shuwen Li) developed the methodology and visualized the results. W.W. implemented the software and conducted the formal analysis. J.Y. and T.Z. validated the data and results. W.W. prepared the original draft, which was reviewed and revised by H.Z. Supervision was provided by Q.S. and S.L. (Shuci Liu) Project administration was handled by Q.C. All authors have read and agreed to the published version of the manuscript.
Funding
This work was supported by the National Natural Science Foundation of China (42201025), the Key R&D projects in Ningxia Autonomous Region (2023BEG02054), Foreign Expert Project (G2023014051L).
Data Availability Statement
The data presented in this study are available on request from the corresponding authors due to privacy.
Conflicts of Interest
Authors Jinxia Yu, Tao Zheng were employed by Fujian Provincial Investigation Design and Research Institute of Water Conservancy and Hydropower. The remaining authors declare that the research was conducted in the absence of any commercial or financial relationships that could be construed as a potential conflict of interest.
Abbreviations
The following abbreviations are used in this manuscript:
| RSOD | Rainy season onset date |
| NEC | Northeast China |
| WPSH | Western Pacific Subtropical High |
| SST | Sea surface temperature |
| ENSO | El Niño–Southern Oscillation |
| IOD | Indian Ocean Dipole |
| RH | Relative humidity |
| ECMWF | European Centre for Medium-Range Weather Forecasts |
| NCEP | National Centers for Environmental Prediction |
| NCAR | National Center for Atmospheric Research |
| CMA | China Meteorological Administration |
References
- Tahara, R.; Hiraga, Y.; Kazama, S. Climate change effects on the localized heavy rainfall event in northern Japan in 2022: Uncertainties in a pseudo-global warming approach. Atmos. Res. 2025, 314, 107780. [Google Scholar] [CrossRef]
- Luković, J.; Chiang, J.C.H.; Blagojević, D.; Sekulić, A. A Later Onset of the Rainy Season in California. Geophys. Res. Lett. 2021, 48, e2020GL090350. [Google Scholar] [CrossRef]
- Boubacar, I.; Moussa, W.; Moussa, S.; Safietou, S.; Boubacar, B. Agroclimatological Characteristics of Rainy Seasons in Southwestern Burkina Faso during the 1970-2013 Period. Atmos. Clim. Sci. 2022, 12, 330–357. [Google Scholar] [CrossRef]
- Cruz, G.l.; Huerta, A.; CarloEspinoza, J.; Casimiro, W. Present Variability and Future Change in Onset and Cessation of the Rainy Season Over Peru. Int. J. Climatol. 2024, 45, e8700. [Google Scholar] [CrossRef]
- Irannezhad, M.; Liu, J.; Chen, D. Influential climate teleconnections for spatiotemporal precipitation variability in the Lancang-Mekong River basin from 1952 to 2015. J. Geophys. Res. Atmos. 2020, 125, e2020JD033331. [Google Scholar] [CrossRef]
- Wasko, C.; Nathan, R.; Stein, L.; O’Shea, D. Evidence of shorter more extreme rainfalls and increased flood variability under climate change. J. Hydrol. 2021, 603, 126994. [Google Scholar] [CrossRef]
- Lu, M.; Song, X.; Yang, N.; Wu, W.; Deng, S. Spatial and Temporal Variations in Rainfall Seasonality and Underlying Climatic Causes in the Eastern China Monsoon Region. Water 2025, 17, 522. [Google Scholar] [CrossRef]
- Dong, Z.; Gui, S.; Yang, R.; Cheng, J.; Yang, H.; Ma, J. Interdecadal variation of precipitation over Yunnan, China in summer and its possible causes. Front. Environ. Sci. 2023, 11, 2023. [Google Scholar] [CrossRef]
- Liu, L.; Gao, C.; Zhu, Z.; Zhang, S.; Tang, X. Spatiotemporal evolution patterns and underlying formation mechanisms of monsoon rainfall across eastern China: A complex network perspective. Atmos. Res. 2024, 304, 107363. [Google Scholar] [CrossRef]
- Xu, H.; Song, Y.; Cao, J.; Lan, J.; Zhang, J.; Zhou, K.E.; Wang, J.; Cheng, P.; Hong, B.; Cheng, J.; et al. Heterogeneity of the East Asian rainfall influenced by solar-forced western Pacific subtropical high. Commun. Earth Environ. 2024, 5, 521. [Google Scholar] [CrossRef]
- He, J.; Deng, Y.; Fosu, B.; Lin, Y.-H.; Lu, K. Constraining Regional Hydrological Sensitivity Over Tropical Oceans. Geophys. Res. Lett. 2024, 51, e2024GL109374. [Google Scholar] [CrossRef]
- Yin, H.; Fowler, H.J.; Blenkinsop, S.; Wu, Z.; He, H.; Li, Y. ENSO and IOD contributions to seasonal meteorological droughts over the Yangtze River basin. Int. J. Climatol. 2023, 43, 8120–8136. [Google Scholar] [CrossRef]
- Cao, Q.; Hao, Z.; Yuan, F.; Su, Z.; Berndtsson, R. ENSO Influence on Rainy Season Precipitation over the Yangtze River Basin. Water 2017, 9, 469. [Google Scholar] [CrossRef]
- Prolay, S.; Rahul, M.; Goswami, B.N. Present and future of the South Asian summer monsoon’s rainy season over Northeast India. Npj Clim. Atmos. Sci. 2023, 6, 170. [Google Scholar] [CrossRef]
- Menon, A.; Levermann, A.; Schewe, J. Enhanced future variability during India’s rainy season. Geophys. Res. Lett. 2013, 40, 3242–3247. [Google Scholar] [CrossRef]
- Gaspar, T.H.; Trigo, R.M.; Ramos, A.M.; Raghuvanshi, A.S.; Russo, A.; Soares, P.M.M.; Ferreira, T.M.; Agarwal, A. Quantifying Multi-Day Precipitation Extremes and Their Linkages With Atmospheric Moisture Flux Over India. Int. J. Clim. 2025, 45, e8751. [Google Scholar] [CrossRef]
- Hua, T.; Wang, N.; Liu, J.; Zhang, S.; Tan, Q. The role of external and local atmospheric moisture fluxes in the interannual variability of peak summer precipitation over the northern fringe of the East Asian summer monsoon. J. Hydrol. 2023, 625, 129912. [Google Scholar] [CrossRef]
- Infanti, J.M.; Kirtman, B.P. North American rainfall and temperature prediction response to the diversity of ENSO. Clim. Dyn. 2016, 46, 3007–3023. [Google Scholar] [CrossRef]
- Morales, F.E.C.; Rodrigues, D.T.; Marques, T.V.; Amorim, A.C.B.; de Oliveira, P.T.; Gonçalves, W.A.; Lucio, P.S. Spatiotemporal Analysis of Extreme Rainfall Frequency in the Northeast Region of Brazil. Atmosphere 2023, 14, 531. [Google Scholar] [CrossRef]
- Bai, L.; Liu, T.; Sha, A.; Li, D. The Spatiotemporal Fluctuations of Extreme Rainfall and Their Potential Influencing Factors in Sichuan Province, China, from 1970 to 2022. Remote Sens. 2025, 17, 883. [Google Scholar] [CrossRef]
- Rodrigues, D.T.; Gonçalves, W.A.; Spyrides, M.H.C.; Santos e Silva, C.M.; de Souza, D.O. Spatial distribution of the level of return of extreme precipitation events in Northeast Brazil. Int. J. Climatol. 2020, 40, 5098–5113. [Google Scholar] [CrossRef]
- Hersbach, H. Global reanalysis: Goodbye ERA-Interim, hello ERA5. ECMWF Newsl. 2019, 159, 17–24. [Google Scholar] [CrossRef]
- Kalnay, E.; Kanamitsu, M.; Kistler, R.; Collins, W.; Deaven, D.; Gandin, L.; Iredell, M.; Saha, S.; White, G.; Woollen, J.; et al. The NCEP/NCAR 40-Year Reanalysis Project. Bull. Am. Meteorol. Soc. 1996, 77, 437–472. [Google Scholar] [CrossRef]
- QX/T 639-2022; China Meteorological Administration. Monitoring Indices of Rainy Season in China—Rainy Season in Northeast China. China Meteorological Press: Beijing, China, 2022. (In Chinese)
- Pettitt, A.N. A Non-Parametric Approach to the Change-Point Problem. J. R. Stat. Society. Ser. C (Appl. Stat.) 1979, 28, 126–135. [Google Scholar] [CrossRef]
- He, J.; Ju, J.; Wen, Z.; Lü, J.; Jin, Q. A review of recent advances in research on Asian monsoon in China. Adv. Atmos. Sci. 2007, 24, 972–992. [Google Scholar] [CrossRef]
- Dai, L.; Cheng, T.F.; Lu, M. Summer Monsoon Rainfall Patterns and Predictability over Southeast China. Water Resour. Res. 2020, 56, e2019WR025515. [Google Scholar] [CrossRef]
- Hu, Z.-Z.; Kumar, A.; Huang, B.; Zhu, J.; L’Heureux, M.; McPhaden, M.J.; Yu, J.-Y. The Interdecadal Shift of ENSO Properties in 1999/2000: A Review. J. Clim. 2020, 33, 4441–4462. [Google Scholar] [CrossRef]
- Sun, L.; Yang, X.-Q.; Tao, L.; Fang, J.; Sun, X. Changing Impact of ENSO Events on the Following Summer Rainfall in Eastern China since the 1950s. J. Clim. 2021, 34, 8105–8123. [Google Scholar] [CrossRef]
- Gao, T.; Zhang, Q.; Luo, M. Intensifying effects of El Niño events on winter precipitation extremes in southeastern China. Clim. Dyn. 2020, 54, 631–648. [Google Scholar] [CrossRef]
Disclaimer/Publisher’s Note: The statements, opinions and data contained in all publications are solely those of the individual author(s) and contributor(s) and not of MDPI and/or the editor(s). MDPI and/or the editor(s) disclaim responsibility for any injury to people or property resulting from any ideas, methods, instructions or products referred to in the content. |
© 2025 by the authors. Licensee MDPI, Basel, Switzerland. This article is an open access article distributed under the terms and conditions of the Creative Commons Attribution (CC BY) license (https://creativecommons.org/licenses/by/4.0/).