Article

Application of Positive Mathematical Programming (PMP) in Sustainable Water Resource Management: A Case Study of Hetao Irrigation District, China

by
Jingwei Yao
1,
Julio Berbel
2,
Zhiyuan Yang
3,
Huiyong Wang
3 and
Javier Martínez-Dalmau
2,*
1
Key Laboratory of Soil and Water Conservation on the Loess Plateau of Ministry of Water Resources, Yellow River Institute of Hydraulic Research, Yellow River Conservancy Commission, Zhengzhou 450003, China
2
Water, Environmental and Agricultural Resources Economics Research Group (WEARE), Universidad de Cordoba, Campus de Rabanales, 14014 Cordoba, Spain
3
Inner Mongolia Hetao Irrigation District Water Conservancy Development Center, Bayannur 015000, China
*
Author to whom correspondence should be addressed.
Water 2025, 17(17), 2598; https://doi.org/10.3390/w17172598
Submission received: 29 July 2025 / Revised: 27 August 2025 / Accepted: 29 August 2025 / Published: 2 September 2025

Abstract

Water scarcity and soil salinization pose significant challenges to sustainable agricultural development in arid and semi-arid regions globally. This study applies Positive Mathematical Programming (PMP) to analyze agricultural water resource management in the Hetao Irrigation District (HID), China. The research constructs a comprehensive multi-stress-factor integrated PMP model to evaluate the compound impacts of water resource constraints, pricing policies, and environmental stress on agricultural production systems. The model incorporates crop-specific salinity tolerance thresholds and simulates farmer decision-making behaviors under various scenarios including water supply reduction (0–100%), water pricing increases (0.2–1.0 CNY/m3), and soil salinity stress (0–10 dS/m). The results reveal that the agricultural system exhibits significant vulnerability characteristics with critical thresholds concentrated in the 60–70% water resource utilization interval. Water pricing policies show limited effectiveness in low-price ranges, with wheat demonstrating the highest price sensitivity (−23.8% elasticity). Crop salinity tolerance analysis indicates that wheat–sunflower rotation systems maintain an 85% planting proportion even under extreme salinity conditions (10 dS/m), significantly outperforming individual crops. The study proposes a hierarchical water resource quota allocation system based on vulnerability thresholds and recommends promoting salt-tolerant rotation systems to enhance agricultural resilience. These findings provide scientific evidence for sustainable water resource management and agricultural adaptation strategies in water-stressed regions, contributing to both theoretical advancement of the PMP methodology and practical policy formulation for irrigation districts facing similar challenges.

1. Introduction

Water scarcity has become one of the most pressing challenges facing the world in the 21st century. The global agricultural sector consumes approximately 70% of freshwater resources, with this proportion reaching as high as 95% in some developing countries [1]. Climate change has led to increasing frequency and severity of extreme weather events, further disrupting water supply and agricultural cycles, exacerbating water stress and threatening agricultural sustainability [2]. This challenge is particularly acute in global arid and semi-arid regions. Against this backdrop, arid and semi-arid regions have become focal areas for research on agricultural water resource planning and management optimization methods [3,4,5]. Scholars have applied agricultural economic models to optimize water resource allocation from multiple perspectives including hydrology, economics, technology, and policy, providing support for agricultural system decision-making in arid and semi-arid regions [6,7,8,9,10,11,12,13,14]. Among these approaches, Positive Mathematical Programming (PMP) has demonstrated good applicability in analyzing farmers’ responses to water pricing policies and evaluating the economic impacts of various water resource management policies [15,16,17,18,19,20,21].
Positive Mathematical Programming is a modeling method commonly used in agricultural economics, resource allocation simulation, and farmer behavior modeling, particularly suitable for research on irrigation districts, water resources, and crop structure optimization. The theoretical foundation of this method was established by Richard E. Howitt in 1995 [22], effectively addressing the problem that traditional linear programming could not accurately simulate farm production plans. With continuous methodological development, PMP has been refined and widely applied under different agricultural environmental policy contexts. Heckelei and Britz extended the PMP method, enhancing its flexibility and accuracy [23]. Mérel and Howitt systematically analyzed the theoretical and applied evolution of PMP, emphasizing its importance in bioeconomic models and policy analysis [24]. In practical applications, Jansson and Heckelei utilized the PMP method to estimate crop supply models in EU regions, providing data support for agricultural policy formulation [25]. Cortignani and Severini analyzed the adoption of water-saving irrigation at the farm level, demonstrating the application potential of PMP in water resource management [19].
In recent years, PMP has been used to assess the impacts of uncertainty and climate change on agricultural environment and policy. Ghaffari et al. considered the uncertainty of climate change and used PMP to analyze the economic impacts of drought on agriculture [26]. Mardani, Najafabadi et al. studied sustainable planting patterns in southern Iran, considering resource allocation and environmental constraints, providing recommendations for regional agricultural sustainable development [27]. Layani et al. combined PMP with system dynamics models to analyze the impact of government policies on agricultural environmental sustainability, emphasizing the potential of PMP in policy evaluation [28]. Randall et al. focused on crop planning optimization under climate change uncertainty, demonstrating the application of PMP in irrigation water resource management under uncertain conditions [29].
Despite significant progress in PMP method research for agricultural water resource management, existing studies still have several limitations. First, regarding regional applicability, existing PMP research has mainly concentrated on Europe and parts of the Middle East, with relatively few application studies in China’s northern arid and semi-arid irrigation districts. The climatic conditions, agricultural systems, and water resource management systems in these studies differ significantly from those in China’s HID. Second, regarding environmental-constraint-factor consideration, most existing studies primarily focus on water resource constraints and economic factors, but inadequately consider soil salinization, a key environmental constraint factor prevalent in arid and semi-arid irrigation districts. Third, regarding multiple stress factor analysis, existing studies often analyze individual stress factors separately, lacking comprehensive assessment of the interactive effects of multiple stress factors. Fourth, regarding crop rotation system modeling, although some studies involve crop selection optimization, the representation and optimization analysis of rotation systems in PMP models is relatively weak. Finally, regarding policy tool evaluation, existing studies mainly focus on water pricing policies, with relatively insufficient modeling and evaluation of other policy tools.
The Hetao Irrigation District (HID), located in the upper reaches of the Yellow River Basin in China, represents a typical example of the contradiction between water resource scarcity and food production in arid and semi-arid regions. The increasingly prominent contradiction between water resource shortage and intensive agricultural production brings complex challenges to local food security and economic development. This irrigation district is an important region for grain and cash crop production in northern China [30], with approximately 3 million tons of annual grain production relying on about 5 billion m3 of water diverted from the Yellow River annually, accounting for approximately one-sixth of the Yellow River’s transit flow. As competition for water resources intensifies among different water-using sectors including agriculture, industry, urban areas, and ecological environment, HID requires scientific agricultural water resource models to quantify the effects of water resource management policies.
Based on the above research on background and limitations of existing studies, this research aims to construct a multi-stress factor integrated PMP model applicable to HID, systematically analyzing the compound impacts of water resource constraints, pricing policies, and environmental stress on agricultural production systems. This study expects to provide scientific evidence and decision support for sustainable agricultural development and water resource management in HID and similar regions globally, while promoting theoretical development and practical application of the PMP method under complex environmental constraint conditions.

2. Materials and Methods

2.1. Study Area

HID is located in Bayannur City, Inner Mongolia Autonomous Region, China, representing one of China’s three mega-scale irrigation districts and a major production area for wheat, corn, and sunflower seeds in China [31]. The total irrigated area of the district is 769,300 ha, including 623,700 ha of Yellow River irrigation, 89,800 ha of combined well and Yellow River irrigation, and 55,900 ha of pure well irrigation [32]. Agricultural production in this region relies almost entirely on water diverted from the Yellow River, with agricultural irrigation accounting for 95% of the total water diverted from the Yellow River [33]. The irrigation district has a typical temperate continental arid and semi-arid climate. Annual average precipitation ranges from 130 to 210 mm, with 70% concentrated from July to September. Annual potential evaporation reaches 2100~2300 mm. Water scarcity and soil salinization are the main limiting factors constraining agricultural production in this irrigation district. Soil survey data show that 63.6% of the irrigated area in the district faces salinization problems, with mild salinization areas accounting for 45.5%, moderate salinization areas for 16.0%, and severe salinization areas for 3.1% [34]. The irrigation district consists of five sub-districts: Wulanbuhe, Jiefangzha, Yongji, Yichang, and Wulate (Figure 1). The district supports the livelihoods of 1.4 million people through intensive agricultural production.

2.2. Current Agricultural Production Status

The high dependence on external water sources makes this region extremely vulnerable to Yellow River water resource allocation policies. Currently, HID mainly implements measures such as irrigation channel lining, water-saving irrigation technology, planned water use implementation, and volume-based charging systems to alleviate water scarcity problems in the region and achieve sustainable agricultural development [35,36]. HID has currently formed a diversified agricultural production system with grain crops as the main body and cash crops as supplements. Major crops account for more than 80% of the area and they include wheat, corn, and sunflower; cash crops include tomatoes, melons (watermelons and cantaloupe), and vegetables, with relatively small planting areas but high economic value. Crop rotation has become a common practice in HID to improve land utilization, increase yields, improve soil fertility, and control pests and diseases [37,38,39,40]. Among these, wheat–corn rotation and wheat–sunflower rotation are the main rotation patterns.
HID faces multiple challenges in water resource utilization. Firstly, the water resources supply is lower than demand and the scarcity has been exacerbated by accelerated urbanization and growing industrial development demand. Secondly, climate change has led to increased inter-annual and seasonal variations in Yellow River flow [41], increasing uncertainty with regard to the water resource supply. Thirdly, soil salinization problems are severe [42]. During the dry season, the proportion of farmland with groundwater mineralization above 2 g/L in HID reaches 60.9% (Table 1), seriously affecting crop selection and yields.

2.3. Methods

2.3.1. Positive Mathematical Programming (PMP)

The Positive Mathematical Programming (PMP) method, first proposed by Howitt [22], is a multi-stage modeling approach designed to calibrate agricultural production models to observed data, ensuring that the model accurately reflects the baseline production activities. This method is particularly well-suited for analyzing the impacts of policy changes, resource constraints, and environmental stresses on agricultural systems. The PMP approach typically involves three main stages:
Stage 1: Linear Programming (LP) Model
The first stage involves solving a standard linear programming model to maximize the total gross margin (TGM) of the agricultural production system, subject to resource constraints. The objective function and constraints are as follows:
Maximize T G M = p i × y i c i × x i
Subject to
Σ x i L ( L a n d   c o n s t r a i n t ) Σ w i × x i W ( W a t e r   c o n s t r a i n t ) x i x _ o b s i + ε ( C a l i b r a t i o n   c o n s t r a i n t )
where p i is the price of crop i , y i is the yield of crop i , c i is the variable cost of crop i , x i is the area of crop i , L is the total available land, W is the total available water, w i is the water requirement per unit area for crop i , x _ o b s i is the observed area of crop i , and ε is a small positive number.
The dual value (shadow price) of the calibration constraint, denoted as λ i , is obtained from this stage and used in the subsequent stages;
Stage 2: Calibration of the Cost Function
The second stage involves calibrating a non-linear cost function using the dual values obtained from the first stage. The most common functional form used is a quadratic cost function:
C   ( x i ) = ( d i + g i × x i ) × x i
where d i and g i are parameters of the quadratic cost function. These parameters are calibrated such that the marginal cost of production equals the marginal revenue at the observed production level:
p i × y i c i λ i = d i + 2 × g i × x _ o b s i
Stage 3: Non-Linear Programming (NLP) Model
The final stage involves solving a non-linear programming model with the calibrated quadratic cost function. The objective function is to maximize the total gross margin, which now includes the non-linear cost term:
Maximize TGM = Σ ( p i × y i × x i ( d i + 0.5 × g i × x i ) × x i )
Subject to the same land and water constraints as in the first stage. This non-linear model is then used for policy scenario analysis.
In this study, we constructed a multi-stress factor integrated PMP model to analyze the agricultural decision-making in HID. The model considers the impacts of water scarcity, water pricing, and soil salinization on crop selection and production. The decision variables and their corresponding ranges are presented in Table 2.
The method of analysis is based on a mathematical programming model that simulates the farmers’ decision as a response to changes in the economic, political, or environmental context. We selected Positive Mathematical Programming (PMP) to construct an agricultural decision model for HID, as it has been frequently used to simulate farmers’ changes in many world regions. This model framework includes three interrelated core modules: first, a baseline calibration module used to accurately reproduce currently observed crop planting structures and resource allocation patterns; second, a behavioral response function module used to capture farmers’ adaptive adjustment behaviors to changes in external conditions; and third, a scenario analysis module used to evaluate system response characteristics under different policy measures and environmental change scenarios [43]. This optimization model aims to maximize regional agricultural total gross margin under given resource constraints and policy constraints.
Objective Function:
Maximize Σ i p i × y i c i × x i 0.5 × Σ i γ i × x i 2
where p i = market price of crop i (CNY/kg), y i = yield per unit area of crop i (kg/ha), c i = variable cost per unit area of crop i (CNY/ha), x i = planting area of crop i (ha), and γ i = calibration parameter for crop i .
Main Constraints:
The land resource constraint is i   x i L
The water resource constraint is i   w i × x i W × ( 1 α )
The salinity stress constraint is y i = y i o × m a x 0 , 1 s i × m a x 0 , S T i
The specific meanings of parameters in constraints are L = total land area available for agricultural production in the region (ha), w i = water requirement per unit area for crop i (m3/ha), W = total water resource supply under baseline scenario (m3), α = water resource reduction ratio coefficient (range 0~1), y i o = potential yield of crop i under ideal conditions (kg/ha), s i = sensitivity coefficient of crop i to salinity stress (%/dS/m), S = soil salinity concentration (dS/m), and T i = salinity tolerance threshold of crop i (dS/m).

2.3.2. Data Sources and Processing

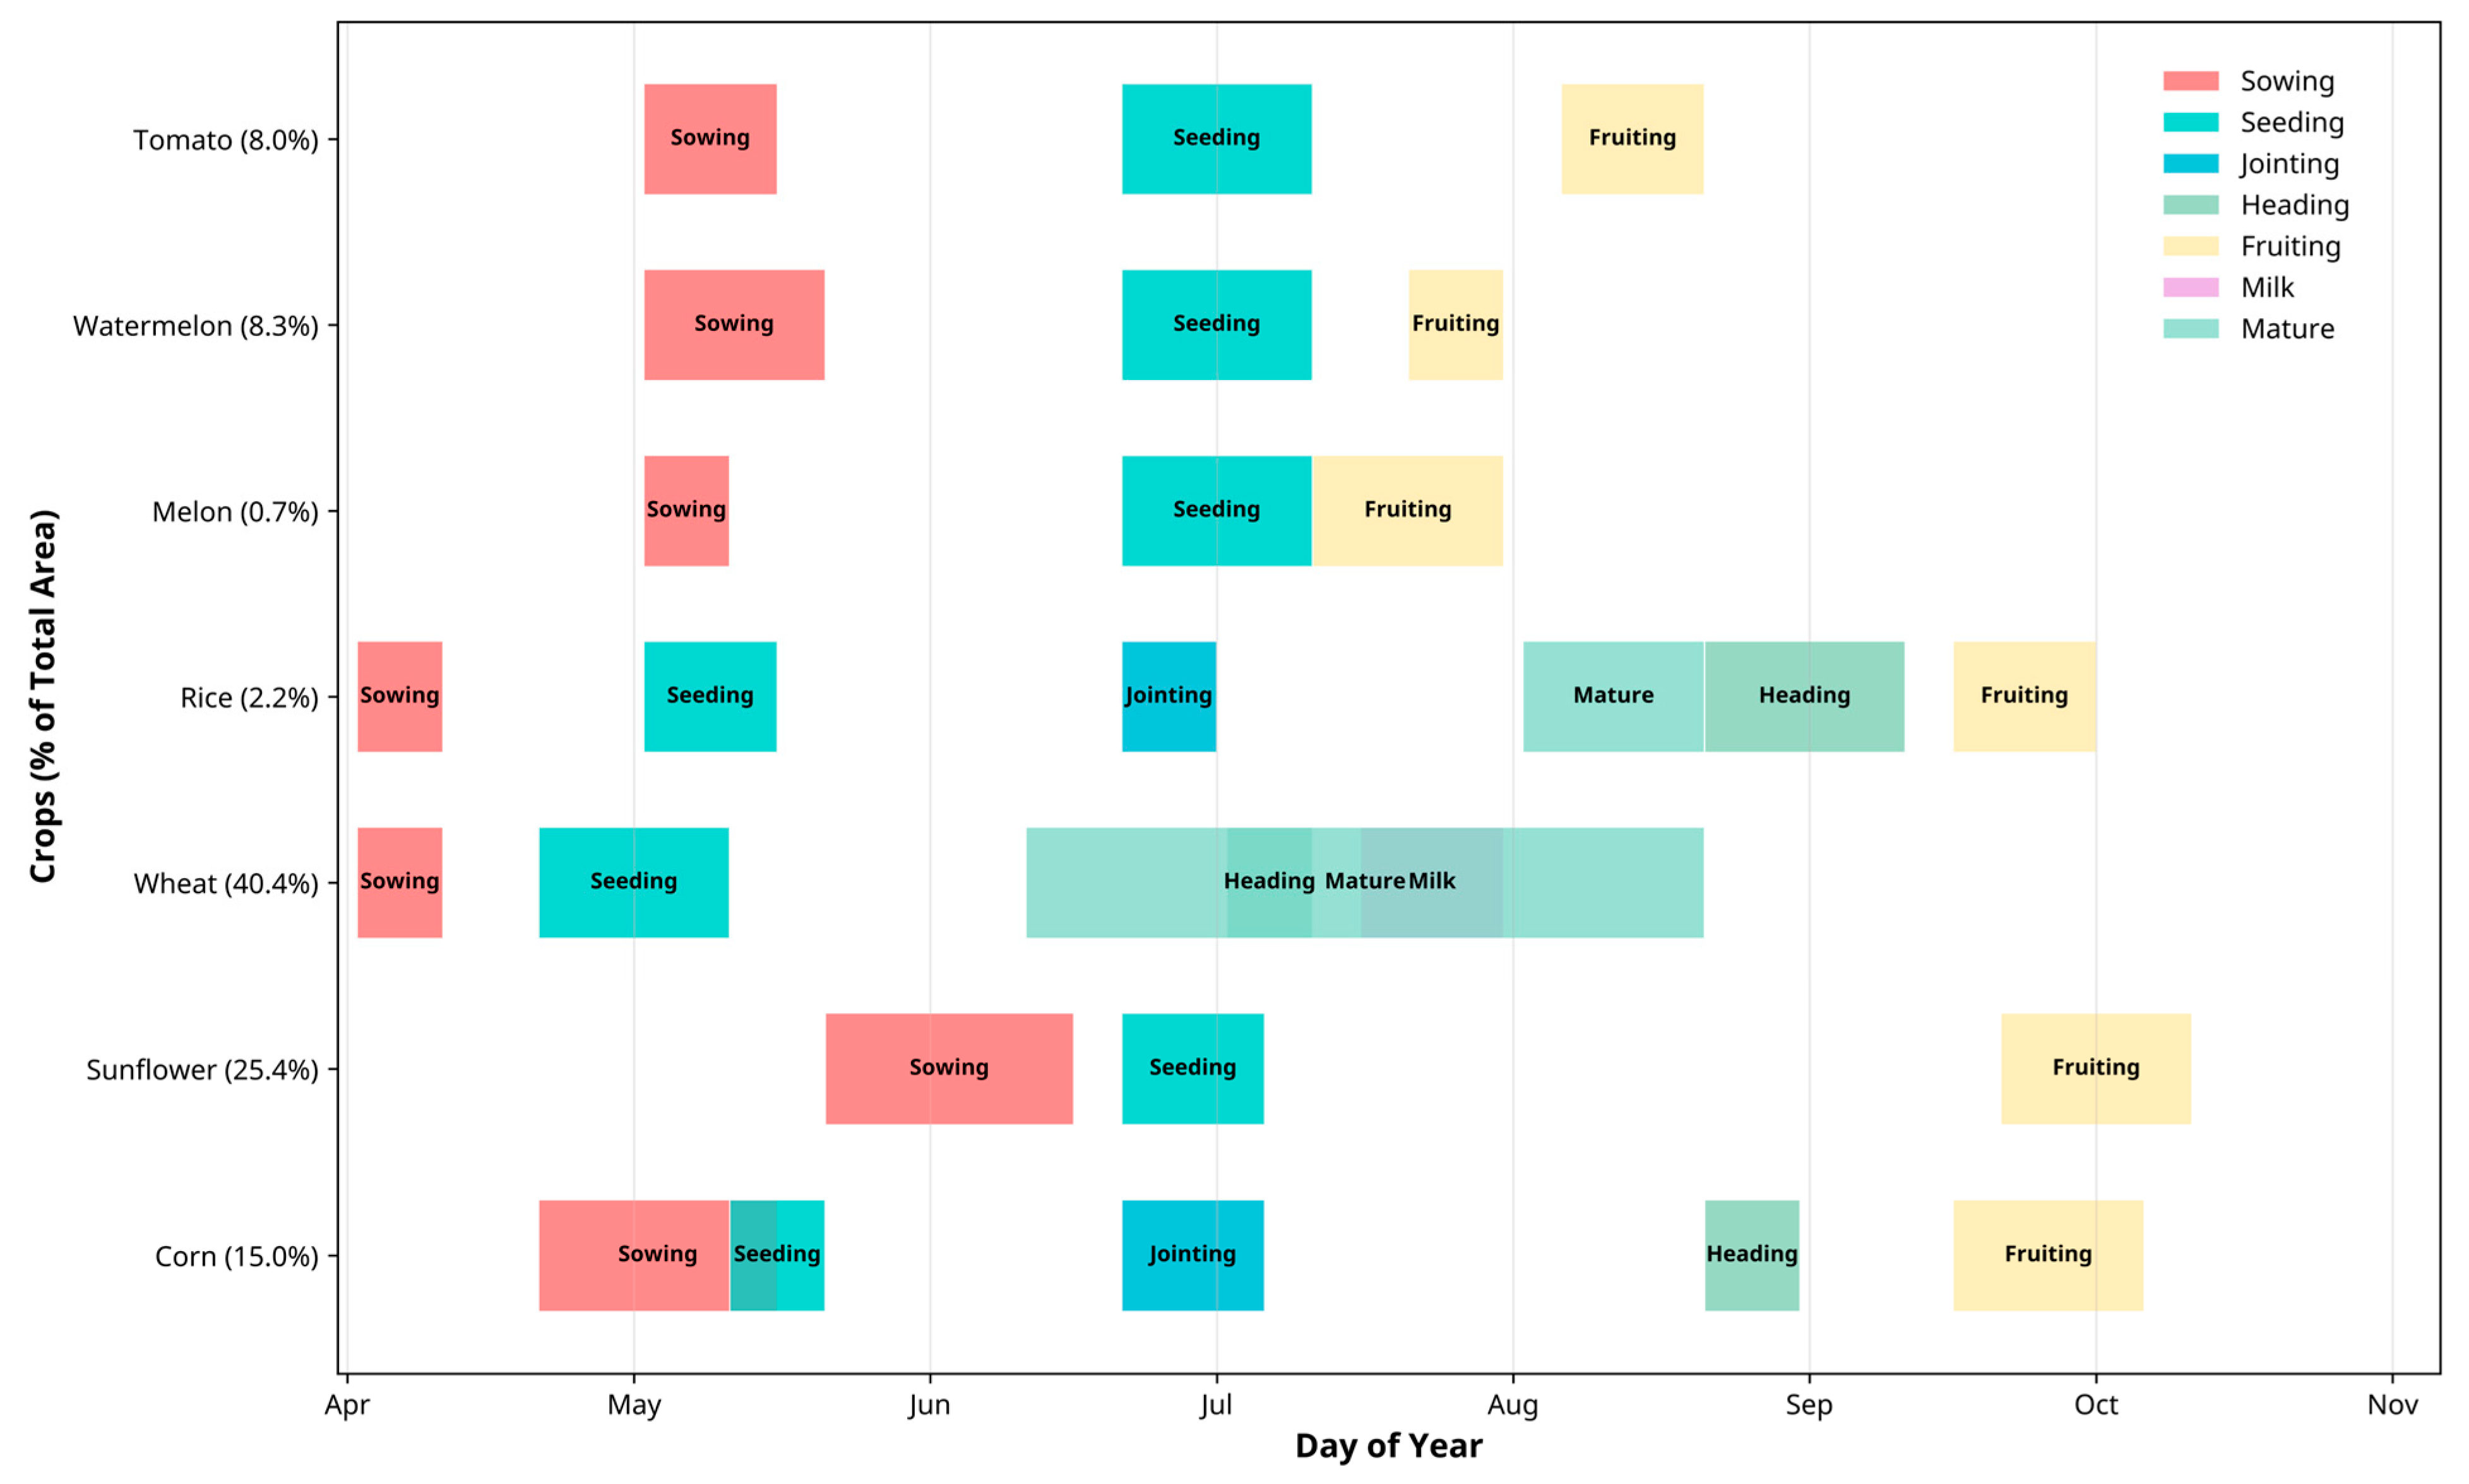
The data used in this study comes from comprehensive surveys of agricultural production, water resource utilization, and economic benefits in HID, as well as relevant socio-economic statistical yearbooks. Crop planting areas were obtained from actual survey data from the Inner Mongolia HID Water Conservancy Development Center and verified with remote sensing satellite image interpretation analysis to ensure accuracy. Crop yield data were obtained from the “Bayannur Statistical Yearbook” (2022–2024). Economic parameters including crop purchase prices and crop production costs were obtained through interviews with typical farmers in the irrigation district and public information published on the official website of Bayannur Statistical Bureau. Crop salinity tolerance parameters referenced salinity tolerance data published by FAO [44]. Crop water-requirement data came from irrigation management records of the Inner Mongolia HID Water Conservancy Development Center and crop water-requirement experiments conducted by relevant agricultural research institutions [32]. Water quality data were obtained from water quality monitoring data maintained by the Yellow River Conservancy Commission of the Ministry of Water Resources. The Yellow River diversion volume data was obtained from the Yellow River Water Resources Bulletin (2021–2023), officially released by the Yellow River Conservancy Commission of the Ministry of Water Resources of China. Based on [45] Figure 2 shows the main crops’ phenological information.

2.3.3. Choice of Modeling Approach

While metaheuristic algorithms are powerful optimization tools for a wide range of problems, the PMP method was chosen for this study due to its specific strengths in agricultural economic modeling. PMP is designed to perfectly calibrate the model to a single-year baseline, which is crucial for policy analysis where the starting point must be the observed reality. Furthermore, PMP is grounded in economic theory, providing a clear interpretation of the model parameters and results in the context of farmer behavior. Metaheuristic algorithms, while effective in finding optimal solutions, often lack this direct economic interpretation.
The implementation of the PMP model was carried out in the General Algebraic Modeling System (GAMS). For the optimization, this study utilized the CONOPT solver for the nonlinear aspects and the CPLEX solver for the linear portions of the model.

2.3.4. Scenario Design and Analysis Framework

To comprehensively evaluate the multi-dimensional impacts of water resource management policies, the study designed three main scenarios:
Scenario 1: Water Resource Supply Scenario
This scenario simulates the impact of gradually reducing Yellow River water resource allocation on agricultural production systems, setting the reduction range of Yellow River water resources from the current baseline level gradually to 100%, analyzing farmers’ adaptive adjustment behavior patterns through crop planting structure modification and water resource allocation optimization;
Scenario 2: Water Pricing Policy Scenario
This scenario focuses on analyzing the actual effects of water pricing mechanisms as water resource demand management policy tools, setting water prices gradually increasing from 0.2 CNY/m3 to 1.0 CNY/m3, systematically evaluating the degree of influence of price signals on farmers’ water use behavior and crop selection decisions;
Scenario 3: Soil Salinization Scenario
This scenario evaluates the vulnerability and adaptive capacity of agricultural production systems for continuously increasing soil salinity concentrations, setting soil salinity concentrations gradually increasing to 10 dS/m and analyzing yield responses and economic losses of various crops under different salinity levels.
In summary, the overall methodological framework of this study is presented in Figure 3.

3. Results and Analysis

3.1. Baseline Agricultural Production Characteristics in HID

Table 3 presents the basic production characteristics of six main crop categories in the study region, including yield per unit area, irrigation water requirements, crop prices, planting areas, production costs, gross margins, water productivity, and salinity thresholds. The results show that high-value cash crops such as tomatoes and watermelons, while having the highest gross margins per unit area, also represent the crop types with the highest water requirements and those which show high sensitivity to soil salinity stress. In contrast, traditional field crops such as wheat and sunflower have relatively low water resource requirements and better salinity tolerance, but with correspondingly lower economic returns. The agricultural system in HID shows distinct structural characteristics and risk vulnerabilities. The crop structure shows significant imbalance, with sunflower and corn dominating. Economic efficiency differences are substantial, with the gross margins of tomatoes and watermelons exceeding those of wheat by 4.4 times. Water use efficiency shows severe differentiation, with the highest (tomato–watermelon) differing from the lowest (wheat) by 3.4 times. Salinity tolerance differences are considerable, with corn showing the highest sensitivity (1.7 dS/m) and wheat showing the highest salt tolerance (6.0 dS/m).

3.2. Water Resource Supply Scenario Analysis

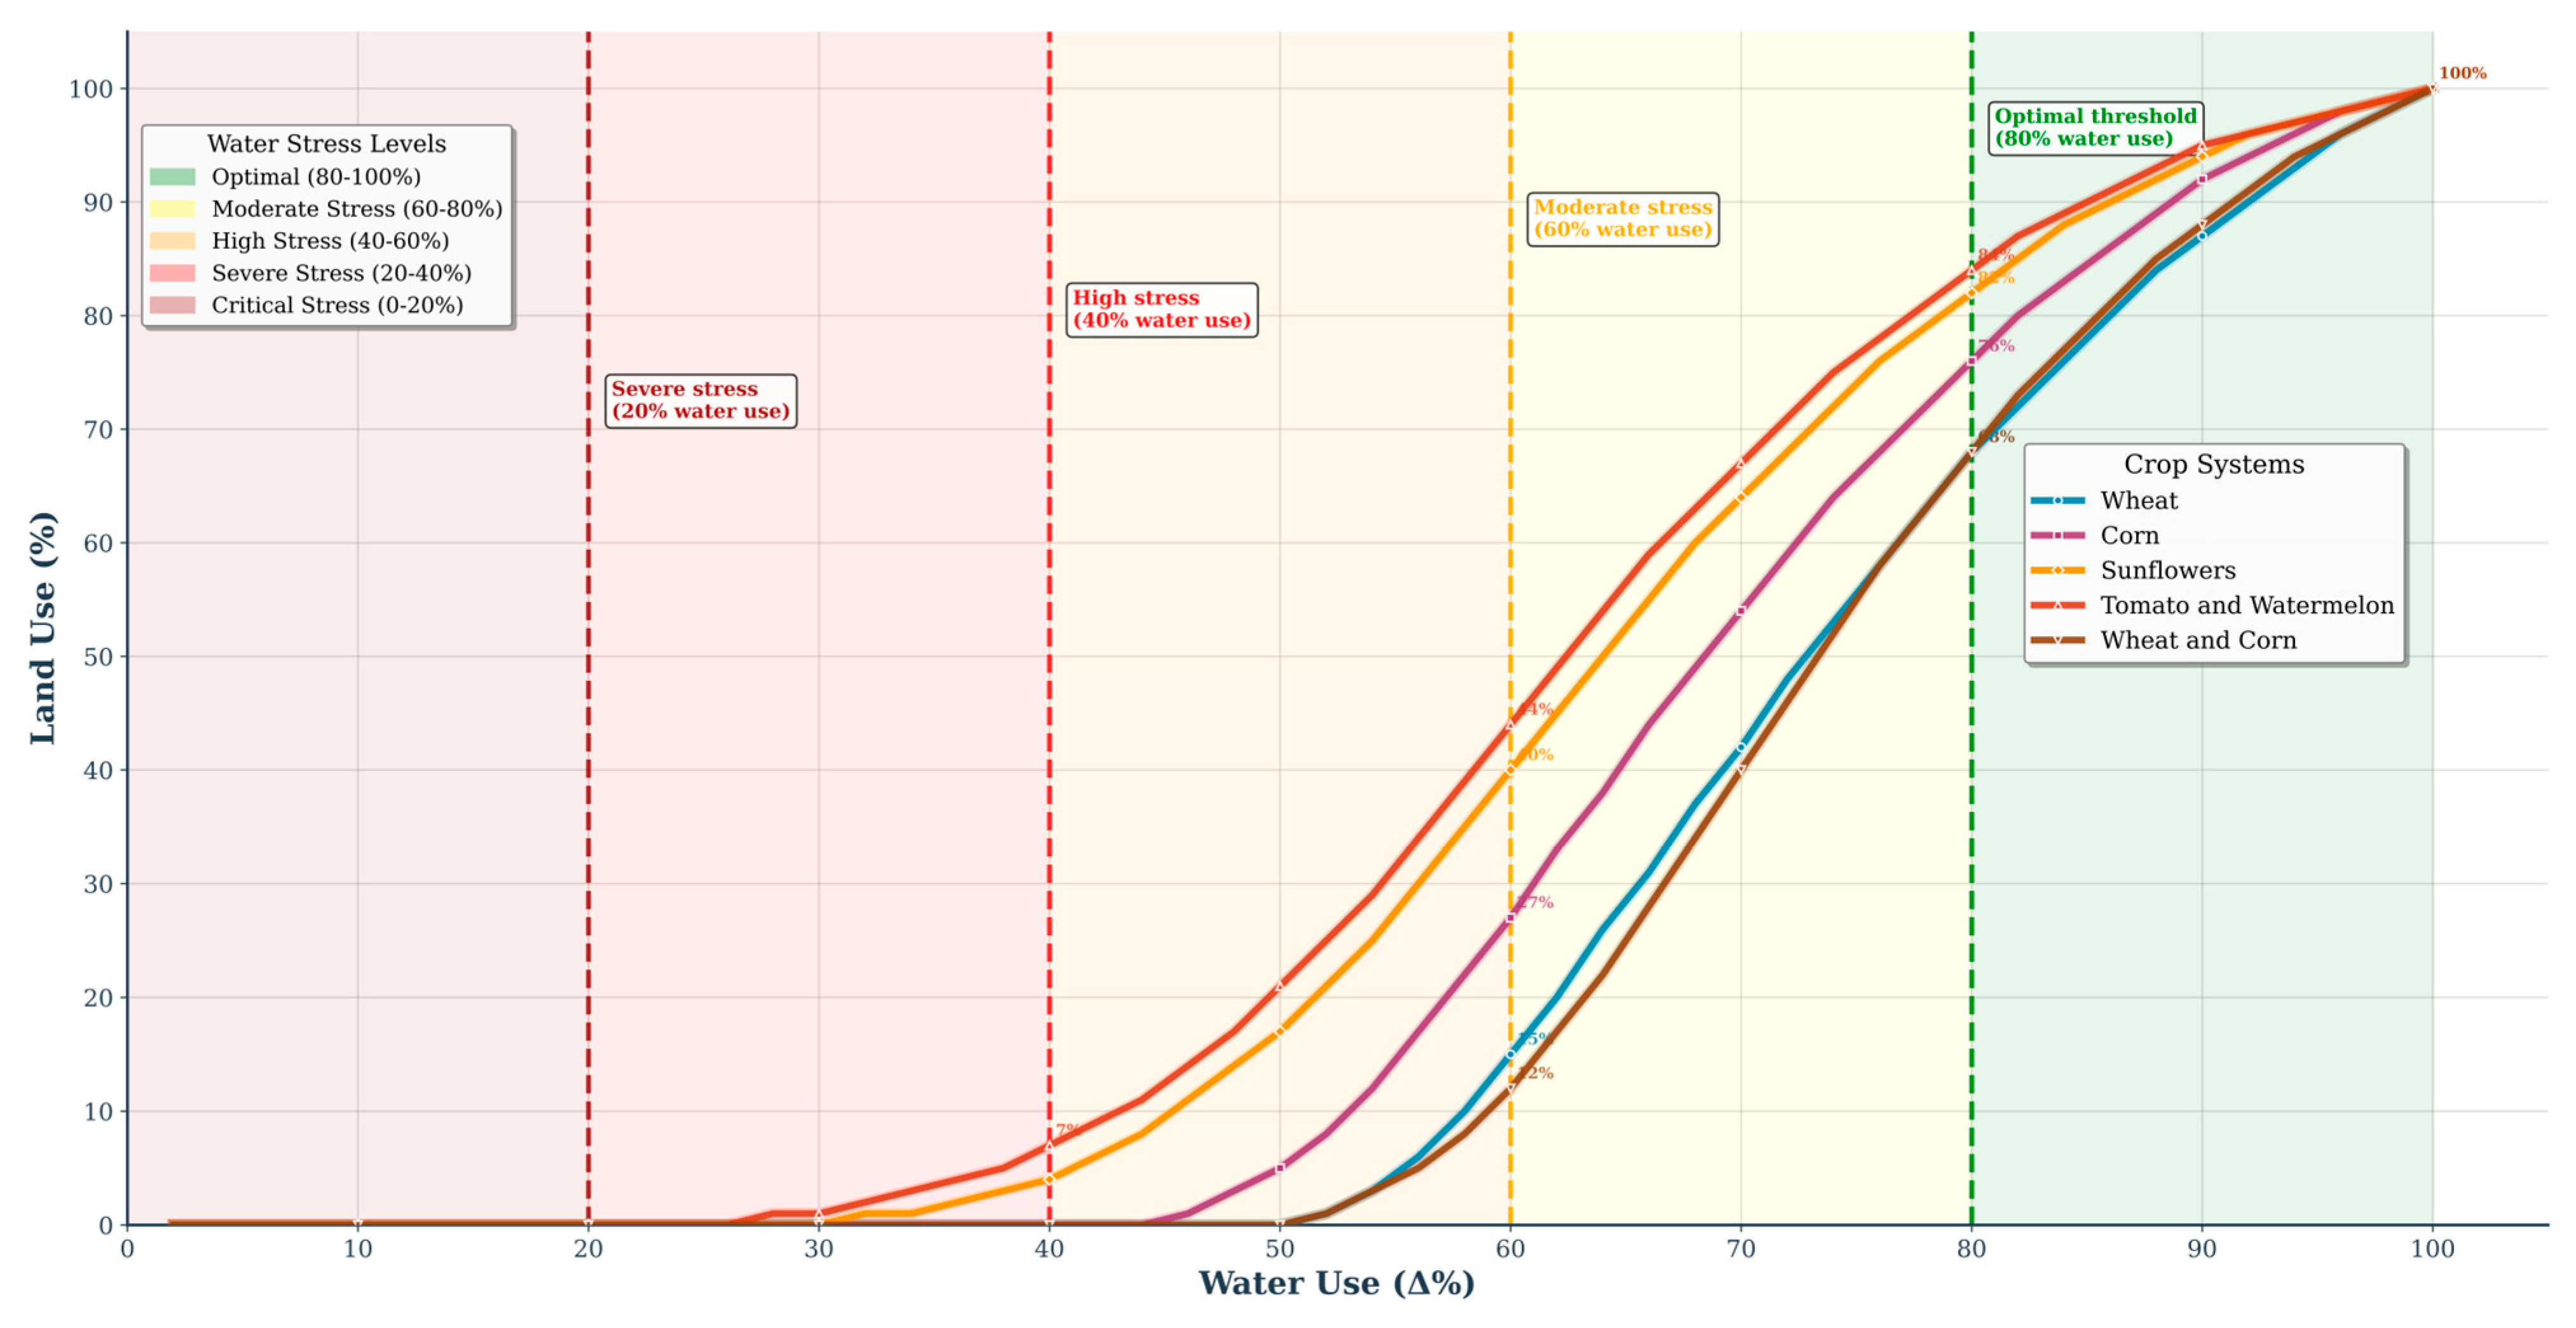
Figure 4 shows that HID water resources exhibit significant vulnerability characteristics. Under the lower water supply scenario (water resource <20%) vs. normal supply), all crop systems show 100% total loss rates, completely withdrawing from production, revealing the region’s high dependence on irrigation water resources. Vulnerability thresholds refer to the critical water utilization level at which each crop system reaches a 50% loss rate. Vulnerability thresholds are concentrated in the 60–70% water resource utilization interval, with tomato–watermelon reaching the threshold (62%) and wheat and rotation systems having the highest threshold (72%). This interval emerges as the critical transition point for agricultural systems moving from stable to unstable states. All crop systems show nonlinear decline trajectories, maintaining relative stability when water resource utilization is over 80% and declining rapidly below 60%. Therefore, the 60–70% water resource utilization interval serves as a critical warning window, representing the optimal intervention timing for threshold-based warning and response mechanisms under the existing irrigation system.
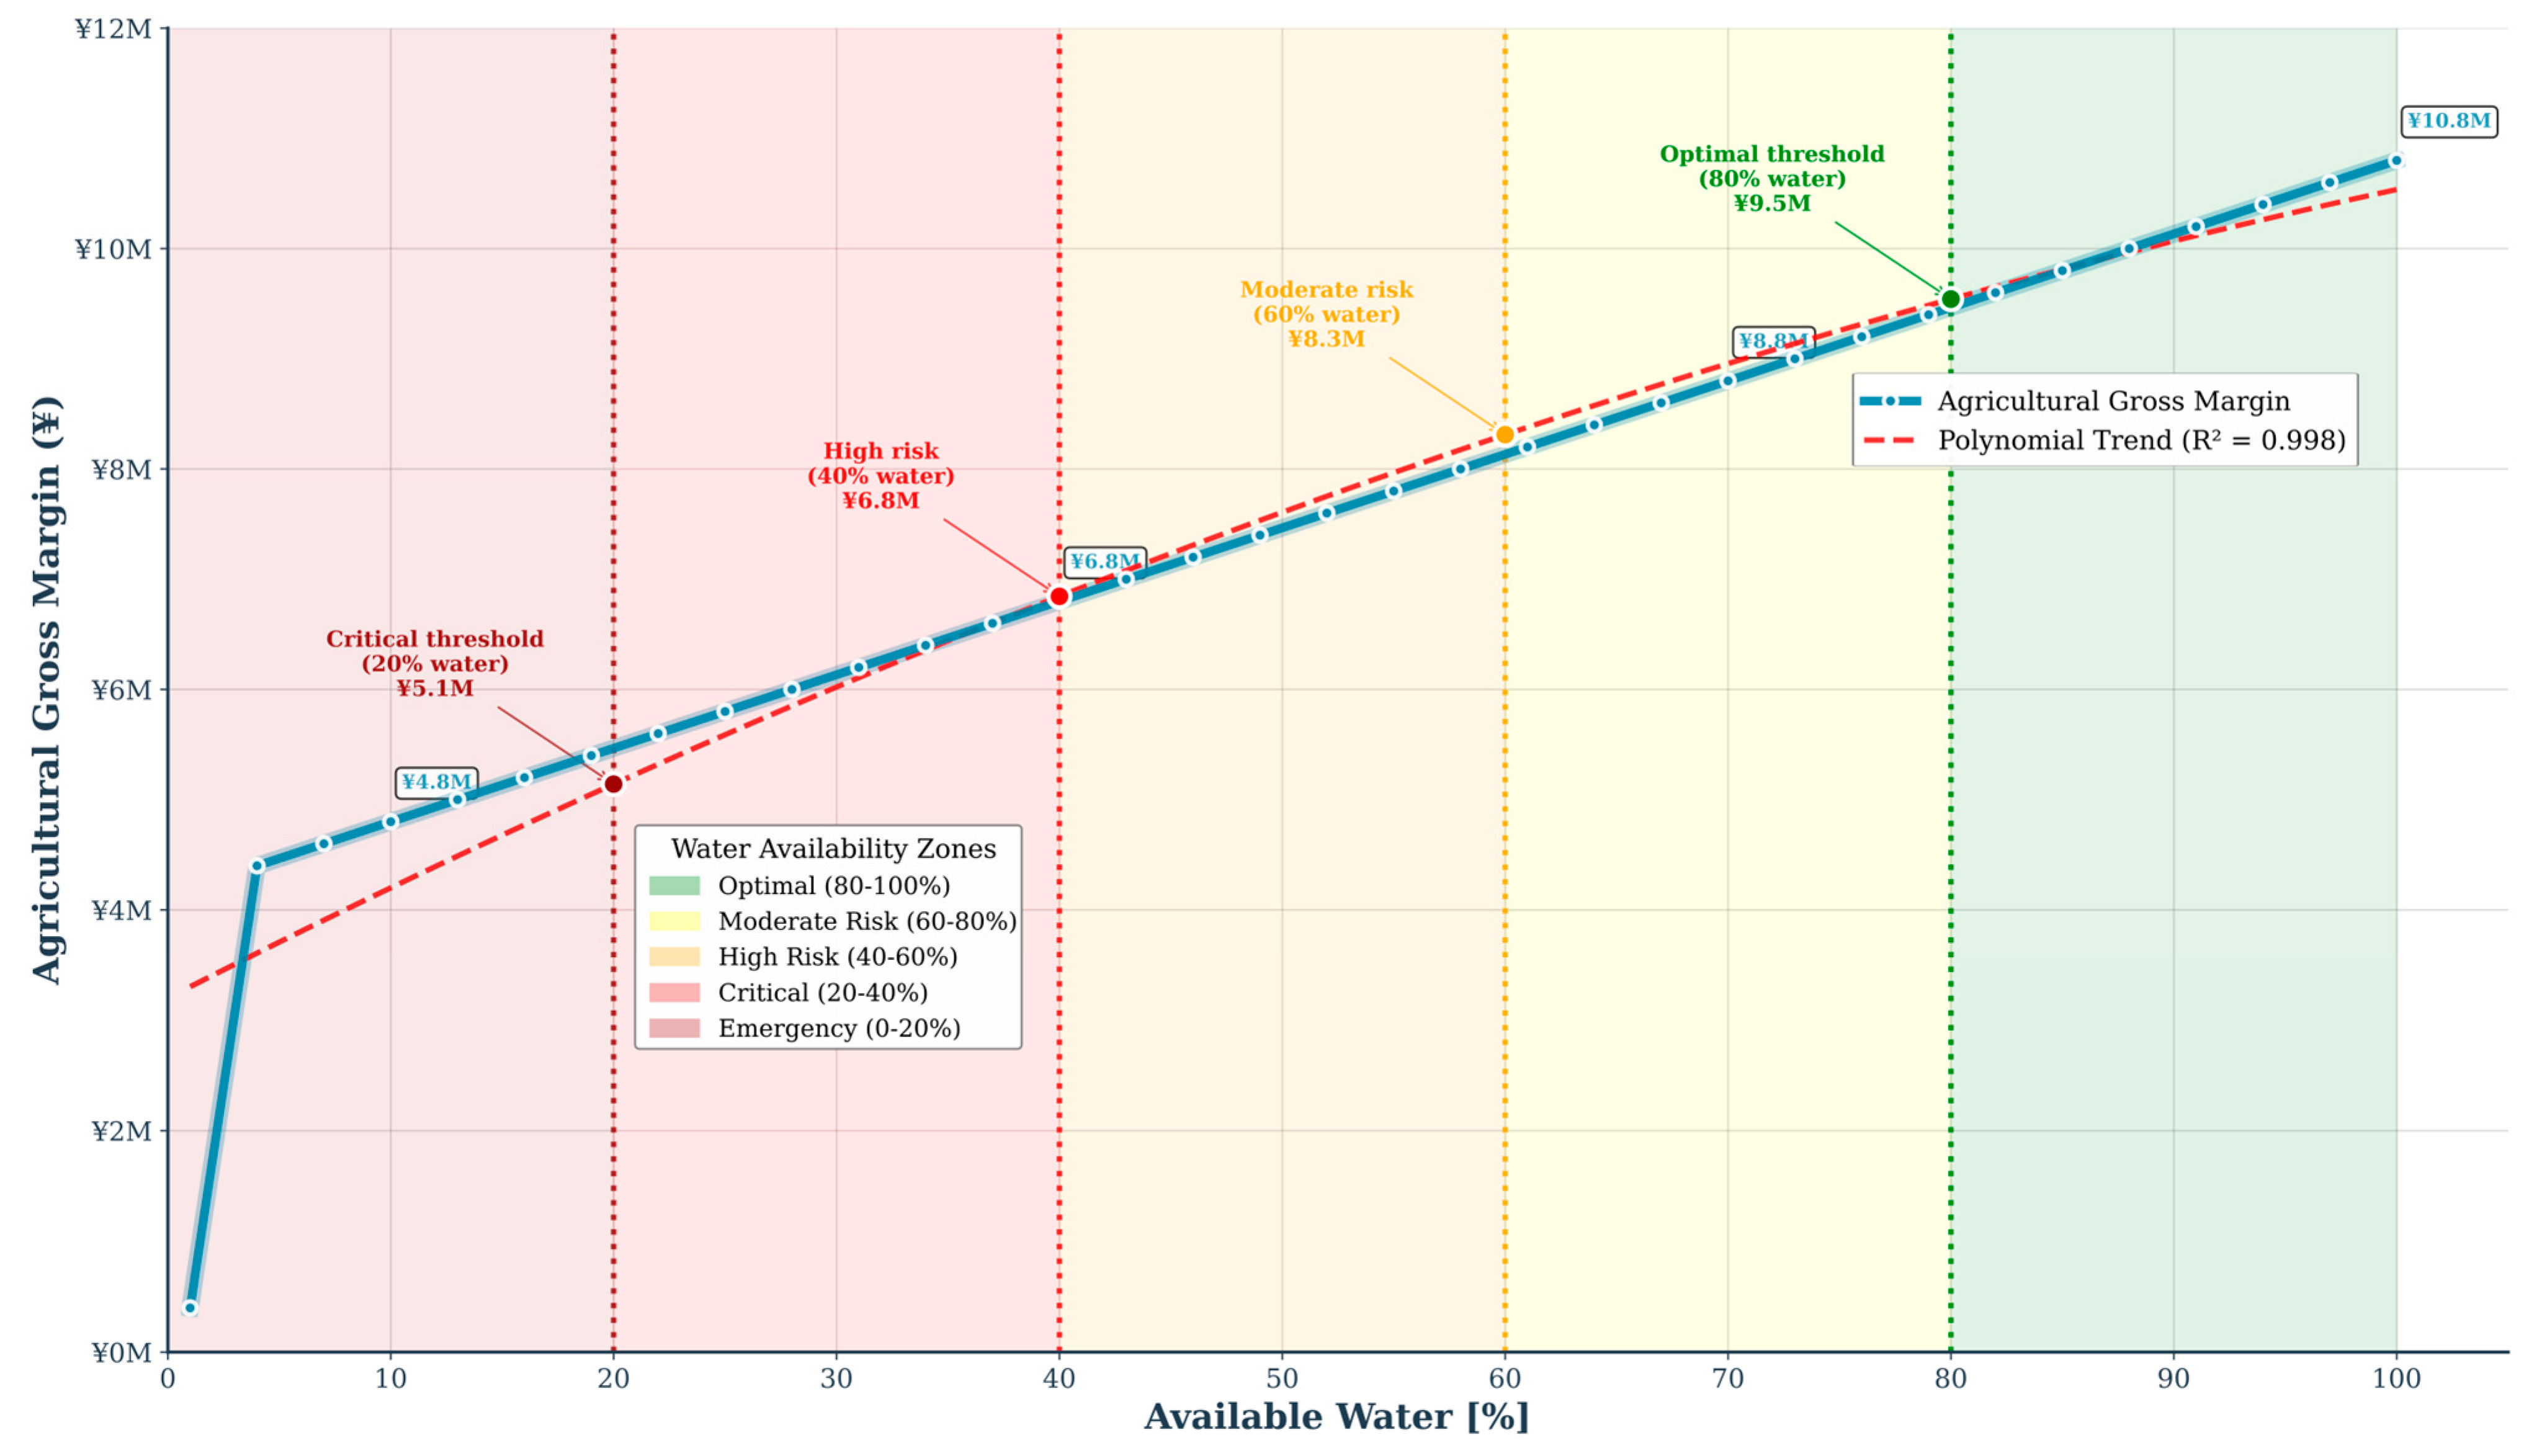
Figure 5 illustrates the response relationship between water resource supply and changes in regional agricultural total gross margins. The research findings indicate (1) water resource availability and agricultural total revenue show a strong positive correlation (r = 0.962), exhibiting significant nonlinear characteristics; (2) the economic impact of water resource scarcity shows obvious threshold effects, with economic losses increasing dramatically when water resource availability falls below 80%; (3) extreme water scarcity (<1% availability) can cause economic losses as high as 96.3% (JPY 10.4 M), with a marginal loss rate of JPY 105 K per 1% of water resource; and (4) different degrees of water resource scarcity correspond to different risk levels, requiring the construction of graded warning and response mechanisms.

3.3. Water Pricing Policy Scenario Analysis

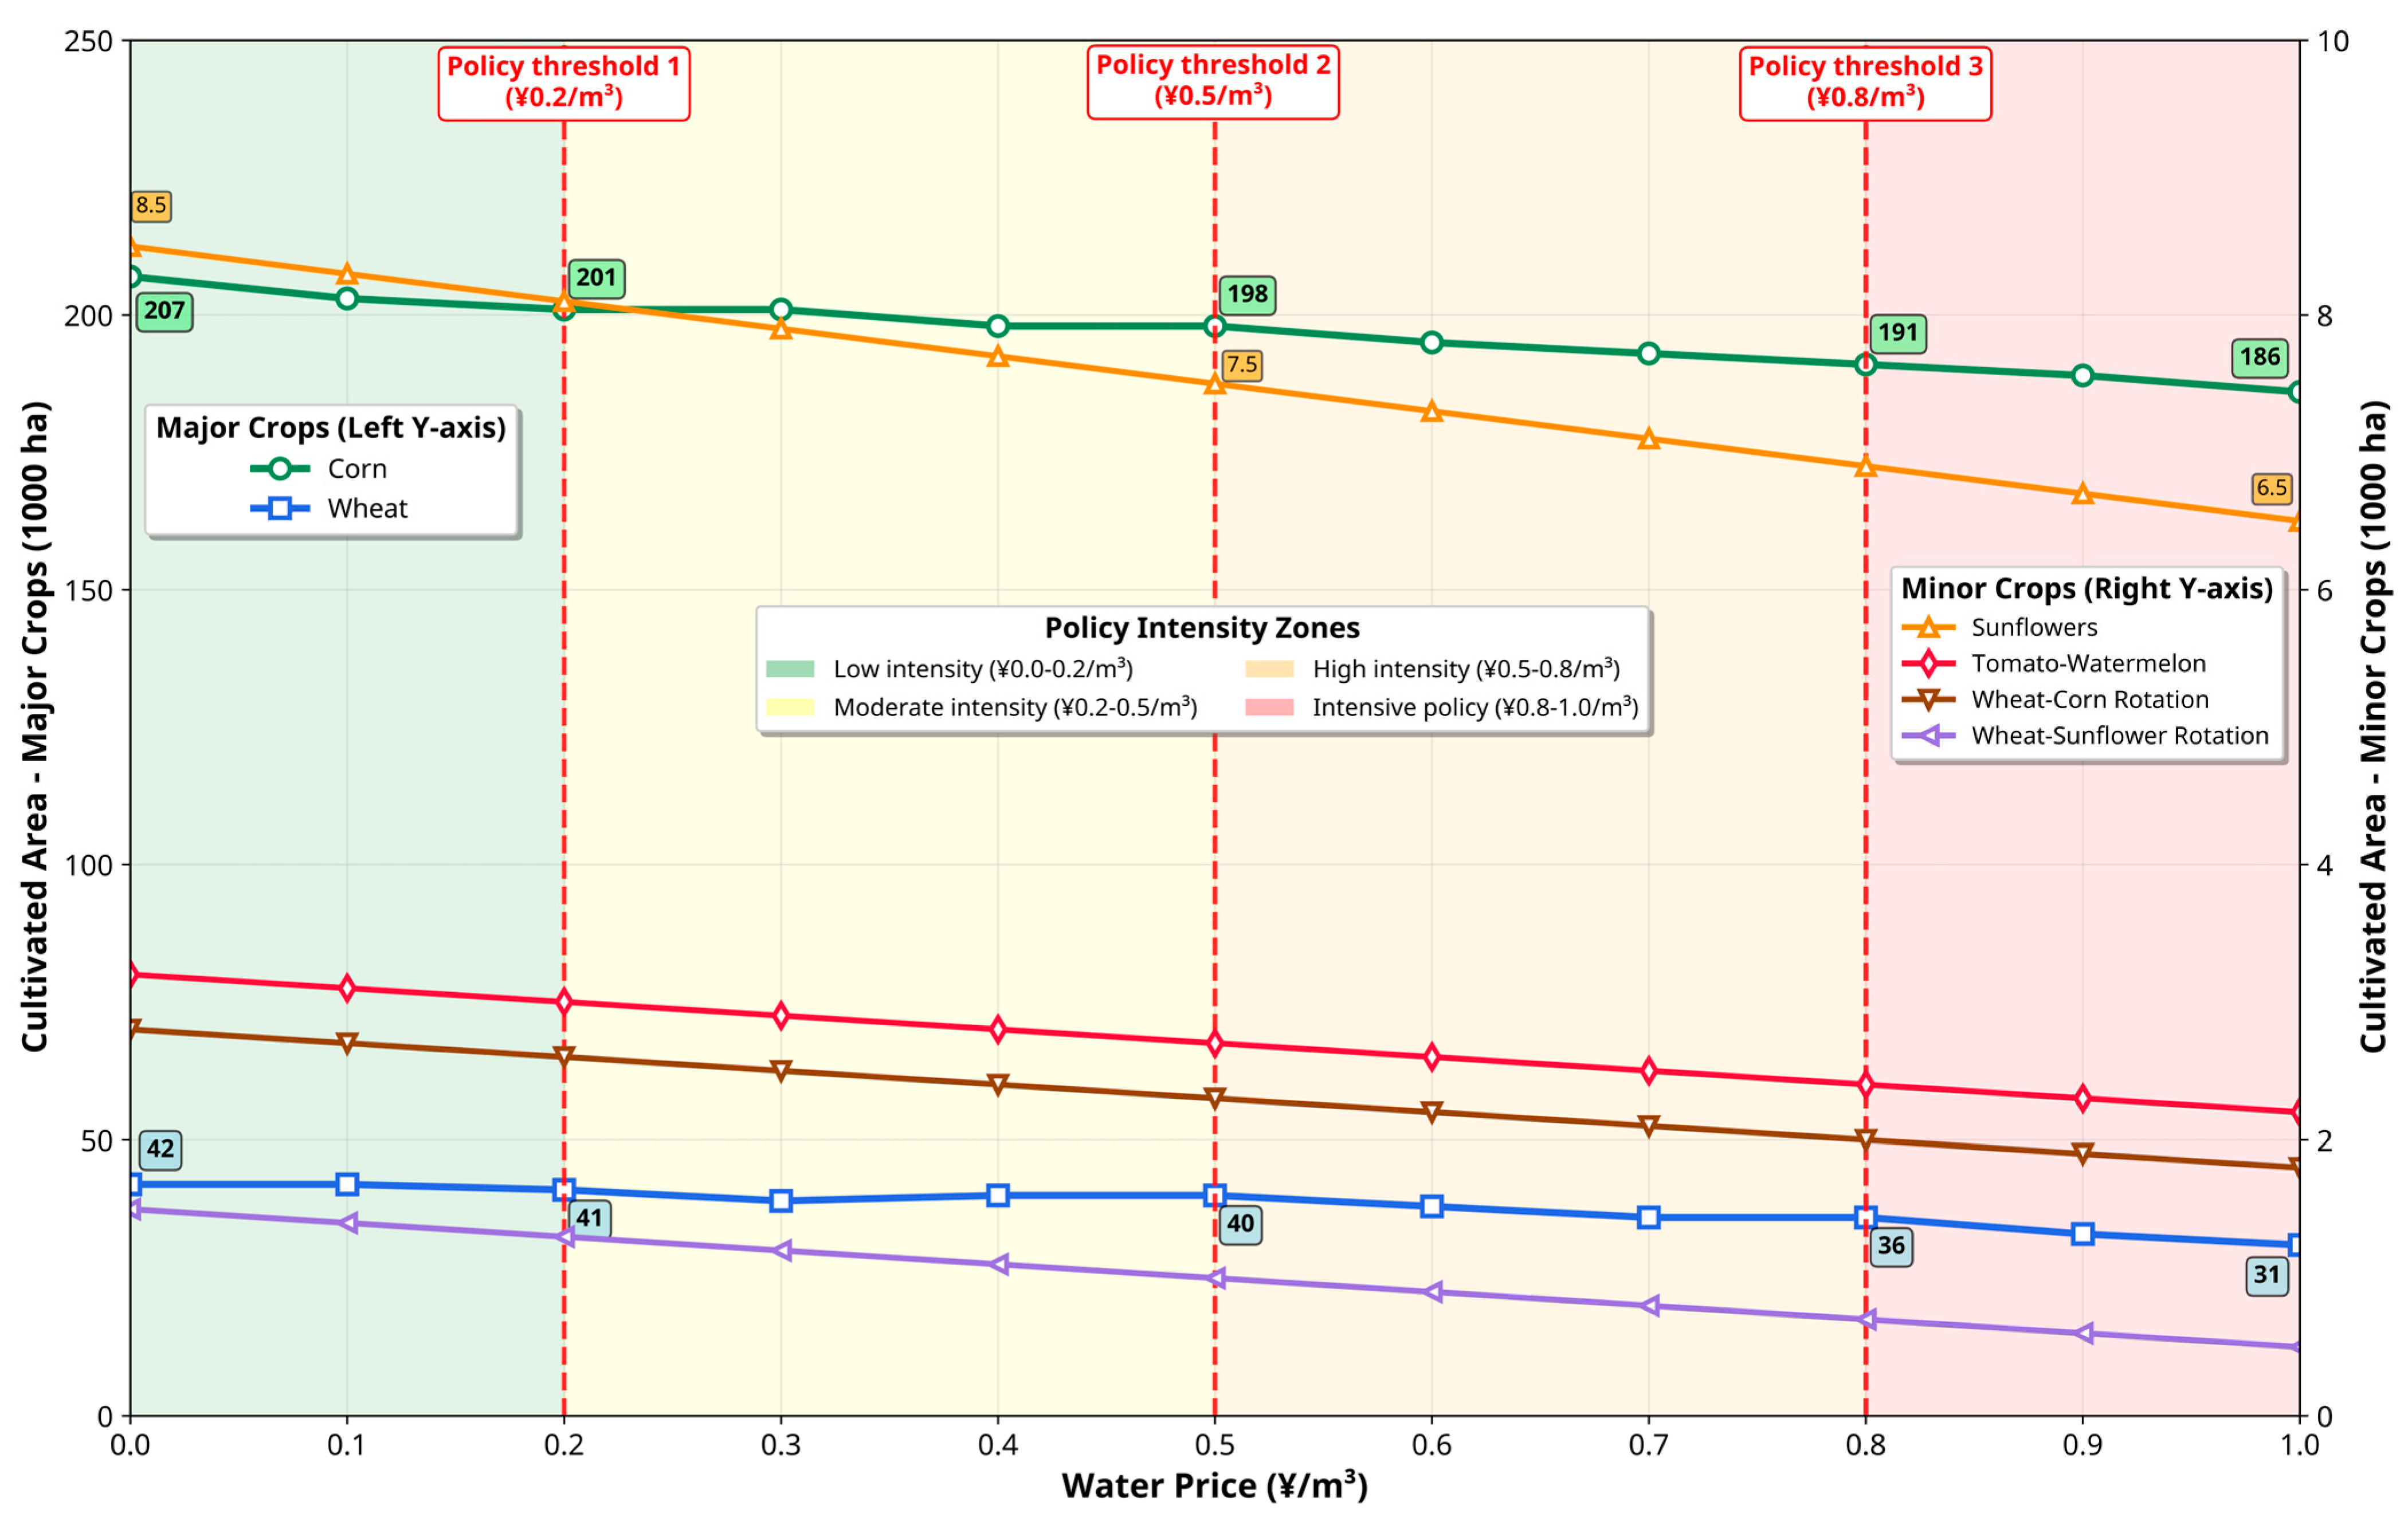
Figure 6 shows the relationship curves between water price levels and changes in crop planting areas, revealing relatively modest response characteristics in the low-to-medium price ranges. Specific characteristics include (1) wheat shows the highest sensitivity to water price changes, with the planted area responding to a water price elasticity coefficient of −23.8%, showing a significant negative response. This result is consistent with wheat’s characteristics as a traditional grain crop with relatively low profit margins. (2) Corn shows moderate price sensitivity (−9.7%), while other crop systems (sunflower, rotation systems, cash crops) show essentially negligible response to price changes, with price elasticity coefficients approaching zero. This result may stem from limited substitutability of cash crops; a small planting area base with limited adjustment space; and high returns per unit area with strong capacity to absorb price changes. (3) Water pricing policies show limited effectiveness in the low price range (0–0.5 JPY/m3), indicating water pricing policy limitations. Significant structural adjustment effects only appear in the high price range (0.5–1.0 JPY/m3). (4) Under the current policy framework, obvious challenges exist with water pricing tool ineffectiveness, requiring the construction of differentiated pricing mechanisms and supporting policy systems, as well as risk-sharing mechanisms.

3.4. Crop Response Characteristics to Salinity Stress

The six crop systems show different response patterns to salinity stress. As soil salinity concentration increases, the planting proportions of all crops show declining trajectories, but the decline magnitudes and critical thresholds differ substantially (Table 4). Based on planting proportions at 10 dS/m, the crop salinity tolerance ranking is wheat–sunflower rotation (85.0%) > sunflower (83.0%) > wheat–corn rotation (52.0%) > wheat (50.0%) > tomato–watermelon (20.0%) > corn (0.0%).
Different crops show significantly different salinity critical thresholds. Among high salt-tolerant crops (90% threshold ≥ 8 dS/m), wheat–sunflower rotation performs most consistently across the entire salinity range. Sunflowers show the strongest salt tolerance among individual crops. Among medium salt-tolerant crops (90% threshold 5–7 dS/m), wheat as a traditional salt-tolerant crop performs well, followed by wheat–corn rotation showing intermediate performance. Among low salt-tolerant crops (90% threshold ≤4 dS/m), tomato–watermelon as cash crops are relatively sensitive to salinity. Corn shows the highest sensitivity to salinity stress.
Rotation systems show clear advantages in salt tolerance (Figure 7). Under extremely high salinity conditions of 10 dS/m, the average planting proportion of rotation systems is 52.3%, significantly exceeding 44.3% of individual crops, with an advantage margin of 8.0%. This advantage is mainly reflected in the fact that rotation facilitates soil salt leaching and microenvironment improvement and differences in root depth and distribution of different crops from three-dimensional utilization patterns. The conclusion is that crop rotation can reduce salt stress risks faced by individual crops and enhance the stability and stress resistance of agricultural ecosystems.

3.5. Comprehensive Economic Efficiency Analysis

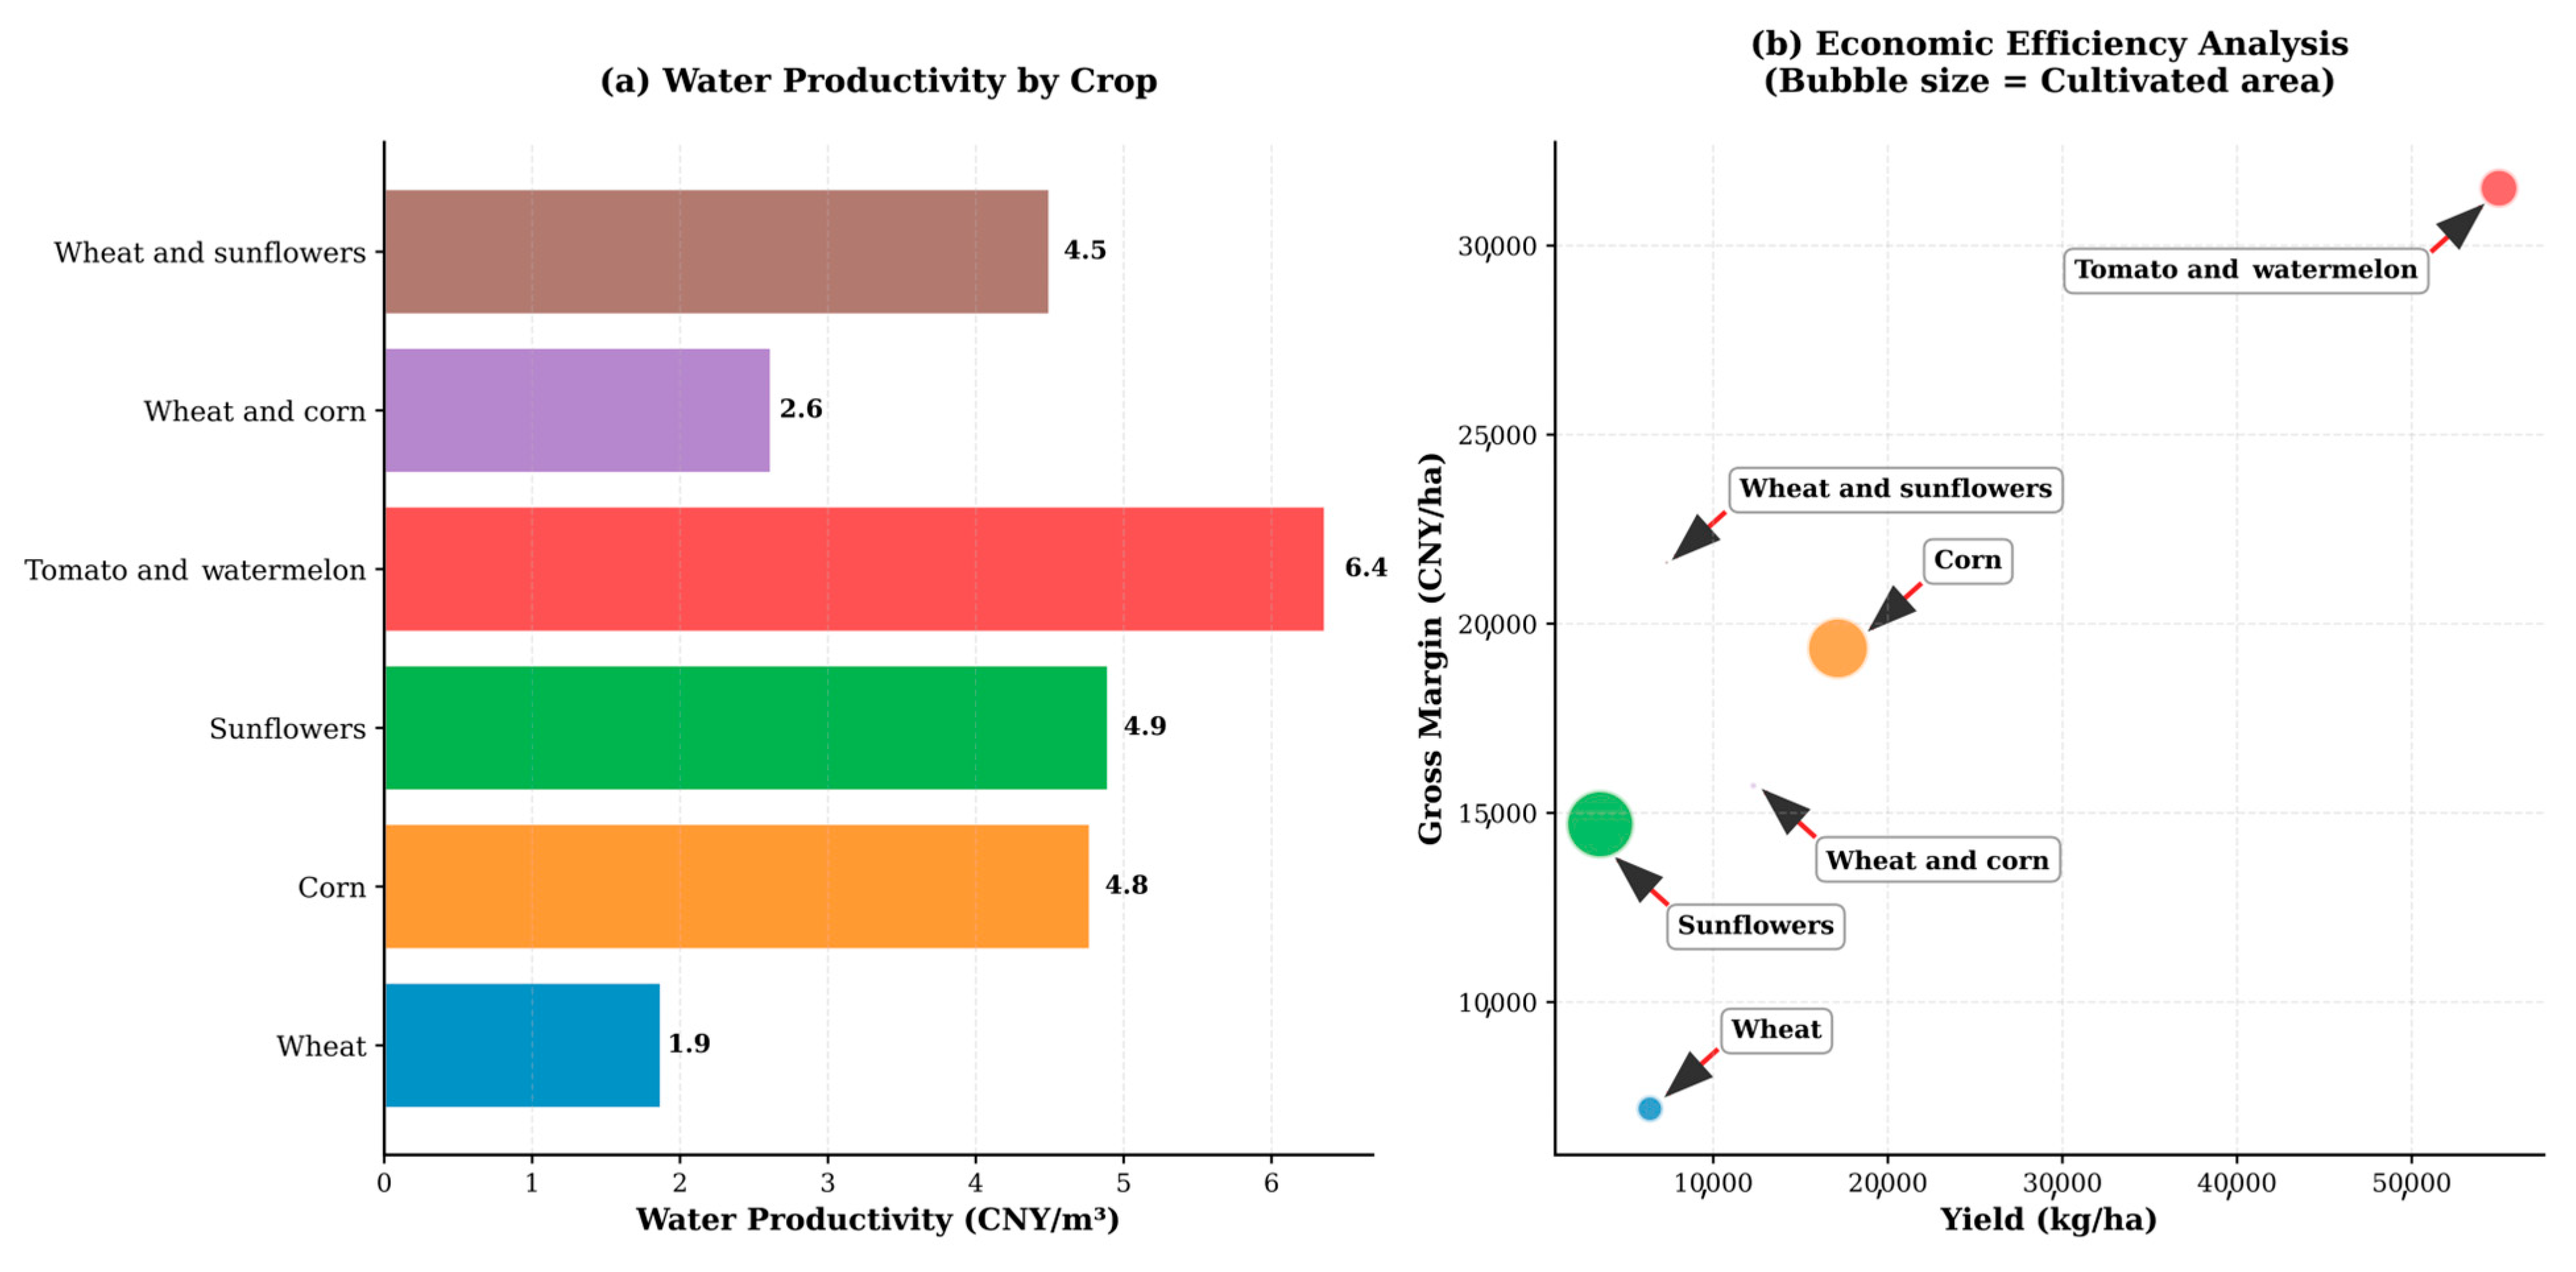
Figure 8 provides a comprehensive comparative analysis of main crop categories for two basic dimensions: water productivity and economic efficiency. Figure 9 summarizes the key results of three main scenario analyses, clearly showing the different impact levels of different types of stress factors on agricultural production performance.
The water productivity analysis results in Figure 8a show substantial differences among different crops in economic output per unit of water resource input. The tomato and watermelon combination shows the highest water productivity level, reaching 6.4 CNY/m3, mainly benefiting from the crops’ high market value and relatively good yield performance per unit area. This is followed by crop rotation systems that achieve efficient utilization through multi-seasonal water resource optimization allocation. Traditional field crops show relatively low water productivity, with wheat at 1.9 CNY/m3 and corn at 4.8 CNY/m3, but these crops play an irreplaceable basic security role in ensuring regional food security.
The economic efficiency scatter plot analysis results in Figure 8b show the complex trade-off relationships among production efficiency, economic profitability, and production scale in the current agricultural production system. High-value cash crops occupy the upper right quadrant of the chart, having both high yield and substantial economic return advantages, but their promotion and planting scale are relatively limited due to constraints from food security policy red lines, high requirements for irrigation water guarantee rates, and land salinization levels.
The comprehensive comparison of the scenario analysis results in Figure 9 indicates that through scientific crop selection strategies and rational planting-area allocation, substantial room exists for further optimization and improvement in the agricultural production system of HID. Moderately expanding the planting scale of crops with high water productivity such as sunflower, while optimizing the crop combinations of existing rotation systems, is expected to significantly improve overall water resource utilization efficiency while maintaining economic viability. However, such structural adjustments must comprehensively consider the impacts of realistic factors such as market demand constraints, technical management capability requirements, and farmers’ risk tolerance. Policymakers need to consider adopting alternative or complementary policy tools such as water resource quota systems and water-saving technology subsidies to more effectively achieve water resource conservation and utilization objectives.

4. Discussion

4.1. Hierarchical Water Resources Quota Allocation and Management System

Based on the model results indicating that the agricultural system in HID shows significant threshold response characteristics to water resource changes, this study recommends establishing a hierarchical water resources quota allocation and management system based on the identified vulnerability thresholds. The system design is grounded in the empirical findings from Section 3.2, which demonstrated clear threshold effects in the 60–70% water utilization range.
Green Alert Level (Water Supply ≥ 80% of normal supply): At this level, the agricultural system maintains stable operation with controllable economic losses. It is recommended to maintain the existing water resource allocation pattern while strengthening water-saving technology promotion and water use efficiency monitoring. According to model analysis, in this range, a 10% reduction in water resources only causes a 5.5% decline in total gross margins, indicating that the system has certain buffering capacity.
Yellow Alert Level (Water Supply 60–80%): The model shows that when water supply availability falls below 80%, economic losses begin to increase dramatically. At this stage, it is recommended to initiate emergency water-saving measures, including (1) prioritizing crops with high water productivity, such as sunflower (4.9 CNY/m3) and corn (4.78 CNY/m3); (2) limiting the planting area of wheat with low water productivity, as its water productivity is only 1.88 CNY/m3; and (3) promoting rotation systems, particularly wheat–sunflower rotation (4.5 CNY/m3) and wheat–corn rotation (2.62 CNY/m3).
Red Alert Level (Water Supply < 60%): The model results show that in the 60–70% water resource utilization range, each crop system reaches the vulnerability threshold of 50% loss points, with tomato–watermelon reaching the earliest threshold at 62% water resource utilization. It is recommended to implement strict water resource quota systems at this stage, mandatorily adjust crop structures, and prioritize ensuring basic water needs for food security crops.
Emergency State Level (Water Supply < 20%): The model shows that under extreme water resource constraints, all crop systems show 100% total loss rates. It is recommended to initiate agricultural production emergency plans, including temporary cessation of irrigation, implementation of dryland agriculture, and activation of agricultural insurance compensation mechanisms.

4.2. Enhanced Water Rights Transfer System

The HID predominantly cultivates major agricultural commodities including wheat, corn, and sunflower, which exhibit limited economic returns per unit area. Concurrently, agricultural production confronts multifaceted risks encompassing climate change, market volatility, and pest and disease outbreaks, rendering farmers relatively vulnerable in their adaptive capacity. Under these circumstances, relying solely on increasing agricultural irrigation water pricing to achieve water conservation objectives not only lacks practical feasibility but may also adversely impact farmers’ livelihoods and regional food security.
Based on the practical experience of two phases of water rights transfer pilot programs in the HID [46,47,48], this study proposes further refinement of the water rights transfer system through the establishment of a “technology + ecology” three-dimensional collaborative framework. This framework leverages iterative upgrades in water-saving technologies to drive water rights release, while optimizing water rights allocation and transfer to promote coordinated development among agricultural, industrial, and ecological systems.
The specific measures involve constructing an intelligent water rights trading ecosystem, with a digital twin water rights management platform as its core component. The technological architecture comprises an Internet of Things (IoT) sensing layer for real-time monitoring of water usage status, an artificial intelligence (AI) algorithm layer for optimizing water rights allocation schemes, and a mobile application layer for facilitating user-friendly transactions. A dynamic pricing model will be established, implementing intelligent pricing based on supply–demand relationships, risk coefficients, and climatic factors. Furthermore, the integration of water rights trading with carbon sink trading will be implemented to achieve “water-carbon synergy.” An innovative water–carbon collaborative trading mechanism will be developed, whereby water-saving retrofits reduce energy consumption to achieve carbon emission reductions, and carbon sink trading revenues subsidize water rights trading, thereby realizing synergistic management of water and carbon resources.

4.3. Soil Management Strategy Based on Salinity Thresholds

The model analysis determined the salinity tolerance thresholds of different crops, providing scientific evidence for formulating precise soil salinization management strategies.
Soil Salinity Monitoring and Stratified Management: Based on salinity thresholds determined by the model, it is recommended to establish a four-level soil salinity management system: (1) safe zone (<4 dS/m): suitable for cultivating all crop types; (2) warning zone (4–6 dS/m): restrict cultivation of salinity-sensitive crops (corn, tomato–watermelon) and prioritize development of salt-tolerant crops; (3) restricted zone (6–8 dS/m): only permit cultivation of highly salt-tolerant crops (wheat, sunflower) and rotation systems; and (4) prohibited zone (>8 dS/m): suspend agricultural production and implement soil improvement measures.
Crop Layout Optimization Strategy: The model results show that under extremely high salinity conditions of 10 dS/m, the crop salinity tolerance ranking is wheat–sunflower rotation (85.0%) > sunflower (83.0%) > wheat–corn rotation (52.0%) > wheat (50.0%) > tomato–watermelon (20.0%) > corn (0.0%). Numerous studies have demonstrated [49,50,51,52,53,54,55] that sunflower exhibits salt–alkali tolerance and possesses the capacity to absorb certain quantities of salt, whereas wheat and corn lack this soil amelioration capability. Therefore, it is recommended to prioritize the promotion of sunflower cultivation in regions with severe salinization, as sunflower can maintain 83.0% of its planting proportion even under extreme salinity conditions while simultaneously contributing to the further remediation of salinized soils.
Rotation System Promotion Plan: The model analysis shows that rotation systems have an 8.0% advantage in salt tolerance (52.3% vs 44.3%). It is recommended to formulate a rotation system promotion plan, targeting an increase in the rotation area proportion from the current 0.5% (29,000 ha) to 15% (approximately 120,000 ha) within 5 years, focusing on promoting the wheat–corn rotation pattern.

4.4. Climate Change Considerations and Future Implications

Climate change represents a critical long-term factor that could significantly influence the effectiveness of water resource management strategies in HID. Rising temperatures and altered precipitation patterns may exacerbate water scarcity and soil salinization challenges. Increased evapotranspiration rates due to higher temperatures could increase crop water requirements, potentially shifting the vulnerability thresholds identified in this study. Changes in precipitation timing and intensity may affect the reliability of Yellow River water allocations, requiring more flexible and adaptive management approaches.
Future climate scenarios suggest that extreme weather events, including droughts and floods, may become more frequent and severe. These changes could alter the effectiveness of current crop rotation systems and necessitate the development of more climate-resilient agricultural practices. The integration of climate projections into PMP models represents an important avenue for future research, enabling the development of long-term adaptive strategies that account for both current constraints and future climate risks.

4.5. Methodological Innovation and Contributions

This study successfully constructed a comprehensive agricultural economic modeling framework applicable to water resource management analysis of agricultural production systems in HID. The successful application of the Positive Mathematical Programming (PMP) method not only effectively captured farmers’ actual decision-making behaviors and adaptive adjustment strategies but also provided scientifically reliable analytical tools for policy effect evaluation. Particularly noteworthy is that this study incorporated soil salinization, an important environmental constraint factor, into agricultural economic models by constructing crop-specific salinity tolerance threshold functions. This methodological advancement makes the evaluation of agricultural production environmental constraints more realistic.
The three-dimensional scenario analysis framework developed in this study provides reference for other irrigated agricultural regions facing water resource stress and environmental degradation challenges. The integration of three scenario dimensions—water resource supply changes, pricing policy implementation, and environmental stress intensification—achieved comprehensive evaluation of agricultural production system vulnerability and adaptive capacity. Future related research can further expand the analytical framework based on this foundation, incorporating additional dimensions such as long-term impacts of climate change, agricultural technology progress effects, and institutional factors affecting farmer decision-making behaviors.

5. Conclusions and Suggestions

This study developed a comprehensive PMP framework integrating multiple stress factors (water scarcity, pricing policies, and soil salinization) to analyze water resource management in the HID. The three-stage PMP approach, incorporating linear programming calibration, cost function estimation, and non-linear optimization, successfully captured farmer decision-making behaviors and system responses to environmental and policy changes. The research provides insights for agricultural adaptation under environmental stress.

5.1. Key Research Findings

The PMP model showed critical vulnerability patterns in the HID agricultural system. Agricultural production has threshold-based responses to water availability. The 60–70% water utilization interval is a critical transition zone where all crop systems reach 50% loss rates. This finding helps develop early warning systems and management strategies.
Water pricing policy analysis showed limited effectiveness in low-to-medium price ranges (0–0.5 CNY/m3). Significant effects only appeared in higher price ranges. Wheat showed the highest price sensitivity with an elasticity coefficient of −23.8%. Cash crops and rotation systems showed a minimal response to price changes. These results suggest that water pricing alone cannot achieve water conservation objectives. Other policy instruments are needed.
The crop salinity tolerance assessment provided quantitative thresholds for different agricultural systems. Rotation systems have better salt tolerance than individual crops. Under extreme salinity conditions (10 dS/m), wheat–sunflower rotation maintained 85% of its planting proportion. This shows an 8% advantage over individual crop systems. This finding supports diversified cropping patterns as an adaptation strategy for salinized agricultural lands.

5.2. Policy Implications and Recommendations

The study recommends establishing a hierarchical water resource quota allocation system with four alert levels: Green (≥80% water supply), Yellow (60–80%), Red (<60%), and Emergency (<20%). Each level corresponds to specific management measures from routine monitoring to emergency agricultural production plans.
The research supports developing water rights transfer systems through “technology + ecology” collaborative frameworks. This integrates water-saving technology upgrades with water rights trading mechanisms. The water–carbon synergy approach offers innovative pathways for sustainable resource management.
For soil salinization management, the study recommends stratified management based on salinity thresholds: Safe zone (<4 dS/m), Warning zone (4–6 dS/m), Restricted zone (6–8 dS/m), and Prohibited zone (>8 dS/m). Priority should be given to promoting sunflower cultivation and wheat–sunflower rotation systems in salinized areas because of their superior salt tolerance and soil improvement capabilities.

5.3. Research Limitations and Future Directions

This study has limitations. The model focuses on short-term responses and may not capture long-term changes in agricultural systems. Climate change represents a significant limitation, as the current model does not fully incorporate the dynamic effects of changing temperature and precipitation patterns on crop water requirements and salinity stress. The static nature of the current PMP framework limits its ability to capture the temporal evolution of climate–agriculture interactions. Future research should include technological progress, climate change projections, and market conditions.
Future research should expand the framework to include climate change scenarios, develop integrated models linking agricultural, hydrological, and economic systems, and explore machine learning techniques to enhance PMP model accuracy. Specifically, incorporating stochastic weather patterns and long-term climate projections into the PMP framework would enhance its predictive capability and policy relevance for long-term planning.

Author Contributions

J.Y.: Data curation, methodology, visualization, writing—original draft, writing—review and editing. J.M.-D.: data processing, methodology, project administration, review and editing, corresponding author. J.B.: review and editing, funding acquisition, project administration. Z.Y.: data collection, review and editing. H.W.: data collection, review and editing. All authors have read and agreed to the published version of the manuscript.

Funding

This study is supported by the Inner Mongolia Department of Science and Technology 2024 major projects to prevent and control sand demonstration “unveiled marshal” project (2024JBGS0016). The contribution of project PID2023-146274OB-I00 (Agencia Estatal de Investigación-Spain) is also acknowledged. Additionally, we acknowledge the support granted to Jingwei Yao by the China Scholarship Council (CSC No.202303340011).

Data Availability Statement

Data will be made available on request.

Conflicts of Interest

The authors declare no conflict of interest.

References

  1. Water Scarcity—One of the Greatest Challenges of Our Time. Newsroom. Available online: https://www.fao.org/newsroom/story/Water-Scarcity-One-of-the-greatest-challenges-of-our-time/en (accessed on 3 July 2025).
  2. Li, M.; Cao, X.; Liu, D.; Fu, Q.; Li, T.; Shang, R. Sustainable management of agricultural water and land resources under changing climate and socio-economic conditions: A multi-dimensional optimization approach. Agric. Water Manag. 2022, 259, 107235. [Google Scholar] [CrossRef]
  3. Yu, Y.; Pi, Y.; Yu, X.; Ta, Z.; Sun, L.; Disse, M.; Zeng, F.; Li, Y.; Chen, X.; Yu, R. Climate change, water resources and sustainable development in the arid and semi-arid lands of central asia in the past 30 years. J. Arid Land 2019, 11, 1–14. [Google Scholar] [CrossRef]
  4. Claro, A.M.; Fonseca, A.; Fraga, H.; Santos, J.A. Future agricultural water availability in Mediterranean countries under climate change: A systematic review. Water 2024, 16, 2484. [Google Scholar] [CrossRef]
  5. Benabdelouahab, T.; Gadouali, F.; Boudhar, A.; Lebrini, Y.; Hadria, R.; Salhi, A. Analysis and trends of rainfall amounts and extreme events in the western Mediterranean region. Theor. Appl. Climatol. 2020, 141, 309–320. [Google Scholar] [CrossRef]
  6. Berbel, J.; Cuadrado-Alarcón, B.; Martínez-Dalmau, J.; Delgado-Ramos, F. Hydro-economic basin impacts of extensive adoption of deficit irrigation by farmers: Are we overestimating water resources? J. Hydrol. 2024, 634, 131075. [Google Scholar] [CrossRef]
  7. López-Baldovin, M.J.; Gutiérrez-Martin, C.; Berbel, J. Multicriteria and multiperiod programming for scenario analysis in guadalquivir river irrigated farming. J. Oper. Res. Soc. 2006, 57, 499–509. [Google Scholar] [CrossRef]
  8. Berbel, J.; Rodriguez-Ocana, A. An MCDM approach to production analysis: An application to irrigated farms in southern Spain. Eur. J. Oper. Res. 1998, 107, 108–118. [Google Scholar] [CrossRef]
  9. Berbel, J.; Mateos, L. Does investment in irrigation technology necessarily generate rebound effects? A simulation analysis based on an agro-economic model. Agric. Syst. 2014, 128, 25–34. [Google Scholar] [CrossRef]
  10. Alamanos, A.; Latinopoulos, D.; Loukas, A.; Mylopoulos, N. Comparing two hydro-economic approaches for multi-objective agricultural water resources planning. Water Resour. Manag. 2020, 34, 4511–4526. [Google Scholar] [CrossRef]
  11. Blanco-Gutiérrez, I.; Varela-Ortega, C.; Purkey, D.R. Integrated assessment of policy interventions for promoting sustainable irrigation in semi-arid environments: A hydro-economic modeling approach. J. Environ. Manag. 2013, 128, 144–160. [Google Scholar] [CrossRef]
  12. Alamanos, A.; Latinopoulos, D.; Xenarios, S.; Tziatzios, G.; Mylopoulos, N.; Loukas, A. Combining hydro-economic and water quality modeling for optimal management of a degraded watershed. J. Hydroinform. 2019, 21, 1118–1129. [Google Scholar] [CrossRef]
  13. Alamanos, A.; Latinopoulos, D.; Papaioannou, G.; Mylopoulos, N. Integrated hydro-economic modeling for sustainable water resources management in data-scarce areas: The case of lake karla watershed in Greece. Water Resour. Manag. 2019, 33, 2775–2790. [Google Scholar] [CrossRef]
  14. Archibald, T.W.; Marshall, S.E. Review of mathematical programming applications in water resource management under uncertainty. Environ. Model. Assess. 2018, 23, 753–777. [Google Scholar] [CrossRef]
  15. Sapino, F.; Pérez-Blanco, C.D.; Gutiérrez-Martín, C.; García-Prats, A.; Pulido-Velazquez, M. Influence of crop-water production functions on the expected performance of water pricing policies in irrigated agriculture. Agric. Water Manag. 2022, 259, 107248. [Google Scholar] [CrossRef]
  16. Petsakos, A.; Rozakis, S. Calibration of agricultural risk programming models. Eur. J. Oper. Res. 2015, 242, 536–545. [Google Scholar] [CrossRef]
  17. Iglesias, E.; Blanco, M. New directions in water resources management: The role of water pricing policies. Water Resour. Res. 2008, 44, 7–27. [Google Scholar] [CrossRef]
  18. Martínez-Dalmau, J.; Gutiérrez-Martín, C.; Expósito, A.; Berbel, J. Analysis of water pricing policy effects in a mediterranean basin through a hydroeconomic model. Water Resour. Manag. 2023, 37, 1599–1618. [Google Scholar] [CrossRef]
  19. Cortignani, R.; Severini, S. Modeling farm-level adoption of deficit irrigation using positive mathematical programming. Agric. Water Manag. 2009, 96, 1785–1791. [Google Scholar] [CrossRef]
  20. Buysse, J.; Van Huylenbroeck, G.; Lauwers, L. Normative, positive and econometric mathematical programming as tools for incorporation of multifunctionality in agricultural policy modelling. Agric. Ecosyst. Environ. 2007, 120, 70–81. [Google Scholar] [CrossRef]
  21. Heckelei, T.; Britz, W.; Zhang, Y. Positive mathematical programming approaches—Recent developments in literature and applied modelling. Bio-Based Appl. Econ. 2012, 1, 109–124. [Google Scholar] [CrossRef]
  22. Howitt, R.E. Positive mathematical programming. Am. J. Agric. Econ. 1995, 77, 329–342. [Google Scholar] [CrossRef]
  23. Heckelei, T.; Britz, W. Positive mathematical programming with multiple data points: A cross-sectional estimation procedure. Cah. Econ. Sociol. Rural 2000, 57, 27–50. [Google Scholar] [CrossRef]
  24. Mérel, P.; Howitt, R. Theory and application of positive mathematical programming in agriculture and the environment. Annu. Rev. Resour. Econ. 2014, 6, 451–470. [Google Scholar] [CrossRef]
  25. Jansson, T.; Heckelei, T. Estimating a primal model of regional crop supply in the european union. J. Agric. Econ. 2011, 62, 137–152. [Google Scholar] [CrossRef]
  26. Ghaffari, A.; Nasseri, M.; Pasebani Someeh, A. Assessing the economic effects of drought using positive mathematical planning model under climate change scenarios. Heliyon 2022, 8, e11941. [Google Scholar] [CrossRef] [PubMed]
  27. Mardani Najafabadi, M.; Ashktorab, N. Mathematical programming approaches for modeling a sustainable cropping pattern under uncertainty: A case study in southern Iran. Environ. Dev. Sustain. 2023, 25, 9731–9755. [Google Scholar] [CrossRef]
  28. Layani, G.; Mehrjou, S.; Farajzadeh, Z. Effects of government policies reform on environmental sustainability: An integrated approach of PMP and system dynamics simulation model. J. Clean. Prod. 2023, 426, 138985. [Google Scholar] [CrossRef]
  29. Randall, M.; Montgomery, J.; Lewis, A. Robust temporal optimisation for a crop planning problem under climate change uncertainty. Oper. Res. Perspect. 2022, 9, 100219. [Google Scholar] [CrossRef]
  30. Qi, Z.; Gao, Y.; Sun, C.; Ramos, T.B.; Mu, D.; Xun, Y.; Huang, G.; Xu, X. Assessing water-nitrogen use, crop growth and economic benefits for maize in upper yellow river basin: Feasibility analysis for border and drip irrigation. Agric. Water Manag. 2024, 295, 108771. [Google Scholar] [CrossRef]
  31. Zhou, L. Influences of deficit irrigation on soil water content distribution and spring wheat growth in hetao irrigation district, inner mongolia of China. Water Supply 2020, 20, 3722–3729. [Google Scholar] [CrossRef]
  32. Zhang, Y.; Bai, Q.; Liu, Q. Thoughts and Suggestions on Deep Water Saving of Agriculture in Hetao Irrigation District. J. Irrig. Drain. 2023, 42 (Suppl. 1), 180–183. [Google Scholar]
  33. Cao, Z.; Zhu, T.; Cai, X. Hydro-agro-economic optimization for irrigated farming in an arid region: The hetao irrigation district, inner mongolia. Agric. Water Manag. 2023, 277, 108095. [Google Scholar] [CrossRef]
  34. Li, D.; Zhang, J.; Wang, G.; Wang, X.; Wu, J. Impact of changes in water management on hydrology and environment: A case study in north China. J. Hydro-Environ. Res. 2020, 28, 75–84. [Google Scholar] [CrossRef]
  35. Yin, J.; Li, X.; Engel, B.A.; Ding, J.; Xing, X.; Sun, S.; Wang, Y. Inter-regional food-water-income synergy through bi-level crop redistribution model coupled with virtual water: A case study of China’s hetao irrigation district. Water Resour. Res. 2024, 60, e2023WR036572. [Google Scholar] [CrossRef]
  36. Xu, X.; Huang, G.; Qu, Z.; Pereira, L.S. Assessing the groundwater dynamics and impacts of water saving in the hetao irrigation district, yellow river basin. Agric. Water Manag. 2010, 98, 301–313. [Google Scholar] [CrossRef]
  37. Miao, Q.; Rosa, R.D.; Shi, H.; Paredes, P.; Zhu, L.; Dai, J.; Gonçalves, J.M.; Pereira, L.S. Modeling water use, transpiration and soil evaporation of spring wheat–maize and spring wheat–sunflower relay intercropping using the dual crop coefficient approach. Agric. Water Manag. 2016, 165, 211–229. [Google Scholar] [CrossRef]
  38. Chen, W.; Sun, W.; Wu, Z.; Wang, Y.; Wang, Y.; Bai, Y.; Zhao, Y. Microtopography-Guided precision restoration of sandy lands through UAV: A case study in Hunshandake Sandy Land, China. CATENA 2024, 247, 108489. [Google Scholar] [CrossRef]
  39. Zhao, N.; Zhang, J.; Li, X.; Ma, J.; Cao, J.; Liu, H.; Wang, X.; Bai, L.; Wang, Z. Limited advantages of green manure planting on soil nutrients and productivity in intensive agriculture: A case study of wheat–maize–sunflower rotation in hetao irrigation district. Agronomy 2024, 14, 100. [Google Scholar] [CrossRef]
  40. Li, X.; Sun, C.; Xiao, X.; Li, Z.; Ma, X.; Wang, J.; Xu, X. Spatio-temporal evolution of complex agricultural land use and its drivers in a super-large irrigation district (hetao) of the upper yellow river basin (2000–2021). J. Geogr. Sci. 2025, 35, 273–292. [Google Scholar] [CrossRef]
  41. Lan, H.; Zhao, Z.; Li, L.; Li, J.; Fu, B.; Tian, N.; Lai, R.; Zhou, S.; Zhu, Y.; Zhang, F.; et al. Climate change drives flooding risk increases in the Yellow River basin. Geogr. Sustain. 2024, 5, 193–199. [Google Scholar] [CrossRef]
  42. Guo, K.; Liu, X. Reclamation effect of freezing saline water irrigation on heavy saline-alkali soil in the hetao irrigation district of north China. CATENA 2021, 204, 105420. [Google Scholar] [CrossRef]
  43. Wuepper, D.; Bukchin-Peles, S.; Just, D.; Zilberman, D. Behavioral agricultural economics. Appl. Econ. Perspect. Policy 2023, 45, 2094–2105. [Google Scholar] [CrossRef]
  44. Tanji, K.K.; Kielen, N.C. Agricultural Drainage Water Management in Arid and Semi-Arid Areas; FAO Irrigation and Drainage Paper; Food and Agriculture Organization of the United Nations (FAO): Rome, Italy, 2002. [Google Scholar]
  45. Zhang, S.; Yang, L.; Ye, D.; Zhang, F.; Bai, Y.; Li, H.; Chen, J.; Fang, K. Extraction and dynamics of planting structure in Hetao Irrigation District of Inner Mongolia from 2000 to 2021 using deep learning. Trans. Chin. Soc. Agric. Eng. (Trans. CSAE) 2023, 39, 142–150. [Google Scholar]
  46. Guan, X.; Wang, B.; Zhang, W.; Du, Q. Study on water rights allocation of irrigation water users in irrigation districts of the Yellow River basin. Water 2021, 13, 3538. [Google Scholar] [CrossRef]
  47. Guan, X.; Du, Q.; Zhang, W.; Wang, B. Study on the pricing of water rights transaction between irrigation water users based on cooperative game in China. Water 2021, 13, 1672. [Google Scholar] [CrossRef]
  48. Chen, X.; Wu, F.; Li, F.; Zhao, Y.; Xu, X. Prediction and analysis of water rights trading volume: Based on the water rights trading in inner mongolia, china. Agric. Water Manag. 2022, 272, 107803. [Google Scholar] [CrossRef]
  49. Lu, H.; Wang, Z.; Xu, C.; Li, L.; Yang, C. Multiomics analysis provides insights into alkali stress tolerance of sunflower (Helianthus annuus L.). Plant Physiol. Biochem. 2021, 166, 66–77. [Google Scholar] [CrossRef]
  50. Farghaly, F.A.; Radi, A.A.; Abdel-Wahab, D.A.; Hamada, A.M. Effect of salinity and sodicity stresses on physiological response and productivity in Helianthus annuus. Acta Biol. Hung. 2016, 67, 184–194. [Google Scholar] [CrossRef] [PubMed][Green Version]
  51. Zhang, J.; Qiao, D.; Zhang, D.; Chi, Z.; Fan, X.; Cao, L.; Li, W. Effect of Subsurface Drip Irrigation on Soil Desalination and Soil Fungal Communities in Saline–Alkaline Sunflower Fields. Agronomy 2024, 14, 3028. [Google Scholar] [CrossRef]
  52. Lai, L.; Feng, H.; Zhang, P.; Gao, X.; Wang, M.; Peng, Q.; Yang, Y.; Wang, H. Soil nitrogen dynamics on a saline-alkali sunflower land under arid region in western inner mongolia. Soil Sci. Soc. Am. J. 2025, 89, e70030. [Google Scholar] [CrossRef]
  53. Li, W.; Zhang, H.; Zeng, Y.; Xiang, L.; Lei, Z.; Huang, Q.; Li, T.; Shen, F.; Cheng, Q. A salt tolerance evaluation method for sunflower (Helianthus annuus L.) at the seed germination stage. Sci. Rep. 2020, 10, 10626. [Google Scholar] [CrossRef] [PubMed]
  54. Gogna, M.; Bhatla, S.C. Biochemical mechanisms regulating salt tolerance in sunflower. Plant Signal. Behav. 2019, 14, 1670597. [Google Scholar] [CrossRef] [PubMed]
  55. Han, X.; Kang, Y.; Wan, S.; Li, X. Effect of salinity on oleic sunflower (Helianthus annuus linn.) under drip irrigation in arid area of northwest China. Agric. Water Manag. 2022, 259, 107267. [Google Scholar] [CrossRef]
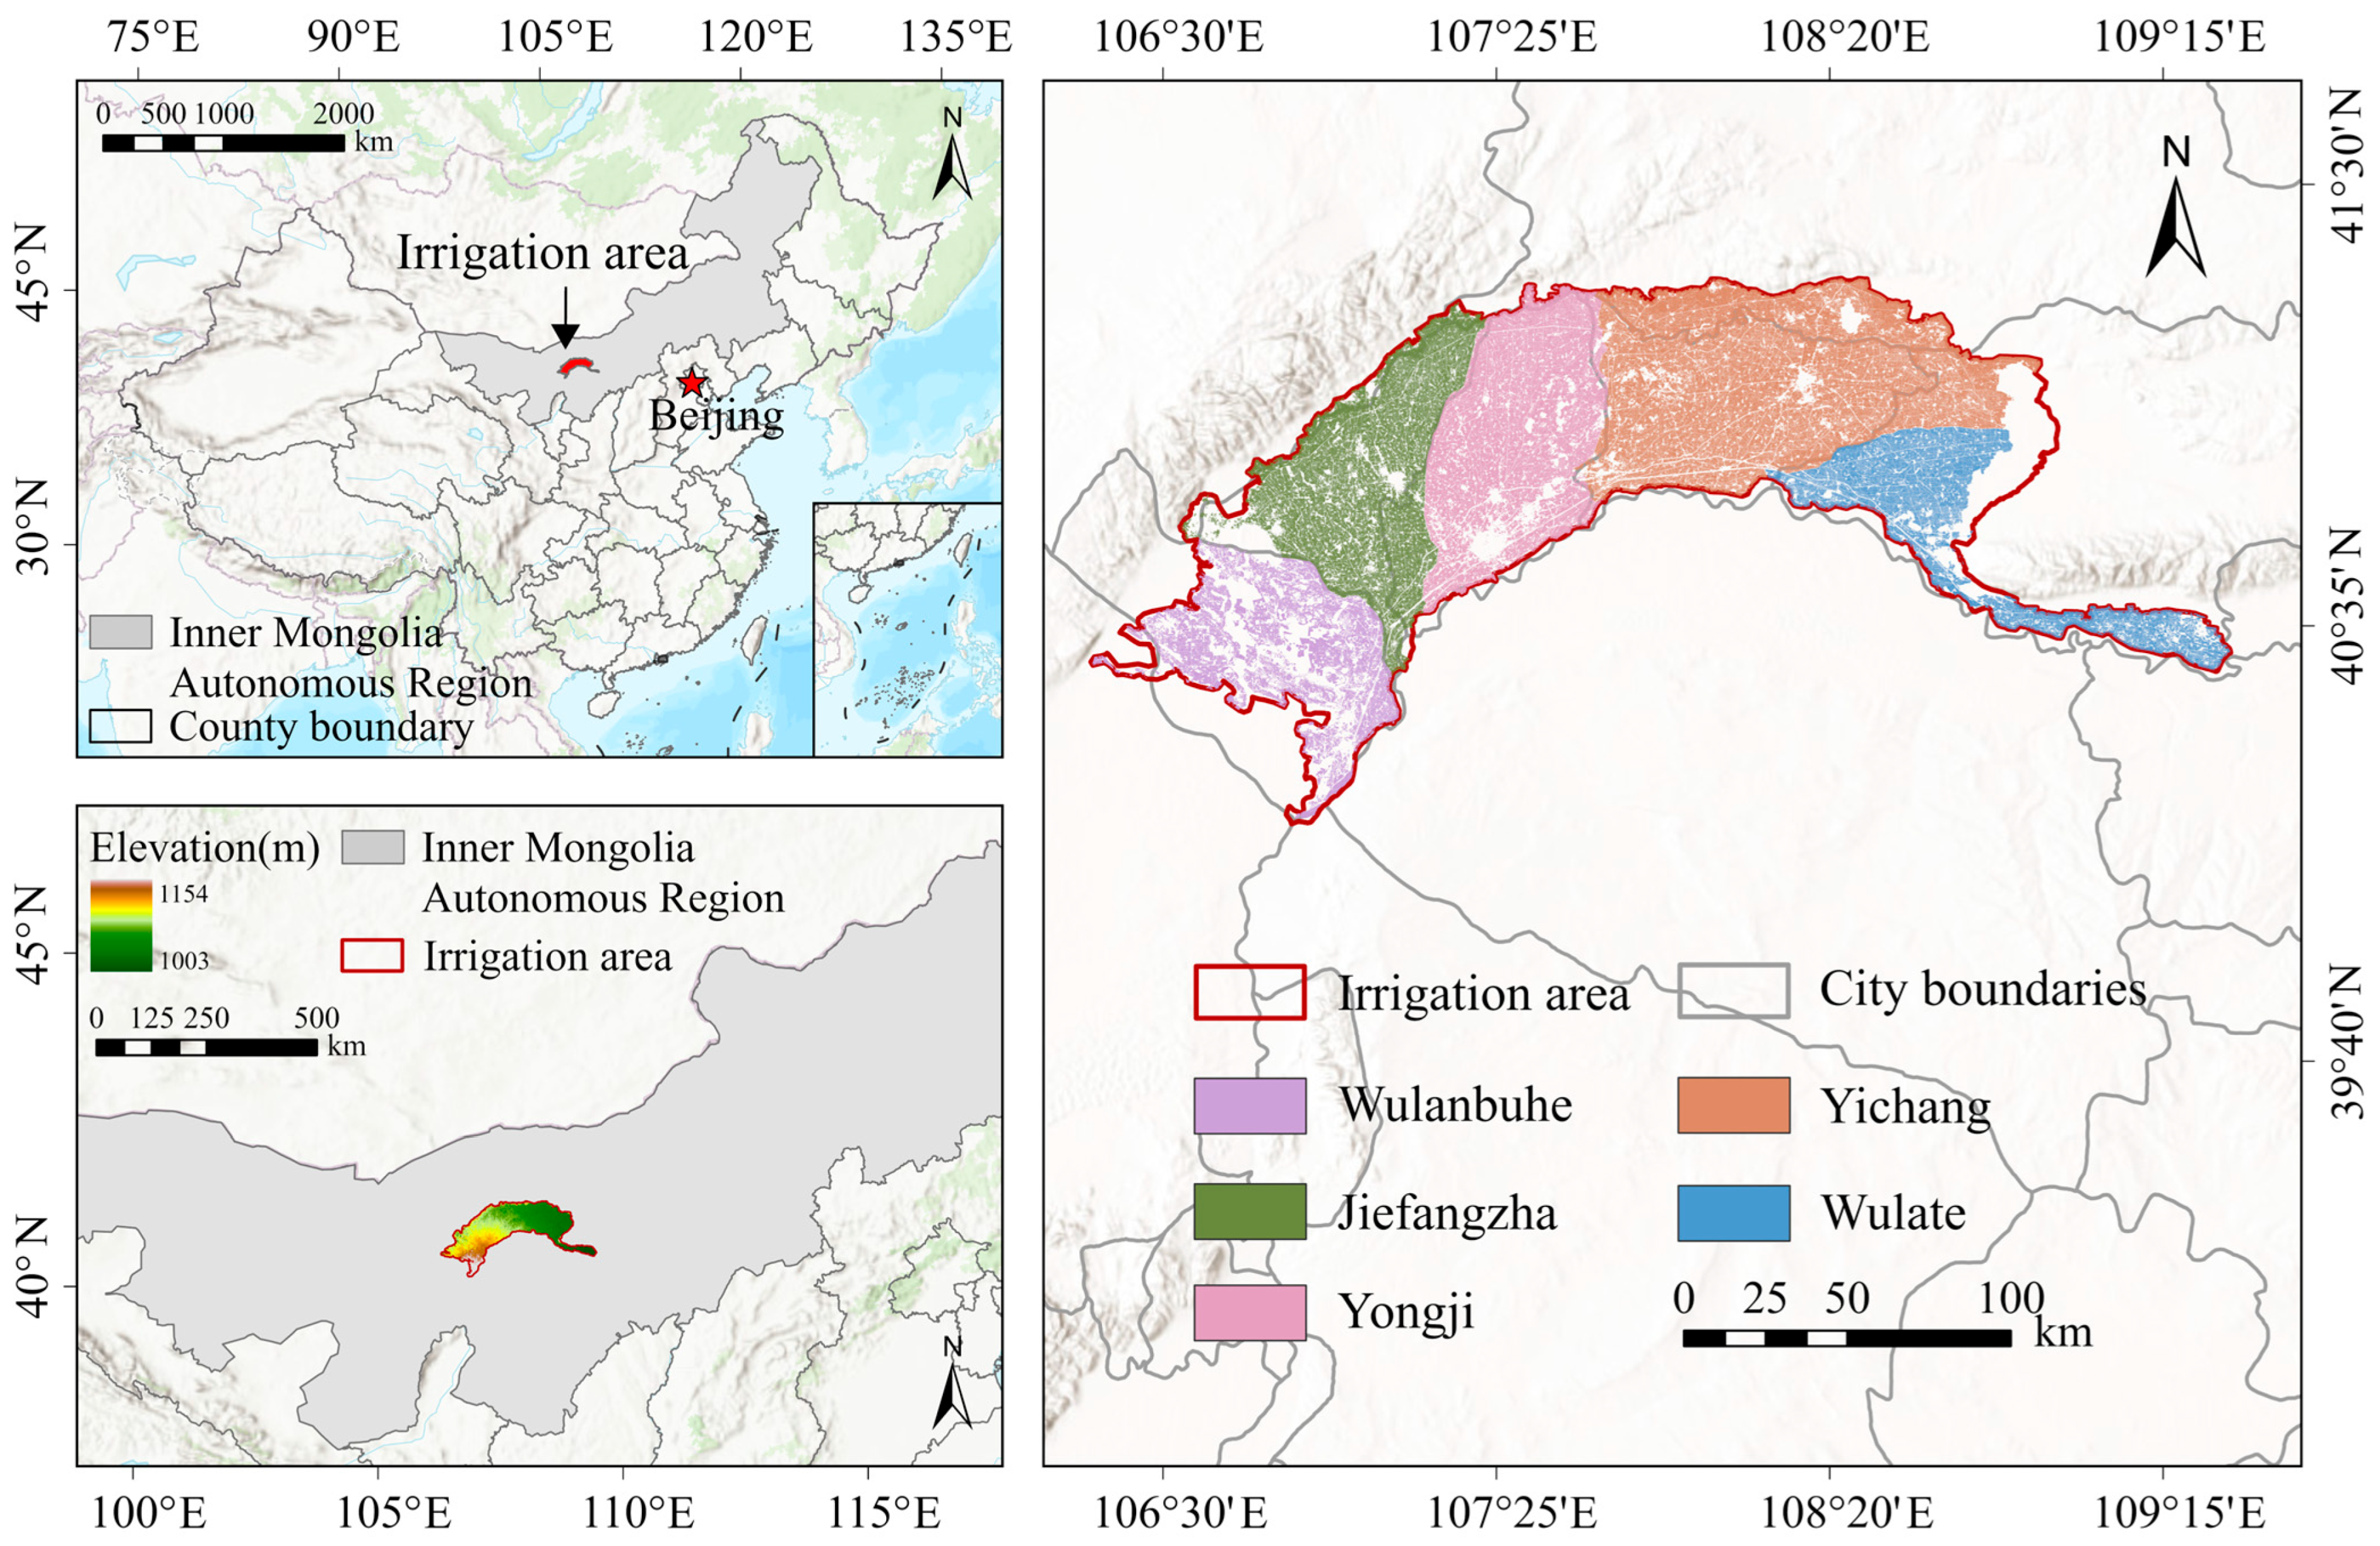
Figure 1. Location of the study area.
Water 17 02598 g001
Figure 2. Main crop phenological information in HID.
Water 17 02598 g002
Figure 3. Methodology flowchart.
Water 17 02598 g003
Figure 4. Impact of water use on crop land use in HID.
Water 17 02598 g004
Figure 5. Impact of water availability on agriculture gross margin in HID.
Water 17 02598 g005
Figure 6. Impact of water price on crop cultivation area in HID.
Water 17 02598 g006
Figure 7. Impact of soil salinity on crop land use in HID.
Water 17 02598 g007
Figure 8. Water productivity and gross margin of different crops.
Water 17 02598 g008
Figure 9. Comprehensive comparison of scenario analysis results.
Water 17 02598 g009
Table 1. Groundwater mineralization during dry season in HID (2023), unit: ha.
Range of SalinityArea (ha)Percentage of
Total Area (%)
Fresh water (<1 g/L)143,42013.2
Slightly saline water (1~2 g/L)282,12025.9
Slightly saline water (2~3 g/L)115,11010.6
Saline water (3~5 g/L)216,15019.8
Saline water (5~10 g/L)215,04019.7
Brine (>10 g/L)118,16010.8
Table 2. Decision variables and their ranges.
VariableDescriptionUnitRange/ValueType
xiPlanting area of crop iha0 ≤ xiLDecision variable
αWater resource reduction ratiodimensionless0 ≤ α ≤ 1Policy parameter
SSoil salinity concentrationdS/m0 ≤ S ≤ 10Environmental parameter
pwaterWater priceCNY/m30.2 ≤ pwater ≤ 1.0Policy parameter
λiDual value of calibration constraint for crop iCNY/haλi ≥ 0Model parameter
diIntercept parameter of quadratic cost function for crop iCNY/hadi ≥ 0Calibrated parameter
giSlope parameter of quadratic cost function for crop iCNY/ha2gi > 0Calibrated parameter
yiYield per unit area of crop ikg/hayi > 0Input data
wiWater requirement per unit area for crop im3/hawi > 0Input data
LTotal available land areahaL = 769,300Fixed parameter
WTotal available water supplym3W = 5.0 × 10⁹Fixed parameter
TiSalinity tolerance threshold of crop idS/m1.7 ≤ Ti ≤ 6.0Input data
siSensitivity coefficient of crop i to salinity stress%/(dS/m)0 ≤ si ≤ 10Input data
Table 3. Crop production characteristics in HID.
Crop TypeYield (kg/ha)Water Requirement (m3/ha)Price (CNY/kg)Area (1000 ha)Production Cost (CNY/ha)Gross Margin (CNY/ha)Water Productivity (CNY/m3)Salinity Threshold (dS/m)
Wheat63753825340.412,0007177.51.886
Corn17,14540502207.215,00019,3504.781.7
Sunflowers352530008254.5800014,7004.94.8
Tomato–Watermelon55,00049500.983.818,00031,5156.372.5
Wheat–Corn Rotation12,30060002.42.216,50015,7202.624.4
Wheat–Sunflower Rotation733548004.80.714,00021,6184.55.4
Table 4. Salinity critical thresholds for different crops.
Crop System90% Threshold (dS/m)75% Threshold (dS/m)50% Threshold (dS/m)25% Threshold (dS/m)Final Land Use at 10 dS/m (%)Decline Rate (%/dS/m)Tolerance RankTolerance Level
Wheat–Sunflowers8>10.0>10.0>10.0851.51High
Sunflowers8>10.0>10.0>10.0831.72High
Wheat–Corn56>10.0>10.0524.83Medium
Wheat67>10.0>10.05054Medium
Tomato–Watermelon45692085Low
Corn45670106Low
Disclaimer/Publisher’s Note: The statements, opinions and data contained in all publications are solely those of the individual author(s) and contributor(s) and not of MDPI and/or the editor(s). MDPI and/or the editor(s) disclaim responsibility for any injury to people or property resulting from any ideas, methods, instructions or products referred to in the content.