Abstract
Groundwater resource management involves complex socio-hydrological systems characterized by dynamic feedback, uncertainty, and common misconceptions among decision-makers. While deterministic models like MODFLOW simulate physical hydrology effectively, they fall short in capturing the social, legal, and behavioral dynamics shaping groundwater use. System dynamics (SD) modeling offers a robust alternative by incorporating feedback loops, delays, and nonlinearities. Yet, model conceptualization remains one of the most challenging steps in SD practice. Experienced modelers often apply a “Lego-like” approach—assembling new models from pre-validated sub-models. However, this strategy depends on access to well-documented sub-model libraries, which are typically unavailable to newcomers. To address this barrier, we systematically review and classify socio-economic sub-models from existing groundwater SD literature, organizing them by system archetypes and generic structures. The resulting modular library offers a practical resource that supports newcomers in building structured, scalable models. This approach improves conceptual clarity, enhances model reusability, and facilitates faster development of SD models tailored to groundwater systems. The study concludes by identifying directions for future research, including expanding the sub-model library, clarifying criteria for base-model selection, improving integration methods, and applying these approaches through diverse case studies to further strengthen the robustness and utility of groundwater SD modeling.
1. Introduction
Groundwater resource management is complex [1]. Models that managers rely on for forecasting availability, recharge, surface to groundwater interaction, and water use come with uncertainty [2]. Complexity and uncertainty also surround social and legal aspects that include rights to use groundwater, historic legacy of use and the right to current use, and the cost of pumping, and finally, groundwater is essentially an invisible resource [3,4]. Collectively, these issues have led to a myriad of problems, including overappropriation, dewatering aquifers, subsidence, and saltwater intrusion [5,6,7].
While deterministic hydrologic modeling platforms such MODFLOW are beneficial for understanding flow, conductivity, recharge, and boundaries, they are not adept at managing dynamic social complexity [8,9,10]. Addressing this gap, recent advances in socio-hydrology explicitly model the feedbacks between social and hydrological processes using integrated frameworks to capture the co-evolution of human–water systems over time [11].
Social groundwater systems exhibit key elements of dynamic complexity: stocks and flows, reinforcing and balancing feedback loops, time delays, and nonlinear relationships [12]. Even with low combinatorial complexity, such systems can exhibit intricate behaviors [12]. As complexity increases, resource management performance often declines due to flawed mental models and bounded rationality, or overlooking or poorly adjusting for feedback and stock accumulation [13]. Mental models are simplified internal representations of external systems [14], and when inaccurate, they can lead to serious consequences [15]. When managing complex socio-ecological systems like groundwater, incorrect mental models hinder sustainable development [16] and result in misguided predictions about conservation policies [17]. Common misconceptions include the belief that pumping below the recharge rate prevents declines in water levels and storage [18], or that sustainable pumping depends on capture rather than natural recharge [19]. Such flawed models can lead to miscalculations of maximum allowable withdrawal (MAW) and groundwater over-exploitation. Addressing these misconceptions is essential for effective groundwater management.
System dynamics (SD) models have been applied across a wide range of dynamically complex surface- and groundwater basins to help managers and stakeholders understand system behavior, encompassing hydrological, social, and economic dimensions of water use [20,21,22,23,24,25]. SD model interfaces can function as “flight simulators,” enabling users to explore multiple “what-if” scenarios in their search for sustainable resource management [26]. However, building a robust SD model is challenging and requires both expertise and experience. Among the most difficult stages of the modeling process is model conceptualization [27,28]. To address this challenge, SD modelers have developed a variety of conceptualization approaches [29]. As models increase in complexity, practitioners often draw on multiple methods—sometimes in combination—to refine conceptual frameworks, especially when engaging with unfamiliar problem domains [29].
One widely used strategy in SD modeling is the “Lego-like” approach, in which pre-existing sub-models are assembled to create a comprehensive representation of the system under study. For instance, in developing the Feedback-Rich Energy–Economy (FREE) model, Fiddaman [30,31] explicitly incorporated structural elements from six prior models to inform his own model architecture. This modular strategy can accelerate model development, but its success depends on access to a robust library of reusable sub-models. Experienced SD practitioners often draw on an internal repository of such components, adapting and integrating them to reflect the unique dynamics of each case. By contrast, those without access to these resources face significant challenges in conceptualizing robust, theoretically grounded models.
Despite the value of structural knowledge, literature reviews in SD rarely examine the architecture of models. A notable exception is the work of Elmasry & Größler [32] in supply chain management, which explicitly addresses structural components. In the water resources domain, several reviews have examined SD applications (e.g., Winz et al. [33], Zarghami et al. [34], Zomorodian et al. [35], Mashaly & Fernald [36], Cerecedo Arroyo & Martínez Austria [37], Phan et al. [38], Naeem et al. [39]), yet few have systematically analyzed the structural building blocks that underpin these models.
In this paper, we reviewed system dynamics–groundwater (SD–GW) models, disaggregated them into constituent sub-models, compiled these components into a structured library, and explained each sub-model using generic structures and archetypes to enhance understanding, memorability, and communication. Archetypes describe recurring patterns of dynamic behavior that appear in diverse, often unrelated contexts [40,41,42,43,44].
Through this process, we identified several mechanisms influencing groundwater that were not explicitly represented in existing SD–GW models. To address these gaps, we developed additional sub-models to expand and enrich the library.
Water is one of the most frequently modeled topics in SD. For instance, a Web of Science search for “System Dynamics” AND “Water” yields more than 3300 papers. A comprehensive review of all such studies was beyond the scope of this research; therefore, we narrowed our focus. We began by identifying foundational models that represent the relationship between groundwater and irrigated land. Our review identified four generic structures and archetypes [45,46,47] commonly used to describe social groundwater system behavior: Limits to Growth, Predator–Prey Dynamics, the Tragedy of the Commons, and Oscillatory Behavior due to Delays.
In some cases, the archetype was explicitly identified in the original paper (e.g., “prey–predator” was directly stated by the authors). When it was not explicitly named, we applied three strategies:
- Textual cues—Narrative descriptions that aligned with known archetypes (e.g., discussions of capacity limits often indicated a Limits to Growth structure).
- Reference to the archetype family tree—The framework developed by Goodman and Kleiner [47], which maps relationships among core archetypes and supports selection when multiple candidates are plausible.
- Behavioral pattern analysis—Examining the simulated dynamics to match them with known structural patterns (e.g., overshoot and collapse indicating a specific structure), even when the original authors did not label it explicitly.
We then broadened the scope to identify key mechanisms influencing groundwater resources, focusing specifically on those affecting pumping, as groundwater stocks change only through flows. Because recharge factors (e.g., precipitation) are typically exogenous, our analysis concentrated on the drivers of pumping. The volume of water pumped is determined as the minimum of water demand and water supply. Water supply is a function of groundwater availability, water rights, and regulatory limits on maximum allowable withdrawals. Water demand is calculated as the irrigated land area multiplied by the water requirement per hectare and divided by irrigation efficiency. Consequently, groundwater consumption is shaped by four primary factors: water rights, irrigated land area, crop type, and irrigation efficiency. We compiled a list of these drivers (Figure 1 column 1), mapped the mechanisms affecting them, and searched existing water-related SD models for corresponding sub-models. Where no such sub-models existed, we drew first on non-SD water studies for conceptual explanations and subsequently on non-water SD studies, generic structures, and archetypes to develop suitable sub-models.
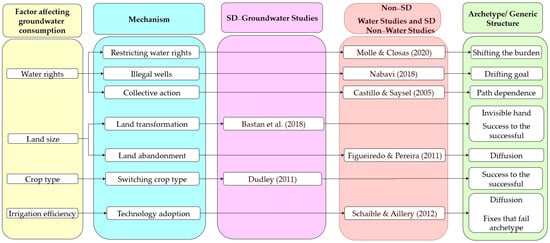
Figure 1.
Library of sub-models for seven key socio-economic mechanisms influencing groundwater pumping: water rights regulation, illegal well drilling, collective action, land transformation, land abandonment, crop type switching, and technology adoption [48,49,50,51,52,53,54].
In this study, beyond the four archetypes and generic structures representing the foundational relationship between groundwater and irrigated land, we identify and describe seven key socio-economic archetypes with corresponding sub-models that capture critical groundwater management mechanisms. These mechanisms include water rights regulation, illegal well drilling, collective action, technology adoption, changes in irrigated land area and crop types, and land transformation or abandonment (Figure 1). By providing a structured library of modular sub-models, this study helps to demystify the conceptualization process and fosters greater consistency, scalability, and efficiency in SD groundwater model development. It offers a solid foundation for future modeling efforts and encourages the broader adoption of “Lego-like” strategies in SD practice.
2. Basic Structures for Modeling Groundwater Resources
Figure 2 illustrates the foundational relationship between groundwater and irrigated land. Groundwater provides the primary water supply for irrigation, sustaining agricultural production on irrigated land. In turn, the extent and intensity of irrigated land determine water demand, which drives groundwater extraction. We reviewed the literature to examine how different authors have conceptualized this feedback between groundwater and irrigated land, identifying four generic structures and archetypes that capture its core dynamics.
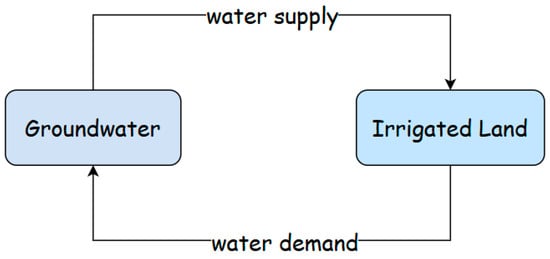
Figure 2.
Foundational relationship between groundwater and irrigated land, showing how groundwater availability influences irrigation demand and how irrigation demand, in turn, affects groundwater use.
The “Limits to Growth” archetype shows how groundwater consumption is constrained by resource availability. The “Prey-Predator” structure models the interdependence between groundwater levels and irrigated farmlands. The “Tragedy of the Commons” archetype highlights how competitive pumping depletes shared groundwater. Finally, the “Oscillation from Delays” structure explains how delays in both information and corrective actions cause fluctuations in groundwater levels.
These structures generally assume a homogeneous distribution of water access, implicitly modeling systems where water is a shared resource and scarcity affects all users equally. While this assumption may hold in contexts where groundwater depletion impacts farmers collectively, it does not reflect the diversity of institutional arrangements governing water rights in other regions. As highlighted by Peña and Fuentes [55], institutional frameworks vary significantly across case studies, encompassing systems such as absolute ownership, reasonable use, correlative rights, prior appropriation, and riparian rights. This also includes cases where surface water rights and groundwater rights are not fully integrated.
2.1. Quick Primer on SD Nomenclature
The field of SD employs two primary diagrammatic tools—Causal Loop Diagrams (CLDs) and Stock and Flow Diagrams (SFDs)—to represent the feedback structures that drive system behavior over time [56,57]. CLDs are particularly well suited for the early stages of model conceptualization, where the focus is on exploring and communicating qualitative feedback structures, such as reinforcing and balancing loops, and articulating the underlying causal logic of the system. They are especially valuable for capturing mental models and engaging stakeholders in collaborative settings.
In contrast, SFDs are more appropriate when the modeling task requires greater structural detail. By explicitly representing accumulations (stocks) and rates of change (flows), SFDs enable precise formulation and are essential for dynamic simulation and quantitative analysis [58].
In this paper, we alternate between CLDs and SFDs based on the modeling purpose and context. When the objective is to surface qualitative reasoning or facilitate discussion of high-level dynamics, CLDs are used. When a more formal representation of system structure and behavior is required, SFDs are employed. This selective use ensures that the modeling approach remains both purpose-driven and methodologically appropriate.
In CLD and SFD, a positive polarity (“+”) indicates that two connected variables move in the same direction—when one increases, the other increases as well, and vice versa. A negative polarity (“−”), by contrast, implies an inverse relationship—when one variable increases, the other decreases. These relationships may be linear or nonlinear; that is, changes in one variable may lead to proportional or disproportionately large or small changes in another, depending on thresholds, saturation effects, or other nonlinear mechanisms. Feedback loops formed by these links are classified as either reinforcing (R), which amplify deviations and drive exponential growth or decline, or balancing (B), which resist change and promote system stability. Temporal delays, commonly denoted by double slashes (//), represent lags between cause and effect that can obscure feedback dynamics [59].
The interaction of reinforcing and balancing feedback loops, nonlinear relationships, and time delays gives rise to complex system behaviors over time, such as exponential growth or decline, goal-seeking dynamics, sustained oscillations, overshoot and collapse, and S-shaped growth [12].
2.2. Limits to Growth Archetype
The concept of “Limits to Growth” has been widely examined in water management at national, regional, watershed, and aquifer levels [60,61,62,63]. The Limits to Growth archetype includes both loop types (Figure 3a). Initially, growth in demand for groundwater rights is driven by a reinforcing loop until it triggers a balancing action, such as recognition that pumping is approaching/exceeding the recharge rate, resulting in no additional rights being administered. If pumping and recharge are in equilibrium, the state of the system approaches carrying capacity, resulting in S-shaped growth.
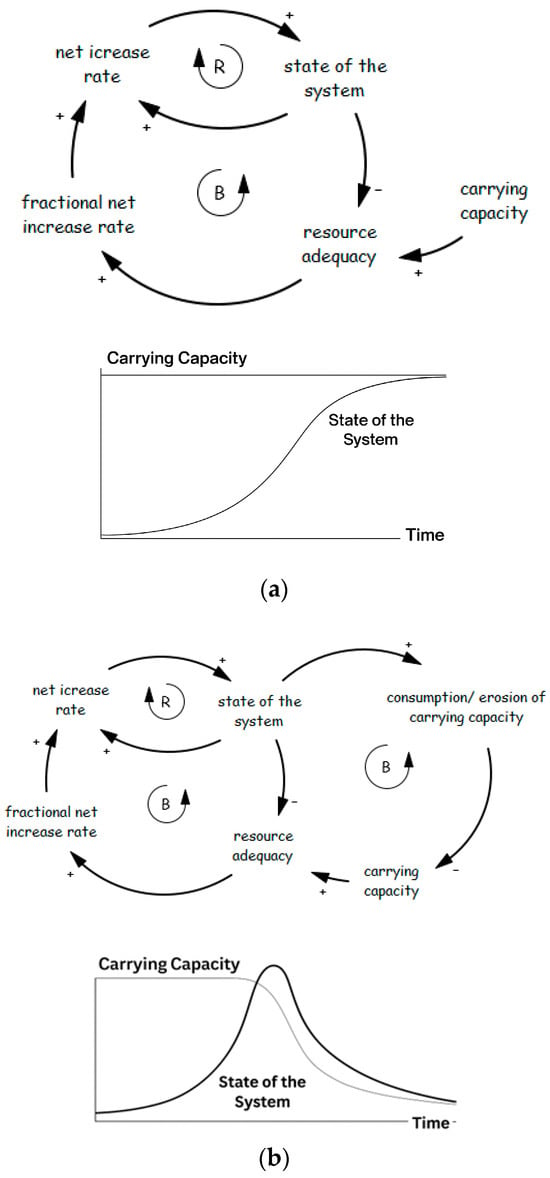
Figure 3.
Common dynamic patterns in resource-limited growth systems [12]. (a) S-shaped growth structure and behavior adopted from Sterman [12]; (b) overshoot and collapse adopted from Sterman [12].
If the carrying capacity declines due to overconsumption, it can lead to overshoot and collapse (e.g., subsidence and collapse of the aquifer, intrusion of salt water, or land abandonment) (Figure 3b) [12].
Figure 4 illustrates a simplified structure that, if not managed sustainably, will result in overshoot and collapse dynamics. The model captures the expansion of cultivated land through a reinforcing loop (R1), constrained by two limiting factors: arable land (B1) and water supply (B2). The availability of arable land in the balancing loop (B1) results in S-shaped behavior like Figure 3a. In loop B2, when water per hectare becomes a constraint, S-shaped growth again results (B2). Less water per acre would, in theory, take land out of production, inspire a change in crop type, or increase efficiency. We add loop B3 to provide an additional feedback mechanism between irrigated land and groundwater to prevent unsustainable use of water that is based on an understanding of the volume of the groundwater stock. This feedback loop maintains S-shaped behavior when withdrawal and recharge are in equilibrium. If knowledge about aquifer size, structure, and recharge is limited, the likelihood of overshoot and collapse increases. A better understanding of aquifer dynamics that results in regulated withdrawals can prevent oscillation, overshoot, and collapse if a system is regulated for sustainable use.
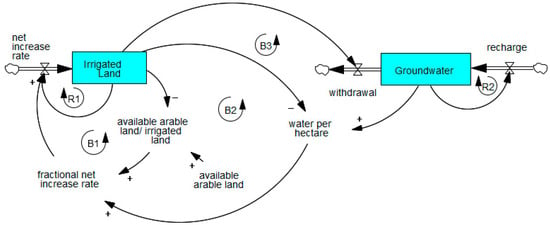
Figure 4.
Limits to Growth archetype applied to a groundwater table, illustrating how resource constraints slow and eventually limit system growth.
Another key limiting factor is groundwater supply, depleted by expanding cultivated land (balancing loop B3). This decline triggers a reinforcing loop (R2), accelerating groundwater erosion. Lower groundwater levels lead to soil compaction, reducing porosity and recharge rates, which further exacerbates groundwater depletion. Additionally, declining aquifer levels may cause land subsidence, shrinking both the groundwater reservoir and its recharge capacity and creating another detrimental cycle. Including these feedbacks provides a more comprehensive understanding of overshoot and collapse dynamics in groundwater systems.
Other limiting factors, such as rising energy costs for pumping [64] and growing environmental water demands, can also be integrated into the model. The system’s equilibrium points are highly context-dependent, influenced by socio-economic and hydrogeological conditions. Sensitivity analysis is essential for identifying critical feedbacks and understanding the relative impact of various parameters [12,65,66,67].
2.3. Predator–Prey
The Predator–Prey model has been widely used to understand groundwater dynamics, particularly in agricultural contexts [59,60,61,62,63]. The historic model, also known as the Lotka–Volterra model [68,69], illustrates the dynamic interdependence between two populations—prey (e.g., rabbits) and predators (e.g., foxes)—through two balancing feedback loops. The Predator–Prey model often exhibits oscillatory behavior, where prey and predator populations fluctuate in cycles due to delayed, nonlinear interactions [70]. When predator numbers are low, prey populations grow rapidly, triggering a predator increase. As predators rise, prey declines, eventually causing a predator drop, allowing prey to recover, and the cycle repeats. These oscillations can be stable (Figure 5b), damped toward equilibrium (Figure 5c), or explosive (Figure 5d), depending on the predator’s functional response to prey density [59,71].
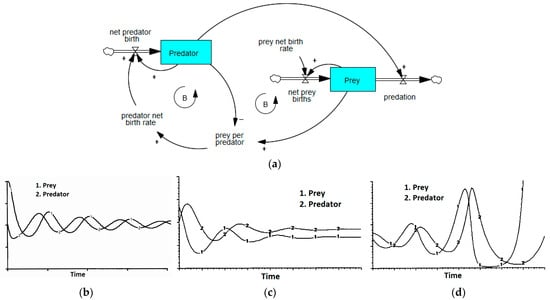
Figure 5.
Predator–prey dynamic structure and behaviors. (a) Predator–Prey model adopted from Ford [59]; (b) stable oscillation [59]; (c) damping oscillation [71]; (d) explosive oscillation [71].
Using this model in groundwater systems captures the dynamics of changing levels of irrigated land based on the availability of groundwater (Figure 6). Declining groundwater limits agricultural activity due to economic constraints (e.g., reduced profitability) or institutional regulations (e.g., water rights). Under prior appropriation laws in the Western United States, junior rights holders may lose access to water during shortages, leading to land abandonment and reduced groundwater extraction and allowing potential recovery. In other systems, reductions occur across all farms, prompting a shift to less water-intensive crops or lower yields. Despite regulatory differences, the fundamental predator–prey dynamic—where agriculture depletes groundwater with possible recovery—remains relevant across governance structures.
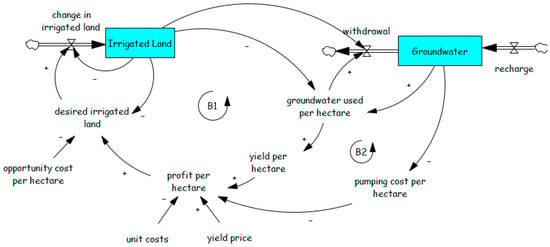
Figure 6.
Predator–Prey model for groundwater consumption, adopted from Valderrama et al. [72].
The gross margin per farm determines both the number of farms and water use per hectare, influencing aquifer depletion. If the aquifer is managed sustainably, the B1 and B2 loops should result in stable or damped oscillations. It should be noted that groundwater levels are expected to fluctuate, declining during the growing season and recovering via recharge after the growing season, characteristic of predator–prey models (Figure 5). The amplitude, period, and damping of these oscillations depend on model calibration and parameter values specific to the case study. The model assumes groundwater can recover, though recharge may be hindered by climate change, soil compaction, or subsidence. These oscillations are distinct from Section 2.5, which describes oscillatory behavior caused by information delays.
2.4. Tragedy of the Commons Archetype
Groundwater systems are common-pool resources (CPRs) because they are non-excludable and subtractable [73,74], making them vulnerable to the Tragedy of the Commons. According to this hypothesis [75,76], rational users maximize individual benefits by increasing extraction, often leading to withdrawals that exceed economically optimal levels [77,78,79]. As a result, CPRs risk degradation or even collapse [80].
This archetype illustrates how a shared resource is overexploited due to self-interested behavior. In this scenario (Figure 7), two beneficiaries rely on a limited resource for growth. As their activities expand, so does their demand for the resource, leading to its depletion and a subsequent decline in their activities. The structure includes two reinforcing and two balancing feedback loops. Individually rational actions—where each actor continues exploiting the commons for personal gain—can remain beneficial if use stays within the capacity of the system. However, once the resource is overused, benefits diminish for everyone [81].
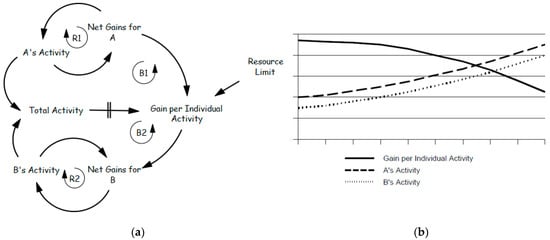
Figure 7.
Archetype of Tragedy of the Commons. (a) Structure of the Tragedy of the Commons archetype adopted from Kim [82]; (b) behavior of the Tragedy of the Commons archetype.
The Tragedy of the Commons manifests in groundwater systems in several ways. One common outcome is a pumping race, where farmers compete to extract as much water as possible to maximize their individual gains from the shared resources. As aquifer levels decline, this behavior intensifies: farmers competing for profit may rush to extract the remaining water in order to maximize short-term gains—even if it exacerbates long-term depletion for all [83]. Farmers fear that reducing their own withdrawals will lower their profits while enabling neighbors to pump more water and gain greater financial benefits. Declining aquifer levels also lead to higher pumping costs, motivating farmers to extract water sooner to avoid increased expenses later—thereby imposing additional costs and negative externalities on others. Furthermore, the Tragedy of the Commons discourages investment in irrigation efficiency. Since efficiency improvements require significant investment, individual farmers may hesitate, knowing that others can benefit from their efforts without sharing the costs [80].
This archetype has been applied to both surface water resources [64] and groundwater [84,85,86]. Using explicit consideration of the trade-off between activity growth and resource depletion results in the model shown in Figure 8, which includes two additional balancing loops compared to Figure 7a. The additional loops B3 and B4 should help stabilize the system, but as with the Tragedy of the Commons example, however, it is dependent upon the level of understanding about aquifer characteristics.
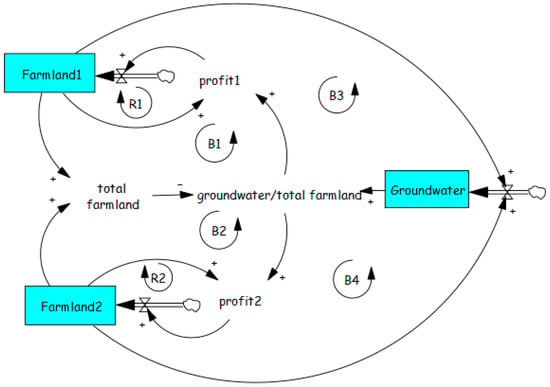
Figure 8.
Groundwater consumption based on the archetype of Tragedy of the Commons.
2.5. Oscillation from Delays
Beyond oscillation caused by seasonality or predator–prey dynamics, groundwater systems may exhibit oscillation based on information delays, delays in corrective actions, and perceived criticality of the resource [50,87,88,89]. In oscillating systems, balancing feedback loops regulate the system by comparing its state to a desired goal and initiating corrective actions when discrepancies arise, aiming for equilibrium (Figure 9a). However, significant time delays within these loops can cause oscillatory behavior, where the system repeatedly overshoots and undershoots the goal (Figure 9b). The nature of these oscillations—whether damped, cyclic, or chaotic—depends on feedback structures and parameter values, but all stem from delayed negative feedback. Delays can occur in various information links, including system state perception (due to measurement and reporting), decision-making time, and the time needed for corrective actions to take effect [12].
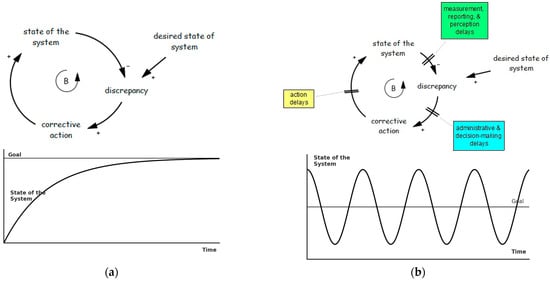
Figure 9.
Goal-seeking and oscillatory system behaviors driven by feedback loops [12]. (a) Goal-seeking structure and behavior adopted from Sterman [12]; (b) oscillation structure and behavior adopted from Sterman [12].
The model in Figure 9 is built on a generic oscillation structure to capture groundwater management dynamics. Drivers of groundwater consumption include factors such as irrigated land area, crop type, farmers’ water rights, and irrigation efficiency. These drivers influence extraction rates and groundwater levels. A goal-seeking feedback loop (B) adjusts the “desired level of groundwater consumption” in response to groundwater depletion: as groundwater availability declines, the perceived criticality of the situation increases. This triggers corrective actions aimed at regulating the underlying drivers of groundwater use.
Under normal conditions and minimal delays, the model exhibits goal-seeking behavior (Figure 9a). However, delays in the system can hinder timely corrective actions, leading to oscillatory patterns. A primary delay in groundwater management arises from the measurement and reporting of water use. For example, the New Mexico Office of the State Engineer (NM OSE) [90] publishes water-use reports every five years, typically with a four-year lag. Similar delays affect national and global agencies, where challenges in data collection and dissemination create backlogs requiring extensive processing [91].
Social constructs such as cognitive biases, anchoring, and the need for consensus-building contribute to delays in corrective action. Cognitive biases, such as optimism, lead individuals to overestimate positive outcomes and underestimate negative ones [87]. Unrealistic optimism often results in overly optimistic hydrological assessments, with “safe yields” or recharge rates initially set too high and later revised downward [88]. For instance, Bitran et al. [89] found a 30% overestimation of aquifer recharge in Chile’s Copiapó Basin due to reliance on data from an unusually wet period (1980–1990). Moreover, quantifying recharge is inherently difficult, often requiring “best guess” estimates due to the complexity of measuring water percolation and aquifer heterogeneity [50].
Environmental, social, and economic side effects also influence “perceived criticality.” For example, lake depletion can trigger dust storms, while excessive groundwater extraction may cause land subsidence, damaging infrastructure like roads, buildings, and subway tunnels. The “desired driver of groundwater consumption” is shaped not only by perceived criticality but also by the cognitive heuristics [92]. Decision-makers, whether farmers or authorities, often anchor their perceptions on current groundwater use and adjust based on external pressures, such as farmer unemployment or the goal of self-sufficiency. Anchoring is typically stronger under uncertainty and when corrective actions are costly. The invisible nature of groundwater makes estimation difficult; recharge rates often rely on subjective assessments or “best guesses” due to aquifer heterogeneity [50]. Further complications arise from hydrological variability, climate change, and uncertainties about aquifer structure and boundaries, requiring extensive research for accurate assessment [80] (p. 30).
Another significant barrier to the timely implementation of corrective actions is the complex process of consensus-building, decision-making, budget allocation, and overcoming practical implementation challenges, including resistance and lobbying from farmers. These processes require substantial time and effort to navigate effectively. Additionally, the impact of corrective actions on groundwater is not immediate due to the inherent nature of groundwater as a “stock” variable, characterized by slow response times and the accumulation of effects over time.
It is important to note that Figure 10 presents a simplified model illustrating system delays that can slow corrective actions through balancing feedback loops, potentially causing oscillatory behavior. However, it does not explicitly model the growth of groundwater consumption drivers. Additionally, perceived criticality affects the desired driver through mechanisms like the Tragedy of the Commons and eroding goals, which are explored in other sections.
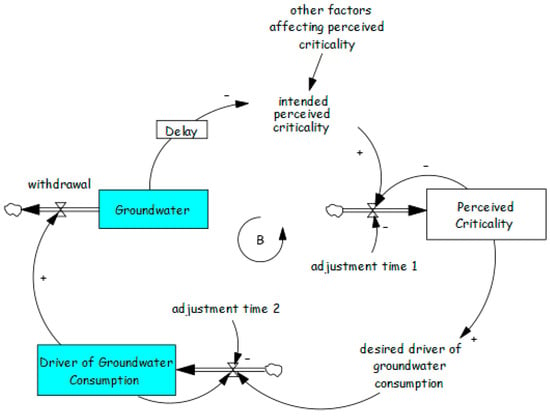
Figure 10.
Basic model for groundwater based on the generic structure of oscillation. Drivers of groundwater consumption are aggregated variables that include factors such as irrigated land area, crop type, farmers’ water rights, and irrigation efficiency. The desired drivers of groundwater consumption represent the target or sustainable level of these factors that stakeholders aim to maintain. Criticality reflects the actual severity or importance of the groundwater depletion problem, while perceived criticality refers to stakeholders’ assessment of this severity, which may differ from reality due to delays in information or the influence of other factors.
3. Internal Mechanisms
The amount of water pumped is defined as the lesser of water demand and available supply. Supply depends on groundwater availability, established water rights, and regulatory caps on maximum withdrawals. Demand, in turn, is derived from the irrigated land area multiplied by the crop water requirement per hectare and adjusted for irrigation efficiency. Thus, groundwater consumption is primarily driven by four factors: water rights, irrigated land area, crop type, and irrigation efficiency. These factors are dynamic, changing over time through internal mechanisms within the system. For example, irrigated land area may decline due to land abandonment or shift through land-use transformation (e.g., conversion to non-agricultural uses). Because climatic drivers are exogenous to the system, they are excluded from this study. The following sections examine these endogenous mechanisms—summarized in Table 1—and their potential long-term implications for system behavior.

Table 1.
Mechanisms that can affect groundwater consumption.
3.1. Water Rights
3.1.1. Restricting Water Rights
Restricting water rights is often seen as a viable solution to groundwater overexploitation. However, political concerns and potential economic and social costs make authorities hesitant to impose such restrictions, worsening the problem. This dynamic aligns with the “shifting the burden” archetype (Figure 11). Faced with water scarcity, governments typically offer two options: creating new non-agricultural job opportunities and reducing farm size [93,94,95,96,97] or, alternatively, ignoring groundwater concerns and continuing to permit new wells to meet agricultural demand [98,99]. The first option is costly and slow, making it unattractive to politicians seeking quick fixes. As a result, short-term solutions fail to address root causes and allow the problem to deepen over time.
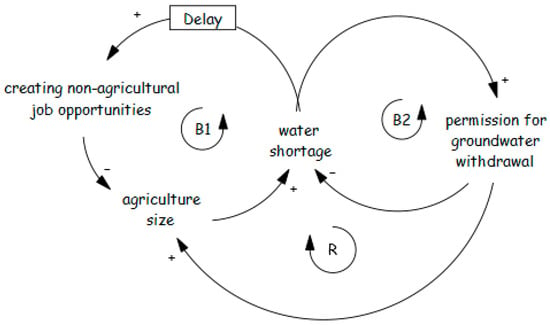
Figure 11.
Governmental laxity in restricting groundwater extraction, illustrating the Shifting the Burden archetype.
3.1.2. Illegal Wells
Restricting water withdrawals can increase the risk of illegal extraction, as seen in Iran [100,101]. Authorities restricted permits for new wells, designated “prohibited plains” where groundwater extraction was banned, and implemented measures such as smart meters on wells, GPS devices on drilling rigs, and expanded patrols [51]. Despite these efforts, the number of illegal wells rose significantly (Figure 12).
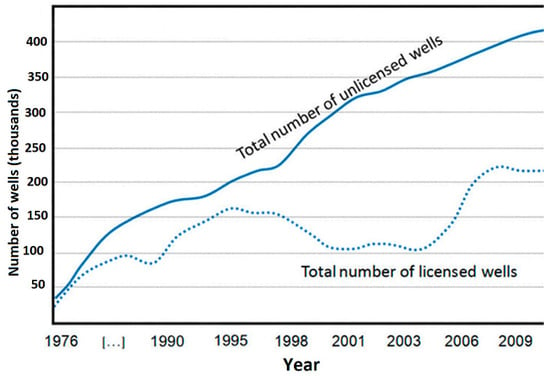
Figure 12.
Number of legal and illegal wells [51].
The rise in illegal wells can be explained by a reinforcing feedback loop (Figure 13): as their numbers increase, so does the belief in their effectiveness, encouraging more farmers to dig illegal wells and perpetuating the cycle. This creates a vicious circle of illegal well drilling.
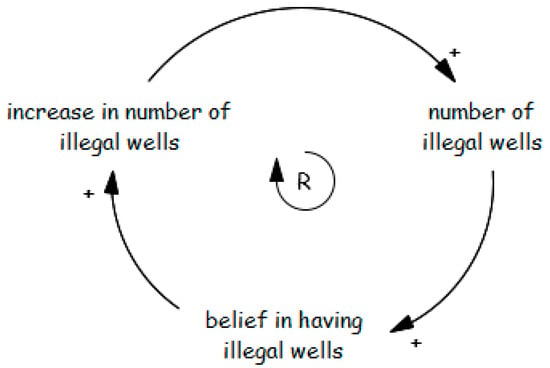
Figure 13.
Reinforcing loop fueling exponential growth of unauthorized wells.
A key question is why governments fail to take decisive action to block illegal wells and enforce stricter penalties. This can be explained by the “drifting goals” archetype (Figure 14). When there is a gap between desired and actual water withdrawal, authorities have two options: take action to meet the goal or lower the goal to align with current realities. Often, the goal is adjusted downward due to implementation challenges or socio-economic and political concerns [50,102,103,104].
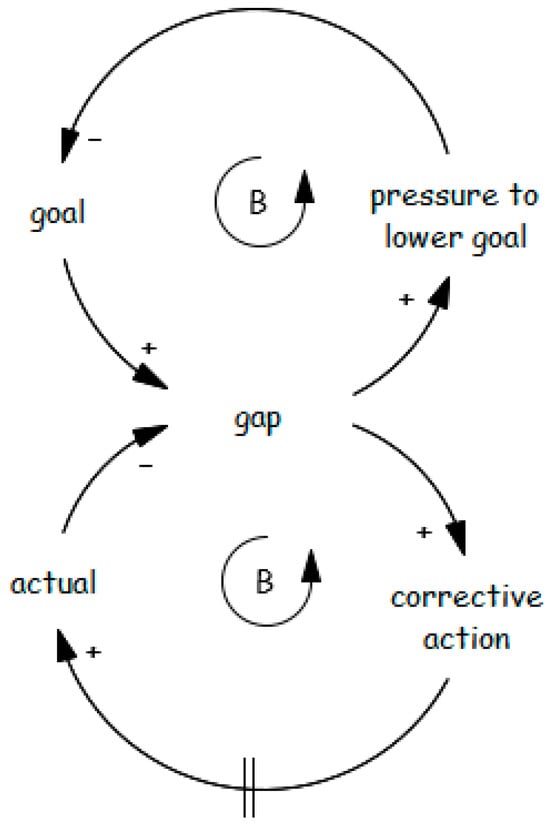
Figure 14.
Erosion of government motivation to block existing illegal wells and prevent new well digging.
3.1.3. Collective Action
While state-centered water governance has been criticized for inefficiency [50,51,105], self-organized collective action offers an alternative for managing groundwater depletion [78,106]. Collective action in groundwater management refers to the coordinated efforts of multiple water users—such as farmers, communities, or institutions—to sustainably govern, allocate, and protect shared groundwater resources, especially in situations where individual actions may lead to over-extraction and resource depletion (i.e., the Tragedy of the Commons). It involves cooperation, shared rules or agreements, monitoring, and conflict resolution mechanisms to ensure long-term resource sustainability and equitable access [107,108].
Castillo & Saysel [52] conducted one of the few SD studies exploring the internal mechanisms of group cooperation. The findings underscore how initial trust is shaped by prior interactions that reveal sensitivity to both reciprocal behavior and free-riding. Path dependence is a common pattern in systems with reinforcing feedback, where small initial differences are amplified, leading the system along distinct trajectories. Early random events often determine the system’s final state, even when all outcomes were equally likely at the start [12] (p. 349). Reinforcing feedback can lock systems into specific equilibria [109,110,111].
Such actions are often illustrated by the “Success to the Successful” archetype [112,113,114,115,116,117]. This archetype describes a reinforcing feedback loop in which initial success attracts more resources, opportunities, or advantages, increasing the likelihood of further success. Over time, this self-reinforcing cycle creates cumulative advantages, widening the gap between successful and less successful entities.
Figure 15a illustrates the “Success to the Successful” archetype in collective action. Cooperation builds trust, which in turn reinforces further cooperation through the R1 feedback loop. Conversely, distrust fosters non-cooperation, accelerating the erosion of trust in a similar reinforcing cycle (R2). Figure 15b shows the system’s two stable equilibria (attractors), while Figure 15c depicts how, from an unstable equilibrium (repeller), small initial differences can lead the system toward either attractor, resulting in different outcomes. Farmers are positioned on the ‘repeller’ in Figure 15b and have the potential to either collaborate (Attractor 1) or not collaborate (Attractor 2).
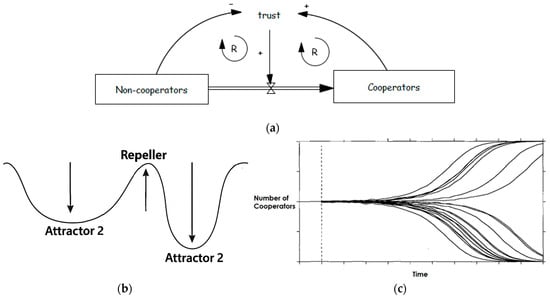
Figure 15.
Path dependence. (a) Path-dependence structure for collective action. (b) A system with two stable states (attractors) and one unstable state (repeller). You can think of it like a ball on a landscape with two valleys and a hill in between. If the ball is placed anywhere on the hill (the repeller), even a small push will cause it to roll down into one of the valleys (the attractors). Once in a valley, the ball stays there unless it is pushed hard enough to cross the hill again. This shows how the system can settle into different stable outcomes depending on where it starts or what disturbances it experiences. (c) Behavior of the system adopted from Sterman [12]. Starting from nearly identical initial conditions, small differences get amplified over time, leading the system toward very different outcomes—either high cooperation or low cooperation.
Once a dominant standard emerges, it creates inertia and rigidity, making change difficult. High transition costs establish a self-reinforcing equilibrium, or lock-in, that persists until a major external shock or architectural shift renders the existing system obsolete. Policy interventions are often required to redirect the system’s trajectory, but choosing the right policy is challenging due to nonlinear feedback loops and delays between actions and outcomes [118].
3.2. Crop Type
Crop selection is shaped by both environmental constraints and economic considerations, though the decision-making logic may differ across contexts. In a study from Africa, Dudley [49] examined farmers’ choices between sorghum and maize. While maize provides higher yield potential, it is more susceptible to drought than sorghum. Farmers adjusted their planting decisions based on recent harvest performance and market conditions, balancing risk and reward in response to climatic uncertainty.
In a separate study, Gohari et al. [62] developed a model (Figure 16) to explain land allocation decisions under water scarcity. Their framework assumes that farmers aim to maximize income, assigning land to crops based on net economic returns from the previous year. A key feature of the model is the “Delivery Rate”—the proportion of water demand that is met by supply—which influences expectations about water availability and subsequently affects crop allocation in future seasons.
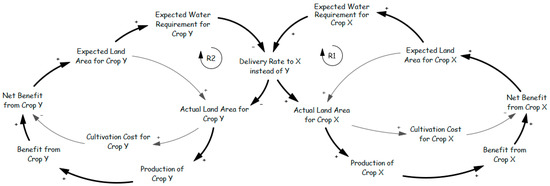
Figure 16.
Agricultural land-use decisions based on income maximization, adopted from Gohari et al. [62].
A notable example of this transition is the Urmia region in Iran, where agriculture has shifted from traditional wheat farming to horticulture, particularly apple orchards. Unlike dryland farming, which can pause during droughts with minimal financial impact, horticulture presents new water management challenges. First, farmers’ livelihoods now depend heavily on consistent water access, making water allocation contentious during shortages—though financial compensation may help address this issue. Second, apple trees require a reliable water supply; even one year of inadequate irrigation can lead to widespread tree loss [119].
The expansion of a specific crop often drives the growth of related industries, creating additional incentives for farmers to maintain or increase production. This reinforces the status quo by consolidating regional expertise and infrastructure around that crop, generating inertia against change. This crop transition is well explained by the “Success to the Successful” archetype. Farmers tend to favor crops with higher profits, leading to expanded cultivation, when water resources are available to support such shifts. In Urmia, apple yields per hectare are about six times higher than wheat [120], despite similar prices, resulting in a steady increase in apple orchards [121]. Notably, apples have a much lower water footprint (m3/ton) than wheat [122]. Additionally, the water needs and economic returns differ between bearing and nonbearing (young) trees [123].
3.3. Irrigation Efficiency
The issue of improving irrigation technology can be viewed from two angles: “developing new technologies” and “adopting existing innovations”. In agriculture, advances in water supply and availability have outpaced improvements in production and irrigation technologies [51]. Historically, high costs and technical limitations have made large-scale water extraction difficult. However, advances in mechanical and electrical pumps, along with deep drilling techniques, have unlocked previously inaccessible water resources, transforming agricultural water use [124].
Regrettably, the potential of these technologies has been undermined by institutional challenges, including unclear property rights, complex shared resource management, and the absence of transparent pricing for water extraction [125]. These issues have led to unsustainable over-extraction by individual farmers, exceeding optimal long-term thresholds. Economically, the failure to internalize the external costs of groundwater use has driven extraction levels beyond the socially optimal point, the point at which overall societal welfare is maximized by balancing the benefits and costs of use [126]. As critical thresholds are approached, supply and demand dynamics—along with the need for technological innovation—are likely to intensify, influencing pricing mechanisms and promoting sustainability efforts, particularly during times of crisis.
An important factor in irrigation efficiency is the adoption of technological innovations, which helps explain why some farmers embrace them while others do not. Despite the availability of advanced technologies, nearly one-third of irrigated cropland in the western United States still relied on less efficient, traditional gravity systems as of 2018 [127]. The sustainability of irrigated agriculture depends, in part, on how widely producers adopt more efficient systems that combine improved on-farm water management with advanced irrigation technologies [54].
The generic diffusion structure shown in Figure 17 models technology adoption and offers insights into phenomena such as epidemics, innovation diffusion, and product growth [12]. It includes two key stocks—Adopters and Non-Adopters—linked by a reinforcing feedback loop that drives accelerating growth, and a balancing feedback loop that stabilizes adoption as the system nears carrying capacity. The interaction of these loops, along with system nonlinearity, produces the characteristic S-shaped adoption curve.
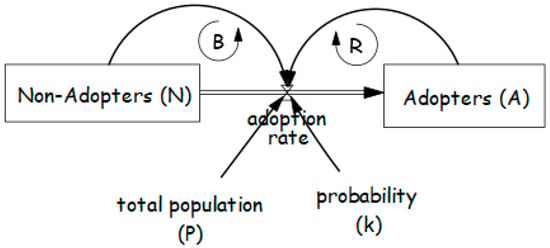
Figure 17.
Technology adoption model adapted from the diffusion model [12].
Applying this model requires answering the following key questions: When do people adopt? What differentiates early adopters from late adopters? And what factors influence individual farmers’ adoption rates? Studies on agricultural technology adoption identify five main categories: farmer characteristics, economic factors, farm characteristics, technology attributes, and institutional factors [128]. However, it is also crucial to understand how these variables evolve over time, particularly regarding land size dynamics (fragmentation and consolidation) and the aging agricultural workforce.
Efforts to enhance irrigation efficiency can paradoxically accelerate groundwater depletion. More efficient technologies may reduce return flows and hinder aquifer recharge [129]. Additionally, the Jevons paradox—also known as the rebound effect—explains how improvements in efficiency can sometimes increase water demand, reducing the expected benefits of conservation [130,131]. Rebound mechanisms include expanding irrigated land, shifting to more intensive or high-value crops, and increasing irrigation frequency [132]. This dynamic reflects the “fixes that fail” archetype (Figure 18), where efficiency improvements (the fix) remove constraints on water use, ultimately leading to greater consumption (the failure). As discussed in Section 2.1, removing water availability limits enables practices such as cultivating water-intensive crops and expanding farmland.
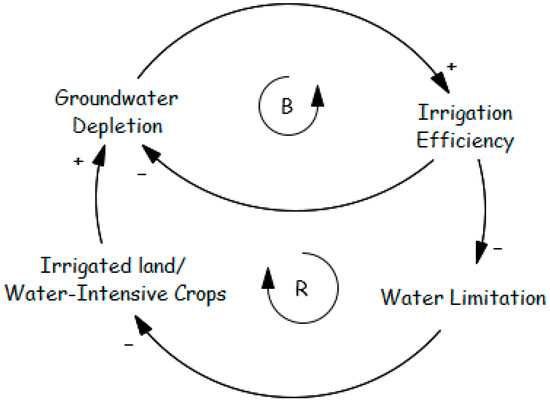
Figure 18.
Fixes That Fail archetype.
3.4. Land Size
The total area of irrigated land changes due to three main factors: (1) the shift from dry to irrigated farming, (2) land transformation, and (3) land abandonment. In recent years, large areas have transitioned from dry farming to irrigation, a trend that could be reversed to address the water crisis [133]. This shift is partly driven by climate change-induced declines in precipitation and the development of water supply infrastructure. In Iran, for example, dam construction has increased land value and enabled the conversion of arid areas into irrigated farmland [134]. The following sections will explore land transformation and abandonment.
3.4.1. Land Transformation
Land use in agricultural areas is dynamic, influenced by factors such as land abandonment and conversion. These changes can go both ways—transforming non-agricultural land into farmland or converting farmland to other uses. For example, Turner et al. [135] documented a major shift from native landscapes to agriculture in North America’s endangered Northern Great Plains. In a subsequent study, Turner et al. [136] projected farmland expansion in the region from under 200,000 km2 to over 230,000 km2 by the mid-21st century under a base-case scenario.
Conversely, agricultural land is often converted to non-agricultural uses due to the profitability of residential land [137,138,139], which can be exacerbated by tax policy [140] Figure 19a presents a model illustrating the land transformation process through three stages (stocks): Farmland, Available Land for Sale, and Residential. The main driver of farmland conversion is the land price-to-farming profit ratio—the higher the ratio, the faster the transformation. Changes in land price follow the “invisible hand” structure [12] (p. 169), while changes in farming profit align with the “Success to the Successful” archetype.
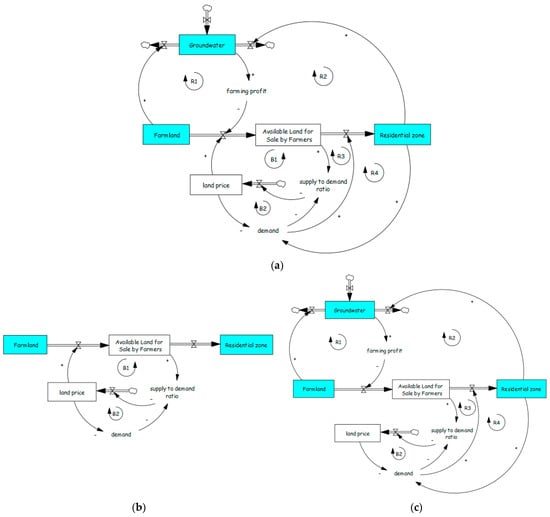
Figure 19.
Land transformation dynamics. (a) Dynamic hypothesis for land transformation in Demavand, Tehran, Iran, adopted from Bastan et al. [48]; (b) invisible hand structure; (c) Success to the Successful archetype.
The invisible hand structure (Figure 19b) includes two balancing loops—supply and demand—both influenced by price. The “Success to the Successful” archetype (Figure 19c) illustrates competition for limited groundwater between farmland and residential [141]. As residents increase, groundwater availability and farming profits decline, accelerating farmland conversion. Additionally, more housing stimulates regional development, further increasing residential demand.
Tax policy represents another reinforcing loop that can significantly influence land transformation [140]. Many areas have transitioned from predominantly rural, agricultural regions to urbanized landscapes. Land sale rates are closely linked to the relative tax burden on agricultural landowners, which escalates as surrounding areas undergo urbanization. This burden increases due to factors such as higher property valuations and taxation of non-land assets (e.g., livestock). As the ratio of urban land to irrigated land rises, so does the financial pressure on farmers, often forcing them to sell land, thereby accelerating urban expansion. This reinforcing feedback loop plays a critical role in determining whether agricultural landowners can retain large holdings (Figure 20).
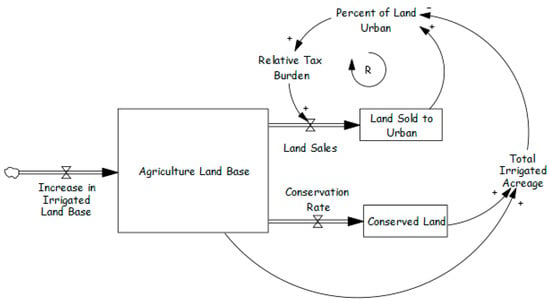
Figure 20.
Dynamics of land transformation, adopted from McNamara et al. [140].
3.4.2. Land Abandonment
An inherent mechanism may cause farmers to migrate and abandon agricultural land without government intervention. This process can be modeled using the generic structure shown in Figure 21 (adapted from the diffusion model), which closely parallels the technology adoption framework presented in Section 3.3. The interaction of these feedbacks and nonlinearity produces an S-shaped curve, reflecting the gradual shift toward equilibrium.
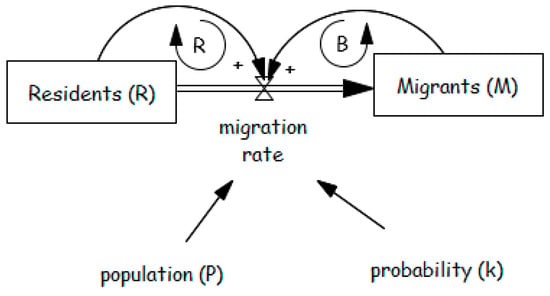
Figure 21.
Rural migration model showing the interaction between resident (R) and migrant (M) populations. The migration rate is determined by population (P) and probability (k), with reinforcing (R) and balancing (B) feedback loops influencing migration dynamics.
Migration and farmland abandonment result from a mix of geo-physical and socio-economic factors, including income gaps between farm and non-farm jobs, water scarcity, land size, labor market shifts, agricultural prices, policies, land modernization limits (e.g., steep terrain, remote access), and the geographic and cultural isolation of settlements [142,143,144,145,146]. Migration is often a collective behavior influenced by the decisions of others. Individuals have specific thresholds, and only when these are met do they choose alternative paths [53].
Rural migration and subsequent land abandonment may suggest a reduction in groundwater over-extraction, given that less cultivated land typically requires less irrigation. However, in many cases, this dynamic has little to no mitigating effect—and can even exacerbate groundwater depletion, especially in situations when water rights are not tied to land ownership. When farmers leave their land, they frequently sell their water rights to others or repurpose the land for residential development. While some farmers may choose not to sell, resulting in a temporary reduction in pumping, expanding urban areas often generate new residential groundwater demands that offset or exceed those reductions [147]. In contexts where groundwater use is poorly monitored or unenforced, remaining users may freely extract additional water [148]. The unused share from one farmer can thus be absorbed by others, intensifying overall pressure on the aquifer [107]. In developing countries, additional factors complicate the relationship between migration and water use. Agriculture remains labor-intensive due to limited mechanization, prompting farmers to rely on large families. Upon inheritance, land is divided among children, leading to fragmentation [149]. In Iran, for instance, the average farm is smaller than five hectares—orchards just one to two—far below the 70- to 80-hectare averages in more productive systems. These small holdings hinder the adoption of modern technologies essential for groundwater conservation [150,151].
While rural youth migration may reduce groundwater use, it can also worsen the problem in the short or long term. Uncertainty about future water availability lowers farmers’ incentives to invest in machinery and improve irrigation efficiency [152]. If farmers believe future generations will not continue farming, they care less about the future, leading to increased consumption, less collective action, and a shift toward intensive agriculture—further degrading groundwater and land [153]. Youth migration also raises the average age and lowers the literacy level of farmers. Older farmers often have reduced physical capacity and are more resistant to adopting new technologies, mechanized irrigation, or alternative crops. In Iran, many farmers lack alternative skills, making it difficult to change professions as agriculture becomes less profitable. Lower literacy further limits their ability to pursue other opportunities, reinforcing reliance on traditional, inefficient practices [154].
In summary, rural youth migration can both alleviate and worsen groundwater depletion. Understanding its net impact is critical for water managers: Will migration reduce groundwater use or intensify depletion? Under what conditions does each scenario emerge? Are there single or multiple possible equilibria? Addressing these questions is essential for assessing the broader implications of rural migration on groundwater and developing effective management strategies.
4. Using Legos
The following three examples demonstrate how the library can facilitate model development using a Lego-like approach. The first example examines the dynamic relationship between irrigation efficiency and groundwater resources, the second explores the connection between land-use change and groundwater, and the third addresses the issue of illegal wells. The first example illustrates how multiple sub-models can be integrated to construct a more comprehensive model. The second example demonstrates that model building does not always require combining multiple sub-models; in some cases, extending a single sub-model is sufficient. The third example is intentionally more advanced, highlighting that the previously introduced sub-models may require customization. Rather than memorizing these sub-models, it is essential to understand their underlying concepts, enabling modelers to adapt and tailor them to the specific needs of each case study.
4.1. Dynamic Relationship Between Irrigation Efficiency and Groundwater
To illustrate the interaction between irrigation efficiency and groundwater use, a base model for groundwater dynamics is first selected. The library offers four fundamental types of base models; in this example, the Prey–Predator model (Section 2.3) is used, as shown in red in Figure 22. To incorporate irrigation efficiency, the technology adoption sub-model from the library is added. The next step involves integrating these two components. The first connection between the sub-models comes from the effect of pumping cost on the probability of technology adoption: the more the pumping cost per liter, the greater the tendency and probability to adopt new technologies. The other connection comes from the effect of adopting irrigation efficiency technology on the amount of groundwater used per hectare: the greater the number of adopters, the less groundwater is used per hectare. Connecting the sub-models results in the creation of a new balancing loop (B4): higher pumping costs per liter encourage greater adoption of water-conserving practices, reducing groundwater use per hectare and overall withdrawals. As groundwater levels recover, pumping costs decline.
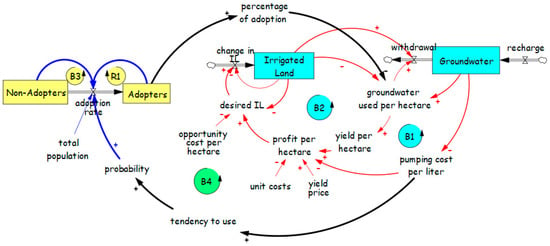
Figure 22.
Interactions between irrigation efficiency and groundwater. The model shows how adoption of irrigation efficiency technologies by non-adopters and adopters influences irrigated land, groundwater withdrawal, and recharge. Key feedback loops (B1–B4 and R1) capture the relationships among groundwater use per hectare, pumping cost per liter, yield per hectare, profit per hectare, opportunity cost, and the tendency to adopt new technologies.
4.2. Dynamic Relationship Between Land-Use Change and Groundwater
This example illustrates the water–land nexus in the context of urbanization. The model is based on the land transformation sub-model (Section 3.4.1), shown in red in Figure 23. To represent groundwater resources, a stock variable for groundwater is incorporated. The linkage between land use and groundwater is established through distinct patterns of water withdrawal and return across agricultural and urban areas. The shift toward residential land use reduces aquifer recharge due to the expansion of impermeable surfaces such as concrete, asphalt, and buildings, which replace pervious open fields. On the other hand, declining groundwater levels lead to rising pumping costs and higher groundwater prices—particularly in systems where groundwater rights are decoupled from land ownership and can be sold or leased independently. Considering land prices, property taxes, water prices, and pumping costs (which affect income per hectare), farmers may opt to sell their land for urban development.
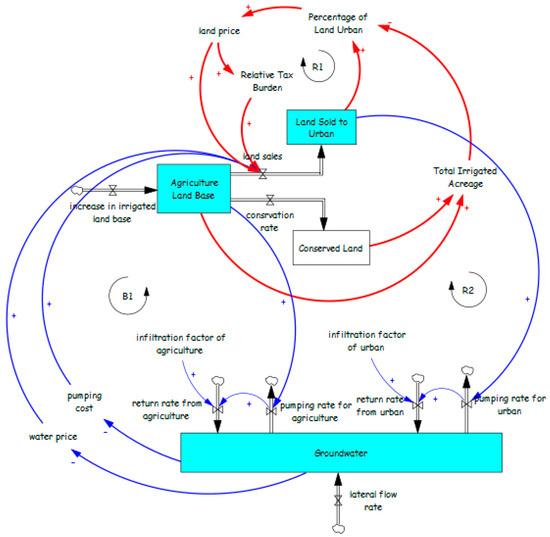
Figure 23.
Water–land nexus model. The diagram illustrates interactions among agricultural land base, urban land conversion, conserved land, and groundwater. Feedback loops (B1, R1, and R2) capture how land price, tax burden, irrigation expansion, pumping costs, and infiltration factors for both agricultural and urban areas influence groundwater levels, pumping rates, and land-use changes.
4.3. Illegal Wells
This example illustrates the dynamics of illegal wells. The model is based on the Limits to Growth archetype, though it employs a modified structure distinct from the version presented in Section 2.2. As shown in Figure 24, the expansion of the agricultural sector (R1) is constrained by three key balancing loops: land availability (B1), water scarcity (B2), and the limited issuance of well permits (B3).
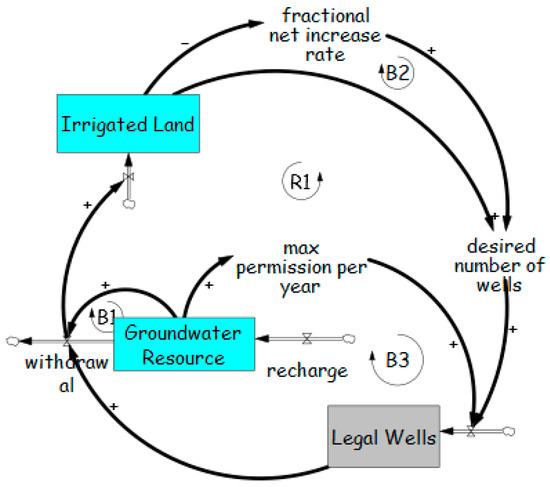
Figure 24.
Modified Limits to Growth archetype applied to groundwater resource management (adapted from [155]). The model illustrates how irrigated land, groundwater resources, and legal wells interact through feedback loops (B1–B3 and R1), capturing the effects of withdrawal, recharge, and regulatory limits on well development.
As discussed in Section 3.1.2 on illegal wells, inadequate regulatory oversight triggers a Fixes That Fail dynamic, whereby short-term measures fail to address the underlying problem and ultimately exacerbate the spread of illegal wells (Figure 25).
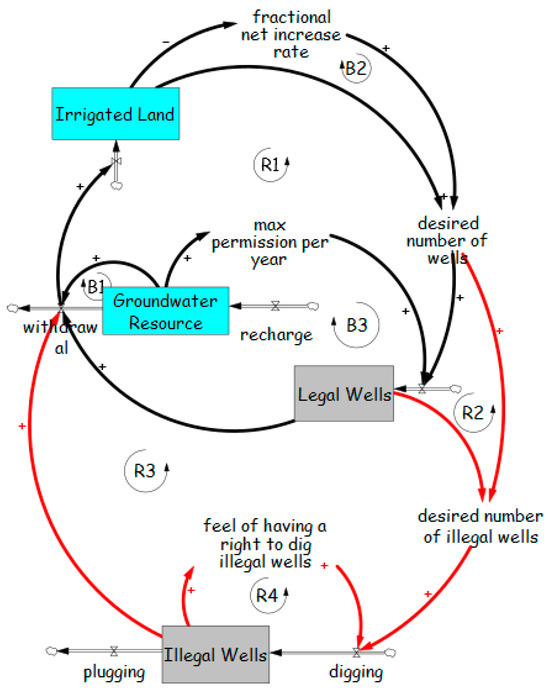
Figure 25.
Fixes That Fail archetype illustrating the unintended consequences of weak supervision in groundwater management. The model links irrigated land, groundwater resources, legal wells, and illegal wells through reinforcing (R1–R4) and balancing (B1–B3) feedback loops, showing how fixes can exacerbate the problems.
In addition, concerns over potential social and political backlash may lead authorities to tolerate or ignore the presence of illegal wells. This behavior aligns with the Drifting Goals archetype, also described in Section 3.1.2, where enforcement standards are gradually lowered in response to mounting pressure (Figure 26).
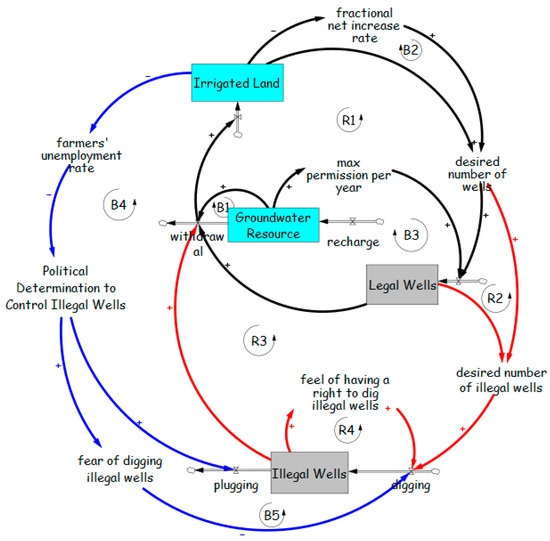
Figure 26.
Drifting Goals archetype representing the erosion of regulatory enforcement over time in groundwater management. The model links irrigated land, groundwater resources, legal wells, and illegal wells through reinforcing (R1–R4) and balancing (B1–B3) feedback loops, illustrating how declining political determination—driven by social consequences such as farmers’ unemployment—and shifting targets can lead to increased illegal well drilling.
5. Summary, Challenges, and Suggestions for Future Study
Groundwater resources exhibit dynamic complexity, with behaviors shaped by accumulations, feedback loops, time delays, and nonlinear interactions. Fully understanding these dynamics requires an interdisciplinary perspective that integrates hydrological, social, economic, and political considerations. Given these characteristics, SD provides a powerful framework for modeling groundwater systems.
Despite its advantages, developing an SD model is challenging and demands substantial expertise—particularly in the conceptualization phase, which is often the most difficult and critical stage of the modeling process. To address these challenges, various conceptualization approaches have been proposed. Among them, the Lego-like approach stands out for its potential to significantly accelerate model development by assembling pre-fabricated sub-models rather than building every structure from the ground up.
Analogous to constructing a house or kitchen from pre-built components—such as cupboards, windows, and doors—rather than crafting each element from raw materials, this approach depends on access to a repository of sub-models. Experienced SD modelers often possess such mental or documented repositories, enabling them to adapt and integrate components efficiently. In contrast, less experienced modelers may lack access to these resources, limiting their ability to apply the approach effectively.
To help bridge this gap, this study conducted a systematic review and classification of sub-models commonly employed in groundwater SD models, creating a structured resource to support faster, more robust model conceptualization.
The sub-model library and the Lego-like approach each offer distinct advantages:
- Faster Model Development—Rather than starting from scratch, modelers can assemble pre-validated modules from the library, significantly accelerating the modeling process.
- Improved Understanding of Complex Models—Viewing models through a Lego-like lens enables less experienced SD modelers to decompose large, complex systems into smaller, more understandable sub-models. This incremental approach enhances comprehension and learning.
- Refinement of Existing Models—Some hydrology-based models are developed by hydrologists with limited SD expertise, which may result in gaps from a system dynamics perspective. The Lego-like approach, together with the sub-model library, can help address these gaps by allowing modelers to systematically deconstruct their models and compare each component with established sub-models in the library, thereby strengthening conceptual clarity and structural robustness.
It is important to note that the Lego-like approach is one of ten recognized methods for model conceptualization—a qualitative phase focused on articulating the dynamic hypothesis for the problem under study. At this stage, the objective is to guide thinking and organize model structure during early development rather than to produce a fully parameterized and validated simulation model. As with other conceptual modeling methods, the resulting structures should be cross-checked and refined using alternative conceptualization approaches. While these methods primarily support qualitative modeling, the development of quantitative SD models typically requires extensive iteration and trial-and-error refinement.
One of the primary challenges in modular modeling lies in assembling sub-models into a cohesive and internally consistent system. The Lego-like approach has two key prerequisites: (1) a comprehensive library of sub-models, and (2) clear guidelines for customizing and integrating those sub-models. Without careful integration and adaptation, the resulting model may appear disjointed, with individually functional components failing to operate effectively as a unified whole. Common integration challenges include ensuring conceptual alignment across sub-models, harmonizing assumptions and time steps, maintaining consistency in units, and resolving overlaps or unintended interactions in feedback structures. Addressing these issues is essential to preserving the model’s relevance, structural integrity, and capacity to generate reliable and actionable insights.
Finally, we recommend several areas for further investigation and development to advance the utility and robustness of modular groundwater SD modeling. As noted, water is one of the most frequently modeled topics, and reviewing all existing studies was beyond the scope of this work. Expanding the sub-model library—either through additional literature review or by developing new sub-models—represents an important avenue for future research. In particular, we found no foundational models for groundwater systems under different institutional frameworks. Further research should examine how varying institutional “rights to water” policies influence system structure and dynamics. This includes adapting or extending archetypal models to capture unequal access to water, differentiated impacts of scarcity, and institution-specific feedback mechanisms. Incorporating such legal and institutional nuances will enhance the realism, relevance, and policy applicability of groundwater SD models across diverse governance contexts.
Establishing a structured methodology for selecting among the four base models (Predator–Prey, Limits to Growth, Tragedy of the Commons, and Oscillation) will be critical to enhancing the reliability, transparency, and applicability of groundwater SD models while minimizing ambiguity in model choice. As noted earlier, providing clear guidelines for customizing and integrating sub-models is equally important. Once a comprehensive library of sub-models and clear procedures for tailoring and assembling them are in place, developing a software implementation—such as embedding the library into existing SD platforms (e.g., Vensim, Stella)—could substantially increase the usability and accessibility of the resource for both researchers and practitioners. Looking ahead, incorporating artificial intelligence into this process could further streamline model construction using the Lego-like approach, enabling automated selection, customization, and integration of sub-models from the library.
Author Contributions
Writing—original draft, M.M.M.; Writing—review & editing, A.B.K.; Supervision, A.B.K. All authors have read and agreed to the published version of the manuscript.
Funding
This research was funded by the National Science Foundation, grant number 2115169.
Data Availability Statement
The data presented in this study are available in the article itself.
Acknowledgments
The authors thank Leonard Malczynski and the anonymous reviewers for their valuable feedback, which strengthened the quality of this work.
Conflicts of Interest
The authors declare no conflict of interest.
References
- Cardwell, H.E.; Cole, R.A.; Cartwright, L.A.; Martin, L.A. Integrated Water Resources Management: Definitions and Conceptual Musings. J. Contemp. Water Res. Educ. 2006, 135, 8–18. [Google Scholar] [CrossRef]
- Højberg, A.L.; Refsgaard, J.C. Model Uncertainty—Parameter Uncertainty versus Conceptual Models. Water Sci. Technol. 2005, 52, 177–186. [Google Scholar] [CrossRef]
- Kreamer, D.K.; Ball, D.M.; Re, V.; Simmons, C.T.; Bothwell, T.; Verweij, H.J.M.; Mukherjee, A.; Moreau, M.F. Chapter 37—The Future of Groundwater Science and Research. In Global Groundwater; Mukherjee, A., Scanlon, B.R., Aureli, A., Langan, S., Guo, H., McKenzie, A.A., Eds.; Elsevier: Amsterdam, The Netherlands, 2021; pp. 503–517. ISBN 978-0-12-818172-0. [Google Scholar]
- Lall, U.; Josset, L.; Russo, T. A Snapshot of the World’s Groundwater Challenges. Annu. Rev. Environ. Resour. 2020, 45, 171–194. [Google Scholar] [CrossRef]
- Zektser, S.; Loáiciga, H.A.; Wolf, J.T. Environmental Impacts of Groundwater Overdraft: Selected Case Studies in the Southwestern United States. Environ. Geol. 2005, 47, 396–404. [Google Scholar] [CrossRef]
- Golian, M.; Saffarzadeh, A.; Katibeh, H.; Mahdad, M.; Saadat, H.; Khazaei, M.; Sametzadeh, E.; Ahmadi, A.; Sharifi Teshnizi, E.; Samadi Darafshani, M.; et al. Consequences of Groundwater Overexploitation on Land Subsidence in Fars Province of Iran and Its Mitigation Management Programme. Water Environ. J. 2021, 35, 975–985. [Google Scholar] [CrossRef]
- Alfarrah, N.; Walraevens, K. Groundwater Overexploitation and Seawater Intrusion in Coastal Areas of Arid and Semi-Arid Regions. Water 2018, 10, 143. [Google Scholar] [CrossRef]
- Kumar, P.; Avtar, R.; Dasgupta, R.; Johnson, B.A.; Mukherjee, A.; Ahsan, N.; Nguyen, D.C.H.; Nguyen, H.Q.; Shaw, R.; Mishra, B.K. Socio-Hydrology: A Key Approach for Adaptation to Water Scarcity and Achieving Human Well-Being in Large Riverine Islands. Prog. Disaster Sci. 2020, 8, 100134. [Google Scholar] [CrossRef]
- Deng, Z.; Ma, Q.; Zhang, J.; Feng, Q.; Niu, Z.; Zhu, G.; Jin, X.; Chen, M.; Chen, H. A New Socio-Hydrology System Based on System Dynamics and a SWAT-MODFLOW Coupling Model for Solving Water Resource Management in Nanchang City, China. Sustainability 2023, 15, 16079. [Google Scholar] [CrossRef]
- Reeves, H.W.; Zellner, M.L. Linking MODFLOW with an Agent-Based Land-Use Model to Support Decision Making. Groundwater 2010, 48, 649–660. [Google Scholar] [CrossRef]
- Gaur, S.; Omar, P.J.; Eslamian, S. Chapter 1—Advantage of Grid-Free Analytic Element Method for Identification of Locations and Pumping Rates of Wells. In Handbook of Hydroinformatics; Eslamian, S., Eslamian, F., Eds.; Elsevier: Amsterdam, The Netherlands, 2023; pp. 1–10. ISBN 978-0-12-821962-1. [Google Scholar]
- Sterman, J. Business Dynamics: Systems Thinking and Modeling for a Complex World; Massachusetts Institute of Technology, Engineering Systems Division: Cambridge, MA, USA, 2000. [Google Scholar]
- Sterman, J. Modeling Managerial Behavior: Misperceptions of Feedback in a Dynamic Decision Making Experiment. Manag. Sci. 1989, 35, 321–339. [Google Scholar] [CrossRef]
- Doyle, J.K.; Ford, D.N. Mental Models Concepts for System Dynamics Research. Syst. Dyn. Rev. 1998, 14, 3–29. [Google Scholar] [CrossRef]
- Besnard, D.; Greathead, D.; Baxter, G. When Mental Models Go Wrong: Co-Occurrences in Dynamic, Critical Systems. Int. J. Hum.-Comput. Stud. 2004, 60, 117–128. [Google Scholar] [CrossRef][Green Version]
- Hjorth, P.; Madani, K. Systems Analysis to Promote Frames and Mental Models for Sustainable Water Management. In Proceedings of the 3rd World Sustainability Forum, Online, 1–30 November 2013; Volume 3. [Google Scholar] [CrossRef]
- Milner-Gulland, E.J. Interactions between Human Behaviour and Ecological Systems. Philos. Trans. R. Soc. B Biol. Sci. 2012, 367, 270–278. [Google Scholar] [CrossRef] [PubMed]
- Alley, W.M. Tracking U.S. Groundwater: Reserves for the Future? Environ. Sci. Policy Sustain. Dev. 2006, 48, 10–25. [Google Scholar] [CrossRef]
- Zhou, Y. A Critical Review of Groundwater Budget Myth, Safe Yield and Sustainability. J. Hydrol. 2009, 370, 207–213. [Google Scholar] [CrossRef]
- Beall King, A.; Thornton, M. Staying the Course: Collaborative Modeling to Support Adaptive and Resilient Water Resource Governance in the Inland Northwest. Water 2016, 8, 232. [Google Scholar] [CrossRef]
- Sušnik, J.; Vamvakeridou-Lyroudia, L.S.; Savić, D.A.; Kapelan, Z. Integrated System Dynamics Modelling for Water Scarcity Assessment: Case Study of the Kairouan Region. Sci. Total Environ. 2012, 440, 290–306. [Google Scholar] [CrossRef] [PubMed]
- Stave, K.A. A System Dynamics Model to Facilitate Public Understanding of Water Management Options in Las Vegas, Nevada. J. Environ. Manag. 2003, 67, 303–313. [Google Scholar] [CrossRef]
- Wang, X.; Zhang, J.; Liu, J.; Wang, G.; He, R.; Elmahdi, A.; Elsawah, S. Water Resources Planning and Management Based on System Dynamics: A Case Study of Yulin City. Environ. Dev. Sustain. 2011, 13, 331–351. [Google Scholar] [CrossRef]
- Tidwell, V.C.; Passell, H.D.; Conrad, S.H.; Thomas, R.P. System Dynamics Modeling for Community-Based Water Planning: Application to the Middle Rio Grande. Aquat. Sci. 2004, 66, 357–372. [Google Scholar] [CrossRef]
- Sahin, O.; Siems, R.S.; Stewart, R.A.; Porter, M.G. Paradigm Shift to Enhanced Water Supply Planning through Augmented Grids, Scarcity Pricing and Adaptive Factory Water: A System Dynamics Approach. Environ. Model. Softw. 2016, 75, 348–361. [Google Scholar] [CrossRef]
- Elsawah, S.; McLucas, A.; Mazanov, J. An Empirical Investigation into the Learning Effects of Management Flight Simulators: A Mental Models Approach. Eur. J. Oper. Res. 2017, 259, 262–272. [Google Scholar] [CrossRef]
- Luna-Reyes, L.F.; Andersen, D.L. Collecting and Analyzing Qualitative Data for System Dynamics: Methods and Models. Syst. Dyn. Rev. 2003, 19, 271–296. [Google Scholar] [CrossRef]
- Wolstenholme, E.F. The Definition and Application of a Stepwise Approach to Model Conceptualisation and Analysis. Eur. J. Oper. Res. 1992, 59, 123–136. [Google Scholar] [CrossRef]
- Moghadam Manesh, M.; Beall King, A. Exploring Approaches to Conceptualization in System Dynamics Modeling. In Proceedings of the International System Dynamics Conference, Boston, MA, USA, 3–7 August 2025. [Google Scholar]
- Fiddaman, T.S. A Feedback-Rich Climate-Economy Model. In Proceedings of the 16th International Conference of the Systems Dynamics Society, Quebec, QC, Canada, 20–23 July 1998. [Google Scholar]
- Fiddaman, T.S. Exploring Policy Options with a Behavioral Climate–Economy Model. Syst. Dyn. Rev. 2002, 18, 243–267. [Google Scholar] [CrossRef]
- Elmasry, A.; Größler, A. Supply Chain Modularity in System Dynamics. Syst. Dyn. Rev. 2018, 34, 462–476. [Google Scholar] [CrossRef]
- Winz, I.; Brierley, G.; Trowsdale, S. The Use of System Dynamics Simulation in Water Resources Management. Water Resour. Manag. 2009, 23, 1301–1323. [Google Scholar] [CrossRef]
- Zarghami, S.A.; Gunawan, I.; Schultmann, F. System Dynamics Modelling Process in Water Sector: A Review of Research Literature. Syst. Res. Behav. Sci. 2018, 35, 776–790. [Google Scholar] [CrossRef]
- Zomorodian, M.; Lai, S.H.; Homayounfar, M.; Ibrahim, S.; Fatemi, S.E.; El-Shafie, A. The State-of-the-Art System Dynamics Application in Integrated Water Resources Modeling. J. Environ. Manag. 2018, 227, 294–304. [Google Scholar] [CrossRef]
- Mashaly, A.F.; Fernald, A.G. Identifying Capabilities and Potentials of System Dynamics in Hydrology and Water Resources as a Promising Modeling Approach for Water Management. Water 2020, 12, 1432. [Google Scholar] [CrossRef]
- Cerecedo Arroyo, M.E.; Martínez Austria, P.F. Dynamic Water System Modeling: A Systematic Review. Water Pract. Technol. 2021, 16, 744–755. [Google Scholar] [CrossRef]
- Phan, T.D.; Bertone, E.; Stewart, R.A. Critical Review of System Dynamics Modelling Applications for Water Resources Planning and Management. Clean. Environ. Syst. 2021, 2, 100031. [Google Scholar] [CrossRef]
- Naeem, K.; Zghibi, A.; Elomri, A.; Mazzoni, A.; Triki, C. A Literature Review on System Dynamics Modeling for Sustainable Management of Water Supply and Demand. Sustainability 2023, 15, 6826. [Google Scholar] [CrossRef]
- Senge, P.M. The Fifth Discipline: The Art and Practice of the Learning Organization, 1st ed.; Doubleday/Currency: New York, NY, USA, 1990; ISBN 978-0-385-26094-7. [Google Scholar]
- Kim, D.H. Systems Archetypes I; Pegasus Communications: Cambridge, MA, USA, 1993; ISBN 978-1-883823-00-9. [Google Scholar]
- Kim, D.H. Systems Archetypes as Dynamic Theories. Syst. Think. 1995, 6, 6–9. [Google Scholar]
- Wolstenholme, E. Using Generic System Archetypes to Support Thinking and Modelling. Syst. Dyn. Rev. 2004, 20, 341–356. [Google Scholar] [CrossRef]
- Wolstenholme, E.F. Towards the Definition and Use of a Core Set of Archetypal Structures in System Dynamics. Syst. Dyn. Rev. 2003, 19, 7–26. [Google Scholar] [CrossRef]
- Kim, D.H.; Lannon, C.P. Applying Systems Archetypes; Pegasus Communications: Waltham, MA, USA, 1997; ISBN 978-1-883823-10-8. [Google Scholar]
- Kim, D.H.; Anderson, V. Systems Archetype Basics: From Story to Structure; Revised edition; Pegasus Communications, Inc.: Waltham, MA, USA, 1998; ISBN 978-1-883823-04-7. [Google Scholar]
- Goodman, M.; Kleiner, A. Using the Archetype Family Tree as a Diagnostic Tool. Syst. Think. 1993, 4, 5–6. [Google Scholar]
- Bastan, M.; Ramazani Khorshid-Doust, R.; Delshad Sisi, S.; Ahmadvand, A. Sustainable Development of Agriculture: A System Dynamics Model. Kybernets 2018, 47, 142–162. [Google Scholar] [CrossRef]
- Dudley, R. Might Continued Emphasis on Maize at the Expense of More Drought Tolerant Crops Endanger Food Security in the Horn of Africa. In Proceedings of the 29th International Conference of the System Dynamics Society, Washington, DC, USA, 24–28 July 2011. [Google Scholar]
- Molle, F.; Closas, A. Why Is State-Centered Groundwater Governance Largely Ineffective? A Review. WIREs Water 2020, 7, e1395. [Google Scholar] [CrossRef]
- Nabavi, E. Failed Policies, Falling Aquifers: Unpacking Groundwater Overabstraction in Iran. Water Altern. 2018, 11, 699–724. [Google Scholar]
- Castillo, D.; Saysel, A.K. Simulation of Common Pool Resource Field Experiments: A Behavioral Model of Collective Action. Ecol. Econ. 2005, 55, 420–436. [Google Scholar] [CrossRef]
- Figueiredo, J.; Pereira, H.M. Regime Shifts in a Socio-Ecological Model of Farmland Abandonment. Landsc. Ecol. 2011, 26, 737–749. [Google Scholar] [CrossRef]
- Schaible, G.; Aillery, M. Water Conservation in Irrigated Agriculture: Trends and Challenges in the Face of Emerging Demands. USDA-ERS Econ. Inf. Bull. 2012, 99. [Google Scholar] [CrossRef]
- Peña, S.; Fuentes, C. Modeling the Institutional Framework Governing Land Use and Water Rights in the U.S.-Mexican Border Region. In The U.S.-Mexican Border Environment: Dynamics of Human-Environmental Interactions; Sadalla, E., Ed.; SCERP Monograph Series 11; San Diego State University Press: San Diego, CA, USA, 2005. [Google Scholar]
- Maani, K.E.; Cavana, R.Y. Systems Thinking, System Dynamics; Pearson Education Canada: Toronto, ON, Canada, 2010; ISBN 978-1-877371-03-5. [Google Scholar]
- Meadows, D.H. Thinking in Systems: International Bestseller; Wright, D., Ed.; Chelsea Green: Hartford, VT, USA, 2008; ISBN 978-1-60358-055-7. [Google Scholar]
- Morecroft, J. Strategic Modelling and Business; John Wiley & Sons: Hoboken, NJ, USA, 2007; ISBN 978-0-470-01286-4. [Google Scholar]
- Ford, A. Modeling the Environment, 2nd ed.; Island Press: Washington, DC, USA, 2009; ISBN 978-1-59726-473-0. [Google Scholar]
- Bagheri, A.; Hosseini, S. A System Dynamics Approach to Assess Water Resources Development Scheme in the Mashhad Plain, Iran, versus Sustainability. In Proceedings of the 4th International Perspective on Water Resources and the Environment (IPWE), Singapore, 4–6 January 2011. [Google Scholar]
- Ghashghaie, M.; Marofi, S.; Marofi, H. Using System Dynamics Method to Determine the Effect of Water Demand Priorities on Downstream Flow. Water Resour. Manag. 2014, 28, 5055–5072. [Google Scholar] [CrossRef]
- Gohari, A.; Mirchi, A.; Madani, K. System Dynamics Evaluation of Climate Change Adaptation Strategies for Water Resources Management in Central Iran. Water Resour. Manag. 2017, 31, 1413–1434. [Google Scholar] [CrossRef]
- Zare, F.; Bagheri, A.; Elsawah, S. Using System Archetypes for Problem Framing and a Qualitative Analysis: A Case Study in Iranian Water Resource Management. In Proceedings of the 22nd International Congress on Modelling and Simulation, Hobart, TAS, Australia, 3–8 December 2017. [Google Scholar]
- Mirchi, A.; Madani, K.; Watkins, D.; Ahmad, S. Synthesis of System Dynamics Tools for Holistic Conceptualization of Water Resources Problems. Water Resour. Manag. 2012, 26, 2421–2442. [Google Scholar] [CrossRef]
- Ahmadi, M.H.; Zarghami, M. Should Water Supply for Megacities Depend on Outside Resources? A Monte-Carlo System Dynamics Simulation for Shiraz, Iran. Sustain. Cities Soc. 2019, 44, 163–170. [Google Scholar] [CrossRef]
- Ford, A.; Flynn, H. Statistical Screening of System Dynamics Models. Syst. Dyn. Rev. 2005, 21, 273–303. [Google Scholar] [CrossRef]
- Beres, D.L.; Hawkins, D.M. Plackett–Burman Technique for Sensitivity Analysis of Many-Parametered Models. Ecol. Model. 2001, 141, 171–183. [Google Scholar] [CrossRef]
- Berryman, A.A. The Orgins and Evolution of Predator-Prey Theory. Ecology 1992, 73, 1530–1535. [Google Scholar] [CrossRef]
- Takeuchi, Y.; Du, N.H.; Hieu, N.T.; Sato, K. Evolution of Predator–Prey Systems Described by a Lotka–Volterra Equation under Random Environment. J. Math. Anal. Appl. 2006, 323, 938–957. [Google Scholar] [CrossRef]
- Groesser, S.N.; Schaffernicht, M. Mental Models of Dynamic Systems: Taking Stock and Looking Ahead. Syst. Dyn. Rev. 2012, 28, 46–68. [Google Scholar] [CrossRef]
- Swart, J. A system dynamics approach to predator-prey modeling. Syst. Dyn. Rev. 1990, 6, 94–99. [Google Scholar] [CrossRef]
- Valderrama, J.M.; Ibáñez, J.; Alcalá, F.J.; Dominguez, A.; Yassin, M.; Puigdefábregas, J. The Use of a Hydrological-Economic Model to Assess Sustainability in Groundwater-Dependent Agriculture in Drylands. J. Hydrol. 2011, 402, 80–91. [Google Scholar] [CrossRef]
- Lalehzari, R.; Kerachian, R. Developing a Framework for Daily Common Pool Groundwater Allocation to Demands in Agricultural Regions. Agric. Water Manag. 2020, 241, 106278. [Google Scholar] [CrossRef]
- Müller, M.F.; Müller-Itten, M.C.; Gorelick, S.M. How Jordan and Saudi Arabia Are Avoiding a Tragedy of the Commons over Shared Groundwater. Water Resour. Res. 2017, 53, 5451–5468. [Google Scholar] [CrossRef]
- Gordon, H.S. The Economic Theory of a Common-Property Resource: The Fishery. J. Political Econ. 1954, 62, 124–142. [Google Scholar] [CrossRef]
- Hardin, G. The Tragedy of the Commons. Science 1968, 162, 1243–1248. [Google Scholar] [CrossRef]
- Duit, A.; Feindt, P.H.; Meadowcroft, J. Greening Leviathan: The Rise of the Environmental State? Environ. Politics 2016, 25, 1–23. [Google Scholar] [CrossRef]
- Ostrom, E. Collective Action and the Evolution of Social Norms. J. Econ. Perspect. 2000, 14, 137–158. [Google Scholar] [CrossRef]
- Rodden, J. Reviving Leviathan: Fiscal Federalism and the Growth of Government. Int. Organ. 2003, 57, 695–729. [Google Scholar] [CrossRef]
- Ostrom, E. Governing the Commons: The Evolution of Institutions for Collective Action; Cambridge University Press: Cambridge, UK, 1990; ISBN 978-0-521-40599-7. [Google Scholar]
- Senge, P.M. The Fifth Discipline. Meas. Bus. Excell. 1997, 1, 46–51. [Google Scholar] [CrossRef]
- Kim, D. Tragedy of the Commons: All for One and None for All. Available online: https://thesystemsthinker.com/tragedy-of-the-commons-all-for-one-and-none-for-all/ (accessed on 6 July 2025).
- Loáiciga, H.A. Analytic Game—Theoretic Approach to Ground-Water Extraction. J. Hydrol. 2004, 297, 22–33. [Google Scholar] [CrossRef]
- Anderson, J.M. A Model for “The Tragedy of the Commons”. IEEE Trans. Syst. Man Cybern. 1974, SMC-4, 103–105. [Google Scholar] [CrossRef]
- Langarudi, S.P.; Silva, C.G.; Fernald, A.G. Measure More or Report Faster? Effect of Information Perception on Management of Commons. Syst. Dyn. Rev. 2021, 37, 72–92. [Google Scholar] [CrossRef]
- Moghadam Manesh, M. Tragedy of the Commons in Groundwater Resources and Evaluating Strategies to Achieve Sustainable Development (A Case Study of Iran). Master’s Thesis, The University of Bergen, Bergen, Norway, 2019. [Google Scholar]
- Sharot, T.; Korn, C.W.; Dolan, R.J. How Unrealistic Optimism Is Maintained in the Face of Reality. Nat. Neurosci. 2011, 14, 1475–1479. [Google Scholar] [CrossRef] [PubMed]
- Molle, F.; Closas, A. Groundwater Governance: A Synthesis; The International Water Management Institute (IWMI): Colombo, Sri Lanka, 2017. [Google Scholar]
- Bitran, E.; Rivera, P.; Villena, M.J. Water Management Problems in the Copiapó Basin, Chile: Markets, Severe Scarcity and the Regulator. Water Policy 2014, 16, 844–863. [Google Scholar] [CrossRef]
- Magnuson, M.; Pruet, J.; Archuleta, R.; Murphy, L. New Mexico Water Resources: Planning and Development Report; New Mexico Office of the State Engineer: Aztec, NM, USA, 2019.
- National Research Council; Division on Earth and Life Studies; Water Science and Technology Board; Committee on USGS Water Resources Research. Estimating Water Use in the United States: A New Paradigm for the National Water-Use Information Program; National Academies Press: Washington, DC, USA, 2002; ISBN 978-0-309-08483-3.
- Farahmand, H.; Tajrishy, M.; Isaai, M.T.; Ghoreishi, M.; Mohammadi, M. Introducing the REPAIR Framework for Sustainable Environmental Restoration: Lessons from Lake Urmia, Iran. J. Arid Environ. 2025, 229, 105369. [Google Scholar] [CrossRef]
- Issahaku, G.; Abdul-Rahaman, A. Sustainable Land Management Practices, off-Farm Work Participation and Vulnerability among Farmers in Ghana: Is There a Nexus? Int. Soil Water Conserv. Res. 2019, 7, 18–26. [Google Scholar] [CrossRef]
- Jabbar, A.; Wei, L.; Zhang, J.; Liu, J.; Wang, Y.; Wu, Q.; Peng, J. Exploring the Contributions of Non-Farm Income Diversification for Improving Soil and Water Conservation Practices and Reducing Rural Poverty in Rain-Fed Areas of Punjab, Pakistan. Front. Sustain. Food Syst. 2023, 7, 1179919. [Google Scholar] [CrossRef]
- Nyathi, D. Motives and Constraints of Rural Livelihoods Diversification in Dry-Land Agrarian Settings of Matabeleland, Zimbabwe. J. Asian Afr. Stud. 2024, 00219096241257696. [Google Scholar] [CrossRef]
- Vasco, C.; Valdiviezo, R.; Hernández, H.; Tafur, V.; Eche, D.; Jácome, E. Off-Farm Employment, Forest Clearing and Natural Resource Use: Evidence from the Ecuadorian Amazon. Sustainability 2020, 12, 4515. [Google Scholar] [CrossRef]
- Figueroa-Sandoval, B.; Coronado-Minjarez, M.A.; García-Herrera, E.J.; Ramírez-López, A.; Sangerman-Jarquín, D.M.; Figueroa-Rodríguez, K.A. Production System Diversification and Livelihood in the Drylands of North Central Mexico. Sustainability 2019, 11, 2750. [Google Scholar] [CrossRef]
- Madani, K. Water Management in Iran: What Is Causing the Looming Crisis? J. Environ. Stud. Sci. 2014, 4, 315–328. [Google Scholar] [CrossRef]
- Schwartz, F.W.; Liu, G.; Yu, Z. HESS Opinions: The Myth of Groundwater Sustainability in Asia. Hydrol. Earth Syst. Sci. 2020, 24, 489–500. [Google Scholar] [CrossRef]
- Haji, L.; Momenpour, Y.; Choobchian, S. Moving toward Salvaging Iran’s Groundwater: A Psychological Analysis of Blocking Unauthorized Agricultural Wells. Agric. Water Manag. 2024, 303, 109035. [Google Scholar] [CrossRef]
- Sassani, A.; Bigdeli, B.; Saghravani, S.F. Detection of Illegal Wells Using Advanced GIS Analysis through Landsat 8 and Sentinel-2 Image Fusion in Bastam, Iran. Sci. Rep. 2025, 15, 6500. [Google Scholar] [CrossRef]
- Molle, F.; Closas, A. Groundwater Licensing and Its Challenges. Hydrogeol. J. 2020, 28, 1961–1974. [Google Scholar] [CrossRef]
- Molle, F.; López-Gunn, E.; van Steenbergen, F. The Local and National Politics of Groundwater Overexploitation. Water Altern. 2018, 11, 445–457. [Google Scholar]
- Hoogesteger, J. The Ostrich Politics of Groundwater Development and Neoliberal Regulation in Mexico. Water Altern. 2018, 11, 552–571. [Google Scholar]
- Nabavi, E. (Ground)Water Governance and Legal Development in Iran, 1906–2016. Middle East Law Gov. 2017, 9, 43–70. [Google Scholar] [CrossRef]
- Olson, M. The Logic of Collective Action: Public Goods and the Theory of Groups, With a New Preface and Appendix; Harvard University Press: Cambridge, MA, USA, 1971; ISBN 978-0-674-28327-5. [Google Scholar]
- Meinzen-Dick, R. Beyond Panaceas in Water Institutions. Proc. Natl. Acad. Sci. USA 2007, 104, 15200–15205. [Google Scholar] [CrossRef] [PubMed]
- Schlager, E.; Heikkila, T. Left High and Dry? Climate Change, Common-Pool Resource Theory, and the Adaptability of Western Water Compacts. Public Adm. Rev. 2011, 71, 461–470. [Google Scholar] [CrossRef]
- Sydow, J.; Schreyögg, G.; Koch, J. Organizational Path Dependence: Opening the Black Box. Acad. Manag. Rev. 2009, 34, 689–709. [Google Scholar]
- David, P.A. Path Dependence: A Foundational Concept for Historical Social Science. Cliometrica 2007, 1, 91–114. [Google Scholar] [CrossRef]
- Scheffer, M.; Carpenter, S.R. Catastrophic Regime Shifts in Ecosystems: Linking Theory to Observation. Trends Ecol. Evol. 2003, 18, 648–656. [Google Scholar] [CrossRef]
- Dangerman, J.; Grössler, A. No Way out? Analysing Policy Options to Alleviate or Derail Success-to-the-Successful in the Energy System. In Proceedings of the 29th International System Dynamics Conference, Washington, DC, USA, 24–28 July 2011. [Google Scholar]
- Dangerman, A.T.C.J.; Schellnhuber, H.J. Energy Systems Transformation. Proc. Natl. Acad. Sci. USA 2013, 110, E549–E558. [Google Scholar] [CrossRef] [PubMed]
- Mandl, C.E. Path Dependence: Segregation, Increasing Returns, and Success to the Successful. In Managing Complexity in Social Systems: Leverage Points for Policy and Strategy; Mandl, C.E., Ed.; Springer International Publishing: Cham, Switzerland, 2023; pp. 207–220. ISBN 978-3-031-30222-0. [Google Scholar]
- Proust, K.; Newell, B.; Brown, H.; Capon, A.; Browne, C.; Burton, A.; Dixon, J.; Mu, L.; Zarafu, M. Human Health and Climate Change: Leverage Points for Adaptation in Urban Environments. Int. J. Environ. Res. Public Health 2012, 9, 2134–2158. [Google Scholar] [CrossRef]
- Cumming, G.S. A Review of Social Dilemmas and Social-Ecological Traps in Conservation and Natural Resource Management. Conserv. Lett. 2018, 11, e12376. [Google Scholar] [CrossRef]
- Olaya, C.; Díaz Pabón, F.A.; Caicedo, S. Towards a System Dynamics Model of De Soto’s Theory on Informal Economy 2007. International System Dynamics Conference, 2007. Available online: https://proceedings.systemdynamics.org/2007/proceed/papers/OLAYA463.pdf (accessed on 25 August 2025).
- Atkinson, G.; Oleson, T. Urban Sprawl as a Path Dependent Process. J. Econ. Issues 1996, 30, 609–615. [Google Scholar] [CrossRef]
- Shirmohammadi, B.; Malekian, A.; Salajegheh, A.; Taheri, B.; Azarnivand, H.; Malek, Z.; Verburg, P.H. Scenario Analysis for Integrated Water Resources Management under Future Land Use Change in the Urmia Lake Region, Iran. Land Use Policy 2020, 90, 104299. [Google Scholar] [CrossRef]
- Annual Agricultural Statistics of West Azerbaijan Province; Ministry of Agriculture Jihad of Iran: Tehran, Iran, 2023. (In Persian)
- Dalby, S.; Moussavi, Z. Environmental Security, Geopolitics and the Case of Lake Urmia’s Disappearance. Glob. Change Peace Secur. 2017, 29, 39–55. [Google Scholar] [CrossRef]
- Mekonnen, M.M.; Hoekstra, A.Y. The Green, Blue and Grey Water Footprint of Crops and Derived Crop Products. Hydrol. Earth Syst. Sci. 2011, 15, 1577–1600. [Google Scholar] [CrossRef]
- Wang, D.; Wang, L. Soil Water Dynamics in Apple Orchards of Different Ages on the Loess Plateau of China. Vadose Zone J. 2018, 17, 1–14. [Google Scholar] [CrossRef]
- Giordano, M. Global Groundwater? Issues and Solutions. Annu. Rev. Environ. Resour. 2009, 34, 153–178. [Google Scholar] [CrossRef]
- Molle, F. Why Enough Is Never Enough: The Societal Determinants of River Basin Closure. Int. J. Water Resour. Dev. 2008, 24, 217–226. [Google Scholar] [CrossRef]
- Lawell, C.-Y.C.L. The Management of Groundwater: Irrigation Efficiency, Policy, Institutions, and Externalities. Annu. Rev. Resour. Econ. 2016, 8, 247–259. [Google Scholar] [CrossRef]
- Hrozencik, R.A. Use of Pressurized Irrigation Systems in the Western United States Roughly Doubled from 1984 to 2018. 2021. Available online: https://ers.usda.gov/data-products/charts-of-note/chart-detail?chartId=102086 (accessed on 25 August 2025).
- Alcon, F.; de Miguel, M.D.; Burton, M. Duration Analysis of Adoption of Drip Irrigation Technology in Southeastern Spain. Technol. Forecast. Soc. Change 2011, 78, 991–1001. [Google Scholar] [CrossRef]
- Ward, F.A.; Pulido-Velazquez, M. Water Conservation in Irrigation Can Increase Water Use. Proc. Natl. Acad. Sci. USA 2008, 105, 18215–18220. [Google Scholar] [CrossRef] [PubMed]
- Khazzoom, J.D. Economic Implications of Mandated Efficiency in Standards for Household Appliances. Energy J. 1980, 1, 21–40. [Google Scholar] [CrossRef]
- Sorrell, S.; Dimitropoulos, J. The Rebound Effect: Microeconomic Definitions, Limitations and Extensions. Ecol. Econ. 2008, 65, 636–649. [Google Scholar] [CrossRef]
- Berbel, J.; Gutiérrez-Martín, C.; Rodríguez-Díaz, J.A.; Camacho, E.; Montesinos, P. Literature Review on Rebound Effect of Water Saving Measures and Analysis of a Spanish Case Study. Water Resour. Manag. 2015, 29, 663–678. [Google Scholar] [CrossRef]
- Oduor, B.O.; Campo-Bescós, M.Á.; Lana-Renault, N.; Echarri, A.A.; Casalí, J. Evaluation of the Impact of Changing from Rainfed to Irrigated Agriculture in a Mediterranean Watershed in Spain. Agriculture 2023, 13, 106. [Google Scholar] [CrossRef]
- Esmaeili, A.; Shahsavari, Z. Water Allocation for Agriculture in Southwestern Iran Using a Programming Model. Appl. Water Sci. 2015, 5, 305–310. [Google Scholar] [CrossRef][Green Version]
- Turner, B.L.; Wuellner, M.; Nichols, T.; Gates, R.; Tedeschi, L.O.; Dunn, B.H. Development and Evaluation of a System Dynamics Model for Investigating Agriculturally Driven Land Transformation in the North Central United States. Nat. Resour. Model. 2016, 29, 179–228. [Google Scholar] [CrossRef]
- Turner, B.L.; Wuellner, M.; Nichols, T.; Gates, R.; Tedeschi, L.O.; Dunn, B.H. A Systems Approach to Forecast Agricultural Land Transformation and Soil Environmental Risk from Economic, Policy, and Cultural Scenarios in the North Central United States (2012–2062). Int. J. Agric. Sustain. 2017, 15, 102–123. [Google Scholar] [CrossRef]
- van Vliet, J.; de Groot, H.L.F.; Rietveld, P.; Verburg, P.H. Manifestations and Underlying Drivers of Agricultural Land Use Change in Europe. Landsc. Urban Plan. 2015, 133, 24–36. [Google Scholar] [CrossRef]
- Bren d’Amour, C.; Reitsma, F.; Baiocchi, G.; Barthel, S.; Güneralp, B.; Erb, K.-H.; Haberl, H.; Creutzig, F.; Seto, K.C. Future Urban Land Expansion and Implications for Global Croplands. Proc. Natl. Acad. Sci. USA 2017, 114, 8939–8944. [Google Scholar] [CrossRef]
- Freedgood, J.; Hunter, M.; Dempsey, J.; Sorensen, A. Farms Under Threat: The State of the States; American Farmland Trust: Washington, DC, USA, 2020. [Google Scholar]
- McNamara, L.A.; Jarratt, J.; Passell, H.D.; Kelly, S.; Malczynski, L.A.; Chermak, J.; Van Bloeman Waanders, P.; Tidwell, V.C.; Pallachula, K.; Turnley, J.G.; et al. Modeling the Transfer of Land and Water from Agricultural to Urban Uses in the Middle Rio Grande Basin, New Mexico; Sandia National Laboratories (SNL): Albuquerque, NM, USA; Livermore, CA, USA, 2004.
- Flores-Lopez, C.; Turner, B.L.; Hanagriff, R.; Bhandari, A.; Sinha, T. South Texas Water Resource Mental Models: A Systems Thinking, Multi-Stakeholder Case Study. J. Contemp. Water Res. Educ. 2022, 176, 15–35. [Google Scholar] [CrossRef]
- Baumann, M.; Kuemmerle, T.; Elbakidze, M.; Ozdogan, M.; Radeloff, V.C.; Keuler, N.S.; Prishchepov, A.V.; Kruhlov, I.; Hostert, P. Patterns and Drivers of Post-Socialist Farmland Abandonment in Western Ukraine. Land Use Policy 2011, 28, 552–562. [Google Scholar] [CrossRef]
- Lasanta, T.; Arnáez, J.; Pascual, N.; Ruiz-Flaño, P.; Errea, M.P.; Lana-Renault, N. Space–Time Process and Drivers of Land Abandonment in Europe. CATENA 2017, 149, 810–823. [Google Scholar] [CrossRef]
- Subedi, Y.R.; Kristiansen, P.; Cacho, O. Drivers and Consequences of Agricultural Land Abandonment and Its Reutilisation Pathways: A Systematic Review. Environ. Dev. 2022, 42, 100681. [Google Scholar] [CrossRef]
- Ustaoglu, E.; Collier, M.J. Farmland Abandonment in Europe: An Overview of Drivers, Consequences, and Assessment of the Sustainability Implications. Environ. Rev. 2018, 26, 396–416. [Google Scholar] [CrossRef]
- Xu, D.; Deng, X.; Guo, S.; Liu, S. Labor Migration and Farmland Abandonment in Rural China: Empirical Results and Policy Implications. J. Environ. Manag. 2019, 232, 738–750. [Google Scholar] [CrossRef]
- Hargrove, W.L.; Sheng, Z.; Granados, A.; Heyman, J.M.; Mubako, S.T. Impacts of Urbanization and Intensification of Agriculture on Transboundary Aquifers: A Case Study. J. Am. Water Resour. Assoc. 2021, 57, 170–185. [Google Scholar] [CrossRef]
- Madani, K.; Dinar, A. Non-Cooperative Institutions for Sustainable Common Pool Resource Management: Application to Groundwater. Ecol. Econ. 2012, 74, 34–45. [Google Scholar] [CrossRef]
- Tan, S.; Heerink, N.; Qu, F. Land Fragmentation and Its Driving Forces in China. Land Use Policy 2006, 23, 272–285. [Google Scholar] [CrossRef]
- Keshavarz, M.; Karami, E.; Vanclay, F. The Social Experience of Drought in Rural Iran. Land Use Policy 2013, 30, 120–129. [Google Scholar] [CrossRef]
- Karami, E.; Rezaei-Moghaddam, K. Modeling Determinants of Agricultural Production Cooperatives’ Performance in Iran. Agric. Econ. 2005, 33, 305–314. [Google Scholar] [CrossRef]
- Carey, J.M.; Zilberman, D. A Model of Investment under Uncertainty: Modern Irrigation Technology and Emerging Markets in Water. Am. J. Agric. Econ. 2002, 84, 171–183. [Google Scholar] [CrossRef]
- de Bruin, S.P.; Knoop, J.; Visser, H.; Biemans, H. Identifying Potential Clusters of Future Migration Associated with Water Stress in Africa: A Vulnerability Approach. Front. Hum. Dyn. 2022, 4, 754354. [Google Scholar] [CrossRef]
- Maleksaeidi, H.; Jalali, M.; Eskandari, F. Challenges Threatening Agricultural Sustainability in the West of Iran: Viewpoint of Agricultural Experts. Sustainability 2021, 13, 3537. [Google Scholar] [CrossRef]
- Moghadam Manesh, M.; Nabavi, E. Using System Dynamics to Scrutinize Behavioral Feedback Loops in Groundwater Management. In Proceedings of the International System Dynamics Conference, Chicago, IL, USA, 26–30 July 2021. [Google Scholar]
Disclaimer/Publisher’s Note: The statements, opinions and data contained in all publications are solely those of the individual author(s) and contributor(s) and not of MDPI and/or the editor(s). MDPI and/or the editor(s) disclaim responsibility for any injury to people or property resulting from any ideas, methods, instructions or products referred to in the content. |
© 2025 by the authors. Licensee MDPI, Basel, Switzerland. This article is an open access article distributed under the terms and conditions of the Creative Commons Attribution (CC BY) license (https://creativecommons.org/licenses/by/4.0/).