Abstract
In recent years, China’s rapid economic growth and urbanization have heightened the conflict between economic development and resource sustainability, leading to severe urban water challenges, including scarcity and environmental degradation. This study proposes a quantitative model that integrates the “Human-Water-City” (HWC) feedback mechanisms to assess and measure urban comprehensive water resources and environmental carrying capacity (CWRECC), aimed at addressing urban water sustainability challenges. The CWRECC integrates water quantity and quality dimensions following the principles of the “Cannikin Law”—selecting the lower envelope between water resources and water environment carrying capacities, which emphasizes the importance of weaknesses in enhancing the overall system. The maximum sustainable population and Gross Domestic Product (GDP) under the CWRECC constraints can be obtained using this quantitative method. A case study was conducted in Wuhan City. The results show that Wuhan has abundant water resources. From 2013 to 2020, if only considering the water quantity aspect, the water resources carrying capacity could support a population ranging from 22.63 to 61.17 million and a GDP between 1946.6 and 7988.9 billion yuan, maintaining a sustainable state throughout the period. However, when considering both water quantity and quality, the CWRECC revealed an overloaded state in 2013, 2014, 2018, and 2019, primarily attributable to significant water environmental issues. In 2013, 2014, 2018, and 2019, the quantified CWRECC could sustain populations of 9.88 million, 10.01 million, 10.33 million, and 10.57 million people, and support a GDP of 849.5 billion, 976.5 billion, 1402.9 billion, and 1538.9 billion yuan, respectively. Both the population and GDP capacities fell short of the actual recorded values for those years. The findings demonstrate that Wuhan needs to make greater efforts in water environmental protection to sustain the harmonious development within the HWC. This empirical study highlights the model’s potential to provide a scientific foundation for urban water resources management and environmental protection strategies.
1. Introduction
The continuous interaction between humans and nature has resulted in a closer coupling of human-water systems, making the human-water relationship increasingly complex. Since the initiation of reform and opening-up, China has experienced an unprecedentedly rapid urbanization process, characterized by rapid socioeconomic development, rising population density, intensified land surface sealing, and a dramatic increase in water resource exploitation. These factors have profoundly altered urban water cycles and water environments across multiple temporal and spatial scales [1,2]. Specifically, China’s population density has escalated from 103 individuals per square kilometer in 1980 to 147 people per square kilometer in 2021, while urban construction land has expanded from 672 km2 in 1981 to 56,100 in 2018. Concurrently, Gross Domestic Product (GDP) per capita has risen from 384.73 yuan in 1978 to 70,100 yuan in 2019 [3,4,5]. Driven by both human and natural systems, the coupling and feedback mechanisms among people, water, and cities have become more intricate, uncertain, and unpredictable compared to natural river basins [6,7]. As China’s economic development deepens and urbanization matures, the conflict between economic growth and water resource sustainability has intensified, exacerbating regional water scarcity [8,9]. This further leads to a series of urban water environment issues, such as black and odorous water bodies and urban non-point source pollution [10,11]. Water resource overload has emerged as a critical challenge in the urbanization process, posing a significant threat to the sustainable development of urban socio-economy [12,13,14].
Carrying capacity serves as a crucial benchmark for effectively addressing urban resource and environmental issues while guiding sustainable urban development [15]. In contemporary society, there is an urgent need to explore the sustainable state of water resource utilization through the study of carrying capacity. The initial concept of carrying capacity was defined as the ability of a carrier to support its load [16,17]. In the 1980s, the United Nations Educational, Scientific, and Cultural Organization (UNESCO) and the Food and Agriculture Organization of the United Nations (FAO) proposed the concept of “resource carrying capacity,” describing it as the population that can be sustained indefinitely at a given standard of living within a foreseeable period [18]. By the late 1980s, Shi and Qu [19] first introduced the concept of water resources carrying capacity, defining it as the maximum capacity of water resources in a specific region to support industry, agriculture, urban development, and population growth. This capacity operates within a specific stage of social history and technological development while ensuring no harm is caused to social and ecological systems. Following this, numerous scholars have offered various definitions of water resources carrying capacity. Overall, research on water resources carrying capacity addresses two primary practical challenges: the sustainable utilization of water resources and the sustainable development of the socio-economy. These issues are complex, interdisciplinary, comprehensive, and practical. Although a consensus has yet to be reached, these definitions, to some extent, reflect the fundamental essence of water resources carrying capacity. Importantly, neglecting the relationship between the carrier and the load, the assessment of carrying capacity would become superficial and inaccurate [20].
Traditional assessments of water resources carrying capacity typically involve establishing an index system based on the analysis of potential influencing factors, and calculating a carrying capacity evaluation score to determine overexploitation [21]. Cui et al. [22] evaluated the water resources carrying capacity based on set pair analysis and improved the entropy weight method. The grade values of water resources carrying results show that there were 11 cities with grade values ≥ 2.001 (overloaded status) in Anhui from 2011 to 2015. Ren et al. [23] established a comprehensive evaluation index system and employed the analytic hierarchy process (AHP) and the entropy method to evaluate Guiyang’s water resources carrying capacity. The comprehensive evaluation score of water resources carrying capacity results show an increased trend by nearly 53% from 2009 to 2018 in Guiyang City. By using the method of fuzzy comprehensive evaluation with a comprehensive evaluation matrix, Gong and Jin [21] evaluated the current situation of water resource capacity in Lanzhou and its dynamic trend. The results showed that the integrated water resources capacity score value dropped from 0.584 to 0.476 from 2005 to 2020. Wu et al. [24] employed the Soil and Water Assessment Tool (SWAT), principal component analysis (PCA), and fuzzy comprehensive evaluation (FCE) to evaluate and predict the water resources carrying capacity. From 2010 to 2015, the water resources carrying capacity (WRCC) evaluation score in the upper Heihe River Basin increased overall. Projections for 2015 to 2025 indicate gradual changes in WRCC pressure. Hu and Li [25] constructed an evaluation index system based on a pressure-state-response-support framework for assessing regional water environmental carrying status. The index results of the water environment carrying status show the temporal change trends in the study area. Although these approaches are computationally straightforward, they generally obscure the definition of carrying capacity. These approaches rely solely on mathematical statistics, and through this static analysis, only relative scores or rankings are generated to assess the temporal changes in water resources carrying capacity [26]. However, they fail to consider the dynamic coupling effects among influencing factors. Consequently, this oversight makes it impossible to accurately identify the absolute carrying capacity threshold—such as the maximum population or GDP that water resources in the city can support. Furthermore, when these methods are adopted, the selection of the index system and evaluation criteria is a subjective process, which leads to a lack of objective accuracy in the assessment of water resources carrying capacity [27].
Water resources carrying capacity fundamentally assumes a state of equilibrium between the water system and the socioeconomic system within a specific area. Therefore, a quantitative measurement of water resources carrying capacity should be grounded in a simulation that captures the internal coupling effects of the entire system [27]. As research has advanced, greater emphasis has been placed on the theoretical foundation of empirical analysis. Contemporary studies highlight the importance of incorporating feedback interactions among factors influencing water resources’ carrying capacity. Quantitative calculations of water resources carrying capacity are derived from a variety of mathematical equations or models, including the ecological footprint method [28], projection pursuit method [29], and system dynamics method [30,31]. These approaches elucidate the essence of system development, simulate the evolutionary process of systems, and investigate feedback mechanisms, resulting in some breakthroughs in understanding the interactions among factors affecting water resources’ carrying capacity. Nonetheless, due to numerous heterogeneous elements (e.g., economy, population, water resources, and water environment), spatiotemporal scale mismatches, multiple feedback loops, and parameter uncertainties, challenges still remain in the establishment of rational and quantitative equations and models for accurately assessing water resources carrying capacity [27,32].
In the context of contemporary urbanization, the development and utilization of water resources involve increasingly complex human-water relationships. Cities, as spatial carriers of human activities, are critical nodes where natural background conditions and socioeconomic elements interact [33]. However, more profound research is needed on the study of carrying capacity, which considers feedback effects among humans, water, and the city [13]. The main challenge lies in how to quantify the threshold of water resources needed for urban economic development based on the mutual feedback mechanism. Furthermore, the concepts of water resources and environmental carrying capacity encompass two essential dimensions: the sustainable utilization of water resources and the protection of the water environment. The interplay between water quantity and quality further necessitates a dual-perspective approach [33,34]. The main obstacle is how to quantify the carrying capacity under the dual constraints of sustainable water management and environmental protection [35]. Therefore, there is an urgent necessity to develop a comprehensive quantitative model for water resources and environmental carrying capacity in urban areas that integrates the feedback relationships among humans, water, and the city.
This study focuses on the city as the research area to explore the complex feedback relationships among humans, water, and the city, aiming to elucidate the multi-dimensional feedback mechanisms of water resources and environmental carrying capacity. By integrating water quantity and quality perspectives, the study develops a quantitative model for the Comprehensive Water Resources and Environmental Carrying Capacity (CWRECC) adapted to cities. This model is designed to comprehensively and precisely quantify the CWRECC. The research is expected to provide significant theoretical and practical value for promoting sustainable socioeconomic development and ensuring water resource and environmental protection.
2. Materials and Methods
2.1. Study Area
Wuhan (113.68°~115.08° E, 29.97°~31.37° N), the capital of Hubei Province in central China (Figure 1), covers a total area of 8569 km2. Wuhan features a subtropical monsoon climate characterized by abundant rainfall, ample heat, and the concurrent occurrence of rainy and warm seasons. The average annual temperature in Wuhan is around 17.3 °C, with an average annual precipitation of roughly 1240.5 mm and total annual water resources estimated at approximately 4.62 billion cubic meters. Wuhan is traversed by numerous rivers and lakes, notably featuring the convergence of the Yangtze River and the Han River in its central area. There are 166 lakes of varying sizes distributed along both banks of the rivers in the city, forming an extensive water network that furnishes abundant freshwater resources for the city. The aquatic area constitutes one quarter of the city’s total land area [36]. Wuhan is recognized as a central city within the urban agglomeration of the middle reaches of the Yangtze River in China and is regarded as one of the most promising areas for development within the Yangtze River Economic Belt [37]. The intricate water system provides substantial freshwater resources and contributes to Wuhan’s strategic advantages in population density and regional connectivity.
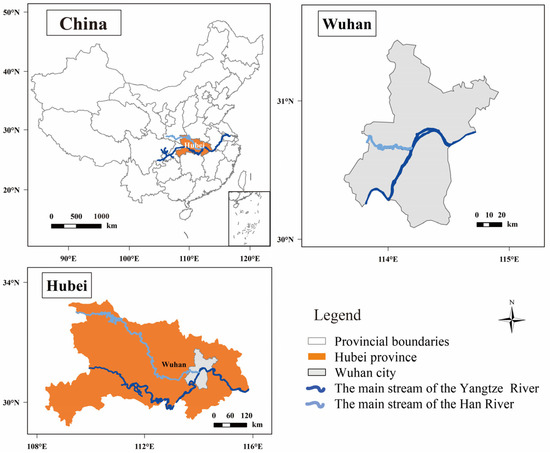
Figure 1.
Location of the study area.
Over recent decades, Wuhan has undergone rapid urbanization and substantial socioeconomic growth, driven by its strong industrial foundation and abundant labor resources [38]. By 2022, the city had achieved a GDP of 1.9 trillion yuan and a permanent population of 13.74 million, consolidating its position as a leading industrial, scientific, educational, and transportation hub in China [39]. However, the rapid socioeconomic development has intensified environmental pressures, particularly concerning water resource management and aquatic ecosystem preservation [40,41]. For instance, population growth and industrial expansion under urbanization conditions have led to a rise in sewage discharge [42]. Insufficient segregation of rainwater and sewage systems, coupled with inadequate sewage treatment facilities, has led to the degradation of water quality in natural water bodies [43,44]. Additionally, urban construction has increased the extent of impervious surfaces, encroaching on green spaces and water bodies [45].
2.2. Data Sources and Processing
The socioeconomic data of Wuhan City are sourced from the Wuhan Statistical Yearbook [46]. Data related to water resources, water consumption, pollutant discharge, external water, etc., are sourced from the Water Resources Bulletin of Wuhan City [47], Water Resources Bulletin of Hubei Province [48], Environmental Quality Bulletin of Wuhan City [49], and other related publications. The data on the available transit water volume through Wuhan City are sourced from the water extraction permit license, which is published by the Changjiang Water Resources Commission of the Ministry of Water Resources of China (http://www.cjw.gov.cn/slxz/xzxk/ (accessed on 12 January 2023)). The transit water sources include segments of the Yangtze River and Han River within Wuhan City. Rainfall-induced non-point source pollution typically originates from agricultural cultivation, rural domestic sewage, and urban surface accumulation and erosion. When rainfall occurs, pollutants are carried by runoff into surface water or groundwater, often resulting in sudden water pollution incidents. Due to the complexity of the migration and transformation processes of non-point source pollution, current research in this area is still immature. In this study, the non-point source pollution loads are estimated by the ECM model proposed by Johnes [50], which has been widely used and provides objective non-point source estimates for data-limited areas [51,52].
where Lnpoint is the non-point source pollution load; Ek is the output coefficient of the k pollution source; Ak is the quantity of the k pollution source; l is the number of pollution source types; and PI is the pollution load input by rainfall.
2.3. Research Method
2.3.1. “Human-Water-City” Feedback Framework
With the advancement of urbanization, the relationship between human activities and water systems in urban areas has become increasingly complex [53]. The transformations brought about by urbanization necessitate a new conceptual understanding of the interaction mechanisms between human society and urban water systems [54]. To more scientifically address the CWRECC issues in urban areas, a “Human-Water-City” (HWC) feedback framework is proposed by adopting a multidimensional perspective, enabling a systematic understanding of the complex feedback mechanisms among humans, water, and the city. The HWC feedback framework is characterized by the interconnectedness, mutual support, and mutual constraints among humans, water, and the city. This framework conceptualizes humans, water resources, and urban development as an integrated whole, linking population size, human well-being, sustainable water resources utilization, water environment protection, and urban economic growth. The HWC framework, as illustrated in Figure 2, comprises three core subsystems—“Human”, “Water”, and “City”, encompassing six key modules: population, human well-being, water resources, water environment, urban economy, and urban environment.
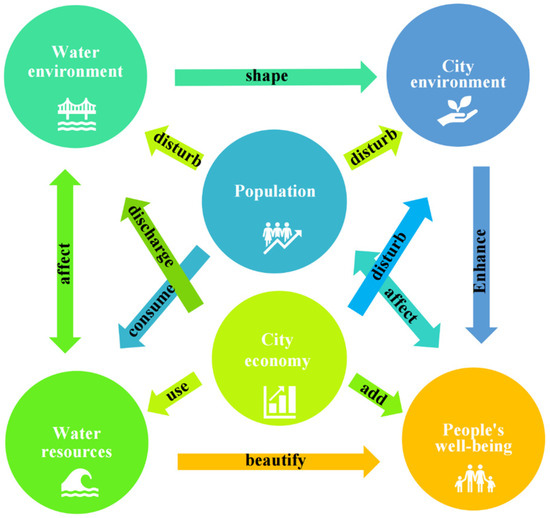
Figure 2.
The HWC framework.
Both residential activities and urban production processes involve water resource consumption and generate water pollution, thereby altering the quantity of available water resources and the quality of the natural water environment. The greater the population density and the more robust the industries, the more significant the intervention and impact on water resources and the water environment. The circulation of water resources within the city affects water pollution through dilution and degradation processes. The water environment, along with air quality and urban greening, collectively shapes the overall urban environment, which in turn affects the cityscape and the lived experiences of its residents. A favorable living environment is a fundamental aspect of human well-being, as it can alleviate stress, enhance mood, and meet the growing public demand for a healthy and aesthetically pleasing ecological environment. Conversely, environmental challenges such as poor air quality, inadequate green spaces, and polluted water bodies can have detrimental effects on human physical and mental health. Another crucial aspect influencing human well-being is the residents’ economic interests, represented in this paper by GDP per capita. As a key indicator of well-being, GDP per capita significantly impacts individual happiness and life satisfaction. Improvements in human well-being enhance a city’s attractiveness, thereby indirectly increasing the immigration rate over time.
This framework underscores the dynamic interconnected nature of the HWC and highlights the importance of balanced development across “Human”, “Water”, and “City”. Unlike other socio-hydrology systems that typically subsume all social, economic, and humanistic aspects of human activity within the human subsystem, this HWC framework distinguishes “Human” from “City”. This separation further refines the HWC feedback system, enabling a clearer understanding of their complex interdependencies. Moreover, cities, as high-density human settlements, host intensive social production and exhibit extensive and intensive water resource development/utilization. Consequently, the coupling and feedback among “Human”, “Water”, and “City” are exceptionally complex here, warranting more in-depth and detailed research. This framework focuses on urban units, providing a suitable basis for formulating and implementing subsequent adaptive measures.
2.3.2. CWRECC Based on the HWC Framework
This study develops a methodological approach for assessing the CWRECC based on the feedback mechanisms within the HWC framework. By quantifying the available water resources provided by natural systems and the water demand generated by human activities, this study evaluates the temporal evolution of water resources’ carrying capacity in Wuhan. Additionally, by calculating the permissible pollutant load from production and daily activities of residents and comparing it with the total pollutant load, this study examines the temporal evolution of the water environment carrying capacity in Wuhan. Integrating these two dimensions, the study proposes a unified CWRECC index, providing a comprehensive framework for assessing the CWRECC in Wuhan. Based on the quantitative analysis of the water quantity- quality process and its feedback mechanism within the HWC framework, this study integrates the “Cannikin Law” [55] to establish a comprehensive measurement model for CWRECC. The “Cannikin Law” principle asserts that the capacity of a system is determined by its weakest component. In this study, the “Cannikin Law” principle is applied to integrate CWRECC by selecting the minimum values between water resources and water environment carrying capacity in each year as the lower bound. This measurement model for CWRECC quantitatively determines the maximum sustainable population and GDP that can be supported under the constraints of CWRECC.
- (1)
- Analysis of Water Resources Carrying Capacity
The total available water resources, Wcapacity, consist of the local available water resources, available transit water resources, and reclaimed wastewater, as follows:
where the locally available water resources Wlocal are calculated by multiplying the surface water resources Wsurface and the groundwater resources Wground by their respective empirical coefficients [56] (or multiplying the total water resources Wsource by an empirical coefficient). The transit water resources Wtransit in this study is compiled based on relevant water extraction permits issued by the Changjiang Water Resources Commission (http://www.cjw.gov.cn/slxz/xzxk/ (accessed on 12 January 2023)). The reclaimed wastewater Wreuse is calculated by multiplying the total water use Wuse by the reuse rate rw.
Wuse represents the total volume of water allocated to end users, which is typically classified into three primary categories based on user characteristics: industrial water use, domestic water use, and ecological water use. Industrial water use is further subdivided into primary industry water use, secondary industry water use, and tertiary industry water use. Domestic water use refers to the water used in daily activities by the residents, categorized by that of urban residents and rural residents. Ecological water use denotes the volume of water supplied through artificial measures to maintain and restore ecological environments, excluding the water naturally supplied by precipitation and runoff. It includes the water for greening and cleaning, and the replenishment water for rivers, lakes, wetlands, marshes, etc.
where Windustry, Wdomestic, and Wecological represent the industrial water use, domestic water use, and ecological water use, respectively. Wprimary, Wsecondary, and Wtertiary represent the volumes of water use for the primary, secondary, and tertiary industries, respectively. WCdomestic and WRdomestic represent the volumes of domestic water use for urban residents and rural residents, respectively.
- (2)
- Analysis of Water Environment Carrying Capacity
Based on the principles of mass conservation and hydrodynamics theory, this paper proposes a method for calculating pollution loads in a city, incorporating both natural and anthropogenic factors affecting urban water pollution. The entire city is conceptualized as a water tank (Figure 3), within which pollutant sources are systematically categorized. Key sources of pollutants include emissions from industrial production and residential activities, riverine inflow pollution, non-point source pollution from rainfall-induced surface runoff, and pollution associated with water diversion projects. Additionally, the gradual reduction of pollution loads through natural degradation, wastewater treatment processes, and outflow pollution of rivers is taken into account. This paper disregards the exchange of pollutants with surrounding cities due to water diffusion and infiltration. Given the availability of socioeconomic data, the model adopts an annual time scale. The derivation process of this method is outlined as follows:
where Q is the outflow rate from the city. C is the concentration of pollutants in the outflow from the city. t is time. V is the total water resources of the city. Qi and Ci represent the flow rate and concentration of pollutants from various sources (i = 1, 2, …, n), including pollutant load from residents (including the production and daily activities of residents; the production here includes the secondary and tertiary industries), non-point source pollution, river inflow pollution, and water diversion pollution. Qj and Cj and represent the flow rate and concentration of pollutants from various pollution reduction measures (j = n + 1, n + 2, …, m), such as wastewater treatment and outflow of rivers. K is the natural degradation coefficient. This formula is applicable to degradable pollutants, and the degradation follows first-order reaction kinetics, meaning that the degradation rate is proportional to the remaining pollutant concentration.
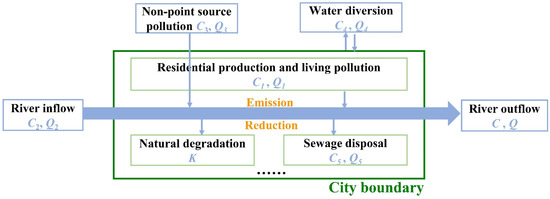
Figure 3.
Conceptual framework of the water environment in the city.
Assuming steady-state
The Formula (6) can then be transformed into the following:
Define a new index E called the water circulation period index, which can explain the efficiency of water exchange in the city.
Substitute the E into Equation (8), as follows:
The total pollutant load Lout discharged from the city over the time interval Δt is the following:
To ensure that the water quality at the local river outlet section meets specific standards issued by relevant government departments, the following conditions must be satisfied:
where Cs represents the local water quality standard limit value for the river outlet section.
Substitute Equation (12) into Equation (11), as follows:
Let
where Lmax is the maximum limit of pollutant load in the outflow; Lpoint is the pollutant load from residents (including the production and daily activities of residents; the production here includes the secondary and tertiary industries); Lsum is the pollutant load from all other sources and reduction measures excluding Lpoint.
Thus,
Therefore, the allowable pollutant load from residents (including production and daily activities of residents), Lcapacity, is the following:
Furthermore, by calculating the Lcapacity and the Lpoint at different Δt periods, the historical evolution of the local water environment carrying capacity can be analyzed through comparative analysis. In this paper, total phosphorus (TP) is selected as an example indicator of water pollutants for calculation. According to the “Surface Water Environmental Quality Standards” (GB3838-2002) [57], the classification standards of the Yangtze River section in Wuhan belong to Class III, and the Cs here must meet or exceed 2.0 × 10⁻⁴ kg/m3.
- (3)
- Comprehensive Assessment of the CWRECC
To meet the needs of balancing the supply and demand of water resources and protecting the water environment during the process of urban sustainable development, this paper proposes an integrated index from both aspects of water quantity and water quality to evaluate the CWRECC, as follows:
where IW and IL are defined as the indices of water resources carrying capacity and water environment carrying capacity, respectively, with a range of (−∞, 1). A higher index value indicates a larger carrying capacity. When the index is positive, it indicates that the corresponding water resources or water environment carrying capacity is in a sustainable state; conversely, a non-positive index indicates an overloaded state. I represents the integrated index of CWRECC, considering both aspects of water quantity and water quality, with a range of (−∞, 1). A higher I value indicates more sustainable CWRECC conditions in the city. α can be adjusted according to local development conditions or needs. In this paper, α is set to 1/2.
- (4)
- Quantitative Measurement Model of the CWRECC
Considering the interrelationship of the HWC and following the principles of the “Cannikin Law”, a quantitative model for the CWRECC is systematically constructed from two dimensions: water quantity and water quality. This model aims to obtain the maximum population and GDP that the city’s water resources and environment can sustain over the years.
First, considering the quantified process of water quantity-water quality changes and its connection with urban population and economic scale, the HWC feedback formulas involved in the CWRECC is obtained as following steps: (1) Analyze the causal relationships between variables in the HWC and collect historical data for the corresponding variables; (2) Conduct preliminary analysis on the changing patterns among the causal related variables in the HWC, select appropriate binary or multivariate regression equations which is suitable for describing their relationship; (3) fit historical data using R 4.2.2 software, estimate parameters based on the least squares method, and determine the HWC feedback formulas as follows:
- (5)
- Equations related to water resources.
- (6)
- Equations related to the aquatic environment.
Then, using the trial calculation method, the equations mentioned above are jointly solved to calculate the maximum population and GDP that can be supported by water resources carrying capacity and the water environment carrying capacity, respectively. The proportions of GDPprimary, GDPsecondary, and GDPtertiary, as well as the urbanization rate, are taken as fixed ratios based on the actual values for each year. The relationship between population and GDP is determined by the actual per capita GDP for each year. The other unknown variables are set to their actual values for each year.
Lastly, based on the principles of the “Cannikin Law”, the CWRECC is integrated by considering both water quantity and water quality dimensions. The “Cannikin Law” suggests that the amount of water a barrel can hold does not depend on the longest stave but on the shortest one. In this study, the “Cannikin Law” is applied to unify the carrying capacity of the water system. Specifically, the smaller value between the water resources carrying capacity and the water environment carrying capacity for each year is selected as the lower bound, thereby defining the CWRECC for the city. The list of all variables is shown in Table 1.

Table 1.
List of variables.
3. Results
3.1. Analysis of Water Resources Carrying Capacity in Wuhan
Figure 4 displays the annual Wsurface, Wground, and Wsource in Wuhan during 2013–2020. Wuhan boasts abundant surface water resources, which fluctuate due to factors such as rainfall. Currently, water resources development in Wuhan primarily relies on surface water, with relatively minimal exploitation of groundwater. Groundwater resources exhibit relatively stable levels throughout the year. As a result, the temporal variation in total water resources in Wuhan is predominantly influenced by changes in surface water resources. The annual average Wsource in Wuhan is 4.624 × 10⁹ m3 during 2013–2020, with an average water production modulus of 5.396 × 10⁴ m3/km2.
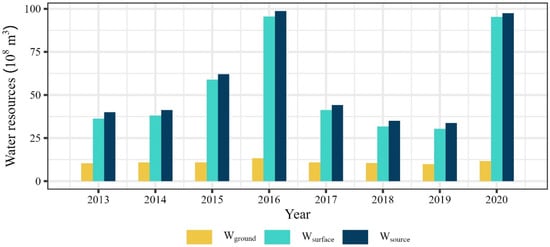
Figure 4.
Water resources in Wuhan City during 2013–2020.
The results for Wlocal, Wtransit, Wreuse, and Wcapacity in Wuhan are detailed in Figure 5. According to the data, Wlocal in the city fluctuated significantly from 2013 to 2020, with values ranging from 3.233 × 10⁹ m3 to 9.556 × 10⁹ m3. In addition to Wlocal, the Yangtze River and the Han River serve as the primary sources of freshwater for a large number of residents and various production enterprises in Wuhan, providing abundant Wtransit and playing an important role in regional economic development. In summary, Wtransit in Wuhan has remained relatively stable from 2013 to 2019. With the advancements in sewage treatment technology and the expansion of sewage treatment scale, the Wreuse in Wuhan showed an increasing trend, rising from 6.97 × 10⁸ m3 in 2013 to 8.27 × 10⁸ m3 in 2020, with a growth rate of 18.65%. During 2013–2020, the largest Wcapacity in Wuhan reached 1.562 × 10¹⁰ m3 in 2020, while the smallest was 7.987 × 10⁹ m3 in 2018. Overall, the Wcapacity in Wuhan City is mainly influenced by the fluctuation of Wlocal.
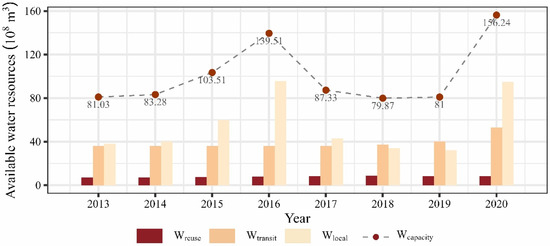
Figure 5.
Available water resources in Wuhan City during 2013–2020.
Figure 6 illustrates the annual Windustry, Wdomestic, Wecological, and Wuse in Wuhan during 2013–2020 (see Appendix A for specific values). According to the data, Windustry in Wuhan constitutes the vast majority, accounting for approximately 83% of Wuse, indicating a high demand for water resources to support industrial development in Wuhan. However, Windustry shows a declining trend, decreasing from 3.282 × 10⁹ m3 in 2013 to 2.689 × 10⁹ m3 in 2020, with a reduction of 18.07%. From 2013 to 2020, Wdomestic and Wecological in Wuhan accounted for a smaller proportion of Wuse, ranging from 13.91% to 18.93% and from 0.47% to 1.65%, respectively. Notably, both Wdomestic and Wecological demonstrated significant upward trends from 2013 to 2020, with average annual growth rates of 1.35 × 10⁷ m3/year and 4.75 × 10⁶ m3/year, respectively. The increase in Wdomestic can be attributed to the growing demand driven by the rapid expansion of the permanent resident population. Additionally, the expansion of urban areas and the increase in green areas lead to the gradual increase in Wecological in Wuhan.
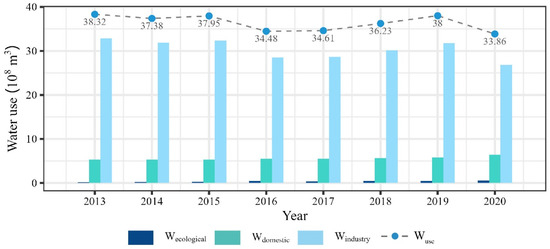
Figure 6.
Water use in Wuhan City during 2013–2020.
The evolution of Wcapacity and Wuse in Wuhan was calculated, as shown in Figure 7. The results indicate that Wcapacity consistently exceeded the Wuse each year, with the surplus ranging from 4.271 × 10⁹ m3 to 1.224 × 10¹⁰ m3. From 2013 to 2020, the average Wcapacity in Wuhan was 1.015 × 10¹⁰ m3, while the Wuse averaged 3.635 × 10⁹ m3, resulting in an average annual surplus of 6.512 × 10⁹ m3. Notably, in 2020, Wcapacity was significantly higher than Wuse, reaching 4.61 times the latter. In 2013, the difference between Wcapacity and Wuse was minimal, yet Wcapacity still exceeded Wuse, amounting to 2.11 times the Wuse. Furthermore, precipitation fluctuation greatly influences the variation of Wlocal, which in turn has a substantial impact on Wcapacity. Especially during years of abundant rainfall, such as 2016 and 2020, Wuhan experienced ample precipitation, leading to a considerable surplus of Wcapacity relative to the Wuse. Consequently, the water resources were more than sufficient to meet the demands for domestic, industrial, and ecological purposes. Overall, from 2013 to 2020, the water resources in Wuhan remained abundant, indicating a sustainable state of resource availability. From a quantitative perspective, the water resources in Wuhan are adequate to support the sustainable development of the economy and society in the city.
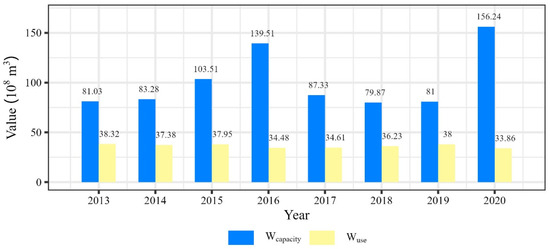
Figure 7.
Evolution of water resource carrying capacity in Wuhan.
3.2. Analysis of Water Environment Carrying Capacity in Wuhan
Table 2 summarizes the calculated allowable pollutant loads from residents in Wuhan. From 2013 to 2020, Lsum ranged from 124,657 to 174,942 tons, with an average of 142,182 tons. Notably, Lsum peaked in 2016 and 2020, reaching 148,942 tons and 174,942 tons, respectively. This could be attributed to the heavy rainfall in 2016 and 2020, resulting in significant increases in local non-point source pollution loads and river inflow pollution loads. Lmax, which is directly related to outflow discharge, is influenced by factors such as upstream water inflow, water use, and evaporation. From 2013 to 2020, the minimum Lcapacity was 5802 tons in 2013, while the maximum was 10,609 tons in 2020. From the results, it can be seen that Lcapacity is strongly influenced by the dilution factor E (E = V/Q); a higher E value facilitates greater pollutant dilution, thereby providing increased capacity to accommodate the pollutant load from residents’ production and daily activities.
Table 2.
Allowable pollutant load from residents in Wuhan City during 2013–2020.
This study collected and organized the annual Dpoint in Wuhan, and calculated the corresponding Lpoint, as shown in Figure 8. From 2013 to 2020, Lpoint in Wuhan exhibited an initial increase followed by a decline. The accelerated urbanization, continuous industrial expansion, and rapid economic growth in Wuhan led to increased pollutant generation during production processes. In addition, the rapidly increasing population resulted in a large amount of domestic sewage discharge from residents. Therefore, Lpoint gradually increased in the early period, peaking in 2018 with an average value of 7125 tons. However, with the adoption of advanced materials, equipment, processes, and technologies in industrial production, as well as the enhancement of residents’ environmental protection awareness, Lpoint demonstrated a downward trend since 2018, decreasing to 6821 tons by 2020.
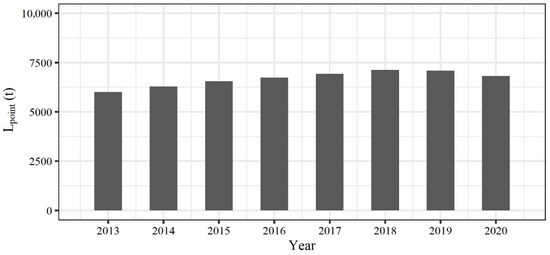
Figure 8.
Pollutant load from residents in Wuhan during 2013–2020.
The comparison and difference between the Lcapacity and the Lpoint in Wuhan during 2013–2020 are illustrated in Figure 9, reflecting temporal variations in water environment carrying capacity. As shown in Figure 9, Lcapacity exceeded Lpoint in 2015, 2016, 2017, and 2020. This indicates that the water bodies in Wuhan could accommodate pollutant load generated from residents’ production and daily activities without jeopardizing the health of the water bodies. During these years, the water environment carrying capacity was in a sustainable state. Notably, in 2016 and 2020, Lcapacity was 10,546 tons and 10,609 tons, respectively, while Lpoint was 6742 tons and 6821 tons, respectively. In 2016 and 2020, Lcapacity far exceeded the respective annual Lpoint, by 1.56 times and 1.55 times, respectively. This phenomenon may be attributed to the above-average precipitation in 2016 and 2020, which generated substantial local water resources. According to the HWC framework established in this study, the circulation of water resources within the city affects water pollution through dilution and degradation processes. Abundant water resources alter the urban water circulation, enabling timely attenuation of discharged pollutants via dilution and degradation. Consequently, the Lcapacity in 2016 and 2020 could sustain more Lpoint. However, in 2013, 2014, 2018, and 2019, the Lpoint slightly exceeded the Lcapacity, with differences of 202, 198, 486, and 404 tons, respectively, accounting for 3.48%, 3.26%, 7.32%, and 6.04% of the Lcapacity, respectively. These results indicate that the water environment carrying capacity in Wuhan was in an overloaded state in 2013, 2014, 2018, and 2019. From a perspective of water quality, the water environment in Wuhan has been incapable of supporting the sustainable development of the economy and society in the city in recent years. This phenomenon is plausibly attributable to precipitation deficits in these years that caused suboptimal replenishment of water resources, thereby reducing the water circulation period in the city. This alteration diminished the capacity for water pollutant dilution and degradation, leading to a progressive deterioration of water quality conditions. The findings highlight the limitations of existing methods, such as natural degradation and artificial sewage treatment, in addressing water pollution challenges. With advancements in technology and adjustments to environmental protection policies, there is potential for improvement in the water environment of Wuhan City. Relevant authorities should prioritize this issue and allocate sufficient attention to ensure sustainable water resource management.
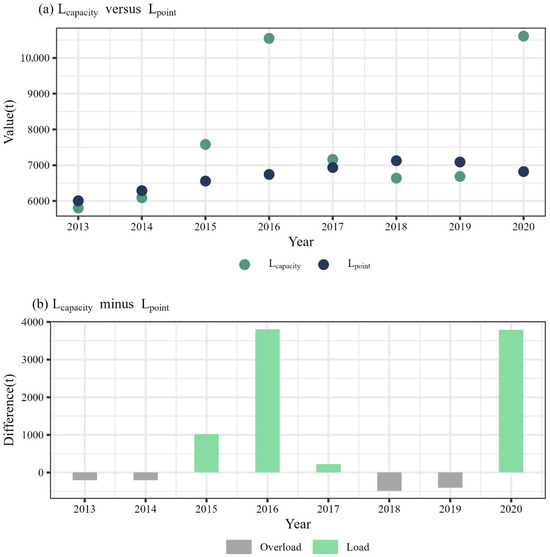
Figure 9.
The allowable pollutant load and actual pollutant load from residents in Wuhan.
3.3. Comprehensive Assessment of CWRECC in Wuhan
The calculation results of IW, IL, and I in Wuhan from 2013 to 2020 are shown in Table 3. Throughout the study period, IW remained positive, ranging from 0.53 to 0.78. This indicates that Wuhan possesses sufficient available water resources to support regional socioeconomic development and meet the needs of human production and daily activities. Given the relatively stable total water consumption, fluctuations in IW were primarily influenced by variations in total available water resources. IL exhibited fluctuations between −0.07 and 0.36 from 2013 to 2020, with negative values observed in certain years. This suggests that the water environment was in an overloaded state during those years, unable to accommodate the pollutant loads generated by human production and daily activities. If this trend persists, it may hinder the city’s long-term sustainable development.
Table 3.
Calculation results of the carrying capacity index in Wuhan.
The temporal evolution of the integrated index I in Wuhan from 2013 to 2020 is depicted in Figure 10. From a holistic perspective, considering both water quantity and water quality, the index I reached relatively high values in 2016 and 2020, at 0.56 and 0.57, respectively, indicating more favorable and sustainable carrying capacity conditions during these years. However, in 2018 and 2019, the I dropped to its lowest levels in 2018 and 2019, both recording values of 0.24. This decline is mainly attributed to reduced precipitation in Wuhan during 2018–2019, which adversely affected local water resource availability. The diminished water resources disrupted the water cycle in the city, leading to insufficient dilution and degradation of pollutants, thereby exacerbating the strain on the water environment in Wuhan.
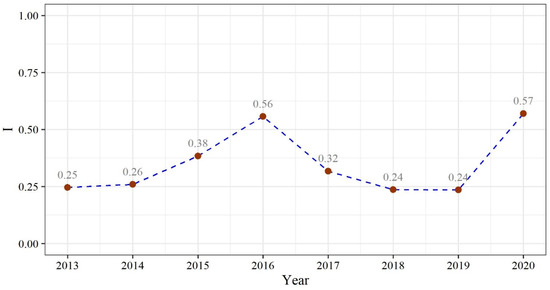
Figure 10.
Evolution of the integrated index of CWRECC in Wuhan.
3.4. Quantitative Measurement of the CWRECC in Wuhan
3.4.1. The Maximum Population That the CWRECC Could Sustain in Wuhan
Using the population as a single unknown quantity, we solve the measurement model of the CWRECC to determine the maximum population that the CWRECC could sustain in Wuhan during 2013–2020. The remaining parameters involved in the model solving process adopt real values of the corresponding years. The calculated results are presented in Figure 11.
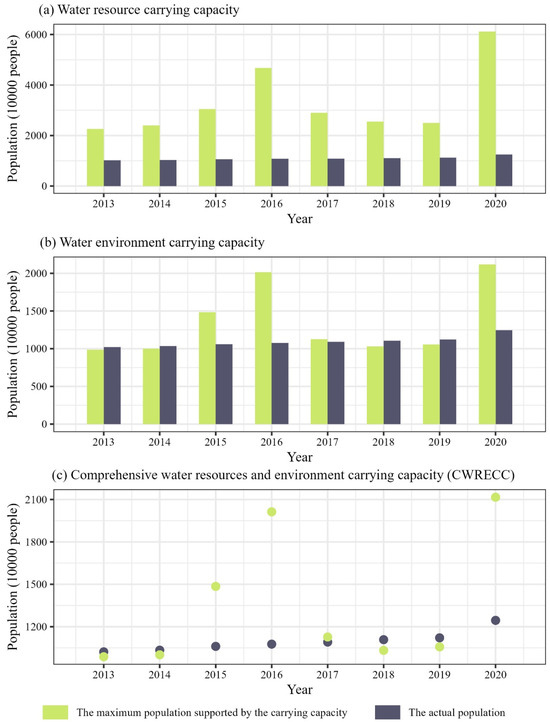
Figure 11.
The maximum population sustainable by the CWRECC and the actual population in Wuhan.
As shown in Figure 11a, the maximum population sustainable by Wuhan’s water resources carrying capacity exhibited fluctuations ranging from 22.63 to 61.17 million inhabitants during the period 2013–2020. During years characterized by abundant water resources, specifically 2016 and 2020, the water resources carrying capacity was able to sustain populations of 46.79 million and 61.17 million, respectively. The marked increase observed in 2020, compared to 2016, might be primarily attributed to a substantial augmentation in reclaimed wastewater, which consequently led to an expansion in the total available water resources in 2020. This development underscores how advances in science and technology of the city, coupled with heightened public water conservation awareness of residents, have boosted the use of reclaimed water, thereby effectively augmenting the total available water supply. During the study period, the low point of the maximum population that the water resources could sustain was observed in 2013, at 22.63 million people, which still exceeded the actual population of 10.22 million that year. The results indicate that the actual population in Wuhan from 2013 to 2020 remained within the sustainable limits of the water resources carrying capacity.
As shown in Figure 11b, the maximum population that the water environment carrying capacity could sustain in Wuhan fluctuated within the range of 9.88 to 21.16 million during 2013–2020. Specifically, the water environment carrying capacity could sustain populations of 9.88 million, 10.01 million, 10.33 million, and 10.57 million in 2013, 2014, 2018, and 2019, respectively, while the corresponding actual populations were slightly higher, at 10.22 million, 10.34 million, 11.08 million, and 11.21 million. This discrepancy indicates a slight but consistent exceedance of the water environment carrying capacity threshold during these specific years.
Taking the smaller value of the population sustainable by water resources and water environment carrying capacity in each year as the lower bound, the CWRECC was calculated for each year, as shown in Figure 11c. However, the analysis revealed substantial discrepancies between the water environment carrying capacity and the water resources carrying capacity in Wuhan. Consequently, the maximum population sustainable by the CWRECC is determined to be equivalent to that of the water environment carrying capacity, reflecting the more restrictive constraint in this urban context.
3.4.2. The Maximum GDP That the CWRECC Could Sustain in Wuhan
Using the GDP as a single unknown quantity, this study solves the measurement model of the CWRECC to obtain the maximum GDP that the CWRECC could sustain in Wuhan during 2013–2020. The remaining parameters involved in the model solving process adopt real values of the corresponding years. The calculated results are shown in Figure 12.
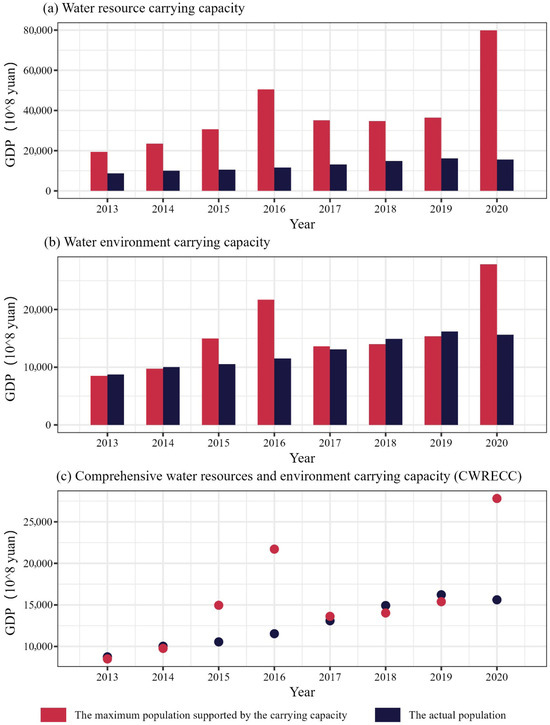
Figure 12.
The GDP sustainable by the CWRECC and the actual GDP in Wuhan.
As shown in Figure 12a, the maximum GDP sustainable by Wuhan’s water resources carrying capacity exhibited significant variability, ranging from 1946.6 billion yuan to 7988.9 billion yuan during the period 2013–2020. These sustainable thresholds substantially exceeded the actual GDP values of 1153.1 billion yuan and 1561.6 billion yuan recorded in the corresponding years. During the study period, the low point of the maximum GDP that the water resources carrying capacity can sustain was observed in 2013, at 19,466 billion yuan, which still exceeded the actual GDP of 8748 billion yuan that year. The results indicate that Wuhan’s GDP consistently remained within the sustainable limits of its water resources’ carrying capacity throughout the examined period.
As shown in Figure 12b, the maximum GDP that the water environment carrying capacity can sustain in Wuhan fluctuated within the range of 849.5 billion yuan to 2781.4 billion yuan during 2013–2020. Specifically, the water environment carrying capacity can sustain GDP of 849.5 billion yuan, 976.5 billion yuan, 1402.9 billion yuan, and 1538.9 billion yuan in 2013, 2014, 2018, and 2019, respectively, while the corresponding actual GDP was slightly higher at 874.8 billion yuan, 1002.6 billion yuan, 1492.9 billion yuan, and 1622.3 billion yuan. This consistent pattern of exceedance indicates an overloading of the water environment carrying capacity during these specific years. The empirical evidence strongly suggests that Wuhan’s economic development surpassed the sustainable thresholds of its water environment carrying capacity in 2013, 2014, 2018, and 2019, highlighting potential environmental stress points in these periods.
By establishing the smaller value of the GDP that can be sustained by water resources and water environment carrying capacity as the annual lower bound, the CWRECC in each year was calculated, as shown in Figure 12c. The analysis revealed substantial discrepancies between the water resources carrying capacity and the water environment carrying capacity in Wuhan. Consequently, the maximum sustainable GDP under the CWRECC limitation is determined to be equivalent to that of the water environment carrying capacity, reflecting its role as the more restrictive constraint in the city’s resource-environment system. This methodological approach ensures a conservative estimation of sustainable economic development thresholds, prioritizing environmental protection in urban planning considerations.
4. Conclusions
This study developed a novel method for assessing CWRECC in urban systems, grounded in the interrelationships of HWC. The core principles of this method are designed for adaptation to diverse urban contexts. Through a case study of Wuhan (2013–2020), we quantitatively analyzed the historical evolution of water resources carrying capacity by evaluating available water resources against demand, while simultaneously assessing water environment carrying capacity through comparative analysis of allowable and actual pollutant load from residents. Building on the analysis, a comprehensive index was established to evaluate the integrated carrying capacity status of water resources and the environment in Wuhan City. This index structure can be calibrated using region-specific data. Guided by the HWC feedback mechanism and the “Cannikin Law” principle, we constructed a quantitative CWRECC model that incorporates the multi-dimensional feedback relationship of CWRECC and integrates water quantity and quality dimensions. This model enables the determination of sustainable thresholds for population and GDP in Wuhan, providing a scalable approach applicable to other cities. The key conclusions are as follows:
- (1)
- The water resources carrying capacity analysis reveals that Wuhan maintained a substantial water surplus throughout the study period, with annual Wcapacity exceeding Wuse by 4.271 × 10⁹ to 1.224 × 10¹⁰ m3. This surplus indicates sufficient water resources to support sustainable urban development in Wuhan. Notably, the Wcapacity/Wuse ratio peaked at 4.61 in 2020, while maintaining a minimum ratio of 2.11 in 2013, demonstrating consistent water resource adequacy.
- (2)
- The water environment carrying capacity analysis reveals that Wuhan maintained sustainable water quality in 2015–2017, effectively accommodating pollutants from production and the daily activities of residents. However, Lpoint exceeded Lcapacity in 2013, 2014, 2018, and 2019 by 202, 198, 486, and 404 tons, respectively, representing 3.48–7.32% of Lcapacity. These findings highlight limitations in Wuhan’s current capabilities for natural degradation and artificial wastewater treatment in addressing water pollution.
- (3)
- The CWRECC assessment reveals that Wuhan’s integrated index I peaked at 0.56 and 0.57 in 2016 and 2020, respectively, indicating more sustainable carrying capacity conditions. Conversely, the index reached its lowest values of 0.24 in both 2018 and 2019, primarily due to reduced precipitation that negatively impacted local water resources. This hydrological deficit impaired the urban water cycle, resulting in inadequate dilution and reduction of pollutants.
- (4)
- The quantitative CWRECC assessment demonstrates that the water environment carrying capacity frequently serves as the limiting factor due to persistent pollution challenges. From an integrated water quantity-quality perspective, Wuhan maintained sustainable development in 2015, 2016, 2017, and 2020, with CWRECC-supported population and GDP exceeding actual values. However, overload conditions occurred in 2013, 2014, and 2018–2019, when actual population (10.22, 10.34, 11.08, and 11.21 million) and GDP (874.8, 1002.6, 1492.9, and 1622.3 billion yuan) surpassed CWRECC thresholds (population: 9.88, 10.01, 10.33, and 10.57 million; GDP: 849.5, 976.5, 1402.9, and 1538.9 billion yuan). These findings indicate periodic CWRECC overload during 2013–2014 and 2018–2019.
- (5)
- In urban areas, the interplay among “Human”, “Water”, and “City” involves multiple elements that influence each other. The relationships involved are mostly not unidirectional feedback but rather complex, interrelated, and interactive feedback loops. The study of water resources carrying capacity pursues the sustainable development of “Human”, “Water”, and “City”, and it is a complex, interdisciplinary, and highly practical research field. Previous research generally relied on indicator system methods or simple mathematical equations to evaluate the water resources carrying capacity. For instance, Wang et al. [60] used the entropy method and a synergistic theoretical model to assess water resources carrying capacity using multiple indicators. The results show that the comprehensive evaluation indicator (CEI) of Wuhan exceeded 2.0 in 2016. Yang et al. [61] employed the variable fuzzy evaluation method with seven relative evaluation indices to assess water resource carrying capacity. For Wuhan in 2020, the result was graded as level 3 as level 3. Wei et al. [62] applied 22 indicators to establish the vigor-pressure-organization-state-resilience-management (VPOSRM) evaluation index system and utilized a projection pursuit model optimized by a quantum genetic algorithm to calculate comprehensive evaluation indicators. The results demonstrated that Wuhan’s water environmental carrying capacity improved from grade IV (unhealthy) to grade III (healthy). Through the above methods, only relative scores or rankings are generated to assess the water resources carrying capacity. On the one hand, the objectivity of the indicator selection and evaluation criteria needs to be enhanced. On the other hand, the mutual feedback relationships between influencing factors are not considered, so the quantitative value of the carrying capacity (such as sustainable population or economic scale) cannot be accurately obtained. Departing from this, our study investigates the precise threshold in the city by considering the complex interplay among “Human”, “Water”, and “City”. Moreover, unlike the traditional single-perspective analysis, this study integrates both water quantity and quality aspects based on the “Cannikin Law” principle to develop a comprehensive CWRECC measurement model.
In summary, this study demonstrates a robust methodological framework capable of diagnosing CWRECC issues not only in Wuhan but also adaptable to other similar cities. This adaptability allows cities with varying water resource conditions, pollution sources, and social development stages to utilize this approach. By explicitly linking “Human”, “Water”, and “City” within a dynamic feedback structure, and integrating both water quantity and quality dimensions, this approach provides a valuable tool for urban planners and policymakers in cities grappling with complex water sustainability issues.
Author Contributions
Conceptualization, H.L. and J.X.; data curation, Y.D.; formal analysis, Y.D. and J.M.; investigation, H.L.; resources, G.W.; methodology, H.L.; validation, Y.D.; writing—original draft, H.L.; writing—reviewing and editing, J.X., G.W. and J.M. All authors have read and agreed to the published version of the manuscript.
Funding
This research was funded by the project of PowerChina Huadong Engineering Corporation Limited (No. KY2023-NGH-02-19, KY2024-ZD-04).
Data Availability Statement
The raw data supporting the conclusions of this article will be made available by the authors on request.
Conflicts of Interest
The authors declare that this study received funding from the project of PowerChina Huadong Engineering Corporation Limited. The funder was not involved in the study design, collection, analysis, interpretation of data, the writing of this article or the decision to submit it for publication. Authors H.L. and J.M. were employed by the company PowerChina Huadong Engineering Corporation Limited. Author Y.D. was employed by the company China Three Gorges Corporation. The remaining authors declare that the research was conducted in the absence of any commercial or financial relationships that could be construed as a potential conflict of interest.
Appendix A
Table A1.
Water resources in Wuhan City during 2013–2020.
Table A1.
Water resources in Wuhan City during 2013–2020.
| Year | Wsurface (108 m3) | Wground (108 m3) | Wsource (108 m3) |
|---|---|---|---|
| 2013 | 36.25 | 10.31 | 39.93 |
| 2014 | 38.07 | 10.84 | 41.23 |
| 2015 | 58.85 | 10.86 | 62.03 |
| 2016 | 95.55 | 13.31 | 98.73 |
| 2017 | 41.22 | 10.97 | 44.18 |
| 2018 | 31.75 | 10.54 | 34.96 |
| 2019 | 30.34 | 9.73 | 33.75 |
| 2020 | 95.37 | 11.67 | 97.48 |
Table A2.
Available water resources in Wuhan City during 2013–2020.
Table A2.
Available water resources in Wuhan City during 2013–2020.
| Year | Wlocal (108 m3) | Wtransit (108 m3) | Wreuse (108 m3) | Wcapacity (108 m3) |
|---|---|---|---|---|
| 2013 | 38.15 | 35.90 | 6.97 | 81.03 |
| 2014 | 40.07 | 35.90 | 7.31 | 83.28 |
| 2015 | 59.82 | 35.90 | 7.79 | 103.51 |
| 2016 | 95.56 | 35.90 | 8.04 | 139.51 |
| 2017 | 43.11 | 35.90 | 8.32 | 87.33 |
| 2018 | 33.96 | 37.32 | 8.59 | 79.87 |
| 2019 | 32.33 | 40.26 | 8.42 | 81.00 |
| 2020 | 94.80 | 53.17 | 8.27 | 156.24 |
Table A3.
Water use in Wuhan City during 2013–2020.
Table A3.
Water use in Wuhan City during 2013–2020.
| Year | Windustry (108 m3) | Wdomestic (108 m3) | Wecological (108 m3) | Wuse (108 m3) |
|---|---|---|---|---|
| 2013 | 32.82 | 5.33 | 0.18 | 38.32 |
| 2014 | 31.86 | 5.31 | 0.21 | 37.38 |
| 2015 | 32.35 | 5.34 | 0.25 | 37.95 |
| 2016 | 28.56 | 5.51 | 0.41 | 34.48 |
| 2017 | 28.66 | 5.56 | 0.39 | 34.61 |
| 2018 | 30.12 | 5.67 | 0.44 | 36.23 |
| 2019 | 31.75 | 5.74 | 0.51 | 38.00 |
| 2020 | 26.89 | 6.41 | 0.56 | 33.86 |
References
- Bao, C.; Fang, C. Water Resources Flows Related to Urbanization in China: Challenges and Perspectives for Water Management and Urban Development. Water Resour. Manag. 2012, 26, 531–552. [Google Scholar] [CrossRef]
- Yu, H.; Song, Y.; Chang, X.; Gao, H.; Peng, J. A Scheme for a Sustainable Urban Water Environmental System During the Urbanization Process in China. Engineering 2018, 4, 190–193. [Google Scholar] [CrossRef]
- Chen, M.; Liu, W.; Tao, X. Evolution and Assessment on China’s Urbanization 1960–2010: Under-Urbanization or over-Urbanization? Habitat Int. 2013, 38, 25–33. [Google Scholar] [CrossRef]
- Liang, L.; Chen, M.; Lu, D. Revisiting the Relationship Between Urbanization and Economic Development in China Since the Reform and Opening-Up. Chin. Geogr. Sci. 2022, 32, 1–15. [Google Scholar] [CrossRef]
- National Bureau of Statistics of China. China Statistical Yearbook 2021; China Statistics Press: Beijing, China, 2021. (In Chinese) [Google Scholar]
- Hale, R.L.; Armstrong, A.; Baker, M.A.; Bedingfield, S.; Betts, D.; Buahin, C.; Buchert, M.; Crowl, T.; Dupont, R.R.; Ehleringer, J.R.; et al. iSAW: Integrating Structure, Actors, and Water to Study Socio-Hydro-Ecological Systems. Earth’s Future 2015, 3, 110–132. [Google Scholar] [CrossRef]
- Liu, J.; Dietz, T.; Carpenter, S.R.; Alberti, M.; Folke, C.; Moran, E.; Pell, A.N.; Deadman, P.; Kratz, T.; Lubchenco, J.; et al. Complexity of Coupled Human and Natural Systems. Science 2007, 317, 1513–1516. [Google Scholar] [CrossRef]
- Chen, X.; Li, F.; Li, X.; Hu, Y.; Hu, P. Evaluating and Mapping Water Supply and Demand for Sustainable Urban Ecosystem Management in Shenzhen, China. J. Clean. Prod. 2020, 251, 119754. [Google Scholar] [CrossRef]
- Wang, Y. Urban Land and Sustainable Resource Use: Unpacking the Countervailing Effects of Urbanization on Water Use in China, 1990–2014. Land Use Policy 2020, 90, 104307. [Google Scholar] [CrossRef]
- Miller, J.D.; Hutchins, M. The Impacts of Urbanisation and Climate Change on Urban Flooding and Urban Water Quality: A Review of the Evidence Concerning the United Kingdom. J. Hydrol. Reg. Stud. 2017, 12, 345–362. [Google Scholar] [CrossRef]
- Han, D.; Currell, M.J.; Cao, G. Deep Challenges for China’s War on Water Pollution. Environ. Pollut. 2016, 218, 1222–1233. [Google Scholar] [CrossRef]
- Bu, J.; Li, C.; Wang, X.; Zhang, Y.; Yang, Z. Assessment and Prediction of the Water Ecological Carrying Capacity in Changzhou City, China. J. Clean. Prod. 2020, 277, 123988. [Google Scholar] [CrossRef]
- Zhou, X.-Y.; Zheng, B.; Khu, S.-T. Simulation Platform of Human-Environment Systems for Water Environment Carrying Capacity Research. J. Clean. Prod. 2020, 250, 119577. [Google Scholar] [CrossRef]
- Liao, X.; Ren, Y.; Shen, L.; Shu, T.; He, H.; Wang, J. A “Carrier-Load” Perspective Method for Investigating Regional Water Resource Carrying Capacity. J. Clean. Prod. 2020, 269, 122043. [Google Scholar] [CrossRef]
- Wei, Y.; Huang, C.; Lam, P.T.I.; Yuan, Z. Sustainable Urban Development: A Review on Urban Carrying Capacity Assessment. Habitat Int. 2015, 46, 64–71. [Google Scholar] [CrossRef]
- Zhu, M.; Shen, L.; Tam, V.W.Y.; Liu, Z.; Shu, T.; Luo, W. A Load-Carrier Perspective Examination on the Change of Ecological Environment Carrying Capacity during Urbanization Process in China. Sci. Total Environ. 2020, 714, 136843. [Google Scholar] [CrossRef] [PubMed]
- Zhang, F.; Wang, Y.; Ma, X.; Wang, Y.; Yang, G.; Zhu, L. Evaluation of Resources and Environmental Carrying Capacity of 36 Large Cities in China Based on a Support-Pressure Coupling Mechanism. Sci. Total Environ. 2019, 688, 838–854. [Google Scholar] [CrossRef]
- UNESCO; FAO. Carrying Capacity Assessment: A Resource Accounting Methodology for Assessing the Sustainability of National Economies in the Context of Population, Resources, Environment and Development; UNESCO; FAO: Rome, Italy, 1985. [Google Scholar]
- Shi, Y.; Qu, Y. The Carrying Capacity of Water Resources and Its Reasonable Use of Urumqi River; Science Press: Beijing, China, 1992. (In Chinese) [Google Scholar]
- Liu, H.; Xia, J.; Zou, L.; Huo, R. Comprehensive Quantitative Evaluation of the Water Resource Carrying Capacity in Wuhan City Based on the “Human–Water–City” Framework: Past, Present and Future. J. Clean. Prod. 2022, 366, 132847. [Google Scholar] [CrossRef]
- Gong, L.; Jin, C. Fuzzy Comprehensive Evaluation for Carrying Capacity of Regional Water Resources. Water Resour. Manag. 2009, 23, 2505–2513. [Google Scholar] [CrossRef]
- Cui, Y.; Feng, P.; Jin, J.; Liu, L. Water Resources Carrying Capacity Evaluation and Diagnosis Based on Set Pair Analysis and Improved the Entropy Weight Method. Entropy 2018, 20, 359. [Google Scholar] [CrossRef]
- Ren, L.; Gao, J.; Song, S.; Li, Z.; Ni, J. Evaluation of Water Resources Carrying Capacity in Guiyang City. Water 2021, 13, 2155. [Google Scholar] [CrossRef]
- Wu, L.; Su, X.; Ma, X.; Kang, Y.; Jiang, Y. Integrated Modeling Framework for Evaluating and Predicting the Water Resources Carrying Capacity in a Continental River Basin of Northwest China. J. Clean. Prod. 2018, 204, 366–379. [Google Scholar] [CrossRef]
- Hu, A.; Li, Q. A Pressure-State-Response-Support Framework for Assessing Regional Water Environmental Carrying Status. Front. Environ. Sci. 2022, 10, 1023180. [Google Scholar] [CrossRef]
- Wang, G.; Xiao, C.; Qi, Z.; Meng, F.; Liang, X. Development Tendency Analysis for the Water Resource Carrying Capacity Based on System Dynamics Model and the Improved Fuzzy Comprehensive Evaluation Method in the Changchun City, China. Ecol. Indic. 2021, 122, 107232. [Google Scholar] [CrossRef]
- Yang, J.; Lei, K.; Khu, S.; Meng, W. Assessment of Water Resources Carrying Capacity for Sustainable Development Based on a System Dynamics Model: A Case Study of Tieling City, China. Water Resour. Manag. 2015, 29, 885–899. [Google Scholar] [CrossRef]
- Sun, S.; Fang, C.; Lv, J. Spatial Inequality of Water Footprint in China: A Detailed Decomposition of Inequality from Water Use Types and Drivers. J. Hydrol. 2017, 553, 398–407. [Google Scholar] [CrossRef]
- Jia, Z.; Cai, Y.; Chen, Y.; Zeng, W. Regionalization of Water Environmental Carrying Capacity for Supporting the Sustainable Water Resources Management and Development in China. Resour. Conserv. Recycl. 2018, 134, 282–293. [Google Scholar] [CrossRef]
- Hu, G.; Zeng, W.; Yao, R.; Xie, Y.; Liang, S. An Integrated Assessment System for the Carrying Capacity of the Water Environment Based on System Dynamics. J. Environ. Manag. 2021, 295, 113045. [Google Scholar] [CrossRef]
- Wang, Y.; Zhou, X.; Engel, B. Water Environment Carrying Capacity in Bosten Lake Basin. J. Clean. Prod. 2018, 199, 574–583. [Google Scholar] [CrossRef]
- Wei, S.; Yang, H.; Song, J.; Abbaspour, K.C.; Xu, Z. System Dynamics Simulation Model for Assessing Socio-Economic Impacts of Different Levels of Environmental Flow Allocation in the Weihe River Basin, China. Eur. J. Oper. Res. 2012, 221, 248–262. [Google Scholar] [CrossRef]
- Yang, Q.; Wang, H.; Mu, H.; Luo, J.; Bao, X.; Bian, J.; Delgado Martín, J. Risk Assessment of Water Resources and Environmental Carrying Capacity in Yinchuan City. Hum. Ecol. Risk Assess. An. Int. J. 2019, 25, 120–131. [Google Scholar] [CrossRef]
- Zhou, F.; Zhang, W.; Jiang, A.; Peng, H.; Li, L.; Deng, L.; Sun, Y.; Wang, H. Spatial-Temporal Variation Characteristics and Coupling Coordination of the “Water Resources—Water Environment—Water Ecology” Carrying Capacity in the Three Gorges Reservoir Area. Ecol. Indic. 2023, 154, 110874. [Google Scholar] [CrossRef]
- Zhou, X.-Y.; Zheng, B.; Khu, S.-T. Validation of the Hypothesis on Carrying Capacity Limits Using the Water Environment Carrying Capacity. Sci. Total Environ. 2019, 665, 774–784. [Google Scholar] [CrossRef]
- Deng, R.; Chu, Z. Path of Wuhan City Implementing Strategy of City of Strong Talent Pool in 14th Five-Year Plan Period from Perspective of Push and Pull Theory. J. Jianghan Univ. (Soc. Sci. Ed.) 2023, 40, 93. (In Chinese) [Google Scholar] [CrossRef]
- Li, J.; Wen, Y. Study on coordinate development between population urbanization and land urbanization in Wuhan. J. Cent. China Norm. Univ. 2018, 52, 108–114. (In Chinese) [Google Scholar] [CrossRef]
- Wang, Y.; Li, X.; Zhang, F.; Wang, W.; Xiao, R. Effects of Rapid Urbanization on Ecological Functional Vulnerability of the Land System in Wuhan, China: A Flow and Stock Perspective. J. Clean. Prod. 2020, 248, 119284. [Google Scholar] [CrossRef]
- Wuhan Municipal Bureau of Statistics. Wuhan Statistical Yearbook; Wuhan Municipal Bureau of Statistics: Wuhan, China, 2022. (In Chinese) [Google Scholar]
- Song, F.; Yang, X.; Wu, F. Catastrophe Progression Method Based on M-K Test and Correlation Analysis for Assessing Water Resources Carrying Capacity in Hubei Province. J. Water Clim. Chang. 2018, 11, 556–567. [Google Scholar] [CrossRef]
- Wen, C.; Zhan, Q.; Zhan, D.; Zhao, H.; Yang, C. Spatiotemporal Evolution of Lakes under Rapid Urbanization: A Case Study in Wuhan, China. Water 2021, 13, 1171. [Google Scholar] [CrossRef]
- Dey, J.; Vijay, R. Geospatial Assessment of Seasonal Water Quality of Malad Creek, Mumbai, India: An Impact of Sewage Discharge. Ind. J. GEO-Mar. Sci. 2022, 51, 811–821. [Google Scholar] [CrossRef]
- Ociepa, E.; Kisiel, A.; Lach, J. Protection of Surface Waters from the Discharge of Rain-Water Sewage from Sewage System. Soc. Ecol. Chem. Engn. 2009, 3, 115–120. [Google Scholar]
- Tian, J.; Ji, J.; Liu, Z.; Huang, J.; Xue, W. Effect Evaluation of Decentralized Domestic Sewage Treatment Facilities in Rural Areas—A Case Study of Nantong City, China. Water Sci. Technol. 2023, 88, 711–722. [Google Scholar] [CrossRef]
- Dams, J.; Dujardin, J.; Reggers, R.; Bashir, I.; Canters, F.; Batelaan, O. Mapping Impervious Surface Change from Remote Sensing for Hydrological Modeling. J. Hydrol. 2013, 485, 84–95. [Google Scholar] [CrossRef]
- Wuhan Municipal Bureau of Statistics. Wuhan Statistical Yearbook 2013–2020; Wuhan Municipal Bureau of Statistics: Wuhan, China, 2021. (In Chinese) [Google Scholar]
- Wuhan Municipal Water Authority. Water Resources Bulletin of Wuhan City 2013–2020; Wuhan Municipal Water Authority: Wuhan, China, 2021. (In Chinese) [Google Scholar]
- Hubei Provincial Department of Water Resources. Water Resources Bulletin of Hubei Province 2013–2020; Hubei Provincial Department of Water Resources: Wuhan, China, 2021. (In Chinese) [Google Scholar]
- Wuhan Municipal Ecology and Environment Bureau. Environmental Quality Bulletin of Wuhan City 2013–2020; Wuhan Municipal Ecology and Environment Bureau: Wuhan, China, 2021. (In Chinese) [Google Scholar]
- Johnes, P.J. Evaluation and Management of the Impact of Land Use Change on the Nitrogen and Phosphorus Load Delivered to Surface Waters: The Export Coefficient Modelling Approach. J. Hydrol. 1996, 183, 323–349. [Google Scholar] [CrossRef]
- Xia, B.; Li, S.; Mei, Z.; Shen, W.; Mi, M.; Qiang, Z.; Zhang, L. Identifying Critical Riparian Zones for Eco-Environmental Management of the Yangtze River through Pollution Mapping. J. Environ. Manag. 2025, 376, 124555. [Google Scholar] [CrossRef]
- Xue, Y.; Kong, X.; Mao, Z.; Zhang, C.; Xue, B.; Shi, X.; Gu, X. Hydrological Variation Drives Changes in Food Web Structure and Ecosystem Function with Potential Hysteresis in a Large Temperate Shallow Lake. J. Hydrol. 2025, 650, 132463. [Google Scholar] [CrossRef]
- Breyer, B.; Zipper, S.; Qiu, J. Sociohydrological Impacts of Water Conservation Under Anthropogenic Drought in Austin, TX (USA). Water Resour. Res. 2018, 54, 3062–3080. [Google Scholar] [CrossRef]
- Xia, J.; Zhang, Y.; She, D.; Zhang, S.; Yang, J.; Lv, M.; Zhang, X.; Luo, A.; Wu, S.; Liu, Y. Urban Water System Theory and Its Model Development and Application. Sci. China Earth Sci. 2024, 67, 704–724. [Google Scholar] [CrossRef]
- Liu, Z.; Zhang, H. Interpretation of cannikin law in human resource management. J. Nanning Teach. Coll. 2009, 67, 11. [Google Scholar]
- Wei, F.; Zhang, X.; Xu, J.; Bing, J.; Pan, G. Simulation of Water Resource Allocation for Sustainable Urban Development: An Integrated Optimization Approach. J. Clean. Prod. 2020, 273, 122537. [Google Scholar] [CrossRef]
- GB3838-2002; Surface Water Environmental Quality Standards. Ministry of Ecology and Environment of the People’s Republic of China: Beijing, China, 2002. (In Chinese)
- GB_T 31962-2015; Water Quality Standards for Urban Sewage Discharge. Ministry of Housing and Urban-Rural Development of the People’s Republic of China: Beijing, China, 2015. (In Chinese)
- GB 18918-2002; Pollutant Discharge Standards for Urban Sewage Treatment Plants. Ministry of Ecology and Environment of the People’s Republic of China: Beijing, China, 2002. (In Chinese)
- Wang, Y.; Cheng, H.; Huang, L. Water Resources Carrying Capacity Evaluation of a Dense City Group: A Comprehensive Water Resources Carrying Capacity Evaluation Model of Wuhan Urban Agglomeration. Urban Water J. 2018, 15, 615–625. [Google Scholar] [CrossRef]
- Yang, J.; Yang, P.; Zhang, S.; Wang, W.; Cai, W.; Hu, S. Evaluation of Water Resource Carrying Capacity in the Middle Reaches of the Yangtze River Basin Using the Variable Fuzzy-Based Method. Environ. Sci. Pollut. Res. 2023, 30, 30572–30587. [Google Scholar] [CrossRef]
- Wei, X.; Wang, J.; Wu, S.; Xin, X.; Wang, Z.; Liu, W. Comprehensive Evaluation Model for Water Environment Carrying Capacity Based on VPOSRM Framework: A Case Study in Wuhan, China. Sustain. Cities Soc. 2019, 50, 101640. [Google Scholar] [CrossRef]


Disclaimer/Publisher’s Note: The statements, opinions and data contained in all publications are solely those of the individual author(s) and contributor(s) and not of MDPI and/or the editor(s). MDPI and/or the editor(s) disclaim responsibility for any injury to people or property resulting from any ideas, methods, instructions or products referred to in the content. |
© 2025 by the authors. Licensee MDPI, Basel, Switzerland. This article is an open access article distributed under the terms and conditions of the Creative Commons Attribution (CC BY) license (https://creativecommons.org/licenses/by/4.0/).