Article

A Practical Model Framework for Describing the Flow of Nitrogen and Phosphorus in a Cascade Reservoir Watershed

1
Tianjin Eco-Environmental Monitoring Center, Tianjin 300191, China
2
National Engineering Laboratory for Port Hydraulic Construction Technology, Key Laboratory of Engineering Sediment, Tianjin Research Institute for Water Transport Engineering, Ministry of Transport, Tianjin 300456, China
*
Author to whom correspondence should be addressed.
Water 2025, 17(16), 2479; https://doi.org/10.3390/w17162479
Submission received: 4 July 2025 / Revised: 18 August 2025 / Accepted: 19 August 2025 / Published: 20 August 2025
(This article belongs to the Section Hydraulics and Hydrodynamics)

Abstract

The construction of cascade reservoir systems (CRSs) is increasing globally, providing reliable energy and water resources for human social development, while also having significant impacts on the watershed water environment, particularly in terms of nitrogen and phosphorus distribution in the rivers and lakes of these areas. Watershed management authorities urgently need model tools that can comprehensively analyze the sources of nitrogen and phosphorus in CRSs and the nitrogen and phosphorus cycling in lakes and reservoirs. Therefore, this study establishes a model framework that includes a watershed nutrient load model and a hierarchical reservoir nutrient cycling model, validating and analyzing this framework in the Water Diversion Basin from the Luanhe River to Tianjin (WDBLT) in North China, which yields nitrogen and phosphorus substance flows over different time scales. The conclusions show that banning cage culture and curbing point sources improved reservoir water quality, and the internal TP flux serves as a key environmental indicator. This model framework is scientifically sound, easy to operate, and does not require high data demands, demonstrating high practical value for similar water environmental management in CRS.

1. Introduction

The cascade reservoir system (CRS) refers to a series of hydraulic structures, natural environments, and water distribution patterns that facilitate the temporal and spatial allocation of water resources [1,2,3]. This system effectively addresses the uneven distribution of water resources in their natural state, allowing surplus water from resource-rich areas to be redistributed, thereby ensuring a reliable water supply for regions experiencing scarcity. The CRS serves as a dependable source of water for humanity, aligning the supply of water resources with the rhythm of social development and supporting the healthy growth of both the economy and society [4,5,6].
Simultaneously, the CRS impedes the flow of essential nutrients, including carbon, phosphorus, and nitrogen, along river networks, which impacts nutrient transformation and elimination processes [7,8]. Furthermore, due to the sedimentation effects of reservoirs, the retention capacity of terrestrial freshwater systems for nutrients has increased, subsequently impacting both terrestrial and coastal environments downstream [9,10,11,12,13].
To investigate the spatio-temporal distribution and migration of nitrogen and phosphorus influenced by the CRS, researchers have developed and applied several watershed-scale water quality models, such as SWAT [8,14], ReNuMa [5,15], and SPARROW [16,17,18]. However, these models typically treat lakes and reservoirs as one-dimensional linear storage units, focusing solely on the one-dimensional attenuation of elements like nitrogen and phosphorus within these water bodies [8,15,18]. When the water volume of lakes and reservoirs is relatively small compared to the total water volume of the watershed, their impact on the distribution of nitrogen and phosphorus is minimal. In such cases, this simplified framework for lake models does not yield significant deviations in the computed results. However, the water volume of CRS is substantial in many typical watersheds, and their influence on the distribution of nitrogen and phosphorus is non-linear. Therefore, analyzing nitrogen and phosphorus distribution solely through watershed water quality models may introduce significant uncertainties [19,20,21].
In contrast to the simplified lake water quality modules included in existing watershed models, more complex models have been developed specifically for hydrological and water quality simulations in lakes. For instance, models such as LAKE2K [22,23], CE-QUAL-W2 [24], EFDC [25], and MIKE series models [26,27] provide detailed descriptions of hydrodynamic and aquatic ecological processes, allowing for more accurate simulations of the biogeochemical processes of nitrogen and phosphorus in lakes. However, these models require extensive data types and quantities, and some lack calibration parameters, which limits their integration with watershed water quality models in environmental management.
In summary, selecting appropriate watershed and lake water quality models to establish a coupled framework is an effective strategy for studying nitrogen and phosphorus distribution in cascade reservoir watersheds (CRWs) [13,20]. For effective water environment management, the complexity and data requirements of the watershed nutrient load model and reservoir water quality models included in the model framework should be comparable, which ensures that simulation errors are evenly distributed among various modules, enhancing parameter sensitivity and model robustness [8,19,28,29]. Given that long-time cycles associated with pollutant migration and transformation in watersheds span years to decades, it is crucial to consider the compatibility of data scale and frequency across different periods when establishing watershed models to maintain temporal continuity. Typically, monthly frequency water quality data can ensure data continuity over extended periods (decades) for most rivers and lakes [30,31,32]. Therefore, most current watershed water quality models are developed based on monthly scale data, indicating that selecting lake models that align with this monthly scale may be optimal for establishing the watershed water quality model framework for cascade reservoirs.
Considering compatibility, data availability, and model complexity, this study aims to select the ReNuMa model and an Improved Hierarchical Bayesian Lake Model (IHBLM) to construct the watershed water quality model framework for CRWs [33,34]. By using nitrogen and phosphorus as characteristic indicators, the study will verify the scientific validity and practicality of this model framework. Establishing this framework will enable the simulation of nitrogen and phosphorus transport processes in CRWs, facilitating the analysis of their spatio-temporal distribution and trends, and allowing predictions regarding the effectiveness of relevant environmental management policies. This model framework is relatively simple, has low data requirements, offers high flexibility, and demonstrates good applicability for management purposes. The schematic diagram of a CRS and the reservoir biochemical cycle is shown in Figure 1.

2. Materials and Methods

2.1. Study Area

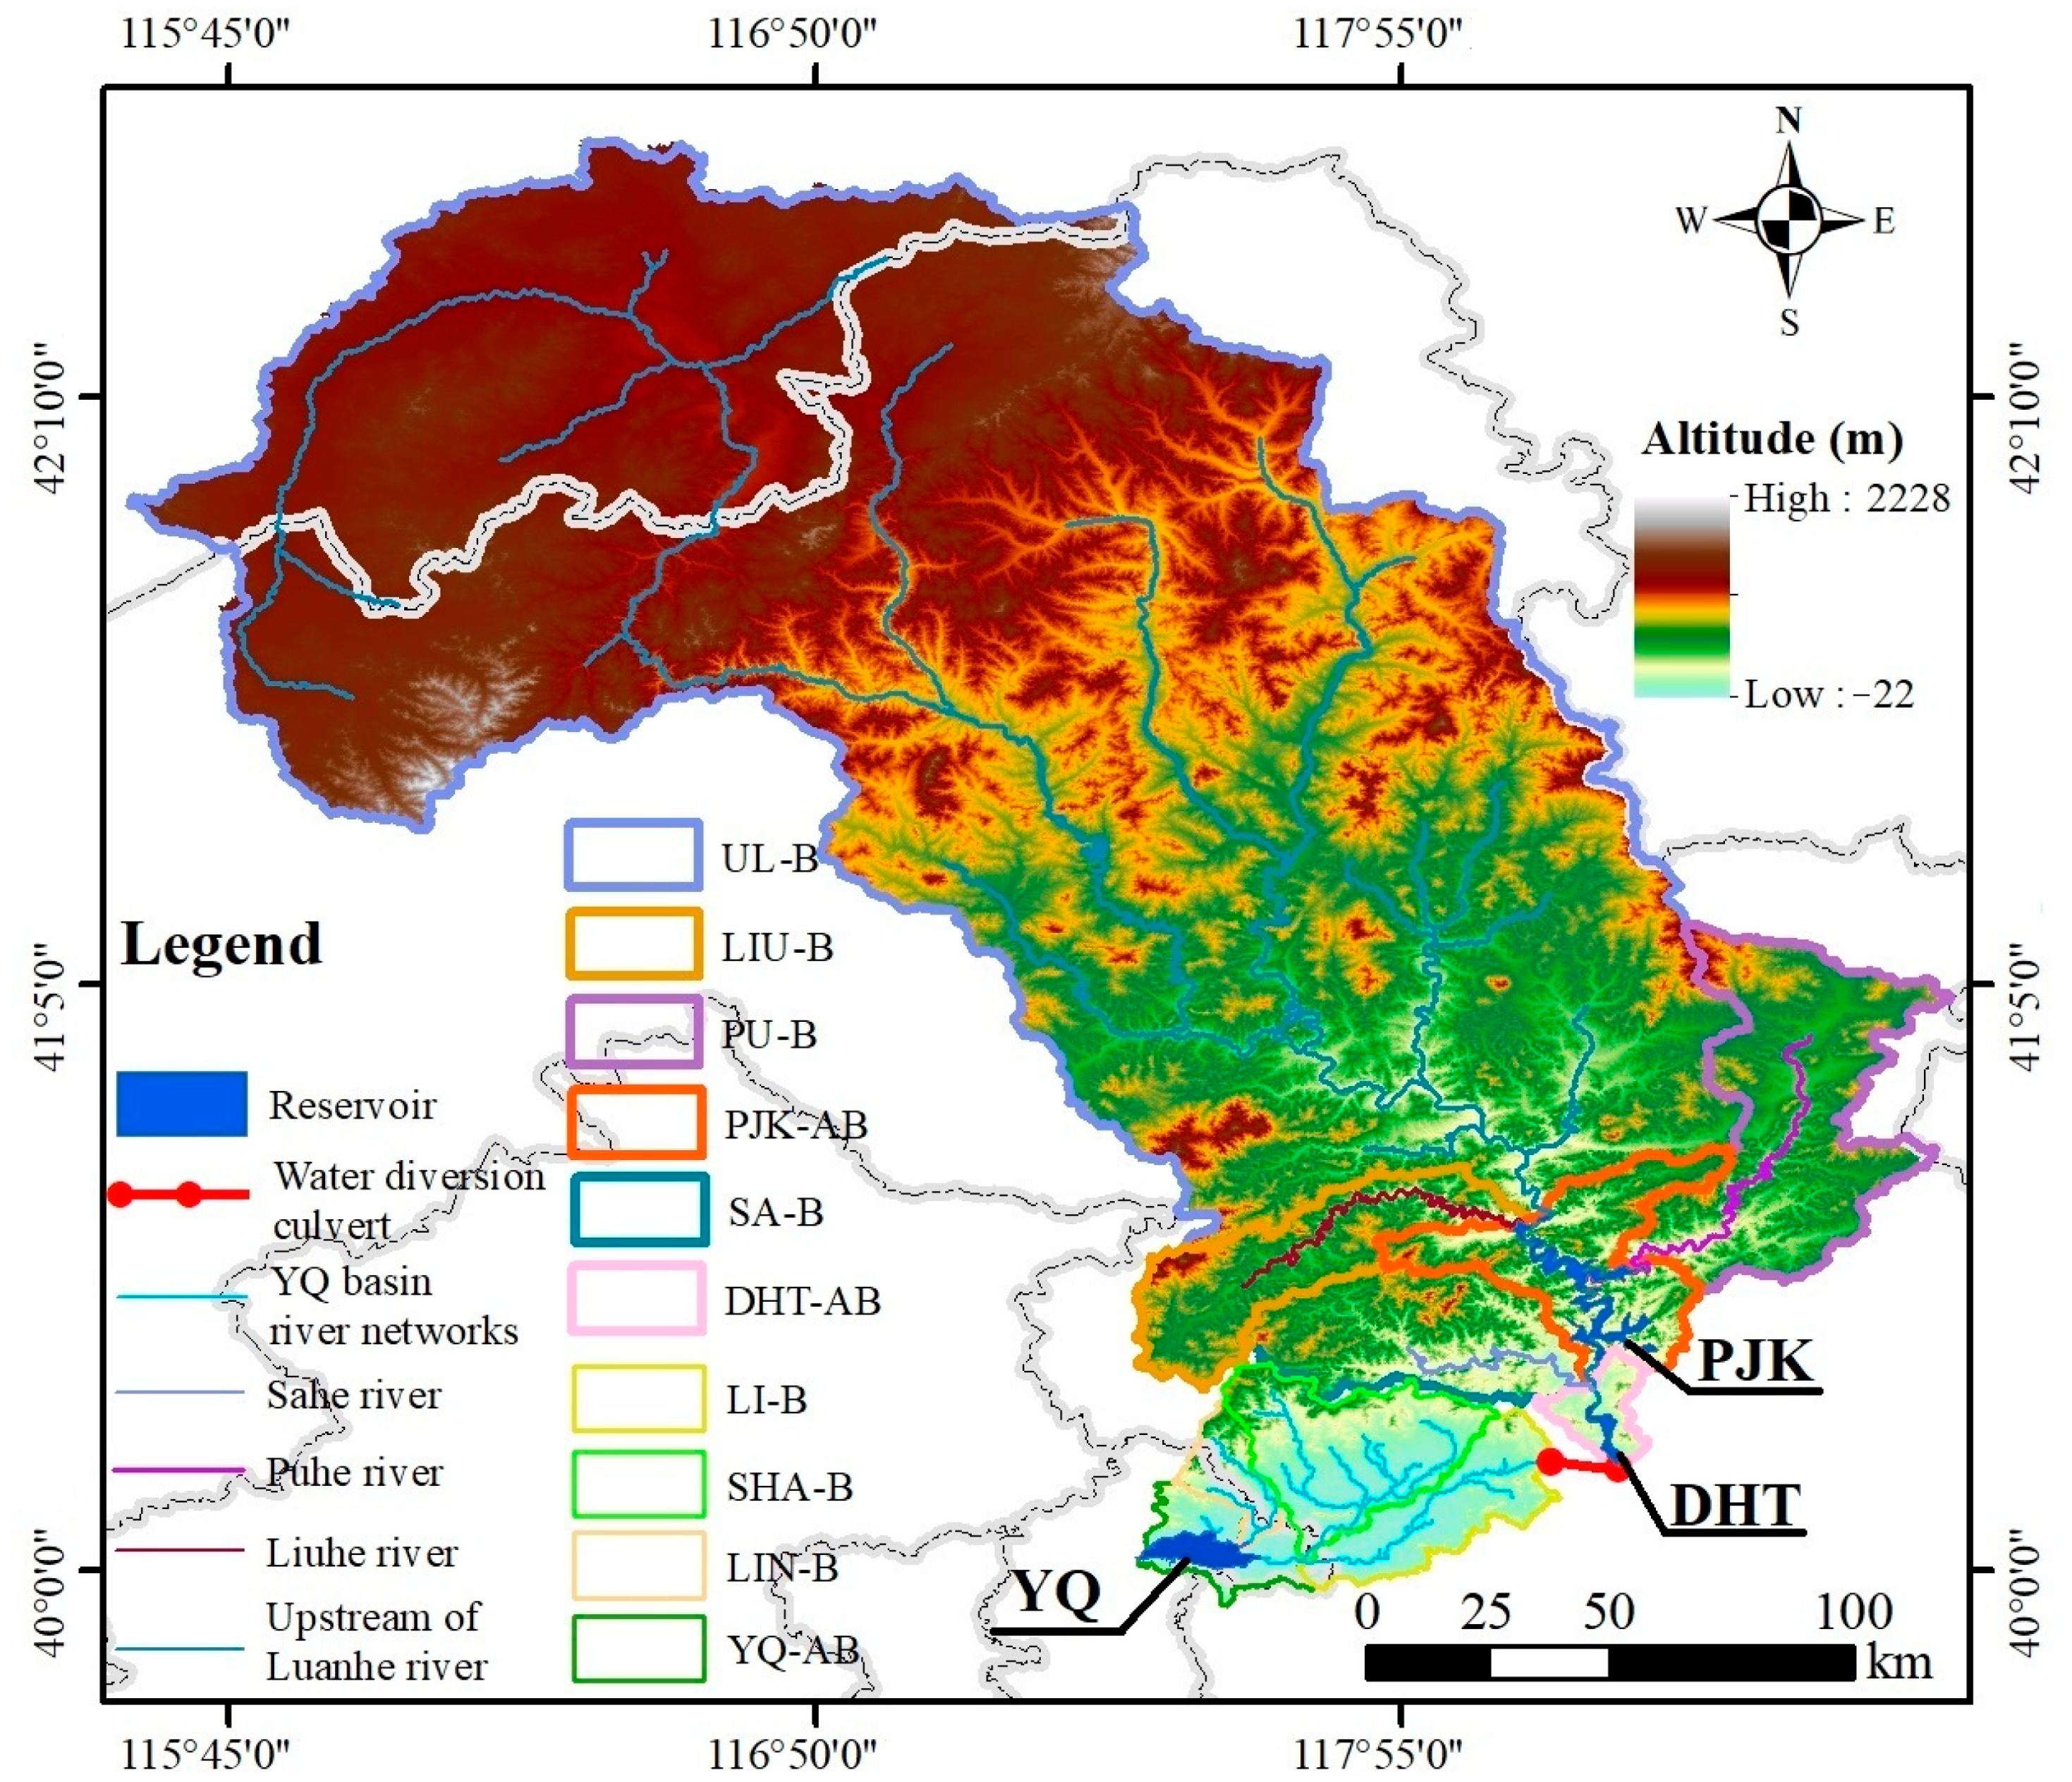
This study was conducted in the Water Diversion Basin from the Luanhe River to Tianjin city (WDBLT) (Figure 2), located in North China and spanning the administrative regions of Tianjin and Hebei Province [35,36,37]. The diversion of water from the Luanhe River basin into Tianjin addresses the water resource shortages. Since the commencement of the diversion in 1983 until 2023, approximately 33.3 billion cubic meters of water have been supplied to the urban area of Tianjin over 40 years, establishing it as a crucial water source for the city. Therefore, ensuring stable water quality in the WDBLT is vital for the economic and social development of Tianjin. This watershed comprises three major reservoirs: the PanJiaKou reservoir (PJK), DaHeiTing reservoir (DHT), and YuQiao reservoir (YQ), which play essential roles in regulating the water resources. Each reservoir corresponds to different rivers, as presented in Table 1.
The sequence of the three main reservoirs in the water diversion system from upstream to downstream is as follows: the PJK, DHT, and YQ. Among them, the PJK and DHT are in a natural cascade, while the DHT and YQ form an artificial water diversion cascade. Additionally, from the perspective of water depth, the PJK is a typical deep reservoir, with an average depth of approximately 10 m for the DHT, while the YQ is a typical shallow reservoir with an average depth of less than 5 m. From a geomorphological perspective, the PJK and DHT are predominantly mountainous around their perimeters, with relatively few submerged plants; in contrast, the YQ has a gentler slope around its perimeter, with a high density of both submerged and emergent plants. Therefore, there are also notable differences among the three reservoirs from the perspective of aquatic ecology.

2.2. Data

2.2.1. Meteorological Data

According to the results of the Thiessen polygon partitioning based on China’s primary meteorological stations, the study area includes a total of several primary meteorological stations [5]. To further calculate the average precipitation for each sub-basin, the boundaries of the sub-basins were aligned with the contours of the meteorological station Thiessen polygons, resulting in the area and proportion of each meteorological station represented within different sub-basins. Meteorological stations with an area proportion less than 10% were excluded from the respective sub-basins, and the adjusted proportions were recalculated. Based on these adjusted proportions, the daily average precipitation and daily average temperature for each sub-basin were further calculated for the purposes of tracing sources of nitrogen and phosphorus nutrients within the watershed.
The meteorological data used in this research is sourced from the National Meteorological Information Center (http://data.cma.cn/) and includes daily station meteorological data.

2.2.2. Land Use Land Cover (LULC) and Population

The land use data of WDBLT is sourced from the “30-Meter Annual Land Cover Products of China” created by Professor Huang Xin’s team from Wuhan University (https://zenodo.org/). The population data came from National Earth System Science Data Center with the type of raster (1 km × 1 km) (http://www.geodata.cn/).

2.2.3. Water Quality and Pollution Source Data

The monthly water quality data in this study were sourced from the Tianjin Eco-Environment Monitoring Center. The types of water quality data include concentrations of nitrate nitrogen ( NO 3 ), ammonia nitrogen ( NH 4 + ), organic nitrogen (ON), total phosphorus (TP), and chlorophyll-a (Chla). The monitoring time range for the water quality data of the PJK and DHT was from 2010 to 2018, while that for the YQ spanned from 2010 to 2019.
The point source pollution in the watersheds includes two components: sewage treatment plants and industrial enterprises, covering the time range from 2010 to 2018. The data was sourced from the Chinese Academy of Environmental Planning and the Tianjin Eco-Environment Monitoring Center.

2.2.4. Hydrological Data

The flow data used in this study includes the monthly average inflow and outflow of the three reservoirs. The flow data were sourced from the Annual Hydrological Report of P. R. China (available at https://www.nlc.cn). In the model input data, the average capacities of the PJK, DHT, and YQ are approximately 1.5 billion m3, 250 million m3, and 350 million m3, respectively, with average water depths of approximately 10 m, 9 m, and 4.7 m, respectively. Within the model framework, flows were calculated using the SCS-CN method and expressed as streamflow depth.

2.3. Watershed Water Quality Model

The ReNuMa was employed to simulate the streamflow depth and the nitrogen and phosphorus load. For details on the ReNuMa, please refer to the model User Manual (www.research.howarthlab.org/modeling.php). The establishment process of ReNuMa focuses on the upstream basins of individual water quality monitoring stations in rivers. The calculation process does not differentiate sub-basins, so the results do not include the direct spatial distribution of pollutants. Although this means that the spatial accuracy of the basin model may not meet the water environment management needs in certain scenarios, it also gives the parameters in ReNuMa a certain degree of spatial transferability. Specifically, parameters from a ReNuMa model established in a small basin can be transferred to adjacent and similar small basins, yielding relatively reliable calculation results. Currently, ReNuMa is used to evaluate the contributions of nitrogen and phosphorus from different sources to the outlet of the basin. In this study, the main inflow rivers of the three reservoirs have water quality monitoring stations, but these stations are not located adjacent to the river and reservoir boundaries. Therefore, during the geographic delineation of the watershed, there are significant watersheds surrounding all three reservoirs, as illustrated in Figure 1. The watersheds surrounding the reservoirs are usually a non-negligible source of nitrogen and phosphorus for the reservoirs; however, there is no long-term stable monitoring of water quality and flow in these basins, making it impossible to establish a suitable basin model. Thus, the approach begins with establishing a basin model for the main inflow rivers, followed by extracting parameters from the ReNuMa model of inflow rivers that are adjacent and similar to the watersheds surrounding the reservoir, thereby constructing a model for the watershed surrounding reservoir to calculate the nitrogen and phosphorus loads and sources entering the reservoirs [38,39,40]. In this way, the spatial range of the basin involved in the reservoir is involved in the model calculation, and the calculation results are spatially complete.
The TN and TP loads were calculated using Equation (1).
L o a d i = c   ×   Q   ×   n i   ×   10 - 6
where L o a d i is the monthly nutrient load (t) in month i. The c and Q are the concentration (mg/L) and streamflow (m3/day), respectively. n i denotes the number of days in month i.

2.4. Lake and Reservoir Water Quality Model

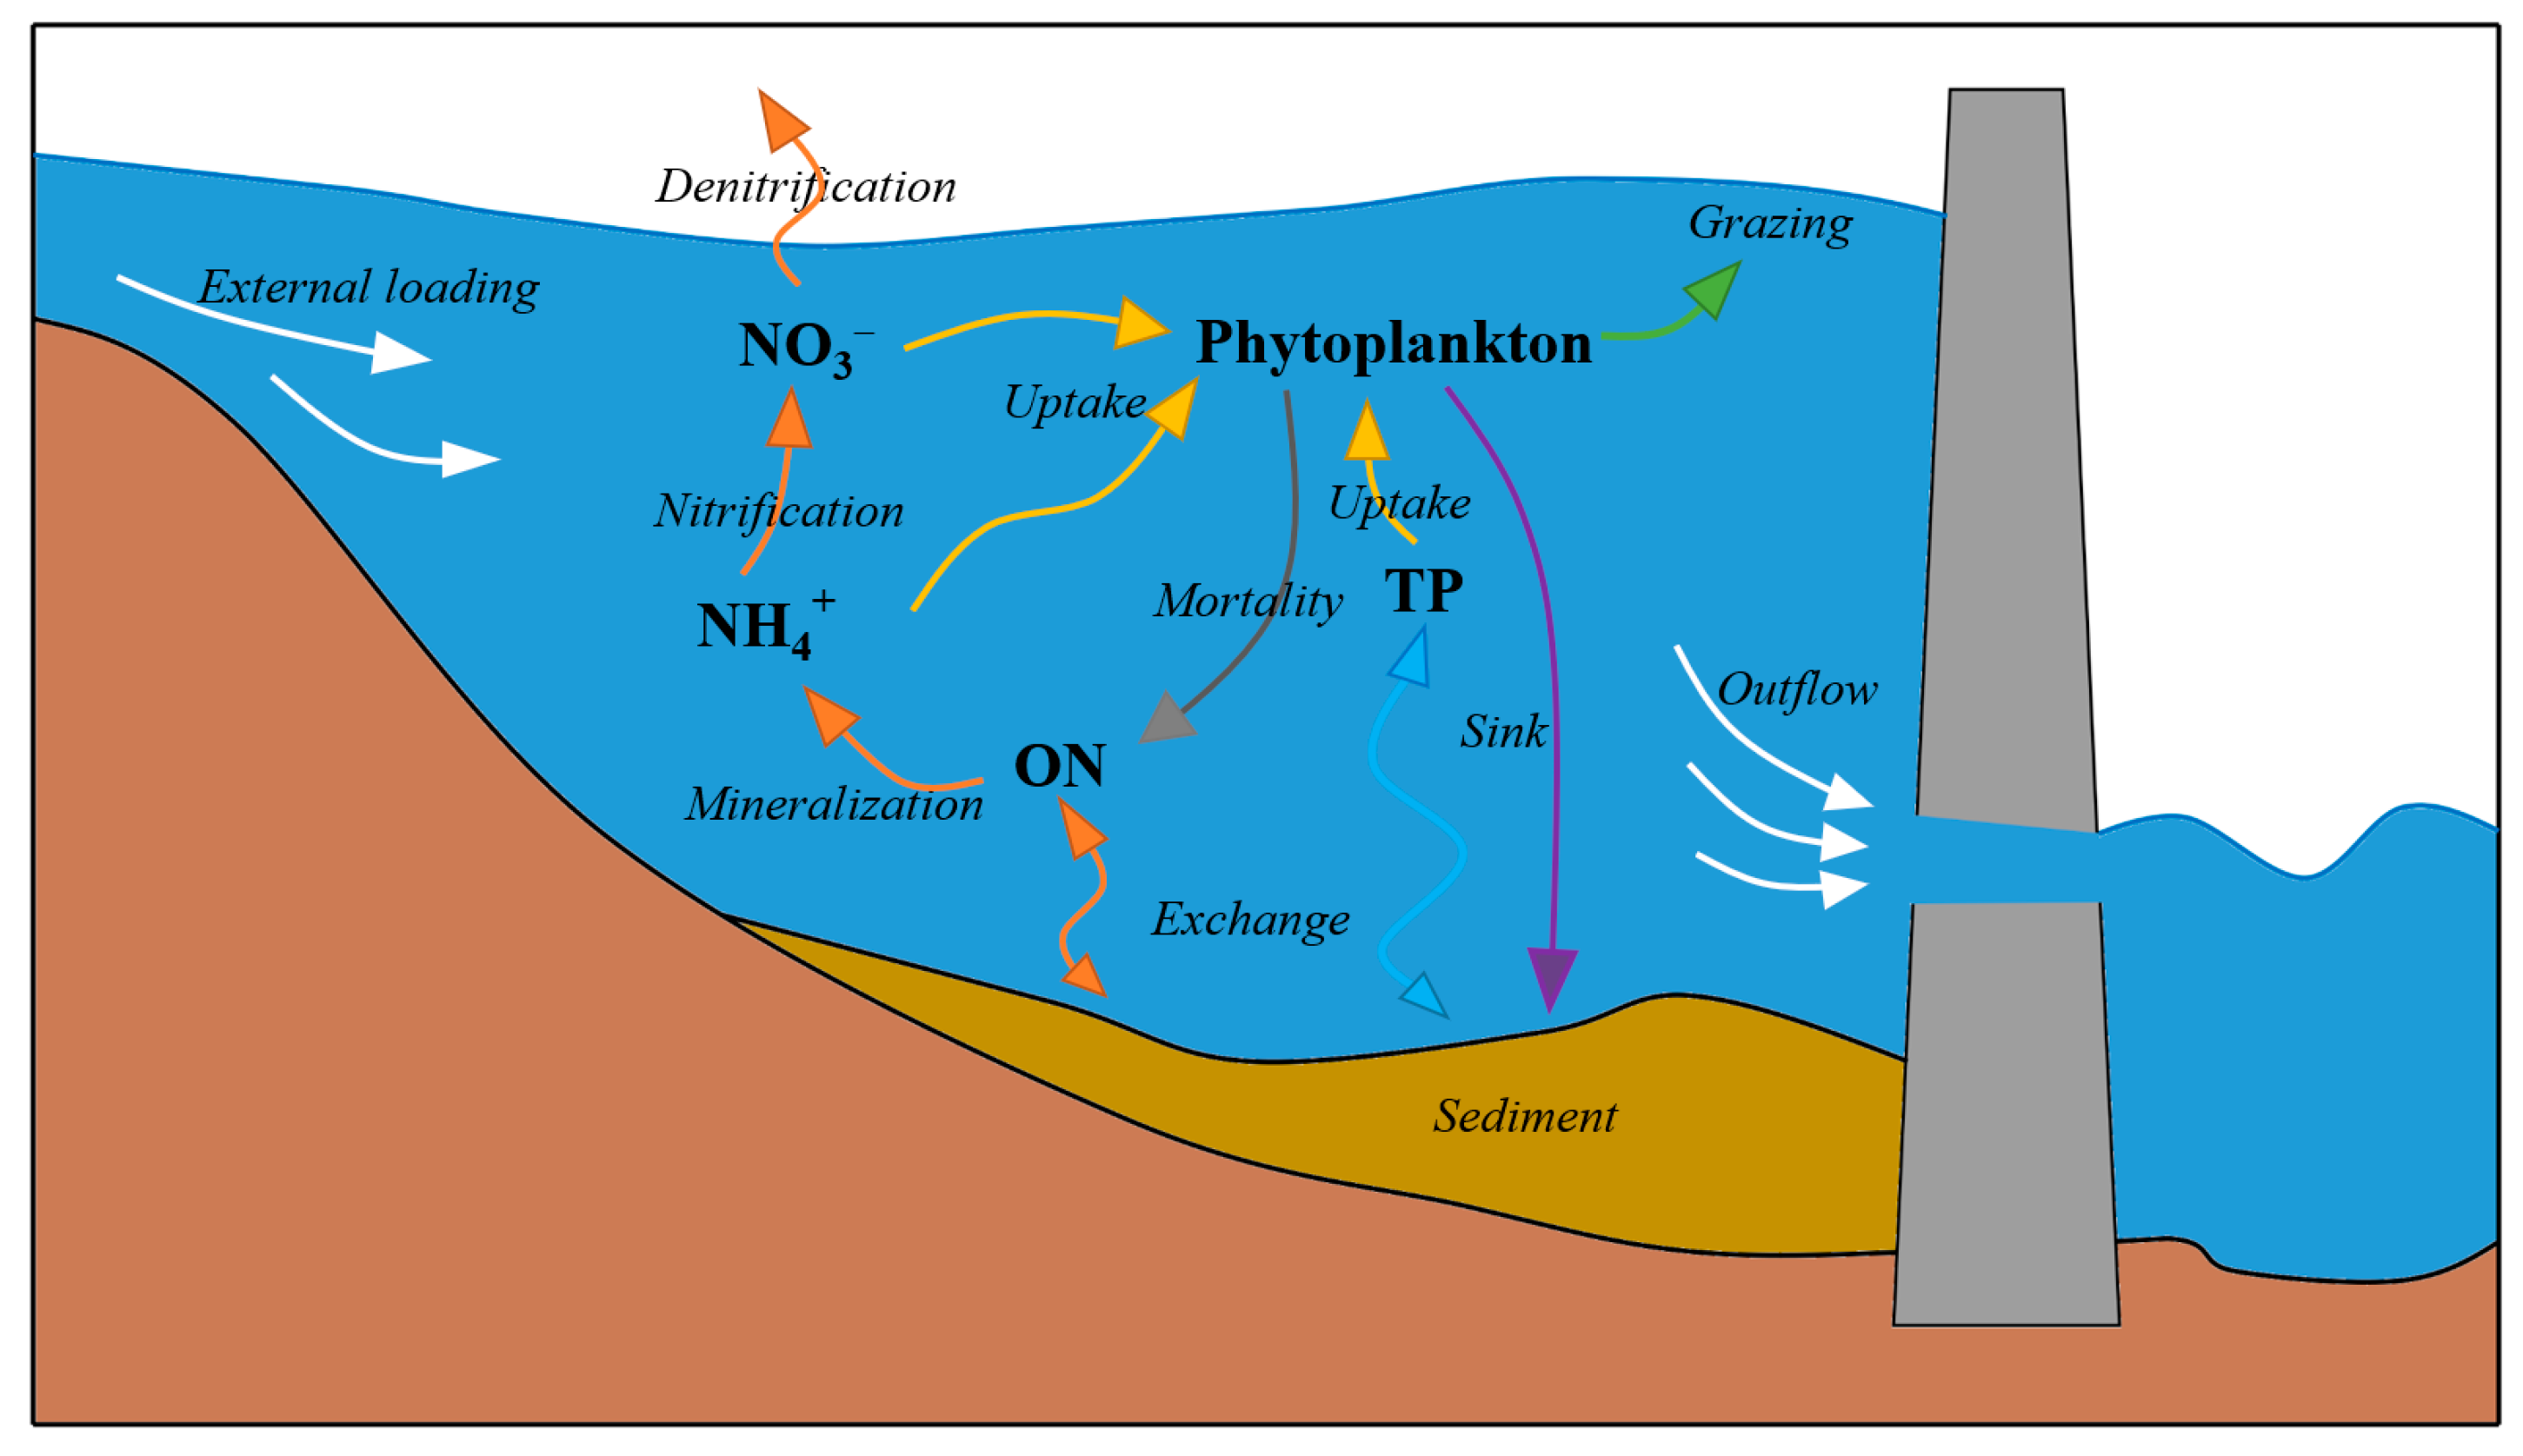
The ecological status of reservoirs is influenced by internal biochemical processes. This study examines the primary biochemical processes of nitrogen, phosphorus, and chlorophyll-a in the reservoirs (Figure 3). The model primarily focuses on the relationships among five water quality parameters: TP, NO 3 , NH 4 + , ON, and Chla. The model encompasses the inflow, outflow, phytoplankton uptake, and denitrification of nitrate nitrogen; the inflow, outflow, phytoplankton uptake, and nitrification of ammonium nitrogen; the inflow, outflow, contributions from phytoplankton mortality, mineralization, and exchange with sediments (or internal sources) of organic nitrogen; the inflow, outflow, phytoplankton uptake, and exchange with sediments (or internal sources) of TP; and the outflow, sedimentation, and phytoplankton growth related to the uptake of nitrogen (nitrate and ammonium) and phosphorus, including the contributions from phytoplankton mortality to organic nitrogen and the grazing process. The key biochemical processes are illustrated in Figure 3. In establishing the lake nitrogen–phosphorus–algae cycle model, references are made to the nitrogen–phosphorus–algae cycle model developed in previous research [33], complemented by the improved parameter scheme provided in the Supplementary Materials.
The model structure provides a highly generalized representation of the nitrogen–phosphorus–algal cycle in lakes. The original model employed a Bayesian hierarchical approach to calibrate parameters for different months; nitrification intensity (ni), denitrification intensity (de), and algal growth rate intensity (M) all follow a normal distribution. The mean values of these parameters during the same season across different years adhere to the same prior distribution, thereby achieving a hierarchical organization of the parameters [34]. This model design emphasizes the seasonality of the nitrogen–phosphorus–algal cycle in lakes, thereby enhancing its broader applicability. However, the three reservoirs studied are significantly affected by human interventions and policy influences [36,37]. Specifically, the YQ experiences water diversion amounts that are significantly greater than its capacity in most years, leading to substantial impacts on the nitrogen–phosphorus–algal cycle attributed to uneven water management, notably disturbing the seasonality of the reservoir’s biochemical processes. If the original model were applied directly to this study, the level of parameterization would be inadequate, resulting in lower simulation accuracy; thus, further parameterization of the model is essential.
Consequently, this study localizes and enhances the Bayesian hierarchical process of the original model. The mean values of ni, de, and M are configured to follow the same prior distribution in the same month across different years, thereby facilitating a more detailed hierarchical structuring of the parameters to accommodate the higher variability of the aquatic ecological environment in the studied reservoirs. In this study, March to May is designated as spring; June to August as summer; September to November as autumn; and December to February as winter. Thus, from the prior distribution of the aforementioned hierarchical parameters, it is evident that the model does not entirely abandon seasonality in the hierarchical process. While parameters for each month are hierarchical, the mean and variance of the hierarchical prior normal distribution remain consistent within each season, thereby balancing the seasonality of the parameters with interannual variability. The intention is that this model design effectively addresses both the seasonality and the fitting capability of the lake model.
This study establishes Improved Hierarchical Bayesian Lake Models (IHBLMs) based on the nitrogen–phosphorus–algal biochemical processes for the PJK, DHT, and YQ. The models are implemented using the R programming language (R version 4.1.1), primarily utilizing the function environment provided by the “Rjags” package. In model computation, three chains are established, and each chain undergoes 100,000 iterations, with the last 80,000 iterations utilized to calculate the posterior distribution. The computation results show that the Markov chains for each parameter have successfully converged.

3. Results

3.1. The Trend of Water Quality

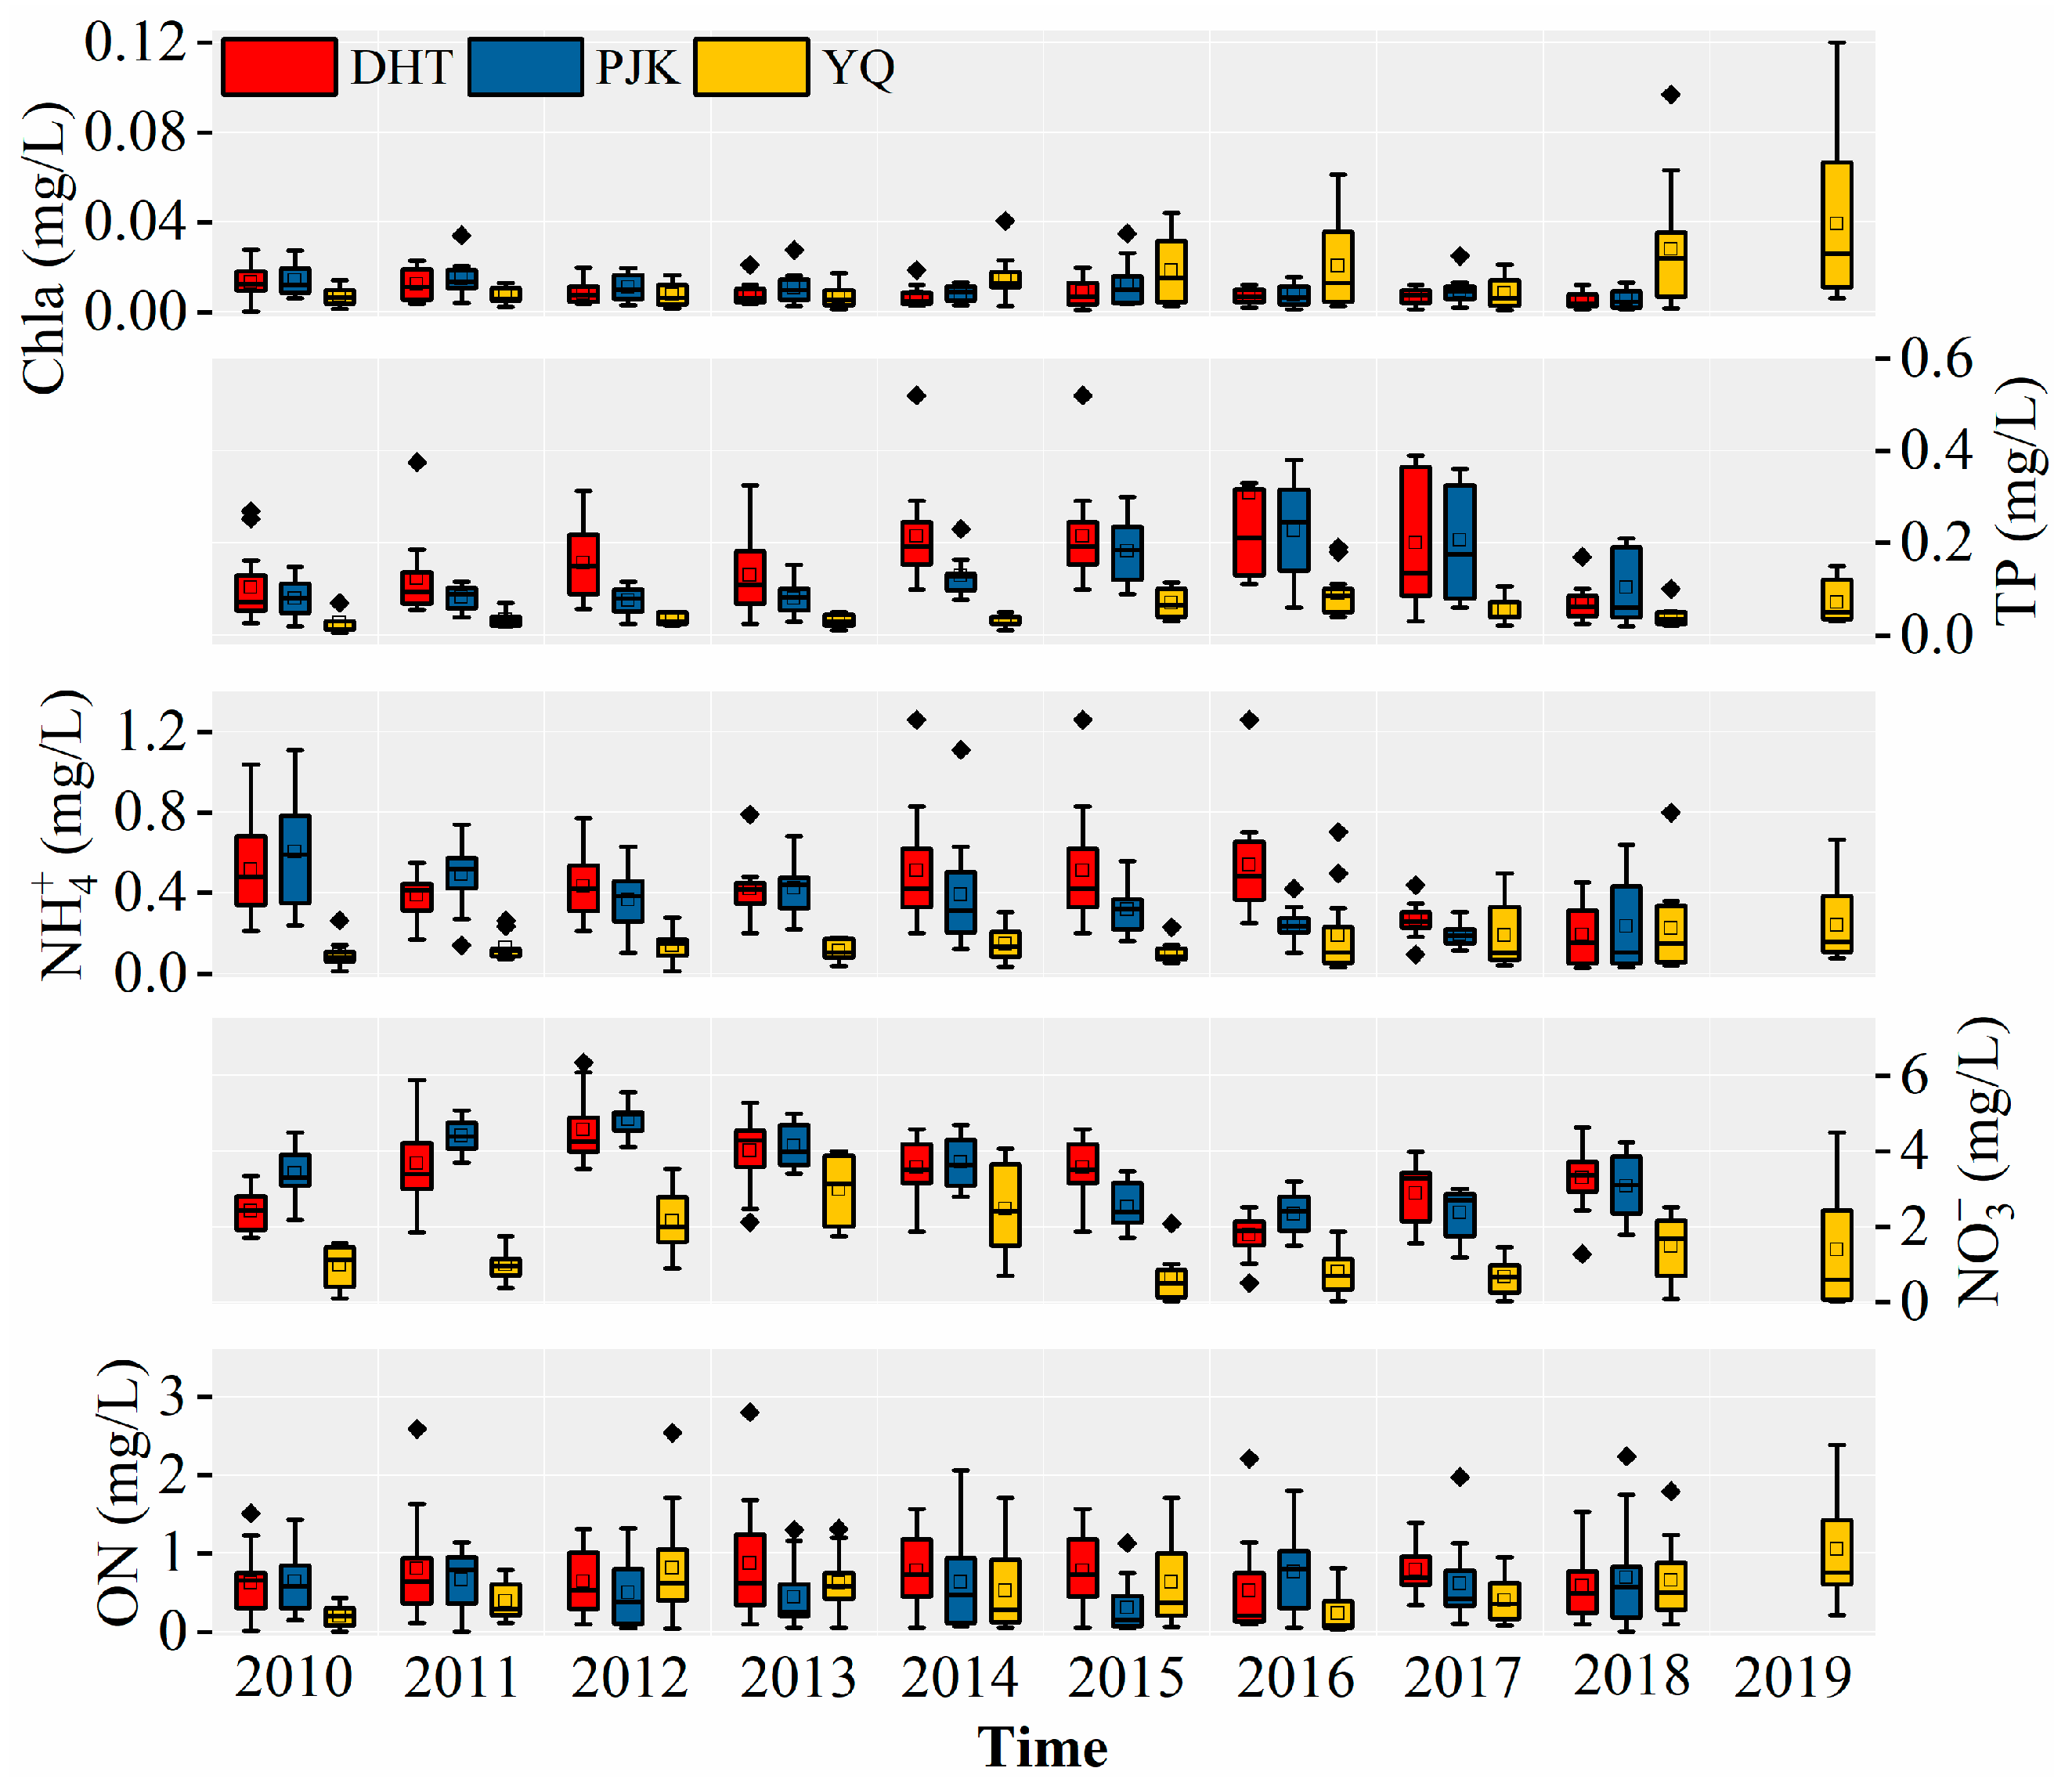
The long-term trends in water quality for the three reservoirs are illustrated in Figure 4. Overall, from 2010 to 2018, the water quality status of the PJK and DHT was poorer than that of the YQ, indicating a discernible differentiation in the water quality status of the three reservoirs around 2014. Between 2010 and 2013, the overall water quality status of the YQ was marginally better than that of the PJK and DHT. However, post-2014, the concentration of Chla in the YQ exhibited a year-on-year upward trend, whereas the concentrations of Chla in the PJK and DHT remained stable with a slight downward trend. Furthermore, other water quality parameters in the YQ, excluding Chla, approached the levels observed in the PJK and DHT.

3.2. Simulation of Three Reservoirs by IHBLM

The IHBLM was employed to simulate monthly water quality changes in the PJK and DHT from 2010 to 2018, and in the YQ from 2010 to 2019. Due to the requirements imposed by the reservoir management authorities regarding the public disclosure of lake water quality data, the water quality data for the three reservoirs underwent a logarithmic transformation with a base of 10.

3.2.1. Simulation Results of PJK

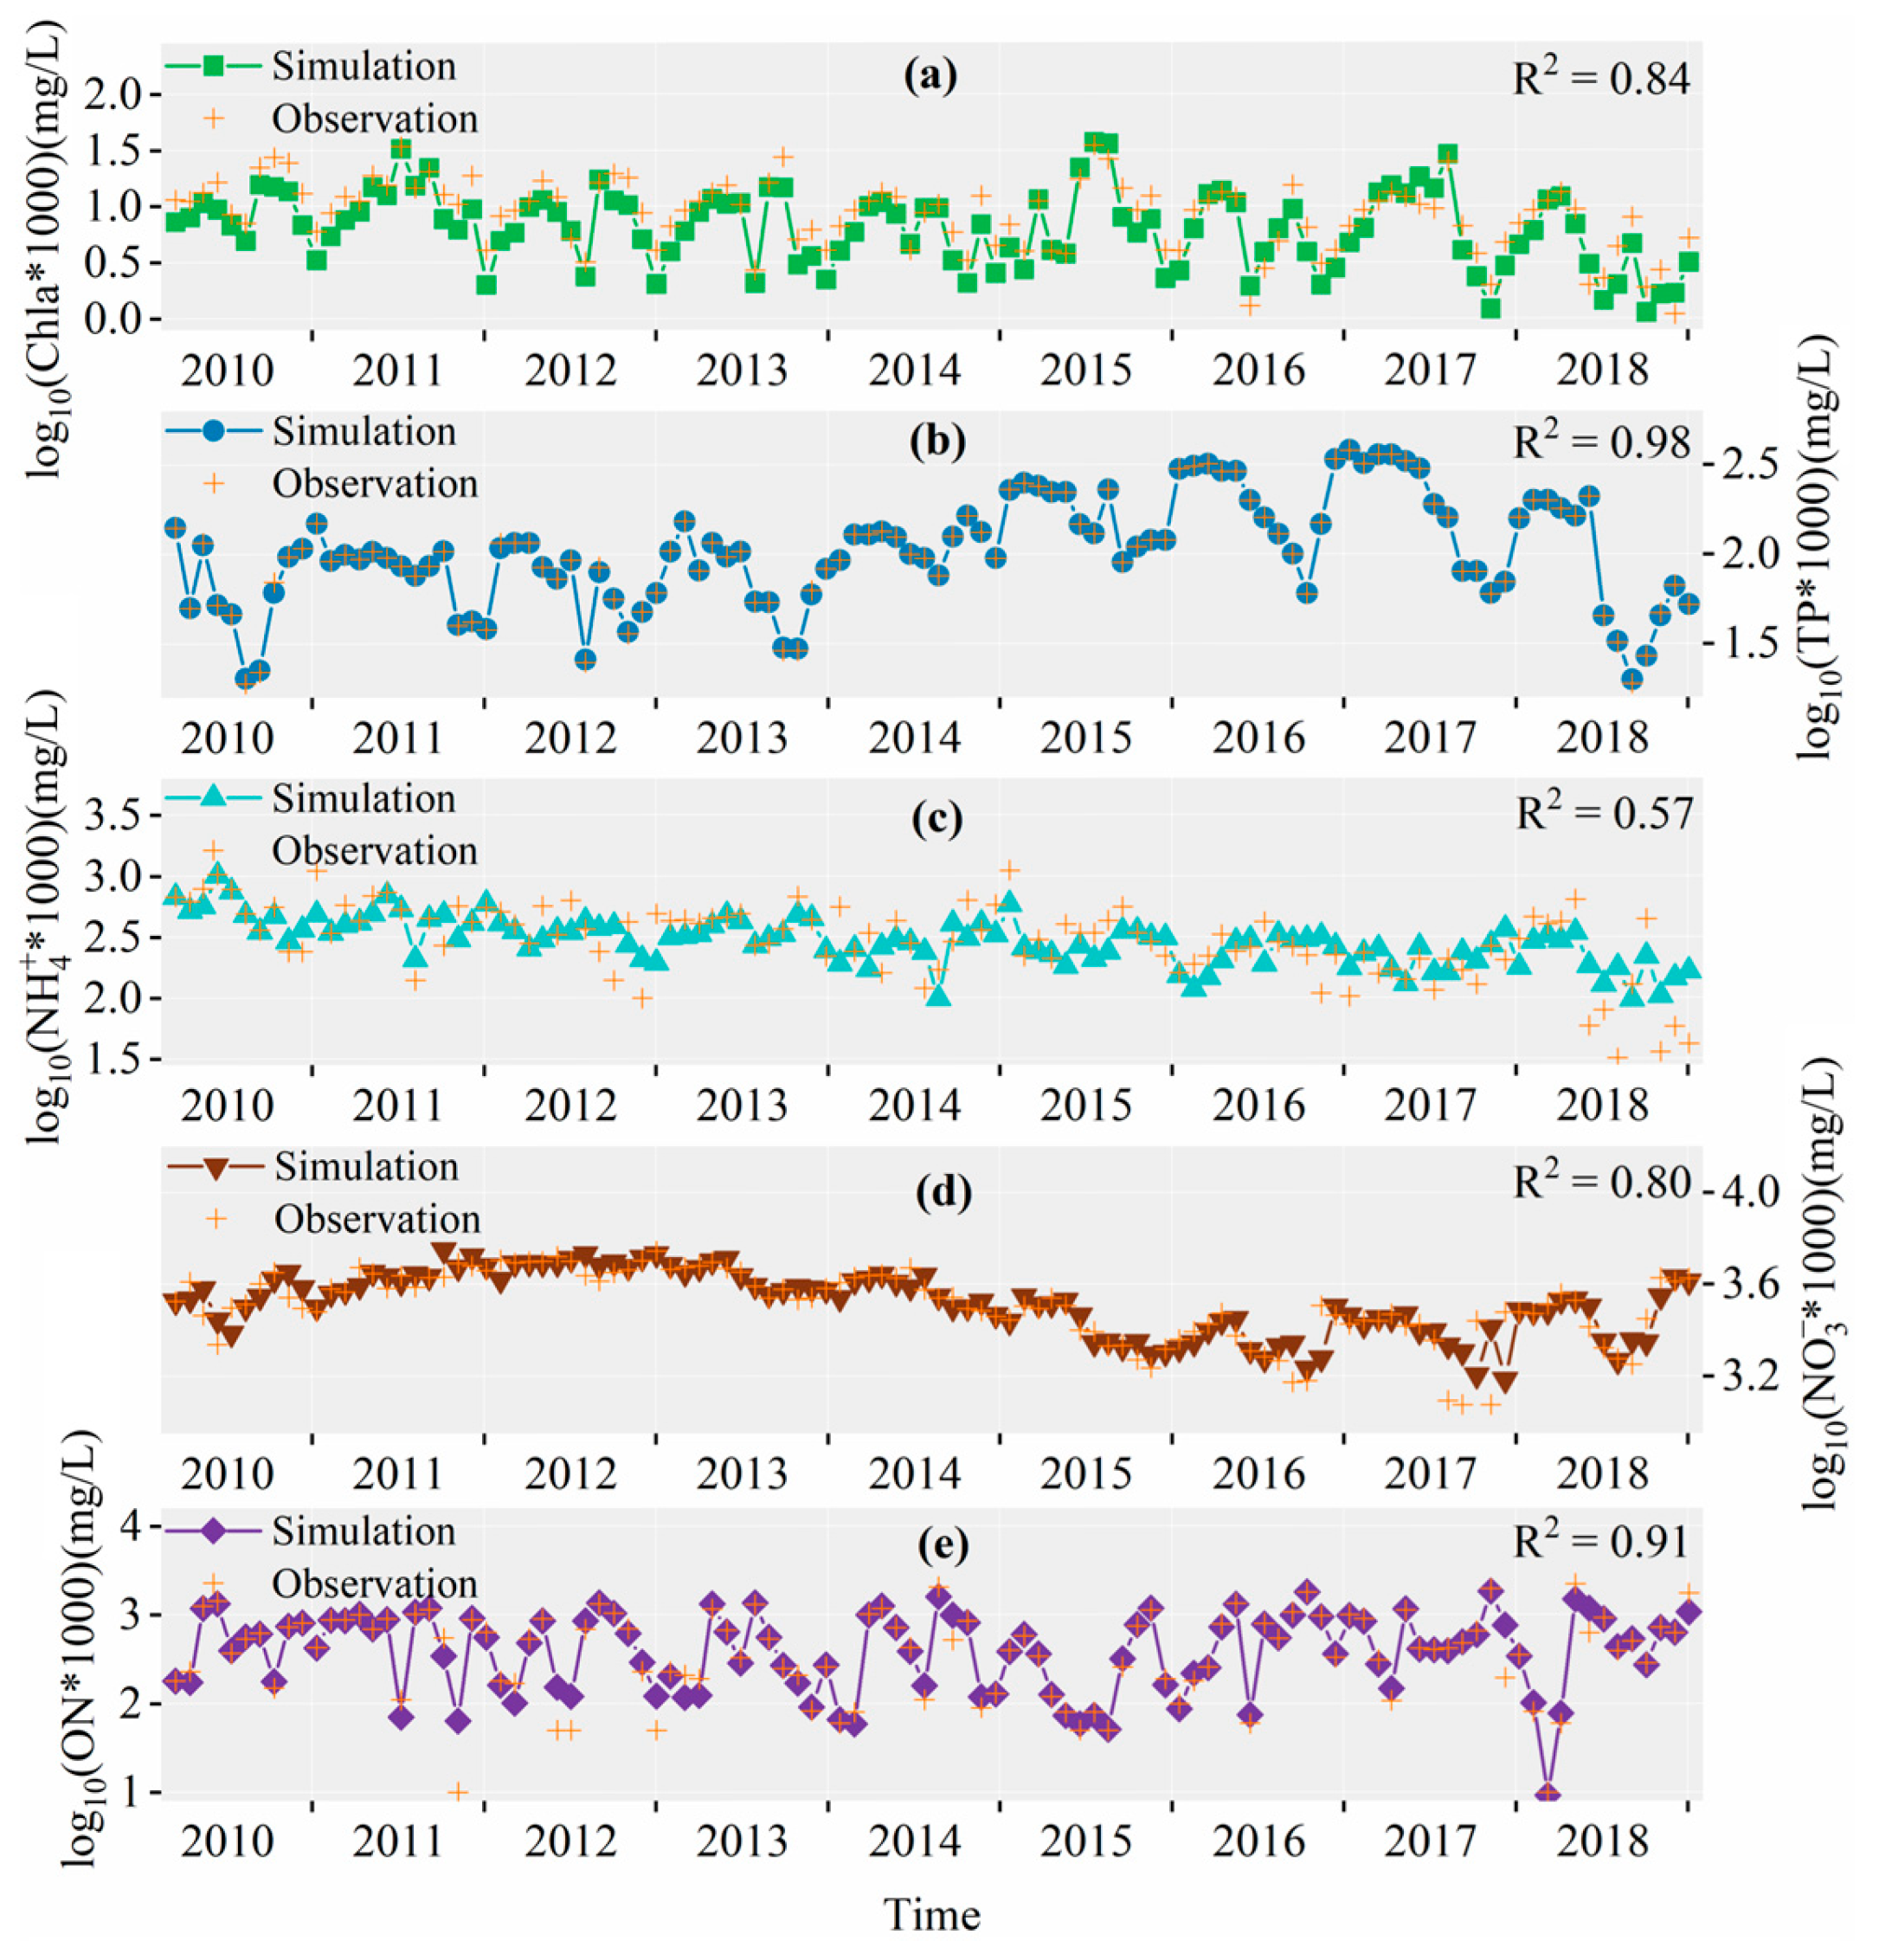
The simulation results for multi-year water quality pertaining to the PJK and the measured values are presented in Figure 5. The simulation accuracies (R2) for chlorophyll-a concentration ( c Chla ), total phosphorus concentration ( c TP ), ammonia nitrogen concentration ( c NH 4 + ), nitrate nitrogen concentration ( c NO 3 ), and organic nitrogen concentration ( c ON ) are 0.84, 0.98, 0.57, 0.80, and 0.91, respectively, indicating the performance of the model. Following localized improvements to the model specifically, adjusting it from a seasonal hierarchy to a monthly hierarchy, the simulation accuracy remains within an acceptable range. Among them, the simulation residuals for c Chla are distributed relatively evenly throughout the simulation period. The simulation residuals for c NH 4 + are larger and distributed unevenly; however, in 2018, the residuals were notably significant. The simulation residuals for c NO 3 are relatively low in most years, with higher residuals observed only in 2017. The overall simulation residuals for c ON are generally small, with the exception of a larger residual in 2012. The simulation accuracy for c TP is notably high, with simulation residuals remaining consistently small throughout the simulation period.

3.2.2. Simulation Results of DHT

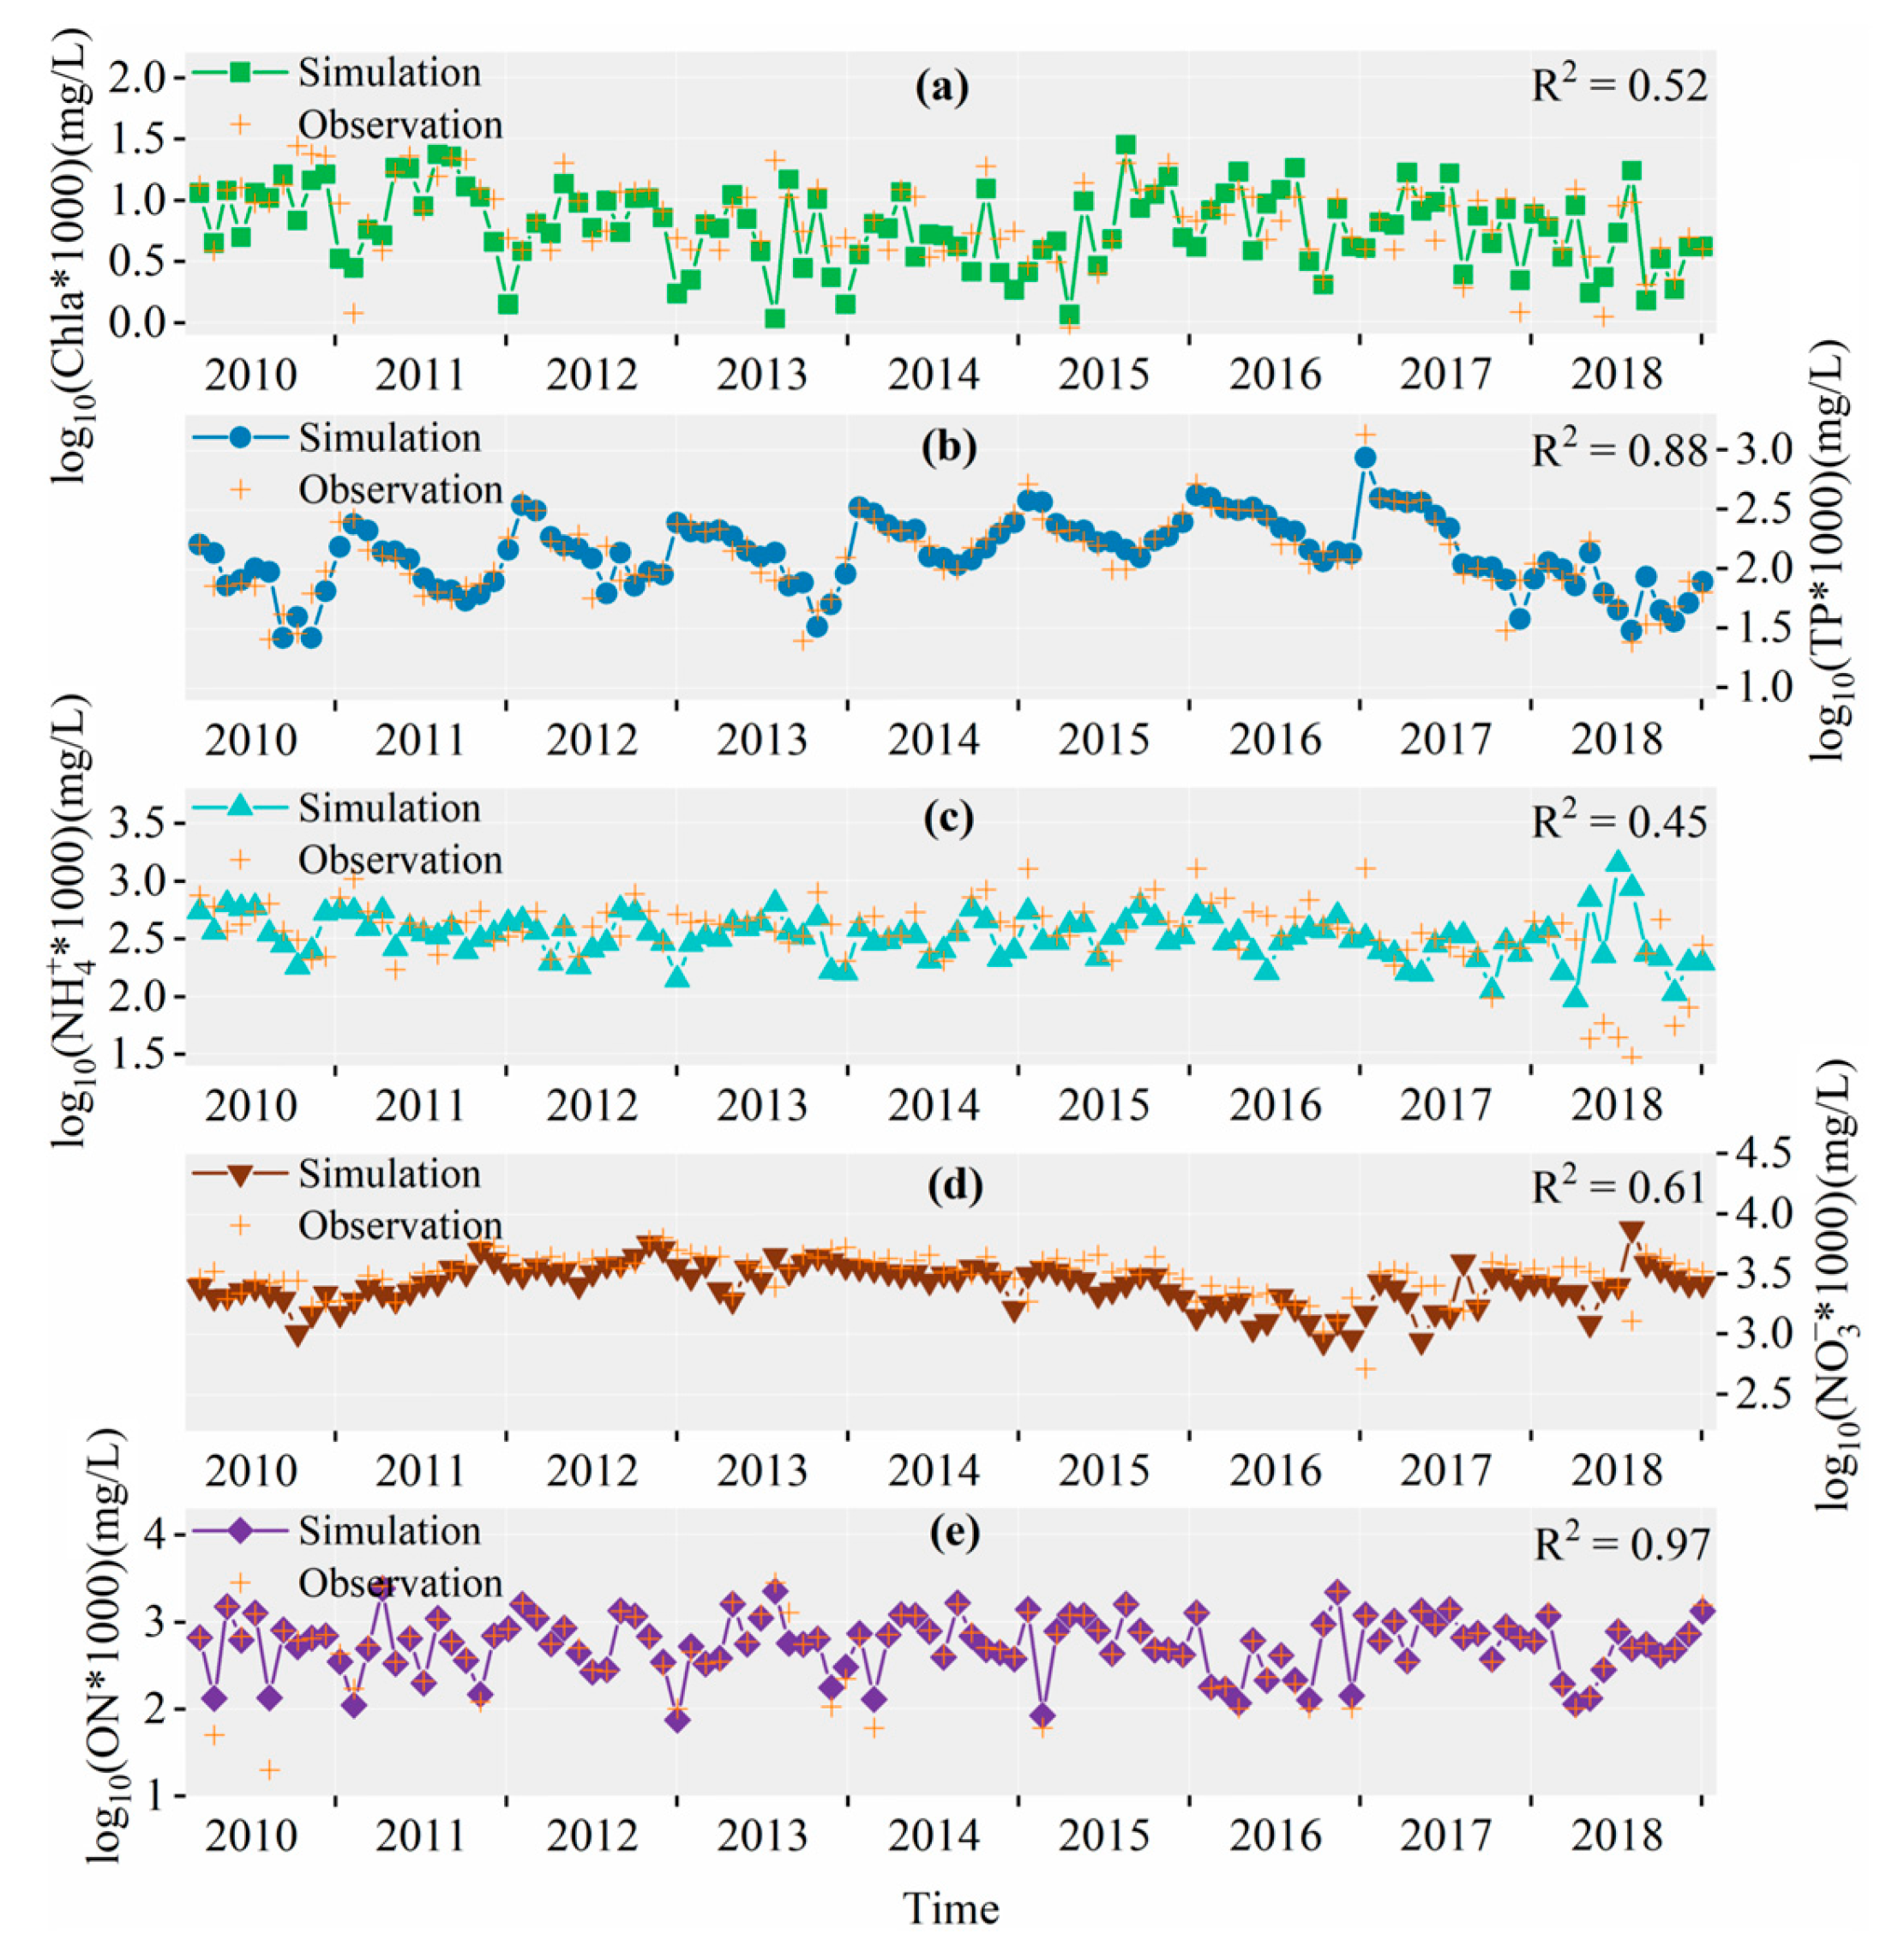
The multi-year water quality simulation results and measured values for DHT are presented in Figure 6. The simulation accuracies (R2) for c Chla , c TP , c NH 4 + , c NO 3 , and c ON are 0.52, 0.88, 0.45, 0.61, and 0.97, respectively, indicating that the simulation accuracy falls within an acceptable range. Compared to other parameters, the simulation accuracies for c Chla and ammonia nitrogen are relatively low; the simulation residuals for c Chla are consistently distributed, while the residuals for ammonia nitrogen exhibited significant increases in 2018. The simulation accuracies for c TP and c ON are high, with very small simulation residuals observed throughout the simulation period. Although the simulation accuracy for c NO 3 is not as high, the overall trend of the simulated values closely aligns with the measured values, exhibiting generally small residuals, except for an increase between 2017 and 2018.

3.2.3. Simulation Results of YQ

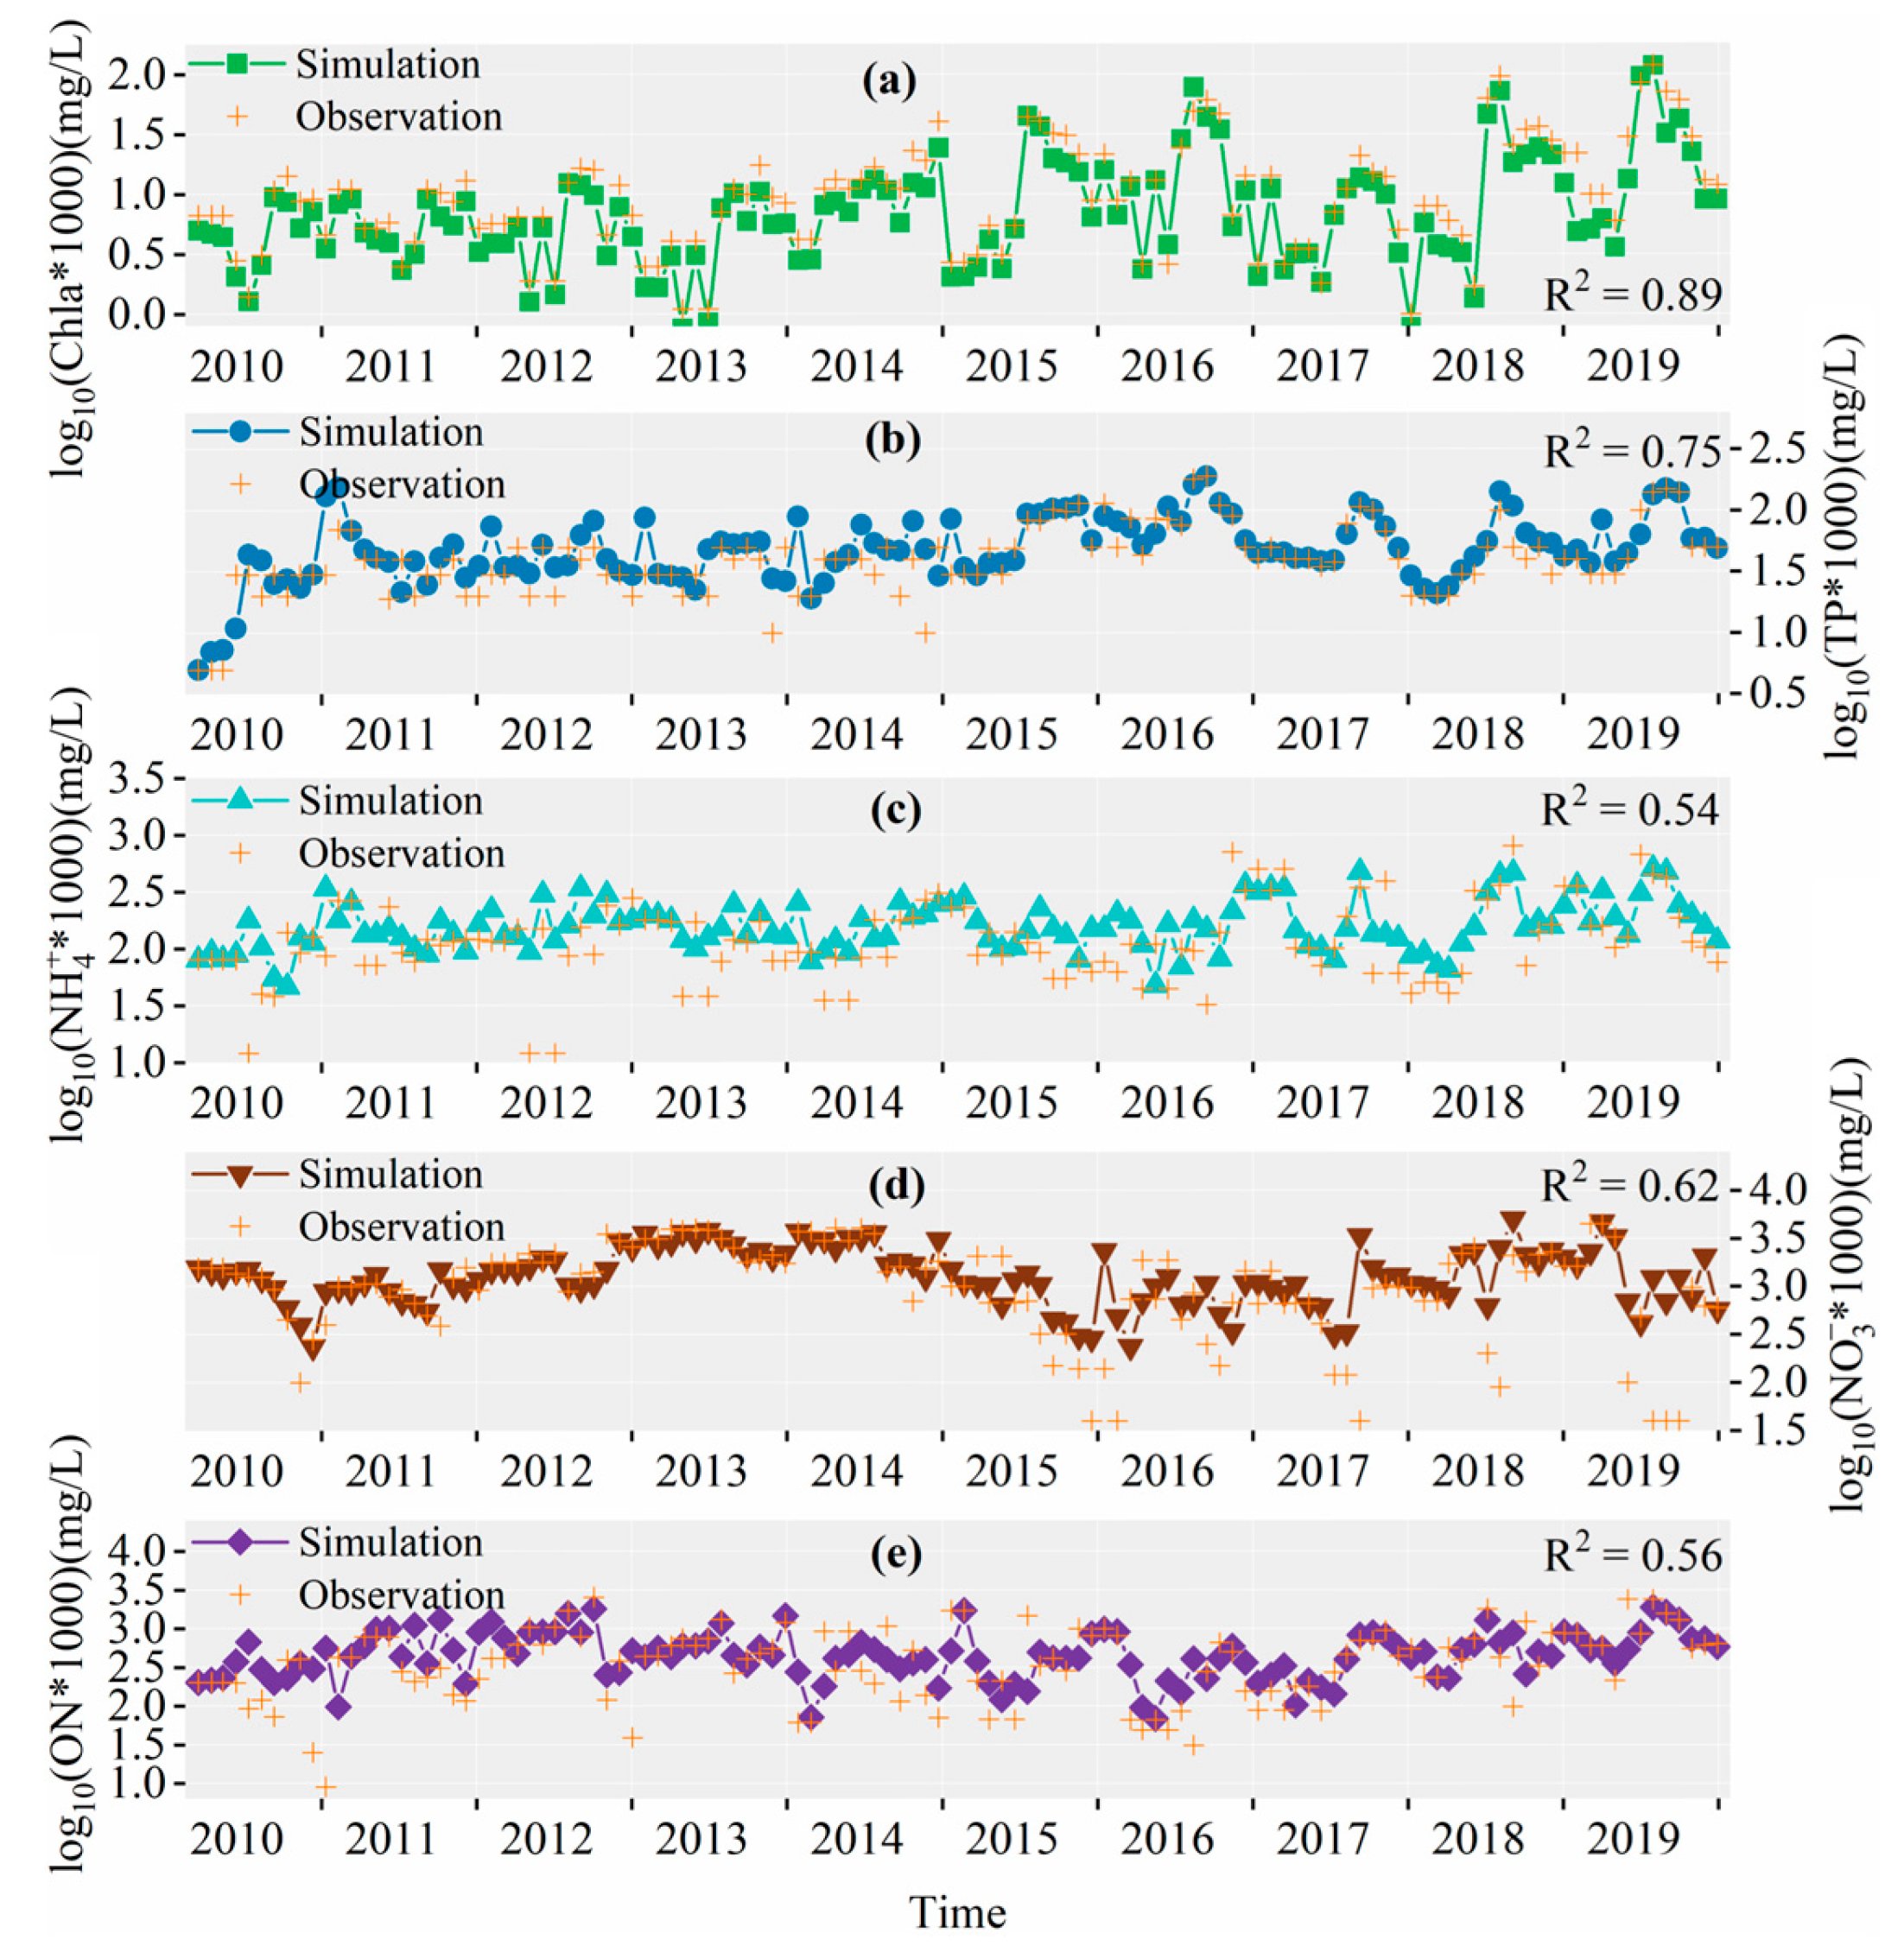
The multi-year water quality simulation results and measured values for the YQ are illustrated in Figure 7. The simulation accuracies (R2) for c Chla , c TP , c NH 4 + , c NO 3 , and c ON are 0.89, 0.75, 0.54, 0.62, and 0.56, respectively, indicating that the simulation accuracy is also within an acceptable range. The simulation accuracy for c Chla is the highest, with residuals evenly distributed overall. The accuracy for c TP remains high but is noticeably lower than that for the PJK and DHT; the simulation residuals were larger between 2010 and 2014 but significantly decreased after 2015. The simulation accuracy for c NH 4 + is low, displaying evenly distributed residuals overall, with exceptions for extreme values in 2010 and 2012. The simulation residuals for c NO 3 were relatively low between 2010 and 2014 but saw a significant increase after 2015. The simulation parameters for c ON are generally evenly distributed, with relatively high values observed only in 2010.

3.2.4. Simulation Error Analysis

The IHBLM has facilitated the simulation of water quality in three reservoirs within the water diversion system, yielding relatively reliable results that provide a foundational basis for further analysis of nitrogen-, phosphorus-, and algae-based biochemical processes within the reservoirs.
The distribution of simulation errors exhibits certain patterns. The small simulation errors for c TP are likely attributable to the relatively simple and stable nature of phosphorus biogeochemistry in these reservoirs. In contrast, the simulation errors for nitrate nitrogen and c NH 4 + are significantly larger compared to other water quality parameters, which may be attributed to the complexities of the biochemical processes involving nitrogen and the presence of numerous intermediate products [41]. For the PJK and DHT, there is a notable difference in simulation outcomes between the periods of 2017–2018 and 2010–2016. For the YQ, the temporal boundary for the simulation effect is identified as 2015. Such temporal demarcations may correspond to significant management measures or substantial changes in the aquatic ecological environment.
Numerous sources of error exist within the lake water quality simulation process. On one hand, the simplification of nitrogen-, phosphorus-, and algae-based biochemical processes can lead to simulation inaccuracies. For instance, the model does not account for the influence of dissolved oxygen concentrations on the biochemical processes within the lake. In reality, dissolved oxygen levels in the lake water directly or indirectly impact nitrification and the mineralization of organic nitrogen in the reservoirs. Moreover, the model fails to consider atmospheric deposition as a source of nitrogen and phosphorus input to the reservoirs. While this study omits atmospheric nitrogen deposition due to its relatively small contribution to nitrogen and phosphorus levels in the reservoirs, the absence of such calculations nonetheless results in increased uncertainty [34]. On the other hand, the uncertainty inherent in monitoring data may also contribute to simulation errors. The water quality and hydrological data employed in this chapter consist of monthly averages, with water quality data obtained from manual sampling and hydrological data sourced from fixed monitoring equipment. Both temporal averaging and variations in measurement methods introduce uncertainty into the model, potentially serving as significant sources of simulation error.

3.3. Simulation of TN and TP Load for WDBLT by ReNuMa

3.3.1. Simulation Results of PJK Watershed

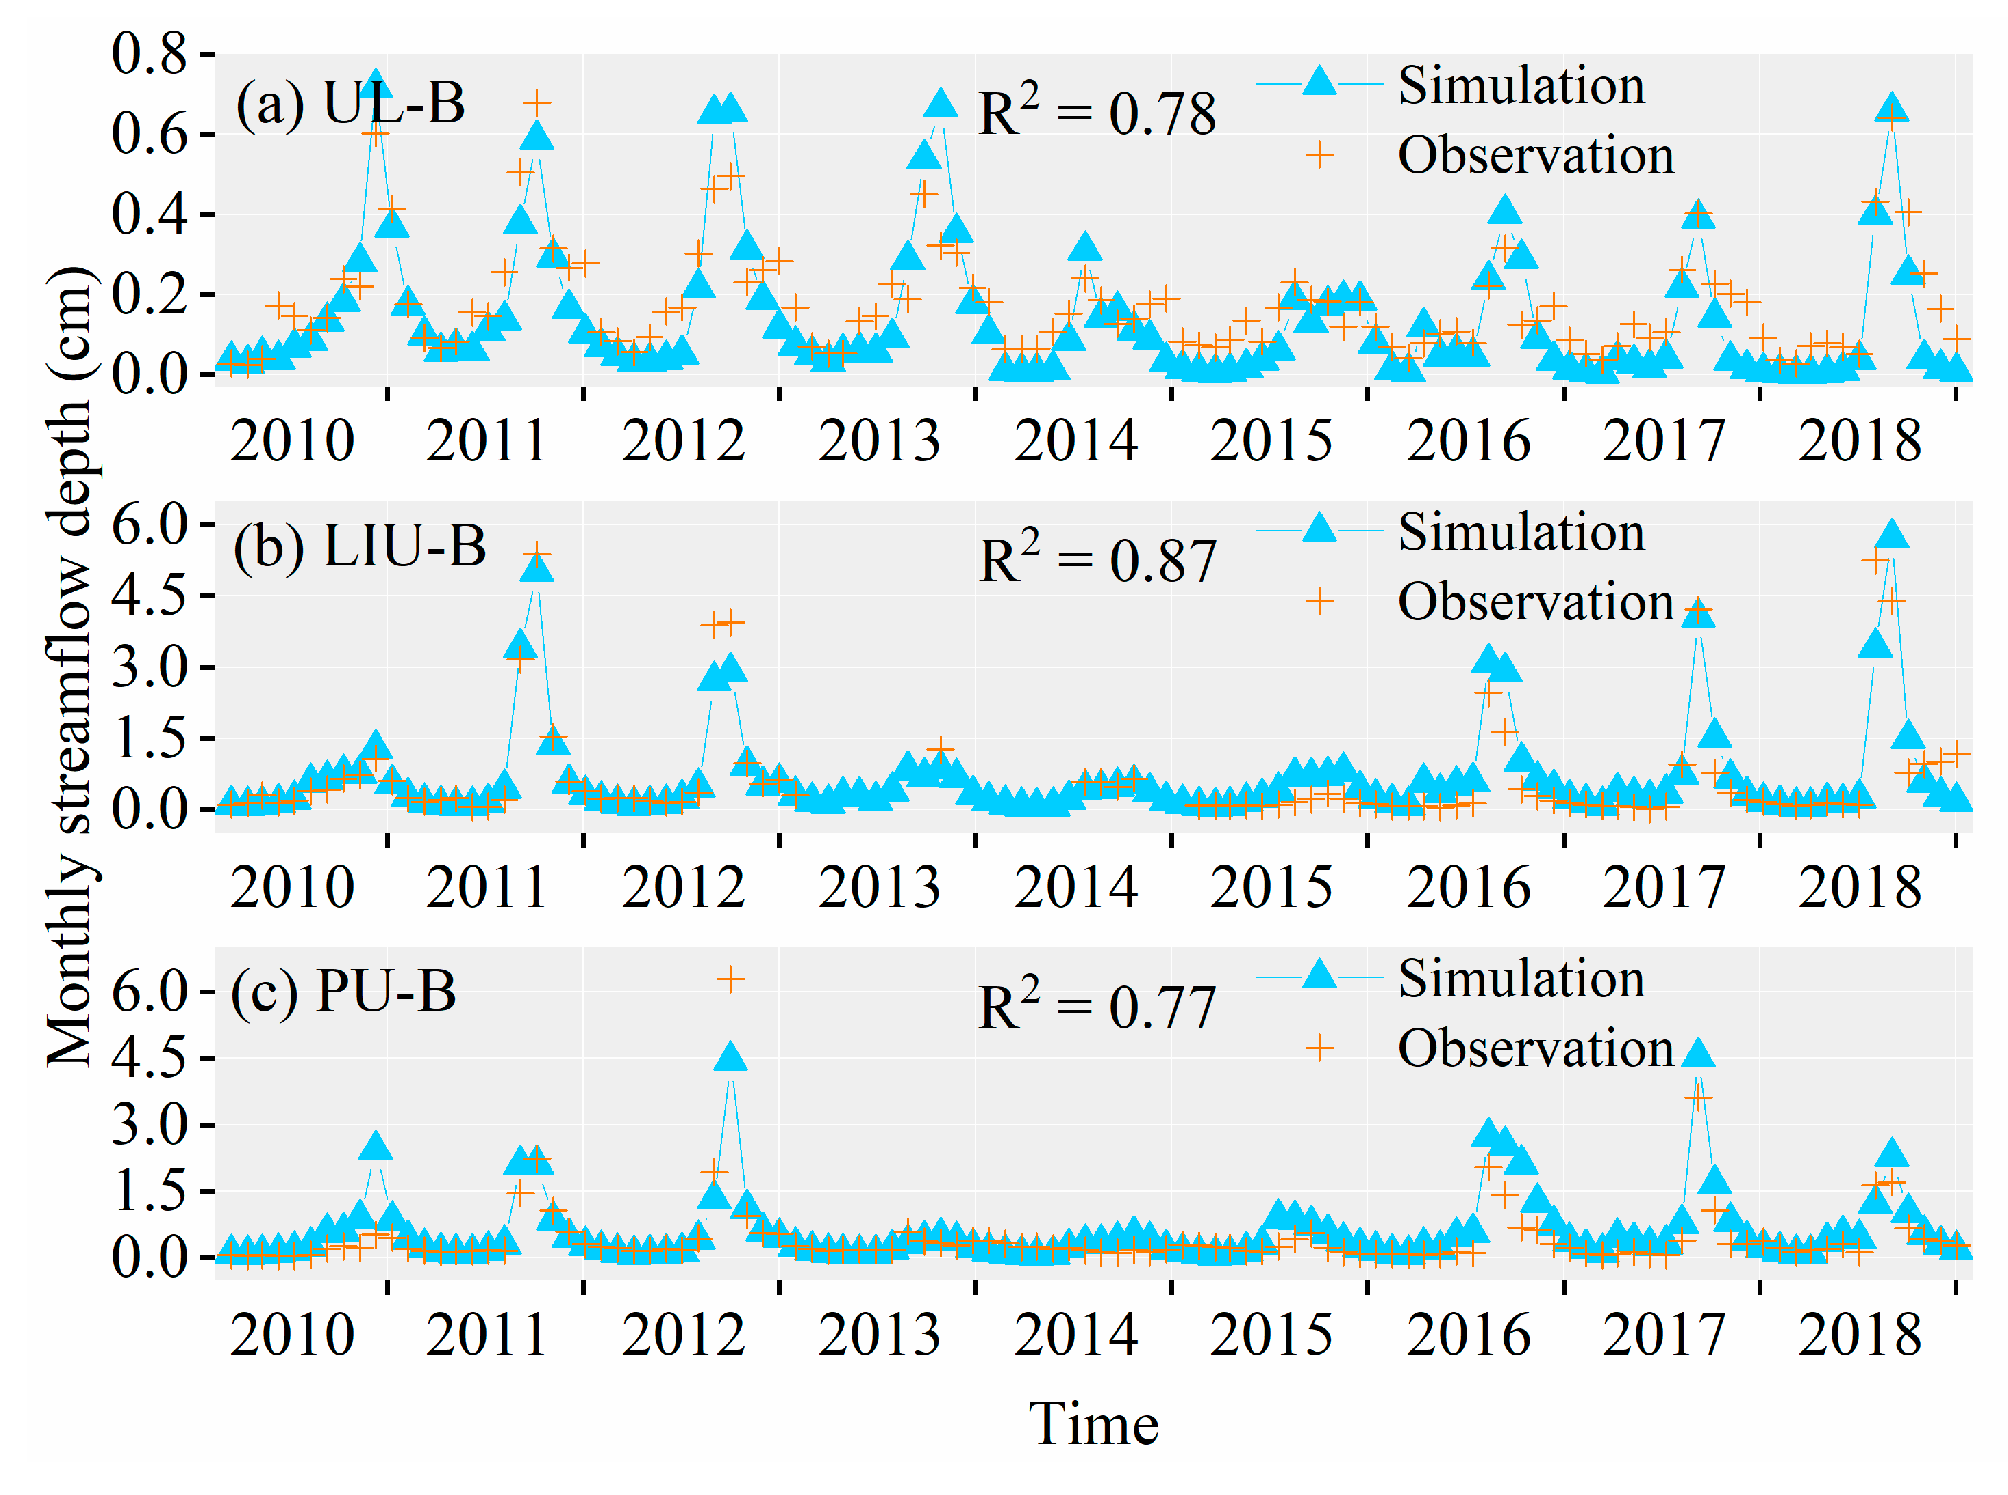
The ReNuMa model is employed to trace nitrogen and phosphorus sources within the PJK watershed. This watershed is delineated into four sub-watersheds: the UL-B, Liu-B, PU-B, and PJK-AB. Initially, the hydrological module of the ReNuMa model is utilized to simulate the monthly runoff for the UL-B, Liu-B, and PU-B sub-watersheds. As illustrated in Figure 8, the coefficients of determination (R2) for the simulated and observed runoff depths of the UL-B, Liu-B, and PU-B are 0.78, 0.87, and 0.77, respectively, indicating a high level of simulation accuracy. These hydrological simulation results, along with the parameters of the hydrological module, provide a robust foundation for simulating nitrogen and phosphorus nutrient loads.
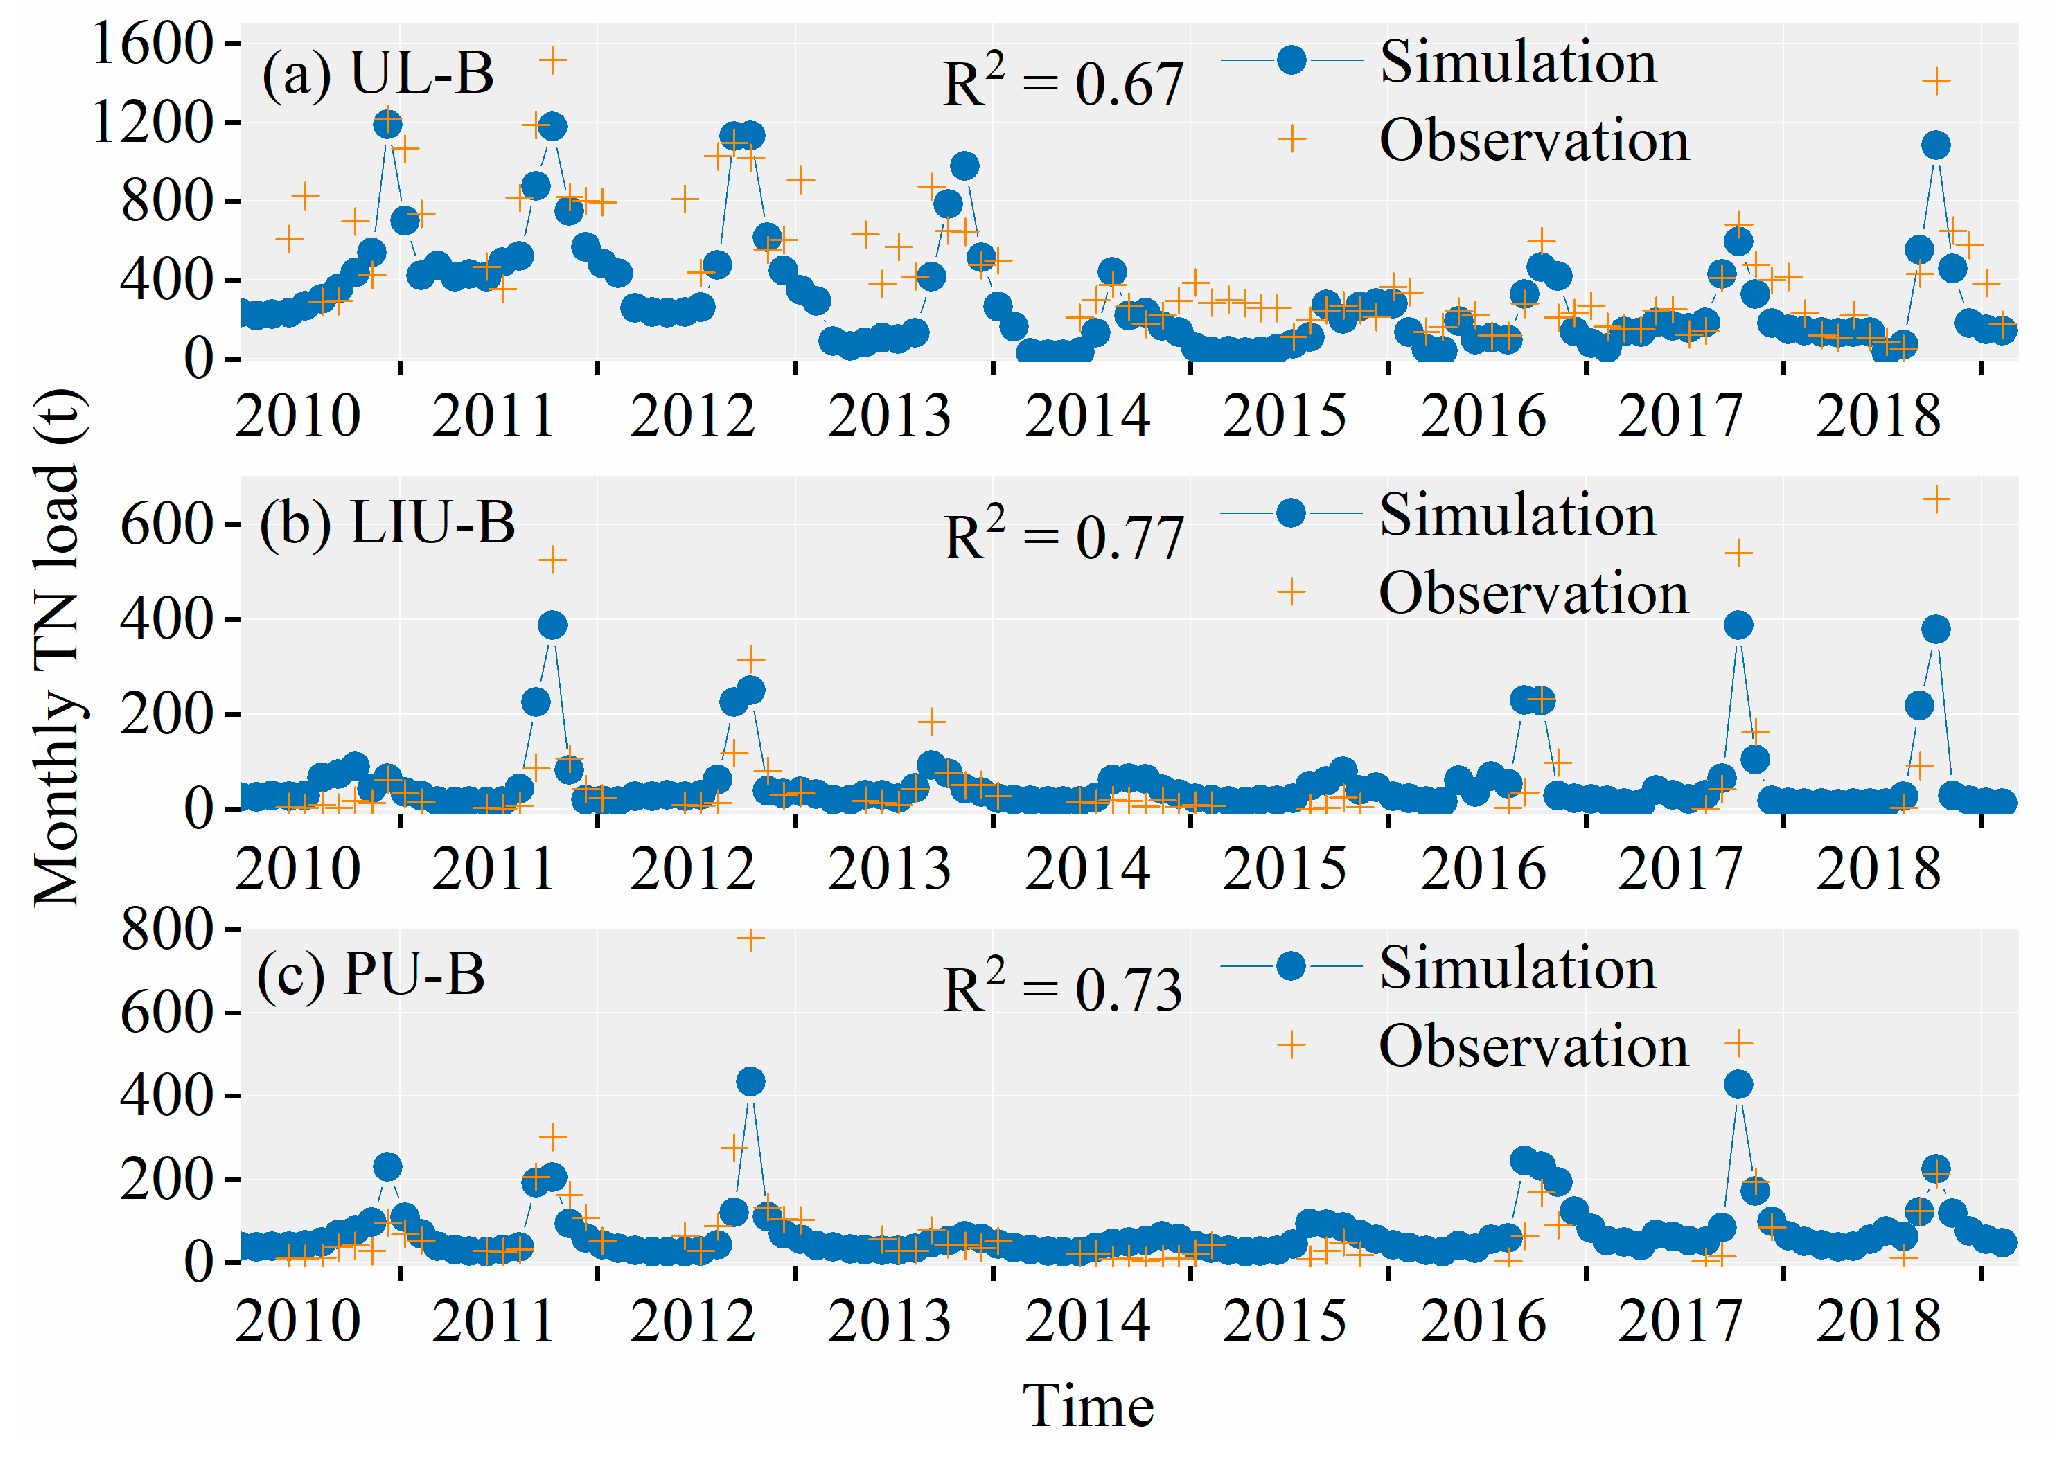
By fixing the hydrological parameters of each sub-model and employing the nutrient module of the ReNuMa model, the monthly TN load for the UL-B, Liu-B, and PU-B is further simulated, with the results presented in Figure 9. The simulation accuracies (R2) for total monthly nitrogen loads in the UL-B, Liu-B, and PU-B are 0.67, 0.77, and 0.73, respectively, reflecting relatively good simulation accuracy. The lowest accuracy is observed in the UL-B, which may be closely linked to its larger watershed area. A larger watershed area introduces a degree of uncertainty in meteorological, hydrological, socioeconomic, and pollution source data; such uncertainties can propagate into the simulation results, thereby diminishing accuracy. The TN tracing results for the PJK-AB are derived by integrating the TN ReNuMa model parameters of the Liu-B with the characteristic attribute data for the PJK-AB.
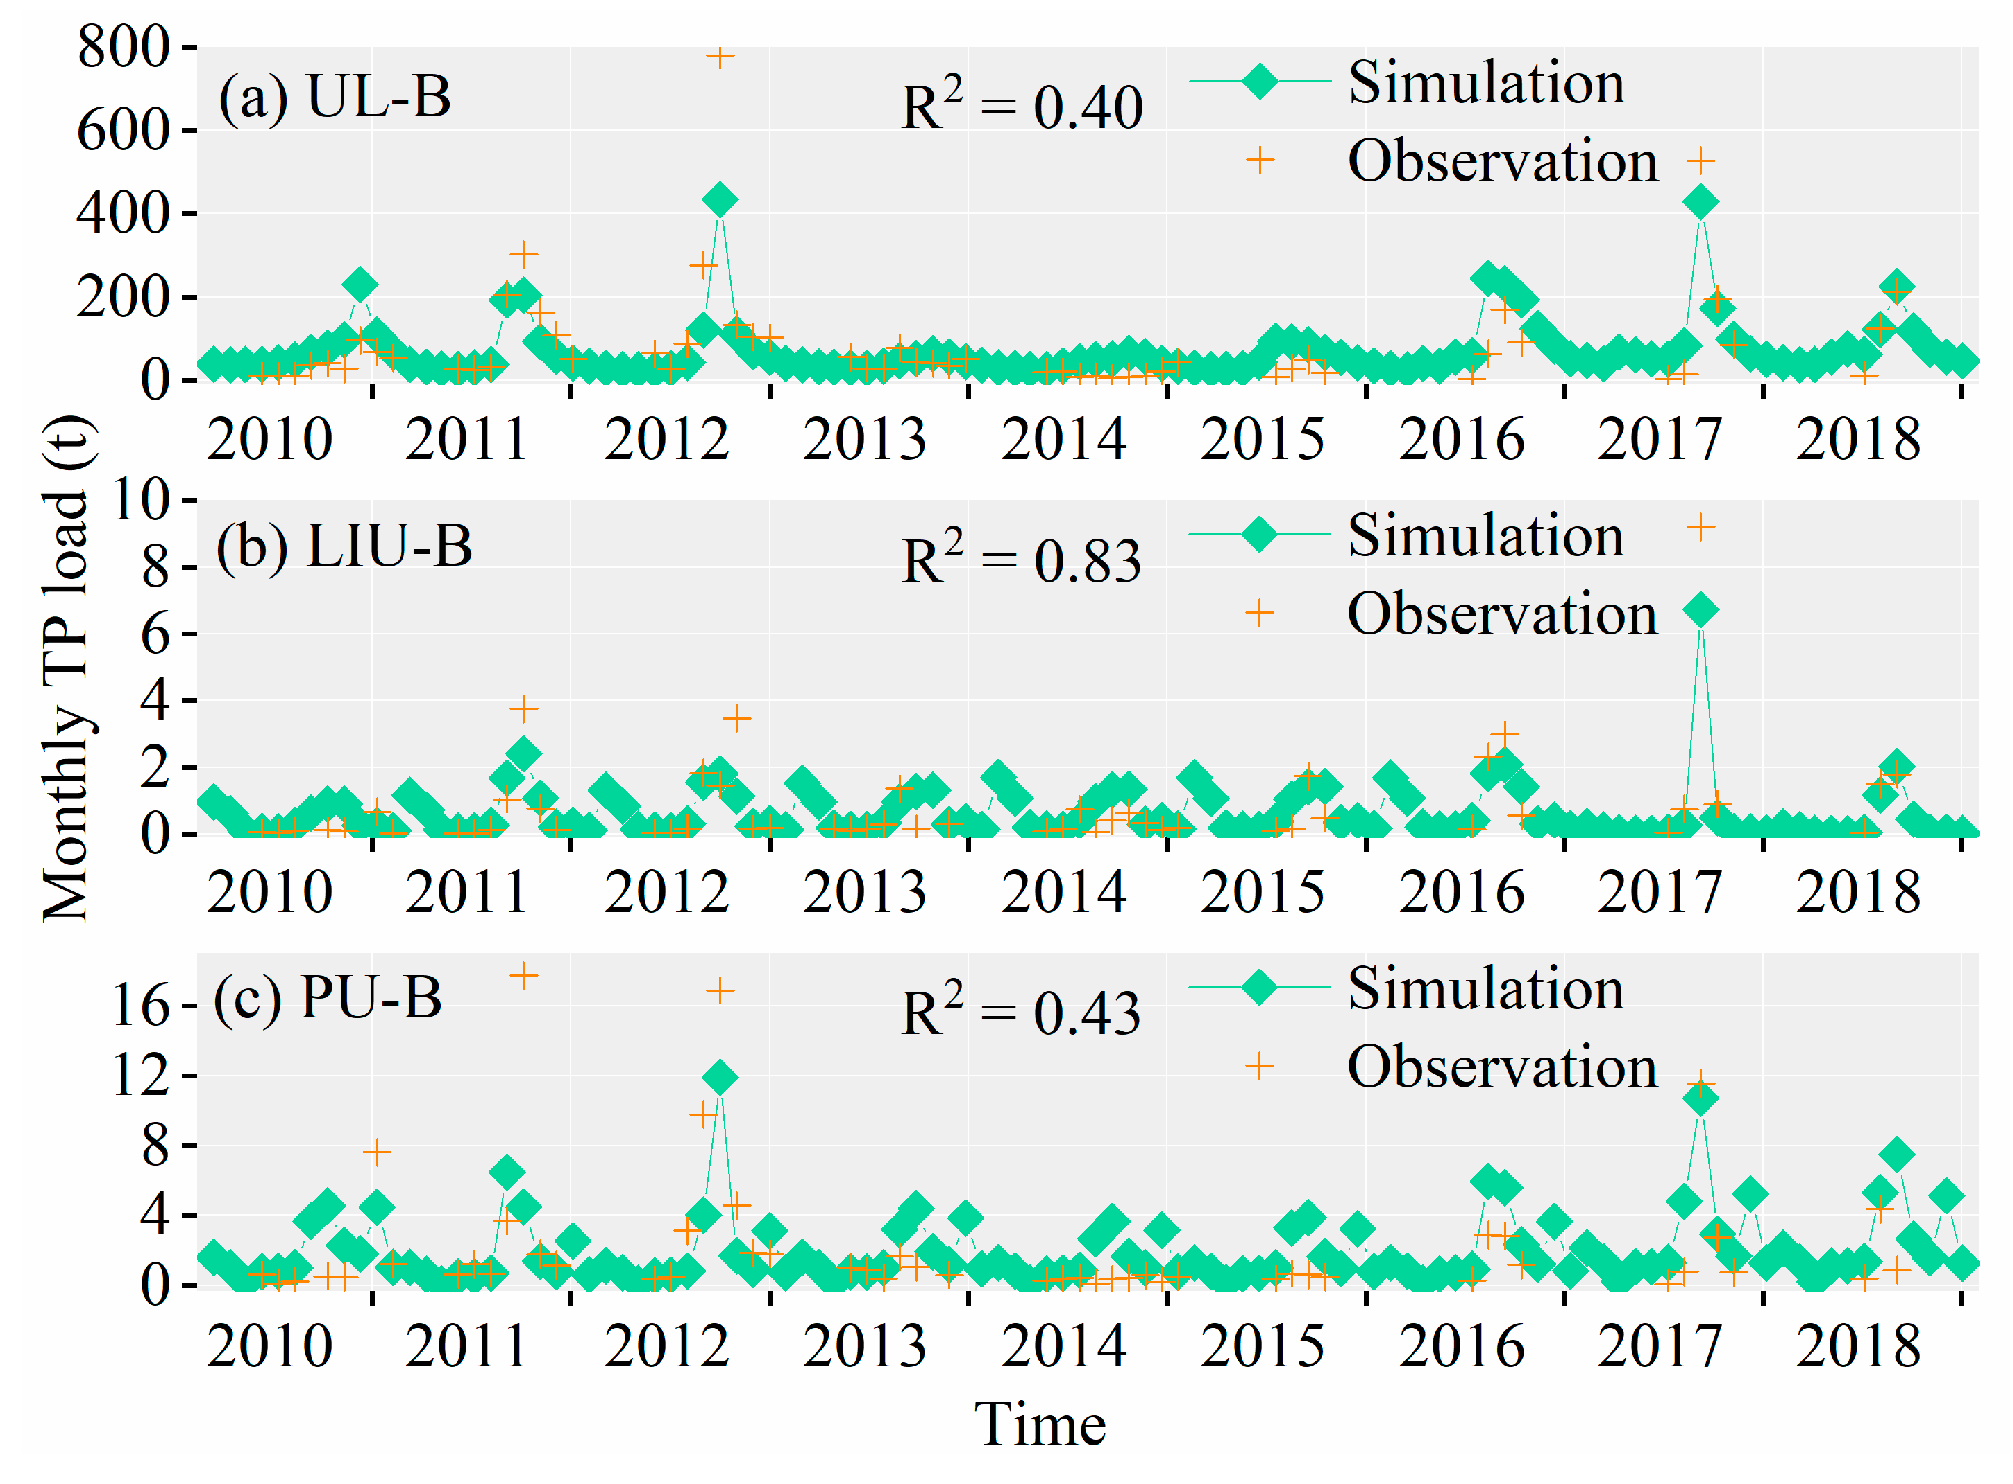
Moreover, by fixing the hydrological parameters of each sub-model, the monthly TP load for the UL-B, Liu-B, and PU-B can also be simulated using the nutrient module of the ReNuMa model, with the results shown in Figure 10. The simulation accuracies (R2) for the monthly TP loads in the UL-B, Liu-B, and PU-B are 0.40, 0.83, and 0.43, respectively, which are considered acceptable. Although the simulation accuracies for the UL-B and PU-B are relatively low, Figure 10 shows that the simulated results generally reflect the long-term trends of TP loads. Consequently, these simulation results serve as a reference for TP tracing. For the TP tracing results of the PJK-AB, it is only necessary to combine the TP ReNuMa model parameters for the Liu-B with the characteristic property data for the PJK-AB.

3.3.2. Simulation Results of DHT Watershed

The ReNuMa model is similarly applied to trace nitrogen and phosphorus nutrients within the DHT watershed. The external sources of the DHT consist of three components: water inflow from the Xiachi reservoir (XC), the SA-B, and the DHT-AB. Because XC, located between the PJK and DHT watersheds, has a very small naturally contributing watershed area (Figure S1), this study does not include nitrogen and phosphorus nutrient tracing for the natural watershed surrounding XC, assuming that the nitrogen and phosphorus nutrients entering the DHT from XC are entirely derived from the internal sources of the PJK and XC.
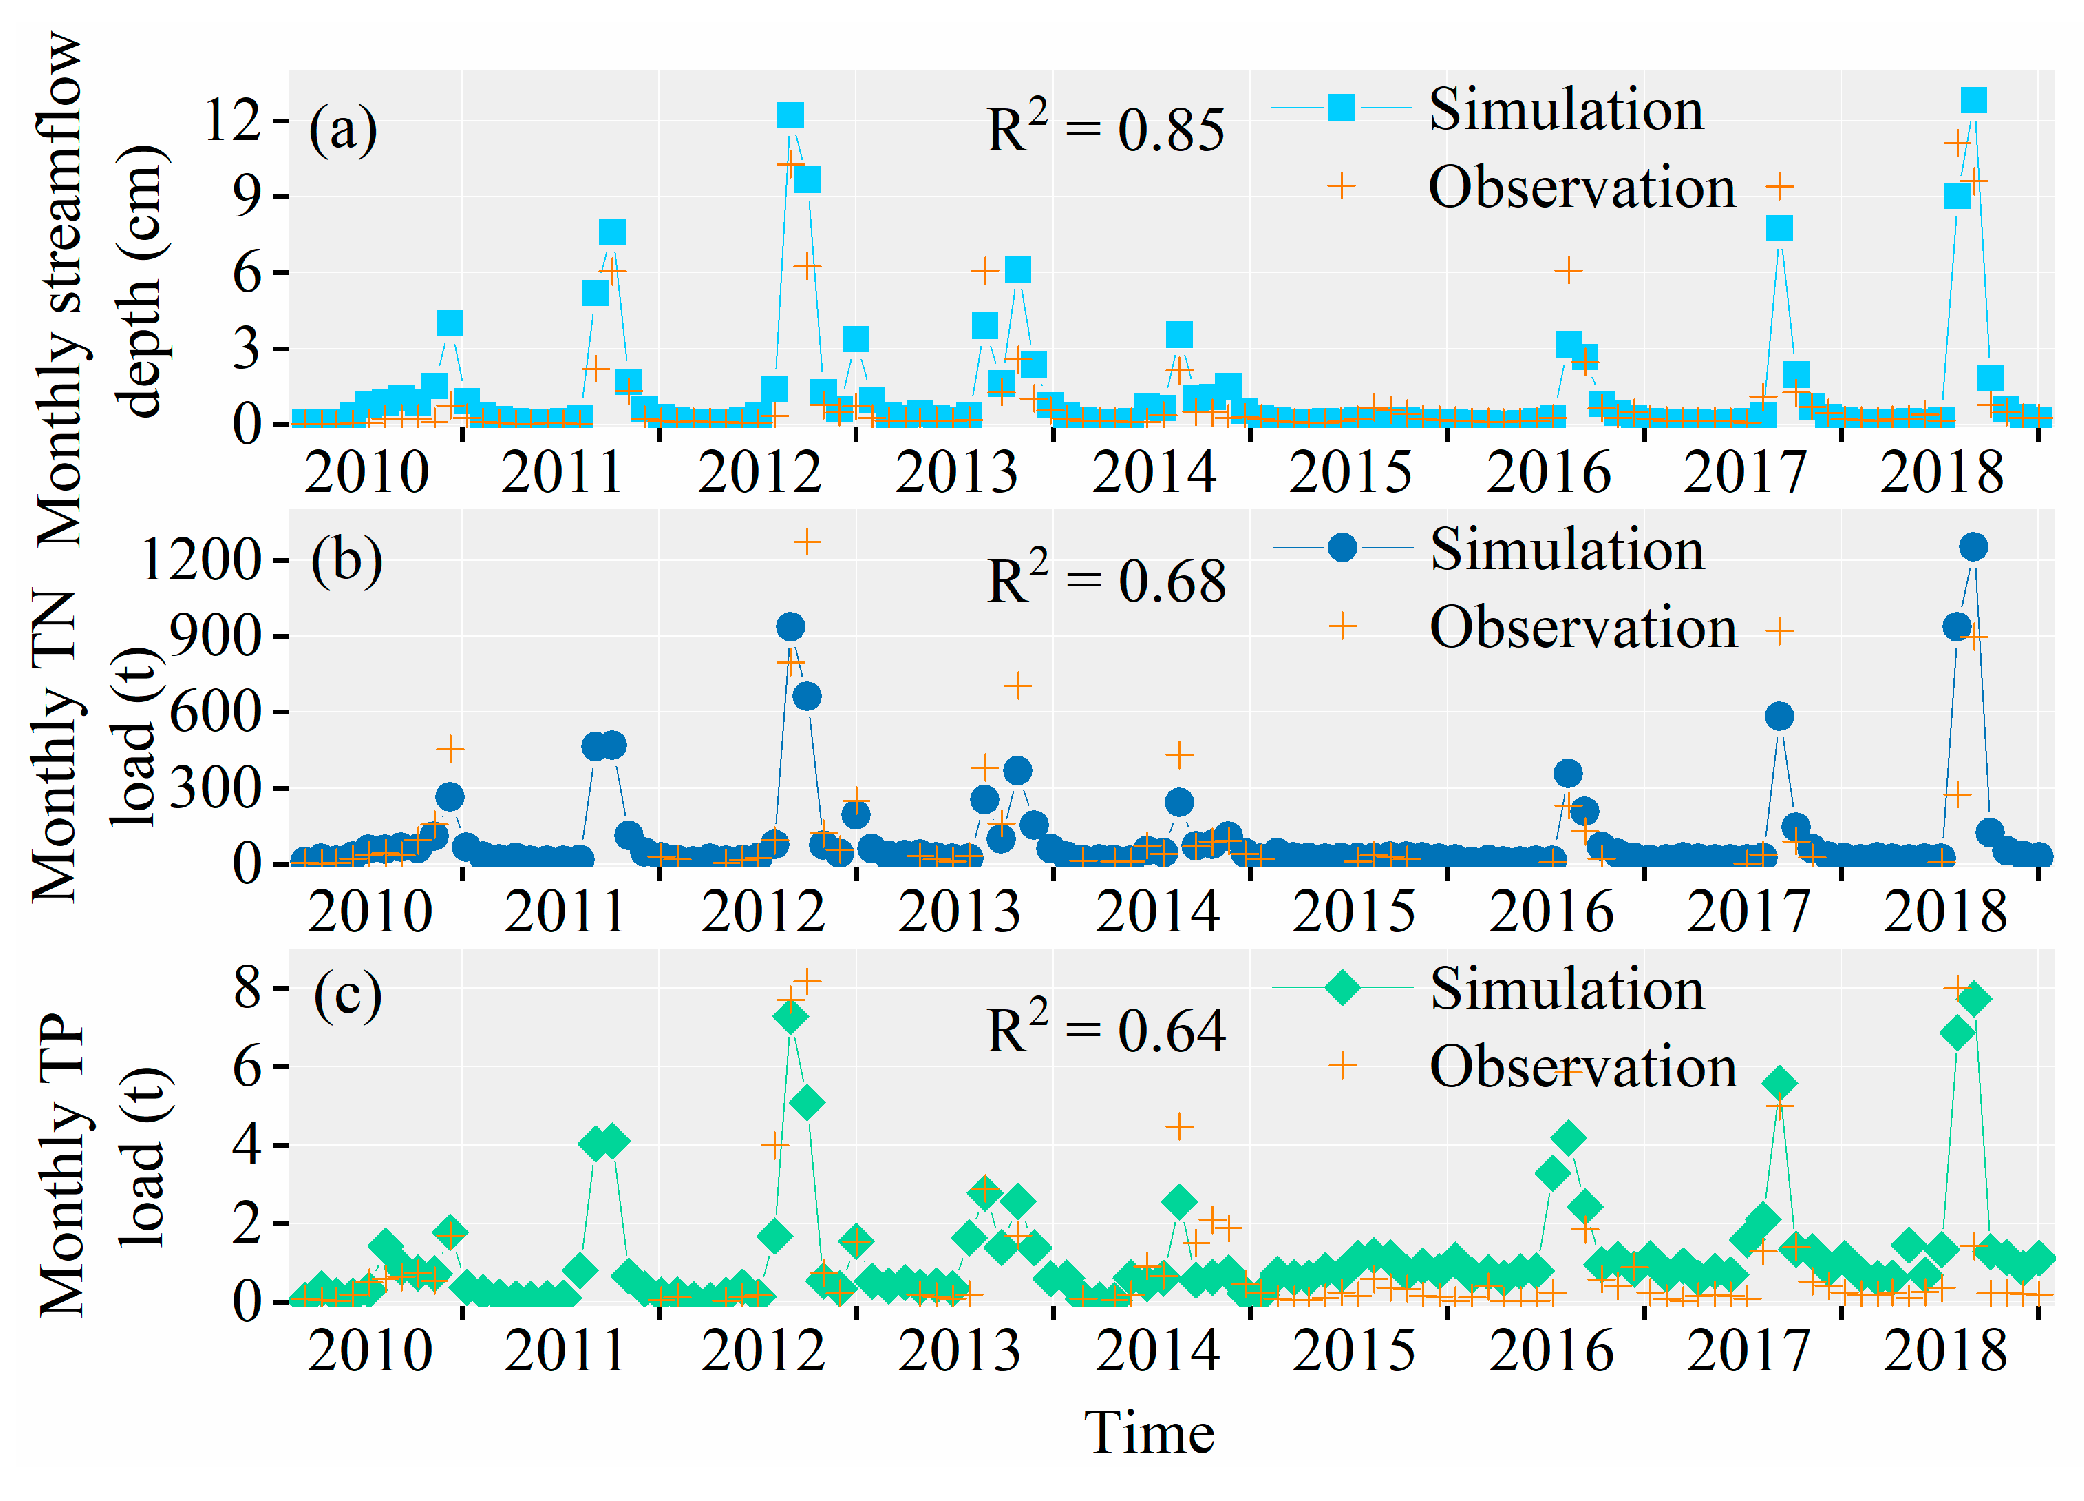
A specific ReNuMa model for the SA-B has been developed. Initially, the hydrological module is employed to simulate the monthly runoff depth of the Sahe River, with the results presented in Figure 11a. Compared to the observed values, the simulation accuracy (R2) achieved is 0.85, indicating high accuracy. Subsequently, by fixing relevant parameters in the hydrological module of the ReNuMa model, the monthly TN and TP loads for the SA-B are further calibrated. The simulation results for the monthly TN and TP loads are displayed in Figure 11b and c, showing simulation accuracies of 0.68 and 0.64, respectively. These accuracies are deemed acceptable, and the simulation results largely reflect the long-term trends of nitrogen and phosphorus nutrient variations within the SA-B, suggesting that the established ReNuMa model can serve as a foundation for subsequent nitrogen and phosphorus tracing. To derive the nitrogen and phosphorus tracing results for the DHT-AB, it is only necessary to integrate the ReNuMa model parameters for the SA-B with the relevant characteristic attribute data for the DHT-AB.

3.3.3. Simulation Results of YQ Watershed

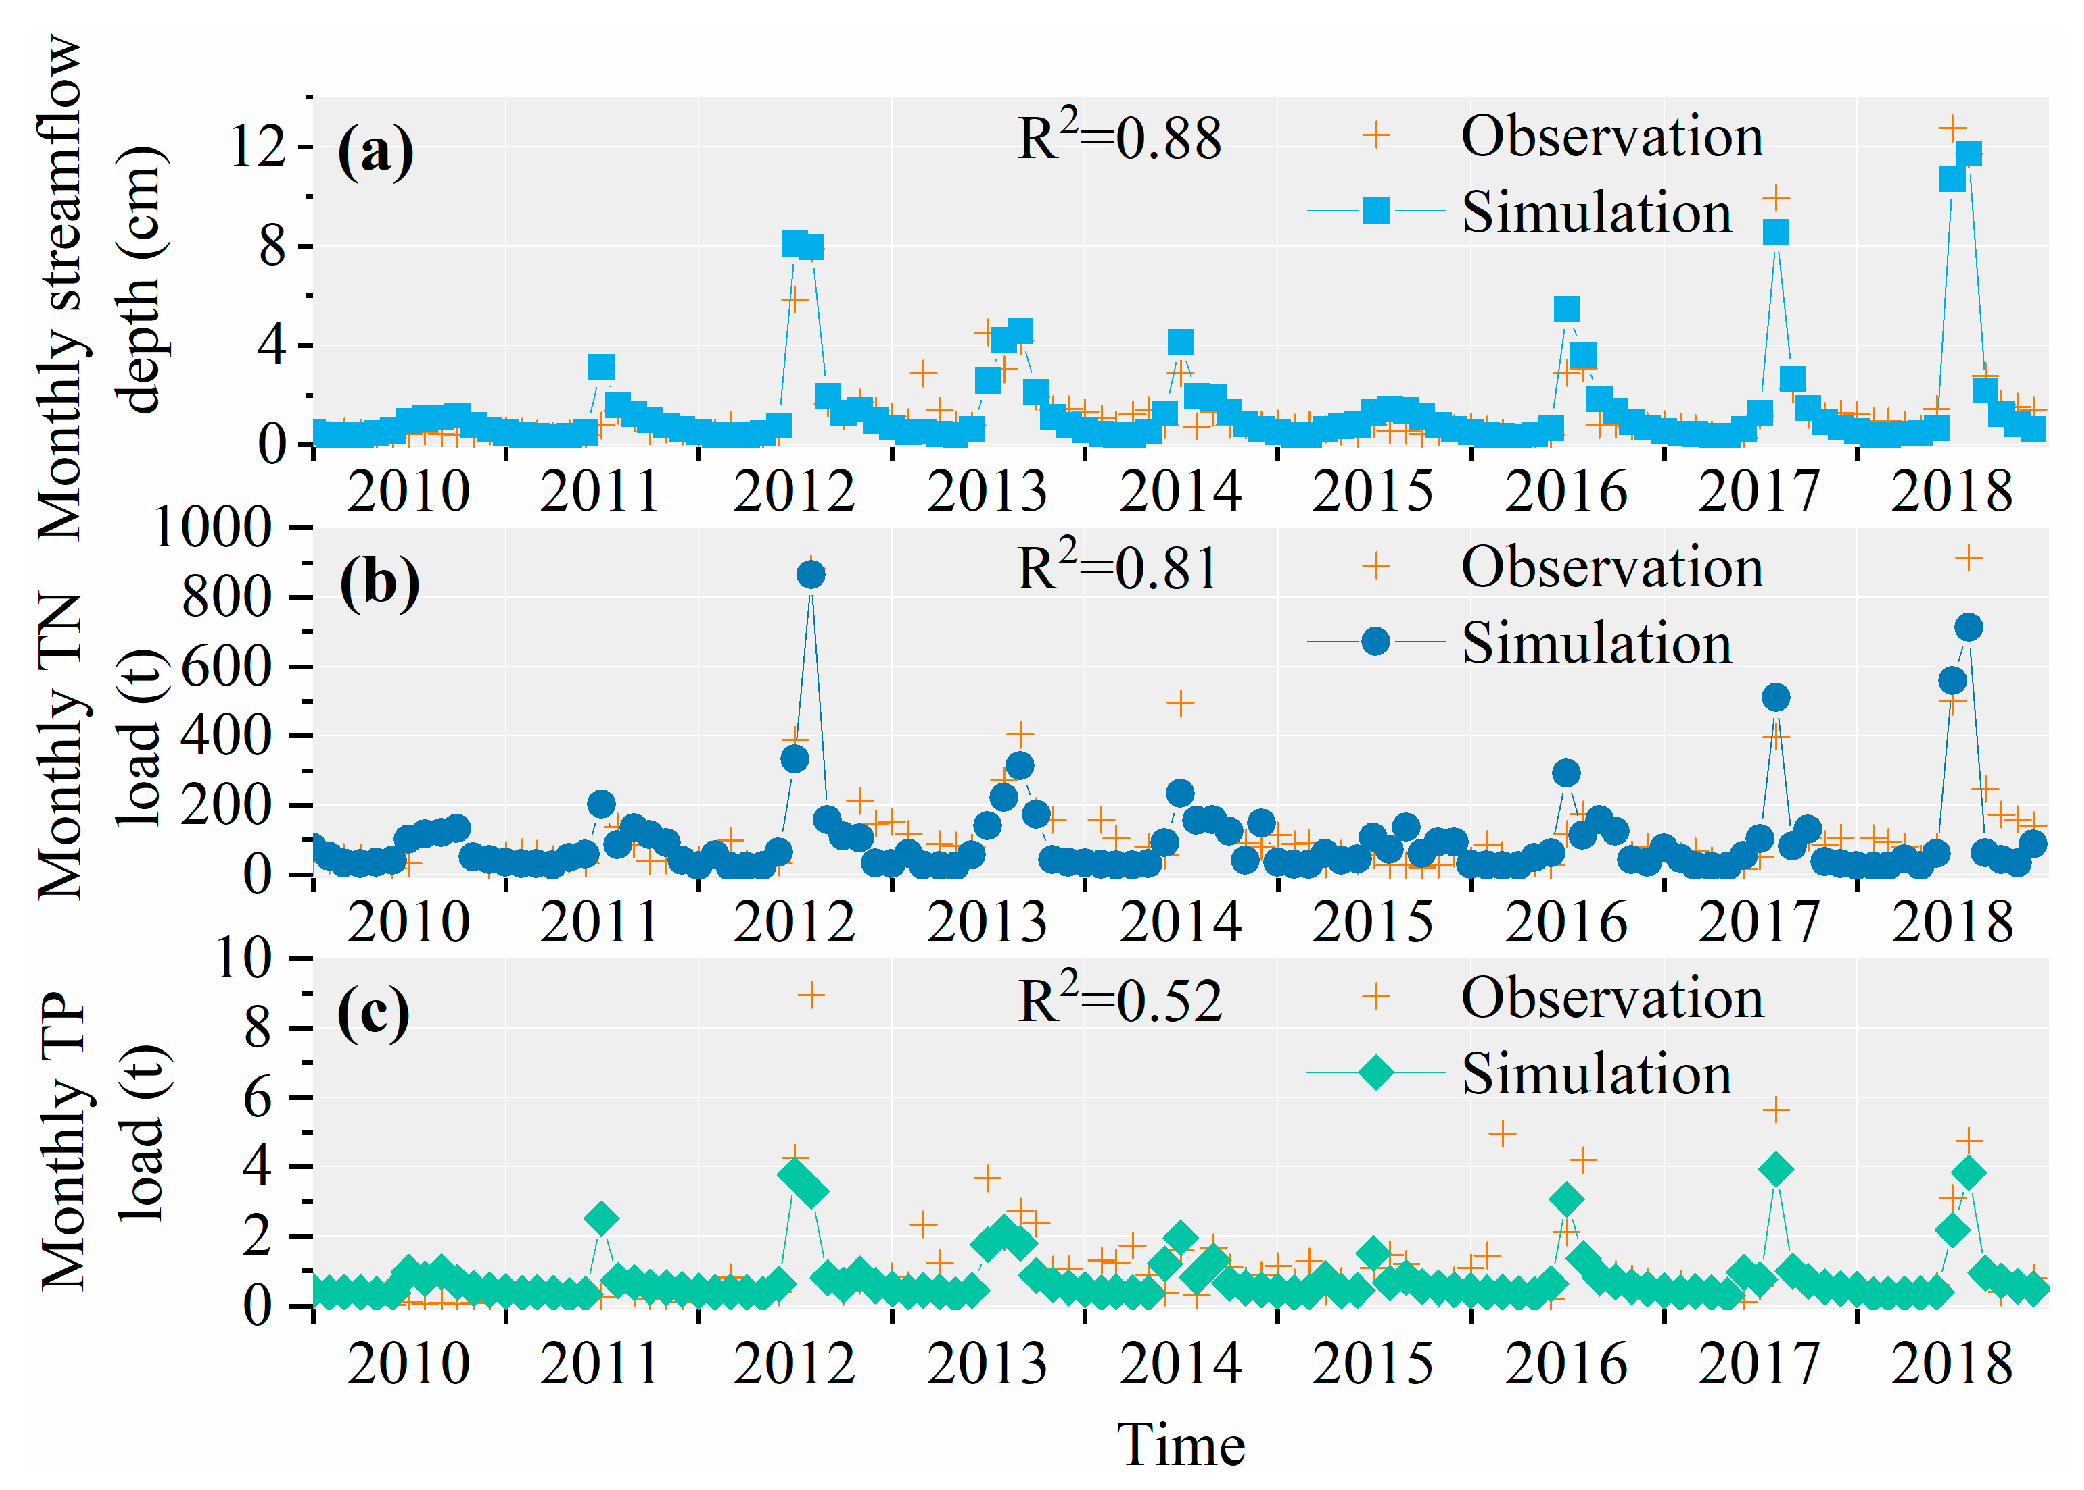
To verify the feasibility of simulating multi-year nitrogen and phosphorus loads in the YQ watershed, the ReNuMa model was established using monitoring data on flow, TN, and TP at the SHA-B from 2010 to 2018. The monthly runoff depth at the SHA-B was simulated (Figure 12a), yielding an R2 value of 0.88 for the monthly streamflow depth simulation from 2010 to 2018. This indicates that the constructed ReNuMa model effectively simulates monthly streamflow depth. Using the calibrated water quantity parameters, the nutrient module of the ReNuMa model was next employed to simulate monthly TN and TP loads. According to the simulation results (Figure 12a,b), R2 values of 0.81 and 0.52 were obtained for monthly TN and TP loads at the SHA-B from 2010 to 2018, respectively, suggesting that the simulation results from the ReNuMa model for these loads are acceptable in terms of accuracy.
Due to significant human disturbances, the surface runoff in the LI-B, LIN-B, and YQ-AB sub-watersheds does not exhibit a clear pattern. In particular, surface runoff in the Linhe River and YQ-AB is predominantly zero, with significant runoff occurring only during heavy rainfall events, while the Lihe River experiences increased flow rates during the water diversion period of the Luanhe River. Consequently, in this study, parameters yielded from the ReNuMa model calibrated with SHA-B data will be applied to the ReNuMa models for the LI-B, LIN-B, and YQ-AB to address calibration and simulation challenges in these areas. This approach will subsequently yield annual TN and TP loads for the LI-B, LIN-B, and YQ-AB from 2010 to 2018.
In this study, the parameter transfer characteristics of the ReNuMa model were utilized to establish nutrient load models for several sub-watersheds with limited data. While the parameter transfer approach may introduce systematic errors in the nutrient simulations for these sub-basins, the overall reliability of the simulation results remains superior compared to traditional empirical estimation methods, as it facilitates objective calculations under various conditional constraints.

4. Discussion

4.1. The Flux Analysis of Reservoir Biochemical Processes

4.1.1. Seasonal Flux of PJK

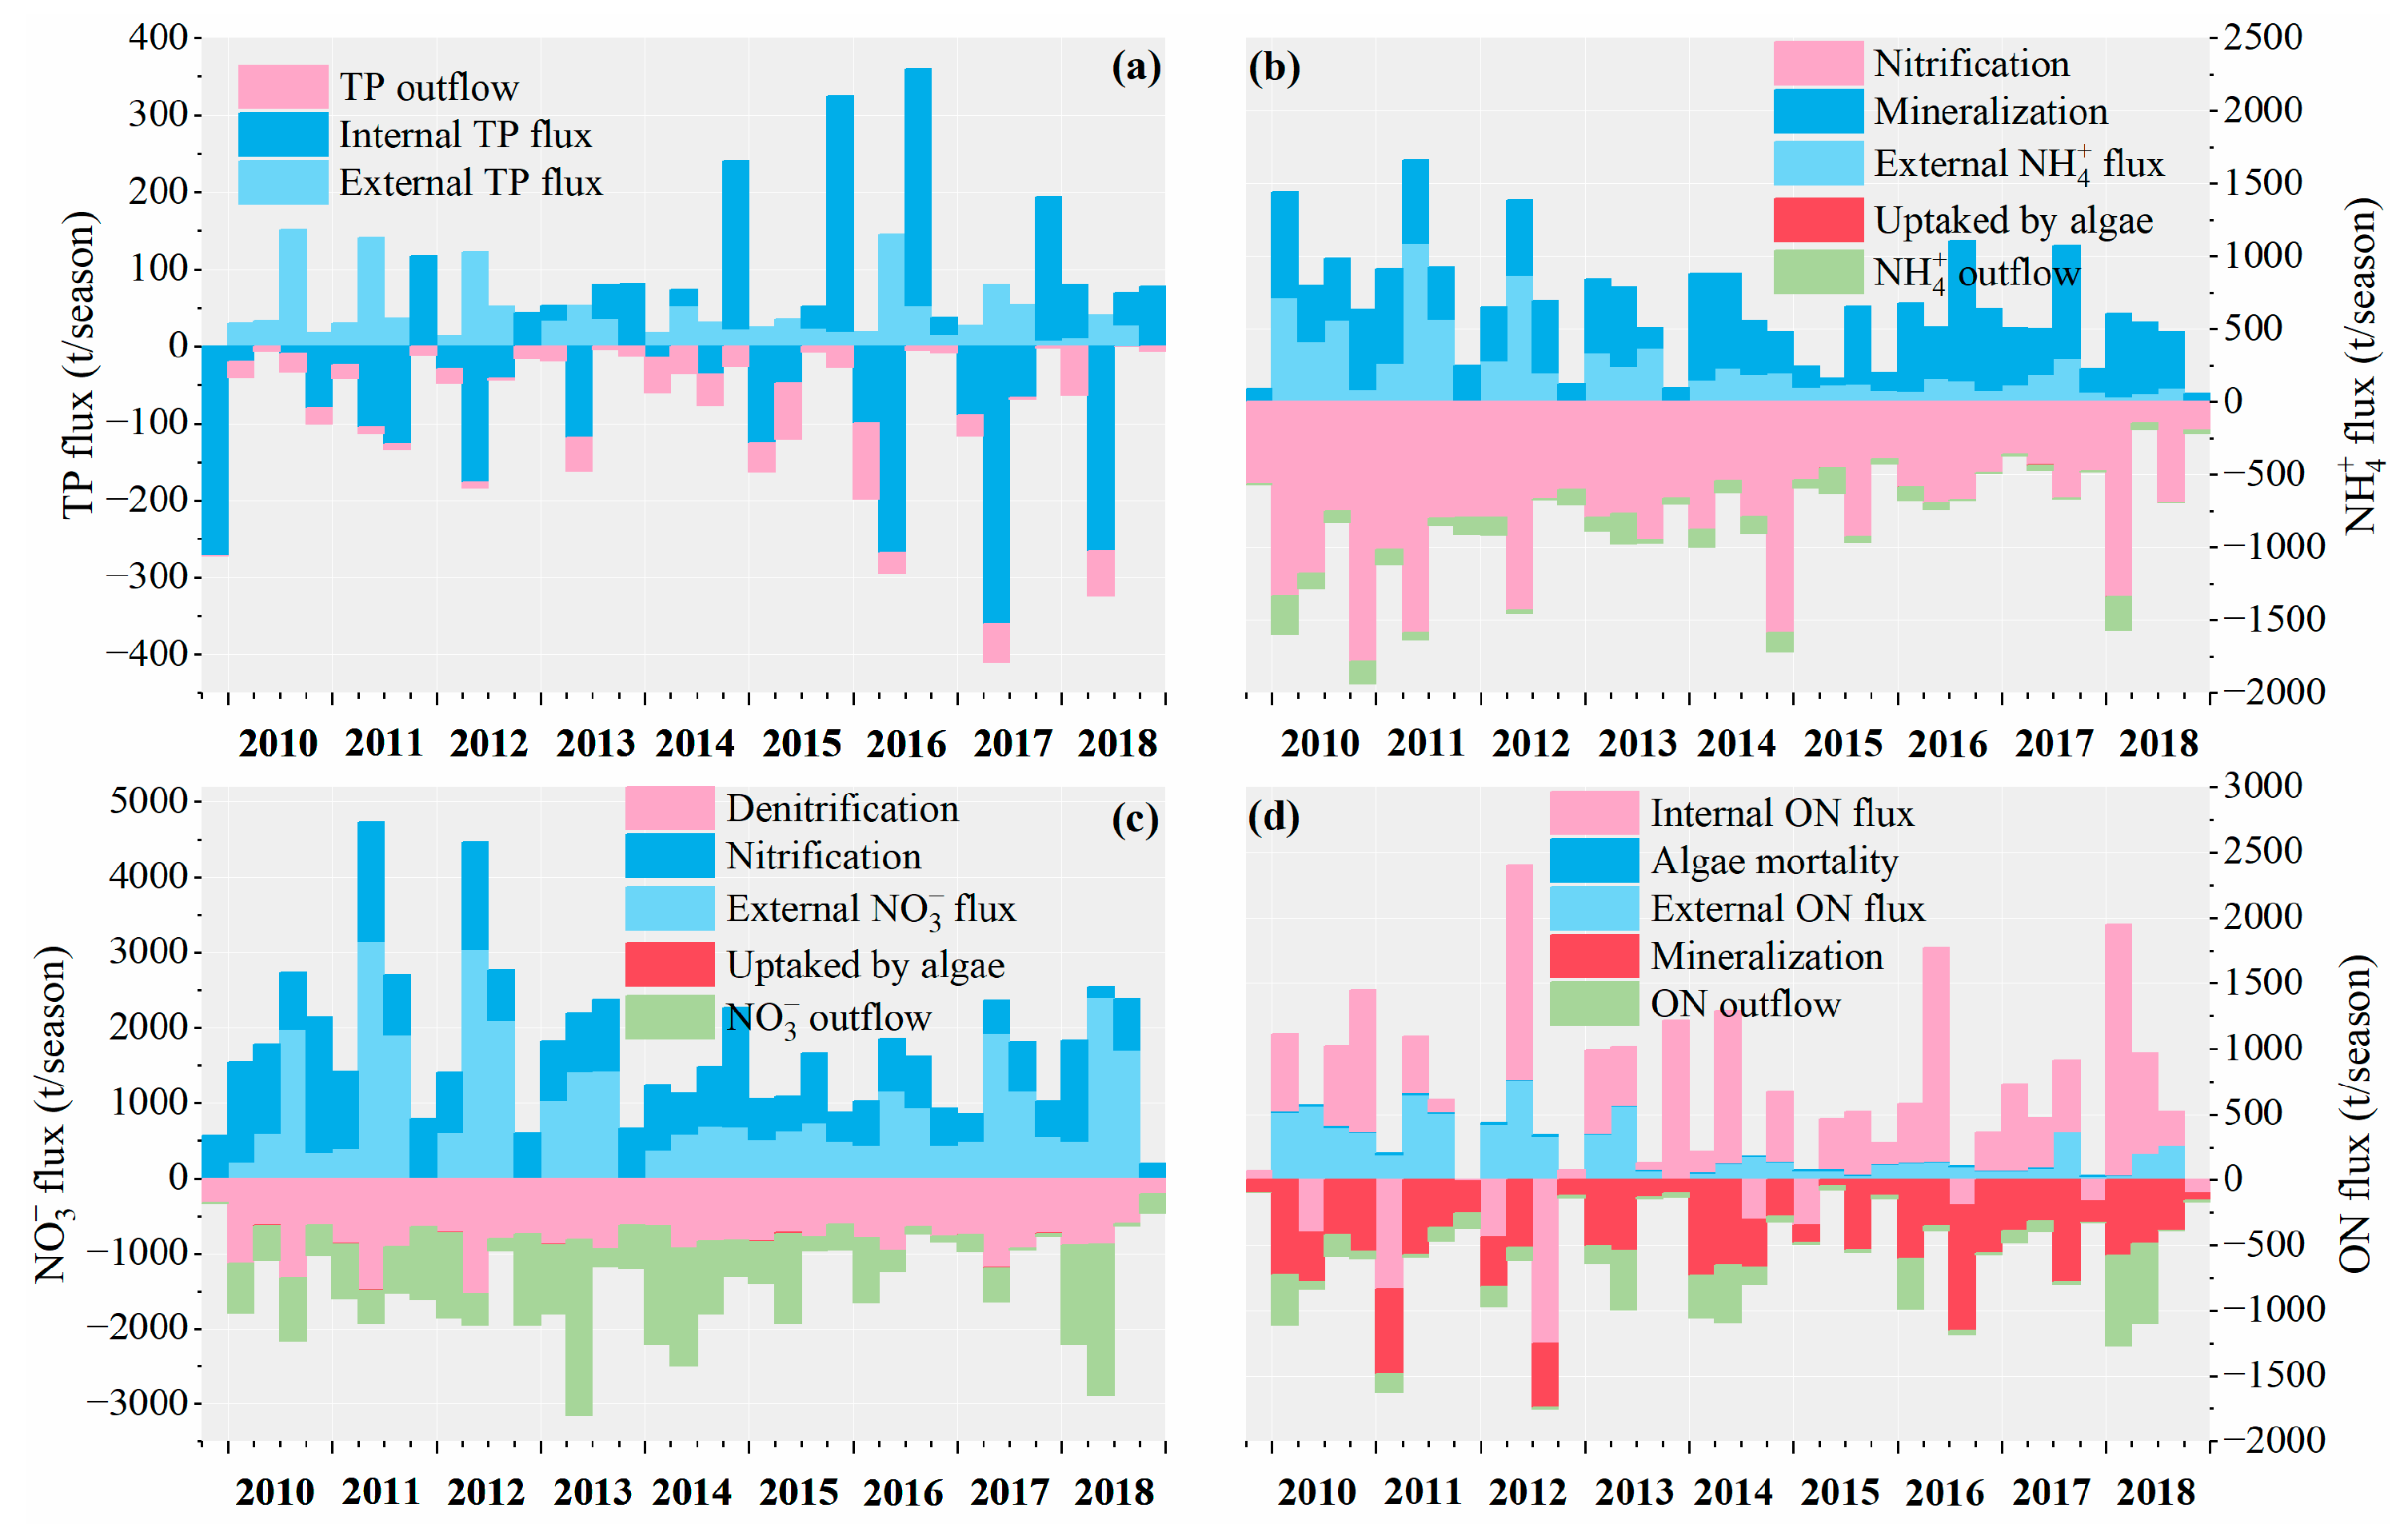
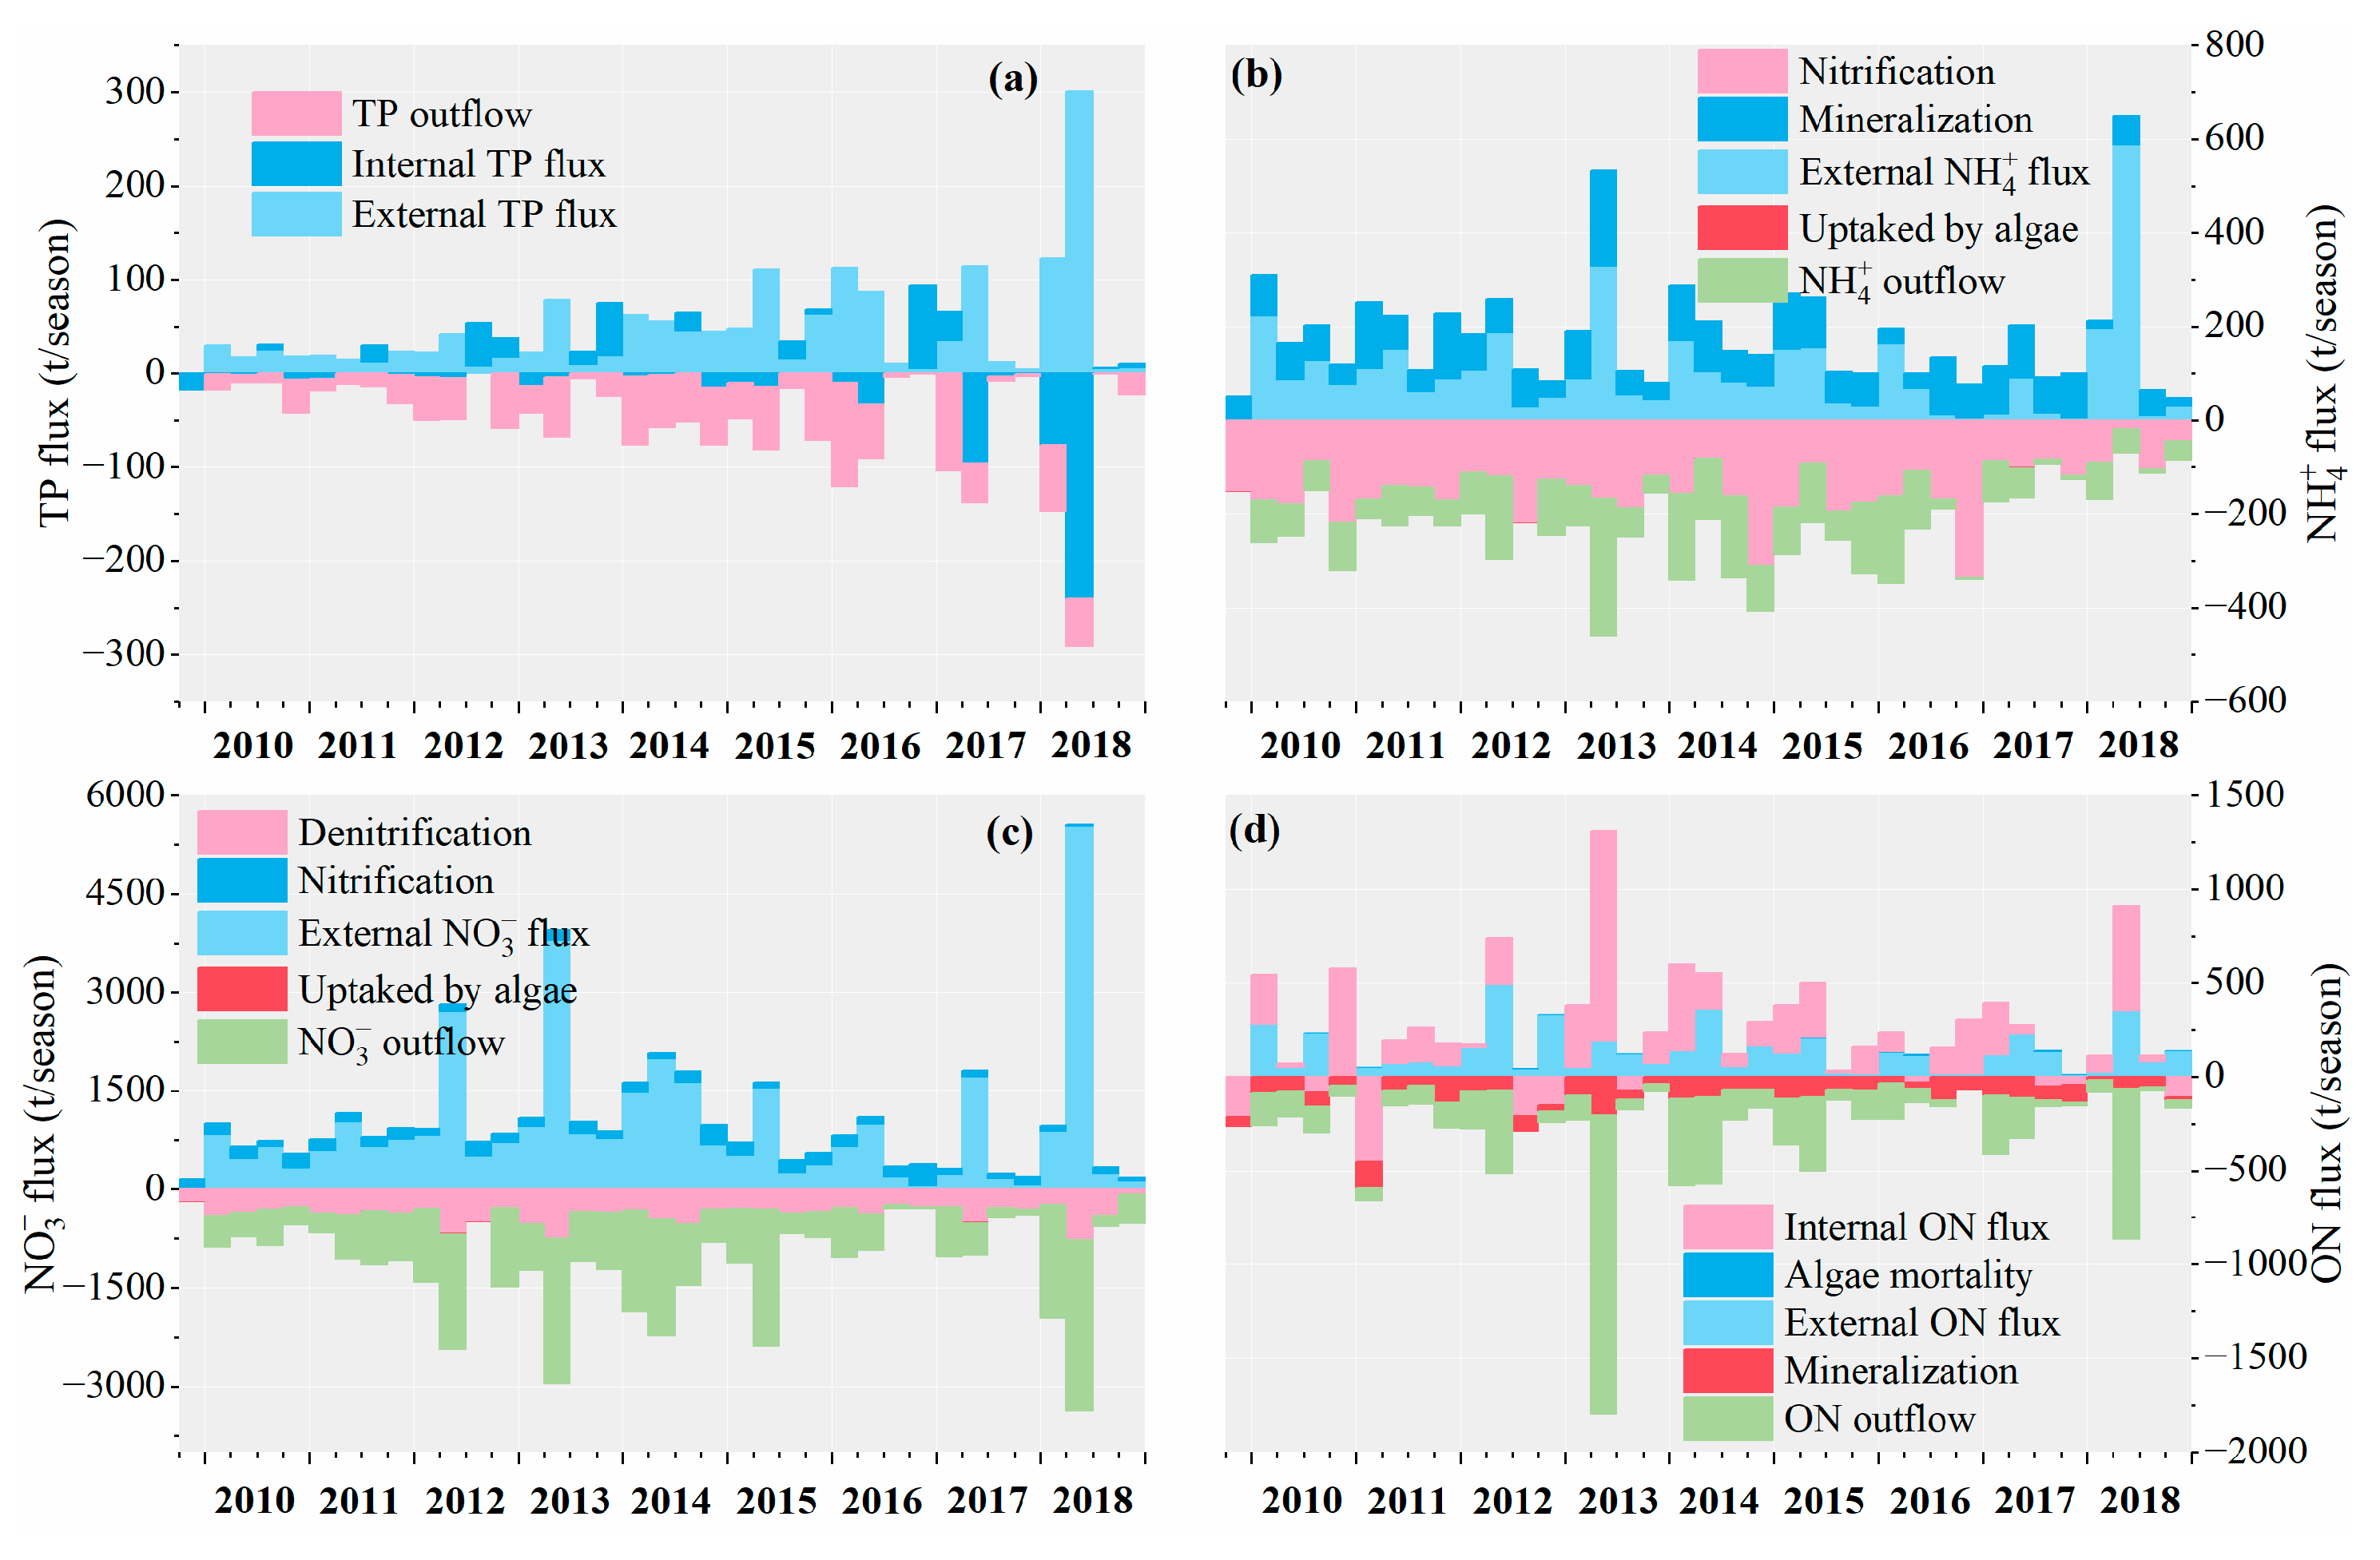
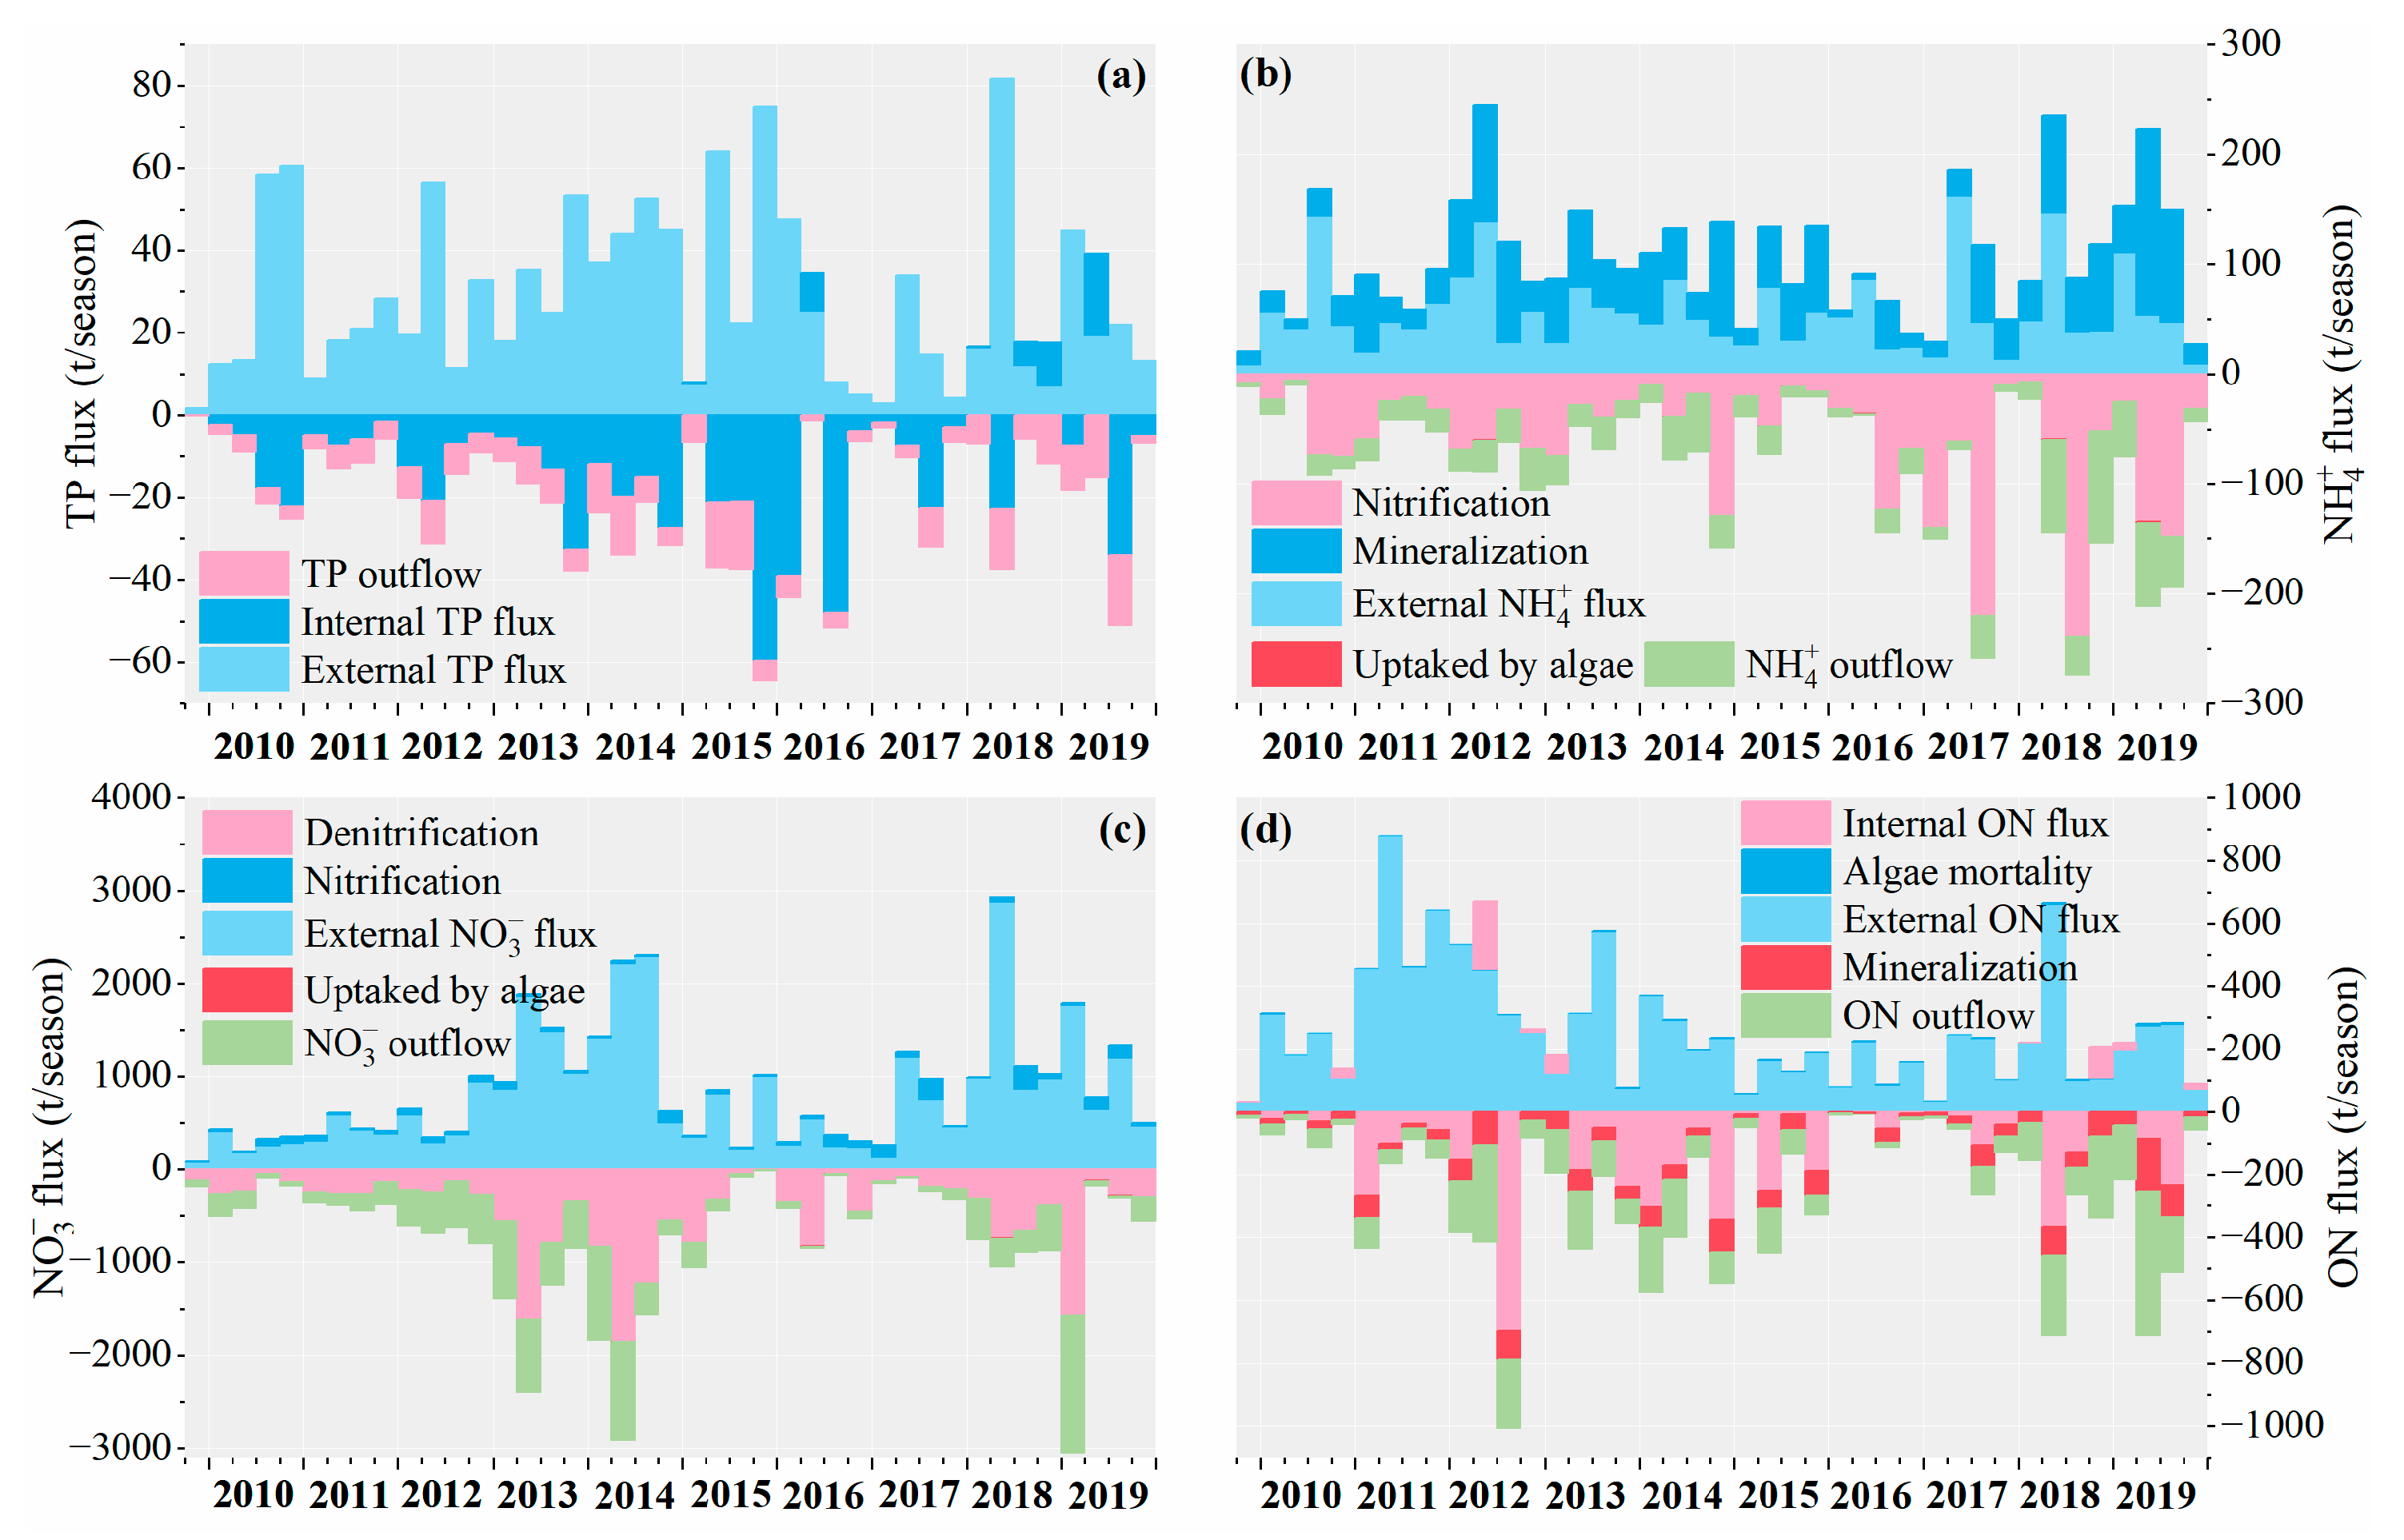
The IHBLMs provided the monthly flux of biochemical processes. However, the biochemical processes based on nitrogen, phosphorus, and algae in reservoirs are a subset of the aquatic ecosystem. Due to the laws or mechanisms of certain functions in the ecosystem, there may be differences at different temporal scales [42,43]. Therefore, here, the monthly fluxes of the simulation results are summarized as seasonal fluxes (Figure 13). And the monthly flux and annual flux are provided in the Supplementary Materials.
(1)
Total Phosphorus Flux
In the seasonal flux of TP (Figure 13a), all three components (outflow, internal sources, and external sources) exhibit distinct seasonal characteristics. The TP outflow demonstrates an overall trend of initial increase followed by a subsequent decrease during the simulation period, with a noteworthy breakpoint occurring in the winter of 2015. The peak TP outflow was observed in spring 2016, reaching a maximum of 98.4 t/season. In contrast, the external TP load exhibits a general declining trend, although a notable increase is recorded during the summer of 2016. The highest external TP load was documented in autumn 2010, with a maximum value of 152 t/season. The dynamic of internal TP loads varies across different years; during periods when internal TP acts as a source, the strength of this source shows an increasing trend from 2010 to 2016, followed by an annual decline. This decline may be attributed to the implementation of comprehensive bans on aquaculture in reservoir cages post-2017. The maximum source strength of internal TP was observed in autumn 2016, reaching 307 t/season. Conversely, when internal TP acts as a sink, the sink strength demonstrates an overall increasing trend throughout the simulation period, with the maximum sink strength occurring in summer 2017, at 361 t/season.
(2)
Ammonia Nitrogen Flux
In the seasonal flux of ammonia nitrogen (Figure 13b), the external ammonia nitrogen load, nitrification flux, and ammonia nitrogen outflow generally exhibit a declining trend, whereas the mineralization flux and ammonia nitrogen uptake by algae remain stable overall, despite displaying certain seasonal patterns. The maximum external ammonia nitrogen load was recorded at 1093 t/season in summer 2011. The nitrification flux, which refers to the ammonia nitrogen consumed during nitrification, peaked in winter 2010 at 1786 t/season. The mineralization flux, indicating the increase in ammonia nitrogen due to mineralization, reached its maximum in autumn 2016, totaling 960 t/season. Although the amount of ammonia nitrogen uptake by algae is relatively small, it shows significant seasonal variability, peaking at 2.1 t/season in summer 2015. The maximum ammonia nitrogen outflow was observed in spring 2010, reaching 263 t/season.
(3)
Nitrate Nitrogen Flux
In the seasonal flux of nitrate nitrogen (Figure 13c), the denitrification flux exhibited a decreasing trend year by year throughout the simulation period, peaking at 1534 t/season in summer 2012. Similarly, the nitrification flux, denoting the increase in nitrate nitrogen due to nitrification, also peaked in winter 2010 at 1786 t/season. The external nitrate nitrogen load showed an initial increase followed by a decrease from 2010 to 2015, after which it rose each subsequent year, culminating in a maximum value of 3149 t/season in summer 2011. Nitrate nitrogen uptake by algae is significantly influenced by algal growth, exhibiting marked seasonality, with a peak recorded at 15.1 t/season in summer 2015. The long-term variation pattern of nitrate nitrogen outflow mirrors that of the external load, showing an initial increase followed by a decrease from 2010 to 2016, followed by annual increases thereafter, peaking at 2342 t/season in summer 2013.
(4)
Organic Nitrogen Flux
In the seasonal flux of organic nitrogen (Figure 13d), the amount of organic nitrogen released by algal decay is relatively small and demonstrates significant seasonality, exhibiting an overall declining trend throughout the simulation period, with a higher peak in summer 2015 at 16.3 t/season. The external organic nitrogen load also exhibits a declining trend overall, peaking at 761 t/season in summer 2012. The mineralization flux, representing the consumption of organic nitrogen during mineralization, remains stable across the simulation period. The outflow of organic nitrogen demonstrates an overall increasing trend, with a maximum value of 693 t/season recorded in spring 2018. Internal organic nitrogen predominantly exists in the form of sources, reaching a maximum source strength of 1912 t/season in spring 2018. Conversely, when internal organic nitrogen acts as a sink, its strength declines annually, with a maximum sink strength of 1249 t/season observed in autumn 2012.

4.1.2. Seasonal Flux of DHT

Based on the monthly flux results of nitrogen and phosphorus processes in the Dahuaiting reservoir, the corresponding seasonal fluxes are summarized in Figure 14.
(1)
Total Phosphorus Flux
In the seasonal flux of TP (Figure 14a), the intensity of the overall TP flux has exhibited a year-on-year increase. Throughout the simulation period, the external TP load demonstrated an upward trend, with the rate of increase accelerating annually. The maximum external TP load reached 301 t/season in the summer of 2018. Conversely, the TP outflow displayed an increasing trend from 2010 to 2016, followed by a gradual decline post-2016, with a peak outflow of 111 t/season occurring in spring 2016. Internal TP primarily functioned as a source from 2010 to 2016, transitioning to a sink from 2017 to 2018. When the internal TP load acted as a source, the maximum source strength was 89 t/season in winter 2016; conversely, when it functioned as a sink, the maximum sink strength reached 240 t/season in summer 2018.
(2)
Ammonia Nitrogen Flux
In the seasonal flux of ammonia nitrogen (Figure 14b), the external ammonia nitrogen load remained relatively stable between 2010 and 2016, followed by an upward trend observed in 2017–2018, peaking at 588 t/season in the summer of 2018. The maximum uptake of ammonia nitrogen by algae was recorded at 0.2 t/season in summer 2013. Following 2016, the ammonia nitrogen outflow declined annually, with a maximum of 294 t/season also recorded in summer 2013. The nitrification flux, defined as the amount of ammonia nitrogen consumed during the nitrification process, peaked in winter 2016 at 335 t/season. The mineralization flux, which indicates the increase in ammonia nitrogen due to mineralization, remained stable during the simulation period but exhibited a declining trend in 2017–2018, with a maximum value of 204 t/season in summer 2013.
(3)
Nitrate Nitrogen Flux
Within the nitrate nitrogen flux (Figure 14c), the external nitrate nitrogen load demonstrated a trend of increase followed by a decrease from 2010 to 2016, subsequently accelerating in its rise thereafter. The maximum external nitrate nitrogen load reached 5542 t/season in summer 2018. The long-term variation in the nitrate nitrogen outflow paralleled that of the external load, with a peak outflow of 2606 t/season in the summer of 2018. The maximum nitrate nitrogen uptake by algae occurred in summer 2013, amounting to 1.4 t/season. The denitrification flux remained stable throughout the simulation period, attaining a maximum of 770 t/season in summer 2018. The nitrification flux, representing the increase in nitrate nitrogen due to nitrification, exhibited overall stability during the simulation period.
(4)
Organic Nitrogen Flux
In the organic nitrogen flux (Figure 14d), internal organic nitrogen primarily existed as a source, displaying distinct seasonal variation. When internal organic nitrogen served as a source, the maximum source strength reached 1121 t/season in summer 2013. As a sink, its strength exhibited an annual decline, with a maximum of 454 t/season noted in spring 2011. The amount of organic nitrogen released from algal decay demonstrated significant seasonality and displayed an overall decline throughout the simulation period, peaking at 1.0 t/season in autumn 2010. The external organic nitrogen load exhibited notable seasonal variation, remaining stable overall during the simulation period, with a maximum of 492 t/season recorded in summer 2012. The mineralization flux, reflecting organic nitrogen consumption during mineralization, showed stability across the simulation period. The outflow of organic nitrogen initially increased, peaked, and subsequently declined from 2010 to 2016, with an anomalous increase observed in summer 2013, reaching a maximum of 1595 t/season.

4.1.3. Seasonal Flux of YQ

Based on the monthly flux results of nitrogen and phosphorus processes in the Qiao River reservoir, the corresponding seasonal fluxes have been compiled (Figure 15).
(1)
Total Phosphorus Flux
In the seasonal flux of TP (Figure 15a), the TP outflow exhibited a steady increase from 2010 to 2015, followed by a significant decline between 2015 and 2016, and subsequently resumed an upward trend from 2016 to 2019. Notably, the maximum recorded outflow was 16.9 t/season in the fall of 2019. The external TP load was influenced by both precipitation and water diversion, leading to considerable fluctuations, peaking at 816 t/season in the summer of 2018. Throughout the period from 2010 to 2015, the internal TP seasonal flux predominantly functioned as a sink, with its intensity gradually increasing. Conversely, from 2016 to 2019, the source strength of internal TP exhibited a gradual rise, while its sink strength declined. When internal TP acted as a source, the maximum intensity reached 19.8 t/season in the summer of 2019; whereas the maximum sink strength was recorded at 59.6 t/season in the winter of 2015.
(2)
Ammonia Nitrogen Flux
Regarding the seasonal flux of ammonia nitrogen (Figure 15b), the external ammonia nitrogen load remained relatively stable throughout the simulation period, with a maximum value of 162 t/season occurring in the summer of 2017. The ammonia nitrogen outflow demonstrated a general upward trend over the simulation period, peaking at 103 t/season in the winter of 2018. The uptake of ammonia nitrogen by algae increased in conjunction with the rising algal biomass in the reservoir, reaching a maximum of 1.2 t/season in the summer of 2019. The nitrification flux, defined as the amount of ammonia nitrogen consumed during the nitrification process, gradually increased during the simulation period, attaining a peak of 239 t/season in the autumn of 2018. Meanwhile, the mineralization flux, which indicates the increase in ammonia nitrogen through mineralization, exhibited an initial upward trend followed by a decline from 2010 to 2016, before rising annually from 2016 to 2019, with a maximum value of 169 t/season in the summer of 2019.
(3)
Nitrate Nitrogen Flux
In the seasonal flux of nitrate nitrogen (Figure 15c), the denitrification flux, which represents the consumption of nitrate nitrogen, displayed an initial increase followed by a decrease from 2010 to 2016, and subsequently increased steadily from 2017 to 2019, with a maximum of 1859 t/season recorded in the summer of 2014. The nitrification flux, reflecting the increase in nitrate nitrogen during the nitrification process, also rose annually throughout the simulation period. The long-term variation in the external nitrate nitrogen load mirrored that of the denitrification flux, peaking at 2872 t/season in the summer of 2018. Correspondingly, the nitrate nitrogen uptake by algae increased alongside the algal biomass over the years, achieving a maximum of 9.5 t/season in the summer of 2019. The nitrate nitrogen outflow exhibited a trend similar to that of the external nitrate nitrogen load, with a maximum of 1474 t/season observed in the spring of 2019.
(4)
Organic Nitrogen Flux
Concerning the seasonal flux of organic nitrogen (Figure 15d), the seasonal release of organic nitrogen due to algal mortality was significant, displaying an overall upward trend throughout the simulation period, with a maximum of 5.8 t/season recorded in the summer of 2019. In contrast, the external organic nitrogen load demonstrated a declining trend throughout the simulation period, peaking at 879 t/season in the summer of 2011. The mineralization flux, which reflects the consumption of organic nitrogen through mineralization, exhibited some variability over the simulation period. The organic nitrogen outflow initially increased, subsequently decreased from 2010 to 2016, and then rose annually from 2016 to 2019, peaking at 458 t/season in the summer of 2019. Internal organic nitrogen primarily functioned as a sink during most seasons, achieving a maximum source strength of 217 t/season when it acted as a source in the summer of 2012. Conversely, when internal organic nitrogen functioned as a sink, its strength peaked at 698 t/season in the autumn of 2012.

4.1.4. Monthly Flux and Annual Flux of Three Reservoirs

The monthly flux and annual flux of three reservoirs are summarized in the Supplementary Materials (Figures S2–S7).

4.2. Source Analysis of TN and TP for WDBLT

Based on the establishment and accuracy analysis of the ReNuMa simulation for the PJK and DHT watersheds, the nitrogen and phosphorus tracing system utilizing the ReNuMa model is considered capable of effectively tracing nutrient sources in these regions [5,39,40].
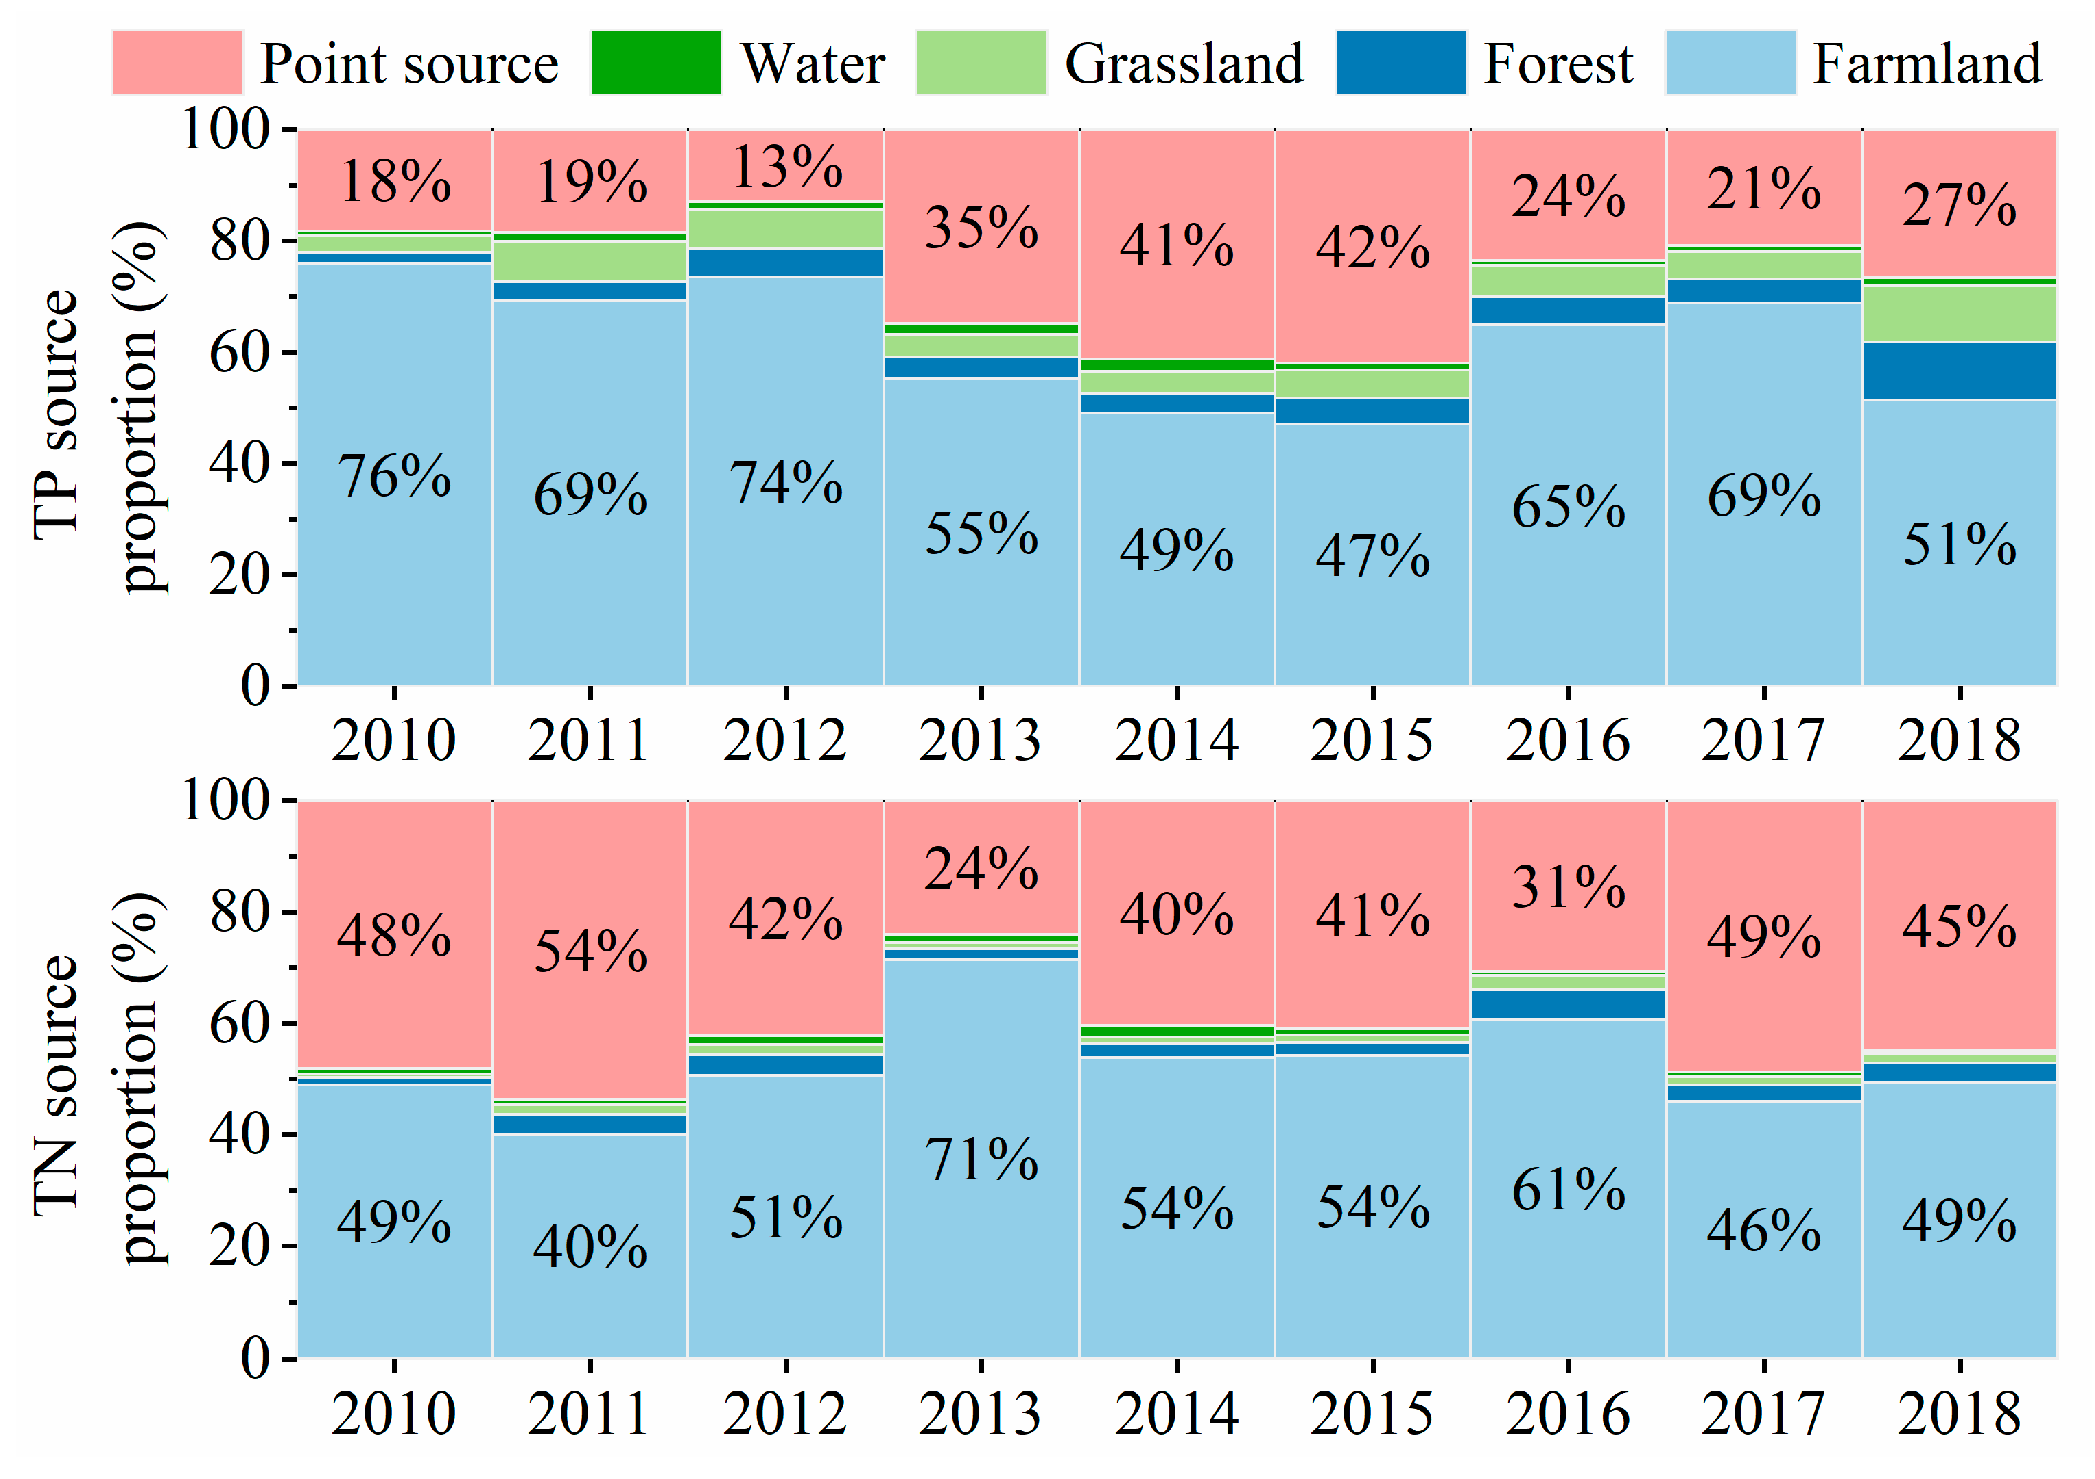
The external sources impacting the PJK watershed can be categorized into four segments: the UL-B, the LIU-B, the PU-B, and the PJK-AB. By aggregating the nitrogen and phosphorus tracing results from these four sub-basins, a comprehensive multi-year tracing output for the entire PJK watershed can be obtained, as summarized in Figure 16.
Point source pollution within the PJK watershed predominantly originates from the UL-B, with a marked increase in the proportion of TP point sources observed from 2010 to 2015. In 2016, a sudden decrease occurred compared to the previous year, followed by a period of relative stability. During the period from 2013 to 2015, the proportion of TP from point sources exceeded one-third, whereas from 2016 to 2018, this proportion stabilized at approximately 20%. The contribution of TP from farmland consistently surpassed 50% in most years, making it the most significant contributor to the TP load entering the PJK watershed. The greatest source of phosphorus in the aquatic system derives from atmospheric deposition across the water surface area, which, while relatively small for the entire PJK-B, nonetheless results in a minor contribution to the overall TP. Contributions from grassland and forested areas concerning TP are also minimal, although they show an upward trend that likely relates to variations in atmospheric deposition intensity and declines in the strength of other sources.
The long-term average proportion of TN from point sources is 41.6%, demonstrating overall stability over the years, with the exception of a notably lower proportion observed in 2013. The long-term average contribution of TN from farmland is 52.8%, exhibiting interannual variations that stabilized after 2014. Contributions from water bodies, grasslands, and forests regarding TN remained low, never exceeding 10% across all years.
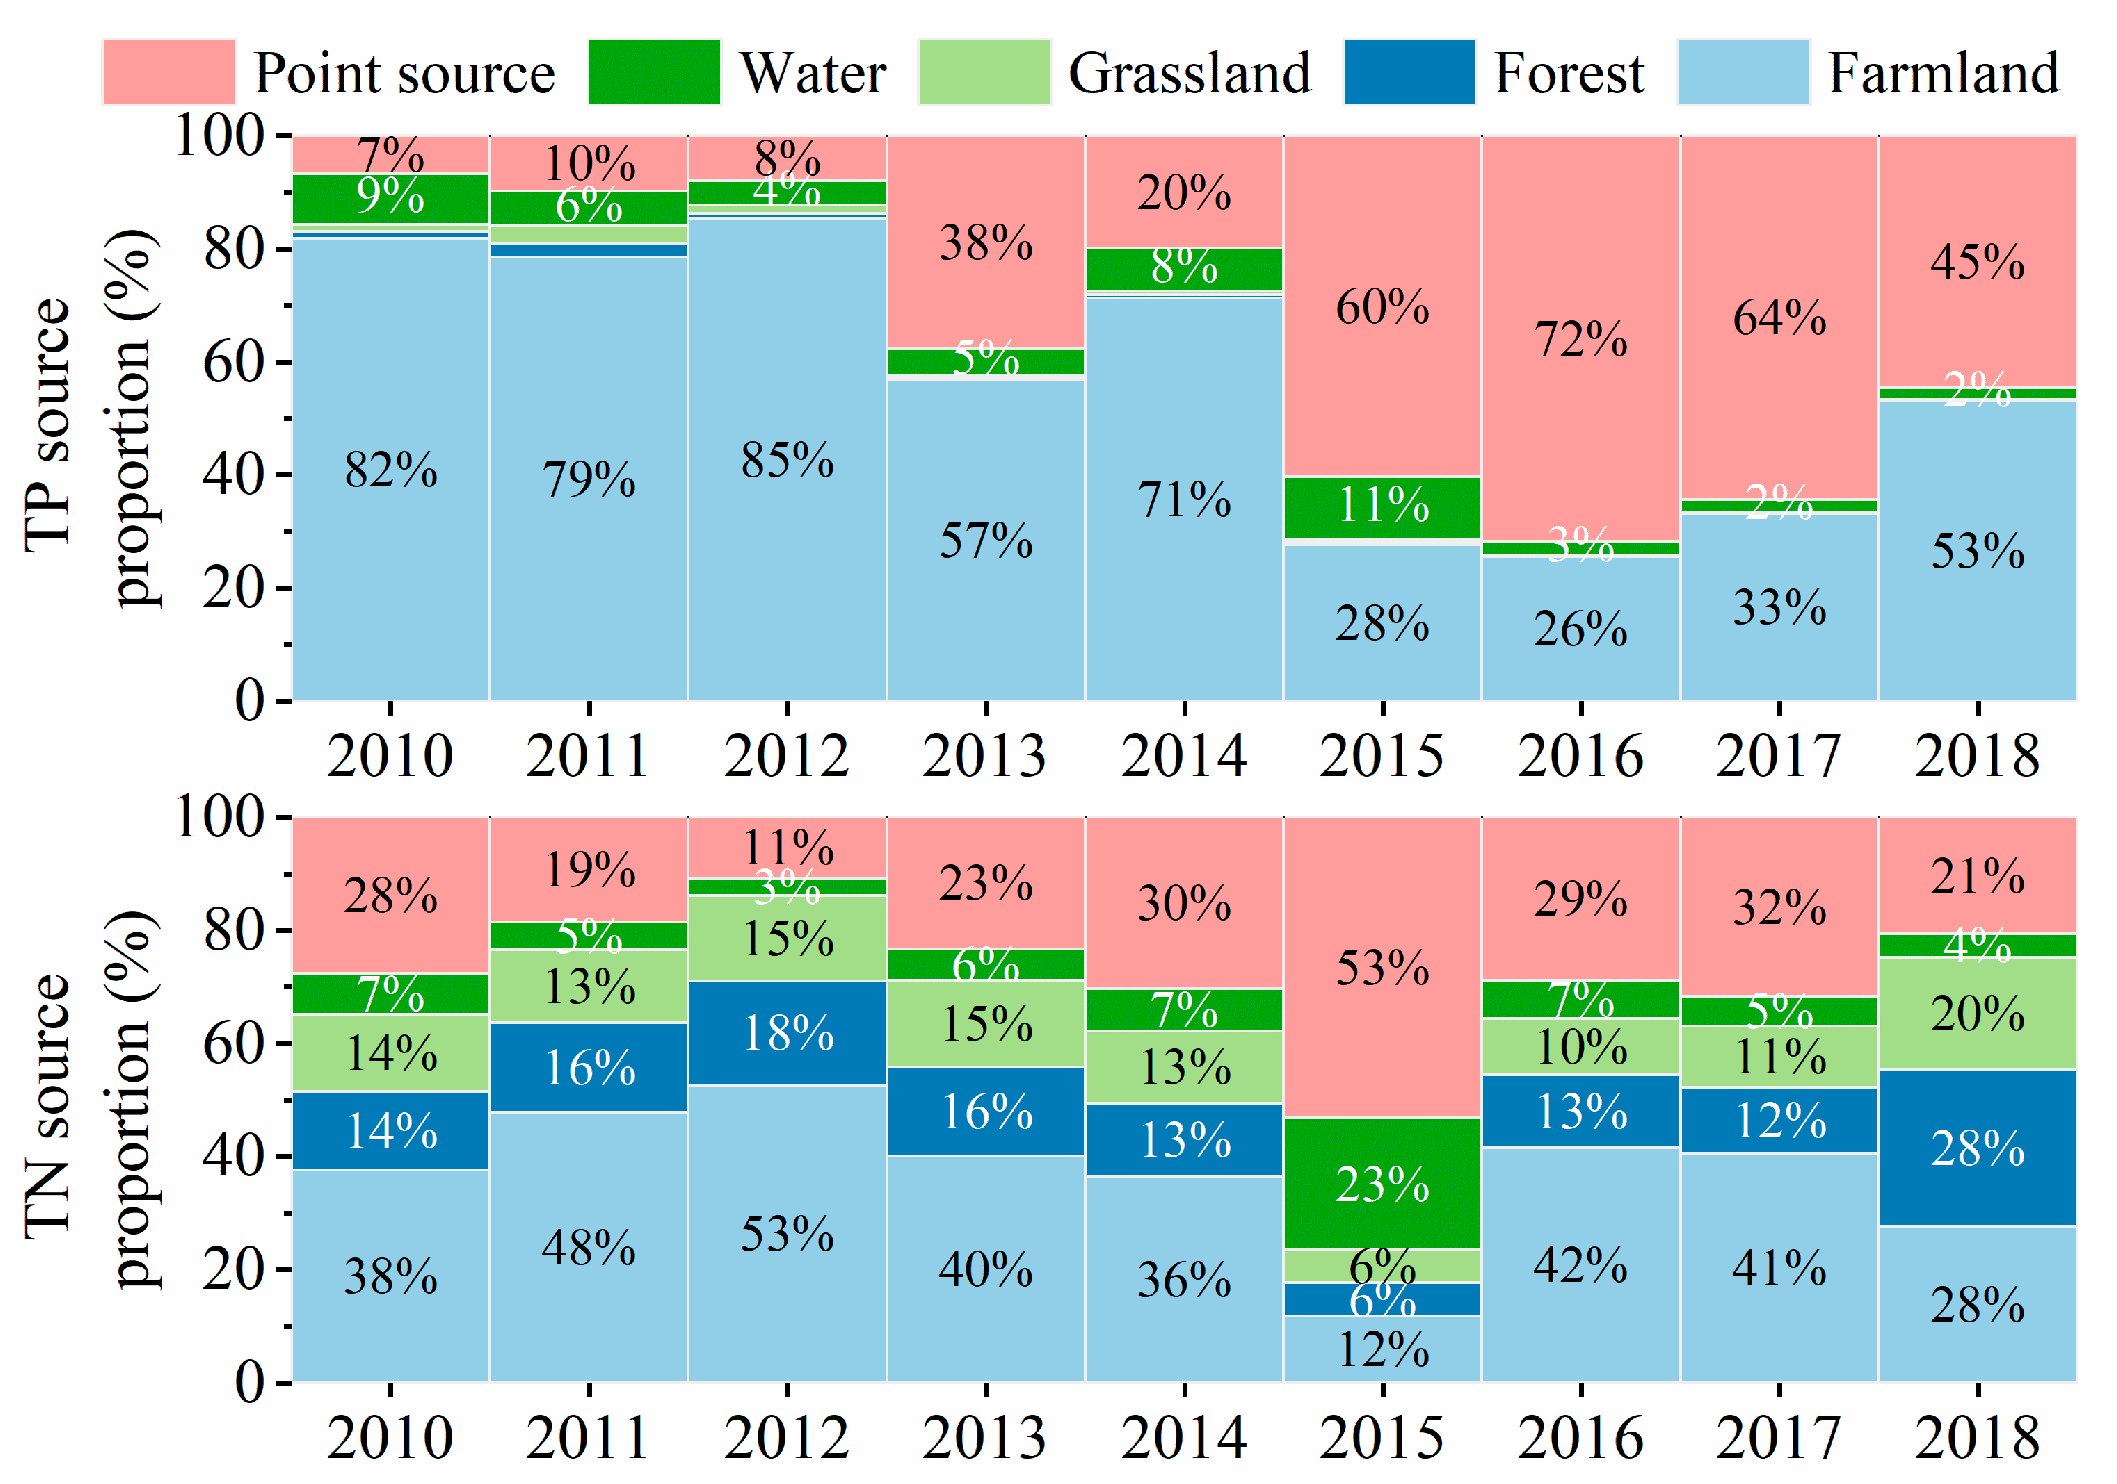
The nitrogen and phosphorus tracing results for the DHT watershed are summarized in Figure 17. External sources for the DHT watershed include three components: inflow from the XC reservoir, the SA-B, and the DHT-AB. The tracing results in this context represent only the aggregate outputs from the Sa River watershed and the surrounding area of the DHT, excluding consideration of the XC reservoir.
Within the DHT watershed, the proportions of point sources and agricultural sources for TP exhibited considerable fluctuations throughout the simulation period. Notably, there has been an overall increasing trend in the proportion of TP point sources, which rose from 7% (2010) to 72% (2016). The trend that may be associated with reduced rainfall during that year [44]. Conversely, the proportion of TP from agricultural sources decreased from 82% in 2010 to 26% in 2016, before increasing again to 53% by 2018. The proportion attributed to the water bodies in the DHT watershed is relatively high, resulting in greater TP contributions compared to the PJK watershed, while the contributions from grassland and forested areas remain minimal.
Similar to the trends observed in TP, the proportions of TN from point sources and agricultural sources in the DHT watershed also exhibit significant fluctuations. Additionally, the TN contributions from water bodies, grasslands, and forests are markedly greater than those from the PJK watershed, with average proportions over the years reported as 7.4%, 13.0%, and 15.1%, respectively.
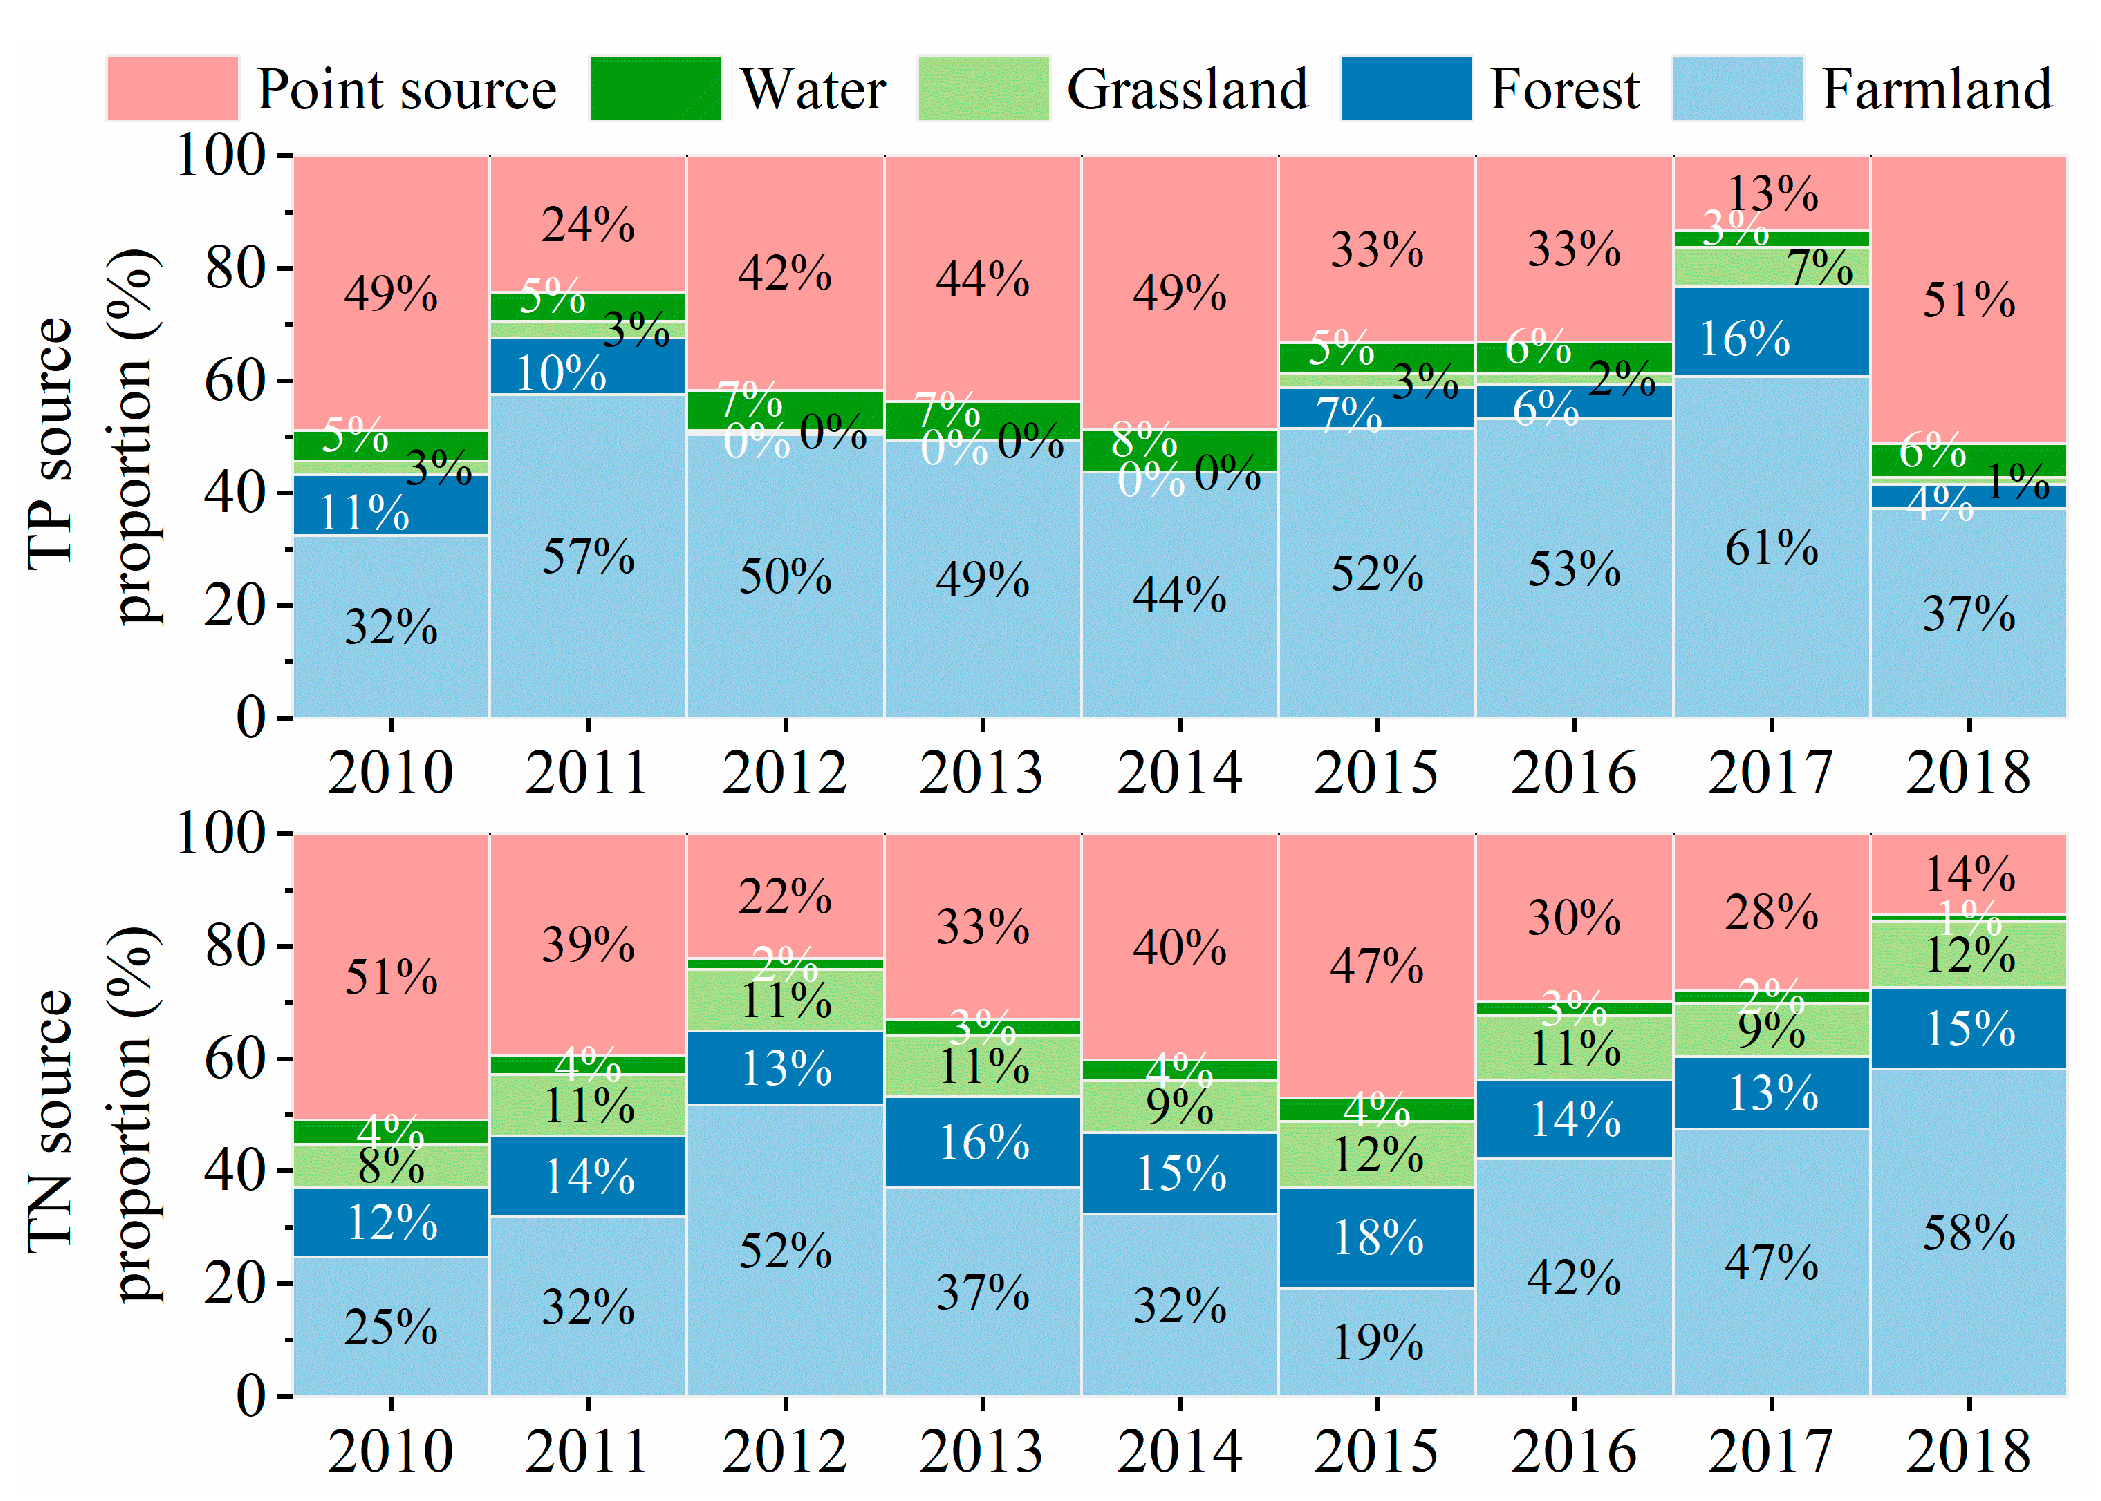
The external sources affecting the YQ watershed comprise four components: the SHA-B, the LI-B, the LIN-B, and the YQ-AB (Figure 18). This analysis specifically focuses on the sources of TN and TP within the SHA-B, while employing calculated values from the ReNuMa model for nutrient loading from the other three watersheds. This approach is justified by the fact that the ReNuMa model for the SHA-B is calibrated utilizing hydrological and water quality data, thereby providing source apportionment results that incorporate objective information derived from natural hydrometric and water quality observations [5,39,44]. In contrast, the ReNuMa models for the LI-B, LIN-B, and YQ-AB are constructed using parameters derived from the SHA-B model alongside the geographical information relevant to each respective watershed; consequently, these models lack independent natural hydrometric and water quality data.
In the SHA-B, the primary sources of TP arise from point source pollution and agricultural runoff, with contributions from forested areas and water bodies being relatively comparable, while grasslands contribute the least. Prior to 2014, the proportion of phosphorus from point sources exhibited an upward trend, which was subsequently followed by a downward trend. In 2018, the proportion of TP from point sources surged to 51%. In contrast, the proportion of TP from agricultural sources remained generally stable, experiencing fluctuations that were inversely related to those of point sources.
Likewise, the main sources of TN in the SHA-B are primarily point source pollution and agricultural runoff, with lesser contributions from forested areas, grasslands, and water bodies. The interannual variability of the TN proportions from point sources and agricultural runoff is significant; from 2010 to 2012, the nitrogen proportion from point sources decreased to 22%, subsequently rising to 47% from 2012 to 2015, before falling again to 14% by 2018. Conversely, the fluctuations in the proportion of agricultural TN follow an opposite trend relative to that of point sources.
Overall, the decline in the contribution of point sources to nitrogen and phosphorus following 2014 may be attributed to the enhanced management standards implemented by the Tianjin Municipal authorities [45,46]. After 2014, relevant agencies intensified their regulatory efforts concerning terrestrial nitrogen and phosphorus inputs into the reservoir, particularly focusing on managing point source pollution. As a result, non-point source pollution due to agricultural runoff emerged as the predominant source of pollution, marking a shift in focus toward non-point source management as a primary strategy for nutrient management in the watershed.

4.3. Substance Flow of TN and TP for WDBLT

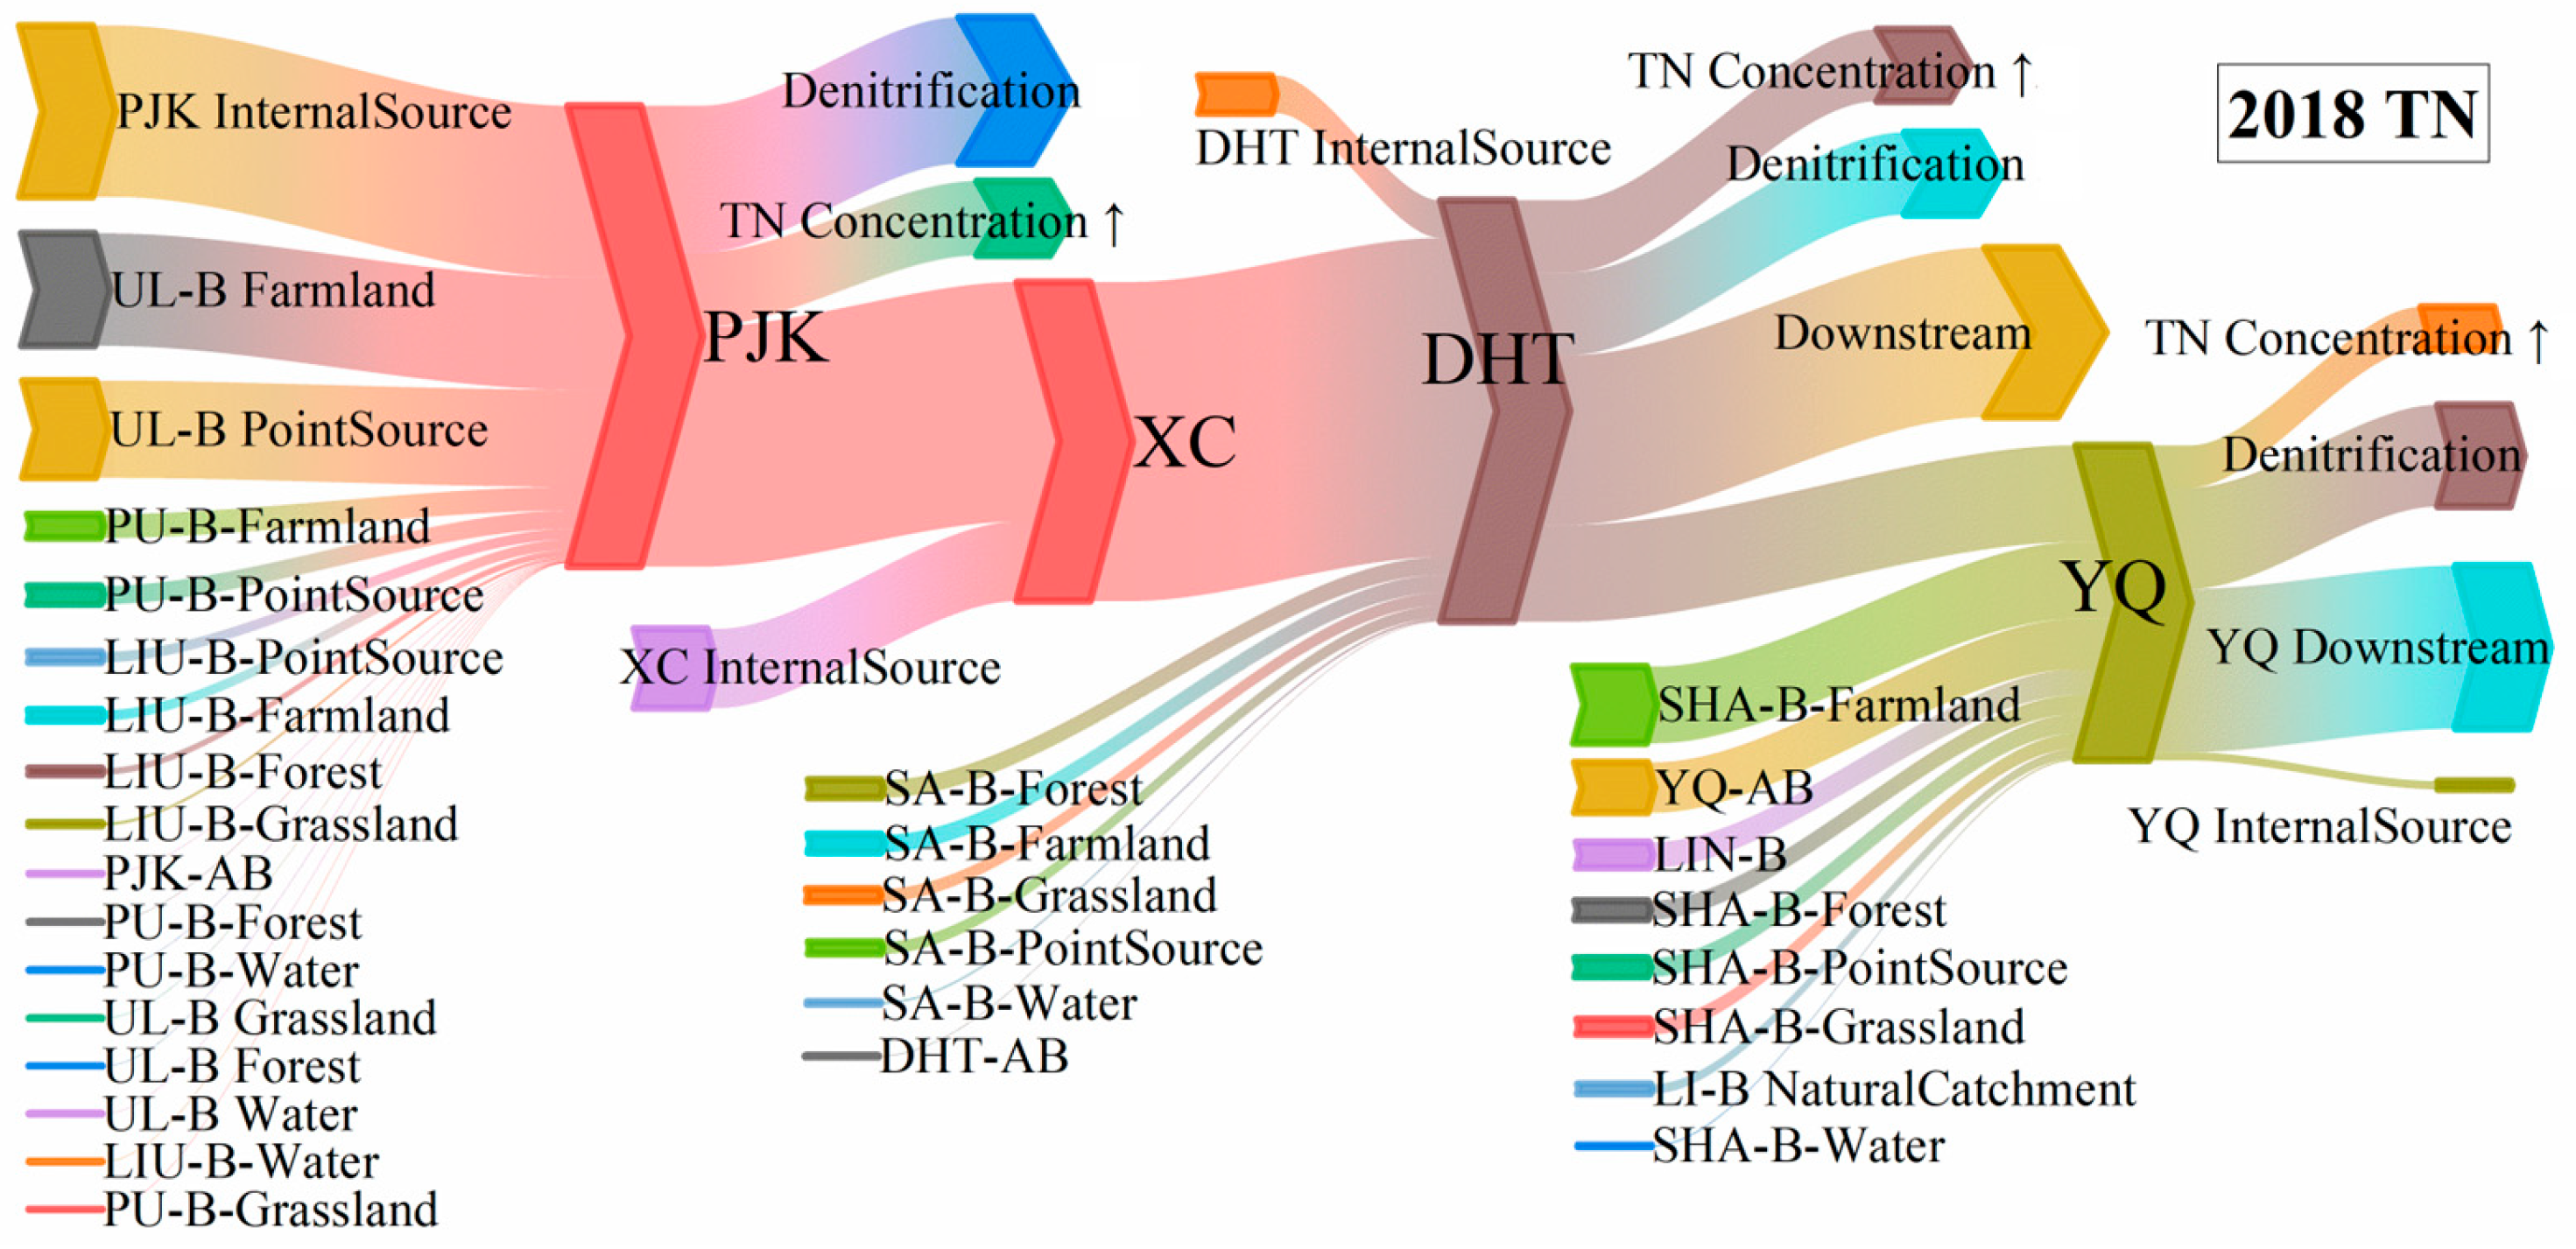
Since 2016, the significance of controlling nitrogen and phosphorus nutrient levels along the WDBLT has markedly increased due to the ecological compensation agreement for the WDBLT [35,45]. To explicitly delineate the responsibilities for pollutant control in this area, this study conducted a comprehensive analysis of nitrogen and phosphorus sources, encompassing both sub-basins and reservoirs. The resulting data were subsequently aggregated to illustrate the nitrogen and phosphorus substance flow within the CRS comprising the three key reservoirs (Figure 19 and Figure 20).
Figure 19 depicts the TN substance flow within the WDBLT in 2018. In the case of the PJK, the UL-B is identified as the primary source contributing to TN variations within the reservoir. Internal sources within the PJK also contributed significantly to TN levels in 2018, serving as a secondary source, while other sources of TN remained relatively minor. The TN outputs from the PJK include three components: TN outflow, denitrification, and support for elevated concentrations of TN in the reservoir. The PJK discharges into the DHT via the XC, where an internal source was also detected in 2018. For the DHT, TN loads from upstream constitute the most significant source, augmented by internal sources, with forested and agricultural lands within the SA-B serving as critical contributors to TN levels in the DHT watershed. The TN outputs from the DHT comprise four components: denitrification, downstream flow, diversion to Tianjin, and support for increased TN concentrations. Notably, the TN load entering the YQ via the Luanhe River diversion is the largest nitrogen source for the YQ in 2018, followed by contributions from agricultural sources in the SHA-B and YQ-AB. Similarly, TN outputs in the YQ consist of four elements: internal sources, denitrification, downstream flow, and support for elevated TN concentrations, with downstream TN loads comprising the largest component.
Figure 20 also presents the TP substance flow within the cascading reservoir system for the year 2018. In the PJK, the upstream watershed of the Luan River represents the most substantial external source of TP, with agricultural land identified as the primary contributor. Internal sources within the PJK functioned as a sink in 2018, as the TP outflow load closely matched the magnitude of the internal sources. Consequently, the c TP in the PJK experienced a notable decline in 2018. The TP load entering the XC from the PJK was significantly less than that flowing into the DHT from the XC, with the disparity attributed to the presence of substantial internal sources within the XC. This phenomenon may arise from the rapid water flow exiting the PJK into the XC, alongside the XC’s relatively small area, which results in considerable disturbances to the water body and sediment. Therefore, a significant amount of TP was released into the DHT from sediment within the XC. TP from the XC into the DHT became the primary source of TP for the DHT, followed by contributions from agricultural lands and point sources within the Sa River watershed. Internal sources in the DHT acted as a sink, primarily facilitating downstream flow to the Luan River diversion, noting a slight decrease in c TP in the DHT in 2018. In the YQ, nearby areas contributed the largest proportion of TP, followed by sources from the Luan River diversion.
Previous studies have demonstrated that the construction of large water retention structures within river systems not only alters the hydrological characteristics of these rivers but also leads to the retention of substances such as nitrogen and phosphorus within the reservoirs created. This phenomenon of nitrogen and phosphorus retention due to reservoir construction is widely recognized over larger temporal scales, such as annually [9,10,11]. However, an analysis of nitrogen and phosphorus substance flows across three reservoirs within the Luan River diversion watershed from 2010 to 2018 reveals that only the YQ consistently functions as a sink for nitrogen and phosphorus on an annual basis, indicating a significant retention effect (Figure S7). In contrast, the nitrogen and phosphorus internal sources in the PJK and the DHT exhibit inconsistent source-sink relationships over the same annual timeframe (Figures S3 and S5) [9,10,11]. The observation that, in certain years, the nitrogen and phosphorus internal sources in these two reservoirs acted as sources contradicts previous research, which emphasizes the significant retention effects of reservoirs on nitrogen and phosphorus. This discrepancy supports our model design hypothesis, which posits that the nitrogen and phosphorus internal sources in the PJK and DHT consist of two principal components: sediments and cage aquaculture. Notably, during years when the overall internal sources of nitrogen and phosphorus are classified as sources, cage aquaculture emerges as the dominant contributor in both reservoirs. This form of aquaculture directly provides substantial quantities of nitrogen and phosphorus nutrients, resulting in a shift from negative to positive annual internal nitrogen and phosphorus sources. Consequently, this phenomenon leads to the appearance of diminished nitrogen and phosphorus retention effects of the reservoirs in specific years. Notably, from 2017 to 2018, following the complete cessation of cage aquaculture, the TP internal sources in both the PJK and DHT transitioned from acting as sources to functioning as sinks, with sediments becoming the primary internal source component. This transition allowed for the manifestation of nutrient retention phenomena (as indicated by negative annual TP internal flux). Additionally, organic nitrogen internal sources persisted in a source capacity for two years following the ban on cage aquaculture.
The observed variations in the annual forms of nitrogen and phosphorus internal sources can likely be attributed to two primary factors. First, the sedimentary accumulation of nitrogenous compounds within the reservoir, a consequence of prolonged cage aquaculture activities and exogenous TN inputs, necessitates a protracted period for their subsequent release into the aquatic environment, which may precipitate a pronounced surge in short-term release intensity. Second, the retention effect of the reservoir for nitrogen is significantly weaker than that for phosphorus [9,47]. These differences may arise from a combination of both factors.
The YQ reservoir exhibited equally pronounced changes. From 2010 to 2014, its internal TP load acted predominantly as a sink. After the reservoir was placed under full closed management in late 2014, the internal source began to function as a net source during a growing number of months between 2015 and 2019, coinciding with an increased frequency of algal blooms.
By integrating the previous source tracing results for nitrogen and phosphorus in the watershed with biogeochemical process calculations from the reservoirs, this study establishes that the smallest time unit for nitrogen and phosphorus substance flow in the cascading reservoir system is monthly. Therefore, it is theoretically feasible to derive monthly nitrogen and phosphorus substance flows for the WDBLT from 2010 to 2018. Such a detailed analysis of nitrogen and phosphorus substance flows provides a theoretical basis and essential technical support for clarifying management priorities related to nitrogen and phosphorus control within the water diversion system. This approach also addresses challenges in nutrient management and identifies focal points for aquatic ecosystem restoration. The nitrogen and phosphorus substance flows for the year 2018 serve as illustrative examples for analysis, with the potential for further refinement of conclusions should more detailed outcomes be required.

5. Conclusions

This study delineates the WDBLT into ten sub-basins based on their topographic and hydrological characteristics. Distinct watershed water quality models have been developed corresponding to the specific attributes of these sub-basins to quantify the nitrogen and phosphorus nutrient loads and their respective sources. Subsequently, localized parameter schemes were employed to establish IHBLMs for the PJK, DHT, and YQ, facilitating the calculation of the intensity of nitrogen–phosphorus–algal biochemical processes occurring within these three reservoirs. Furthermore, the watershed water quality model was coupled with a lake water quality model to analyze the substance flow and variation patterns of nitrogen and phosphorus in the WDBLT. The study reveals several key findings: (1) Following the ban on cage farming in the PJK and DHT, the internal source of TP transitioned from being a source to a sink, whereas organic nitrogen exhibited no significant change. (2) The TP fluxes of the three reservoirs exhibited distinct temporal trajectories, serving as a sensitive indicator of their divergent environmental changes. (3) After 2017, although the release of internal total phosphorus in the YQ diminished annually, more pronounced increases during the spring and summer seasons. (4) Since 2016, there has been a decline in the proportion of point source pollution within the WDBLT, accompanied by a corresponding rise in the proportion of non-point source pollution. Through the model experiments, a practical framework was established that clarifies the sources of nitrogen and phosphorus nutrients entering the reservoirs, calculates the cycling dynamics of these nutrients in the biochemical processes of the reservoirs, and evaluates their sources and distribution within the watershed. Moreover, this model framework imposes modest requirements regarding data frequency and types, enhancing its applicability to a variety of watersheds. Consequently, it offers robust support for the detailed management of nitrogen and phosphorus nutrients within the watershed.

Supplementary Materials

The following supporting information can be downloaded at: https://www.mdpi.com/article/10.3390/w17162479/s1, Figure S1: Location of PJK, XC, and DHT. (The map is sourced from the website: https://livingatlas.arcgis.com/wayback/); Figure S2: Monthly flux of biochemical processes for PJK. TP (a), NH 4 +   (b), NO 3   (c), ON (d). Figure S3: Annual flux of biochemical processes for PJK. TP (a), NH 4 +   (b), NO 3 (c), ON (d). Figure S4: Monthly flux of biochemical processes for DHT. TP (a), NH 4 +   (b), NO 3   (c), ON (d). Figure S5: Annual flux of biochemical processes for DHT. TP (a), NH 4 +   (b), NO 3   (c), ON (d). Figure S6: Monthly flux of biochemical processes for YQ. TP (a), NH 4 +   (b), NO 3   (c), ON (d). Figure S7: Annual flux of biochemical processes for YQ. TP (a), NH 4   + (b), NO 3   (c), ON (d). Table S1. The simulation accuracy (R2) of reservoir water quality. Table S2. The simulation accuracy (R2) of watershed nutrient loads. Table S3. The source of data in this study.

Author Contributions

H.D.: Conceptualization, Investigation, Data curation, Methodology, Software, Formal analysis, Writing—original draft, Project administration. Q.W.: Resources, Conceptualization, Investigation, Supervision. G.K.: Conceptualization. L.H.: Formal analysis, Visualization. Z.L.: Formal analysis, Visualization. T.H.: Formal analysis, Visualization. W.J.: Resources. All authors have read and agreed to the published version of the manuscript.

Funding

This study was supported by the National Natural Science Foundation of China, grant number 42307597.

Data Availability Statement

All data sources are cited in the text. Restrictions apply to the availability of certain data. Pursuant to applicable laws and institutional policies, our affiliation is not authorized to publicly disseminate these data; nevertheless, we affirm responsibility for their authenticity and impartiality.

Conflicts of Interest

The authors declare that they have no known competing financial interests or personal relationships that could have appeared to influence the work reported in this paper.

References

  1. Li, D.F.; Lu, X.X.; Walling, D.E.; Zhang, T.; Steiner, J.F.; Wasson, R.J.; Harrison, S.; Nepal, S.; Nie, Y.; Immerzeel, W.W.; et al. High Mountain Asia hydropower systems threatened by climate-driven landscape instability. Nat. Geosci. 2022, 15, 520–530. [Google Scholar] [CrossRef]
  2. Wang, Z.N.; Fang, G.H.; Wen, X.; Tan, Q.F.; Zhang, P.; Liu, Z.H. Coordinated operation of conventional hydropower plants as hybrid pumped storage hydropower with wind and photovoltaic plants. Energy Convers. Manag. 2023, 277, 116654. [Google Scholar] [CrossRef]
  3. Yang, S.L.; Milliman, J.D.; Xu, K.H.; Deng, B.; Zhang, X.Y.; Luo, X.X. Downstream sedimentary and geomorphic impacts of the Three Gorges Dam on the Yangtze River. Earth-Sci. Rev. 2014, 138, 469–486. [Google Scholar] [CrossRef]
  4. Li, D.L.; Zuo, Q.T.; Wu, Q.S.; Li, Q.W.; Ma, J.X. Achieving the tradeoffs between pollutant discharge and economic benefit of the Henan section of the South-to-North Water Diversion Project through water resources-environment system management under uncertainty. J. Clean. Prod. 2021, 321, 128857. [Google Scholar] [CrossRef]
  5. Sha, J.; Liu, M.; Wang, D.; Swaney, D.P.; Wang, Y.Q. Application of the ReNuMa model in the Sha He river watershed: Tools for watershed environmental management. J. Environ. Manag. 2013, 124, 40–50. [Google Scholar] [CrossRef] [PubMed]
  6. Zhao, X.; Liu, J.G.; Liu, Q.Y.; Tillotson, M.R.; Guan, D.B.; Hubacek, K. Physical and virtual water transfers for regional water stress alleviation in China. Proc. Natl. Acad. Sci. USA 2015, 112, 1031–1035. [Google Scholar] [CrossRef]
  7. Li, Y.Y.; Gao, B.; Xu, D.Y.; Peng, W.Q.; Liu, X.B.; Qu, X.D.; Zhang, M. Hydrodynamic impact on trace metals in sediments in the cascade reservoirs, North China. Sci. Total Environ. 2020, 716, 136914. [Google Scholar] [CrossRef]
  8. Sheng, J.C.; Tang, W.Z.; Webber, M. Can interbasin water transfer affect water consumption and pollution? Lessons from China’s South-North water transfer project. Environ. Policy Gov. 2020, 30, 345–358. [Google Scholar] [CrossRef]
  9. Maavara, T.; Akbarzadeh, Z.; Van Cappellen, P. Global Dam-Driven Changes to Riverine N:P:Si Ratios Delivered to the Coastal Ocean. Geophys. Res. Lett. 2020, 47, e2020GL088288. [Google Scholar] [CrossRef]
  10. Maavara, T.; Chen, Q.W.; Van Meter, K.; Brown, L.E.; Zhang, J.Y.; Ni, J.R.; Zarfl, C. River dam impacts on biogeochemical cycling. Nat. Rev. Earth Environ. 2020, 1, 103–116. [Google Scholar] [CrossRef]
  11. Maavara, T.; Parsons, C.T.; Ridenour, C.; Stojanovic, S.; Dürr, H.H.; Powley, H.R.; Van Cappellen, P. Global phosphorus retention by river damming. Proc. Natl. Acad. Sci. USA 2015, 112, 15603–15608. [Google Scholar] [CrossRef]
  12. Wang, X.; Wang, P.; Deng, Y.; Xing, X.; Yuan, Q.; Du, C.; Gan, J.; Zheng, Y.; Liu, Y.; Xia, Y.; et al. Impacts of cascade hydropower development on river ecosystem homeostasis: A review. J. Hydrol. 2024, 638, 131484. [Google Scholar] [CrossRef]
  13. Zhao, B.; Zeng, Q.; Wang, J.; Jiang, Y.; Liu, H.; Yan, L.; Yang, Z.; Yang, Q.; Zhang, F.; Tang, J.; et al. Impact of cascade reservoirs on nutrients transported downstream and regulation method based on hydraulic retention time. Water Res. 2024, 252, 121187. [Google Scholar] [CrossRef]
  14. Francesconi, W.; Srinivasan, R.; Pérez-Miñana, E.; Willcock, S.P.; Quintero, M. Using the Soil and Water Assessment Tool (SWAT) to model ecosystem services: A systematic review. J. Hydrol. 2016, 535, 625–636. [Google Scholar] [CrossRef]
  15. Hu, M.P.; Liu, Y.M.; Wang, J.H.; Dahlgren, R.A.; Chen, D.J. A modification of the Regional Nutrient Management model (ReNuMa) to identify long-term changes in riverine nitrogen sources. J. Hydrol. 2018, 561, 31–42. [Google Scholar] [CrossRef]
  16. Alexander, R.B.; Elliott, A.H.; Shankar, U.; McBride, G.B. Estimating the sources and transport of nutrients in the Waikato River Basin, New Zealand. Water Resour. Res. 2002, 38, 4-1–4-23. [Google Scholar] [CrossRef]
  17. Alexander, R.B.; Smith, R.A.; Schwarz, G.E. Effect of stream channel size on the delivery of nitrogen to the Gulf of Mexico. Nature 2000, 403, 758–761. [Google Scholar] [CrossRef]
  18. Kim, D.K.; Kaluskar, S.; Mugalingam, S.; Blukacz-Richards, A.; Long, T.Y.; Morley, A.; Arhonditsis, G.B. A Bayesian approach for estimating phosphorus export and delivery rates with the SPAtially Referenced Regression On Watershed attributes (SPARROW) model. Ecol. Inform. 2017, 37, 77–91. [Google Scholar] [CrossRef]
  19. Debele, B.; Srinivasan, R.; Parlange, J.Y. Coupling upland watershed and downstream waterbody hydrodynamic and water quality models (SWAT and CE-QUAL-W2) for better water resources management in complex river basins. Environ. Model. Assess. 2008, 13, 135–153. [Google Scholar] [CrossRef]
  20. Li, L.; Chen, L.; Chen, S.; Zhang, Y.; Xu, Y.; Zhi, X.; Meng, X.; Shen, Z.; Liu, Y.; Yang, D.; et al. The cumulative effects of cascade reservoirs control nitrogen and phosphorus flux: Base on biogeochemical processes. Water Res. 2024, 252, 121177. [Google Scholar] [CrossRef]
  21. Yazdi, J.; Moridi, A. Interactive Reservoir-Watershed Modeling Framework for Integrated Water Quality Management. Water Resour. Manag. 2017, 31, 2105–2125. [Google Scholar] [CrossRef]
  22. McCarthy, S.M. Modeling the Physical and Biogeochemical Processes in Lake Superior Using LAKE2K. Master’s Thesis, Michigan Technological University, Houghton, MI, USA, 2016. [Google Scholar]
  23. Verma, K.; Thattaramppilly, R.M.; Manisha, M.; Jayakumar, S.; Marigoudar, S.R.; Pranesh, A.T.; Rao, L. Determination of degradation/reaction rate for surface water quality of recycled water using Lake2K model for large-scale water recycling. Environ. Sci. Pollut. Res. 2023, 30, 120207–120224. [Google Scholar] [CrossRef]
  24. Shabani, A.; Zhang, X.D.; Chu, X.F.; Zheng, H.C. Automatic Calibration for CE-QUAL-W2 Model Using Improved Global-Best Harmony Search Algorithm. Water 2021, 13, 2308. [Google Scholar] [CrossRef]
  25. Tong, Y.D.; Xu, X.W.; Qi, M.; Sun, J.J.; Zhang, Y.Y.; Zhang, W.; Wang, M.Z.; Wang, X.J.; Zhang, Y. Lake warming intensifies the seasonal pattern of internal nutrient cycling in the eutrophic lake and potential impacts on algal blooms. Water Res. 2021, 188, 116570. [Google Scholar] [CrossRef]
  26. Li, X.J.; Huang, M.T.; Wang, R.H. Numerical Simulation of Donghu Lake Hydrodynamics and Water Quality Based on Remote Sensing and MIKE 21. ISPRS Int. J. Geo-Inf. 2020, 9, 94. [Google Scholar] [CrossRef]
  27. Xu, M.J.; Yu, L.; Zhao, Y.W.; Li, M. The Simulation of Shallow Reservoir Eutrophication Based on MIKE21: A Case Study of Douhe Reservoir in North China. Procedia Environ. Sci. 2012, 13, 1975–1988. [Google Scholar] [CrossRef]
  28. Bailey, R.T.; Wible, T.C.; Arabi, M.; Records, R.M.; Ditty, J. Assessing regional-scale spatio-temporal patterns of groundwater-surface water interactions using a coupled SWAT-MODFLOW model. Hydrol. Process. 2016, 30, 4420–4433. [Google Scholar] [CrossRef]
  29. Rajib, A.; Liu, Z.; Merwade, V.; Tavakoly, A.A.; Follum, M.L. Towards a large-scale locally relevant flood inundation modeling framework using SWAT and LISFLOOD-FP. J. Hydrol. 2020, 581, 124406. [Google Scholar] [CrossRef]
  30. Bhatta, B.; Shrestha, S.; Shrestha, P.K.; Talchabhadel, R. Evaluation and application of a SWAT model to assess the climate change impact on the hydrology of the Himalayan River Basin. Catena 2019, 181, 104082. [Google Scholar] [CrossRef]
  31. Jha, M.; Arnold, J.G.; Gassman, P.W.; Giorgi, F.; Gu, R.R. Climate change sensitivity assessment on Upper Mississippi River Basin streamflows using SWAT. J. Am. Water Resour. Assoc. 2006, 42, 997–1015. [Google Scholar] [CrossRef]
  32. Zhou, F.; Xu, Y.P.; Chen, Y.; Xu, C.Y.; Gao, Y.Q.; Du, J.K. Hydrological response to urbanization at different spatio-temporal scales simulated by coupling of CLUE-S and the SWAT model in the Yangtze River Delta region. J. Hydrol. 2013, 485, 113–125. [Google Scholar] [CrossRef]
  33. Wu, Z.; Liu, Y.; Liang, Z.Y.; Wu, S.F.; Guo, H.C. Internal cycling, not external loading, decides the nutrient limitation in eutrophic lake: A dynamic model with temporal Bayesian hierarchical inference. Water Res. 2017, 116, 231–240. [Google Scholar] [CrossRef] [PubMed]
  34. Wang, M.Z.; Xu, X.W.; Wu, Z.; Zhang, X.Q.; Sun, P.Z.; Wen, Y.T.; Wang, Z.; Lu, X.B.; Zhang, W.; Wang, X.J.; et al. Seasonal Pattern of Nutrient Limitation in a Eutrophic Lake and Quantitative Analysis of the Impacts from Internal Nutrient Cycling. Environ. Sci. Technol. 2019, 53, 13675–13686. [Google Scholar] [CrossRef]
  35. Kang, G.L.; Yin, J.C.; Cui, N.X.; Ding, H.; Wang, S.M.; Wang, Y.Q.; Qi, Z.D. The Long-Term and Retention Impacts of the Intervention Policy for Cage Aquaculture on the Reservoir Water Qualities in Northern China. Water 2020, 12, 3325. [Google Scholar] [CrossRef]
  36. Liu, C.; Wang, S.Y.; Liu, X.B.; Zhou, H.D.; Li, B.D.; Du, Y.L.; Wang, L. Characteristics of water quality response to hypolimnetic anoxia in Daheiting Reservoir. Water Sci. Technol. 2022, 85, 2065–2075. [Google Scholar] [CrossRef]
  37. Tian, Y.L.; Jiang, Y.; Liu, Q.; Dong, M.Y.; Xu, D.X.; Liu, Y.; Xu, X. Using a water quality index to assess the water quality of the upper and middle streams of the Luanhe River, northern China. Sci. Total Environ. 2019, 667, 142–151. [Google Scholar] [CrossRef] [PubMed]
  38. Kang, G.L.; Qiu, Y.; Wang, Q.X.; Qi, Z.D.; Sun, Y.T.; Wang, Y.Q. Exploration of the critical factors influencing the water quality in two contrasting climatic regions. Environ. Sci. Pollut. Res. 2020, 27, 12601–12612. [Google Scholar] [CrossRef]
  39. Qi, Z.D.; Kang, G.L.; Chu, C.L.; Qiu, Y.; Xu, Z.; Wang, Y.Q. Comparison of SWAT and GWLF Model Simulation Performance in Humid South and Semi-Arid North of China. Water 2017, 9, 567. [Google Scholar] [CrossRef]
  40. Qi, Z.D.; Kang, G.L.; Shen, M.L.; Wang, Y.Q.; Chu, C.L. The Improvement in GWLF Model Simulation Performance in Watershed Hydrology by Changing the Transport Framework. Water Resour. Manag. 2019, 33, 923–937. [Google Scholar] [CrossRef]
  41. Ballantyne, A.P.; Baker, P.A.; Fritz, S.C.; Poulter, B. Climate-mediated nitrogen and carbon dynamics in a tropical watershed. J. Geophys. Res. Biogeosci. 2011, 116, G02013. [Google Scholar] [CrossRef]
  42. Chave, J. The problem of pattern and scale in ecology: What have we learned in 20years? Ecol. Lett. 2013, 16, 4–16. [Google Scholar] [CrossRef]
  43. Hastings, A. Timescales, dynamics, and ecological understanding. Ecology 2010, 91, 3471–3480. [Google Scholar] [CrossRef]
  44. Ding, H.; Ren, Q.R.; Wang, C.C.; Chen, H.T.; Wang, Y.Q.; Li, Z.L. Rain Pattern Deeply Reshaped Total Phosphorus Load Pattern in Watershed: A Case Study from Northern China. Water 2023, 15, 2910. [Google Scholar] [CrossRef]
  45. Wen, S.L.; Wang, H.W.; Wu, T.; Yang, J.; Jiang, X.; Zhong, J.C. Vertical profiles of phosphorus fractions in the sediment in a chain of reservoirs in North China: Implications for pollution source, bioavailability, and eutrophication. Sci. Total Environ. 2020, 704, 135318. [Google Scholar] [CrossRef]
  46. Ding, H.; Li, Z.L.; Ren, Q.R.; Chen, H.T.; Song, M.L.; Wang, Y.Q. Single-variable method for predicting trends in chlorophyll a concentration based on the similarity of time series. Ecol. Indic. 2022, 140, 109027. [Google Scholar] [CrossRef]
  47. Hobbie, S.E.; Finlay, J.C.; Janke, B.D.; Nidzgorski, D.A.; Millet, D.B.; Baker, L.A. Contrasting nitrogen and phosphorus budgets in urban watersheds and implications for managing urban water pollution. Proc. Natl. Acad. Sci. USA 2017, 114, 4177–4182. [Google Scholar] [CrossRef] [PubMed]
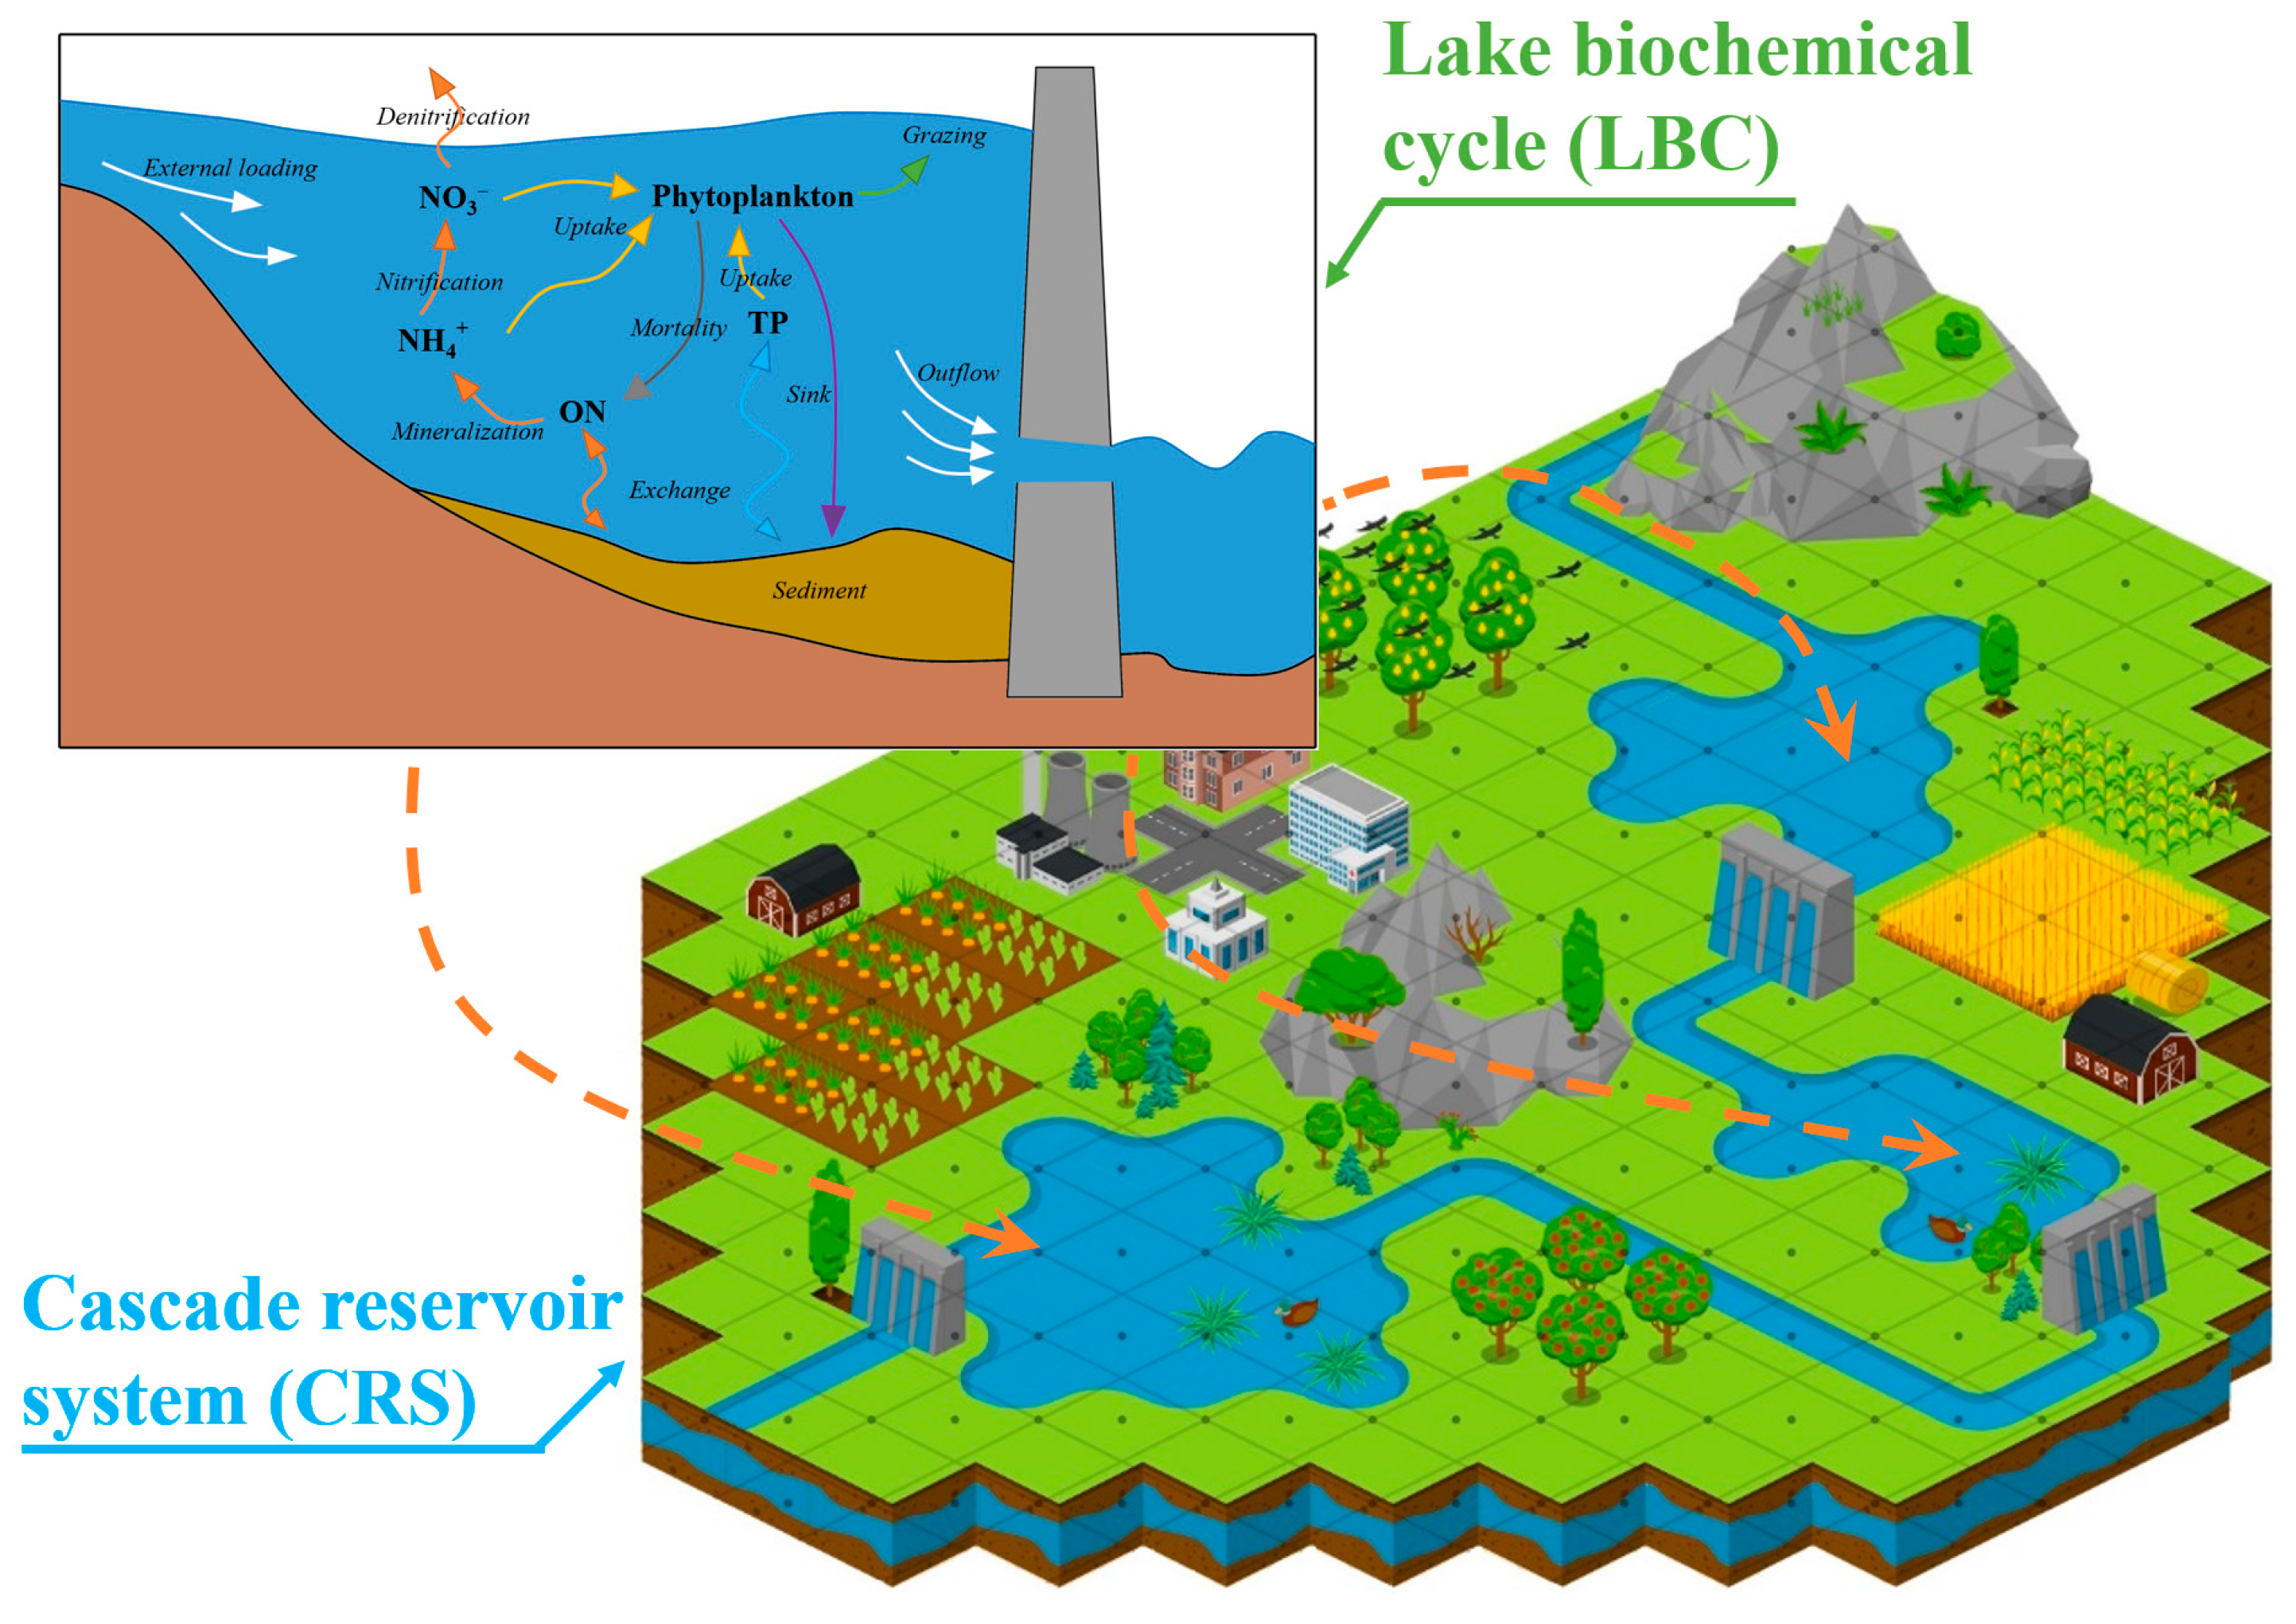
Figure 1. Schematic diagram of cascade reservoir system and lake biochemical cycle.
Water 17 02479 g001
Figure 2. Study area diagram of WDBLT.
Water 17 02479 g002
Figure 3. Diagram of nitrogen–phosphorus–algal processes in reservoir.
Water 17 02479 g003
Figure 4. The water quality trend of three reservoirs.
Water 17 02479 g004
Figure 5. Simulation results of five water quality parameters for PJK. Chla (a), TP (b), NH 4 + (b), NO 3 (c), ON (d).
Water 17 02479 g005
Figure 6. Simulation results of five water quality parameters for DHT. Chla (a), TP (b), NH 4 + (c), NO 3 (d), ON (e).
Water 17 02479 g006
Figure 7. Simulation results of five water quality parameters for YQ. Chla (a), TP (b), NH 4 + (c), NO 3 (d), ON (e).
Water 17 02479 g007
Figure 8. The simulation results of streamflow depth for the PJK watershed. UL-B (a), LIU-B (b), PU-B (c).
Water 17 02479 g008
Figure 9. The simulation results of TN load for the PJK watershed. UL-B (a), LIU-B (b), PU-B (c).
Water 17 02479 g009
Figure 10. The simulation results of TP load for the PJK watershed. UL-B (a), LIU-B (b), PU-B (c).
Water 17 02479 g010
Figure 11. Simulation results of runoff depth (a), TN (b), and TP (c) load for SA-B.
Water 17 02479 g011
Figure 12. The simulation results of runoff depth (a), TN (b), and TP (c) load for SHA-B.
Water 17 02479 g012
Figure 13. Seasonal flux of biochemical processes for PJK. TP (a), NH 4 + (c), NO 3 (d), ON (e).
Water 17 02479 g013
Figure 14. Seasonal flux of biochemical processes for DHT. TP (a), NH 4 + (b), NO 3 (c), ON (d).
Water 17 02479 g014
Figure 15. Seasonal flux of biochemical processes for YQ. TP (a), NH 4 + (b), NO 3 (c), ON (d).
Water 17 02479 g015
Figure 16. Source proportions of TN and TP for PJK.
Water 17 02479 g016
Figure 17. Source proportions of TN and TP for DHT.
Water 17 02479 g017
Figure 18. Source proportions of TN and TP for YQ (only SHA-B).
Water 17 02479 g018
Figure 19. Substance flow of TN for WDBLT in 2018. (The arrows in the figure indicate the changes in concentration (increase (“↑”) or decrease (“↓”)).
Water 17 02479 g019
Figure 20. Substance flow of TP for WDBLT in 2018. (The arrows in the figure indicate the changes in concentration (increase (“↑”) or decrease (“↓”)).
Water 17 02479 g020
Table 1. Relationship between sub-basins and reservoirs in WDBLT.
ReservoirRiverSub-Basin
PJKUpstream of Luanhe RiverUpstream of Luanhe River basin (UL-B)
Liuhe RiverLiuhe River basin (LIU-B)
Puhe RiverPuhe River basin (PU-B)
Rivers around PJKPJK around basin (PJK-AB)
DHTSahe RiverSahe River basin (SA-B)
Rivers around DHTDHT around basin (DHT-AB)
YQShahe RiverShahe River basin (SHA-B)
Lihe RiverLihe River basin (LI-B)
Linhe RiverLinhe River basin (LIN-B)
Rivers around YQYQ around basin (YQ-AB)
Disclaimer/Publisher’s Note: The statements, opinions and data contained in all publications are solely those of the individual author(s) and contributor(s) and not of MDPI and/or the editor(s). MDPI and/or the editor(s) disclaim responsibility for any injury to people or property resulting from any ideas, methods, instructions or products referred to in the content.