Abstract
Assessing fishery resources is crucial for sustainable marine ecosystem management and the operation of fisheries. This study integrates trawl surveys, environmental DNA (eDNA) analysis, and scientific echo sounder techniques to analyze the fishery resource distribution of and seasonal variations in the East China Sea. Surveys were conducted in April, July, August, and November 2022, utilizing bottom trawl sampling, eDNA metabarcoding, and acoustic data collection. The results revealed temporal differences in species composition, with crustaceans dominating in terms of abundance and fish species in biomass. The integration of eDNA analysis provided broader species detection, including cryptic and pelagic species, while acoustic techniques enabled large-scale resource assessment. However, discrepancies between methods highlighted the need for methodological refinement. Dominant species exhibited seasonal variation, with Portunus trituberculatus prevailing in spring (April), Trachurus japonicus and Scomber japonicus in summer (July–August), and Pampus argenteus in late autumn (November). A comparative analysis revealed that eDNA is sensitive to pelagic and cryptic species, trawl surveys effectively detect demersal fish, and acoustics allow for broad-scale biomass estimation, highlighting the complementary value of method integration.
1. Introduction
The East China Sea (ECS) is a semi-enclosed continental shelf sea bordered by Korea, Japan, China, and Taiwan, covering an area of approximately 744,000 km2 [1]. It is a highly productive marine ecosystem that serves as a key spawning and overwintering ground for various commercial fish species [2,3,4]. High densities of migratory species such as Japanese anchovy, sardine, hairtail, mackerel, and horse mackerel are distributed throughout the region, supporting the coastal fisheries of China. The ECS is influenced by the Kuroshio Current, China Coastal Current, and freshwater input from the Yangtze River, resulting in strong seasonal variations in sea temperature, salinity, nutrients, and dissolved oxygen, which in turn lead to dynamic changes in fish community structure and resource abundance.
Over the past decades, excessive fishing, land-based pollution, and climate change have significantly reduced fishery resources in the ECS [5]. Although management measures such as seasonal fishing bans and trawl prohibition zones have been implemented, negative trends—including community simplification, the dominance of small-sized species, and a decline in biodiversity—continue to persist. Thus, the development of a precise and timely monitoring system is urgently needed to evaluate resource recovery potential and support effective management strategies.
Conventional bottom trawl surveys have long been used to assess fishery resources in the ECS [6,7,8,9]. While trawling provides physical specimens that allow for accurate species identification and biomass estimation, it is limited by gear selectivity, restricted coverage, and behavioral avoidance [9]. To overcome these limitations, environmental DNA (eDNA) analysis has emerged as a powerful, non-invasive method with a high sensitivity for detecting aquatic organisms [10,11,12]. eDNA enables the detection of rare, benthic, and cryptic species that may be missed by traditional methods.
However, eDNA concentration does not always correlate directly with biomass due to factors such as water temperature, species-specific DNA shedding rates, and degradation dynamics [13,14]. In marine environments—especially in the ECS—low biomass per unit volume, rapid dilution by currents, and the presence of many sympatric species further complicate species-level detection and quantitative interpretation [15]. These challenges highlight the need for complementary approaches to validate and enhance eDNA-based estimates. Accordingly, recent studies have sought to integrate eDNA with traditional methods such as trawling and hydroacoustic surveys to leverage the strengths of each technique [15].
Nevertheless, few studies have applied such tri-method integration—combining bottom trawl, eDNA metabarcoding, and multi-frequency hydroacoustic surveys—on a seasonal scale in large and biologically complex regions such as the ECS. In this study, we developed a comprehensive assessment framework that integrates these three approaches to examine the spatiotemporal dynamics of fish species composition and biomass. This design enhances species detectability and enables vertical resource profiling from the seafloor to the surface. Seasonal comparisons across spring (April), summer (July–August), and late autumn (November) also provide new insights into ecological changes that have previously gone undocumented.
Specifically, we assessed species composition using both bottom trawl surveys and eDNA analysis and identified dominant species for each method. By applying species-specific target strength (TS) values derived from previous studies, we estimated the acoustic-based density for each dominant species. This integrative approach allows for a comparative analysis of species-level abundance estimates across methods, enabling a more ecologically informed interpretation of fishery resources by leveraging the distinct detection characteristics of each method, despite their respective limitations.
2. Materials and Methods
2.1. Survey Area and Methods
Surveys were conducted in the East China Sea using Chonnam National University’s training vessel Saedongbaekho (G/T 2996 T). Seasonal surveys were conducted in April, July, August, and November 2022 (Figure 1), covering a total survey area of approximately 33,104 km2.
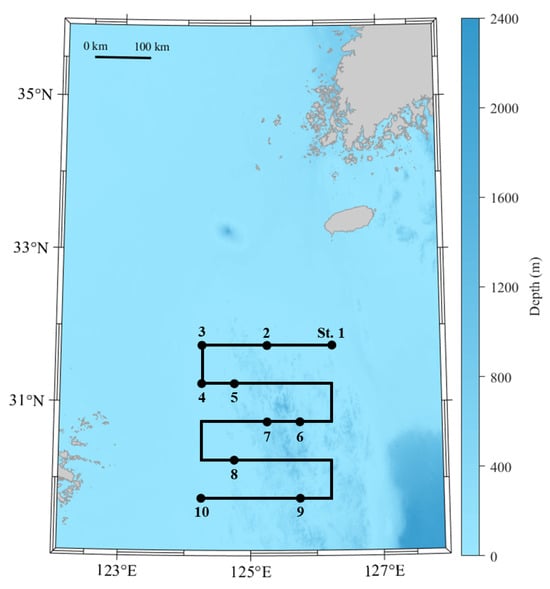
Figure 1.
Map of the study area located in the East China Sea, a marginal sea situated to the east of China and south of Korea and Japan, characterized by its rich biodiversity and significant fishery resources. The solid lines indicate the acoustic survey transects conducted to investigate the spatial distribution of marine resources, while the dots represent the locations of trawl sampling and water sampling stations used for biological and environmental data collection.
To assess whether the acoustic transect design provided sufficient spatial coverage, the degree of coverage (DOC) was calculated using the following formula:
where D is the total transect length (1178.89 km) and A is the survey area (33,104 km2). The resulting DOC value was approximately 6.48, which exceeds the recommended threshold of 6 for reliable resource assessment, as suggested by [16,17]. This indicates that the survey design provided statistically robust and representative coverage of the survey area.
Although the surveys were conducted on a monthly basis during April, July, August, and November, these time periods are considered representative of the seasonal oceanographic conditions in the East China Sea—spring (April), summer (July–August), and late autumn (November). This seasonal coverage enables the analysis of spatiotemporal variations in species composition and biomass across distinct marine environmental and ecological conditions, thereby providing foundational data and scientific insights for the development of more effective and sustainable fishery resource management strategies.
Acoustic surveys were performed on five transects during each season using an EK80 split-beam scientific echo sounder (Simrad, Kongsberg Maritime AS, Horten, Norway). The acoustic data were collected at six frequencies (18, 38, 70, 120, 200, and 333 kHz). Data were acquired while the vessel traveled at a controlled speed of 7–10 knots to minimize potential noise and target strength (TS) estimation errors associated with high vessel speeds. Positional data were continuously collected from the Position and Attitude System (Seapath 320-5, Kongsberg Maritime AS, Horten, Norway) and integrated with the acoustic data.
In addition to acoustic and biological surveys, oceanographic environmental data were collected during each cruise to assess the physical and chemical conditions of the water column. A conductivity–temperature–depth (CTD) profiler equipped with a water sampler (SBE 911 Plus, Sea-Bird Scientific, Bellevue, WA, USA) was used to measure temperature, salinity, dissolved oxygen (DO), and pH at each sampling station. These variables were selected as they are key environmental factors influencing the distribution and abundance of marine organisms. To explore the dominant patterns among environmental gradients and their seasonal variation, a principal component analysis (PCA) was performed using the environmental datasets collected from April, July, August, and November.
2.2. Trawl Survey
In this study, the fishing catch survey was conducted using a bottom trawl net installed on the training vessel Saedongbaekho of Chonnam National University (Figure 2). The total length of the bottom trawl net was 50.2 m, with a width of 26.5 m and a height of 2.5 m. The codend (terminal section of the trawl) measured 8.6 m in length, 2.2 m in width, and 1.5 m in height. The codend was constructed with a double-layered net structure consisting of inner and outer nets. The mesh size of the inner net was 120 mm, while that of the outer net was 240 mm. The outer net helped maintain the overall shape of the codend and supported mesh opening consistency in the inner net, thereby allowing the escape of juveniles and small-sized fish while also protecting the net from abrasion from the seabed. In contrast, the inner net, composed of finer mesh, served to retain adult fish by preventing their escape after entry.
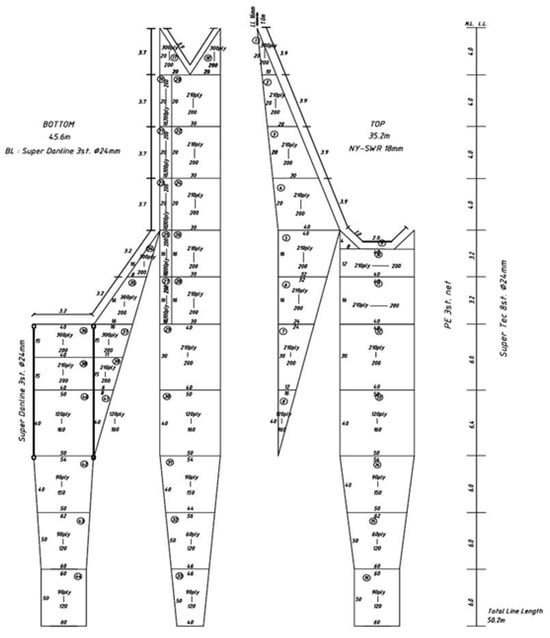
Figure 2.
Net plan of the survey trawl gear for the research.
The bottom trawl survey was conducted at each sampling station by towing the net for approximately 30 min at an average speed of 3 knots. To account for the diel vertical migration of demersal fish, the surveys were carried out only during daylight hours, from sunrise to sunset.
2.3. CTD Measurements, Collection of Seawater Samples, and eDNA Extraction
Seawater samples were collected using a conductivity–temperature–depth (CTD) profiler equipped with a water sampler (SBE 911 Plus, Sea-Bird Scientific, Bellevue, WA, USA) aboard the Saedongbaekho training vessel to estimate the distribution and density of fishery resources in the East China Sea. Water quality parameters including temperature, salinity, dissolved oxygen (DO), and pH were measured using the CTD system. At each station, CTD profiles were recorded from the sea surface to 10 m above the seafloor at 1 m intervals. Surveys were conducted seasonally in April, July, August, and November 2022, covering 7 stations in April, 8 in July, and 10 stations each in August and November. Sampling stations were randomly selected within the broader East China Sea to reduce selection bias and to ensure representative spatial coverage. Although the stations were not stratified by specific hydrographic sub-regions, they encompassed a range of environmental gradients from coastal to offshore areas, thereby indirectly capturing spatial heterogeneity relevant to fishery resource assessment [18].
Seawater samples for eDNA analysis were collected at a depth of 20 m at each station. However, due to adverse weather conditions in April and July, samples could only be collected from a subset of the designated 10 stations. At each station, 2 L of seawater were filtered using Sterivex filters (Merck Millipore, Burlington, MA, USA), and eDNA was subsequently extracted using the DNeasy Blood and Tissue Kit (Qiagen, Hilden, Germany). The final elution was carried out in 200 µL of AE buffer (10 mM Tris-Cl, 0.5 mM EDTA, pH 9.0). The extracted DNA was quantified using the Quant-iT PicoGreen dsDNA Assay Kit (Invitrogen, Thermo Fisher Scientific, Waltham, MA, USA) and stored at −20 °C until further analysis. To prevent contamination and preserve DNA integrity, all filtration and extraction procedures were conducted in a clean workspace using sterile equipment. Equipment was decontaminated between samples with 10% bleach and UV sterilization. Samples were stored on ice during field processing and immediately frozen to minimize DNA degradation. Negative controls (field blanks and extraction blanks) were included throughout the sampling and extraction processes to monitor for potential contamination.
2.4. Metabarcoding Analysis
The extracted eDNA was subjected to metabarcoding analysis, targeting the mitochondrial 12S rRNA region of fish using the universal primers MiFish-U-F2 and MiFish-U-R2 [19]. Overhang sequences were designed based on the TruSeq adapter system (Table 1), and metabarcoding analysis was conducted using a two-step PCR protocol involving two rounds of amplification. PCR was performed using the composition of the PCR mixture, and the reaction temperature conditions are detailed in Supplementary Table S1. After the first PCR, the target size was confirmed through electrophoresis using a 1.5% agarose gel, followed by the purification of the amplified product.

Table 1.
Details of Illumina overhang sequences and 12S rDNA primers.
Based on the first purified PCR product, a second PCR was conducted to attach indices and adapters to the primer sequences. A sequencing library was constructed, and quality checks (QCs) were performed to verify the target size. Samples that passed the QC process were sequenced using the Illumina MiSeq platform based on next-generation sequencing (NGS) technology.
2.5. Shannon–Wiener Diversity Index
The Shannon–Wiener diversity index was calculated for the seasonally collected trawl and water sampling data (refer to Supplementary Tables S4 and S6–S9 for source data). Subsequently, the mean ± standard deviation values were calculated for each month (Equation (2)):
where the variable represents the number of species identified at each sampling site, and denotes the proportion of individuals or read counts attributed to the -th species. For the trawl survey data, was calculated based on the number of individuals per species, and only fish-specific diversity indices were analyzed. For the eDNA data, was derived from read counts associated with each species.
The Shannon–Wiener Index was selected as the diversity metric for this study because it incorporates both species richness and evenness, offering a balanced and sensitive measure of community diversity. This index is widely used in ecological studies and is particularly suitable for analyzing complex species assemblages derived from eDNA data.
As the values for all factors did not follow a normal distribution, the non-parametric Mann–Whitney U test was used to examine differences in species diversity indices between July and August. Statistical analysis revealed no significant differences between the datasets for these two months. Moreover, as July and August represent the same season (summer), their data were combined for subsequent analyses.
2.6. Acoustic Data Analysis
Acoustic data for the primary frequencies used (38 kHz and 120 kHz) were analyzed with Echoview software (Echoview Software Pty. Ltd., version 12, Hobart, Australia) to identify fish and zooplankton. Various acoustic noises were encountered during the collection of acoustic data using a scientific echo sounder, leading to signal loss in normal acoustic signals. In this study, signal losses caused by background and impulse noises were addressed.
Background noise was removed using the time-varied threshold (TVT) method proposed by [20], and impulse noise was eliminated using the two-sided comparison method proposed by [21] (Table 2 and Table 3).

Table 2.
Setting parameters to remove background noise.

Table 3.
Setting parameters to remove impulse noise.
The frequency differencing method (), which utilizes the difference in the mean volume backscattering strength values between 38 kHz and 120 kHz, was applied to isolate the echo signals of target organisms. This method can be expressed by the following equation:
The target strength (TS) and species-specific length information were used to define the frequency difference ranges for each species and identify them. Species-specific echoes were extracted from echograms based on these ranges. The TSs for each species were extracted by referencing values reported in previous studies (Table 4). The target strength value of bony fish (−72.0 dB) was applied for separation for species lacking this information [22]. The densities of the dominant species were analyzed on a seasonal (monthly) basis using the referenced target strengths and length/weight data from the catch samples.

Table 4.
Seasonal (monthly) target strength and percentage of dominant species in the East China Sea using catch data.
Data range bitmaps were created by setting a range of values once the frequency differences in the fish species were clarified. A mask was then created by matching the echoes within the defined range to the cell size at a frequency of 38 kHz. This mask was further divided by ping intervals, and echoes matching the noise-filtered 38 kHz echoes were considered fish echoes. This process enabled the extraction of fish echoes with specific characteristics, enabling the identification of individual species.
Echoes obtained from the scientific echo sounder, referred to as elementary distance sampling units (EDSUs), were integrated over 1-nautical-mile intervals to estimate the density of the identified fish species. The integrated volume backscattering strength values were converted into nautical area scattering coefficients (NASCs, m2/nmi2). These NASC values were then used to determine the spatiotemporal distribution characteristics of the fish schools.
2.7. Estimation of Fish Density
The density of fish schools () can be calculated using Equation (4) by dividing the mean NASC over 1-nautical-mile interval by the backscattering cross-section () of an individual fish and multiplying this by the weight. In Equation (4), the terms on the right-hand side, excluding NASC, represent the species-specific conversion factor (CF), which converts acoustic estimates into fish density. This factor considers the backscattering cross-section () of the target species and the length/weight relationship. The average values of the backscattering cross-section and weight of the target species were used in the calculation.
The mean density of each transect was calculated using the received acoustic data, and the density data were calculated using the CF. The overall mean fish school density () for the entire survey area was determined as the weighted mean of the transect-specific mean densities, as shown in Equation (5):
where represents the mean density of the -th transect, denotes the number of EDSUs in the -th transect, and N is the total number of transects.
3. Results
3.1. Marine Environment
Marine environmental factors influence the distribution of marine organisms and fish resources. Therefore, a seasonal (monthly) marine environmental survey was conducted in the East China Sea in April, July, August, and November 2022, using a CTD profiler with a water sampler (SBE 911 Plus, Sea-Bird Scientific, Bellevue, WA, USA) (Figure 3 and Figure 4).
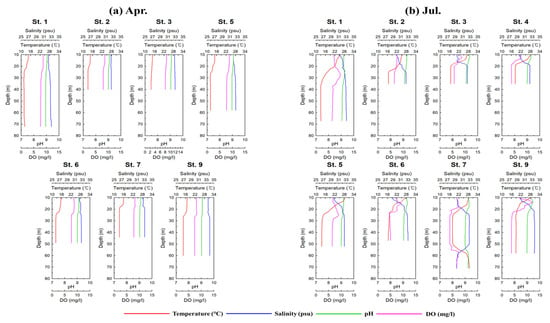
Figure 3.
Distribution of environmental factors by station during the study period (2022); (a) April, (b) July.
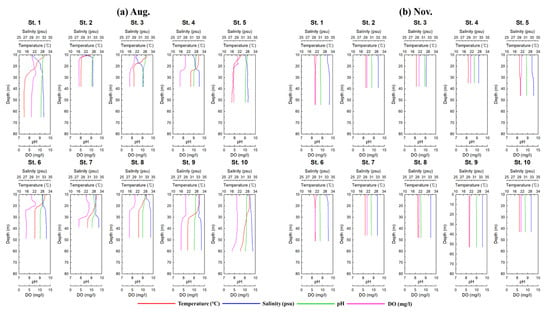
Figure 4.
Distribution of environmental factors by station during the study period (2022); (a) August, (b) November.
The seasonal (monthly) temperature distribution in the survey area showed higher temperatures in July and August and lower temperatures in April and November. In contrast, the salinity was higher in April and November and lower in July and August. Dissolved oxygen levels followed a seasonal (monthly) pattern, being lower in July and August and higher in April and November. The pH levels were higher in April, July, and November but tended to decrease in August.
The principal component analysis (PCA) of the environmental data revealed clear seasonal separations among the survey months (Figure 5). April stations clustered with high dissolved oxygen and moderate salinity conditions, whereas July and August stations were associated with higher temperatures and pH levels. November stations were grouped closer to high-salinity and lower-temperature conditions. These patterns reflect distinct seasonal regimes in water mass characteristics, indicating that temperature, salinity, DO, and pH collectively contribute to the spatiotemporal structuring of the East China Sea ecosystem.
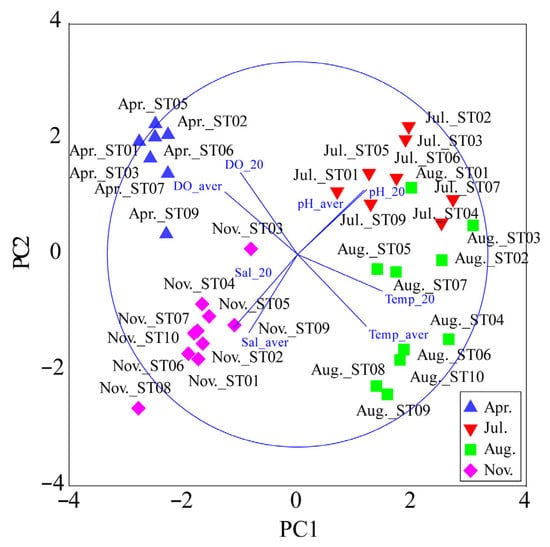
Figure 5.
Principal component analysis (PCA) biplot showing the influence of environmental variables (dissolved oxygen, temperature, salinity, and pH at surface and 20 m depth) on the sampling sites during four different months: April (▲), July (▼), August (■), and November (◆). Blue lines represent the contribution of each environmental parameter to the principal components PC1 and PC2.
3.2. Seasonal (Monthly) Species Composition Using Trawl Gear
During the seasonal (monthly) surveys conducted in April, July, August, and November 2022 in the East China Sea, a total of 21 fish species, six crustacean species, six cephalopod species, and two echinoderm species were identified. Species composition, dominance, abundance, and biomass were analyzed for each taxonomic group (Supplementary Table S2). Based on the total number of individuals collected by bottom trawling, crustaceans were the most abundant group, accounting for 50.4% (532 individuals), followed by fish (42.7%, 450 individuals), cephalopods (4.4%, 46 individuals), and echinoderms (2.6%, 27 individuals). However, in terms of biomass, fish contributed the most (52.4%, 43,091.2 g), followed by crustaceans (29.3%, 24,103 g), echinoderms (13.5%, 11,111.8 g), and cephalopods (4.8%, 3,906.4 g) (Supplementary Table S3).
Given the ecological importance of fish, this study focused exclusively on fish species in the subsequent analyses. The most frequently observed fish species—based on the number of sampling stations where each species was found—varied by season: Zoarces gillii in April, Lophius litulon in July, Trichiurus japonicus in August, and Miichthys miiuy in November. In terms of total abundance, Harpadon nehereus was most common in April, followed by Trachurus japonicus in both July and August, and Miichthys miiuy in November. In terms of biomass, Lophius litulon dominated in April, July, and August, while Miichthys miiuy contributed the most in November. These seasonal differences in occurrence and biomass reflect dynamic changes in the habitat use, population structure, and spatial dominance of fish species across the East China Sea.
Figure 6 presents a stacked bar chart showing the number of fish species captured by bottom trawling at each sampling station during the surveys. Each color represents a different month, highlighting seasonal and spatial patterns in species richness and community composition based on trawl data.
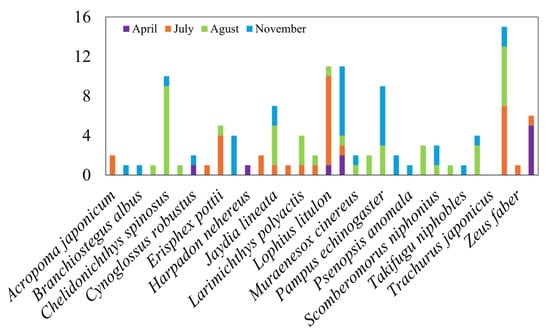
Figure 6.
Stacked bar chart showing the number of fish species captured by bottom trawling at each sampling station during seasonal surveys in the East China Sea (April, July, August, and November 2022). Each color represents a different survey month. The x-axis indicates the station codes, and the y-axis represents the number of species recorded per station. The figure illustrates seasonal and spatial variations in fish species composition based on trawl catch data.
3.3. Seasonal (Monthly) Species Composition of Fishery Resources Using Metabarcoding
During the seasonal (monthly) surveys conducted in April, July, August, and November 2022 in the East China Sea, fish species were identified through metabarcoding analysis using eDNA samples collected with a CTD profiler (Sea-Bird SBE 911 Plus, Otronix) equipped with a water sampler. The MitoFish database, which contains mitochondrial genome sequences of fish, was used for species identification.
Sequence clustering was performed based on ≥99% sequence identity and >80% coverage, and homology searches were conducted using MegaBLAST implemented in BLAST+ version 2.12.0 (NCBI, Bethesda, MD, USA) against the MitoFish database. The results were used to determine the proportions of taxonomic assignments at the species, genus, family, and phylum levels for each sample. Species-level identification was carried out based on BLAST results, and the number of fish species detected per station by season is shown in Figure 7. The total number of species and read counts for each station are summarized in Supplementary Tables S6–S9.
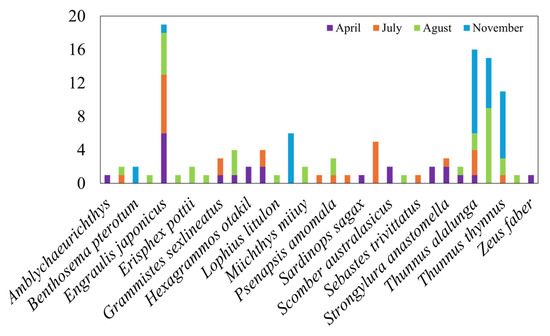
Figure 7.
Stacked bar chart showing the number of fish species detected by eDNA metabarcoding at each sampling station during seasonal surveys in the East China Sea (April, July, August, and November 2022). Each color indicates a different survey month. The x-axis represents sampling station codes, and the y-axis indicates the number of species detected per station. The figure highlights seasonal and spatial variation in species detection patterns using eDNA-based monitoring.
Demersal species that are difficult to detect using scientific echo sounders, as well as species for which no target strength (TS) data are available in the literature, were excluded from the dominant species analysis.
In November, Thunnus alalunga, Thunnus orientalis, and Thunnus thynnus were detected. Due to their identical genetic sequences in the 12S rDNA region, these species were grouped as “bluefin tuna” (Thunnus spp.), and their acoustic density was estimated collectively.
Figure 7 displays a stacked bar chart illustrating the number of fish species detected by eDNA metabarcoding at each station across the four survey months. This figure emphasizes seasonal and spatial patterns in eDNA-based species detection, particularly highlighting the enhanced detectability of surface- and midwater-dwelling taxa not readily sampled by trawl gear.
When comparing the results of the eDNA and trawl surveys, notable overlap in species composition was observed only in August, while the other months showed minimal overlap (Figure 8). Most species were independently detected by either method. These discrepancies likely reflect methodological differences in detection sensitivity, habitat depth coverage, species behavior, gear selectivity, and the dispersal characteristics of eDNA in the marine environment.
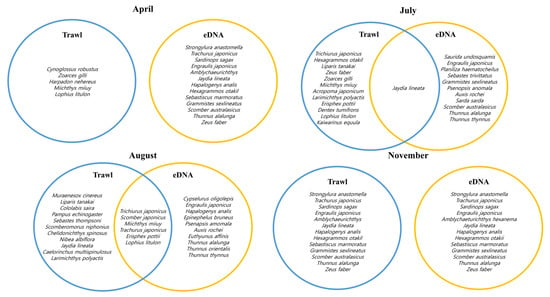
Figure 8.
Seasonal comparison of species composition between trawl and eDNA methods based on Venn diagrams. Each panel represents the number of fish species detected by trawling (left circle) and eDNA (right circle) for each survey month: April, July, August, and November 2022. The overlapping areas indicate species detected by both methods.
3.4. Diversity Index
In total, 30 fish species were caught by trawling, whereas 31 were detected using eDNA. Approximately 27% of the species overlapped. The species diversity of the trawl and eDNA samples collected in July and August was compared. A Mann–Whitney U test was conducted to analyze the Shannon–Wiener diversity index of the trawl and eDNA data, and a significant difference was observed (July and August, p < 0.02).
3.5. Seasonal (Monthly) Density of Dominant Species Using Trawling and Scientific Echo Sounder
The density of the dominant species was estimated for April, July, August, and November 2022 using the length/weight data from trawl catches and the TS values cited in previous studies (Table 5). In the April survey, most of the catches consisted of demersal fish species, and due to the limited availability of target strength (TS) data, density estimation was performed only for Portunus trituberculatus.

Table 5.
Seasonal (monthly) comparison of estimated acoustic density of dominant species in the East China Sea during the study period (2022) using trawling.
The average densities of the dominant species in the East China Sea survey area were 0.021 g/m2 for Portunus trituberculatus in April and 0.007 g/m2 for Trichiurus lepturus, 0.451 g/m2 for Scomber japonicus, and 0.335 g/m2 for Trachurus japonicus in July.
In August, the average densities of the dominant species were 0.001 g/m2 for T. lepturus, 0.255 g/m2 for S. japonicus, and 0.248 g/m2 for T. japonicus, while it was 1.709 g/m2 for Pampus argenteus in November.
The total average densities of the dominant species for all transects were 0.021 g/m 2 in April, 0.793 g/m2 in July, 0.504 g/m 2 in August, and 1.709 g/m 2 in November. The total average density of the dominant species was the highest in November and lowest in April.
3.6. Seasonal (Monthly) Density of Dominant Species Using eDNA and Scientific Echo Sounder
The seasonal (monthly) density of the dominant species identified using metabarcoding analysis technology with eDNA, along with the TS values and length/weight data from previous studies, were analyzed for April, July, August, and November 2022 (Table 6).

Table 6.
Seasonal (monthly) comparison of estimated acoustic density of dominant species in the East China Sea during the study period (2022) using eDNA.
In April 2022, the average densities of the dominant species in the East China Sea survey area were 0.043 g/m2 for Scomber japonicus, 0.085 g/m2 for Thunnus alalunga, 0.020 g/m2 for Engraulis japonicus, and 0.173 g/m2 for Hexagrammos otakii.
In July, the average densities of the dominant species were 0.085 g/m2 for T. alalunga and 0.020 g/m2 for E. japonicus. In August, the average density of dominant species was 0.085 g/m2 for Thunnini and 0.020 g/m2 for E. japonicus.
In November, the average densities of the dominant species were 0.057 g/m2 for Thunnus orientalis, 0.057 g/m2 for T. alalunga, and 0.013 g/m2 for E. japonicus.
The total average densities of the dominant species across all transects were 0.321 g/m2 in April, 0.105 g/m2 in July, 0.105 g/m2 in August, and 0.127 g/m2 in November. The total average density of the dominant species was highest in April and lowest in July and August.
4. Discussion
This study evaluated the seasonal variations in fish species composition and distribution in the East China Sea through a multi-method approach, incorporating bottom trawl surveys, eDNA metabarcoding, and scientific echo sounder-based acoustic techniques during April, July, August, and November 2022. Each method differs in terms of ecological detection range, spatial coverage, and sensitivity, and their integrated comparison contributes to a more comprehensive understanding of the spatiotemporal dynamics of marine ecosystems. Seasonal environmental changes had a clear influence on fish community structures. Water temperature, salinity, dissolved oxygen, and pH formed distinct water mass characteristics each month, affecting the occurrence and vertical distribution of dominant species. In August, vertical mixing and increased surface temperature facilitated the upward movement of demersal and mesopelagic species, resulting in greater overlap in dominant taxa between the trawl and eDNA analyses. Indeed, ten shared dominant species were identified by both methods in August, reflecting a seasonal convergence in vertical distribution. A similar trend was also reported in a previous study in the Zhoushan coastal region [28].
Trichiurus japonicus exhibited an average body length of 22.9 cm in June, with many small individuals, whereas in August, the average sharply increased to 47.9 cm. This is interpreted as a result of the rapid summer growth of post-spawning individuals in response to increased temperatures. The authors of [29] reported that juveniles of this species exhibit accelerated growth during warm seasons due to high food availability and thermal conditions. The authors of [30] further stated that the main spawning season occurs between April and June, and by August, most individuals transition into the first-year adult stage, which is consistent with our findings.
Trachurus japonicus was not captured in June, but small individuals were present from August onward. This aligns with its typical seasonal northward migration pattern, in which larvae spawned in the southern East China Sea are transported northward by the Kuroshio Current and its branches [31]. At this time, individuals of similar size were detected using both trawling and eDNA.
Strongylura anastomella exhibited relatively stable body lengths of 5.6–6.4 cm throughout all seasons. This may suggest either year-round residency with consistent growth or species-specific traits showing minimal seasonal size variation.
In contrast, during stratified seasons such as April and November—when strong vertical layering was induced by temperature and salinity gradients—the species composition was distinctly separated between surface and bottom layers, resulting in minimal species overlap between the eDNA and trawl results. For instance, in April, demersal species such as Cynoglossus robustus and Lophius litulon were mainly captured by trawling, whereas surface-associated taxa such as Engraulis japonicus and Strongylura anastomella were dominant in eDNA results. This illustrates the ecological detection differences among methods. The authors of [32] also reported that eDNA is more effective in detecting mobile or surface-dwelling species, while trawling is specialized for benthic species, indicating the complementary nature of the two approaches.
To further explore these seasonal patterns, we conducted redundancy analysis (RDA) using both eDNA and trawl datasets for each sampling month. The RDA plots revealed distinct differences in species composition and environmental responses between the two methods. In April, eDNA detected surface-associated species such as Sebastiscus marmoratus and Engraulis japonicus, which were strongly correlated with dissolved oxygen, whereas the trawl survey captured demersal species like Cynoglossus robustus and Lophius litulon, showing associations with bottom-layer temperature and salinity. During July and August, water column mixing reduced vertical stratification, resulting in an increased overlap in species composition and environmental response patterns between the two methods—most notably, species like Trichiurus japonicus and Trachurus japonicus were commonly detected by both. In contrast, the November RDA again showed divergence between the methods, with eDNA detecting pelagic species influenced by DO and pH, and trawling identifying demersal taxa associated with salinity and temperature gradients. These RDA results further support the seasonal variability in method-specific detection efficiency and reinforce the complementary nature of eDNA and trawl surveys (Figure 9 and Figure 10).
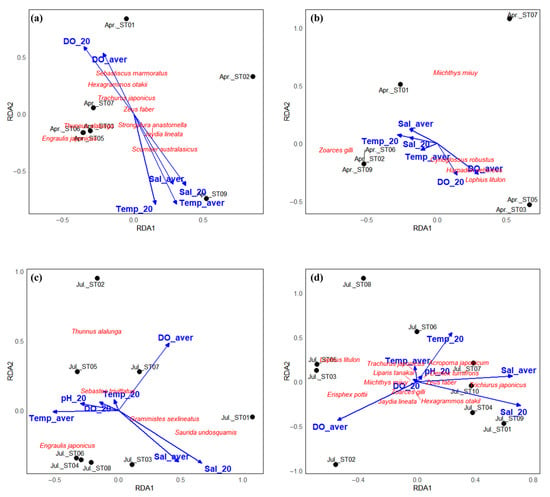
Figure 9.
Redundancy analysis (RDA) plots showing the relationships between fish species composition, environmental variables, and sampling stations in the East China Sea in April (a,b) and July (c,d), 2022. Panels (a,c) present results from eDNA metabarcoding, while panels (b,d) show results from bottom trawl surveys. Environmental variables (blue arrows) include temperature (Temp_aver, Temp_20), salinity (Sal_aver, Sal_20), dissolved oxygen (DO_aver, DO_20), and pH (pH_aver, pH_20). Fish species are labeled in red, and black dots represent sampling stations. The RDA plots illustrate seasonal and methodological differences in species–environment associations and highlight depth-related biases between surface-oriented (eDNA) and bottom-oriented (trawl) detection methods.
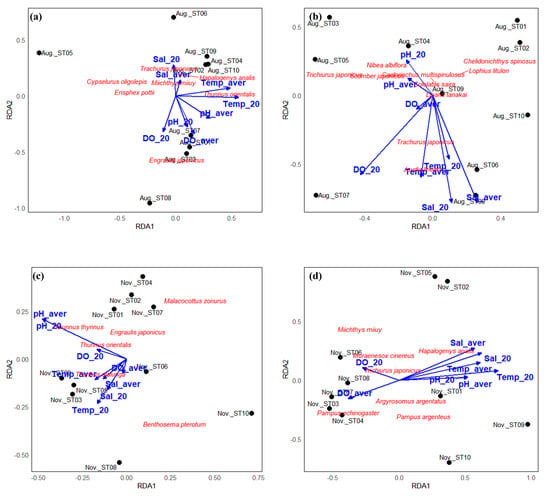
Figure 10.
Redundancy analysis (RDA) plots for fish community structure and environmental gradients in the East China Sea in August (a,b) and November (c,d), 2022. Panels (a,b) represent results from eDNA metabarcoding, and panels (c,d) show results from bottom trawl surveys. Blue arrows indicate environmental variables (temperature, salinity, dissolved oxygen, and pH) averaged over the full column and the 0–20 m layer. Red labels indicate detected fish species, and black dots show the sampling stations. The plots demonstrate seasonal changes in species–environment relationships and reveal how vertical stratification or mixing affects community detection by each survey method.
Acoustic-based density analyses also revealed discrepancies. Biomass derived from trawl data peaked in November, whereas the highest eDNA-based density was observed in April. This may reflect the acoustic method’s sensitivity to species-specific biomass concentration, body size, vertical distribution, and the availability of target strength (TS) information. In contrast, eDNA analysis, due to its surface-oriented sampling and the limitations of its genetic reference databases, may lead to the over- or underestimation of certain species. Notably, species such as Scomber japonicus, Thunnus spp., and Engraulis japonicus were frequently detected via eDNA but were less dominant in trawl or acoustic datasets. This highlights the strong influence of surface sampling on eDNA detection sensitivity, especially during warm seasons when DNA degradation accelerates, potentially resulting in underestimation.
These results suggest that a simple cross-comparison among survey methods is challenging. While biomass or NASC per unit area is useful for spatial comparison, it cannot serve as a representative index of total resources unless sensitivity, detection range, and data quality of each method are jointly considered. Furthermore, eDNA has a high potential for broad species detection but faces challenges in species-level accuracy due to marker redundancy and incomplete reference databases. In this study, for example, Thunnus alalunga, T. orientalis, and T. thynnus could not be distinguished and were classified as a single group.
In the future, it is necessary to quantify the detection sensitivity and false positive/negative rates of each method and to integrate data from co-located stations using GLMs or probabilistic models for a comparison of their reliability and calibration. Survey design improvements such as collecting eDNA samples by depth layers, introducing midwater and surface trawls, and obtaining high-resolution TS data by species are also required. These approaches will enhance the accuracy of monitoring in seasonally dynamic ecosystems like the East China Sea and support the development of customized strategies for different target species across seasons.
In conclusion, this study demonstrates an integrated approach combining eDNA, trawl, and acoustic methods for fishery resource assessment in the East China Sea. By highlighting the complementary strengths of each method, we provide a robust basis for understanding the spatiotemporal dynamics of fish communities and for advancing more accurate and sustainable fishery management strategies.
5. Conclusions
This study investigated the seasonal dynamics of fish communities in the East China Sea based on seasonal surveys conducted in April, July, August, and November. By comparing and integrating results from bottom trawl surveys, scientific echo sounders, and eDNA metabarcoding, we assessed the efficiency and limitations of each method for marine biological resource monitoring. Distinct seasonal variations were observed in fish community composition. In particular, spring and autumn showed high species diversity due to the coexistence of demersal and migratory species, while in summer, elevated water temperatures and hypoxic conditions induced vertical redistribution, leading to the upward migration of certain species and affecting detection sensitivity by individual survey methods.
In April, demersal crustaceans such as Ovalipes punctatus and Portunus trituberculatus were dominant, whereas in July–August, pelagic fish species, including Trachurus japonicus, Trichiurus lepturus, and Scomber japonicus, were relatively abundant. In November, species adapted to the low temperature and high-salinity conditions, such as members of the family Sciaenidae and Pampus argenteus, were commonly observed, characterizing the autumn fish assemblages.
These seasonal shifts in species composition reaffirm the ecological role of the East China Sea as a key spawning and overwintering ground and indicate a strong correlation between species turnover and environmental drivers. Notably, during the warm summer period, vertical water mass stratification and hypoxia directly influenced fish community structure, either by causing an upward redistribution or a reduced density of certain species. Understanding such spatiotemporal dynamics is fundamental for effective fishery resource assessment and management.
Furthermore, this study empirically compared the ecological detection ranges, sensitivities, and biases of each survey method by analyzing results from the same sampling stations. The trawl survey demonstrated strength in detecting demersal species and enabling physical specimen collection, but it tended to underestimate pelagic or migratory species. eDNA metabarcoding enabled broad taxonomic detection with a high sensitivity, yet showed limitations for mid- and deep-water species due to DNA degradation, dilution, and primer specificity issues. Acoustic methods provided high-resolution biomass estimates for schools above a certain body size but lacked the capacity for species identification and excluded species without established TS (target strength) values.
Substantial differences in biomass estimates were observed among the methods. For example, eDNA-based density values were up to 15 times higher than those from trawl surveys, reflecting differences in detection sensitivity and data processing approaches. These discrepancies reflect the method-specific biases and detection scopes, emphasizing the importance of cautious integration rather than conducting a simple cross-method comparison. Recognizing and strategically integrating their respective strengths and limitations can help construct a more nuanced and balanced assessment of fish community structure and biomass, rather than relying on any single method.
Future studies should incorporate depth-stratified eDNA sampling and mid- and surface-layer trawl surveys to better resolve vertical distribution patterns. Additionally, the development of machine learning-based integrative models is needed to unify occurrence data across survey types. Ultimately, by establishing models that quantitatively link fish occurrence with environmental variables (e.g., temperature, salinity, and dissolved oxygen), we can enhance our predictive understanding of community dynamics. This will provide a critical scientific foundation for sustainable fishery resource management in highly dynamic regions like the East China Sea.
Supplementary Materials
The following supporting information can be downloaded at: https://www.mdpi.com/article/10.3390/w17162477/s1, Table S1: PCR Composition and Reaction Conditions; Table S2: Seasonal (monthly) comparison of number of taxon caught by bottom trawling in the East China Sea during the study period (2022); Table S3: The individuals and biomass of the taxon caught using bottom trawl in the East China sea during the study period (2022); Table S4: Seasonal (monthly) comparison of dominant species abundance (individuals) caught by bottom trawling in the East China Sea during the study period (2022); Table S5: Seasonal (monthly) comparison of dominant species abundance (biomass) caught by bottom trawling in the East China Sea during the study period (2022); Table S6: Species and the number of read counts for the sampled occurrence taxa in the East China Sea in April 2022 (Occurrence ranking 1, 2, 3:); Table S7: Species and the number of read counts for the sampled occurrence taxa in the East China Sea in July 2022 (Occurrence ranking 1, 2, 3:); Table S8: Species and the number of read counts for the sampled occurrence taxa in the East China Sea in August 2022 (Occurrence ranking 1, 2, 3:); Table S9: Species and the number of read counts for the sampled occurrence taxa in the East China Sea in November 2022 (Occurrence ranking 1, 2, 3:).
Author Contributions
Conceptualization, K.L. and J.K.L.; methodology, W.O.; software, G.P.; validation, G.P. and S.L.; formal analysis, G.P.; investigation, J.K.L.; resources, K.L.; data curation, W.O.; writing—original draft preparation, S.L.; writing—review and editing, K.L.; visualization, J.K.L.; supervision, K.L.; project administration, K.L.; funding acquisition, K.L. All authors have read and agreed to the published version of the manuscript.
Funding
This research was supported by “Development of Advanced Science and Technology for Marine Environmental Impact Assessment” of Korea Institute of Marine Science & Technology Promotion (KIMST) funded by the Ministry of Oceans and Fisheries (RS-2021-KS211469) and it was partially funded by the Grant (RS-2025-02307389).
Data Availability Statement
The original contributions presented in this study are included in the article. Further inquiries can be directed to the corresponding author.
Acknowledgments
We would like to thank the researchers of the T/S SaeDongBaek of Chonnam National University for helping with the experiment. We are grateful to the two anonymous reviewers that helped improve this paper.
Conflicts of Interest
The authors declare no conflicts of interest.
References
- Sherman, K.; Hempel, G. X-22 East China Sea: LME. The UNEP Large Marine Ecosystem Report: A Perspective on Changing Conditions in LMEs of the World’s Regional Seas; UNEP Regional Seas Report and Studies; United Nations Environment Programme: Nairobi, Kenya, 2008; Volume 182, pp. 383–392. [Google Scholar]
- Li, J.; Chen, Y.; Pan, S.; Pan, Y.; Fang, J.; Sowa, D.M. Estimation of mean and extreme waves in the East China Seas. Appl. Ocean Res. 2016, 56, 35–47. [Google Scholar] [CrossRef]
- Liu, Y.; Cheng, J. Analysis of the interrelation and seasonal variation characteristics of the spatial niche of dominant fishery species—A case study of the East China Sea. Biology 2024, 13, 751. [Google Scholar] [CrossRef]
- Peng, Y.; Yin, W. Spatial–Temporal Distribution of Offshore Transport Pathways of Coastal Water Masses in the East China Sea Based on GOCI-TSS. Water 2025, 17, 1370. [Google Scholar] [CrossRef]
- Chang, N.N.; Shiao, J.C.; Gong, G.C. Diversity of demersal fish in the East China Sea: Implication of eutrophication and fishery. Cont. Shelf Res. 2012, 47, 42–54. [Google Scholar] [CrossRef]
- Zhang, S.; Jin, S.; Zhang, H.; Fan, W.; Tang, F.; Yang, S. Distribution of bottom trawling effort in the Yellow Sea and East China Sea. PLoS ONE 2016, 11, e0166640. [Google Scholar] [CrossRef]
- Liu, Y.; Cheng, J.H. A preliminary analysis of variation characteristics of structure and average trophic level of the main fishery species caught by paired bottom trawl in the East China Sea and the Yellow Sea during the fall season. J. Fish. China 2015, 396, 691–702. [Google Scholar]
- Ohshimo, S. Spatial distribution and biomass of pelagic fish in the East China Sea in summer, based on acoustic surveys from 1997 to 2001. Fish. Sci. 2004, 70, 389–400. [Google Scholar] [CrossRef]
- Ohshimo, S. Acoustic estimation of biomass and school character of anchovy Engraulis japonicus in the East China Sea and the Yellow Sea. Fish. Sci. 1996, 62, 344–349. [Google Scholar] [CrossRef]
- Thomsen, P.F.; Willerslev, E. Environmental DNA–An emerging tool in conservation for monitoring past and present biodiversity. Biol. Conserv. 2015, 183, 4–18. [Google Scholar] [CrossRef]
- Easson, C.G.; Boswell, K.M.; Tucker, N.; Warren, J.D.; Lopez, J.V. Combined eDNA and acoustic analysis reflects diel vertical migration of mixed consortia in the Gulf of Mexico. Front. Mar. Sci. 2020, 7, 552. [Google Scholar] [CrossRef]
- Gold, Z.; Sprague, J.; Kushner, D.J.; Zerecero Marin, E.; Barber, P.H. eDNA metabarcoding as a biomonitoring tool for marine protected areas. PLoS ONE 2021, 16, e0238557. [Google Scholar] [CrossRef]
- Danziger, A.M.; Olson, Z.H.; Frederich, M. Limitations of eDNA analysis for Carcinus maenas abundance estimations. BMC Ecol. Evol. 2022, 22, 14. [Google Scholar] [CrossRef]
- Collins, R.A.; Wangensteen, O.S.; O’Gorman, E.J.; Mariani, S.; Sims, D.W.; Genner, M.J. Persistence of environmental DNA in marine systems. Commun. Biol. 2018, 1, 185. [Google Scholar] [CrossRef]
- Fraija-Fernández, N.; Bouquieaux, M.C.; Rey, A.; Mendibil, I.; Cotano, U.; Irigoien, X.; Santos, M.; Rodríguez-Ezpeleta, N. Marine water environmental DNA metabarcoding provides a comprehensive fish diversity assessment and reveals spatial patterns in a large oceanic area. Ecol. Evol. 2020, 10, 7560–7584. [Google Scholar] [CrossRef]
- Aglen, A. Random Errors of Acoustic Fish Abundance Estimates in Relation to the Survey Grid Density Applied; FAO Fisheries Report (FAO); FAO: Rome, Italy, 1983. [Google Scholar]
- MacLennan, D.N.; Simmonds, E.J. Fisheries Acoustics; Springer Science Business Media: Boston, NY, USA, 2013; Volume 5. [Google Scholar]
- Stoeckle, M.Y.; Adolf, J.; Charlop-Powers, Z.; Dunton, K.J.; Hinks, G.; VanMorter, S.M. Trawl and eDNA assessment of marine fish diversity, seasonality, and relative abundance in coastal New Jersey, USA. ICES J. Mar. Sci. 2021, 78, 293–304. [Google Scholar] [CrossRef]
- Miya, M.; Sato, Y.; Fukunaga, T.; Sado, T.; Poulsen, J.Y.; Sato, K.; Minamoto, T.; Yamamoto, S.; Yamanaka, H.; Araki, H.; et al. MiFish, a set of universal PCR primers for metabarcoding environmental DNA from fishes: Detection of more than 230 subtropical marine species. R. Soc. Open Sci. 2015, 2, 150088. [Google Scholar] [CrossRef] [PubMed]
- De Robertis, A.; Higginbottom, I. A post-processing technique to estimate the signal-to-noise ratio and remove echosounder background noise. ICES J. Mar. Sci. 2007, 64, 1282–1291. [Google Scholar] [CrossRef]
- Ryan, T.E.; Downie, R.A.; Kloser, R.J.; Keith, G. Reducing bias due to noise and attenuation in open-ocean echo integration data. ICES J. Mar. Sci. 2015, 72, 2482–2493. [Google Scholar] [CrossRef]
- Lee, H.B.; Seo, Y.I.; Oh, T.Y.; Choi, J.H.; Jo, H.S.; Choi, K.H. Distribution of Demersal Fish Based on a Combined Acoustic and Trawl Survey during Day and Night in Coastal of the South Sea, Korea. Korean J. Fish. Aquat. Sci. 2015, 48, 798–804. [Google Scholar]
- Yoon, H.S.; Jung, H.T.; Rha, S.J.; Moon, S.Y.; Choi, S.D. The studies on the marine benthic invertebrates appearing biomass in the East China Sea. J. Korean Soc. Fish. Ocean Technol. 2005, 11, 47–61. [Google Scholar]
- Zhao, X. In situ target-strength measurement of young hairtail (Trichiurus haumela) in the Yellow Sea. ICES J. Mar. Sci. 2006, 63, 46–51. [Google Scholar] [CrossRef]
- Park, G.; Oh, W.; Oh, S.; Lee, K. Acoustic scattering characteristics of chub mackerel (Scomber japonicus) by KRM model. J. Korean Soc. Fish. Ocean Technol. 2022, 58, 32–38. [Google Scholar] [CrossRef]
- Hwang, K.; Yoon, E.-A.; Lee, K.; Lee, H.; Hwang, D.-J. Multifrequency acoustic scattering characteristics of jack mackerel by KRM model. J. Korean Soc. Fish. Ocean Technol. 2015, 51, 424–431. [Google Scholar] [CrossRef]
- Lee, D.; Shin, H. Construction of a data bank for acoustic Target Strength with fish species, length and acoustic frequency for measuring fish size distribution. J. Korean Fish. Soc. 2005, 38, 265–275. [Google Scholar]
- Zhai, B.; Zhang, X.; Wang, L.; Zhang, Z.; Zou, L.; Sun, Z.; Jiang, Y. Concentration distribution and assessment of heavy metals in surface sediments in the Zhoushan Islands coastal sea, East China Sea. Mar. Pollut. Bull. 2021, 164, 112096. [Google Scholar] [CrossRef]
- Sun, P.; Chen, Q.; Fu, C.; Zhu, W.; Li, J.; Zhang, C.; Yu, H.; Sun, R.; Xu, Y.; Tian, Y. Daily growth of young-of-the-year largehead hairtail (Trichiurus japonicus) in relation to environmental variables in the East China Sea. J. Mar. Syst. 2020, 201, 103243. [Google Scholar] [CrossRef]
- Cheng, S.; Sun, P.; Liu, Y.; Chen, Q.; Shi, Z.; Sun, R. Age, growth and maturation of largehead hairtail (Trichiurus japonicus) in the East China Sea. J. Ocean Univ. China 2022, 21, 1244–1250. [Google Scholar] [CrossRef]
- Sassa, C.; Konishi, Y.; Mori, K. Distribution of jack mackerel (Trachurus japonicus) larvae and juveniles in the East China Sea, with special reference to the larval transport by the Kuroshio Current. Fish. Oceanogr. 2006, 15, 508–518. [Google Scholar] [CrossRef]
- Kelly, R.P.; Gallego, R.; Jacobs-Palmer, E. The effect of tides on nearshore environmental DNA. PeerJ 2018, 6, e4521. [Google Scholar] [CrossRef]
Disclaimer/Publisher’s Note: The statements, opinions and data contained in all publications are solely those of the individual author(s) and contributor(s) and not of MDPI and/or the editor(s). MDPI and/or the editor(s) disclaim responsibility for any injury to people or property resulting from any ideas, methods, instructions or products referred to in the content. |
© 2025 by the authors. Licensee MDPI, Basel, Switzerland. This article is an open access article distributed under the terms and conditions of the Creative Commons Attribution (CC BY) license (https://creativecommons.org/licenses/by/4.0/).