Article

Spatiotemporal Dynamics of Drought Propagation in the Loess Plateau: A Geomorphological Perspective

1
School of Water and Environment, Chang’an University, Xi’an 710054, China
2
Key Laboratory of Subsurface Hydrology and Ecological Effect in Arid Region of Ministry of Education, Chang’an University, Xi’an 710054, China
3
Key Laboratory of Eco-Hydrology and Water Security in Arid and Semi-Arid Regions of the Ministry of Water Resources, Chang’an University, Xi’an 710054, China
4
Gansu Water Resources and Hydropower Survey, Design and Research Institute Co., Ltd., Lanzhou 730030, China
5
PowerChina Northwest Engineering Corporation Limited, Xi’an 710100, China
6
School of Civil Engineering, Xijing University, Xi’an 710123, China
*
Author to whom correspondence should be addressed.
Water 2025, 17(16), 2447; https://doi.org/10.3390/w17162447
Submission received: 29 June 2025 / Revised: 13 August 2025 / Accepted: 16 August 2025 / Published: 19 August 2025
(This article belongs to the Special Issue Watershed Hydrology and Management under Changing Climate)

Abstract

The Loess Plateau frequently endures droughts, and the propagation process has grown more intricate due to the interplay of climate change and human activities. This study developed the Standardized Precipitation Evapotranspiration Index (SPEI) and the Standardized Soil Moisture Index (SSMI) on a 3-month scale and examined the spatiotemporal characteristics and driving mechanisms of drought propagation from meteorological to agricultural drought utilizing cross-wavelet analysis, grey relational analysis, and the optimal parameter-based geographical detector (OPGD) model. The results demonstrate a substantial seasonal correlation between meteorological and agricultural droughts in spring, summer, and autumn, as evidenced by cross-wavelet coherence analysis (wavelet coherence > 0.8, p < 0.05). Lag analysis utilizing grey relational degree (>0.8) indicates that drought propagation generally manifests with a temporal delay of 1–3 months, with the shortest lag observed in spring (average 1.2 months) and the longest in winter (average 3.1 months). Distinct spatial heterogeneity is seen within geomorphological divisions: the loess wide valley hills and loess beam hills divisions exhibit the highest propagation rates (0.64 and 0.59), whereas the loess tableland and soil–stone hills divisions have lower propagation (around 0.50). The OPGD results reveal that precipitation, soil moisture, and temperature are the principal contributing factors, although their effects differ among geomorphological types. Interactions among components exhibit synergistic enhancement effects. This study improves our comprehension of seasonal and geomorphological heterogeneity in drought propagation from meteorological to agricultural droughts and provides quantitative evidence to support early drought warnings across various divisions, agricultural risk assessment, and water security strategies in the Loess Plateau.

1. Introduction

Drought is an extreme natural disaster, characterized by extensive distribution, considerable destructiveness, and substantial losses [1,2,3,4]. It presents significant risks to ecological systems, socioeconomic development, and even human existence. Reports from the United Nations indicate that more than seventy-five percent of global land has experienced permanent drought in recent decades, with drought-affected areas continuing to increase [5]. China is one of the countries undergoing the most significant transition from non-arid to arid regions. Annual economic losses due to drought surpass CNY 34 billion, impacting 200,000 km2 of farmland and diminishing grain production by more than 26 billion kilograms per year [6,7]. Studies suggest that future climate change scenarios will likely lead to an increase in both the frequency and intensity of droughts [8,9], which will considerably affect regional livelihood security [10]. Consequently, the precise identification of drought events and comprehension of their propagation dynamics is essential for regional sustainable development and social ecological security.
Recently, drought propagation has become a focal point of research in hydrology and water resources. Droughts are typically categorized into four types based on their causes and affected areas: meteorological, hydrological, agricultural, and socioeconomic droughts [11,12,13]. Prolonged precipitation deficits, elevated temperature heat waves, and heightened evapotranspiration can all lead to meteorological droughts [14]. These, in turn, drive abnormal energy and water transfer in the hydrosphere via water vapor processes, resulting in less runoff and groundwater recharge, thereby inducing hydrological drought. The interplay of several factors may result in sustained soil moisture depletion, potentially causing agricultural drought. Intensified drought circumstances may lead to water supply constraints and adversely affect human systems, resulting in socioeconomic drought [15].
Currently, research on drought propagation predominantly focuses on three principal aspects—propagation time, propagation probability, and driving mechanisms—with related findings becoming increasingly abundant. Barker et al. [16] proposed determining propagation time by evaluating the correlation coefficient between two drought indices across various time scales and picking the time scale with the highest correlation as the propagation time. This approach has been extensively applied in studies concerning drought propagation, encompassing meteorological, agricultural, and hydrological droughts [17,18]. Xu et al. [19] employed this method to evaluate the drought propagation process in northern and southern China, revealing that the propagation duration escalated from 2 months to 7 months when transitioning from South China to North China. Sarwar et al. [20] highlighted that hydrological drought in the Soan River basin of Pakistan occurred 1–3 months after meteorological drought, with the propagation process significantly affected by sub-basin land use and temporal scale. Furthermore, the Copula function method is adopted to construct conditional probability models of drought occurrence, delineating both the linear and nonlinear relationships between drought indices, thus expanding the estimation path of drought propagation time [21]. Mainstream approaches for assessing propagation probability encompass the Copula function, Bayesian network, multiple regression model, and their coupled forms. Sattar et al. [22] employed a Bayesian network model to examine drought propagation pathways in South Korea, revealing that the probability of meteorological drought triggering hydrological drought ranged from 27% to 60%. Dehghani et al. [23] investigated the Karun Basin in Iran and reported that extreme or severe meteorological droughts had a 70% probability of leading to hydrological droughts, substantially surpassing the chance associated with mild drought conditions. Similarly, Geng et al. [24] integrated copula functions with Bayesian network analysis and determined that the average probability of extreme meteorological drought inducing mild agricultural drought in China reached 61.93%.
Previous studies have demonstrated that drought propagation is typically driven by a combination of climatic factors (e.g., precipitation, temperature, and evapotranspiration) and human activities [8,25], with the explanatory power of these factors varying considerably across different regions. Although significant advancements have been made in estimating drought propagation time, probability, and driving factors, most existing studies have focused on single regions or scales, failing to provide a systematic analysis of the regulatory role of geomorphological factors in the propagation process. Nonetheless, accumulating evidence indicates that drought characteristics and propagation mechanisms differ markedly across different geomorphological zones [19,20,26]. Therefore, it is essential to thoroughly reveal the impact of geomorphological factors on the spatial heterogeneity of drought propagation, particularly in areas with complex natural geographical conditions.
The Loess Plateau, one of the regions in China most susceptible to drought disasters, is marked by severe drought conditions and varied geomorphological types [27,28]. The region contains a variety of typical landforms, including loess tablelands, ridge hills, and wind dunes. These geomorphological units exhibit significant differences in hydrological response and intensity of human intervention, resulting in pronounced spatial heterogeneity in drought propagation. Consequently, delineating response units based on geomorphological types to discern spatial variations in drought propagation patterns is crucial for advancing the comprehension of drought evolution mechanisms. To this end, this study takes the Loess Plateau in northern Shaanxi as a representative case, examining the spatiotemporal propagation process from meteorological drought to agricultural drought across different geomorphological divisions. The optimal parameter-based geographical detector (OPGD) systematically analyzes the interactions between the effective propagation rate of drought and multiple driving factors across different geomorphological types. The findings provide valuable scientific support for enhancing the spatial accuracy of drought identification and formulating targeted drought mitigation strategies in response to climate change. Moreover, they provide direct assistance for early drought warnings and agricultural risk assessments across various geomorphological units, and they are anticipated to have a major influence on research on drought mitigation, as well as on actual management.

2. Study Area and Data Sources

2.1. Study Area

The Loess Plateau in northern Shaanxi is located at the core area of the Loess Plateau, spanning from 107°15′ E to 111°14′ E and from 35°04′ N to 39°15′ N [29,30]. The region primarily encompasses Yulin City and Yan’an City, with 25 counties and a total area of approximately 80,000 km2 [31]. The terrain predominantly inclines from northwest to southeast, with an average elevation of 800–1800 m [32]. This area is a transitional zone from a warm temperate continental monsoon humid climate to an inland arid climate, characterized by pronounced seasonality. Spring features frequent winds and little precipitation; summer is hot and rainy; autumn experiences declining temperatures with frequent overcast and rainy conditions; and winter is cold and dry with scant snow or rain. The annual mean temperature ranges from 8 °C to 12 °C [29], and the annual precipitation varies between 350 mm and 600 mm, with highly uneven spatial and temporal distribution [33]. The annual potential evaporation is approximately 1000 mm, significantly exceeding the annual precipitation, hence indicating a substantial water deficit in the region.
Due to the extensive topographic undulation and diverse geomorphological types, drought occurrence and propagation in this region exhibit marked spatial heterogeneity [8]. These geomorphological units exhibit significant differences in hydrological response and intensity of human intervention. Therefore, in examining the propagation characteristics of meteorological drought to agricultural drought, it is essential to incorporate geomorphological division as a key spatial response unit. This study referred to the “Geographical Division Map of the Loess Plateau (2000)” released by the National Earth System Science Data Center (http://www.geodata.cn) (see Figure S1) [34]. The northern Loess Plateau was categorized into seven representative geomorphological types based on the spatial overlap between the study area and the divisions: loess tableland, cover sand loess hills, loess hilly mounds, loess beam hills, loess wide valley hills, wind–sand hills, and soil–stone hills. This geomorphological division was developed by the China National Earth System Science Data Center, emphasizing factors such as topographic relief, soil structure, human disturbance intensity, landform shape, hydrometeorological conditions, and land use patterns during the delineation process. This method guarantees that the resultant divisions display distinct inter-regional variations in topographic relief, soil composition, and levels of human disturbance while preserving relative intra-regional consistency in landform shape, hydrometeorological conditions, and land use patterns. Figure 1 illustrates the geographic location and geomorphological divisions of the study area.

2.2. Data Source

The data used in this study are primarily classified into three types: meteorological data, underlying surface data, and human activity data. Precipitation, temperature, evapotranspiration, and the aridity index are among the most used meteorological data. The precipitation, temperature, and evapotranspiration data were obtained from the 1 km monthly datasets of precipitation, mean air temperature, and potential evapotranspiration in China [35,36,37,38,39]. The annual aridity index represents the ratio of annual potential evapotranspiration to annual total precipitation, computed from the 1 km annual aridity index dataset for China [35,37,38,39]. Underlying surface data consist of a DEM, slope, soil moisture, and geomorphological division of the Loess Plateau. Specifically, soil moisture data were obtained from the GLDAS-NOAH model, incorporating both version 2.0 and 2.1 monthly datasets (0–10 cm) at a spatial resolution of 0.25°. Slope data were derived from a DEM using the slope tool in ArcMap. Human activity data include population density and land use. Population density data were sourced from the LandScan dataset, which provides 1 km resolution population spatial distribution raster data from 2000 to 2022. A full description of each type of data is provided in Table 1. It should be mentioned that all datasets were resampled to a 1 km resolution in ArcMap using bilinear interpolation to maintain consistency in the research scale. Given the coarse original resolution of the GLDAS dataset (0.25°, roughly 25 km) and the study’s emphasis on regional-scale drought propagation, resampling the soil moisture data may introduce some localized smoothing effects. Nevertheless, these effects are thought to have a negligible impact on the overall results. Additionally, the resampling procedure lessens the possibility of bias brought on by resolution discrepancies across several data sources.

3. Methodology

3.1. Drought Indicators

This study employs the Standardized Precipitation Evapotranspiration Index (SPEI) and the Standardized Soil Moisture Index (SSMI) to characterize meteorological and agricultural drought, respectively. The SPEI, originally proposed by Vicente-Serrano et al. [40], quantifies drought severity by incorporating both precipitation and evapotranspiration. The SSMI, recognized as one of the effective indicators for agricultural drought assessment [41,42,43], evaluates drought conditions based on soil moisture anomalies. The calculation methods and results of SPEI and SSMI are provided in Supplementary Sections S.2–S.4.
It should be noted that both the SPEI and SSMI in this study were calculated using monthly meteorological and soil moisture data spanning from 1950 to 2022 in order to guarantee the temporal consistency of drought indices in the time-series analysis.

3.2. Drought Event Identification

This study employs the optimized multi-threshold run theory [44] to identify meteorological and agricultural drought events across different geomorphological divisions of the Loess Plateau in northern Shaanxi. Compared with the traditional run theory, the multi-threshold approach effectively eliminates short-term minor droughts and identifies short-interval strong drought events [44,45,46]. The optimal theory may extract drought-specific variables, including drought duration (D), drought severity (S), and drought intensity (I). Here, D represents the duration of a drought event from start to end, S denotes the absolute sum of the SPEI or the SSMI during the event, and I is the ratio of S to D.
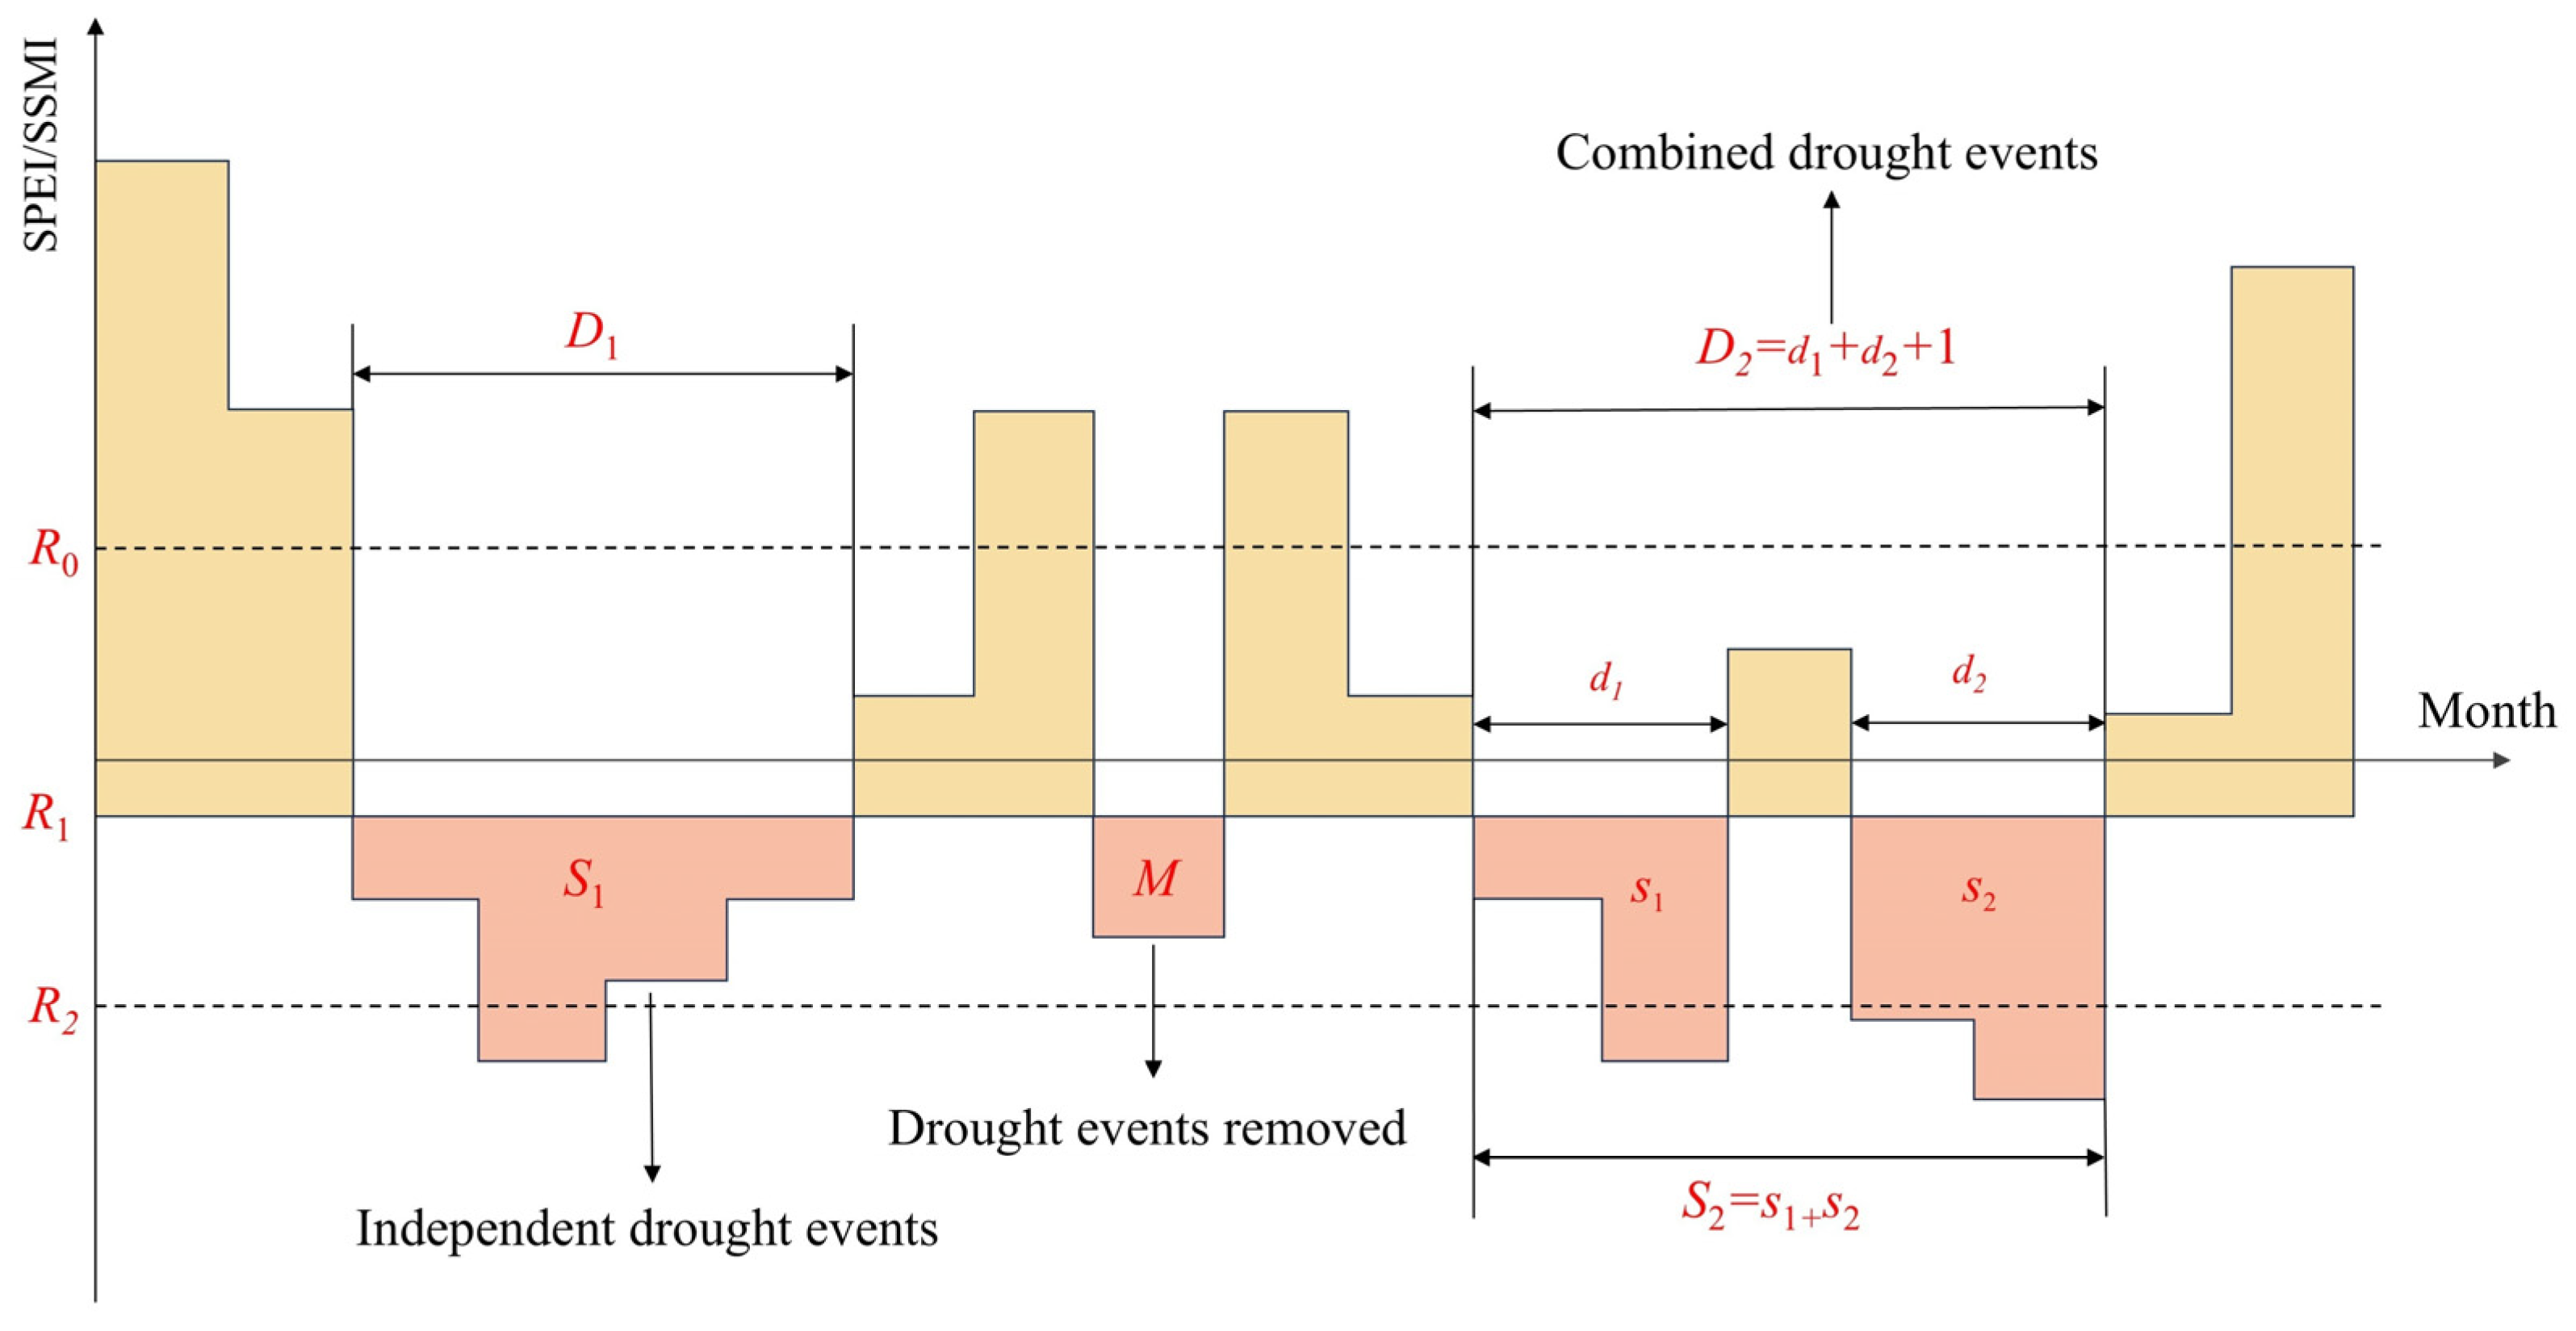
Figure 2 depicts the schematic map for the optimized three-threshold run theory used in this study. A drought event occurs when the SPEI or SSMI value drops below the first threshold (R1) and persists until the index exceeds R1. For drought events with a drought duration D of only one month, the event is removed if the corresponding SPEI or SSMI exceeds R2. Moreover, if two adjacent drought events are identified with a one-month interval, and the SPEI or SSMI during the interval month is less than R0, the two events are merged into a single event. In this case, the drought duration is redefined as the sum of the two original durations plus one month, while the drought severity is the sum of the two events.
It is generally recognized that a decline in the SPEI or SSMI below 0 indicates the onset of drought [40]. Therefore, the threshold R0 in this study was set at 0. According to the Classification of Meteorological Drought Standard [47], the lower limit for identifying a mild drought is −0.5; thus, R2 was set at −0.5. The threshold R1 should be determined according to the specific drought features of the study area to guarantee that the drought occurrences detected by the multi-threshold run theory align with the actual drought circumstances. Studies by Li et al. [48] and Wang et al. [49] reveal that the multi-year average frequency of drought in the Loess Plateau is almost 36%. Consequently, the threshold R1 was established at −0.3 to align the pertinent cumulative probability of the SPEI/SSMI with the real drought frequency, thereby enhancing the precision of drought identification.

3.3. Cross-Wavelet Analysis

Cross-wavelet analysis is a method that integrates cross-spectrum and wavelet transform to effectively examine the correlation between two time series in the time-frequency domain [50,51]. Specifically, the cross-wavelet transform (XWT) and wavelet coherence (WTC) can reveal the correlation between two time series in high-energy and low-energy regions, respectively [52,53]. This study calculated the XWT and WTC between the 3-month scale SPEI and SSMI time series to evaluate their temporal relationships across different seasons. The computational steps are detailed as follows:
The SPEI and SSMI for the four seasons—spring, summer, autumn, and winter—are designated as time series X and Y, respectively, and their cross-wavelet transform (XWT, WXY) is calculated as follows:
W X Y ( α ) = C X ( α ) C Y ( α )
where α represents the time lag, C X ( α ) is the wavelet-transform coefficient of the SPEI time series, C Y ( α ) is the complex conjugate of the wavelet coefficient of the SSMI. A higher WXY value indicates a stronger and more significant correlation between meteorological and agricultural drought in high-energy regions.
Meanwhile, the wavelet coherence (WTC) is calculated as:
R 2 α , N = S ( α 1 W X Y ( α ) ) 2 S ( α 1 W X ( α ) ) S ( α 1 W Y ( α ) )
where N is the length of the time series, and S is the smoothing parameter. A higher computed value indicates a stronger and more significant correlation between meteorological drought and agricultural drought in low-energy regions.

3.4. Grey Relational Analysis

Grey relational analysis assesses the degree of association between two sequences by measuring the synchronism of their variation trends and is commonly applied in correlation analysis [54,55,56]. In this study, grey relational analysis was employed to quantitatively determine the propagation time from meteorological drought to agricultural drought by examining the correlation between a multi-scale SPEI and a 1-month scale SSMI. The specific steps are as follows:
(1)
The 1-month scale SSMI was selected as the reference sequence x 0 ( k ) , while the SPEI at time scales of 1 to 12 months was used as the comparison sequence x i ( k ) , where i = 1, 2, …, 12.
(2)
The grey relational coefficients between the reference sequence and each comparison sequence were then calculated:
ξ i ( k ) = min i min k x 0 ( k ) x i ( k ) + ρ max i max k x 0 ( k ) x i ( k ) x 0 ( k ) x i ( k ) + ρ max i max k x 0 ( k ) x i ( k )
where ξ i ( k ) denotes the grey relational coefficients, and ρ is the resolution coefficient, which is set to 0.5 in this study.
(3)
The average of the grey relational degree coefficients is calculated to obtain the overall grey relational degree, using the following formula:
r i = 1 n Σ k = 1 n ξ i ( k )
where n is the number of samples. The closer it is to 1, the stronger the association between the SPEI and the SSMI at this timescale.
Consequently, the effective propagation rate was subsequently determined after the grey relational analysis effectively evaluated the response time of meteorological drought propagating to agricultural drought in the study area. The explanatory power of several anthropogenic and natural driving factors across distinct geomorphological divisions was subsequently examined using this propagation rate as the dependent variable in the OPGD model.

3.5. Drought Effective Propagation Rate

This study adopts the concept of effective propagation rate proposed by Guo et al. [57] to explore the propagation relationship between meteorological drought and agricultural drought. This concept defines the drought propagation rate as the ratio of the number of meteorological droughts that trigger hydrological drought to the total number of meteorological droughts. Similarly, this paper defines the effective propagation rate R from meteorological drought to agricultural drought as follows:
R = m n
where m is the number of meteorological droughts that trigger agricultural droughts, and n is the total number of meteorological droughts. The value of R typically ranges from 0 to 1; however, in instances of significant human intervention, it may surpass 1. A higher R indicates a stronger propagation capacity of meteorological drought to agricultural drought.

3.6. Optimal Parameter-Based Geographical Detector Model

This study employed the optimal parameter-based geographical detector (OPGD) model proposed by Song et al. [58] to comprehensively detect and analyze the effective propagation rate from meteorological drought to agricultural drought across different geomorphological divisions of the Loess Plateau in northern Shaanxi, along with its relationship with various driving factors. The OPGD model effectively determines the explanatory influence of driving factors on spatially distributed variables, accommodates both categorical and continuous variables, provides a q-value indicator with enhanced physical explanatory significance in the spatial dimension, and further elucidates the interactions among driving factors, resulting in more comprehensive and profound outcomes. This study primarily employs four major modules from the OPGD model: factor detector, parameter optimization, interaction detector, and risk detector.
(a)
Factor detector
The factor detector, a core part of the geographic detector, determines the extent to which potential driving factors explain the spatial differentiation of the dependent variable. It is generally expressed by the q-value, and its calculation formula is as follows:
q = 1 h = 1 m N h σ h 2 N σ 2
where h = 1, …, m denotes the stratification of the drought effective propagation rate and the driving factor. Nh and N represent the quantity of grid cells in stratum h and the overall study area, respectively. σ h 2 and σ 2 denote the variance of the drought effective propagation rate within stratum h and the entire region, respectively. The q-value ranges from 0 to 1, with a higher q signifying increased spatial heterogeneity in the drought effective propagation rate and enhanced explanatory power of the corresponding driving factor.
(b)
Parameter optimization
Parameter optimization consists of two components: variable discretization and spatial scale optimization. Variable discretization employs equal interval, natural break, quantile, geometric interval, and standard deviation (sd) approaches. The number of categories is set between 4 and 10, and the combination with the highest q-value is selected as the best parameter. Spatial scale optimization aims to determine the appropriate spatial analysis resolution. By comparing the q-value of each driving factor across various spatial scales, the scale corresponding to the maximum 90th percentile of the q-value is selected as the optimal spatial scale.
(c)
Interaction detector
The interaction detector compares the q-value of two single driving factors X1 and X2 when they act alone and jointly to determine the enhancement or weakening effect of their interaction on the explanatory power of drought effective propagation rate. The interaction types are divided into five categories, as shown in Table 2.
(d)
Risk detector
The risk detector generally employs the t-statistic to compare whether the mean values of the dependent variable across different divisions of each driving factor exhibit statistically significant differences. The calculation formula is as follows:
t y ¯ h = 1 y ¯ h = 2 = Y ¯ h = 1 Y ¯ h = 2 Var Y ¯ h = 1 n h = 1 + Var Y ¯ h = 2 n h = 2 1 / 2
where Y ¯ h is the mean effective drought propagation rate in division h; n h denotes the total number of grid cells in division h; and Var is the variance function. The null hypothesis is defined as Y ¯ h = 1   =   Y ¯ h = 2 . If this hypothesis is rejected at a given confidence level, it indicates a statistically significant difference in the average effective drought propagation rate between the two divisions, with a greater difference indicating an elevated level of risk.

4. Results and Analysis

4.1. Estimation of the Propagation Lag from Meteorological Drought to Agricultural Drought

In this study, the 3-month-scale SPEI and SSMI were employed to qualitatively analyze the propagation relationship between meteorological and agricultural droughts in the Loess Plateau of northern Shaanxi through cross-wavelet analysis. The cross-wavelet transform (XWT) and wavelet coherence (WTC) were illustrated for different seasons, as shown in Figure 3. In the figure, colors represent the strength of periodic energy (red indicates strong, and blue indicates weak). To avoid the influence of boundary effects, the analysis was limited to the cone of influence (enclosed by solid thin lines), with statistically significant regions at the 95% confidence level marked by bold solid lines. Arrows denote the phase relationship between the SPEI and the SSMI: “→” represents the same phase (positive correlation), whereas “←” represents the opposite phase (negative correlation).
Figure 3a illustrates that in spring, significant in-phase resonance between the SPEI and the SSMI is observed within the 1-5a band (1957–1970), the 3-8a band (1980–2008), and the 5-6a band (1958–1966). The WTC results reveal that regions passing the 95% confidence level span almost the entire time domain, with correlation coefficients exceeding 0.9 in the 5-8a frequency band during 1957–2008, demonstrating a robust correlation between the changing patterns of spring meteorological drought and agricultural drought in the low-energy zone.
In the summer (Figure 3b), there are two strong resonance periods of 1-2a (1953–1967) and 3-6a (2008–2016), in addition to a low-intensity period of around 8a. The WTC demonstrates discontinuous in-phase resonances between the SPEI and the SSMI across the 1-14a period (1953–2017). However, the resonance intensity in the 6-12a (1957–2000), 1-4a (1996–2018), and 14-20a (1968–2005) bands is relatively weak and fails to pass the confidence test.
During autumn (Figure 3c), numerous areas of positive correlation resonance emerge within the 5-8a and 1-2a frequency bands, whereas resonance in other bands is weaker. The WTC demonstrates that regions passing the confidence level predominantly occupy a significant portion of the cone of influence, with the 8-12a band spanning nearly the entire time domain. The correlation coefficient typically exceeds 0.8, indicating that the propagation from meteorological to agricultural drought is most pronounced in autumn. Significant coherence was observed in the 5-8a band during spring and autumn, potentially linked to ENSO and NAO [59,60]. Specifically, ENSO and NAO can modulate monsoon intensity over the Loess Plateau, thereby altering temperature and precipitation patterns. This, in turn, impacts the propagation process and attributes of drought, exhibiting notable seasonal characteristics.
In contrast, the overall resonance intensity of the SPEI and SSMI during winter is weak, featuring merely three local significant resonance locations that exhibit intermittent quasi-periodic oscillations. In 2004, the resonance period of the two abruptly altered, and the phase relationship between the SPEI and the SSMI shifted from positive to negative. The WTC further confirms that the correlation between the SPEI and the SSMI is significantly diminished in winter, with a notable 6-12a resonance band present solely from 1977 to 2010. Most of these regions fall within the cone of influence, indicating that the weaker correlation is primarily attributable to the physical reality of lower winter temperatures, which reduces soil moisture evaporation rate and crop water demand, thereby weakening the propagation intensity from meteorological to agricultural drought.
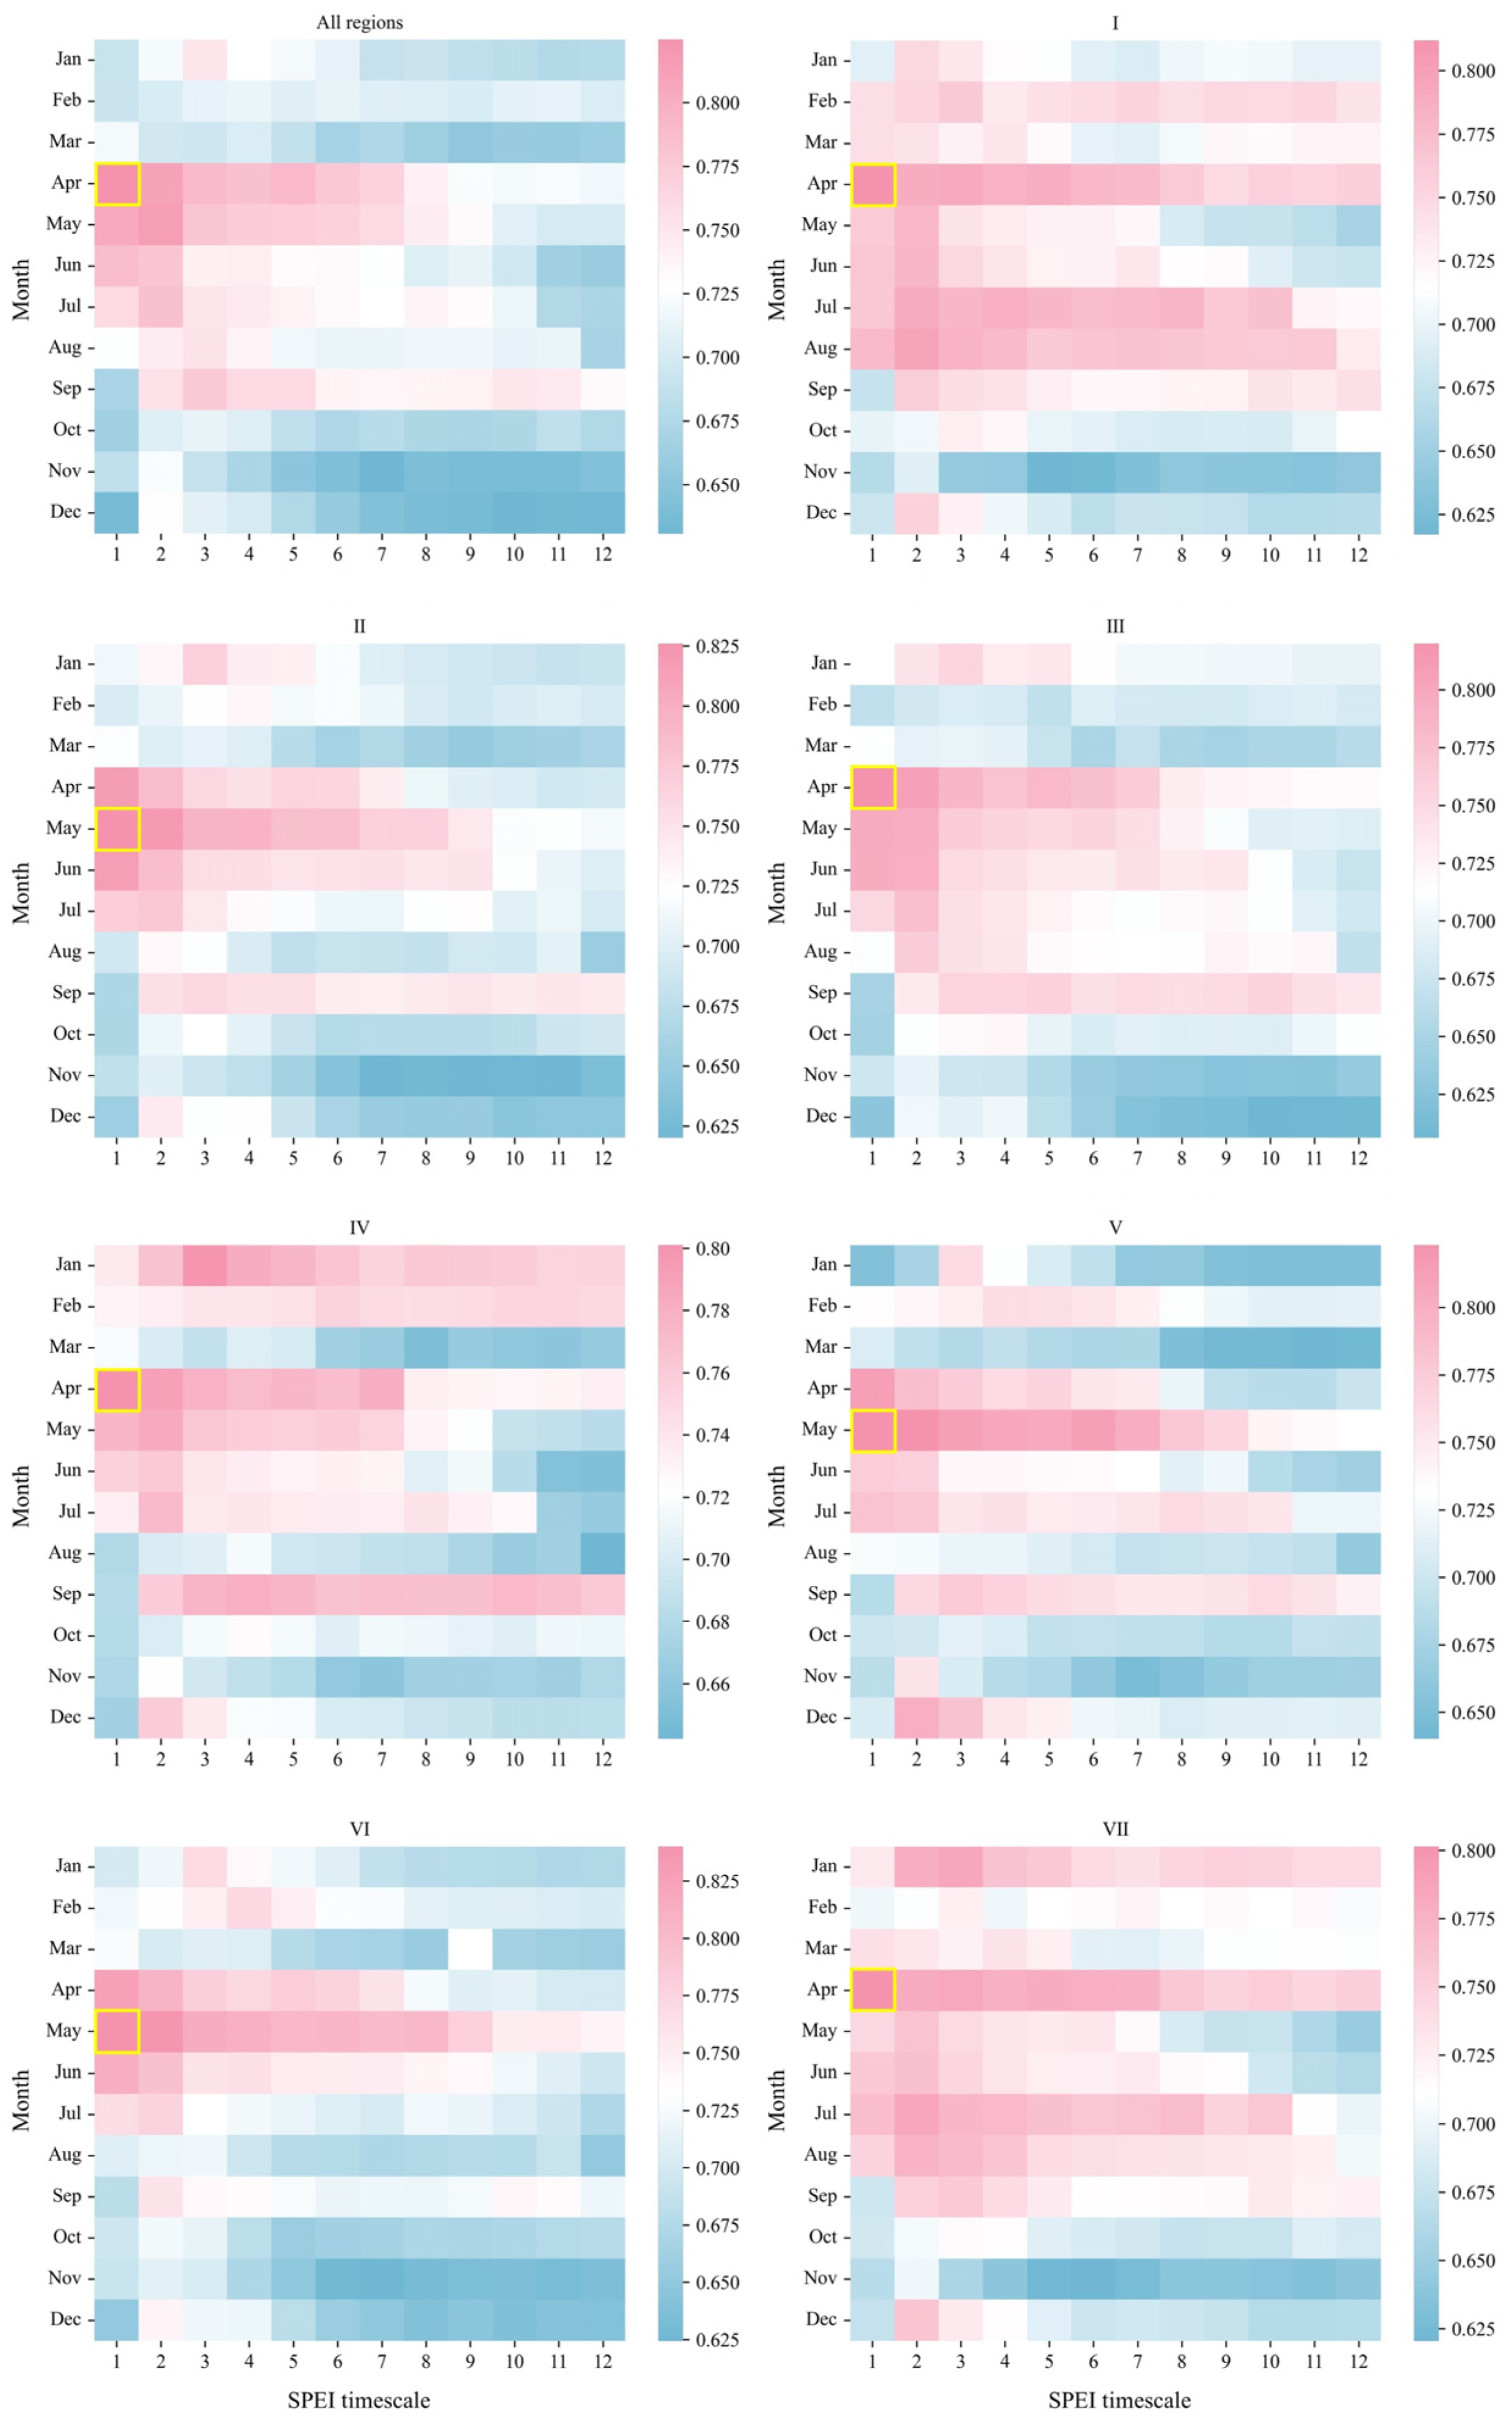
This study subsequently analyzed the grey relational degree between the SPEI at different time scales (1–12 months) and the SSMI at a 1-month scale across various geomorphological divisions of the Loess Plateau in northern Shaanxi from 1950 to 2022, aiming to quantitatively determine the propagation time from meteorological drought to agricultural drought. The results were visualized using heat maps (Figure 4), with colors denoting the intensity of the grey connection between the two indicators. For each month, the time scale exhibiting the highest grey relational degree was identified as the response time of meteorological drought propagating to agricultural drought (see Table 3). The yellow boxes in the figure indicate the temporal scale with the highest annual grey relational degree, signifying the most sensitive month for drought propagation. In addition, the average of the time scales corresponding to the highest grey relational degree for each month within a season was considered the drought propagation time for that season.
Figure 4 illustrates that, with the exception of winter (December to February), the correlation between the SPEI and the SSMI is predominantly strong across most geomorphological divisions during other seasons. The maximum Grey relational degrees for the Loess Plateau in northern Shaanxi and all geomorphological divisions exceed 0.8, with spring identified as the season exhibiting the highest drought sensitivity. Additionally, the seasonal drought propagation time of the study area and each geomorphological division is shown in Table 4.
The findings indicate that across various geomorphological divisions of the Loess Plateau in northern Shaanxi, the propagation time from meteorological drought to agricultural drought is relatively short, spanning from 1 to 3 months per season. Among the four seasons, the propagation time is significantly shorter in spring, averaging only about 1.2 months, whereas in winter, it can reach up to 3.1 months. Based on the climatic characteristics of the Loess Plateau in northern Shaanxi, the underlying physical mechanisms of these seasonal differences can be elucidated as follows: (a) Spring: Characterized by strong winds and limited rainfall, droughts are prone to occur. Simultaneously, low temperatures and frequent frosts result in a quicker response of agricultural drought to meteorological drought compared to winter. (b) Summer: Precipitation increases significantly, leading to higher soil moisture. The soil’s buffering capacity postpones the propagation of meteorological drought to agricultural drought [61,62]. (c) Autumn: The incursion of frigid air from the north results in a decline in temperature and a rise in overcast and rainy days. Soil moisture remains comparatively elevated following summer, and the propagation time of drought mirrors that of summer. (d) Winter: Dominated by polar continental air masses, the climate is frigid and arid, with minimal precipitation or snowfall. This leads to a delayed response in the agricultural system, resulting in a longer propagation time of drought.
In addition, the propagation time differs among geomorphological divisions. Division V (loess wide valley hills) exhibits the shortest propagation time. This may pertain to the terrain characteristics: the region is densely populated with gullies, and the surface is shattered, resulting in rapid surface runoff from precipitation, complicating the infiltration and restoration of soil moisture levels.

4.2. Assessment of the Effective Propagation Rate from Meteorological to Agricultural Drought

Due to the influence of underlying surface conditions and human activities, not all meteorological droughts lead to agricultural droughts. Droughts may exhibit delayed, diminished, or amplified effects during the propagation process. Therefore, this study adopts the time overlap principle to match identified meteorological drought events to agricultural drought events. The matching principle is as follows: According to the calculated drought propagation time, a meteorological drought occurring within the three months preceding the onset of an agricultural drought until its termination is considered to have triggered the agricultural drought, indicating drought propagation. A total of 34 matched drought events were identified across the Loess Plateau in northern Shaanxi. Table 5 presents the three most severe agricultural drought events and their corresponding meteorological droughts for each geomorphological division. The comparative analysis indicates that, despite the infrequency of agricultural drought events, their durations and intensities are markedly more severe than those of meteorological droughts. Moreover, the majority of prolonged and severe agricultural drought occurrences are generally initiated by the combination of two to three meteorological drought events.
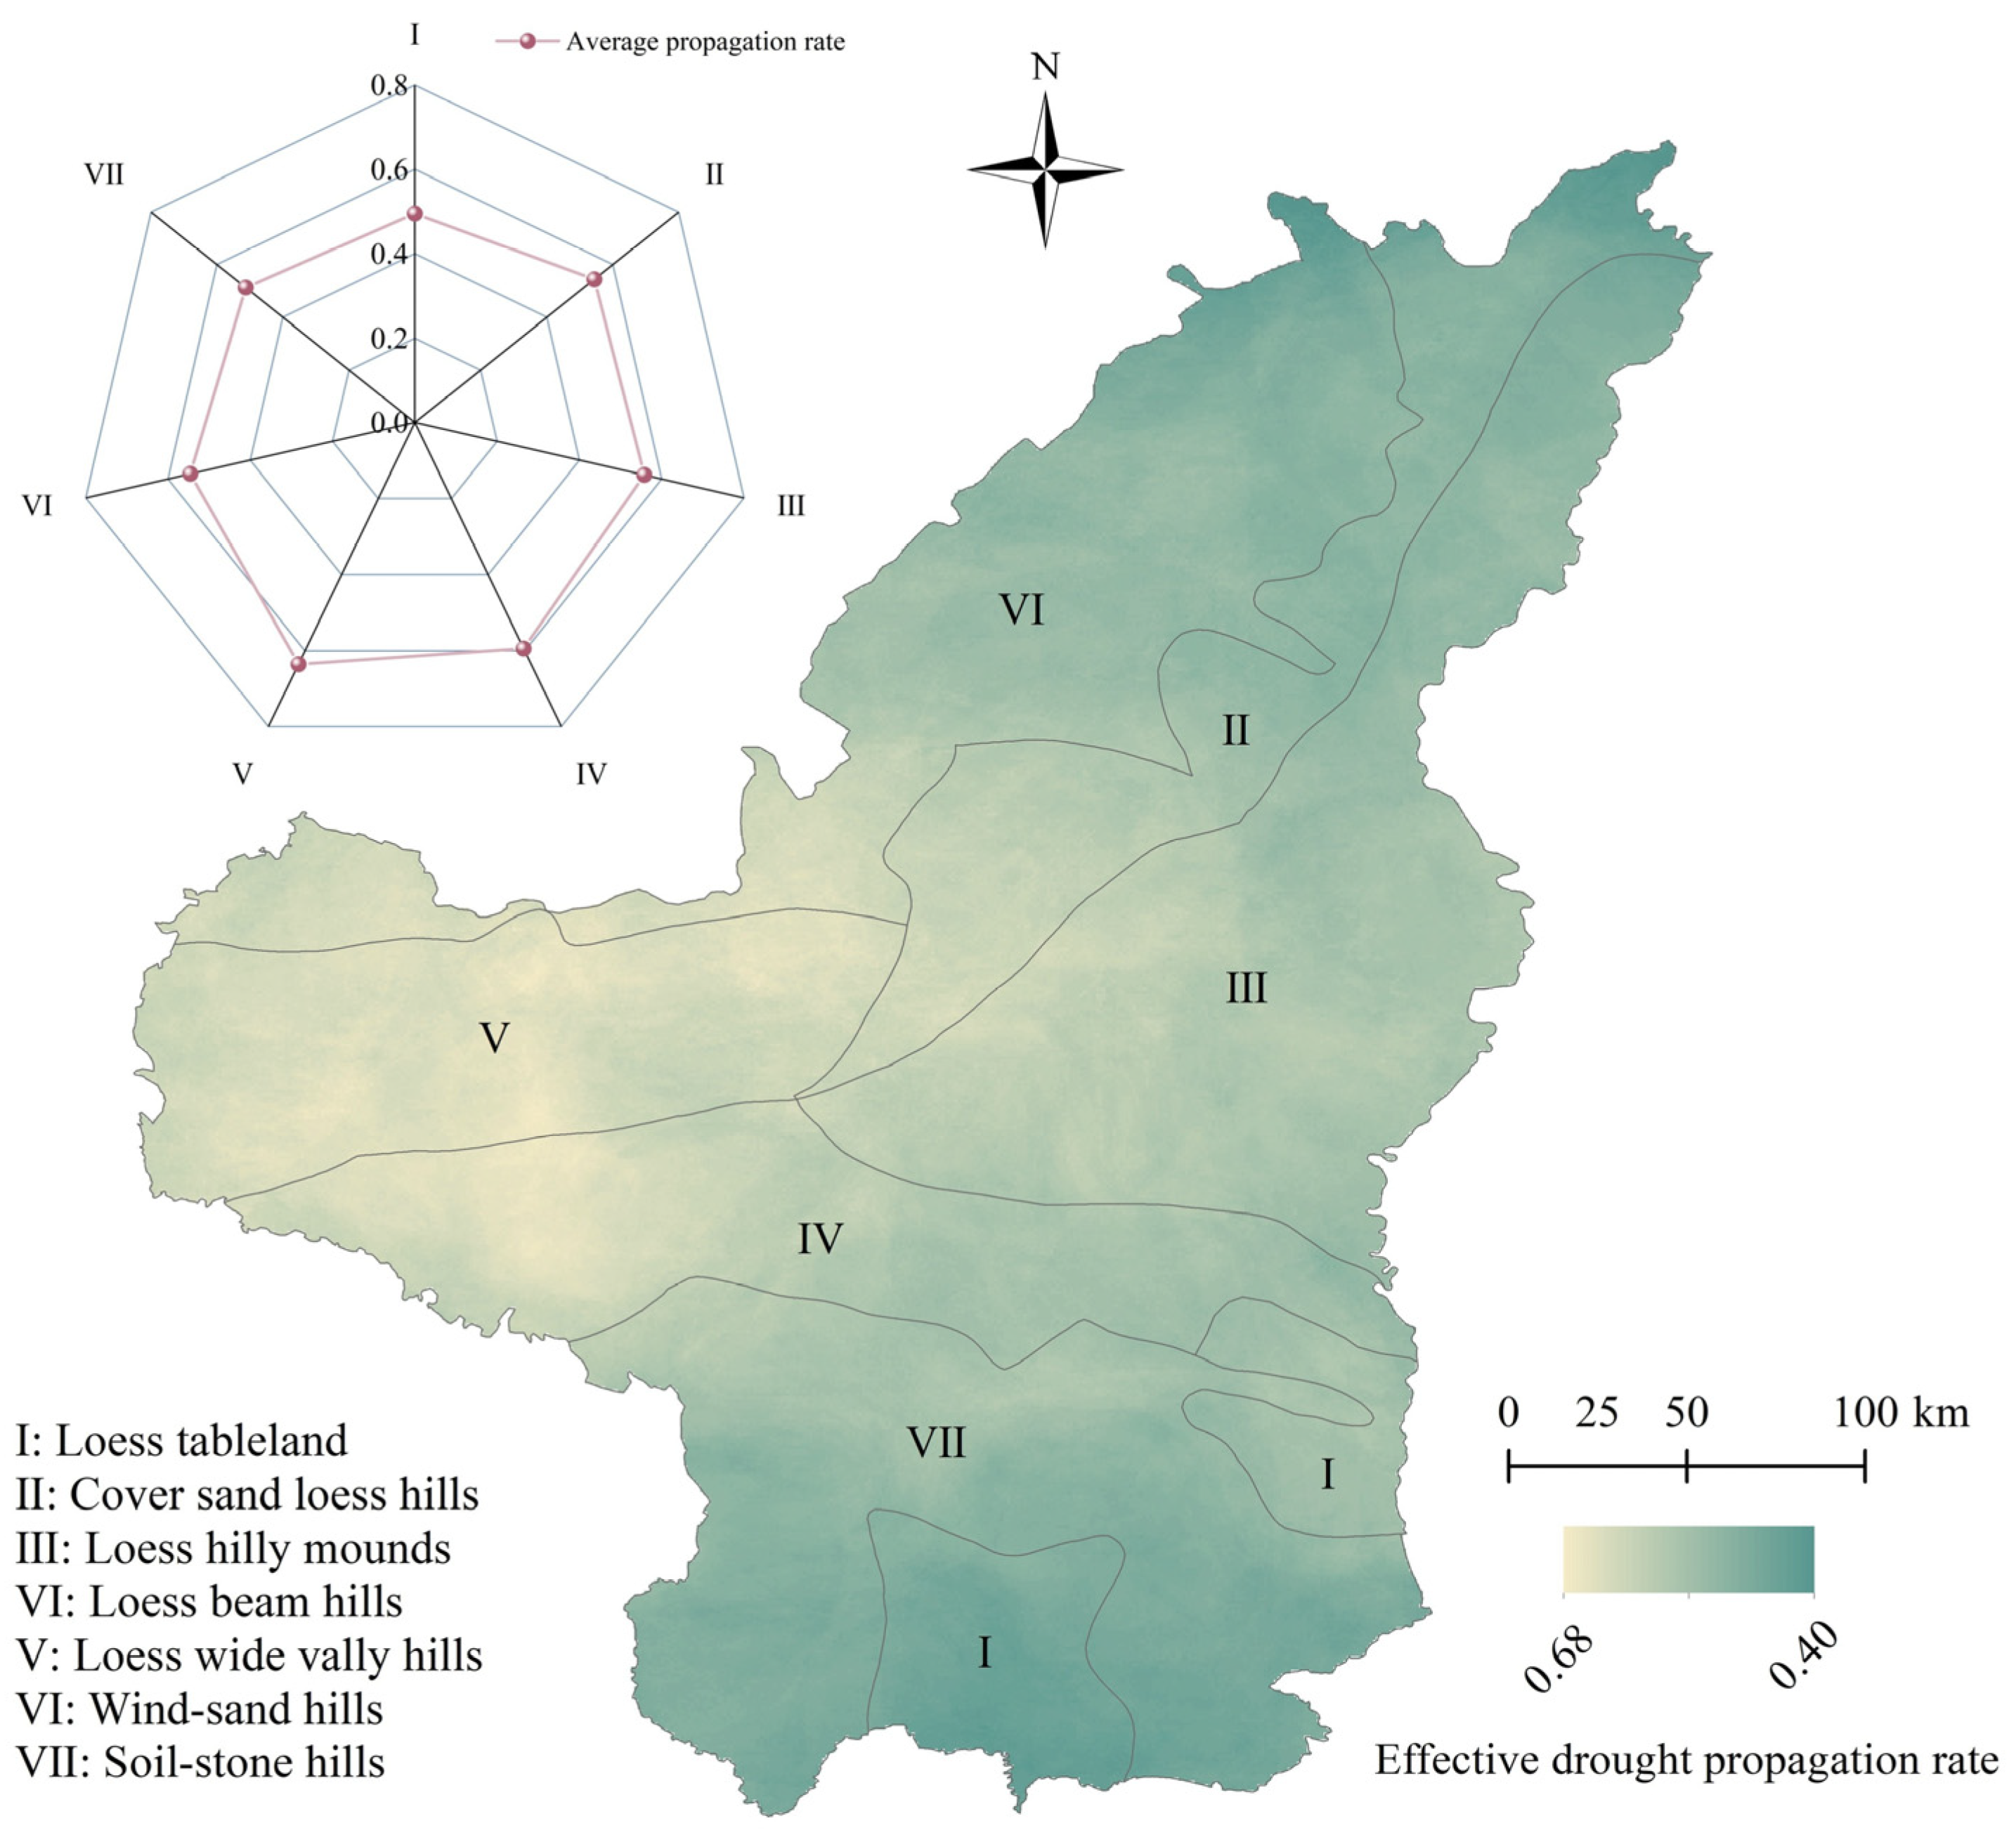
The effective propagation rate of drought in the Loess Plateau of northern Shaanxi was calculated on a pixel-by-pixel basis, utilizing the matched results between meteorological and agricultural drought events. To further investigate spatial differences in drought propagation rates across geomorphological divisions, the average effective drought propagation rate for each division was subjected to statistical analysis (refer to Table 6). The spatial distribution of effective propagation rates from meteorological drought to agricultural drought across the entire study area and within different geomorphological divisions is shown in Figure 5.
The effective propagation rate of meteorological drought to agricultural drought exceeds 0.4. Propagation rates were higher in the western and central regions, peaking at 0.68, whereas the northern and southern regions exhibited comparatively lower rates. Among the geomorphological divisions, divisions V and IV (the loess wide valley hills division and the loess beam hills division) exhibited a more pronounced propagation from meteorological to agricultural drought, with rates of 0.64 and 0.59, respectively. Conversely, divisions II, III, and VI (namely, the cover sand loess hills division, loess hilly mounds division, and wind-sand hills division) exhibited moderate propagation rates of around 0.54, whereas divisions I and VII (the loess tableland division and soil–stone hills division) demonstrated relatively weak drought propagation, with rates around 0.50.
The observed differences can be attributed to the relatively high altitudes of divisions V and IV. These regions encompass the Ordos endorheic basin, the upper reaches of the Beiluo River, and the western part of the Wuding River basin, characterized by restricted water conservation capacity. Consequently, soil moisture is significantly influenced by precipitation, rendering agricultural drought acutely responsive to meteorological drought. This leads to a higher effective drought propagation rate in these areas. Moreover, the soil in division V exhibits limited water retention capacity and elevated permeability, with the predominant agricultural production model being rain-fed and minimal artificial irrigation. Thus, it may be deduced that the coupling effect influenced by soil characteristics has intensified the transmission of meteorological drought to agricultural drought.
Conversely, divisions I and VII are situated in the lower reaches of the Beiluo River basin, while the northern parts of divisions II, III, and VI are located in the Kuye River basin, Tuwei River basin, and main stem of the Yellow River. These areas possess considerable water conservation capacity, with soil moisture affected by a combination of precipitation, runoff, evapotranspiration, and other factors. Consequently, the propagation from meteorological to agricultural drought is less pronounced and occurs at a slower rate.

4.3. Detection and Analysis of Factors Influencing the Effective Propagation Rate from Meteorological to Agricultural Drought

This study selected nine potential driving factors influencing the effective propagation rate of drought, considering the representativeness of each factor, the natural characteristics of the Loess Plateau in northern Shaanxi, the temporal span of available data, and data accessibility. The selected factors include four meteorological factors—precipitation (X1), temperature (X2), potential evapotranspiration (X3), and aridity index (X4); three underlying surface environmental factors—elevation (X5), slope (X6), and soil moisture (X7); and two human activity factors—population density (X8) and land use type (X9) (refer to Figure 6). This study assessed six spatial scales (3, 4, 5, 6, 7, and 8 km) to determine the optimal spatial scale for the OPGD, corresponding to 8842, 4971, 3176, 2201, 1626, and 1249 grid cells, respectively. The q-values for each factor across various spatial scales were computed, as illustrated in Figure 6. A statistical analysis of the q-values for each factor across various scales reveals that the 90th percentile q-values of all driving factors peaked at a spatial scale of 5 km. This indicates that, at this scale, the majority of factors exhibit the highest explanatory power for drought propagation. Therefore, 5 km was determined as the optimal spatial scale for OPGD model analysis and was applied uniformly in subsequent investigations.
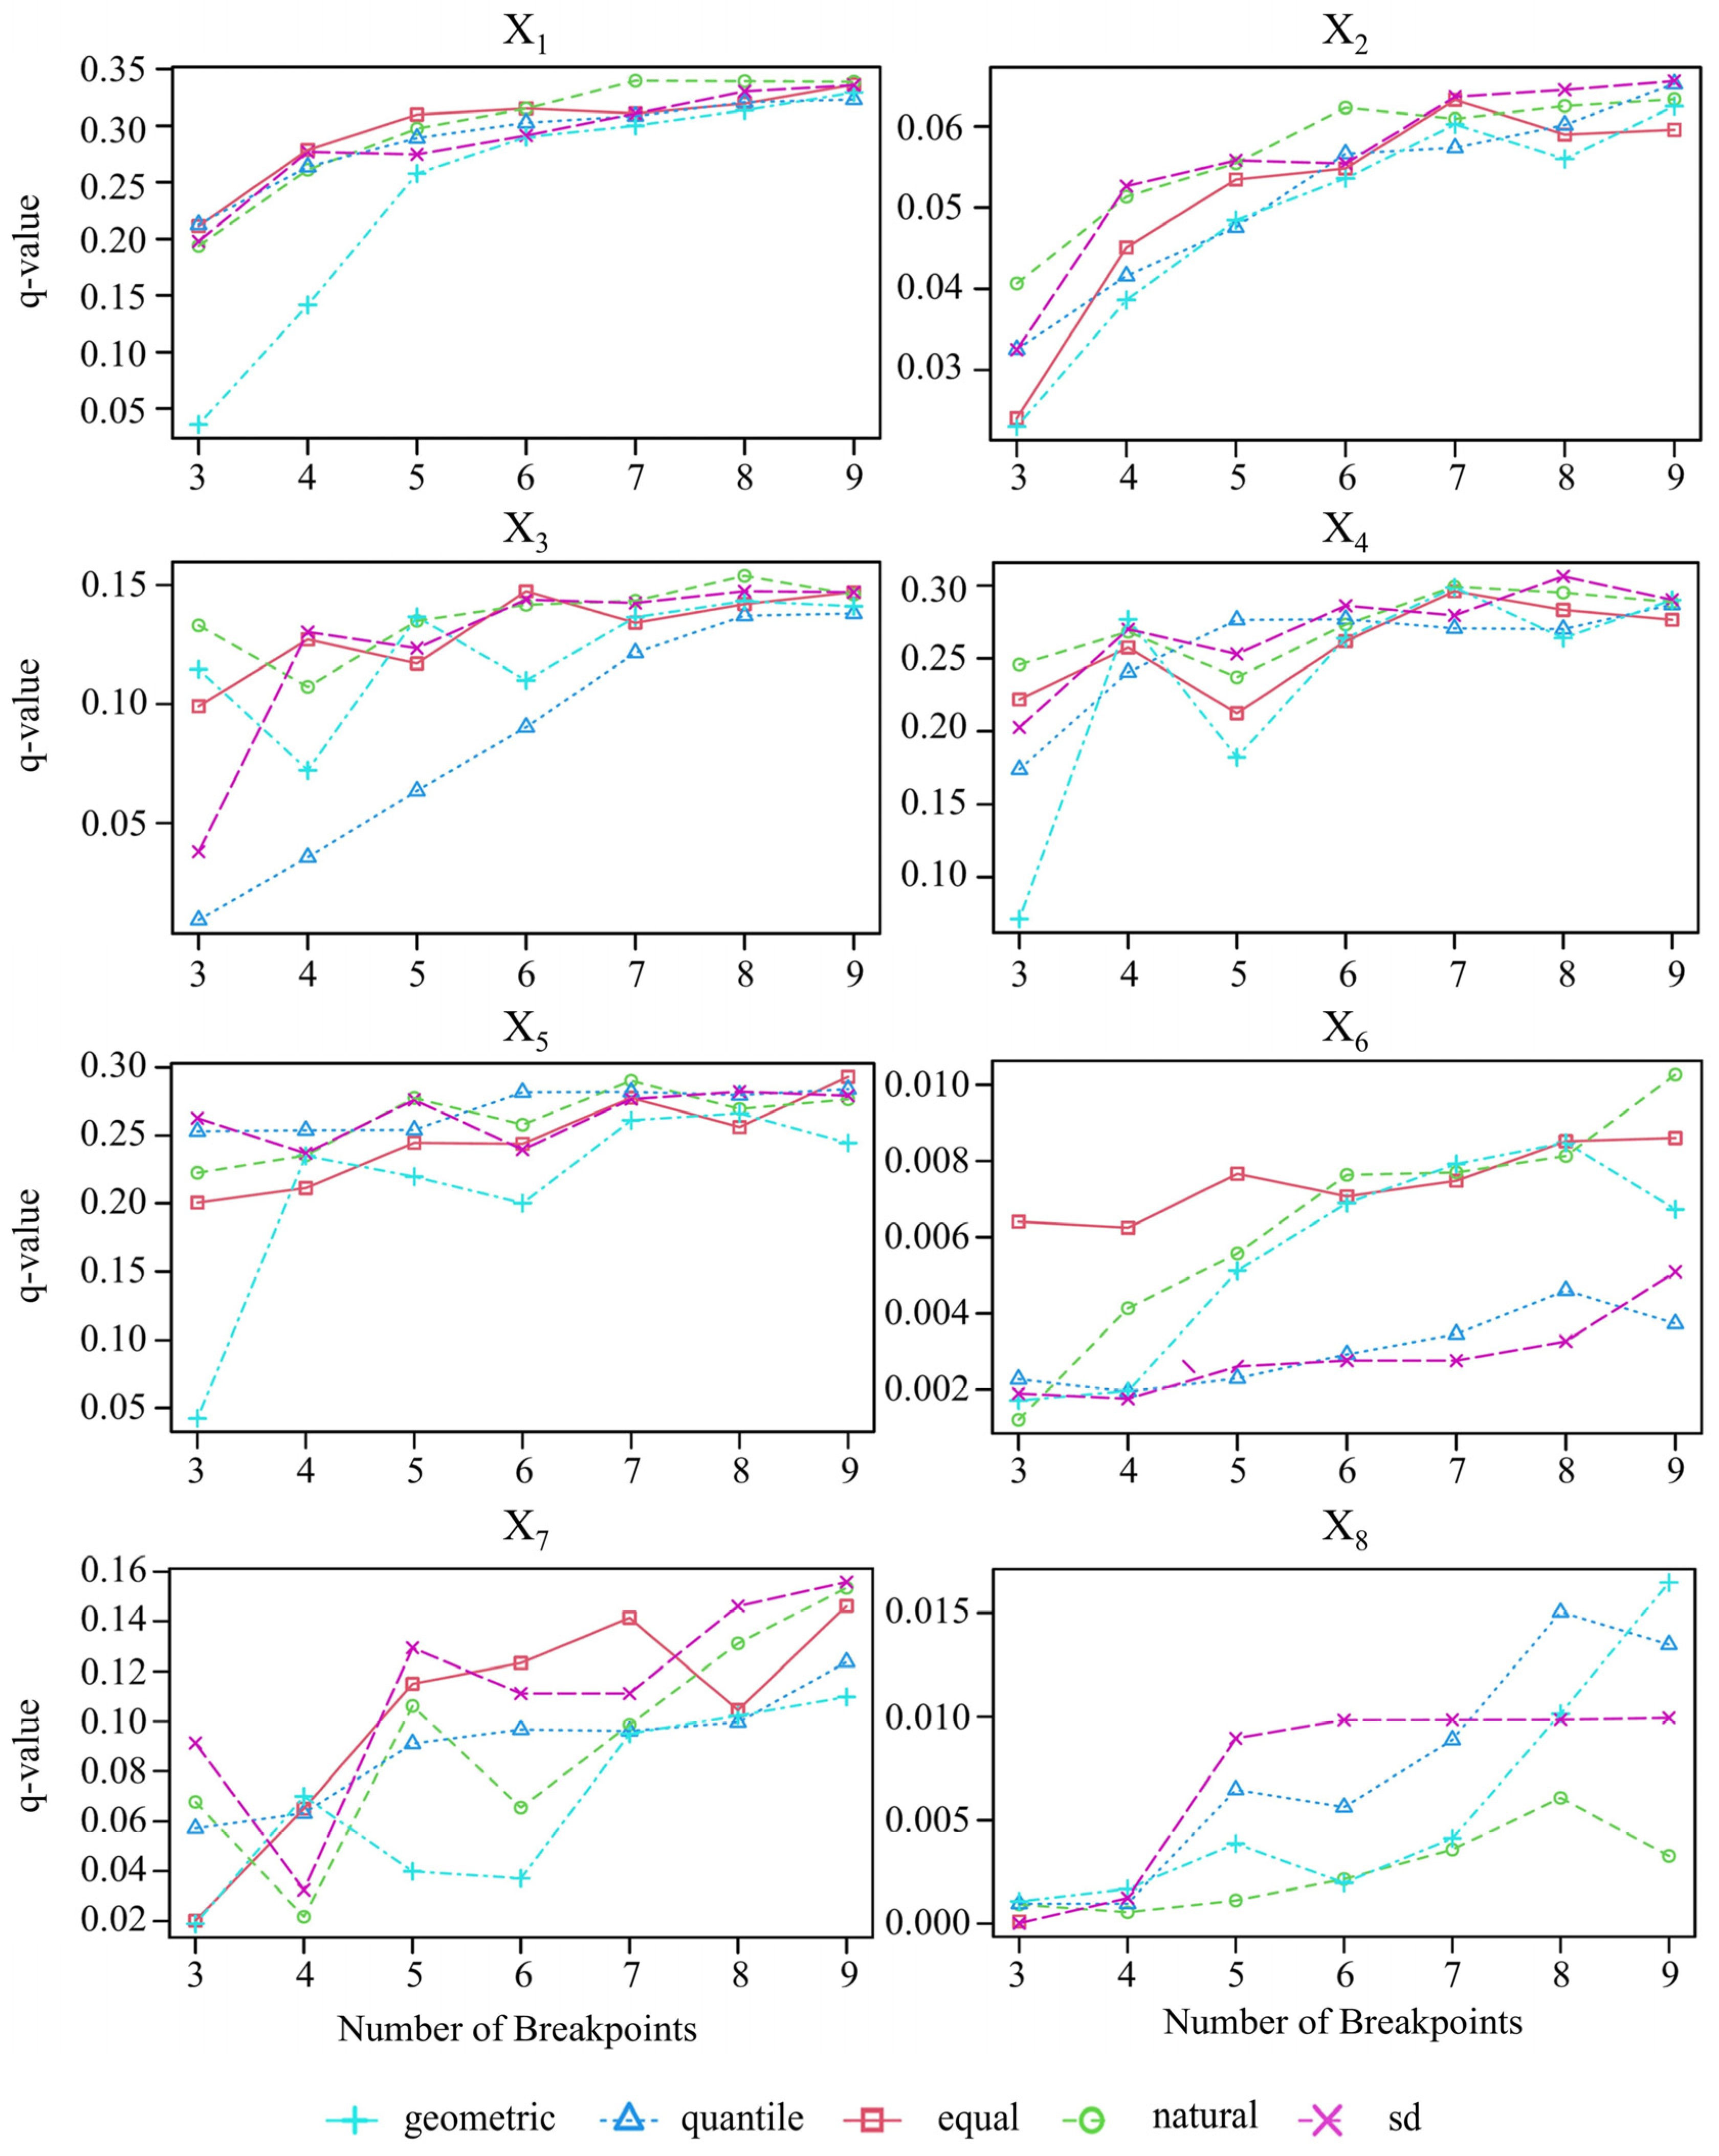
This study optimized the discretization parameters of eight continuous driving factors at an optimal spatial scale of 5 km: meteorological factors (precipitation, temperature, potential evapotranspiration, and aridity index), underlying surface factors (elevation, slope, and soil moisture), and human activity factors (population density). The results are illustrated in Figure 7. The results reveal significant variations in the optimal discretization methods and classification numbers across different driving factors. For example, precipitation (X1) was optimally classified using the natural breaks method with seven categories, whereas temperature (X2) was best discretized using the standard deviation method with nine categories. Optimal parameter combinations for the remaining factors are detailed in Figure 7.
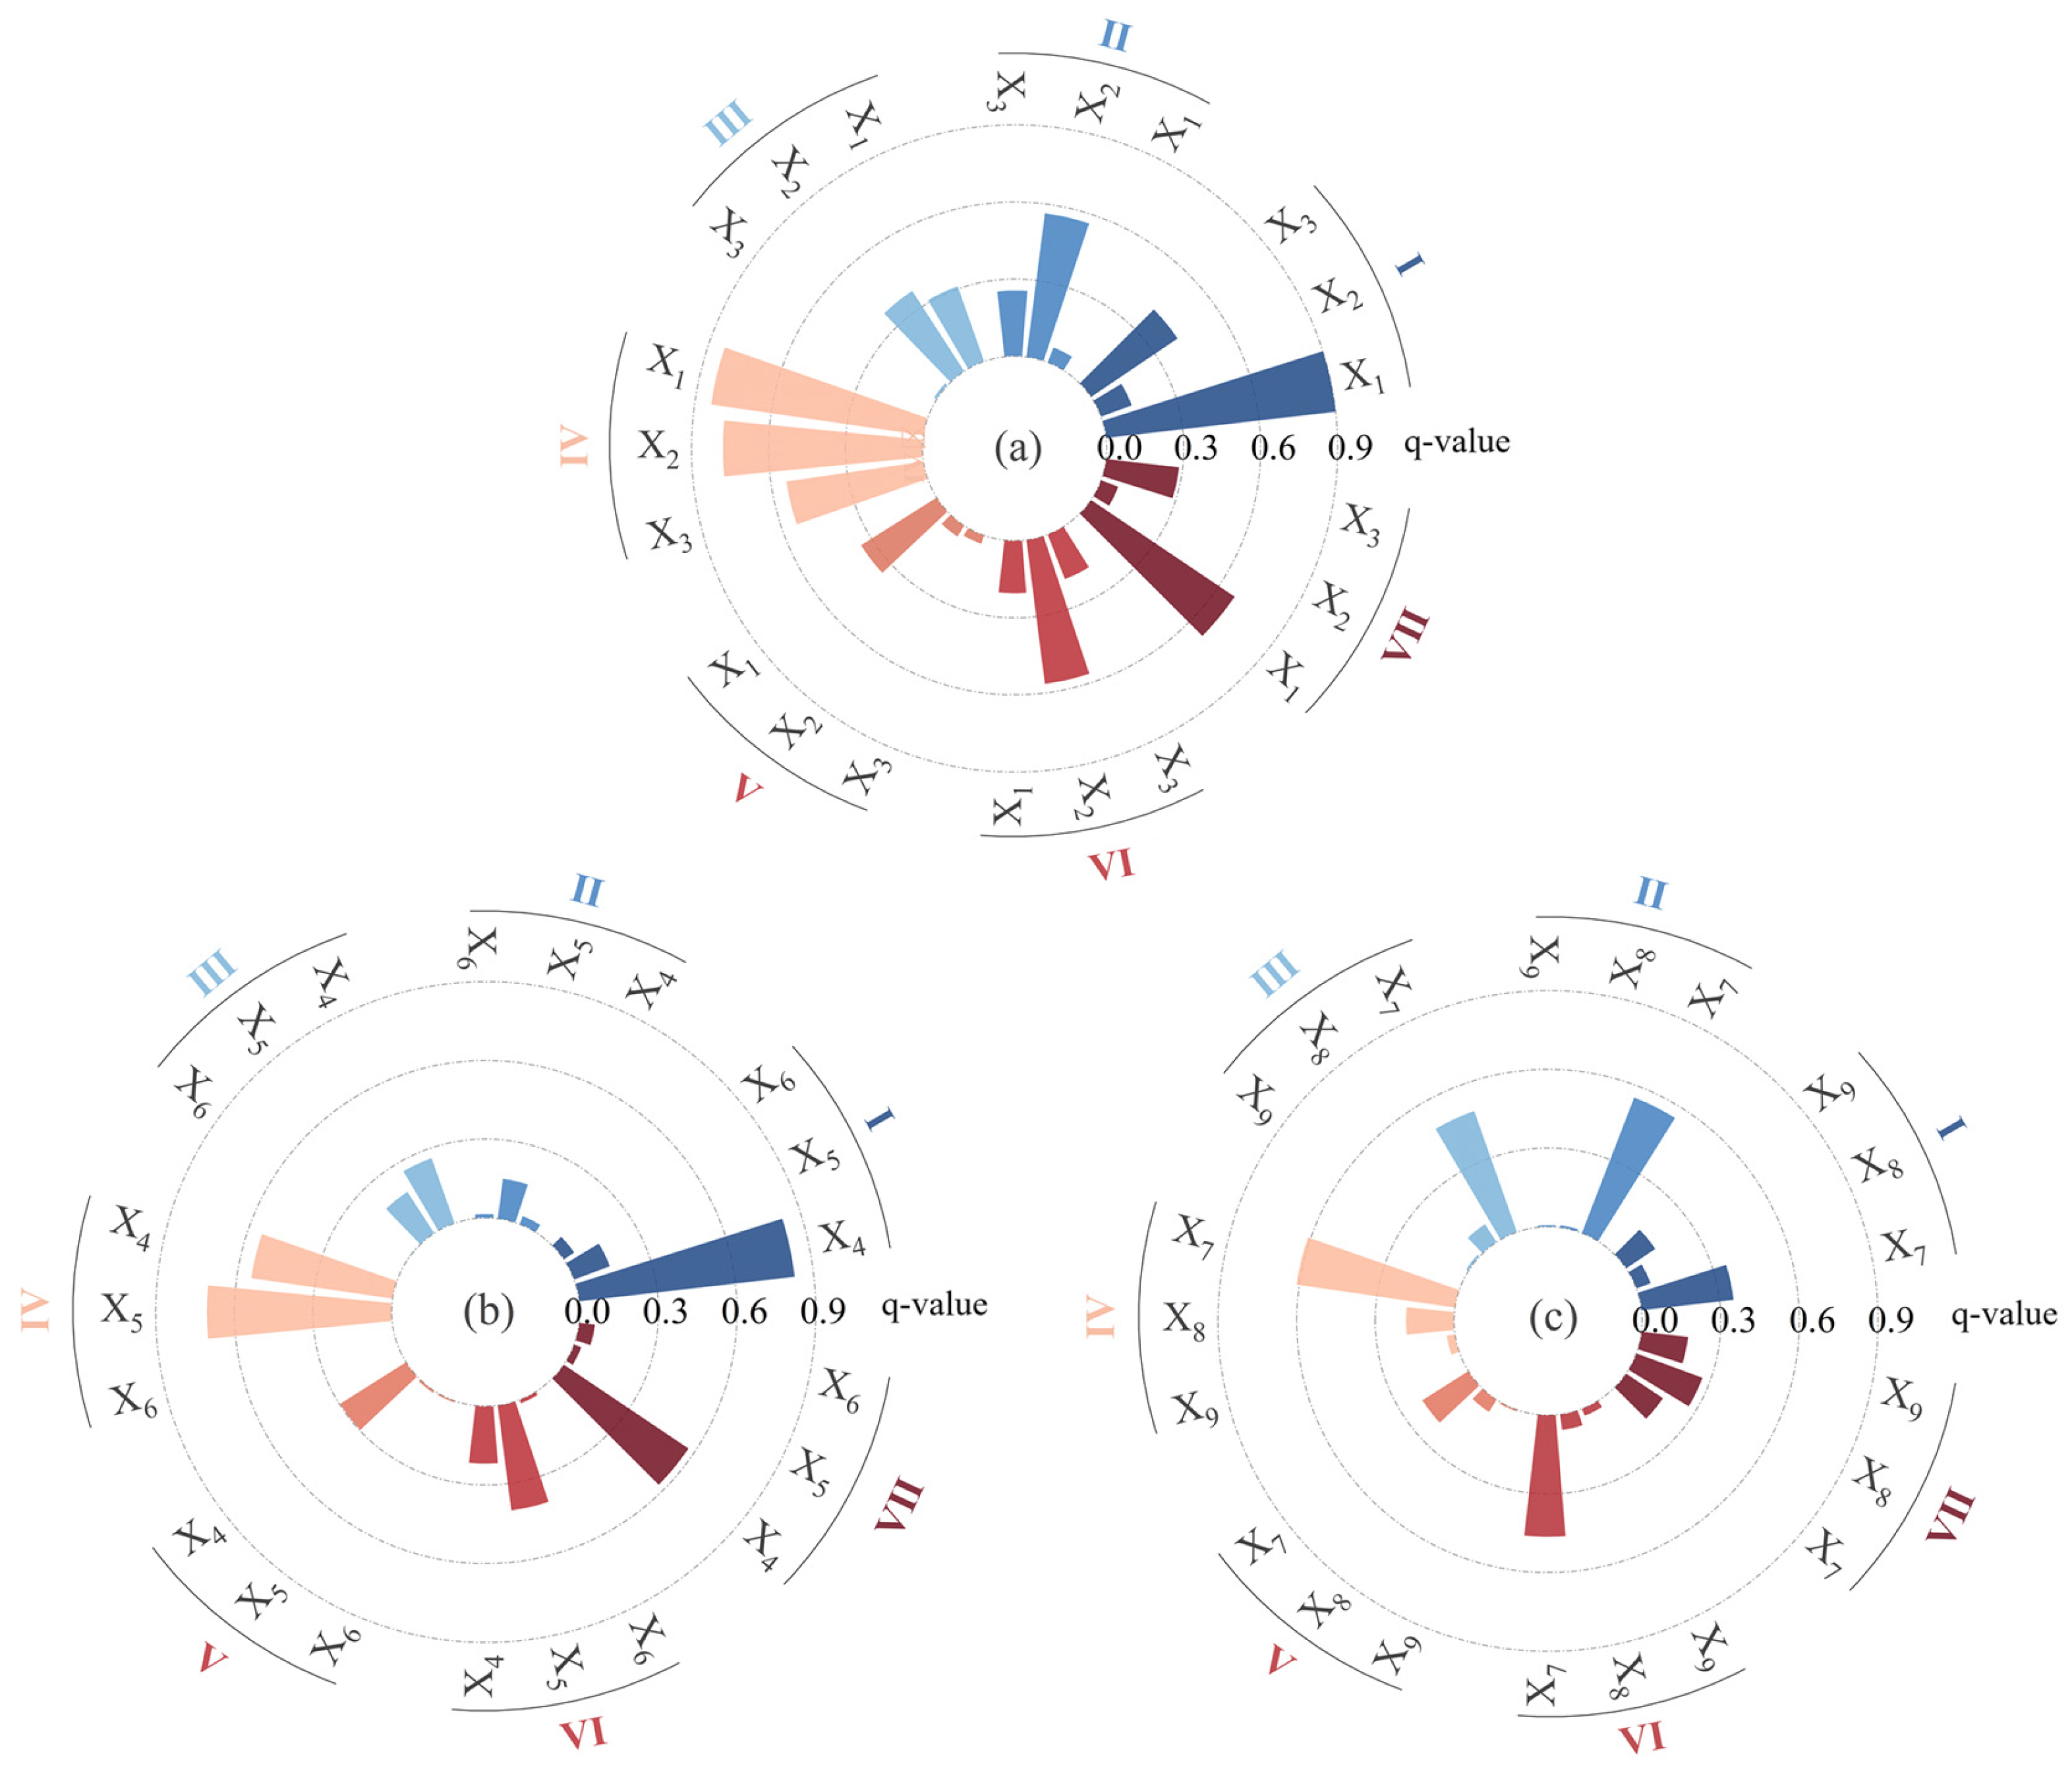
This study employed the optimal parameter-based geographic detector (OPGD) model to investigate the effective propagation rate of meteorological drought to agricultural drought and its influencing factors across various geomorphological divisions of the Loess Plateau in northern Shaanxi. The results are displayed in Figure 8. All nine selected driving factors significantly impacted the effective drought propagation rate (p < 0.01), demonstrating notable distinct spatial heterogeneity.
Overall, precipitation (X1) and soil moisture (X7) exhibited the highest average explanatory power, with q-values of 0.48 and 0.41, respectively, suggesting their dominant roles in the drought propagation process. These were followed by the aridity index (X4) and temperature (X2), with average q-values of 0.39 and 0.36. The remaining factors had average q-values below 0.3, ranked as follows: potential evapotranspiration (X3) > elevation (X5) > population density (X8) > land use type (X9) > slope (X6).
From the perspective of spatial heterogeneity, the dominant factor influencing the effective drought propagation rate in each geomorphological division was identified as follows: precipitation (I, loess tableland), soil moisture (II, cover sand loess hills), soil moisture (III, loess hilly mounds), precipitation (IV, loess beam hills), precipitation (V, loess wide valley hills), temperature (VI, wind-sand hills), and precipitation (VII, soil–stone hills). Precipitation was the dominant factor in divisions I, IV, and VII, with q-values exceeding 0.6, signifying its critical influence on the propagation of meteorological drought to agricultural drought in these divisions. In division II, the q-value for precipitation was merely 0.06, indicating a negligible effect. The drought propagation rate in this division was primarily determined by soil moisture and temperature, potentially associated with factors such as poor vegetation cover, loose soil structure, susceptibility to temperature and terrain, and high evapotranspiration. Despite the occurrence of precipitation, it is quickly absorbed by the surface soil and evaporates, hindering the replenishment of deeper soil moisture and consequently diminishing the impact of precipitation on drought propagation. Furthermore, it was observed that the q-values of human activity factors (X8 and X9) were predominantly inferior to those of climatic and underlying surface factors. This discrepancy may be attributed to the coarse spatial resolution adopted in the OPGD model, which may hinder its ability to accurately represent human activities such as irrigation. Moreover, the influence of human activities on drought propagation exhibits a temporal delay, and synchronous analysis fails to account for this lag, potentially resulting in a diminished q-value.
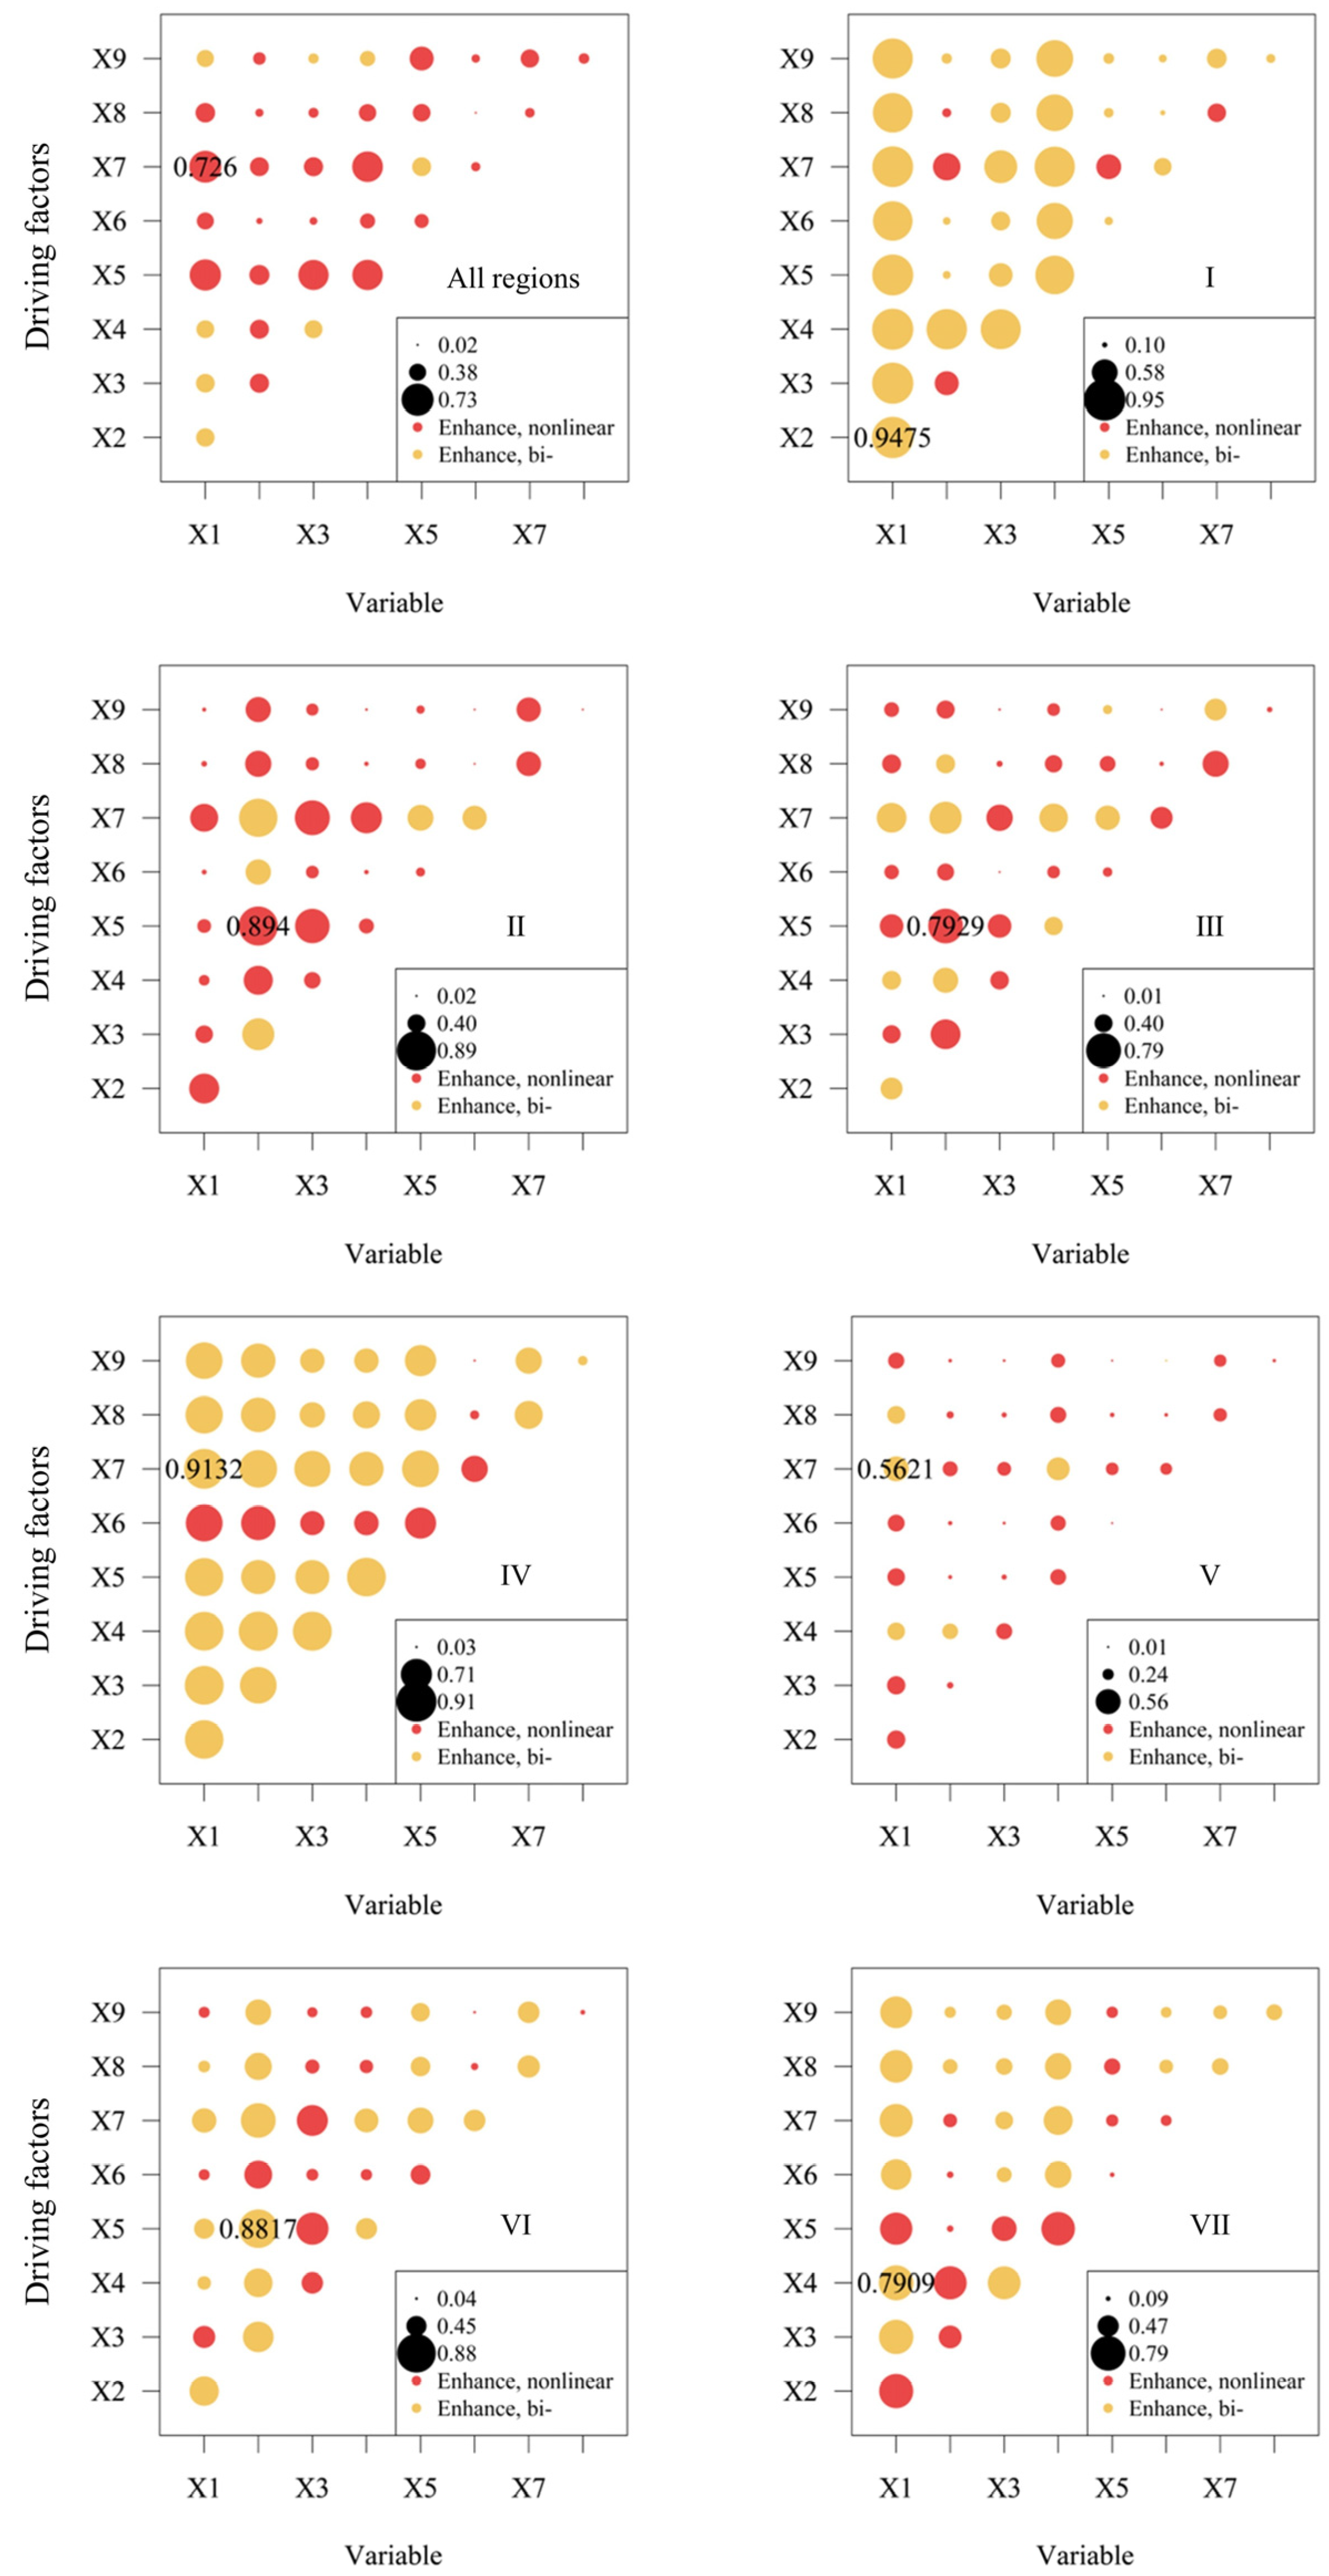
To further explore the impact of the interaction among different driving factors on the effective propagation rate of meteorological drought to agricultural drought, this study performed an interactive detection analysis on different geomorphological divisions of the Loess Plateau in northern Shaanxi, as illustrated in Figure 9. The analysis results demonstrate that the interactive q-values of most factor combinations within each geomorphological division are significantly higher than those of single factors. The interaction types are primarily “bi-factor enhancement” or “nonlinear enhancement”. This demonstrates that the propagation process of meteorological drought to agricultural drought is jointly driven by multiple factors, including meteorological conditions, underlying surface characteristics, and human activities, and that the synergy between factors significantly increases the spatial heterogeneity of the effective propagation rate of drought.
At the regional scale, the interaction between precipitation and soil moisture exhibits the strongest explanatory power, with a q-value of 0.73. Further analysis based on geomorphological division reveals that the primary interaction factors in each division are distinct, as detailed in Figure 9: (a) Divisions I, IV, and VII: Precipitation is the dominant factor, with its interaction q-values exceeding 0.7 when combined with each of the other eight factors. The predominant interaction type is “bi-factor enhancement”, particularly in division I, where the highest interaction q-value exceeds 0.9, signifying that the synergistic effect of precipitation and other factors significantly improves the spatial explanatory power of drought propagation rate in this area. (b) Divisions II and III: These regions are primarily characterized by “nonlinear enhancement” interactions. The combination of elevation and temperature has the highest explanatory power for drought propagation, with a q-value reaching 0.89 in division II, indicating that the drought propagation pattern in these divisions is predominantly governed by the coupling effect of terrain and temperature. Additionally, the q-value of the nonlinear enhancement interaction between temperature and potential evapotranspiration in region III is approximately 0.7, implying significant explanatory power for drought propagation. This interaction may enhance evapotranspiration water consumption and exacerbate soil water deficit, consequently intensifying the propagation of drought to agricultural drought. (c) Division V: The interaction q-values across various factor combinations are relatively low, with the highest only reaching 0.56. Among them, precipitation and soil moisture are the dominating interaction factors. This may be attributed to the generally flat terrain of this location. Although drought propagation rates are high due to insufficient precipitation and soil moisture, the spatial pattern of effective drought propagation is not significantly influenced by the two-factor interaction.
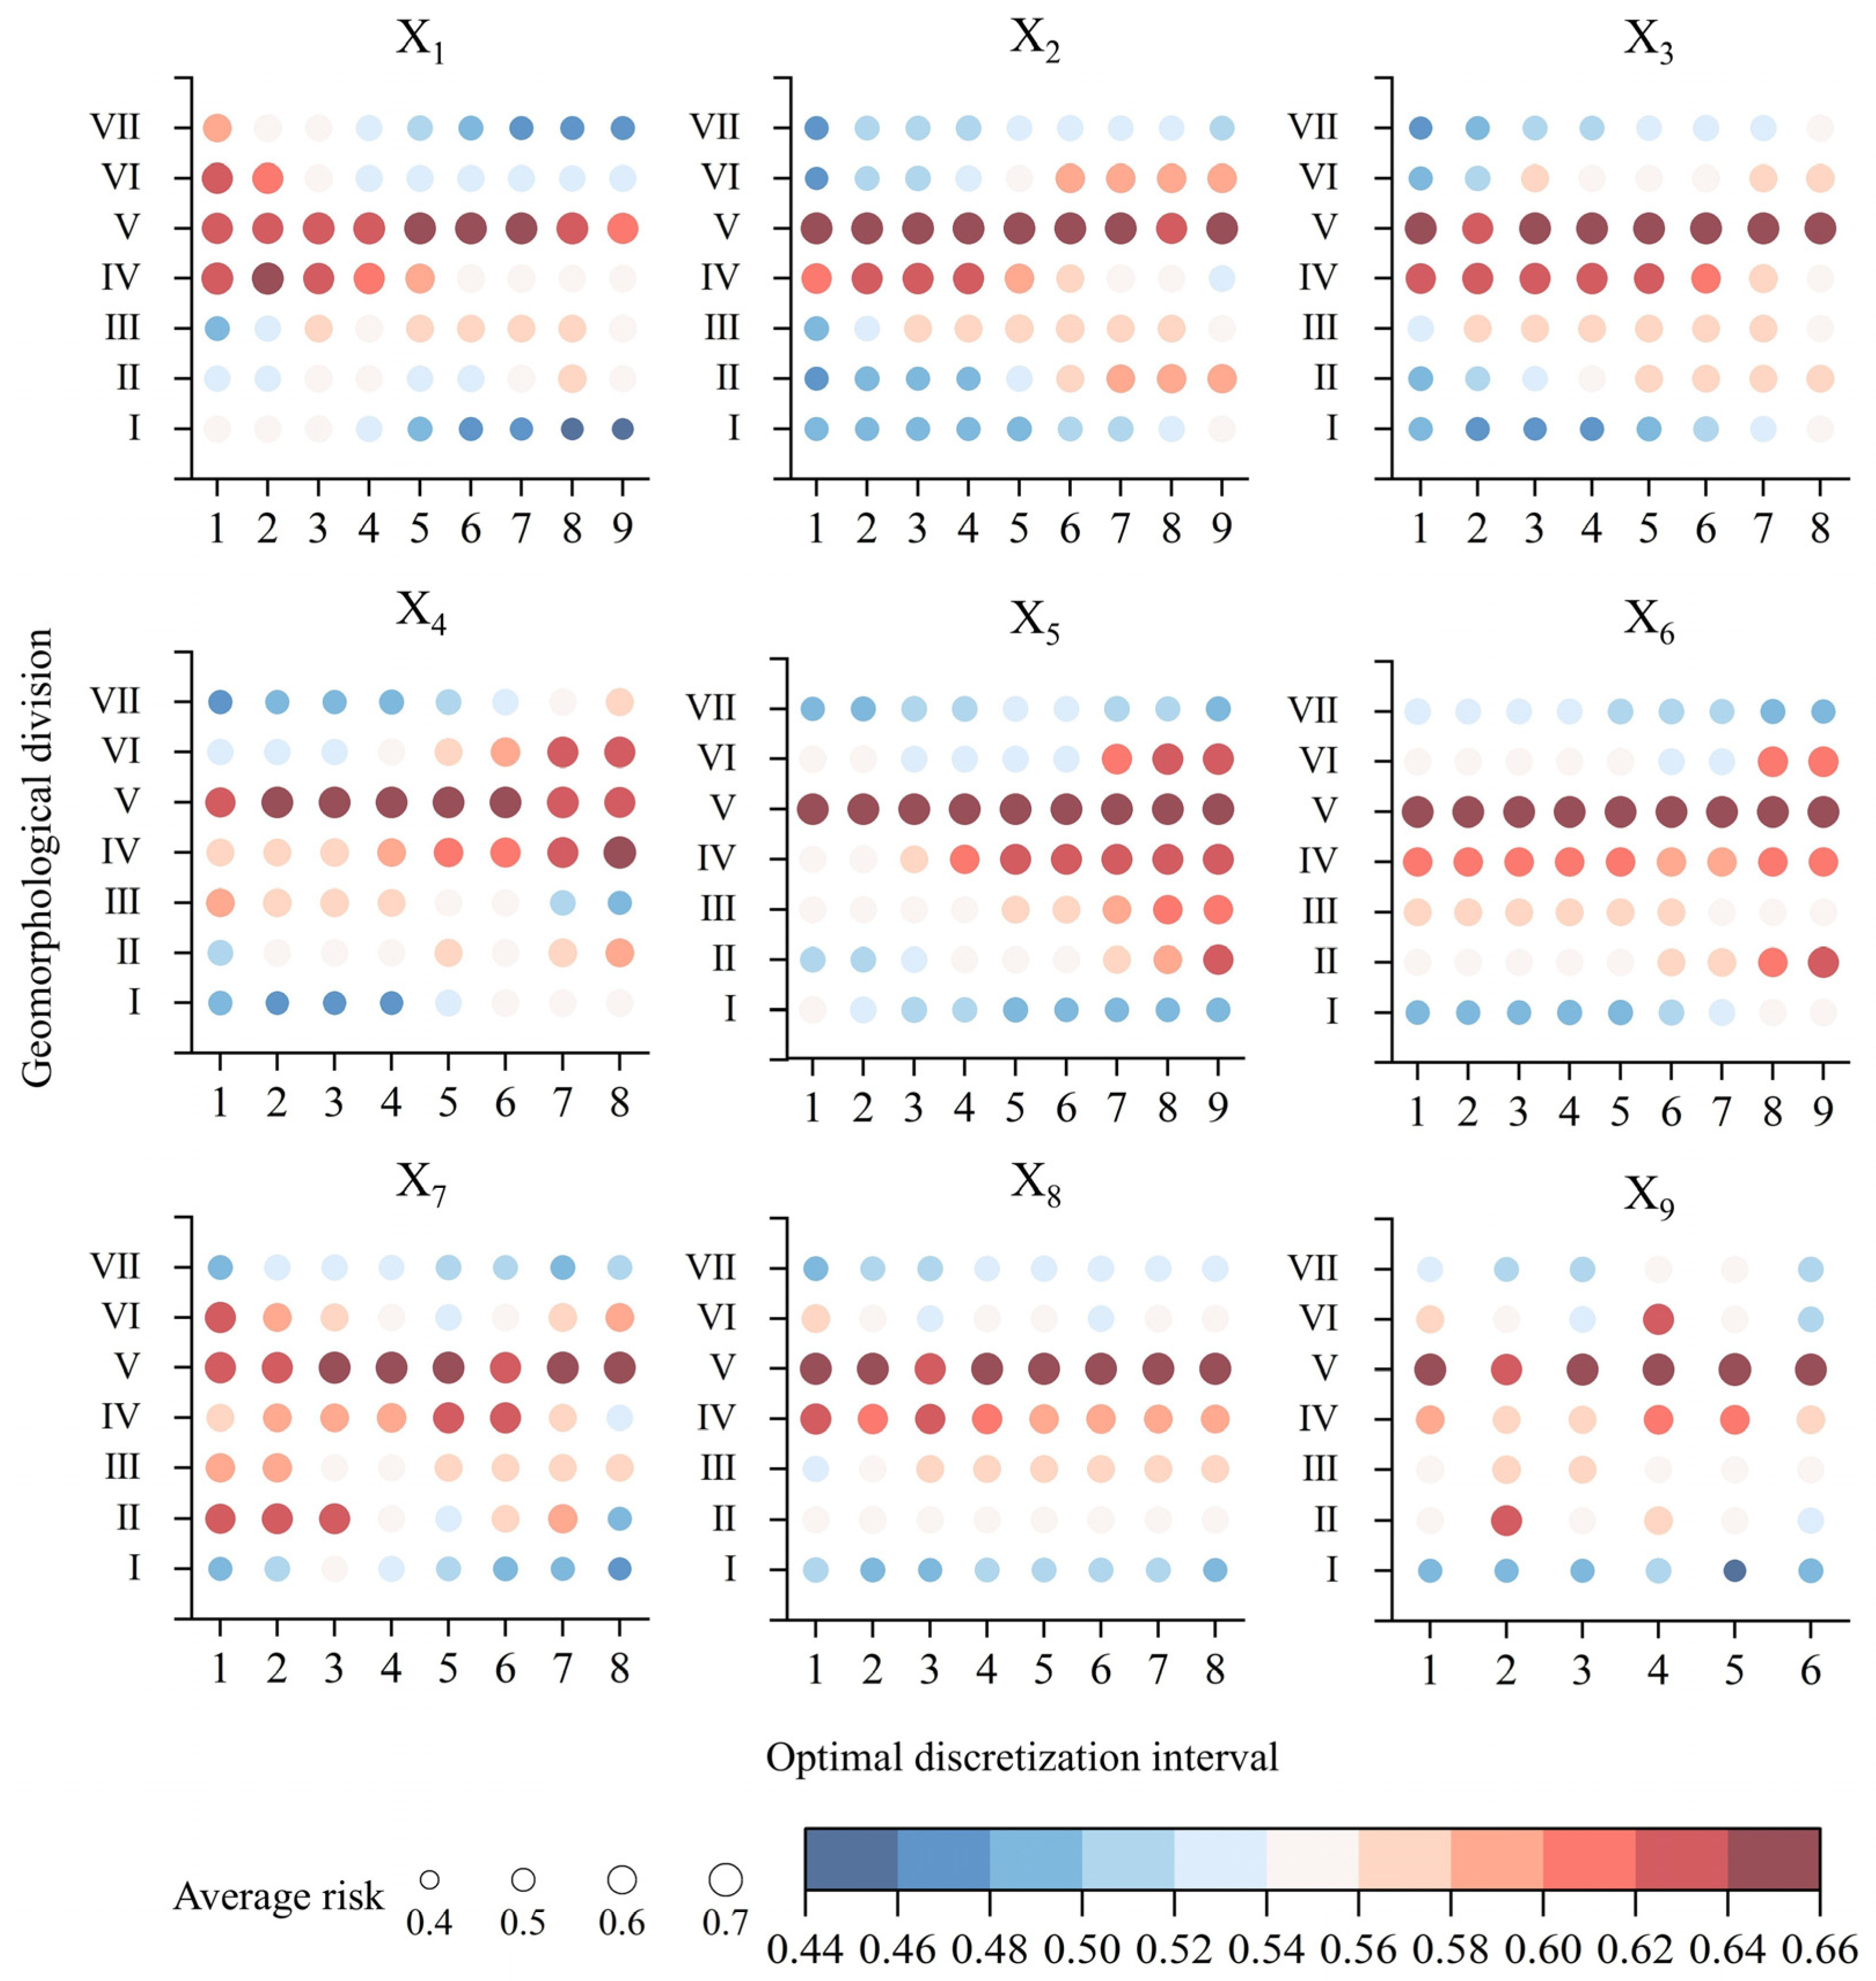
In order to reveal the differences in effective drought propagation rates across various geomorphological divisions of the Loess Plateau in northern Shaanxi, a risk detection analysis was conducted based on multi-year average data, focusing on the optimal discretization intervals of each driving factor. The results are presented in Figure 10.
Regarding meteorological factors, the effective drought propagation rate peaks in divisions I, IV, VI, and VII during periods of minimal precipitation. However, once this range is surpassed, the effective propagation rate of drought reduces as precipitation increases, indicating that precipitation has a suppressive effect on drought propagation in these divisions. This finding aligns with the factor detection results and suggests that increased precipitation helps mitigate drought propagation. Additionally, it was observed that the effective propagation rate of drought generally increases with rising temperature, potential evapotranspiration, and the aridity index across most geomorphological divisions. This is likely due to these factors decreasing soil moisture, thereby facilitating the transition from meteorological to agricultural drought.
In terms of underlying surface factors, the effective propagation rate of drought in division I decreases as elevation increases, whereas the remaining six geomorphological divisions exhibit the opposite pattern. The slope exhibits a positive correlation with propagation rate in divisions I and II while demonstrating a negative correlation in divisions VI and VII, indicating that drought propagation is influenced by topographic conditions, albeit with regional variability. Furthermore, the relationship between soil moisture and propagation rate appears to fluctuate across divisions, suggesting that the impact of soil moisture on drought propagation varies significantly in the study area.
Concerning human activity factors, the effective propagation rate of drought in division IV diminishes as population density increases, whereas the opposite tendency is observed in division VII. This may be ascribed to large-scale artificial rainfall, water diversion irrigation, and ecological restoration methods implemented in recent years in the loess beam hills division to alleviate drought. As a result, the rise in population density has not accelerated the propagation of meteorological drought to agricultural drought. Additionally, different land use types exhibit varying effects on drought propagation rates across geomorphological divisions, reflecting the complex role of human activities in drought dynamics.

5. Discussion

This study systematically explored the propagation characteristics of meteorological drought to agricultural drought in the Loess Plateau of northern Shaanxi from the perspective of geomorphological divisions. The lag time, effective propagation rate, dominant driving factors, and their interactions were quantitatively analyzed. Based on previous research, this work further reveals the regulatory role of geomorphological background in drought propagation, providing a new perspective for understanding the spatial heterogeneity of drought.
The results indicate a significant positive correlation between meteorological and agricultural droughts. Drought propagation was primarily delayed by 1–3 months and exhibited substantial seasonality, with faster propagation in spring and summer and slower in winter. These findings are consistent with those of Li et al. [63], Zhang et al. [64], Xu et al. [65], and Feng et al. [66] in Northwest China and the Loess Plateau. In contrast to the findings of Li et al. [63], this study reveals that the lag time in spring was shorter than that in summer. The analysis suggests that this may be attributed to the utilization of the SPEI, which incorporates temperature effects. Although high temperatures would exacerbate meteorological drought, the concentrated summer precipitation (July-September) and substantial soil moisture buffering effect in the Loess Plateau may prolong the propagation lag, leading to a slightly extended lag period compared to the findings of Li et al. [63]. Furthermore, this study further found that propagation time varies across geomorphological divisions. Specifically, the loess wide valley hills division exhibits the shortest propagation period (1.0 months), while the loess tableland division demonstrates a longer lag, indicating that geomorphological attributes play a regulatory role in the drought propagation process.
This study identifies precipitation and soil moisture as the dominant driving factors using the OPGD model, especially in the loess beam hills division. These results are corroborated by the findings of Feng et al. [66] in Northwest China, affirming the leading role of meteorological and underlying surface conditions. In terms of human activities, they significantly alter the spatial pattern of drought [67]. This study found a negative correlation between population density and drought propagation rate in the loess beam hills division, as elucidated by the findings of Wang et al. [68] about the mitigating effects of water-saving irrigation and other human interventions. Moreover, the influence of land use types on drought propagation patterns exhibited variability across geomorphological divisions, consistent with the findings of Murugesan et al. [69].
Furthermore, interaction terms identified by the OPGD model, such as “precipitation ∩ soil moisture”, demonstrated significantly greater explanatory power than individual factors across most geomorphological divisions, with the highest q-value reaching 0.73. This discovery is supported by the research of Liu et al. [70] in the Fuhe River Basin, which also highlighted a bi-factor enhancement or nonlinear enhancement relationship between driving factors such as temperature, precipitation, and solar radiation.
Additionally, different threshold settings can profoundly affect the identification results of drought events. For example, He et al. [44] established thresholds of 0.5, 0, and –0.5, whereas Yuan et al. [71] adopted 0, –0.4, and –0.6. In comparison to the thresholds of R0 = 0, R1 = −0.3, and R2 = –0.5 established in this study, these thresholds exhibit a broader identification range, potentially neglecting early drought events occurring between –0.3 and –0.5 in the Loess Plateau. This may result in considerable discrepancies between the identified drought events and the actual conditions in the study area. This paper integrates three existing thresholds based on empirical regional drought data. Consequently, it can more precisely delineate regional drought characteristics. The spatial and temporal distribution of detected drought occurrences closely corresponds with the actual regional conditions, resulting in considerable representativeness and explanatory efficacy. This paper, however, possesses limitations. The sensitivity of drought detection outcomes and the effective conductivity of agricultural drought to threshold settings may introduce uncertainty in the results. Future research may employ various threshold combinations for comparative analysis to investigate the influence of threshold selection on the estimation of drought propagation features, hence improving the robustness of the findings.
This study established a “process-mechanism” analysis framework utilizing geomorphological divisions as spatial response units, integrating cross-wavelet analysis, grey relational analysis, and the OPGD model to supplement research on drought propagation mechanisms in various geomorphological units. It is worth noting that this study primarily examines the unidirectional propagation from meteorological to agricultural drought. In the future, drought categories such as hydrological drought, socioeconomic drought, and ecological drought might be incorporated to enhance the triggering and propagation mechanisms across different types of droughts in northern Shaanxi’s Loess Plateau.

6. Conclusions

This study focuses on the relationship between meteorological drought and agricultural drought. The SPEI-3 and SSMI-3, along with cross-wavelet analysis, grey relational analysis, and the optimal parameter geographic detector model (OPGD), were employed to systematically explore the spatiotemporal characteristics and driving mechanisms of drought propagation in typical regions of the Loess Plateau in northern Shaanxi. The primary conclusions are as follows:
(1)
Meteorological drought and agricultural drought exhibit significant positive correlations during spring, summer, and autumn, whereas the correlation in winter is relatively weak. The overall drought propagation lag is short, with the seasonal propagation lag concentrated in 1–3 months. Spring demonstrates the shortest lag (average of 1.2 months), while winter exhibits the longest lag (average of 3.1 months).
(2)
The propagation rate of drought exceeds 0.4 on the Loess Plateau in northern Shaanxi, exhibiting distinct regional heterogeneity. The propagation rate is higher in the west and central regions (up to 0.68) but lower in the north and south. Among the various geomorphological divisions, the loess wide valley hills and the loess beam hills exhibit stronger propagation effects (rates of 0.64 and 0.59, respectively), whereas the loess tableland and the earth and soil–stone hills demonstrate weaker propagation (around 0.50).
(3)
The OPGD results demonstrate that the dominant driving factors vary across geomorphological types. Precipitation and soil moisture are the main contributors in most regions, whereas temperature exerts the greatest influence on the wind-sand hills. Synergistic enhancement effects are present among driving factors: elevated temperature, potential evapotranspiration, and aridity significantly promote drought propagation, while precipitation exerts a suppressive effect in certain areas. Soil moisture and land use types exhibit spatial heterogeneity in their effects. Additionally, the impact of population density differs by region: in the loess beam hills division, it is negatively correlated with drought propagation, likely due to regional interventions such as artificial precipitation enhancement and ecological restoration; conversely, a positive correlation is noted in the soil–stone hills division.

Supplementary Materials

The following supporting information can be downloaded at: https://www.mdpi.com/article/10.3390/w17162447/s1, S.1. Geographical Division Map of the Loess Plateau (2000). S.2. Standardized Precipitation Evapotranspiration Index (SPEI). S.3. Standardized Soil Moisture Index (SSMI). S.4. Results. S.5. OPGD model driving factor q-value and its associated p-value. Figure S1. Geographical Division Map of the Loess Plateau (2000). Figure S2. The calculation results of SPEI-1. Figure S3. The calculation results of SPEI-3. Figure S4. The calculation results of SPEI-12. Figure S5. The calculation results of SSMI-1. Figure S6. The calculation results of SSMI-3. Figure S7. The calculation results of SSMI-12. Table S1. Drought level classifications. Table S2. OPGD model driving factor q-value and its associated p-value.

Author Contributions

Conceptualization, Y.Z. and Z.Y.; Methodology, Y.Z. and Z.Y.; Validation, J.L. and X.Z.; Formal analysis, Y.Z. and Z.Y.; Investigation, Z.Y.; Resources, H.Z.; Data curation, Y.Z., Z.Y. and H.M.; Writing—original draft, Y.Z.; Writing—review & editing, H.Z.; Visualization, Y.Z.; Supervision, H.Z.; Funding acquisition, H.Z. All authors have read and agreed to the published version of the manuscript.

Funding

This research was supported by the National Natural Science Foundation of China (Grant Nos. 52379003 and 51979005) and the Natural Science Basic Research Program of Shaanxi, China (Grant No. 2022JC-LHJJ-03).

Acknowledgments

The authors are grateful to the members of the research group. The authors thank the editor and anonymous reviewers for their valuable comments and suggestions on this paper.

Conflicts of Interest

Author Zhaoxia Ye was employed by the company Gansu Water Resources and Hydropower Survey, Design and Research Institute Co., Ltd., authors Jiaojiao Lyu and Huan Ma were employed by the company PowerChina Northwest Engineering Corporation Limited.The remaining authors declare that the research was conducted in the absence of any commercial or financial relationships that could be construed as a potential conflict of interest.

References

  1. Van Loon, A.F. Hydrological drought explained. Wiley Interdiscip. Rev. Water 2015, 2, 359–392. [Google Scholar] [CrossRef]
  2. Yao, N.; Li, Y.; Lei, T.J.; Peng, L. Drought evolution, severity and trends in mainland China over 1961–2013. Sci. Total Environ. 2018, 616–617, 73–89. [Google Scholar] [CrossRef] [PubMed]
  3. Li, Q.Q.; Ye, A.Z.; Zhang, Y.H.; Zhou, J. The peer-to-peer type propagation from meteorological drought to soil moisture drought occurs in areas with strong land-atmosphere interaction. Water Resour. Res. 2022, 58, e2022WR032846. [Google Scholar] [CrossRef]
  4. Zhao, X.W.; Yang, T.Z.; Zhang, H.B.; Lan, T.; Xue, C.; Li, T.; Ye, Z.; Yang, Z.; Zhang, Y. GTDI: A game-theory-based integrated drought index implying hazard-causing and hazard-bearing impact change. Nat. Hazards Earth Syst. Sci. 2024, 24, 3479–3495. [Google Scholar] [CrossRef]
  5. Vicente-Serrano, S.M.; Pricope, N.G.; Toreti, A.; Morán-Tejeda, E.; Spinoni, J.; Ocampo-Melgar, A.; Archer, E.; Diedhiou, A.; Mesbahzadeh, T.; Ravindranath, N.H.; et al. The Global Threat of Drying Lands: Regional and Global Aridity Trends and Future Projections. A Report of the Science-Policy Interface; United Nations Convention to Combat Desertification (UNCCD): Bonn, Germany, 2024. [Google Scholar]
  6. Su, B.D.; Huang, J.L.; Mondal, S.K.; Zhai, J.; Wang, Y.; Wen, S.; Gao, M.; Lv, Y.; Jiang, S.; Jiang, T.; et al. Insight from CMIP6 SSP-RCP scenarios for future drought characteristics in China. Atmos. Res. 2021, 250, 105375. [Google Scholar] [CrossRef]
  7. Dai, M.; Huang, S.Z.; Huang, Q.; Zheng, X.; Su, X.; Leng, G.; Li, Z.; Guo, Y.; Fang, W.; Liu, Y. Propagation characteristics and mechanism from meteorological to agricultural drought in various seasons. J. Hydrol. 2022, 610, 127897. [Google Scholar] [CrossRef]
  8. Wu, J.W.; Miao, C.Y.; Zheng, H.Y.; Duan, Q.; Lei, X.; Li, H. Meteorological and hydrological drought on the Loess Plateau, China: Evolutionary characteristics, impact, and propagation. J. Geophys. Res. Atmos. 2018, 123, 11569–11584. [Google Scholar] [CrossRef]
  9. Ashraf, M.S.; Shahid, M.; Waseem, M.; Azam, M.; Rahman, K.U. Assessment of variability in hydrological droughts using the improved innovative trend analysis method. Sustainability 2023, 15, 9065. [Google Scholar] [CrossRef]
  10. Ashraf, M.; Arshad, A.; Patel, P.M.; Khan, A.; Qamar, H.; Siti-Sundari, R.; Ghani, M.U.; Amin, A.; Babar, J.R. Quantifying climate-induced drought risk to livelihood and mitigation actions in Balochistan. Nat. Hazards 2021, 109, 2127–2151. [Google Scholar] [CrossRef]
  11. Wilhite, D.A.; Glantz, M.H. Understanding: The drought phenomenon: The role of definitions. Water Int. 1985, 10, 111–120. [Google Scholar] [CrossRef]
  12. Hao, Z.H.; Singh, P.V. Drought characterization from a multivariate perspective: A review. J. Hydrol. 2015, 527, 668–678. [Google Scholar] [CrossRef]
  13. Dai, M.; Huang, S.Z.; Huang, Q.; Leng, G.; Guo, Y.; Wang, L.; Fang, W.; Li, P.; Zheng, X. Assessing agricultural drought risk and its dynamic evolution characteristics. Agric. Water Manag. 2020, 231, 106003. [Google Scholar] [CrossRef]
  14. Azam, M.; Nauman Altaf, M.; Waseem, M.; Anjum, M.N.; Afzal, A.; Hussain, F.; Eun Lee, J.; Ahmed, R.; Latif, M.; Kwon, S.A.; et al. Bivariate risk evaluation of drought across Balochistan, Pakistan. Heliyon 2025. under review. [Google Scholar] [CrossRef]
  15. Tu, X.J.; Wu, H.O.; Singh, V.P.; Chen, X.; Lin, K.; Xie, Y. Multivariate design of socioeconomic drought and impact of water reservoirs. J. Hydrol. 2018, 566, 192–204. [Google Scholar] [CrossRef]
  16. Barker, L.J.; Hannaford, J.; Chiverton, A.; Svensson, C. From meteorological to hydrological drought using standardised indicators. Hydrol. Earth Syst. Sci. 2016, 20, 2483–2505. [Google Scholar] [CrossRef]
  17. Jehanzaib, M.; Sattar, M.N.; Lee, J.; Kim, T.-W. Investigating effect of climate change on drought propagation from meteorological to hydrological drought using multi-model ensemble projections. Stoch. Environ. Res. Risk Assess. 2020, 34, 7–21. [Google Scholar] [CrossRef]
  18. Wu, J.F.; Chen, X.H.; Yao, H.X.; Zhang, D. Multi-timescale assessment of propagation thresholds from meteorological to hydrological drought. Sci. Total Environ. 2021, 765, 144232. [Google Scholar] [CrossRef]
  19. Xu, Y.; Zhang, X.; Hao, Z.C.; Singh, V.P.; Hao, F. Characterization of agricultural drought propagation over China based on bivariate probabilistic quantification. J. Hydrol. 2021, 598, 126194. [Google Scholar] [CrossRef]
  20. Sarwar, A.N.; Waseem, M.; Azam, M.; Abbas, A.; Ahmad, I.; Lee, J.E.; Haq, F.U. Shifting of Meteorological to Hydrological Drought Risk at Regional Scale. Appl. Sci. 2022, 12, 5560. [Google Scholar] [CrossRef]
  21. Han, H.M.; Sun, J.H. An analysis of the meteorological and hydrological drought propagation characteristics in Ganjiang River Basin. China Rural Water Hydropower 2022, 12, 101–106. [Google Scholar]
  22. Sattar, M.N.; Lee, J.Y.; Shin, J.Y.; Kim, T.W. Probabilistic characteristics of drought propagation from meteorological to hydrological drought in South Korea. Water Resour. Manag. 2019, 33, 2439–2452. [Google Scholar] [CrossRef]
  23. Dehghani, M.; Saghafian, B.; Zargar, M. Probabilistic hydrological drought index forecasting based on meteorological drought index using Archimedean copulas. Hydrol. Res. 2019, 50, 1230–1250. [Google Scholar] [CrossRef]
  24. Geng, G.P.; Zhang, B.; Gu, Q.; He, Z.; Zheng, R. Drought propagation characteristics across China: Time, probability, and threshold. J. Hydrol. 2024, 631, 130805. [Google Scholar] [CrossRef]
  25. Huang, S.Z.; Huang, Q.; Chang, J.X.; Leng, G.; Xing, L. The response of agricultural drought to meteorological drought and the influencing factors: A case study in the Wei River Basin, China. Agric. Water Manag. 2015, 159, 45–54. [Google Scholar] [CrossRef]
  26. Gevaert, A.I.; Veldkamp, T.I.; Ward, P.J. The effect of climate type on timescales of drought propagation in an ensemble of global hydrological models. Hydrol. Earth Syst. Sci. 2018, 22, 4649–4665. [Google Scholar] [CrossRef]
  27. Wu, J.W.; Miao, C.Y.; Tang, X.; Duan, Q.; He, X. A nonparametric standardized runoff index for characterizing hydrological drought on the Loess Plateau, China. Glob. Planet. Change 2018, 161, 53–65. [Google Scholar] [CrossRef]
  28. Guo, J.; Xiao, D.Y.; Sun, X.L.; Guo, F.; Xue, S.; Fan, L. Drought risk assessment on arid region under different socioeconomic scenarios: A case of Loess Plateau, China. Ecol. Indic. 2024, 167, 112728. [Google Scholar] [CrossRef]
  29. Ding, Z.M.; Yao, S.B. Assessing the ecological effectiveness of Sloping Land Conversion Programme to identify vegetation restoration types: A case study of Northern Shaanxi Loess Plateau, China. Ecol. Indic. 2022, 145, 109671. [Google Scholar] [CrossRef]
  30. Yan, Z.J.; Wang, Y.R.; Hu, X.; Luo, W. Assessment and enhancement of ecosystem service supply efficiency based on production possibility frontier: A case study of the Loess Plateau in northern Shaanxi. Sustainability 2023, 15, 14314. [Google Scholar] [CrossRef]
  31. Wen, X. Temporal and spatial relationships between soil erosion and ecological restoration in semi-arid regions: A case study in northern Shaanxi, China. GISci. Remote Sens. 2020, 57, 572–590. [Google Scholar] [CrossRef]
  32. Li, C.; Wu, P.T.; Li, X.L.; Zhou, T.; Sun, S.; Wang, Y.; Luan, X.; Yu, X. Spatial and temporal evolution of climatic factors and its impacts on potential evapotranspiration in Loess Plateau of Northern Shaanxi, China. Sci. Total Environ. 2017, 589, 165–172. [Google Scholar] [CrossRef] [PubMed]
  33. Wang, H.; Hu, Y.F. Simulation of biocapacity and spatial-temporal evolution analysis of Loess Plateau in northern Shaanxi based on the CA–Markov model. Sustainability 2021, 13, 5901. [Google Scholar] [CrossRef]
  34. Yang, Q.K. Graphs of Geographical Division on the Loess Plateau (2000); Data Sharing Infrastructure of Earth System Science_Data Sharing Infrastructure of Loess Plateau: 2013. Available online: https://www.geodata.cn/main/face_science_detail?typeName=face_science&guid=155336412721281 (accessed on 1 August 2025).
  35. Peng, S.Z.; Ding, Y.X.; Wen, Z.M.; Chen, Y.; Cao, Y.; Ren, J. Spatiotemporal change and trend analysis of potential evapotranspiration over the Loess Plateau of China during 2011–2100. Agric. For. Meteorol. 2017, 233, 183–194. [Google Scholar] [CrossRef]
  36. Peng, S.Z.; Gang, C.C.; Cao, Y.; Chen, Y. Assessment of climate change trends over the Loess Plateau in China from 1901 to 2100. Int. J. Climatol. 2018, 38, 2250–2264. [Google Scholar] [CrossRef]
  37. Peng, S.Z.; Ding, Y.X.; Liu, W.Z.; Li, Z. 1 km monthly temperature and precipitation dataset for China from 1901 to 2017. Earth Syst. Sci. Data 2019, 11, 1931–1946. [Google Scholar] [CrossRef]
  38. Ding, Y.X.; Peng, S.Z. Spatiotemporal trends and attribution of drought across China from 1901–2100. Sustainability 2020, 12, 477. [Google Scholar] [CrossRef]
  39. Ding, Y.X.; Peng, S.Z. Spatiotemporal change and attribution of potential evapotranspiration over China from 1901 to 2100. Theor. Appl. Climatol. 2021, 145, 79–94. [Google Scholar] [CrossRef]
  40. Vicente-Serrano, S.M.; Beguería, S.; López-Moreno, J.I. A multiscalar drought index sensitive to global warming: The standardized precipitation evapotranspiration index. J. Clim. 2010, 23, 1696–1718. [Google Scholar] [CrossRef]
  41. Hao, Z.; AghaKouchak, A. Multivariate standardized drought index: A parametric multi-index model. Adv. Water Resour. 2013, 57, 12–18. [Google Scholar] [CrossRef]
  42. Oertel, M.; Meza, F.J.; Gironás, J.; Scott, C.A.; Rojas, F.; Pineda-Pablos, N. Drought propagation in semi-arid river basins in Latin America: Lessons from Mexico to the Southern Cone. Water 2018, 10, 1564. [Google Scholar] [CrossRef]
  43. Khan, M.I.; Zhu, X.Y.; Arshad, M.; Zaman, M.; Niaz, Y.; Ullah, I.; Anjum, M.N.; Uzair, M. Assessment of spatiotemporal characteristics of agro-meteorological drought events based on comparing Standardized Soil Moisture Index, Standardized Precipitation Index and Multivariate Standardized Drought Index. J. Water Clim. Change 2020, 11 (Suppl. S1), 1–17. [Google Scholar] [CrossRef]
  44. He, J.; Yang, X.H.; Li, Z.; Zhang, X.; Tang, Q. Spatiotemporal variations of meteorological droughts in China during 1961–2014: An investigation based on multi-threshold identification. Int. J. Disaster Risk Sci. 2016, 7, 63–76. [Google Scholar] [CrossRef]
  45. Ma, Q.; Li, Y.; Liu, F.G.; Feng, H.; Biswas, A.; Zhang, Q. SPEI and multi-threshold run theory based drought analysis using multi-source products in China. J. Hydrol. 2023, 616, 128737. [Google Scholar] [CrossRef]
  46. Palagiri, H.; Pal, M. Agricultural drought risk assessment in Southern Plateau and Hills using multi threshold run theory. Results Eng. 2024, 22, 102022. [Google Scholar] [CrossRef]
  47. GB/T20481-2006; Classification of Meteorological Drought. China Standardization Association: Beijing, China, 2006.
  48. Li, C.D.; Wang, L.; Li, X.X.; Li, Q.; Chang, Z.; Ma, Z. Temporal and spatial characteristics of droughts and floods in the Loess Plateau based on standardized precipitation index. Torrential Rain Disasters 2020, 39, 524–531. [Google Scholar]
  49. Wang, X.F.; Zhang, Y.; Feng, X.M.; Feng, Y.; Xue, Y.; Pan, N. Analysis and application of drought characteristics based on run theory and Copula function. Trans. Chin. Soc. Agric. Eng. 2017, 33, 206–214. [Google Scholar]
  50. Maraun, D.; Kurths, J. Cross wavelet analysis: Significance testing and pitfalls. Nonlinear Process. Geophys. 2004, 11, 505–514. [Google Scholar] [CrossRef]
  51. Marques de Souza, A.; Echer, E.; Bolzan, M.J.A.; Hajra, R. Cross-correlation and cross-wavelet analyses of the solar wind IMF Bz and auroral electrojet index AE coupling during HILDCAAs. Ann. Geophys. 2018, 36, 205–211. [Google Scholar] [CrossRef]
  52. Li, R.H.; Chen, N.C.; Zhang, X.; Zeng, L.; Wang, X.; Tang, S.; Li, D.; Niyogi, D. Quantitative analysis of agricultural drought propagation process in the Yangtze River Basin by using cross wavelet analysis and spatial autocorrelation. Agric. For. Meteorol. 2020, 280, 107809. [Google Scholar] [CrossRef]
  53. Muraja, D.O.S.; Klausner, V.; Prestes, A.; da Silva, I.R. Ocean–atmosphere interaction identified in tree-ring time series from southern Brazil using cross-wavelet analysis. Theor. Appl. Climatol. 2023, 153, 1177–1189. [Google Scholar] [CrossRef]
  54. Kadier, A.; Abdeshahian, P.; Simayi, Y.; Ismail, M.; Hamid, A.A.; Kalil, M.S. Grey relational analysis for comparative assessment of different cathode materials in microbial electrolysis cells. Energy 2015, 90, 1556–1562. [Google Scholar] [CrossRef]
  55. Rehman, E.; Ikram, M.; Feng, M.T.; Rehman, S. Sectoral-based CO2 emissions of Pakistan: A novel Grey Relation Analysis (GRA) approach. Environ. Sci. Pollut. Res. 2020, 27, 29118–29129. [Google Scholar] [CrossRef] [PubMed]
  56. Bai, J.Z.; Zhou, Z.X.; Zou, Y.F.; Pulatov, B.; Siddique, K.H. Watershed drought and ecosystem services: Spatiotemporal characteristics and gray relational analysis. ISPRS Int. J. Geo-Inf. 2021, 10, 43. [Google Scholar] [CrossRef]
  57. Guo, Y.; Huang, S.Z.; Huang, Q.; Leng, G.; Fang, W.; Wang, L.; Wang, H. Propagation thresholds of meteorological drought for triggering hydrological drought at various levels. Sci. Total Environ. 2020, 712, 136502. [Google Scholar] [CrossRef]
  58. Song, Y.Z.; Wang, J.F.; Ge, Y.; Xu, C. An optimal parameters-based geographical detector model enhances geographic characteristics of explanatory variables for spatial heterogeneity analysis: Cases with different types of spatial data. GISci. Remote Sens. 2020, 57, 593–610. [Google Scholar] [CrossRef]
  59. Sun, Y.J.; Liu, X.F.; Ren, Z.Y.; Li, S. Spatiotemporal variations of multi-scale drought and its influencing factors across the Loess Plateau from 1960 to 2016. Geogr. Res. 2019, 38, 1820–1832. [Google Scholar]
  60. Wang, J.R.; Sun, C.J.; Zheng, Z.J.; Li, X.M. Drought characteristics of the Loess Plateau in the past 60 years and its relationship with changes in atmospheric circulation. Acta Ecol. Sin. 2021, 41, 5340–5351. [Google Scholar] [CrossRef]
  61. Huang, S.Z.; Li, P.; Huang, Q.; Leng, G.; Hou, B.; Ma, L. The propagation from meteorological to hydrological drought and its potential influence factors. J. Hydrol. 2017, 547, 184–195. [Google Scholar] [CrossRef]
  62. Wang, J.S.; Wang, W.; Cheng, H.; Wang, H.; Zhu, Y. Propagation from meteorological to hydrological drought and its influencing factors in the Huaihe River Basin. Water 2021, 13, 1985. [Google Scholar] [CrossRef]
  63. Li, M.; Ge, C.H.; Deng, Y.Y.; Wang, G.; Chai, X. Meteorological and agricultural drought characteristics and their relationship across the Loess Plateau. Sci. Geogr. Sin. 2020, 40, 2105–2114. [Google Scholar]
  64. Zhang, Y.; Hao, Z.C.; Feng, S.F.; Zhang, X.; Xu, Y.; Hao, F. Agricultural drought prediction in China based on drought propagation and large-scale drivers. Agric. Water Manag. 2021, 255, 107028. [Google Scholar] [CrossRef]
  65. Xu, Z.G.; Wu, Z.Y.; Shao, Q.X.; He, H.; Guo, X. From meteorological to agricultural drought: Propagation time and probabilistic linkages. J. Hydrol. Reg. Stud. 2023, 46, 101329. [Google Scholar] [CrossRef]
  66. Feng, K.; Yuan, H.B.; Wang, Y.Y.; Li, Y.; Wang, X.; Wang, F.; Su, X.; Zhang, Z. Propagation Dynamics from Meteorological to Agricultural Drought in Northwestern China: Key Influencing Factors. Agronomy 2024, 14, 1987. [Google Scholar] [CrossRef]
  67. Xu, Y.; Zhang, X.; Wang, X.; Hao, Z.; Singh, V.P.; Hao, F. Propagation from meteorological drought to hydrological drought under the impact of human activities: A case study in northern China. J. Hydrol. 2019, 579, 124147. [Google Scholar] [CrossRef]
  68. Wang, W.X.; Cui, C.F.; Yu, W.H. Response of drought index to land use types in the Loess Plateau of Shaanxi, China. Sci. Rep. 2022, 12, 8668. [Google Scholar] [CrossRef]
  69. Murugesan, E.; Shanmugamoorthy, S.; Veerasamy, S.; Sivakumar, V. Drought assessment in Coimbatore South region, Tamil Nadu, India, using remote sensing and meteorological data. J. Earth Syst. Sci. 2025, 134, 40. [Google Scholar] [CrossRef]
  70. Liu, M.C.; Jian, H.F.; Han, H.M.; Long, P. Analyzing the droughts and their determinants in the Fuhe River Basin using the SWAT model. J. Irrig. Drain. 2024, 43, 114–120. [Google Scholar]
  71. Yuan, X.C.; Zhou, Y.L.; Jin, J.L.; Wei, Y.-M. Risk analysis for drought hazard in China: A case study in Huaibei Plain. Nat. Hazards 2013, 67, 879–900. [Google Scholar] [CrossRef]
  72. Fowé, T.; Yonaba, R.; Mounirou, L.A.; Ouédraogo, E.; Ibrahim, B.; Niang, D.; Karambiri, H.; Yacouba, H. From meteorological to hydrological drought: A case study using standardized indices in the Nakanbe River Basin, Burkina Faso. Nat. Hazards 2023, 119, 1941–1965. [Google Scholar]
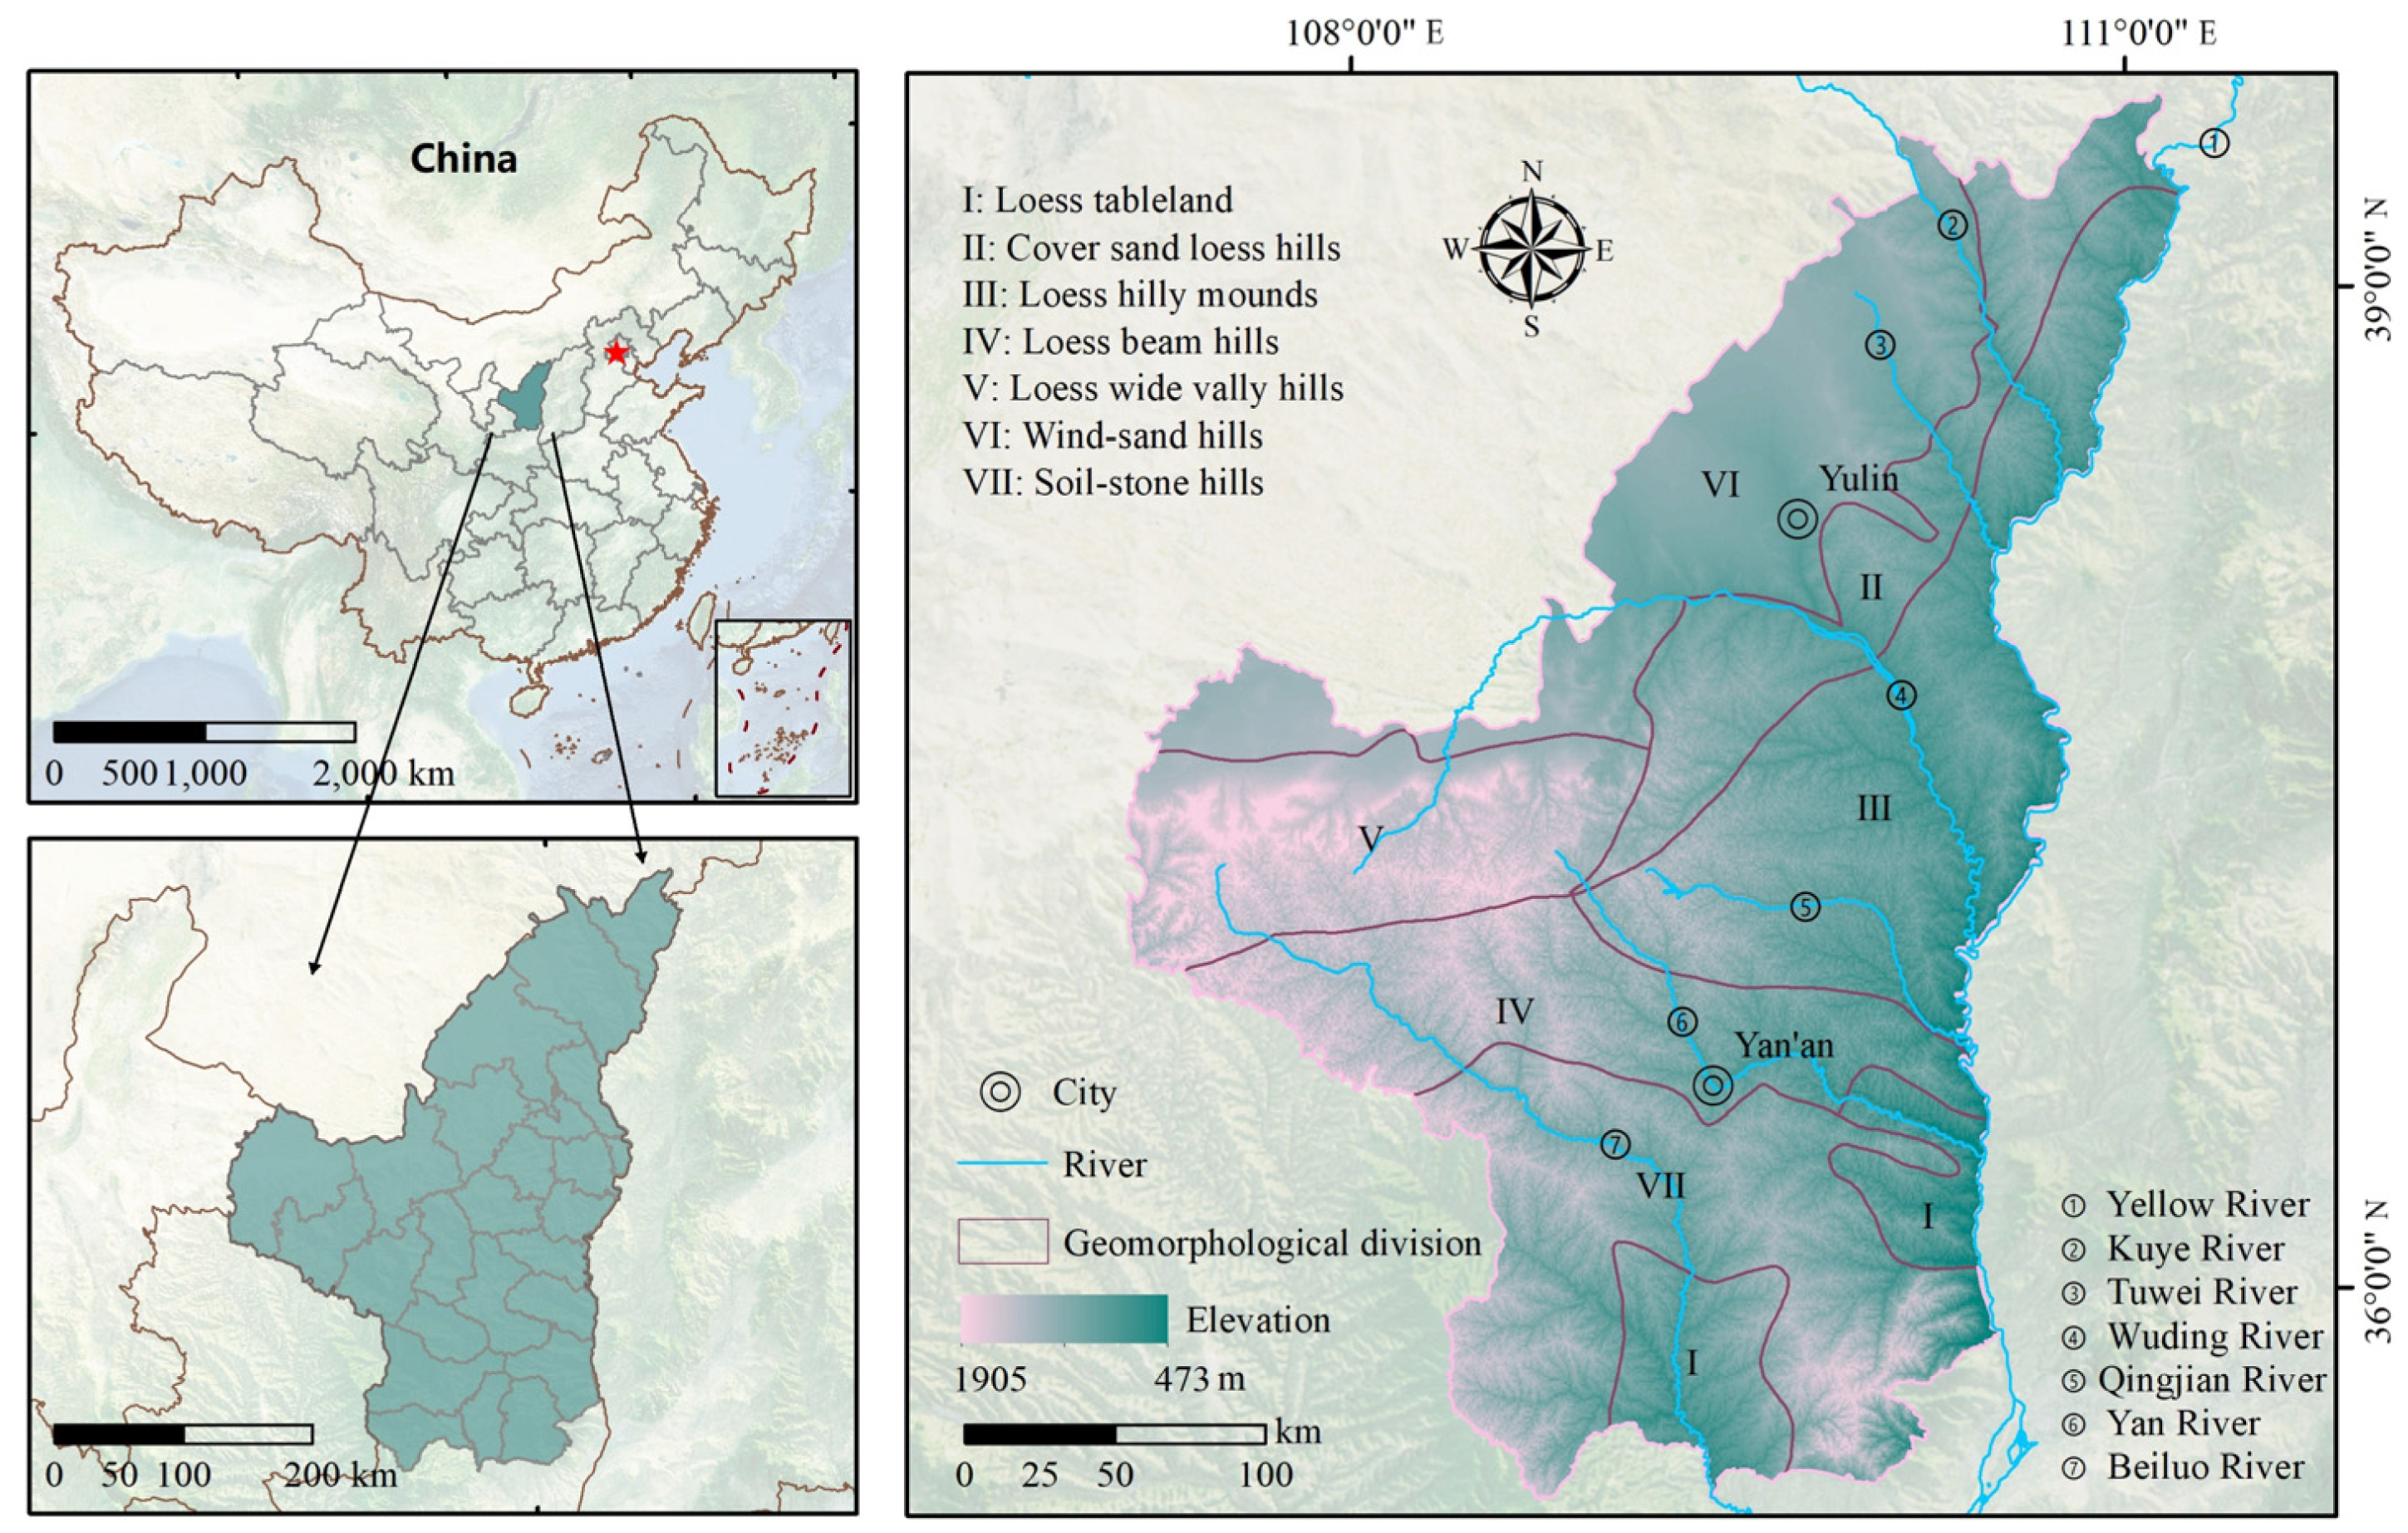
Figure 1. Geographic location and geomorphological divisions of the study area. The red star indicates the location of Beijing, the capital of China.
Water 17 02447 g001
Figure 2. The schematic map of the drought event identification process based on three-threshold run theory.
Water 17 02447 g002
Figure 3. Cross-wavelet transform (XWT) and wavelet coherence (WTC) of the SPEI and SSMI.
Water 17 02447 g003
Figure 4. Grey relational analysis between SPEI at multiple time scales and 1-month SSMI.
Water 17 02447 g004
Figure 5. The spatial distribution of the effective propagation rate from meteorological to agricultural drought in the Loess Plateau of northern Shaanxi.
Water 17 02447 g005
Figure 6. The selected driving factors and spatial scale optimization results in the geographical detector model. The table on the left lists the factors, and the graph on the right shows the 90th percentile of q-values across scales.
Water 17 02447 g006
Figure 7. Optimization of discretization parameters for driving factors.
Water 17 02447 g007
Figure 8. Factor detection results across different geomorphological divisions. (a) Detection results across different geomorphological divisions for X1, X2, and X3; (b) Detection results across different geomorphological divisions for X4, X5, and X6; (c) Detection results across different geomorphological divisions for X7, X8, and X9.
Water 17 02447 g008
Figure 9. Interaction detection results across different geomorphological divisions.
Water 17 02447 g009
Figure 10. Risk detection results across different geomorphological divisions.
Water 17 02447 g010
Table 1. Data resolution and source.
NameData LengthResolutionSource
Meteorological dataPrecipitation1901–20211 km1 km monthly precipitation dataset for China (1901–2021)
http://data.tpdc.ac.cn (Accessed on 4 March 2024)
Temperature1901–20211 km1 km monthly mean temperature dataset for China (1901–2021)
http://data.tpdc.ac.cn (Accessed on 4 March 2024)
Evapotranspiration1901–20221 km1 km monthly potential evapotranspiration dataset for China (1901–2022)
http://data.tpdc.ac.cn (Accessed on 4 March 2024)
Aridity index1901–20221 km1 km annual aridity index dataset for China (1901–2022)
http://data.tpdc.ac.cn (Accessed on 4 March 2024)
Underlying surface dataDEM 30 mhttp://www.gscloud.cn (Accessed on 4 March 2024)
Slope 30 m
Soil moisture1948–20220.25°Global Land Data Assimilation System (GLDAS)
https://disc.gsfc.nasa.gov/datasets/ (Accessed on 4 March 2024)
Geomorphological zoning data of the Loess Plateau Geographical zoning map of the Loess Plateau region (2000)
http://www.geodata.cn (Accessed on 4 March 2024)
Human activity dataPopulation density2000–20221 kmLandScan dataset
https://landscan.ornl.gov/ (Accessed on 4 March 2024)
Land use1990–202030 mAnnual China land cover dataset (CLCD)
https://zenodo.org/records/4417810 (Accessed on 4 March 2024)
Table 2. The types of interaction effects between two potential driving factors on the dependent variable.
Results of q-Value ComparisonInteraction Type
q (X1∩X2) < Min [q (X1), q (X2)]nonlinear weakening
Min [q (X1), q (X2)] < q (X1∩X2) < Max [q (X1), q (X2)]single-factor nonlinear weakening
q (X1∩X2) > Max [q (X1), q (X2)]bi-factor enhancement
q (X1∩X2) = q (X1) + q (X2)Independence
q (X1∩X2) > q(X1) + q (X2)nonlinear enhancement
Table 3. The propagation time from meteorological drought to agricultural drought in different months on the Loess Plateau of northern Shaanxi.
Propagation Time/MonthAll RegionsIIIIIIIVVVIVII
January32333333
February43466443
March11111111
April11111111
May22112112
June12112112
July22222122
August32224132
September32354323
October33344323
November22222222
December2 2222222
Table 4. The propagation time from meteorological drought to agricultural drought in different seasons on the Loess Plateau of northern Shaanxi.
Propagation Time/MonthAll RegionsIIIIIIIVVVIVII
Spring1.31.31.01.01.31.01.01.3
Summer2.02.01.71.72.71.02.02.0
Autumn2.72.32.73.73.32.72.02.7
Winter3.02.33.03.73.73.03.02.7
Table 5. A summary of the three most severe agricultural drought events and their corresponding meteorological droughts in each geomorphological division.
AreaMeteorological DroughtAgricultural Drought
Start TimeEnd TimeDurationSeverityStart TimeEnd TimeDurationSeverity
I1965-061966-031012.551965-081966-071212.01
1997-051997-12812.871997-061998-02915.62
1998-101999-04718.181998-111999-05711.12
II1950-071950-1156.851950-071951-081417.4
1998-091999-101421.921998-101999-081114.46
2010-072010-0822.032010-082011-101512.73
III1950-061950-0944.661950-061951-031011.89
1973-111973-1222.251973-121974-111211.07
1997-051997-1067.561997-051997-11710.94
IV1950-071950-1045.481950-071951-091515.33
1970-111971-0132.641970-111971-07912.33
2008-052008-0844.542008-062009-111818.43
V1966-021966-0433.511966-021966-0876.7
2004-022004-0658.262004-012004-0668.02
2008-052008-0844.942008-042009-091822.73
VI1950-071950-1157.081950-071951-081417.46
1965-071965-12611.431965-071966-02815.24
2010-072010-0821.632010-082011-101515.87
VII1957-081957-1258.471957-091958-04810.98
1997-051997-12812.631997-061998-01813.81
1998-101999-03616.681998-111999-05710.66
Table 6. Statistical analysis of drought propagation rate.
DivisionIIIIIIIVVVIVII
Mean0.500.540.560.590.640.550.51
SD0.040.050.030.040.010.050.04
Disclaimer/Publisher’s Note: The statements, opinions and data contained in all publications are solely those of the individual author(s) and contributor(s) and not of MDPI and/or the editor(s). MDPI and/or the editor(s) disclaim responsibility for any injury to people or property resulting from any ideas, methods, instructions or products referred to in the content.