Article

Rapid Flood Mapping and Disaster Assessment Based on GEE Platform: Case Study of a Rainstorm from July to August 2024 in Liaoning Province, China

1
School of Civil Engineering and Transportation, Northeast Forestry University, Harbin 150040, China
2
Institute of Cold Regions Science and Engineering, Northeast Forestry University, Harbin 150040, China
3
Ministry of Education Observation and Research Station of Permafrost Geo-Environment System in Northeast China (MEORS-PGSNEC), Harbin 150040, China
4
Collaborative Innovation Centre for Permafrost Environment and Road Construction and Maintenance in Northeast China (CIC-PERCM), Harbin 150040, China
*
Author to whom correspondence should be addressed.
Water 2025, 17(16), 2416; https://doi.org/10.3390/w17162416
Submission received: 2 July 2025 / Revised: 6 August 2025 / Accepted: 13 August 2025 / Published: 15 August 2025
(This article belongs to the Section Hydrogeology)

Abstract

Intensified by climate change and anthropogenic activities, flood disasters necessitate rapid and accurate mapping for effective disaster management. This study develops an integrated framework leveraging synthetic aperture radar (SAR) and cloud computing to enhance flood monitoring, with a focus on a 2024 extreme rainfall event in Liaoning Province, China. Utilizing the Google Earth Engine (GEE) platform, we combine three complementary techniques: (1) Otsu automatic thresholding, for efficient extraction of surface water extent from Sentinel-1 GRD time series (154 scenes, January–October 2024), achieving processing times under 2 min with >85% open-water accuracy; (2) random forest (RF) classification, integrating multi-source features (SAR backscatter, terrain parameters from 30 m SRTM DEM, NDVI phenology) to distinguish permanent water bodies, flooded farmland, and urban areas, attaining an overall accuracy of 92.7%; and (3) Fuzzy C-Means (FCM) clustering, incorporating backscatter ratio and topographic constraints to resolve transitional “mixed-pixel” ambiguities in flood boundaries. The RF-FCM synergy effectively mapped submerged agricultural land and urban spill zones, while the Otsu-derived flood frequency highlighted high-risk corridors (recurrence > 10%) along the riverine zones and reservoir. This multi-algorithm approach provides a scalable, high-resolution (10 m) solution for near-real-time flood assessment, supporting emergency response and sustainable water resource management in affected basins.

1. Introduction

Floods are one of the most common and frequent natural disasters, posing a significant threat to ecosystem stability and human life/property safety [1,2]. Under the combined influence of global climate change and human activities [3,4,5], alterations in streamflow patterns, winter snow accumulation, and snowmelt timing have exacerbated flood regimes. The Intergovernmental Panel on Climate Change (IPCC, United Nations agencies that assess science related to climate change, international organizations) projects that flood risks and associated societal impacts will escalate with increasing global warming [6].
Liaoning Province in Northeast China exemplifies these challenges. Its river discharge is regulated by snowpacks acting as natural reservoirs—storing water during wet seasons and gradually releasing it through melt in warmer months. Snowmelt recharge from higher latitudes, coupled with abundant precipitation, has necessitated continuous expansion of flood control levees since the 20th century. In 2024, extreme rainfall triggered severe flooding in Liaoning Province. Preliminary reports indicate torrential rains caused 12 reservoirs to exceed flood limits and five rivers to surpass warning levels, displacing approximately 30,000 residents.
River and reservoir hydrological variables are indispensable for flood monitoring and forecasting. They integrate precipitation losses with snowmelt-induced time lags, providing timely assessments of regional water availability [1]. Consequently, accurate flood mapping and post-disaster assessment are critical for flood management [7]. However, traditional flood-mapping techniques face limitations in timeliness and efficiency due to environmental and methodological constraints [8]. While optical remote sensing enables large-scale multi-temporal detection [9,10], it remains susceptible to cloud cover and extreme weather interference [11,12,13].
Synthetic aperture radar (SAR) overcomes these limitations through all-weather sensing capabilities, making it essential for multi-source flood mapping and impact analysis [14,15].
At the same time, the advancement of algorithms based on multi-source remote sensing has further enhanced flood prediction and reservoir operation. Laassilia et al. coupled SCS and HES-HMS models to simulate flood hydrographs in Moroccan reservoirs [16], while Kumar et al. optimized multi-objective reservoir operations using improved Jaya algorithms [17]. Choong et al. demonstrated that artificial bee colony algorithms effectively minimize water shortages in reservoir management [18]. The iteration of algorithms supports the effective utilization of remote sensing data.
This study leverages Google Earth Engine (GEE)—a planetary-scale platform for geospatial analysis [19]—to integrate machine learning and Otsu thresholding techniques [20,21]. Google Earth Engine is a pioneering cloud platform enabling planetary-scale geospatial analysis. It harnesses massive cloud computing resources to facilitate the study of critical environmental and societal issues, while uniquely lowering the technical expertise required for such large-scale computations [19]. The proliferation of geospatial big data, coupled with advances in cloud computing, is reshaping remote sensing (RS) research paradigms. Google Earth Engine (GEE) has emerged as a transformative platform that enables researchers to efficiently extract insights from massive RS datasets (e.g., multi-decadal Landsat and Sentinel archives), circumventing traditional computational barriers [22]. GEE’s cloud-computing capabilities enable efficient processing of PB-scale remote sensing data [23,24]. Random forest classifiers on GEE optimize feature extraction from multi-spectral imagery [25,26], while the Otsu method automates histogram-based segmentation for SAR data [21]. Locally, we implement Fuzzy C-Means (FCM) clustering and incorporate topographic parameters (elevation, slope, aspect) from the 30 m Copernicus DEM to mitigate terrain shadows [27,28,29,30].
Our objectives are threefold: (1) Extract flood extents and analyze frequencies using GEE-based Otsu; (2) Random forest classification based on GEE platform for flood-prone areas using multi-source datasets; (3) Employ FCM for refined flood information extraction with topographic correction.
These approaches aim to provide actionable insights for disaster resilience and sustainable water management.

2. Materials and Methods

This study developed a comprehensive method for rapid flood mapping using the Google Earth Engine (GEE) platform and local computing power, see Figure 1.

2.1. Study Area

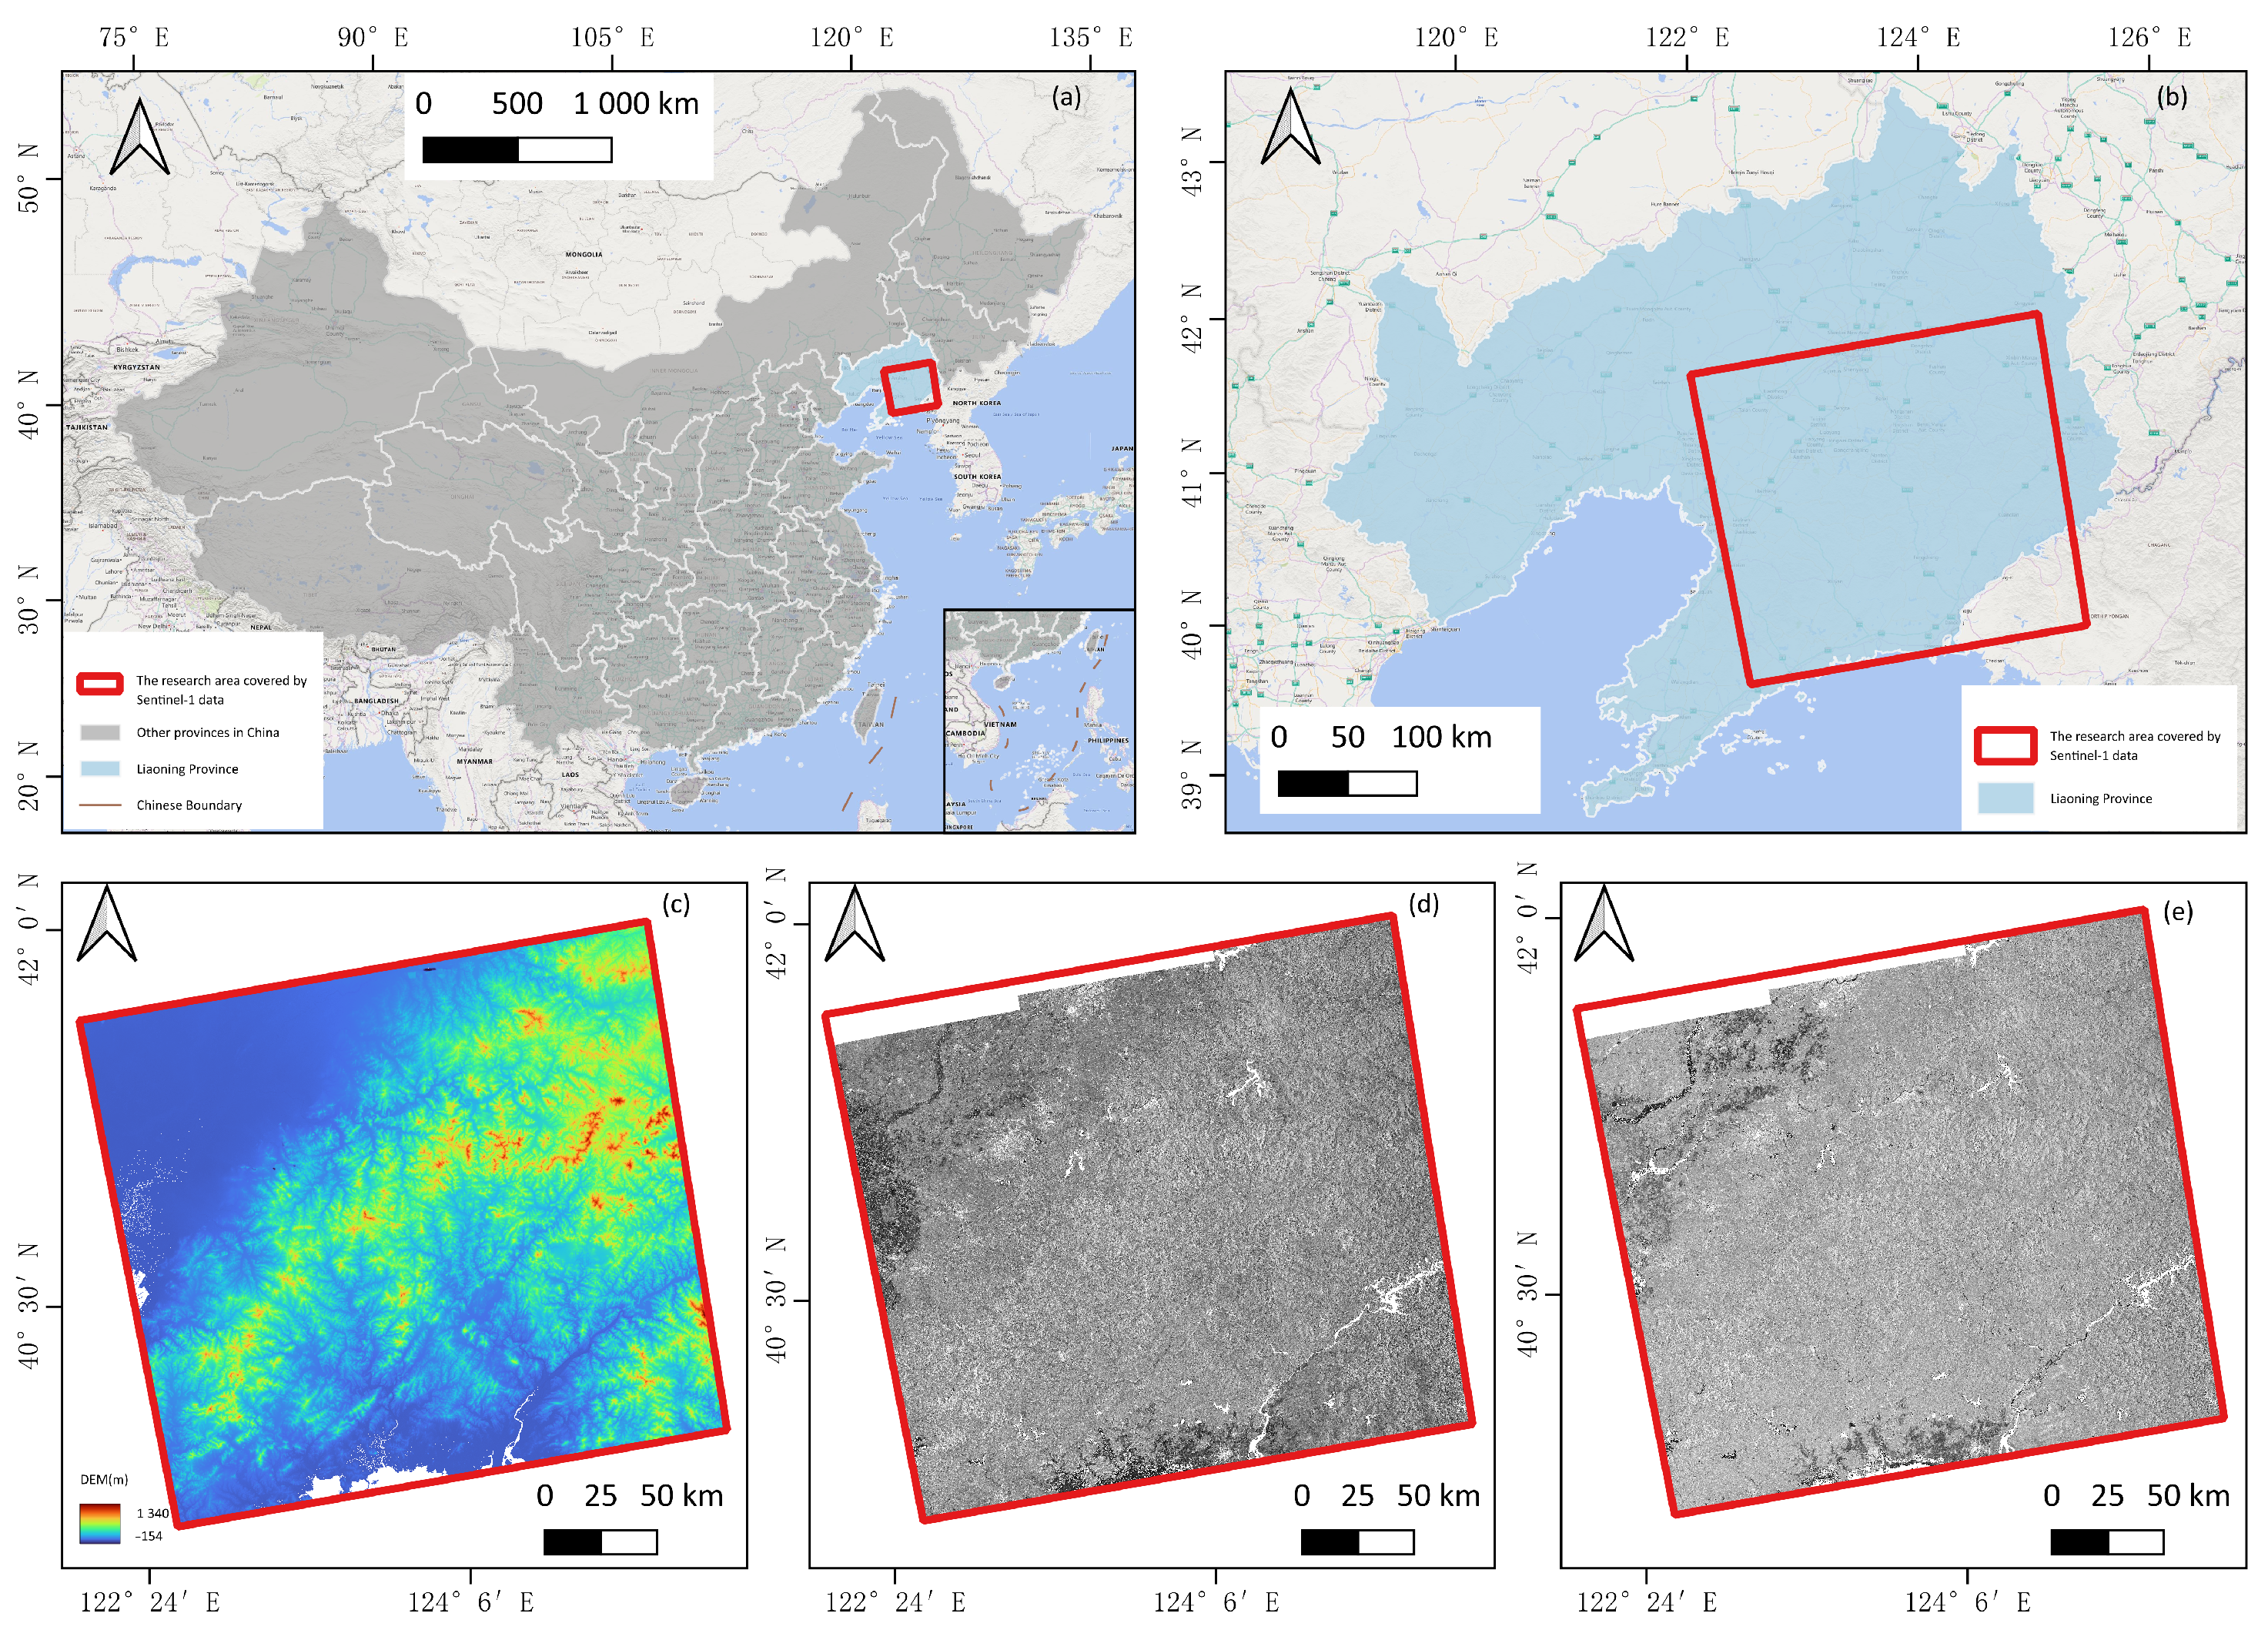
The study area encompasses the river basin and adjacent reservoirs within Liaoning Province, China (122.83° E–125.27° E, 39.88° N–40.67° N). Geographically, Liaoning Province encompasses a diverse landscape characterized by mountainous terrains in the eastern and western regions—including the Changbai and Qianshan ranges—and the fertile central Liaohe River Plain. The province is bounded by the Yellow Sea (Korea Bay) to the south, forming a 2178 km coastline, and shares borders with Jilin Province (northeast), Hebei Province (southwest), Inner Mongolia (northwest), and North Korea (southeast, separated by the Yalu River). Liaoning experiences a temperate continental monsoon climate, with distinct seasonal variations: cold, dry winters and warm, rainy summers. Major rivers include the Liaohe, Hunhe, and Daling, which support agriculture and industrial activities. The province covers approximately 148,000 km2, comprising forests (32%), farmland (25%), and urbanized zones. As of the 2020 National Census, Liaoning has a population of 42.59 million residents, accounting for 3.0% of China’s total population. The region is highly urbanized, with key cities like Shenyang (the provincial capital, population: 9.07 million) and Dalian (a major port city, population: 7.45 million) driving its economic significance in manufacturing, heavy industry, and logistics. Situated in northeastern China, this region exhibits heightened flood susceptibility in riverine zones and reservoir peripheries following intense rainfall events. Terrain analysis and synthetic aperture radar (SAR) imagery confirm that flood-prone areas are primarily concentrated in these low-lying basins and hydraulic infrastructure vicinities, see Figure 2.
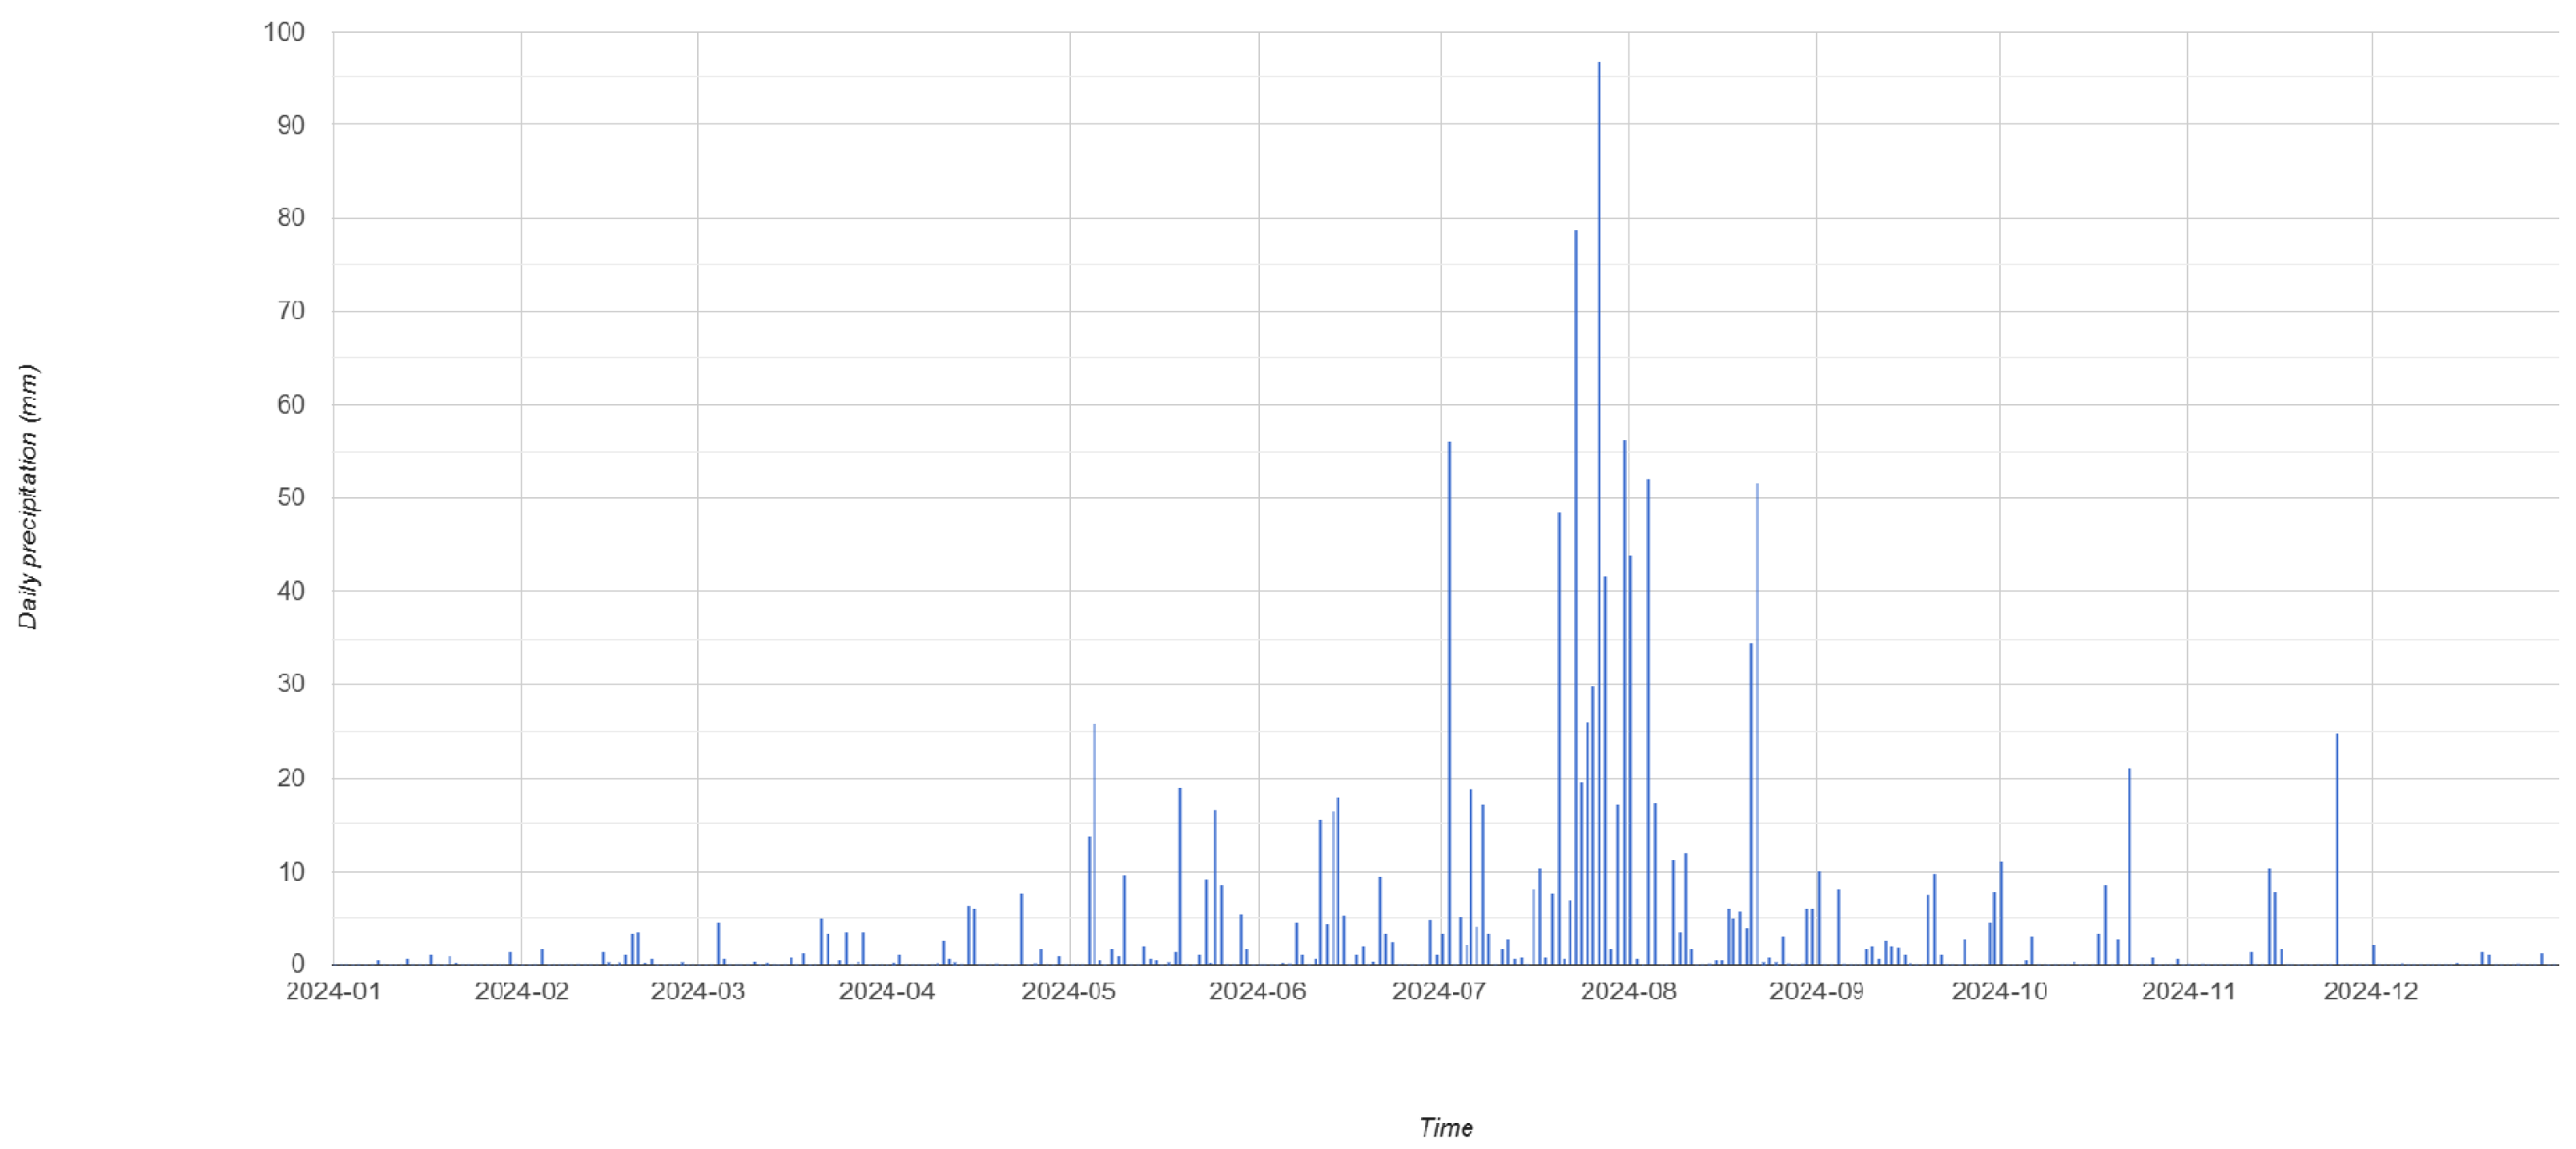
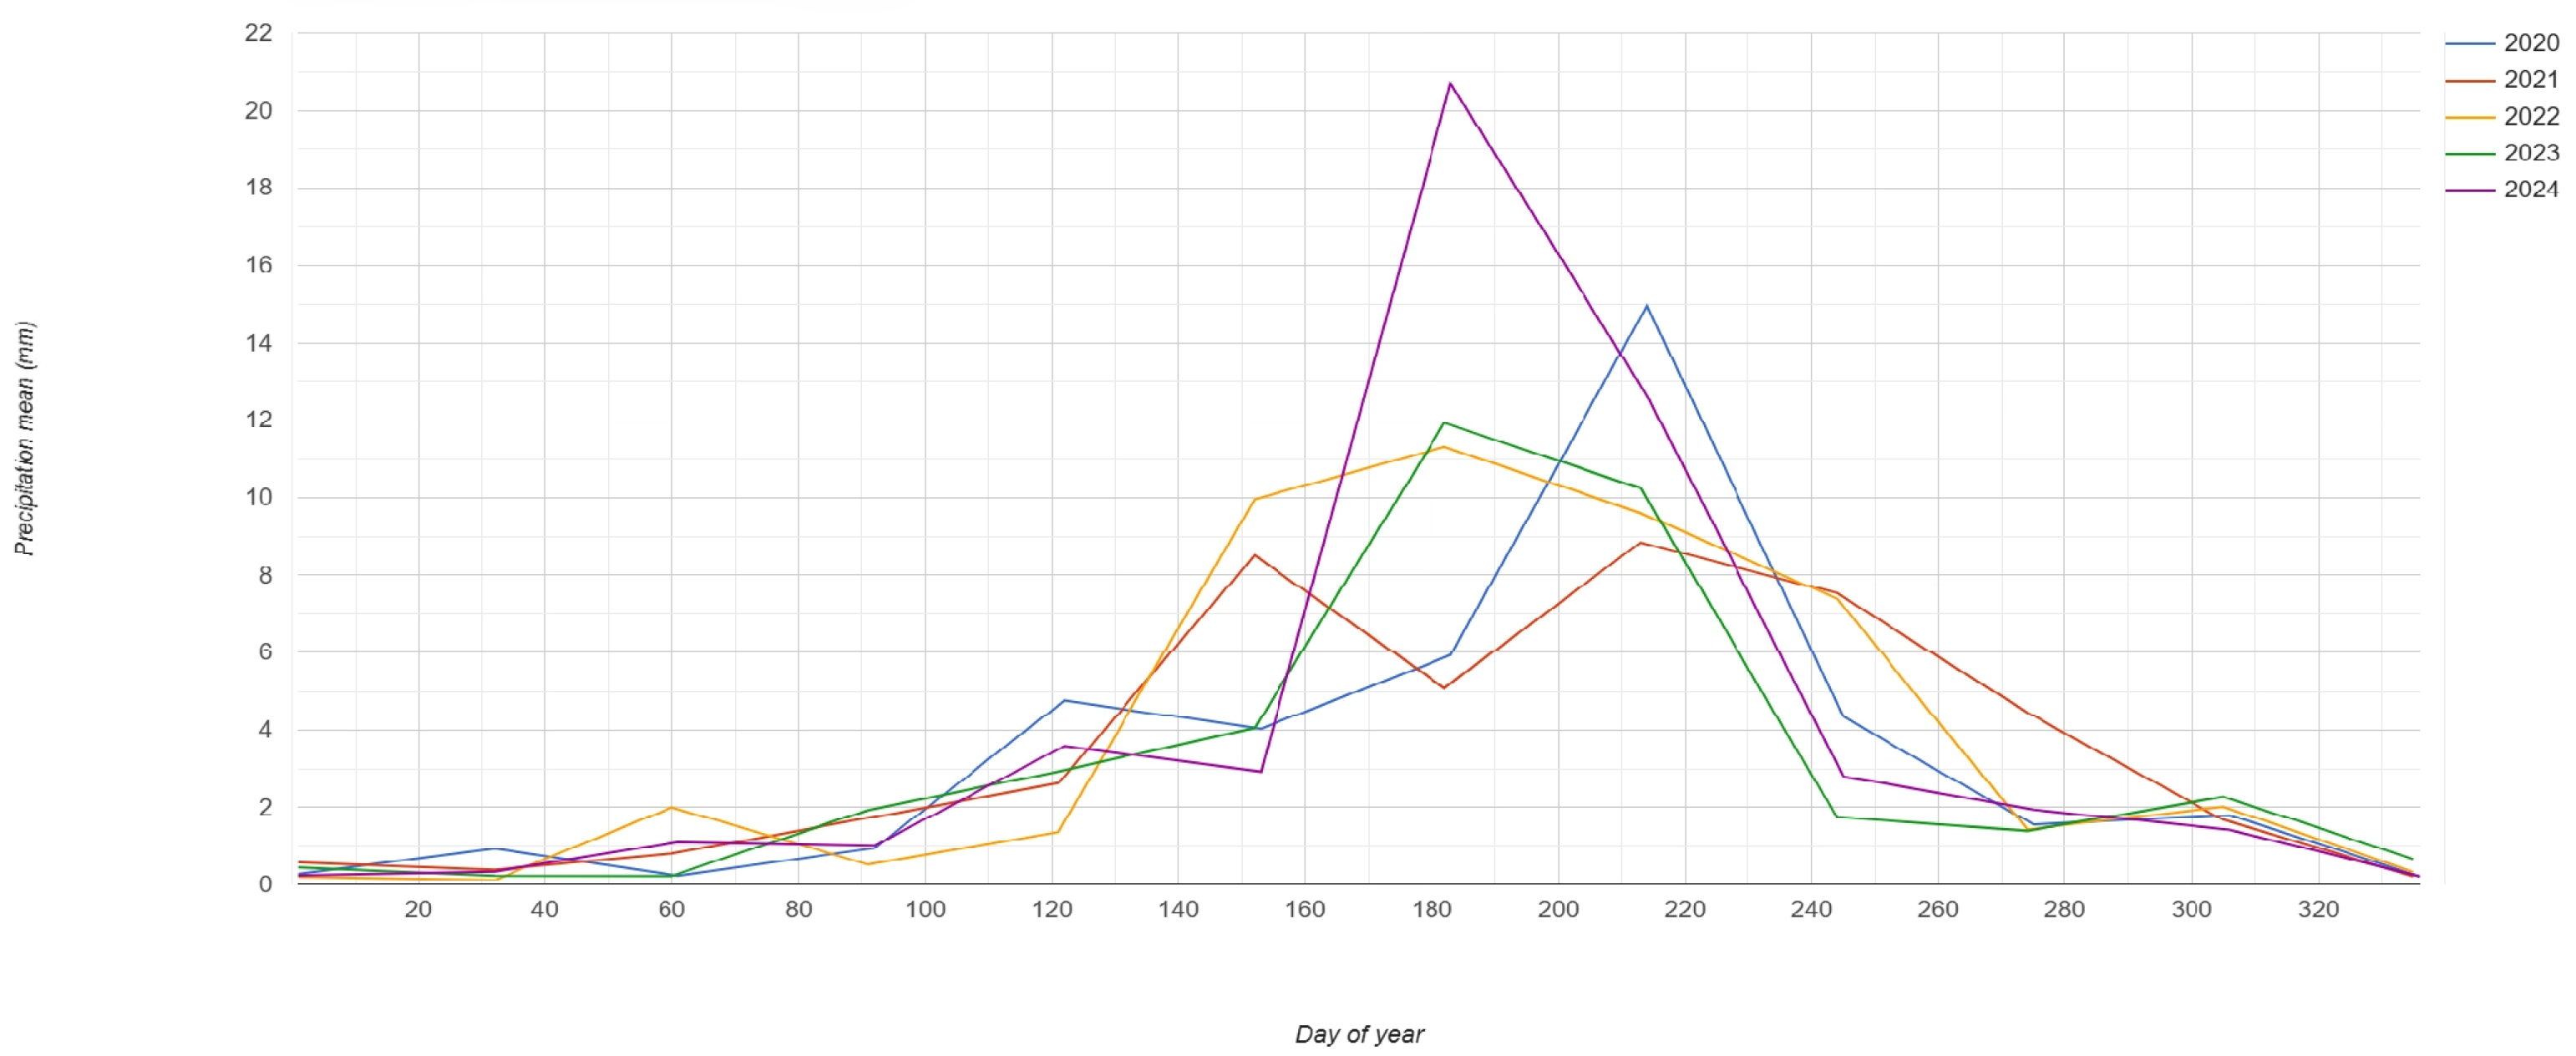
The precipitation situation in the study area is shown in Figure 3 and Figure 4, using the CHIRPS dataset (https://developers.google.com/earth-engine/datasets/catalog/UCSB-CHG_CHIRPS_DAILY#description, accessed on 1 July 2025). It is observed that the rainfall from July to August increased significantly and was much higher than that in previous years, which is consistent with the preliminary report and early warning provided when the rainstorm had just occurred.
Due to the heavy rainfall, the flood disaster occurred rapidly and affected a wide range of areas. Traditional flood mapping was no longer sufficient for the management of this rapidly occurring disaster. At the same time, there are various complex terrains in this widely affected area, such as farmland, high-rise buildings, mountainous areas, etc. Rapid flood mapping using multiple remote sensing images and methods can better meet the needs of disaster management, thereby eliminating the impact of complex-area shadows on SAR data and the interference of extreme weather in optical images in this study area.

2.2. Data Acquisition

2.2.1. Sentinel-1 SAR

Sentinel-1 GRD data (154 ascending-path images; January–October 2024) were acquired from the European Space Agency’s Copernicus programme (https://www.copernicus.eu, accessed on 1 July 2025). The C-band synthetic aperture radar (SAR) sensor provides surface microwave scattering information. The GRD data in Google Earth Engine (GEE) underwent radiometric calibration, multi-view processing, and terrain correction, stored in decibels (dB) or raw power values (FLOAT). Scattering coefficient ( σ ° ) and backscattering intensity ( μ ° ) conversions were optimized based on land feature classification or physical model requirements. Preprocessed Analysis Ready Data (ARD) in GEE features interferometric wide swath (IW) mode with 10 m spatial resolution and VV + VH polarization.

2.2.2. Ancillary Datasets

Sentinel-2: Multispectral optical imagery from the Copernicus programme was utilized for global land monitoring. The dual-satellite constellation (Sentinel-2A/B) achieves 5-day global revisit. Data from 13 spectral bands (443–2190 nm) were accessed, with spatial resolutions of 10 m (4 bands), 20 m (6 bands), and 60 m (3 bands). The Normalized Difference Vegetation Index (NDVI) was calculated as
NDVI = B 8 B 4 B 8 + B 4
where B 8 = near-infrared band (842 nm) and B 4 = red band (665 nm). NDVI values range from 1 to 1, with vegetation typically 0.2 0.8 .
USGS/SRTMGL1_003 DEM: The 1-arc-second (∼30 m) global digital elevation model (United States Geological Survey/NASA) was employed. Derived from 2000 Shuttle Radar Topography Mission (SRTM) data ( 60 ° N– 56 ° S), it features 5–10 m vertical accuracy in flat regions. Terrain parameters (elevation, slope, aspect) were extracted for classification. The median error in the study area is ∼9.5 m.
Copernicus DEM (30 m): This high-precision DEM integrates TerraSAR-X and TanDEM-X SAR interferometry, achieving ∼1 m vertical accuracy globally. It supersedes traditional DEMs (e.g., SRTM) in complex terrain, with reduced noise and artifacts. The terrain factors derived from this dataset enhanced fuzzy classification accuracy. Therefore, this study introduces a more accurate digital elevation model suitable for SAR data, extracts corresponding terrain factors with smaller errors, and improves the accuracy of fuzzy classification technology (FCM) under local computing power.
JRC Global Surface Water Dataset: The JRC/GSW1_3/GlobalSurfaceWater data (1984–2020) provided water occurrence frequency (occurrence), seasonality (seasonality), and maximum water extent (extent). Occurrence: The frequency of water bodies occurring over 36 years, used to distinguish between permanent water bodies and temporary floods. Seasonality: Seasonal index of water bodies. In the code, permanent water samples are extracted using seasonality. gte (5)

2.3. Overall Methodological Framework

The flood-mapping methodology integrates three complementary computational approaches to overcome the limitations of traditional techniques in complex terrains. First, an adaptive thresholding algorithm processes SAR backscatter characteristics to rapidly identify potential water surfaces. Second, a multi-feature random forest classifier leverages aforementioned ancillary datasets to distinguish floodwaters from spectrally similar land covers. Both methods are implemented on the Google Earth Engine platform for large-scale processing, with outputs subsequently refined through local fuzzy clustering to enhance classification accuracy. This multi-pronged strategy enables robust flood detection across diverse landscapes while maintaining computational efficiency, essential for rapid disaster response.

2.4. Adaptive Water Thresholding

2.4.1. Algorithm Flow

The surface water detection employed SAR backscatter thresholding optimized via Otsu’s algorithm. For each image I, the following was performed:
1.
Apply focal median filter to reduce speckle:
V V smooth = median ( V V , r = 50 m )
where
  • V V : original VV-polarized backscatter coefficient (dB);
  • r: filter radius (50 m).
2.
Compute backscatter histogram H over AOI (area of interest):
H = x AOI δ ( V V ( x ) k ) , k [ 0 , 255 ]
3.
Determine optimal threshold t * , maximizing inter-class variance:
t * = arg max t ω 0 ( t ) μ 0 2 ( t ) + ω 1 ( t ) μ 1 2 ( t )
where ω i = class probability, μ i = class mean.
4.
Generate binary water mask:
WaterMask = 1 if V V smooth < t * 0 otherwise

2.4.2. Post-Processing

1.
Water occurrence frequency:
Ψ w = t = 1 N WaterMask t N × 100 %
( Ψ w > 10 % retained as persistent water).
2.
Slope-based water exclusion:
y ^ adj = null if α > 15 ° y ^ = 1 y ^ otherwise
where
  • y ^ : original classification label;
  • y ^ adj : adjusted classification label;
  • α : terrain slope angle (degrees);
  • null: invalid classification flag.
3.
Area quantification:
A c = i c p i × 10 6 ( km 2 )
where
  • A c : area of class c in km2;
  • c: land cover class index;
  • p i : area of pixel i in m2;.

2.5. Random Forest Classification

2.5.1. Training Sample Generation

Automated sampling leveraged multi-source criteria (Table 1):

2.5.2. Feature Engineering

Seven predictive features were computed:
F = V V , V H SAR , h , α , I H S Topo , NDVI med , σ NDVI Phenology
where h = elevation, α = slope, I H S = hillshade, σ NDVI = seasonal variability.

2.5.3. Construction of Random Forest Classifier

A 100-tree classifier was implemented with
y ^ = mode k = 1 100 T k ( F )
Model parameters:
  • 70/30 training–test split;
  • Gini impurity splitting criterion;
  • Maximum tree depth: unlimited.

2.6. Accuracy Assessment

  • Thresholding method: Temporal consistency analysis.
  • RF classification: Confusion matrix metrics:
    OA = M i i i , j M i j
  • Visual validation with false-color composites;
  • Statistical comparison against JRC reference.

2.7. Fuzzy C-Means Classification Framework

The flood classification workflow employs a Fuzzy C-Means (FCM) clustering algorithm [31], a soft classification technique that assigns partial membership values to pixels across multiple classes. This approach is particularly effective for SAR-based flood mapping due to its ability to handle backscatter ambiguity in transitional water boundaries [32].

2.7.1. Mathematical Formulation

The FCM algorithm minimizes the following objective function:
J m ( U , V ) = i = 1 n j = 1 c u i j m d i j 2
where
  • n = Number of pixels in input data;
  • c = Number of clusters (fixed at 5: Unclassified, non-water, high-scattering, permanent water, flood);
  • u i j = Membership degree of pixel i in cluster j ( j = 1 c u i j = 1 );
  • m = Fuzziness exponent ( m = 2.0 for this study);
  • d i j = x i v j = Euclidean distance between feature vector x i and cluster centroid v j .
The optimization involves iterative updates through
u i j = k = 1 c d i j d i k 2 m 1 1
v j = i = 1 n u i j m x i i = 1 n u i j m

2.7.2. Feature Space Configuration

The classifier operates on a multidimensional feature space comprising
x i = σ post 0 σ pre 0 ¯ DEM Slope R pre / post
where
  • σ post 0 = Post-event backscatter (dB);
  • σ pre 0 ¯ = Mean pre-event backscatter (dB);
  • R pre / post = σ pre 0 σ post 0 = Backscatter ratio;
  • DEM = Elevation (m) from Copernicus DEM;
  • Slope = Terrain gradient (°).

2.7.3. Topographic Integration

To mitigate false positives from radar shadowing, DEM and slope constraints are incorporated as
u i j = 0 if DEM i > τ DEM Slope i > τ slope
where τ DEM = 1500   m and τ slope = 5 ° represent empirically determined thresholds.

2.7.4. Algorithm Implementation

The implementation follows this procedure:
1.
Initialization: Random centroid initialization with spatial constraints.
2.
Iteration:
  • Membership update via Equation (2);
  • Centroid recomputation via Equation (3).
3.
Termination: When max v j ( k + 1 ) v j ( k ) < ϵ ( ϵ = 0.001 ) or k > k max ( k max = 100 ).
4.
Defuzzification: Hard classification via j ^ i = arg max j u i j .

2.7.5. Probabilistic Refinement

Post-classification refinement applies Markov random fields (MRFs) to incorporate spatial context:
P ( c i | x ) exp α k N i δ ( c i , c k ) β x i v c i 2
where
  • c i : class label of pixel i;
  • N i : 8-neighbor system;
  • δ : Kronecker delta function;
  • α = 0.7 : spatial regularization weight;
  • β = 0.3 : spectral fidelity weight;
  • v c i : centroid of class c i .
The refinement parameters are listed in Table 2.
Flood mapping was performed using SARscape 6.1’s Flood Classification Tool with the following configuration:
  • Input files:
    Post-event file: Geocoded backscatter coefficient (dB or unitless);
    Pre-event file list: n pre-event images (multiple acquisitions recommended).
  • Optional files:
    DEM file: Copernicus DEM (COP-DEM) as ellipsoid reference;
    Slope file: Terrain slope data for shadow reduction.
  • Threshold parameters:
    Water threshold: dB (minimum backscatter for water detection);
    DEM threshold: m (maximum elevation for flood consideration);
    Slope threshold: ° (terrain slope limit for false-positive reduction);
    Ratio threshold: Minimum pre/post backscatter ratio for flood detection;
    High scattering point: dB (vessel/urban area exclusion).
  • Output products:
    _class: classification raster;
    _postEvent: post-event mean intensity;
    _preEvent: pre-event mean intensity;
    _ratio: backscatter ratio image.

3. Results

3.1. Otsu Method

Spatiotemporal Dynamics of Flood Inundation at Tumenzi Reservoir
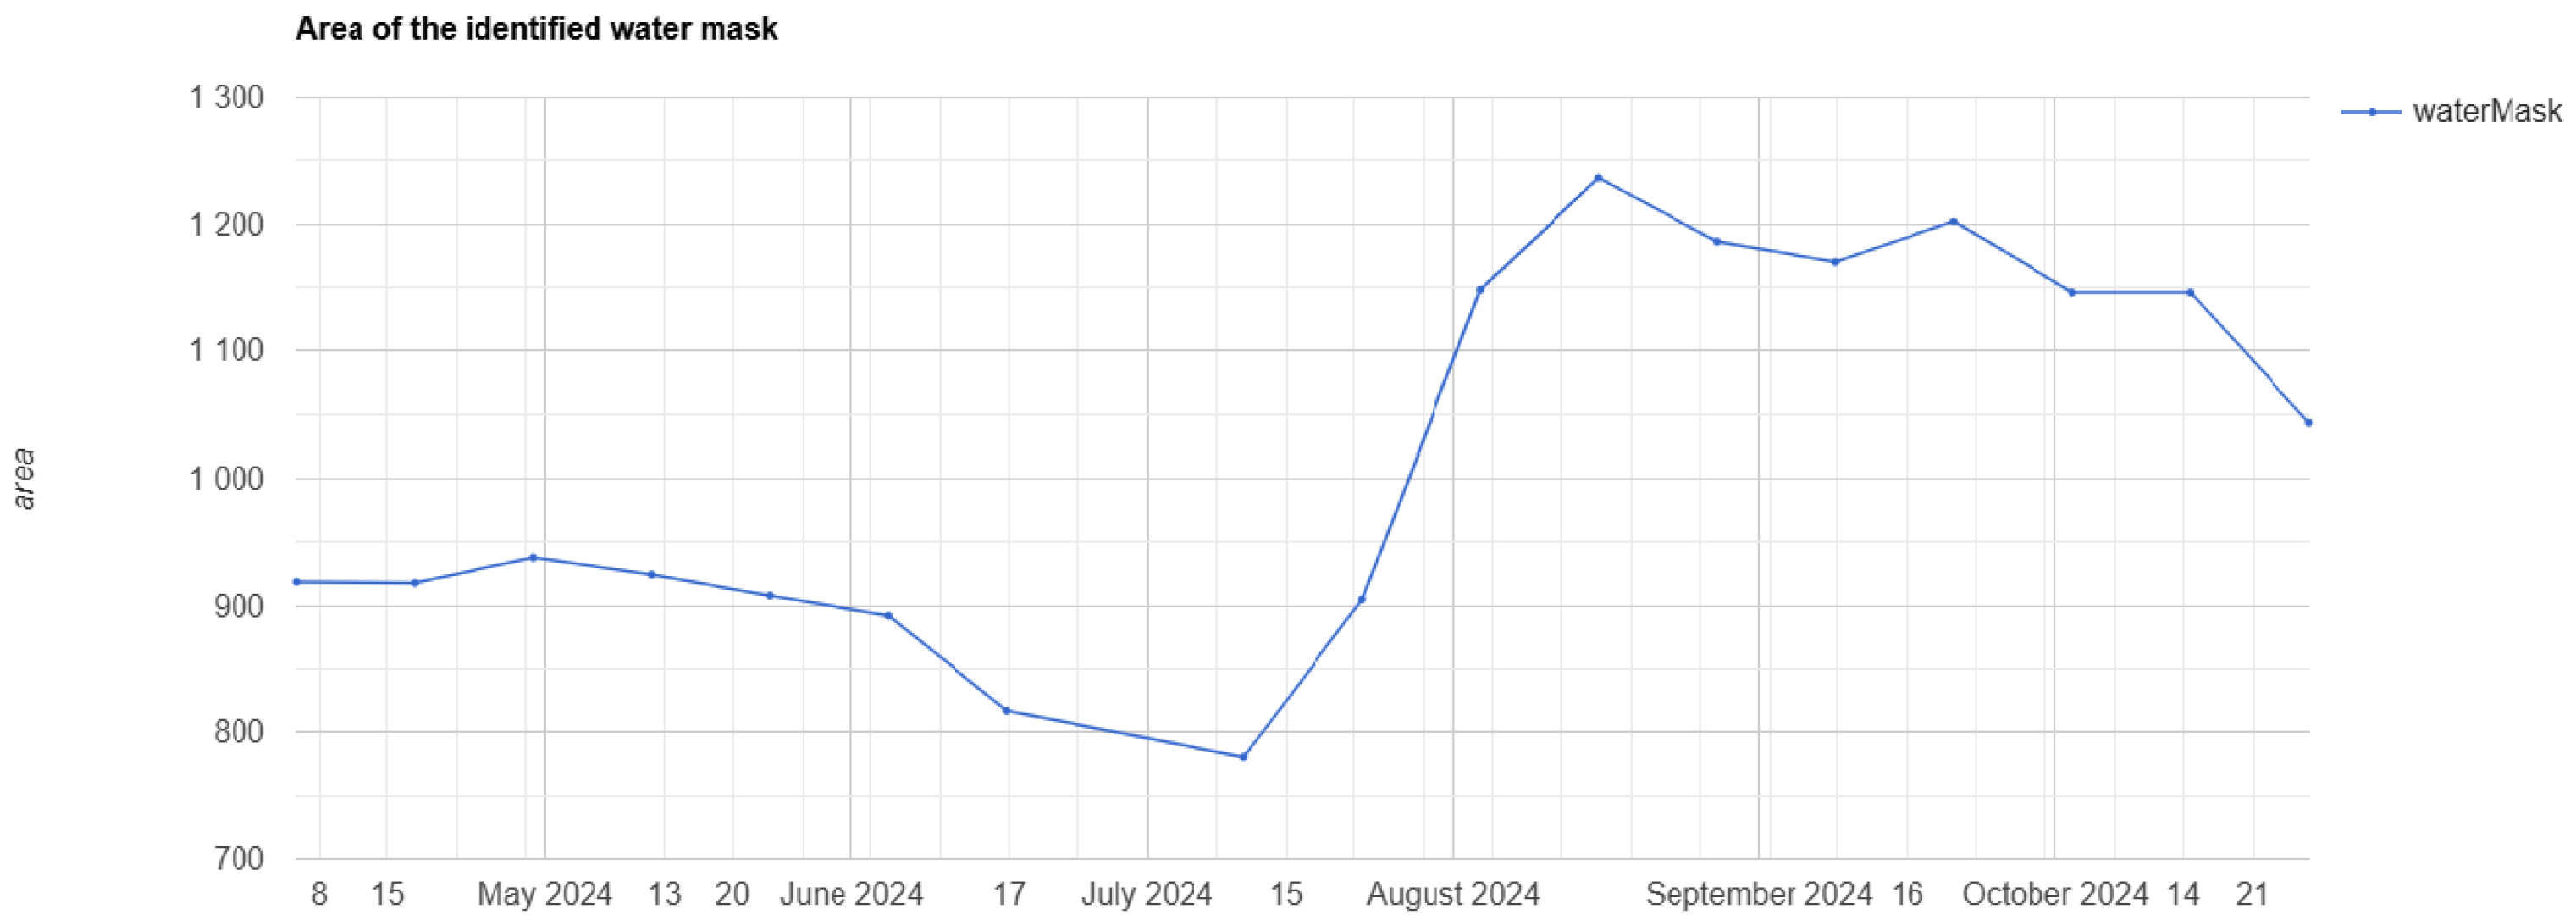
The Otsu-based SAR water mask analysis revealed significant fluctuations in inundation area around Tumenzi Reservoir from April to October 2024 (Table 3 and Figure 5). Three distinct hydrological phases were identified:
1.
Post-snowmelt decline (1 April–10 July 10): Water mask area decreased from 892.118   km 2  to 780.553   km 2 (−12.5%), attributed to the following:
  • Exhaustion of snowmelt contributions from eastern Liaoning mountains;
  • Agricultural water extraction for rice transplantation.
2.
Rapid flood onset (10 July–3 August): A surge from 780.553   km 2 (10 July) to 1148 km 2 (3 August) (+47.1%) was driven by the following:
  • Convective storms during 10–15 July;
  • Typhoon remnant rainfall;
  • Reservoir emergency spillway activation.
3.
Peak inundation (3–15 August): Maximum extent reached 1236.482   km 2 (15 August), representing a 58.4% increase from the June minimum. This plateau resulted from the following:
  • Sustained precipitation;
  • Saturated soil conditions reducing infiltration.
Hydrological Forcing Mechanisms
Due to the computational limitations of GEE, the Otsu method was used to demonstrate the frequency mapping of water bodies in the Tumenzi Reservoir, where significant changes were observed during the disaster.
Water body frequency mapping (Figure 6) showed the reservoir water level rising rapidly from July to August, submerging surrounding villages, especially in the east. The overall water body frequency observed from April to October corresponds to the affected area and peak flood timing documented in the disaster report.

3.2. Random Forest Classification

The random forest classifier achieved robust performance in floodwater delineation. Validation using the 30% holdout testing partition yielded an overall accuracy of 92.7%. Water class identification demonstrated exceptional reliability. This reflects the effective separation of flood signatures from complex backgrounds including urban areas and agricultural fields.
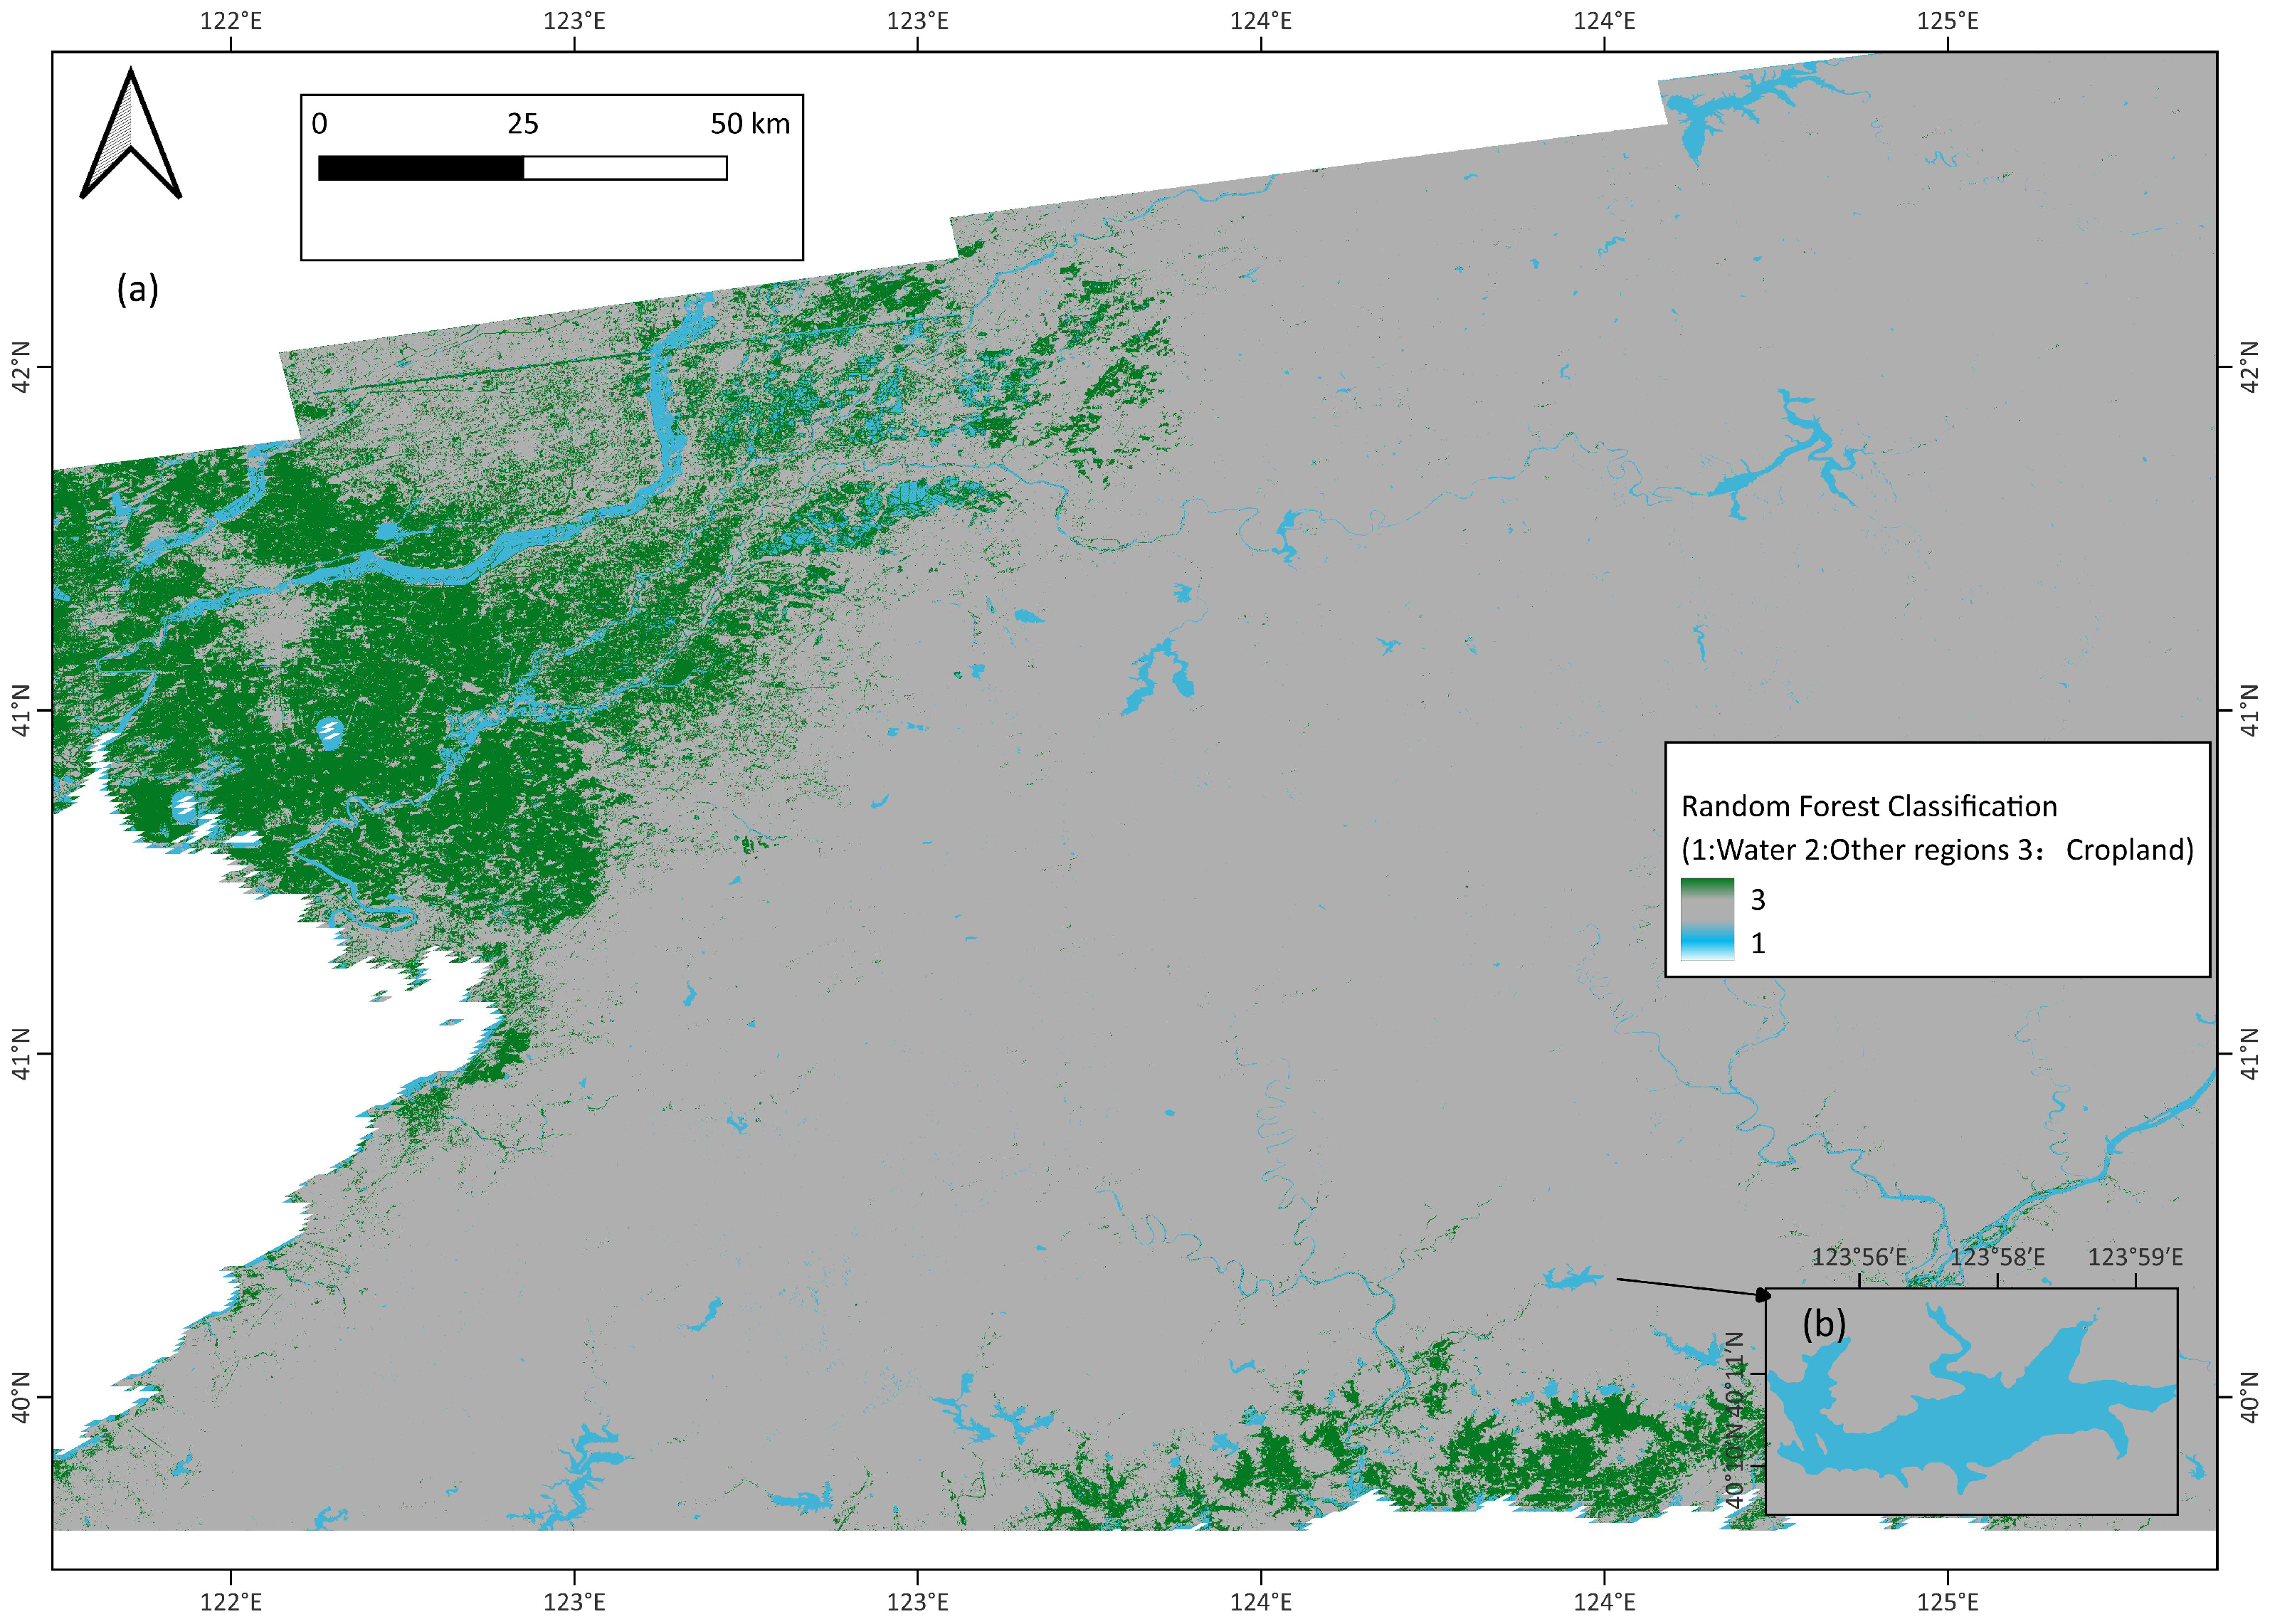
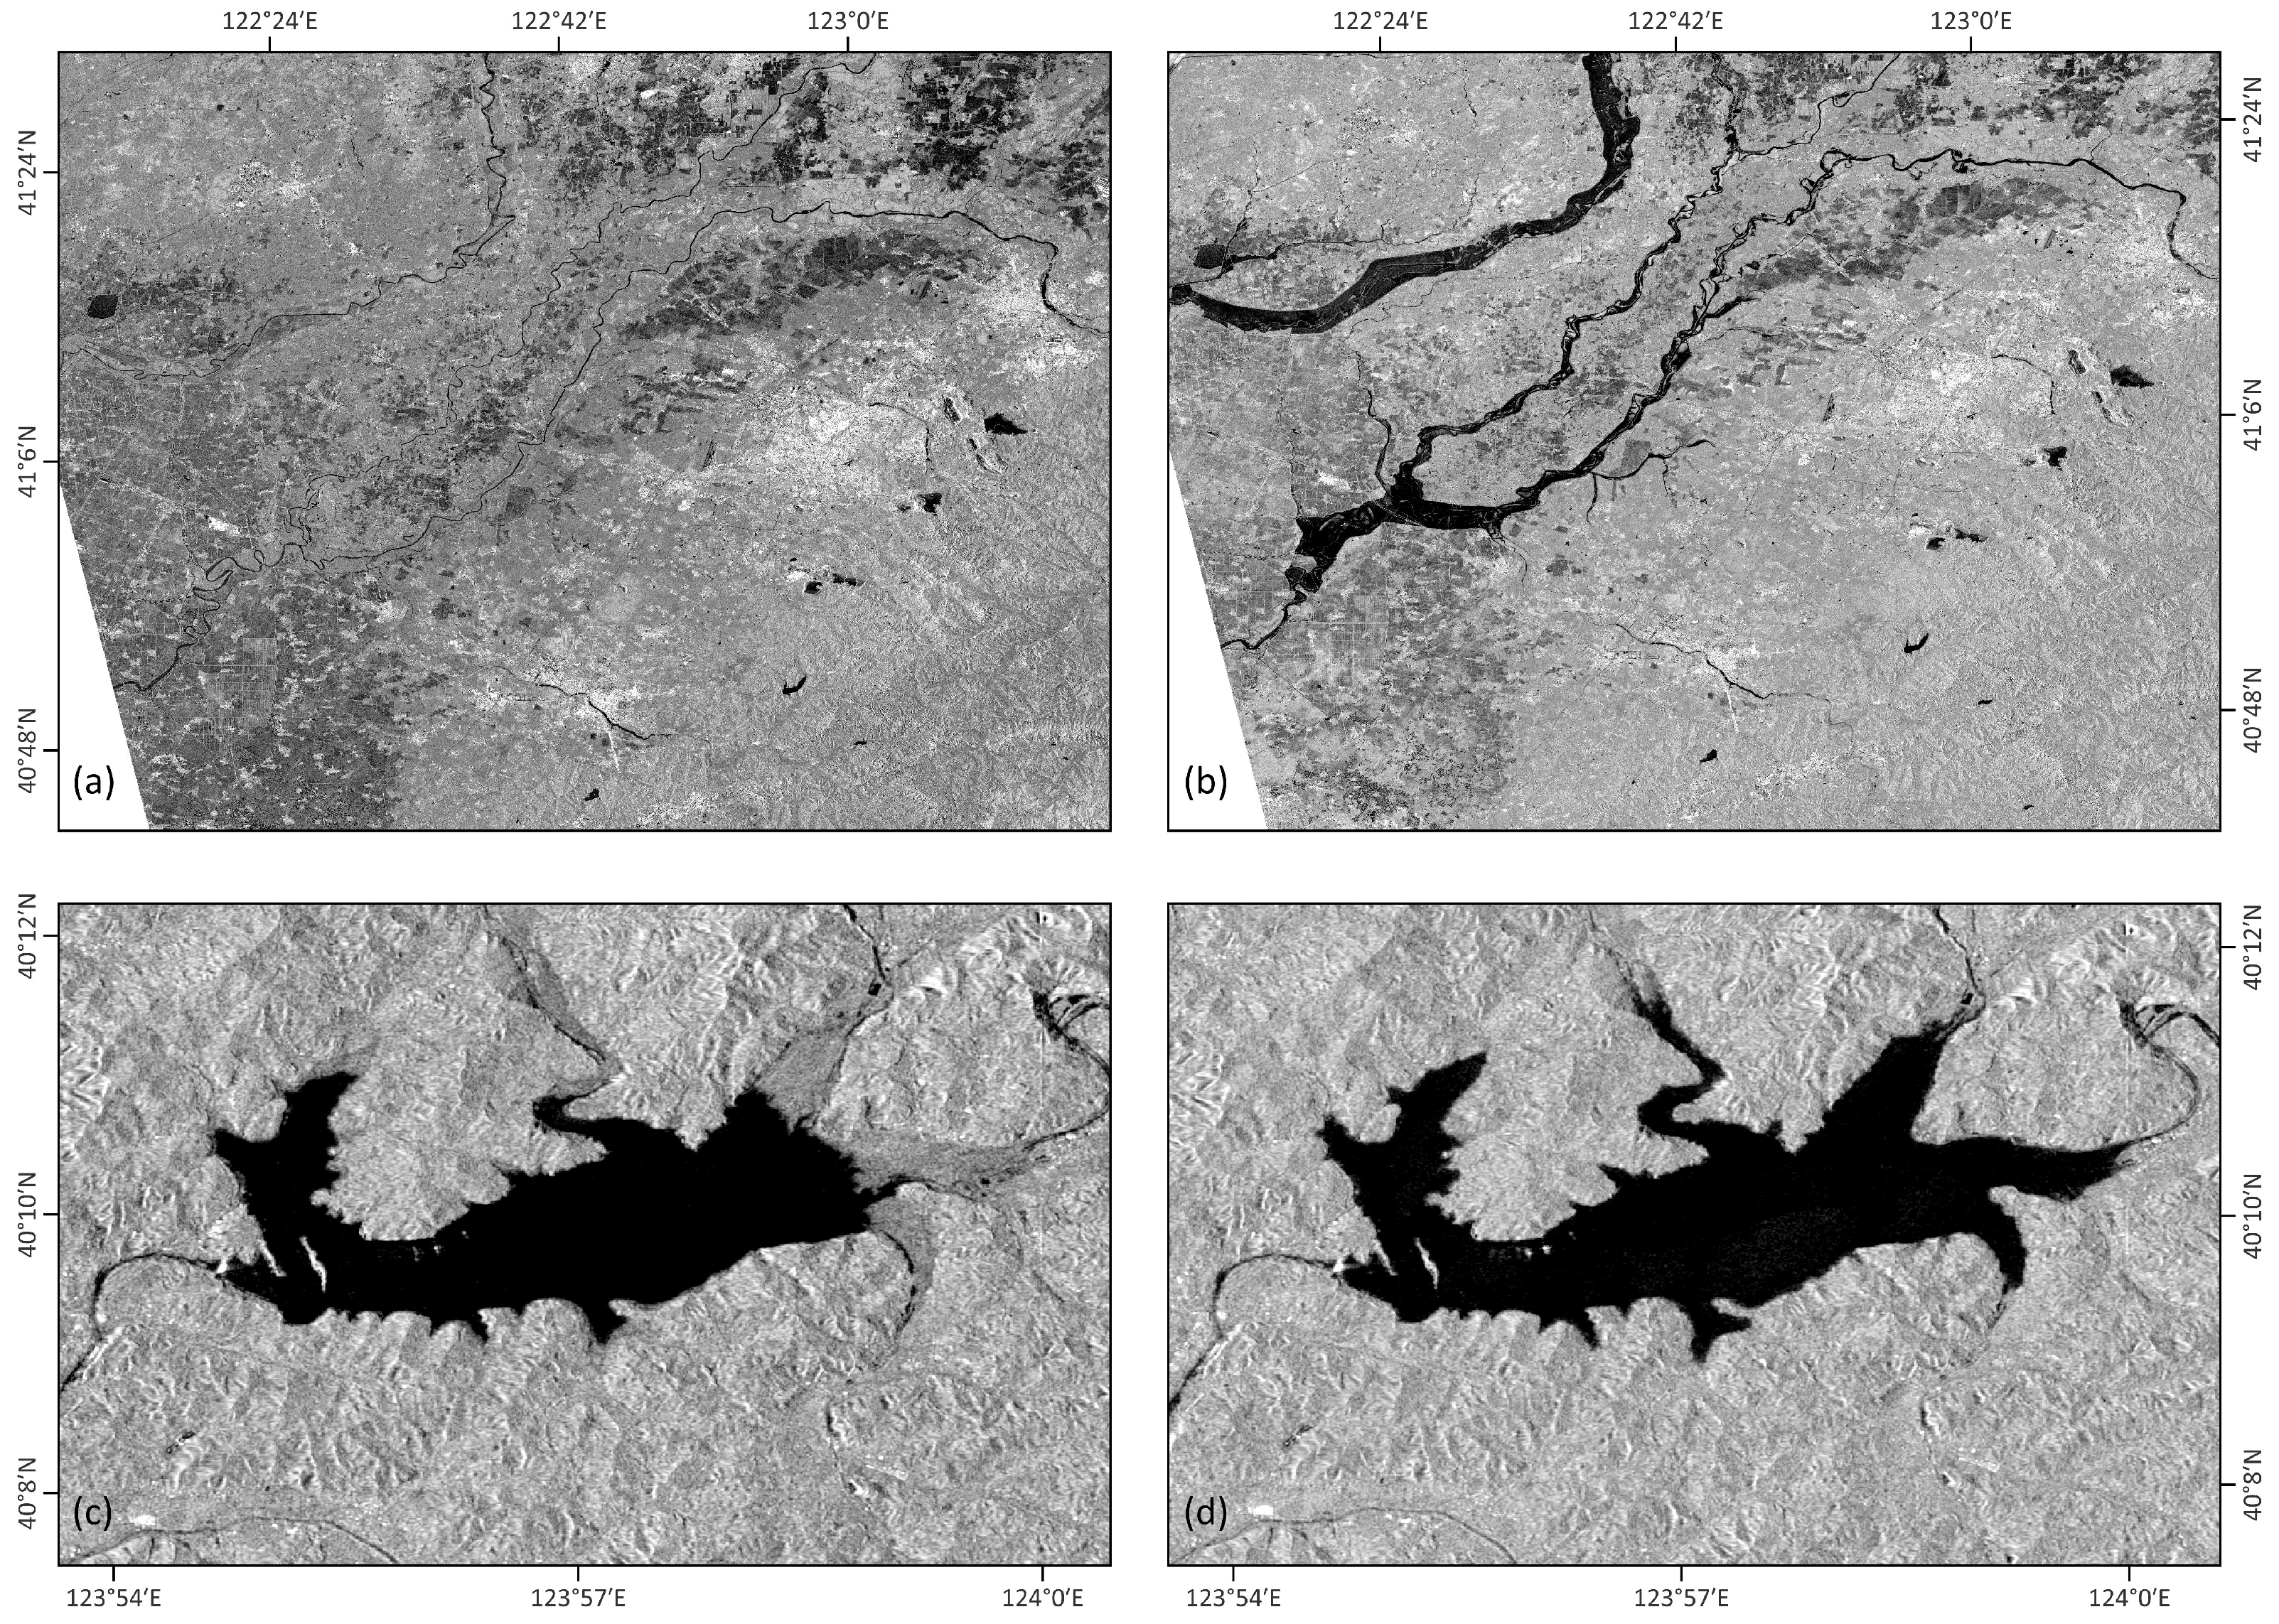
This study area was classified into water bodies, farmland, and other areas based on random forest classification. Sample points were automatically selected based on Table 1. Classification was as shown in Figure 7. According to the comprehensive identification of water bodies based on the classification map, there is a significant process of water-level rise in the watershed located in the southwest of Shenyang City, and the area through which the river flows has expanded. The surrounding farmland has been submerged due to the impact of floods, resulting in dB intensity values on SAR images that maintain similar characteristics to the water body (Figure 8). The surrounding farmland was classified by adding multiple datasets, eliminating the interference of single SAR images on farmland classification caused by flooding during floods, making it easier to calculate the impact range of floods. Surrounding villagers received emergency evacuation notices based on the disaster situation. The difference between this classification and the Otsu method is that, based on multi-source remote sensing, the flooded farmland can still be classified correctly, and the distribution of floods and permanent water bodies affected by rainfall factors is also marked, providing improvements and multiple methods for rapid flood mapping, as shown in the following text.

Feature Importance Analysis

The backscattering of SAR increases the contrast of the water surface, and the VV polarization has a higher contrast after being processed by a median filter, making a major contribution to classification. Meanwhile, according to the overview of geographical conditions mentioned earlier, the terrain features covered by SAR images are complex. In mountainous terrain, the addition of slope and altitude data suppresses false alarms. Finally, regarding phenological indices, NDVI variability is superior to NDVI median in distinguishing flooded farmland.

3.3. Error Analysis and Improvement Thinking

The main misclassifications in random forest classification occur in urban flood shadows, wind-roughened water, emerging aquatic vegetation, etc.
Overall, the application of random forest classification in rapid and complex disaster situations can enable timely mapping. However, after in-depth analysis, the classification probability of random forest classification for each pixel is too close. Simply put, with the addition of various datasets, after exporting the classification process of GEE random forest, some pixels have a 30% probability of being water bodies, but there may also be a slightly lower probability of them being non-water bodies, and then this pixel is judged as water bodies. Admittedly, the results may be correct, but when facing more complex problems and environments, the disadvantage of insufficient discrimination will be exposed. Thus, this study aims to explore more detailed and rapid mapping methods for this case. Annotating flood areas by applying the Fuzzy C-Means classifier (FCM): This method is different from the Otsu method and random forest classification, which compare the threshold or probability of images in the same image. It is a time-series analysis that classifies floods by comparing the changes on different time images of the same area. At the same time, with the convenience of the GEE platform, this method incorporates validation and error correction of random forest classification results from different periods. After comparing the effects of random forests before, during, and after disasters, it improves the classification confusion caused by seasonal plants, crops, and mixed aquatic plants, effectively improves the method of rapid mapping, and provides a reliable basis for determining flood areas and flooded farmland.

3.4. Fuzzy C-Means

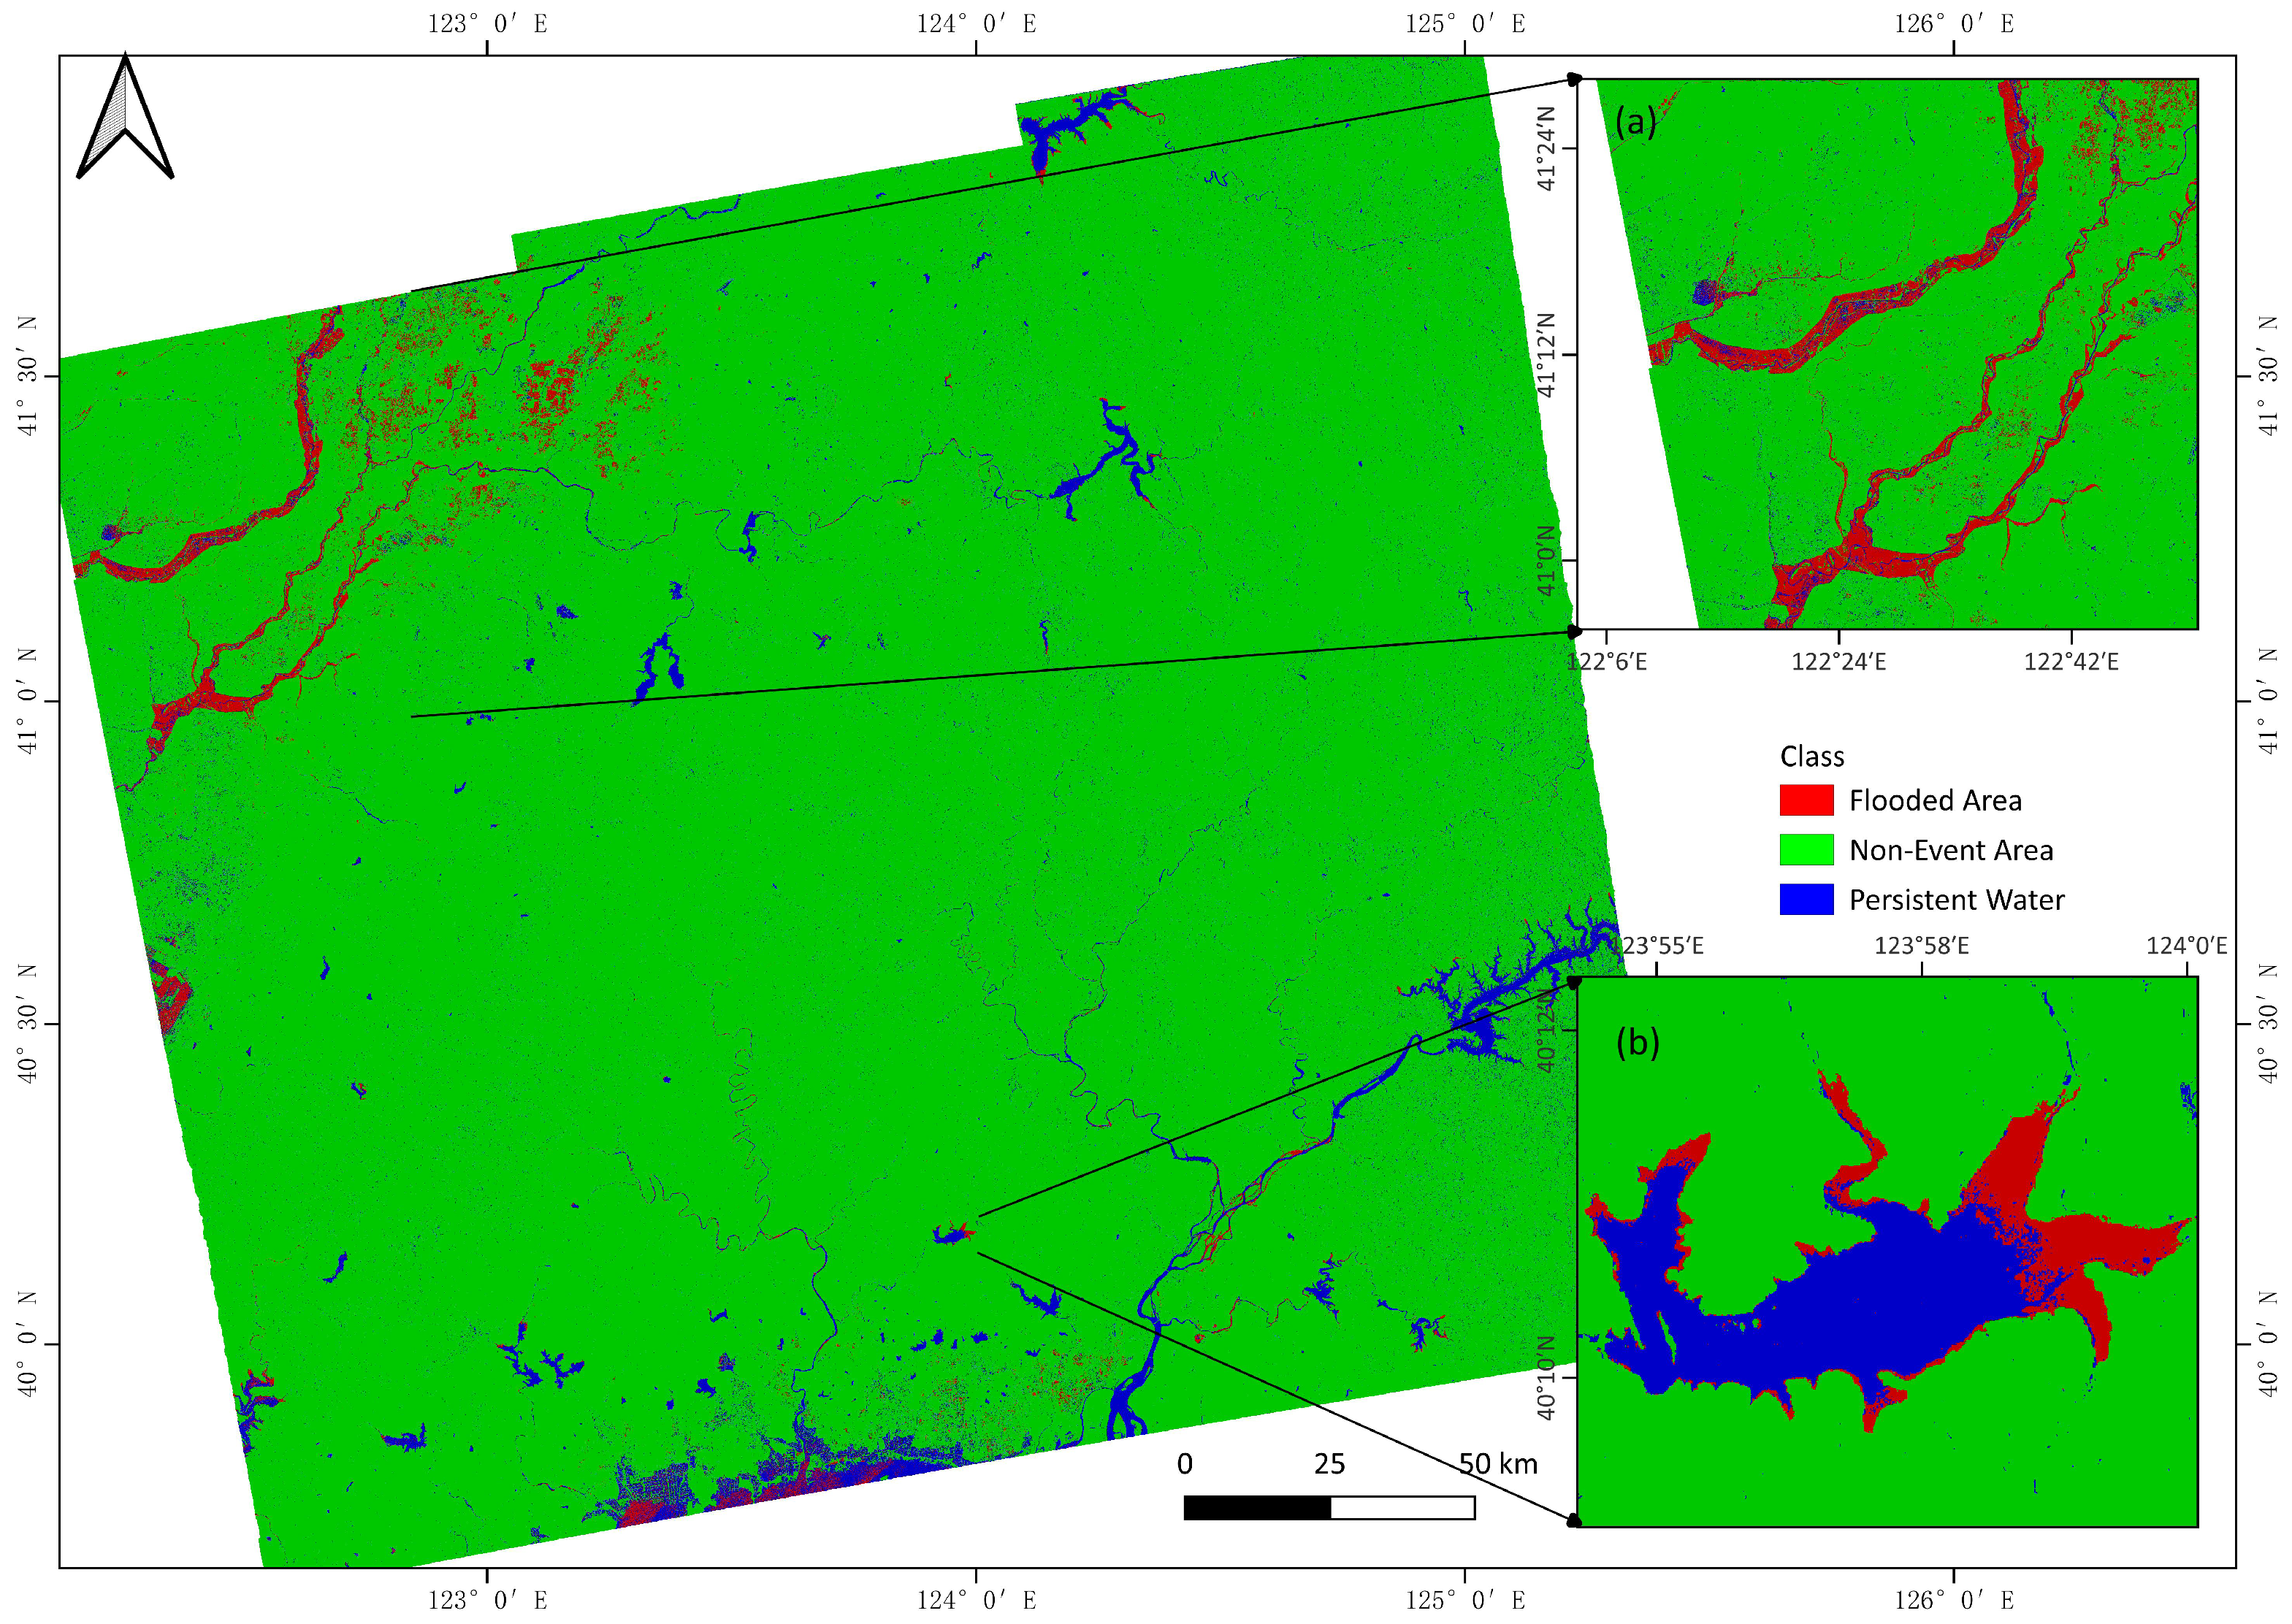
The application of the Fuzzy C-Means (FCM) classifier, building upon the foundation laid by Otsu thresholding and random forest classification for unreliable data removal, effectively delineated the areas most severely impacted by the flood event. The analysis revealed a pronounced concentration of significant flood effects in the southwestern region of Shenyang Municipality, see Figure 9.

3.4.1. Hydrological System Response

The intense and sustained rainfall profoundly affected the regional hydrological system. Multiple rivers traversing the impacted southwestern Shenyang area exhibited substantial morphological responses. Significant widening of river channels was observed, indicative of high flow volumes and velocities. Critically, the floodwaters exceeded channel capacities in numerous locations, leading to the breaching of riverbanks and the consequent inundation and destruction of adjacent infrastructure and agricultural land. Major reservoirs within the affected region experienced water levels exceeding their safe storage capacities. This critical state of reservoir impoundment posed a severe and direct threat to nearby villages, transportation networks (roads), and ultimately, human safety, necessitating emergency management protocols.

3.4.2. Meteorological Drivers and Precipitation Magnitude

This severe flooding event was directly attributable to an extreme regional rainstorm process. Meteorological analysis attributed this event to the synergistic interaction of several factors: the peripheral cloud systems and residual moisture from Typhoon “Gaemi” (No. 3), the position and intensity of the subtropical high, and the influx of cold air from the northwestern wind belt. The storm unfolded in four distinct, intense precipitation phases. According to the China Meteorological Administration (CMA), the comprehensive intensity of this rainstorm ranked as the second highest on record for the region since 1951, surpassed only by an event in 1963. The province-wide average precipitation reached 192.8 mm, a value substantially exceeding the typical total precipitation for the entire month of July based on climatological norms.

4. Discussion

Our integrated framework combines the Otsu threshold, random forest classification, and Fuzzy C-Means clustering to improve efficiency and accuracy for rapid flood mapping.
The Otsu algorithm exhibits excellent water detection efficiency in GEE (processing 154 Sentinel-1 scenes in < 2 min) while maintaining an accuracy of >85 percent in open-water detection. This is consistent with the paradigm shift of GEE-based Otsu for continental-scale hydrological monitoring reported by [33,34,35,36]. The random forest classifier achieved a high overall accuracy (92.7 percent), but showed serious limitations in transitional environments. In urban areas, it is very fragile because the geometric shape of buildings can cause complex double bounce scattering, mimicking flood characteristics. This confirms Giustarini’s observation [32] of SAR’s limitations in built environments. However, the cloud computing power based on the GEE platform will correspondingly have some benefits, such as dynamic feature space optimization through seamless integration of multi-sensor indices (NDVI, NDWI) [37,38]; and seasonal adaptability via rapid retraining with temporal feature stacks [39]. Due to the large dataset in GEE, during the process of random forest classification, multiple sources of data can collaborate to automatically screen the required samples for the random forest. The categories of the samples can also be quickly changed by the platform’s simple code and the process can be rerun [22]. More importantly, diverse datasets such as Sentinel-1 and Sentinel-2 allow us to synthesize NDVI, NDWI, and other indices as feature images for training. As for the random forest classification part of this study, it mainly proposes a framework. When we use these feature images for research, there may be significant differences in flood patterns and hydrological responses at different times of the year. Therefore, different datasets and combinations of dataset years and indices are particularly important for different study area profiles. The selected flood cases in this study showed significant differences in SAR images. After adding the mountain shadow dataset, NDVI, and other feature images, the error was further reduced, and good discrimination was achieved for the widening range of river channels and flooded farmland in the cases. Meanwhile, when facing cases where SAR image features are not so obvious, or in different seasons, any data can be attempted to be used as feature images within the limits of cloud computing power. The differences in time and space can also be better compensated for. As for the flood-mapping method that combines the three methods in this study, it effectively solves the core challenge of assigning partial membership degrees in flood-affected pixels. From a temporal and spatial perspective, unlike the Otsu method, which only performs threshold processing on the same image, and unlike the random forest classification, which has similar possibilities for each classification of some pixels, the improved FCM method based on the Otsu method and random forest classification has higher discrimination during floods. By combining the backscatter ratio and terrain constraints, the ability to model the “mixed pixel” [27,30] effect is better when vegetation is partially covered by floods. FCM introduces new algorithms into the framework, while the Otsu method and random forest classification complement and validate the final results of the framework.

4.1. Limitations and Future Research

Despite methodological advances, several limitations warrant attention:
1.
Temporal resolution: Sentinel-1’s 6-day revisit cycle missed peak flood transitions during rapid-onset events. Future work should integrate COSMO-SkyMed (<1 day revisit) for critical phases.
2.
Vegetation penetration: C-band limitations in dense vegetation caused omission errors in riparian forests. L-band systems (e.g., ALOS-2) should be tested.
3.
Real-time integration: Current processing lags hinder operational response. Edge computing implementations on UAV-SAR platforms could bridge this gap.
4.
Feature engineering limitations: The random forest feature space showed seasonal sensitivity, requiring manual recalibration corresponding conditions.
5.
GEE platform: While augmenting training samples or input features is a primary strategy for enhancing classification accuracy, practical computational constraints often limit the feasible scale. Consequently, complex machine learning or deep learning algorithms requiring extensive training datasets or longer training times that cannot be executed within environments like Google Earth Engine (GEE) [40,41]. Users must use external computing resources to implement such algorithms and apply more complex algorithms [42]. This further proves the necessity of the multi-pronged strategy of using cloud platforms and local computing power in this study.
Future research should prioritize multi-sensor data assimilation, coupling SAR with IoT water-level sensors and hydraulic models like HEC-RAS [43]. Additionally, the integration of InSAR coherence for flood duration mapping could improve damage assessment accuracy. Finally, the framework should be improved by implementing automatic feature selection through mutual information standards to address different seasonal hydrological characteristics and geographical location conditions.

4.2. Implications for Flood Risk Management

Our flood frequency maps provide actionable insights for disaster resilience planning:
  • High-recurrence zones (>10% frequency) require strategic relocation;
  • Reservoir operation rules should incorporate backscatter-based early-warning thresholds.
The identification of water bodies and land features is crucial in disaster management. Gu et al. [44] used local computing power-based deep learning and hydrological feature constraints to identify water bodies and land features. Compared to them, the framework of this study can achieve faster disaster management through GEE, greatly reducing the training cycle of the model. Whether it is water detection or post-disaster management, it is more timely. Similarly, by importing the results of GEE training into the local environment, the joint framework construction of FCM further compensates for the lack of processes in the GEE platform and improves the reliability of disaster management through local diversified methods.

5. Conclusions

This study developed an integrated framework combining Otsu thresholding, random forest classification, and Fuzzy C-Means clustering for rapid flood mapping in Liaoning Province, China. Our approach leverages Google Earth Engine’s cloud-computing capabilities to efficiently process multi-temporal Sentinel-1 SAR imagery and multi-source geospatial datasets. Key conclusions are summarized as follows:
(1) The GEE-implemented Otsu algorithm demonstrated exceptional processing efficiency, analyzing 154 Sentinel-1 scenes in under 2 min while maintaining >85% accuracy in open water detection. This enables flood monitoring at watershed scales. (2) Random forest classification achieved 92.7% overall accuracy in land cover classification, effectively distinguishing flooded farmland from permanent water bodies through multi-feature integration (SAR backscatter, terrain parameters, and phenological indices). This addresses critical limitations in single-source flood mapping. (3) The Fuzzy C-Means approach significantly improved transitional boundary delineation by resolving “mixed pixel” ambiguities through partial membership assignments.
Our integrated methodology generated 10 m-resolution flood-extent maps for researched area, providing actionable intelligence for emergency response during the 2024 flood event. The flood frequency maps identified high-risk zones (recurrence probability >10%), enabling targeted infrastructure reinforcement. These techniques establish a transferable framework for rapid flood assessment. Future work will focus on integrating IoT sensor networks with near-real-time SAR processing to enhance early warning systems and optimize reservoir operations during extreme hydrometeorological events.

Author Contributions

Writing—review and editing, resources, W.S.; writing—original draft, visualization, investigation, data curation, J.L.; formal analysis, Y.G. All authors have read and agreed to the published version of the manuscript.

Funding

This research was supported by the National Natural Science Foundation of China (Grant No. 41641024), the Carbon Neutrality Fund of Northeast Forestry University (CNF-NEFU), and the Science and Technology Project of Heilongjiang Communications Investment Group (Grant No. JT-100000-ZC-FW-2021-0182) for providing financial support and the Field Scientific Observation and Research Station of the Ministry of Education—Geological Environment System of Permafrost Areas in Northeast China (MEORS-PGSNEC).

Data Availability Statement

The data presented in this study are available upon request from the corresponding author. The data are not publicly available as the study is still in progress.

Acknowledgments

The authors thank the editors and reviewers for their helpful and insightful comments, which have significantly improved this work.

Conflicts of Interest

The authors declare no conflicts of interest.

References

  1. Lazin, R.; Pallotta, G.; Bonfils, C. Basin-informed flood frequency analysis using deep learning exhibits consistent projected regional patterns over CONUS. Sci. Rep. 2025, 15, 12754. [Google Scholar] [CrossRef]
  2. Kundzewicz, Z.W.; Kanae, S.; Seneviratne, S.I.; Handmer, J.; Nicholls, N.; Peduzzi, P.; Mechler, R.; Bouwer, L.M.; Arnell, N.; Mach, K. Flood Risk and Climate Change: Global and Regional Perspectives. Hydrol. Sci. J. 2014, 59, 1–28. [Google Scholar] [CrossRef]
  3. Taye, M.T.; Dyer, E. Hydrologic Extremes in a Changing Climate: A Review of Extremes in East Africa. Curr. Clim. Change Rep. 2024, 10, 1–11. [Google Scholar] [CrossRef]
  4. Kwakye, S.O.; Bárdossy, A. Quantification of the Hydrological Consequences of Climate Change in a Typical West African Catchment Using Flow Duration Curves. J. Water Clim. Change 2022, 13, 26–42. [Google Scholar] [CrossRef]
  5. United States Environmental Protection Agency (EPA). Climate Change Indicators: River Flooding; Technical report; U.S. Environmental Protection Agency: Washington, DC, USA, 2021. [Google Scholar]
  6. IPCC. Summary for Policymakers. In Climate Change 2022: Impacts, Adaptation and Vulnerability; Pörtner, H.O., Roberts, D.C., Poloczanska, E.S., Mintenbeck, K., Tignor, M., Alegría, A., Craig, M., Langsdorf, S., Löschke, S., Möller, V., et al., Eds.; Cambridge University Press: Cambridge, UK; New York, NY, USA, 2022; pp. 3–33. [Google Scholar] [CrossRef]
  7. Pandey, A.C.; Kaushik, K.; Parida, B.R. Google Earth Engine for Large-Scale Flood Mapping Using SAR Data and Impact Assessment on Agriculture and Population of Ganga-Brahmaputra Basin. Sustainability 2022, 14, 4210. [Google Scholar] [CrossRef]
  8. Ulloa, N.I.; Yun, S.H.; Chiang, S.H.; Furuta, R. Sentinel-1 Spatiotemporal Simulation Using Convolutional LSTM for Flood Mapping. Remote Sens. 2022, 14, 246. [Google Scholar] [CrossRef]
  9. Mustafa, A.R.A.; Shokr, M.S.; Alharbi, T.; Abdelsamie, E.A.; El-Sorogy, A.S.; Meroño de Larriva, J.E. Integration of Google Earth Engine and Aggregated Air Quality Index for Monitoring and Mapping the Spatio-Temporal Air Quality to Improve Environmental Sustainability in Arid Regions. Sustainability 2025, 17, 3450. [Google Scholar] [CrossRef]
  10. Carrasco Baquero, J.C.; Carrasco López, D.C.; Córdova Lliquín, J.D.; Guzmán Guaraca, A.C.; León Gualán, D.A.; Parra León, V.J.; Caballero Serrano, V.L. Multitemporal Analysis Using Remote Sensing and GIS to Monitor Wetlands Changes and Degradation in the Central Andes of Ecuador (Period 1986–2022). Resources 2025, 14, 61. [Google Scholar] [CrossRef]
  11. Ouled Sghaier, M.; Hammami, I.; Foucher, S.; Lepage, R. Flood Extent Mapping from Time-Series SAR Images Based on Texture Analysis and Data Fusion. Remote Sens. 2018, 10, 237. [Google Scholar] [CrossRef]
  12. Tiwari, V.; Kumar, V.; Matin, M.A.; Thapa, A.; Ellenburg, W.L.; Gupta, N.; Thapa, S. Flood Inundation Mapping-Kerala 2018; Harnessing the Power of SAR, Automatic Threshold Detection Method and Google Earth Engine. PLoS ONE 2020, 15, e0237324. [Google Scholar] [CrossRef]
  13. Zeng, H.; Jia, G.; Epstein, H. Recent Changes in Phenology over the Northern High Latitudes Detected from Multi-Satellite Data. Environ. Res. Lett. 2011, 6, 045508. [Google Scholar] [CrossRef]
  14. Rahman, M.S.; Di, L.; Yu, E.; Lin, L.; Yu, Z. Remote Sensing Based Rapid Assessment of Flood Crop Damage Using Novel Disaster Vegetation Damage Index (DVDI). Int. J. Disaster Risk Sci. 2020, 12, 90–110. [Google Scholar] [CrossRef]
  15. Qamer, F.M.; Abbas, S.; Ahmad, B.; Hussain, A.; Salman, A.; Muhammad, S.; Nawaz, M.; Shrestha, S.; Iqbal, B.; Thapa, S. A Framework for Multi-Sensor Satellite Data to Evaluate Crop Production Losses: The Case Study of 2022 Pakistan Floods. Sci. Rep. 2023, 13, 4240. [Google Scholar] [CrossRef]
  16. Laassilia, O.; Saghiry, S.; Ouazar, D.; Bouziane, A.; Hasnaoui, M.D. Flood Forecasting with a Dam Watershed Event-Based Hydrological Model in a Semi-Arid Context: Case Study in Morocco. Water Pract. Technol. 2022, 17, 817–834. [Google Scholar] [CrossRef]
  17. Kumar, V.; Yadav, S.M. Multi-Objective Reservoir Operation of the Ukai Reservoir System Using an Improved Jaya Algorithm. Water Supply 2022, 22, 2287–2310. [Google Scholar] [CrossRef]
  18. Choong, S.M.; El-Shafie, A.; Wan Mohtar, W.H.M. Optimisation of Multiple Hydropower Reservoir Operation Using Artificial Bee Colony Algorithm. Water Resour. Manag. 2017, 31, 1397–1411. [Google Scholar] [CrossRef]
  19. Gorelick, N.; Hancher, M.; Dixon, M.; Ilyushchenko, S.; Thau, D.; Moore, R. Google Earth Engine: Planetary-Scale Geospatial Analysis for Everyone. Remote Sens. Environ. 2017, 202, 18–27. [Google Scholar] [CrossRef]
  20. Bentivoglio, R.; Isufi, E.; Jonkman, S.N.; Taormina, R. Deep Learning Methods for Flood Mapping: A Review of Existing Applications and Future Research Directions. Hydrol. Earth Syst. Sci. 2022, 26, 4345–4378. [Google Scholar] [CrossRef]
  21. Otsu, N. A Threshold Selection Method from Gray-Level Histograms. IEEE Trans. Syst. Man Cybern. 1979, 9, 62–66. [Google Scholar] [CrossRef]
  22. Amani, M.; Ghorbanian, A.; Ahmadi, S.A.; Kakooei, M.; Moghimi, A.; Mirmazloumi, S.M.; Moghaddam, S.H.A.; Mahdavi, S.; Ghahremanloo, M.; Parsian, S.; et al. Google Earth Engine Cloud Computing Platform for Remote Sensing Big Data Applications: A Comprehensive Review. IEEE J. Sel. Top. Appl. Earth Obs. Remote Sens. 2020, 13, 5326–5350. [Google Scholar] [CrossRef]
  23. Munawar, H.S.; Hammad, A.W.A.; Waller, S.T. Remote Sensing Methods for Flood Prediction: A Review. Sensors 2022, 22, 960. [Google Scholar] [CrossRef]
  24. Koo, Y.; Xie, H.; Mahmoud, H.; Iqrah, J.M.; Ackley, S.F. Automated Detection and Tracking of Medium-Large Icebergs from Sentinel-1 Imagery Using Google Earth Engine. Remote Sens. Environ. 2023, 296, 113731. [Google Scholar] [CrossRef]
  25. Sun, X.; Li, L.; Zhang, B.; Chen, D.; Gao, L. Soft Urban Water Cover Extraction Using Mixed Training Samples and Support Vector Machines. Int. J. Remote Sens. 2015, 36, 3331–3344. [Google Scholar] [CrossRef]
  26. Skakun, S. A Neural Network Approach to Flood Mapping Using Satellite Imagery. Comput. Inform. 2012, 29, 1013–1024. [Google Scholar]
  27. Zhang, H.; Shi, W.; Hao, M.; Li, Z.; Wang, Y. An Adaptive Spatially Constrained Fuzzy C-Means Algorithm for Multispectral Remotely Sensed Imagery Clustering. Int. J. Remote Sens. 2017, 39, 2207–2237. [Google Scholar] [CrossRef]
  28. Ahmed, M.N.; Yamany, S.M.; Mohamed, N.; Farag, A.A.; Moriarty, T. A Modified Fuzzy C-Means Algorithm for Bias Field Estimation and Segmentation of MRI Data. IEEE Trans. Med. Imaging 2002, 21, 193–199. [Google Scholar] [CrossRef] [PubMed]
  29. Saxena, A.; Prasad, M.; Gupta, A.; Bharill, N.; Patel, O.P.; Tiwari, A.; Er, M.J.; Ding, W.; Lin, C.T. A Review of Clustering Techniques and Developments. Neurocomputing 2017, 267, 664–681. [Google Scholar] [CrossRef]
  30. Gong, M.; Zhou, Z.; Ma, J. Change Detection in Synthetic Aperture Radar Images Based on Image Fusion and Fuzzy Clustering. IEEE Trans. Image Process. 2012, 21, 2141–2151. [Google Scholar] [CrossRef] [PubMed]
  31. Bezdek, J.C.; Ehrlich, R.; Full, W. FCM: The Fuzzy C-Means Clustering Algorithm. Comput. Geosci. 1984, 10, 191–203. [Google Scholar] [CrossRef]
  32. Giustarini, L.; Hostache, R.; Matgen, P.; Schumann, G.J.P.; Bates, P.D.; Mason, D.C. A Change Detection Approach to Flood Mapping in Urban Areas Using TerraSAR-X. IEEE Trans. Geosci. Remote Sens. 2013, 51, 2417–2430. [Google Scholar] [CrossRef]
  33. Farhadi, H.; Kiani, A.; Ebadi, H.; Asgary, A. Development of an Automatic Time-Series Flood Mapping Framework Using Sentinel-1 and 2 Imagery. Stoch. Environ. Res. Risk Assess. 2025, 39, 2627–2655. [Google Scholar] [CrossRef]
  34. Liang, J.; Liu, D. A Local Thresholding Approach to Flood Water Delineation Using Sentinel-1 SAR Imagery. ISPRS J. Photogramm. Remote Sens. 2020, 159, 53–62. [Google Scholar] [CrossRef]
  35. Zeng, Z.; Gan, Y.; Kettner, A.; Yang, Q.; Zeng, C.; Brakenridge, G.R.; Hong, Y. Towards High Resolution Flood Monitoring: An Integrated Methodology Using Passive Microwave Brightness Temperatures and Sentinel Synthetic Aperture Radar Imagery. J. Hydrol. 2020, 582, 124377. [Google Scholar] [CrossRef]
  36. Moharrami, M.; Javanbakht, M.; Attarchi, S. Automatic Flood Detection Using Sentinel-1 Images on the Google Earth Engine. Environ. Monit. Assess. 2021, 193, 248. [Google Scholar] [CrossRef]
  37. Li, S.; Song, K.; Wang, S.; Liu, G.; Wen, Z.; Shang, Y.; Lyu, L.; Chen, F.; Xu, S.; Tao, H.; et al. Quantification of Chlorophyll-a in Typical Lakes Across China Using Sentinel-2 MSI Imagery with Machine Learning Algorithm. Sci. Total Environ. 2021, 778, 146271. [Google Scholar] [CrossRef]
  38. Adusei, Y.; Quaye-Ballard, J.; Adjaottor, A.A.; Mensah, A.A. Spatial Prediction and Mapping of Water Quality of Owabi Reservoir from Satellite Imageries and Machine Learning Models. Egypt. J. Remote Sens. Space Sci. 2021, 24, 825–833. [Google Scholar] [CrossRef]
  39. Zhao, F.; Feng, S.; Xie, F.; Zhu, S.; Zhang, S. Extraction of Long Time Series Wetland Information Based on Google Earth Engine and Random Forest Algorithm. Ecol. Indic. 2023, 146, 109813. [Google Scholar] [CrossRef]
  40. Amani, M. Canadian Wetland Inventory Using Google Earth Engine: The First Map and Preliminary Results. Remote Sens. 2019, 11, 842. [Google Scholar] [CrossRef]
  41. Amani, M. A Generalized Supervised Classification Scheme to Produce Provincial Wetland Inventory Maps: An Application of Google Earth Engine for Big Geo Data Processing. Big Earth Data 2019, 3, 378–394. [Google Scholar] [CrossRef]
  42. DeLancey, E.; Simms, J.; Mahdianpari, M.; Brisco, B.; Mahoney, C.; Kariyeva, J. Comparing Deep Learning and Shallow Learning for Large-Scale Wetland Classification in Alberta, Canada. Remote Sens. 2019, 12, 2. [Google Scholar] [CrossRef]
  43. Quang, N.H.; Tuan, V.A.; Hang, L.T.T.; Hung, N.M.; The, D.T.; Dieu, D.T.; Anh, N.D.; Hackney, C.R. Hydrological/Hydraulic Modeling-Based Thresholding of Multi SAR Remote Sensing Data for Flood Monitoring in Regions of the Vietnamese Lower Mekong River Basin. Water 2020, 12, 71. [Google Scholar] [CrossRef]
  44. Gu, H.; Gao, Y.; Fei, Y.; Sun, Y.; Tian, Y. Deep Learning and Hydrological Feature Constraint Strategies for Dam Detection: Global Application to Sentinel-2 Remote Sensing Imagery. Remote Sens. 2025, 17, 1194. [Google Scholar] [CrossRef]
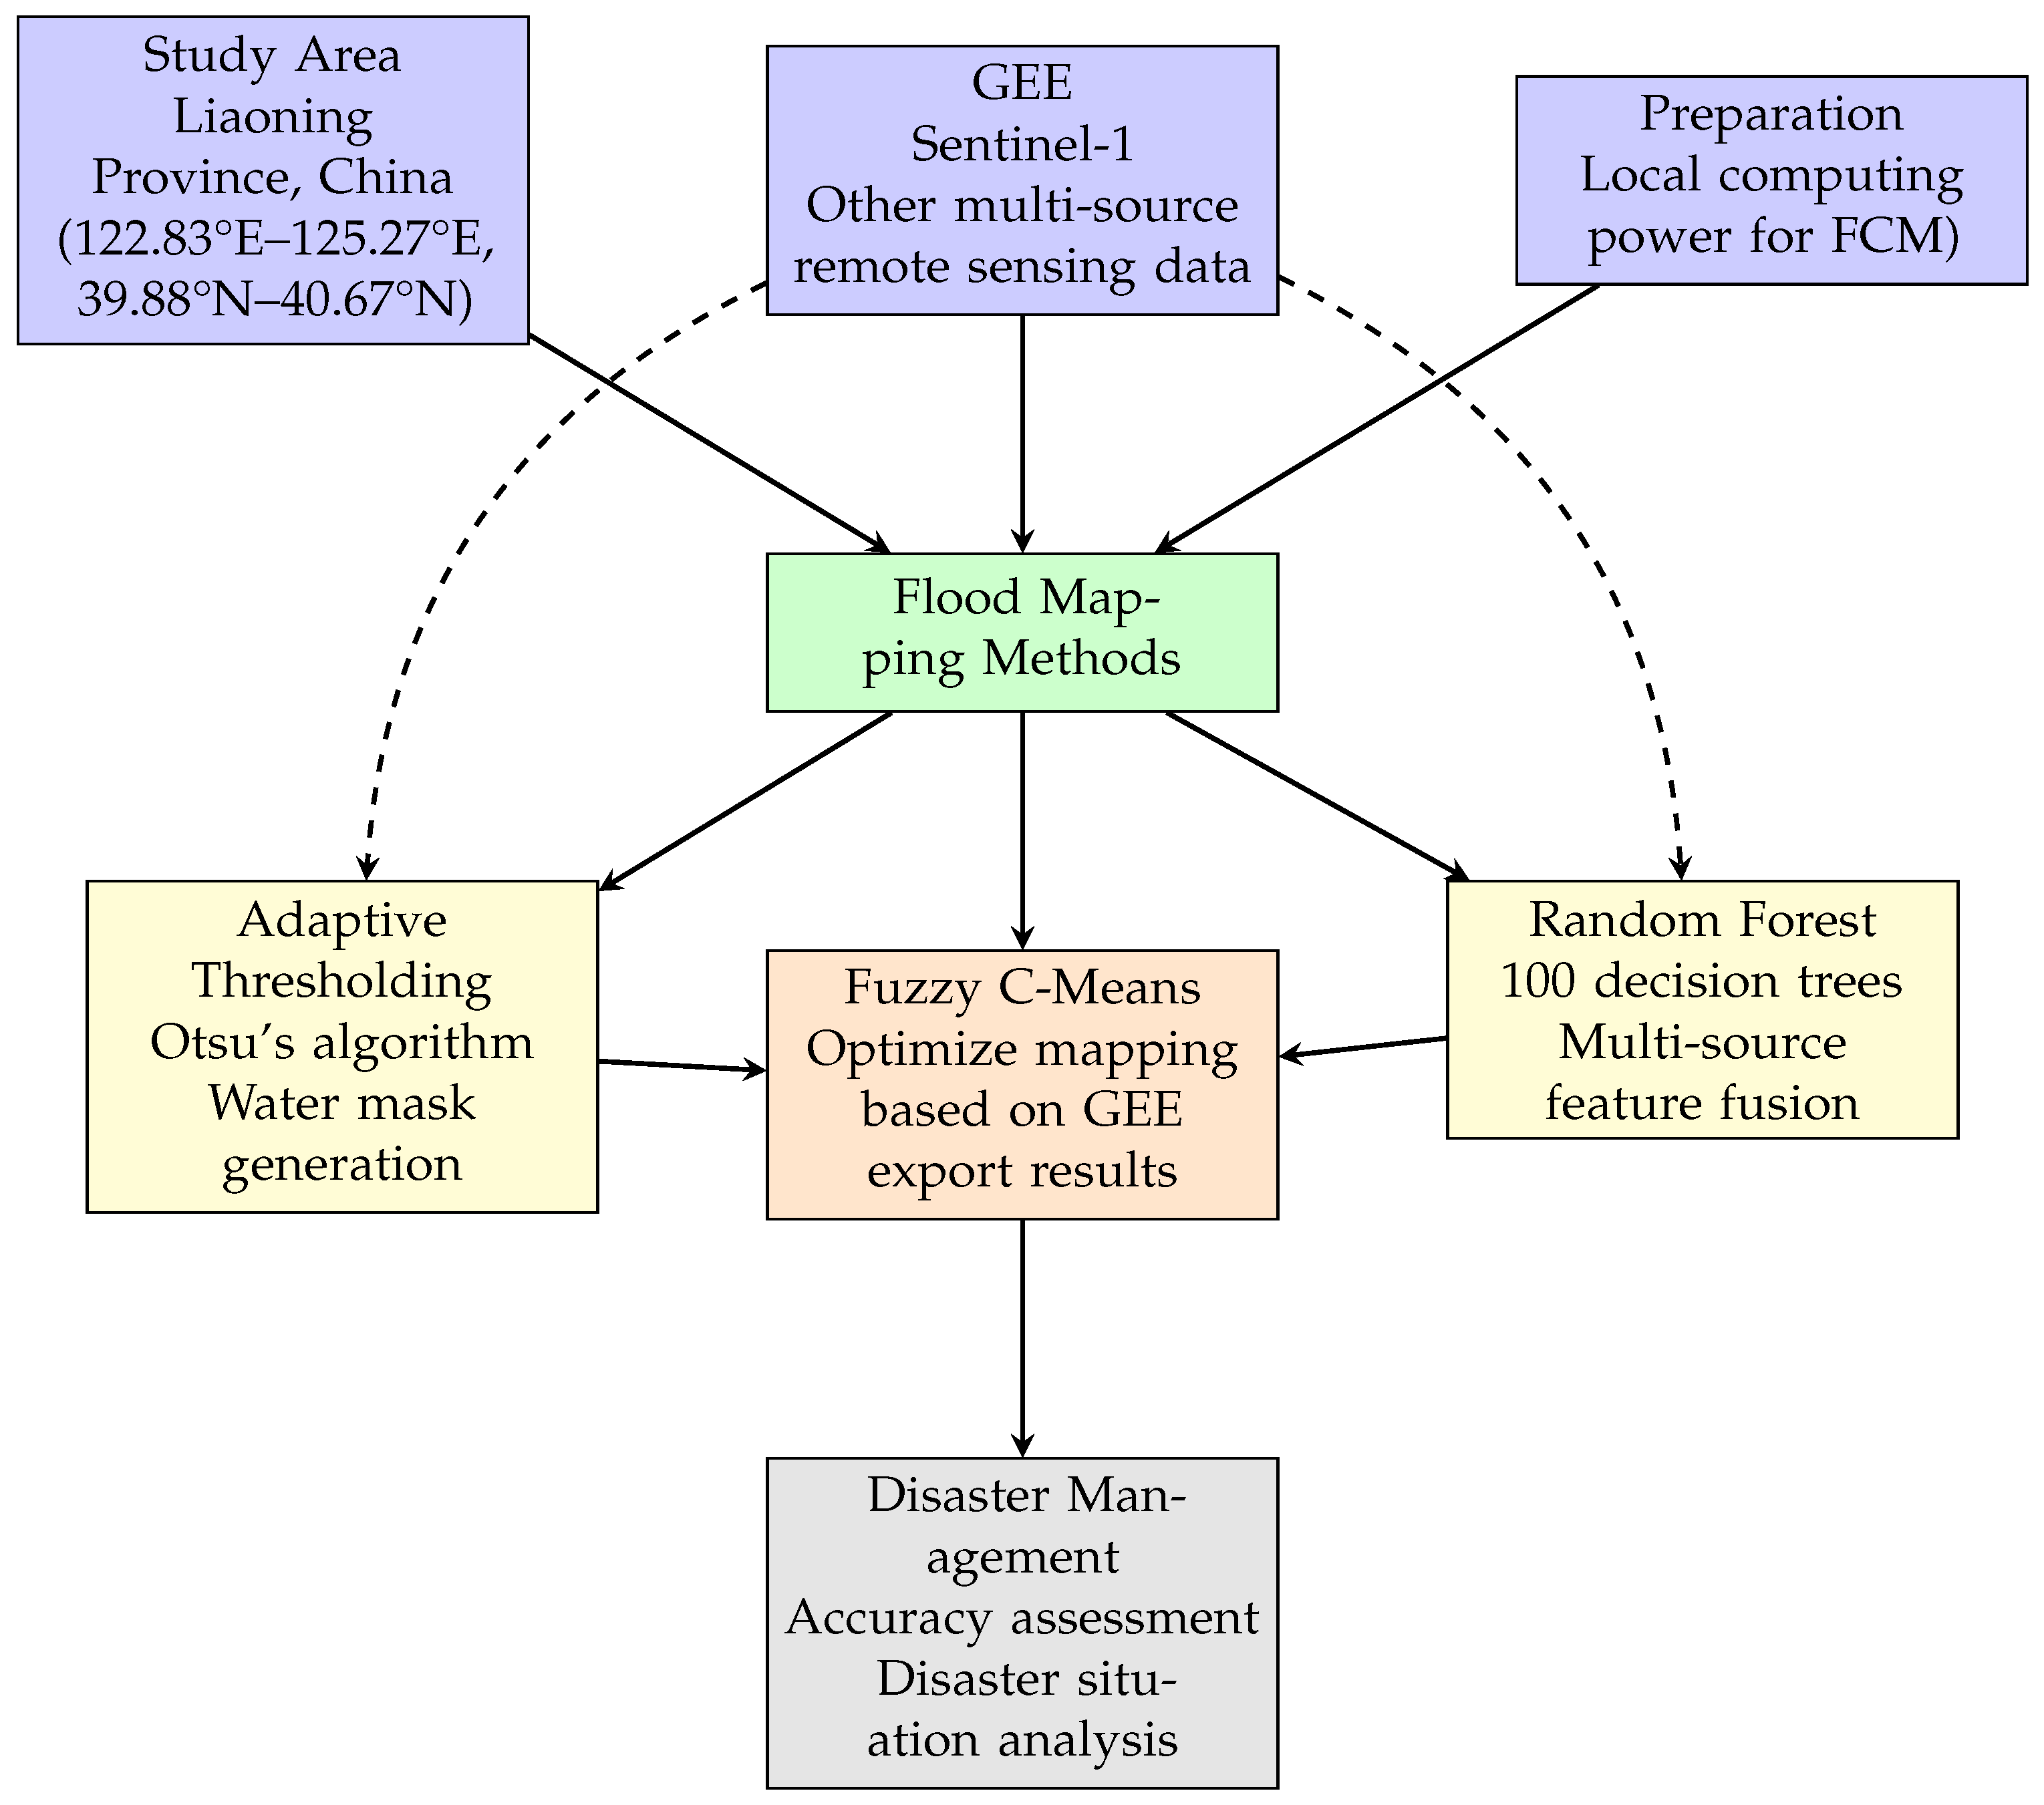
Figure 1. Workflow of flood mapping.
Water 17 02416 g001
Figure 2. Overview of the research area. (a) Geographic profile of Liaoning Province. (b) The research area located within Liaoning Province. (c) Terrain information within the region. (d,e) Example of SAR images synthesized before and after flood occurrence.
Water 17 02416 g002
Figure 3. Daily average precipitation generated from the CHIRPS dataset in GEE.
Water 17 02416 g003
Figure 4. Annual precipitation trend change map generated from the CHIRPS dataset in GEE.
Water 17 02416 g004
Figure 5. Water mask automatically calculated through GEE platform.
Water 17 02416 g005
Figure 6. Water body frequency obtained from SAR time series (1 April to 31 October 2024).
Water 17 02416 g006
Figure 7. (a) Overall classification mapping based on SAR images within the study area. (b) Classification of Tumenzi Reservoir.
Water 17 02416 g007
Figure 8. (a,b) SAR images before and after the flood in the southwest of Shenyang City. (c,d) SAR images before and after the flood in Tumenzi Reservoir.
Water 17 02416 g008
Figure 9. Flood classification based on FCM and improved by Otsu method and random forest: (a) Overview of southwestern Shenyang City; (b) overview of Tumenzi Reservoir.
Water 17 02416 g009
Table 1. Training sample classification schema.
ClassLabelSelection Criteria
Water1 seasonality 5
Urban2 ESA WorldCover = 50
Nightlights2 avg_rad ¯ > 5
Terrain2 Elev > 2000   m Slope > 15 ° Elev < 5   m
Vegetation2 NDVI ¯ > 0.3
Cropland3 GFSAD = 2 static σ ( NDVI ) > 0.15 dynamic
Table 2. MRF-FCM refinement parameters.
ParameterWaterFloodUnits
Fuzzy coefficient1.82.2
MRF kernel size35pixels
Spatial penalty0.60.8
Max iterations5050
Table 3. Key water mask transitions at Tumenzi Reservoir (2024).
DateEventWater Mask (km2)
4 JunePost-snowmelt baseline892.118
10 JulyPre-flood minimum780.553
22 JulyPost-typhoon spillway release905.000
3 AugustMajor flood expansion1148.000
15 AugustPeak inundation1236.482
Disclaimer/Publisher’s Note: The statements, opinions and data contained in all publications are solely those of the individual author(s) and contributor(s) and not of MDPI and/or the editor(s). MDPI and/or the editor(s) disclaim responsibility for any injury to people or property resulting from any ideas, methods, instructions or products referred to in the content.